Determination of trace elements in crude oils by ICP-MS using detergent microemulsion.
AL-MARMORI, Seham S.
Available from Sheffield Hallam University Research Archive (SHURA) at:
http://shura.shu.ac.uk/19250/
This document is the author deposited version. You are advised to consult the publisher's version if you wish to cite from it.
Published version
AL-MARMORI, Seham S. (2008). Determination of trace elements in crude oils by ICP-MS using detergent microemulsion. Masters, Sheffield Hallam University (United Kingdom)..
Copyright and re-use policy
See http://shura.shu.ac.uk/information.html
Sheffield Hallam University Research Archivehttp://shura.shu.ac.uk
ProQuest Number: 10694130
All rights reserved
INFORMATION TO ALL USERS The quality of this reproduction is dependent upon the quality of the copy submitted.
In the unlikely event that the author did not send a com ple te manuscript and there are missing pages, these will be noted. Also, if material had to be removed,
a note will indicate the deletion.
uestProQuest 10694130
Published by ProQuest LLC(2017). Copyright of the Dissertation is held by the Author.
All rights reserved.This work is protected against unauthorized copying under Title 17, United States C ode
Microform Edition © ProQuest LLC.
ProQuest LLC.789 East Eisenhower Parkway
P.O. Box 1346 Ann Arbor, Ml 48106- 1346
Determination of Trace Elements in Crude Oils by ICP-MS Using Detergent
Microemulsion
Seham S. Al-Marmori
A thesis submitted to the Faculty of Health and Wellbeing of Sheffield Hallam University
in partial fulfillment o f the requirements for the degree o f Master of Philosophy
November 2008
Abbreviations
API American Petroleum Institute
UOP Universal Oil Product
ppm Parts Per Million
LPG Liquefied Petroleum Gas
FAAS Flame Atomic Absorption Spectrometry
ETAAS Electrothermal Atomization In Graphite Furnace
ICP-OES Inductively Coupled Plasma-Optical Emission Spectrometry
ICP-MS Inductively Coupled Plasma-Mass Spectrometry
VG Vapor Generation
IBMK Isobutyl Methyl Ketone
BA Butyl Acetate
ETV Electrothermal Vaporization
USN Ultrasonic Nebulizer
MIBK Methyl Isobutyl Ketone
SPL Solvent Plasma Load
NaDS Sodium Dodecylsulphate
HLB Hydrophile-Lipophile Balance
SDS Sodium Dodecylsulphate
ETV ICP-MS Electrothermal Vaporization Inductively Coupled Plasma-
Mass Spectrometer
K Kelvin
TDS Total Dissolved Solid
bbl Barrels
bbl/d Barrels Per Day
HP Hewlett Packard
RF Radio Frequency Power
Sp.g Specific Gravity
EDS Emulsion Droplet Size
CRM Certified Reference Material
LOD Limits o f Detection
LOQ Limits of Quantification
RSD Relative Standard Deviation
SD Standard Deviation
r2 Correlation Coefficient
n Number o f Replicates
ii
Abstract
A method was developed and evaluated in terms of its analytical performance for the
determination o f Ti, V, Cr, Mn, Ni, Cu, Mo, Cd, Sn and Pb concentrations in three
Libyan crude oil samples using ICP-MS. The samples were introduced to the plasma
after the formation o f microemulsions in which Triton X-100 was used as the emulsifier
and tetralin was the co-solvent with the addition o f nitric acid in order to enable
calibration with aqueous standard. The validity o f the method was proven by three
different traditional sample preparation protocols (dry ash, wet digestion and microwave
digestion) and good agreement was obtained between the results using the proposed and
comparative procedures. The accuracy was confirmed by analysing two different
certified reference materials (Used Oil HU-1 from SCP science and Wear Metals in
Lubricating Oils 1084a from NIST). The recoveries ranged from 100.1% to 119.9 % for
all elements and 85.1 % for Cr in Used Oil HU-1 and from 84.8 % to 100.1 % for all
elements and 79.1 % for Cr in 1084a NIST. The precision o f the method was < 5% for
all elements, except for Cr which was 30.9 %. The limits o f detection based on 3 times
standard deviation o f the blank (10 replicates), were ranging from 0.1 to 0.7 ng g' 1 for
all elements and 4.8 ng g ' 1 for Cr. The limits o f quantification based on 10 times
standard deviation o f the blank (10 replicates) ranged between 0.2 to 2.4 ng g' 1 and 16.1
ng g' 1 for Cr. Satisfactory recoveries were obtained when 2 pg L ' 1 and 10 pg L’1
multielement spikes were used to test the accuracy o f the developed method. The
method has proven to be reliable, and can be used in routine analysis in laboratories
where there is a high throughput o f the sample.
Dedication
I would like to dedicate my thesis to my father and mother who
offered me unconditional love and support throughout my life.
To my dear husband, without his support, and gentle encour
agement, I wouldn’t have finished this thesis, and to a loving
family that just never stopped giving o f themselves in countless
ways, both direct and indirect.
Acknowledgements
Praise and gratitude be to ALLAH, Almighty, without whose gracious help it would
have been impossible to accomplish this work.
I would like to acknowledge and extend my gratitude to my supervisor Dr. Philip
Gardiner, for his guidance and helpful suggestions throughout this study and for his
vital encouragement and support. My thanks to Professor Malcolm Clench, for his
understanding and assistance. I am also deeply thankful to Professor Nicola
Woodroofe, for her efforts to afford a supportive environment for students in BMRC
to finish their studies. Many thanks to Dr. Peter Drew, for his invaluable advices and
supplies o f references. And to the two helpful ladies, Marguerite Lyons and Sarah
Wright for the help and inspiration they extended.
My gratitude to Libyan Petroleum Institute for giving me this opportunity for
studying MPhil as a part time student in Sheffield Hallam University.
v
Contents
ABBREVIATIONS..................................................................................................................................... I
ABSTRACT.............................................................................................................................................. Ill
DEDICATION......................................................................................................................................... IV
ACKNOWLEDGEMENTS...................................................................................................................... V
CONTENTS..............................................................................................................................................VI
LIST OF FIGURES...................................................................................................................................X
LIST OF TABLES..................................................................................................................................XII
CHAPTER 1................................................................................................................................................ 1
1. INTRODUCTION................................................................................................................................1
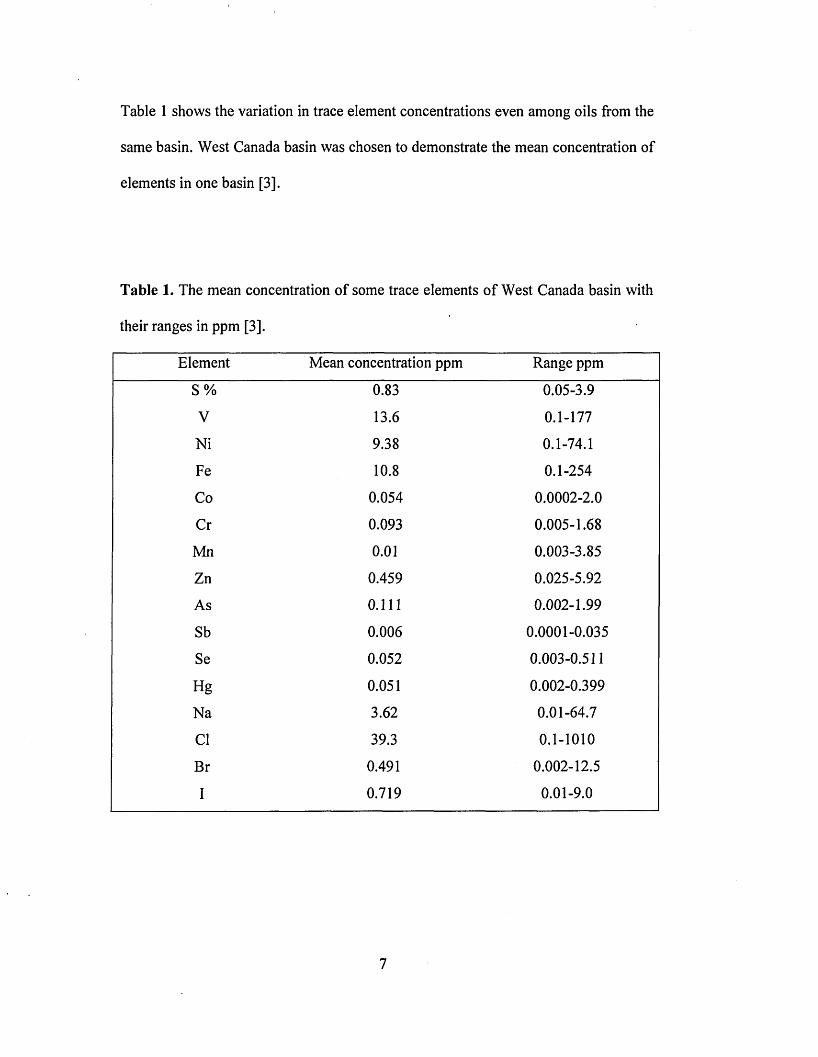
1.1 OCCURRENCES AND IMPORTANCE OF CRUDE OIL AND FRACTIONS........................1
1.2 CLASSIFICATION OF CRUDE OIL............................................................................................. 2
1.3 CHEMICAL COMPOSITION OF OIL...........................................................................................3
1.3.1 H y d r o c a r b o n s ............................................................................................................................ 3
1 .3 .2 N o n h y d r o c a r b o n s .....................................................................................................................................................4
1.3.2.1 Sulphur Compounds...................................................................................................................4
1.3.2.2 Oxygen Compounds....................................................................................................................4
1.3.2.3 Nitrogen Compounds.................................................................................................................5
1.3.2.4 Salts.............................................................................................................................................. 5
1.3.2.5 Carbon Dioxide...........................................................................................................................6
1.3.2.6 Trace M etals................................................................................................................................6
1.4 PETROLEUM REFINING OPERATIONS.................................................................................... 8
1.4.1 REFining OpErations................................................................................................................. 8
1.4.1.1 Fractionation........................................................................................................................8
1.4.1.2 Conversion processes......................................................................................................... 10
1.4.1.3 Treatment.............................................................................................................................10
1.4.1.4 Formulating and Blending............................................................................................... 10
1.4.2 Major REFinEry Products....................................................................................................10
1.5 ELEMENTAL DETERMINATIONS BY ATOMIC SPECTROMETRY............................... 11
1.6 SAMPLE PRETREATMENT AND PREPARATION.................................................................13
1.7 EMULSION........................................................................................................................................ 16
1.8 INDUCTIVELY COUPLED PLASMA-MASS SPECTROMETRY (ICP-MS)..................... 27
1.8.1 In s t r u m E n t O ptim iza tio n a n d T u n i n g ........................................................................................... 3 2
1 .8 .2 In t E r F E r E n c E s ..............................................................................................................................................................32
1.8.2.1 Isobaric Interferences............................................................................................................... 32
1.8.2.2 Molecular (or Polyatomic) Interferences............................................................................... 32
1.8.2.3 Doubly- Charged Ion Interferences.........................................................................................33
1.8 .3 . M a t r k E F F E c t s .......................................................................................................................................................... 34
1.9 RELIABLE MEASUREMENTS......................................................................................................35
1.9.1 M E t h o d V a l id a t io n ............................................................................................................................................. 35
1.9.1.1 Specificity & selectivity............................................................................................................ 35
1.9.1.2 Accuracy or Bias....................................................................................................................... 35
1.9.1.3 Precision.................................................................................................................................... 36
1.9.1.4 Limit o f Detection (LOD)......................................................................................................... 36
1.9.1.5 Limit o f Quantification (LOQ).................................................................................................36
1.10 CHARACTERISATION OF LIBYAN CRUDE OILS.............................................................. 37
1.11 THE APPROACH ADOPTED IN THE PRESENT STUDY.....................................................40
1.12 THE MOTIVATION....................................................................................................................... 41
1.13 THE AIMS............................................... 41
CHAPTER 2 .............................................................................................................................................. 42
2. EXPERIMENTAL................................................................................................................................42
2.1 INSTRUMENTATION..................................................................................................................... 42
2.2 REAGENTS........................................................................................................................................43
2.3 SAMPLE PREPARATION..............................................................................................................44
2 .3 .1 D r y A s h i n g ....................................................................................................................................................................44
2 .3 .2 W E t D i g E s t i o n ........................................................................................................................................................... 4 4
2 .3 .3 M ic r o w a v E D ig E s t io n .......................................................................................................................................... 44
2 .3 .4 M ic r o E m u l s io n P r E p a r a t i o n ......................................................................................................................... 45
CHAPTER 3 .............................................................................................................................................. 46
3. RESULTS AND DISCUSSION..................................................................... 46
3.1 OPTIMIZATION OF THE MICROEMULSION FORMATION..............................................46
3.2 FACTORS AFFECTING MICROEMULSION STABILITY.....................................................48
3.2.1 SONICATION AND TEMPERATURE.............................................................................................. 48
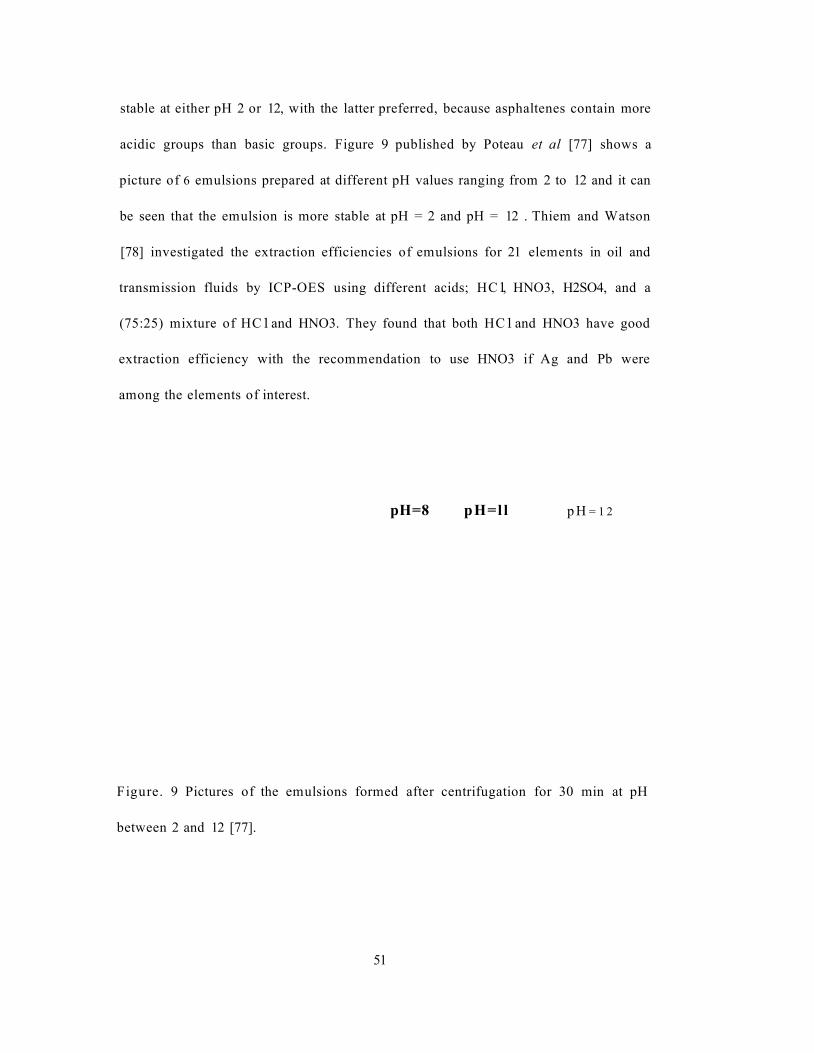
3 .2 .2 A c id it y ( p H ) .................................................................................................................................................................. 50
3 .2 .3 D r y n E s s o F Gl a s s w a r E a n d O r d E r o F A d d it io n o F E m u l s io n C o n s t i t u E n t s 54
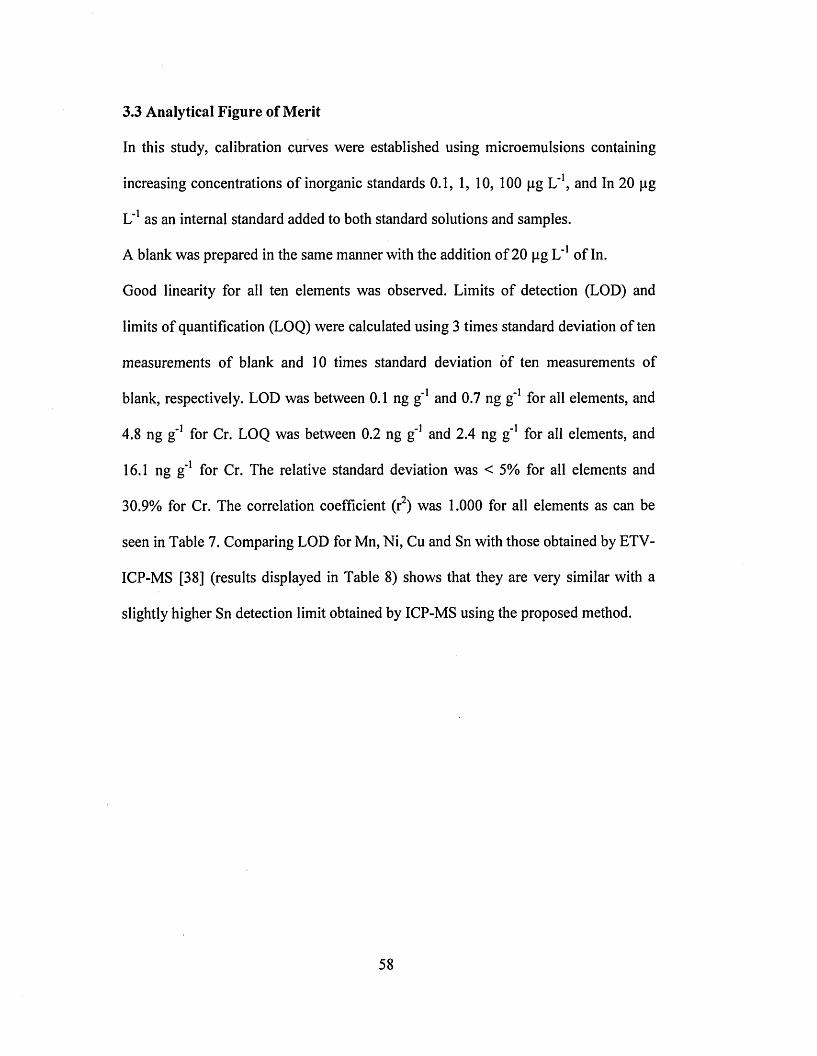
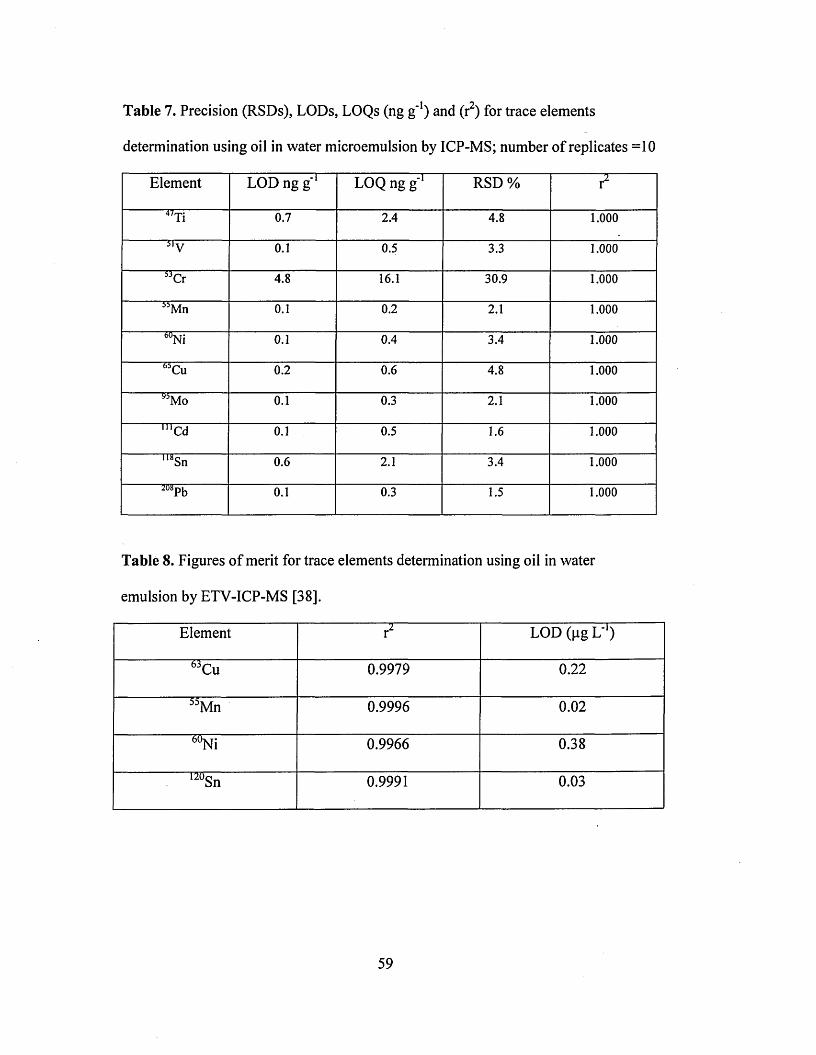
3.3 ANALYTICAL FIGURE OF MERIT............................................................................................ 58
3.4 METHOD VALIDATION................................................................................................................ 61
3.5 RECOVERY TEST............................................................................................................................64
3.6 ANALYSIS OF REFERENCE MATERIALS............................................................................... 66
3.7 CALIBRATION WITH AQUEOUS STANDARD SOLUTIONS...............................................68
3.8 REAL SAMPLES RESULTS....................................................................................................... 70
CHAPTER 4 .............................................................................................................................................. 74
4.1 CONCLUSION...................................................................................................................................74
4.2 RECOMMENDATIONS...................................................................................................................76
REFERENCES..........................................................................................................................................78
APPENDIX A .............................................................................................................................................. 1
List of Figures
Figure 1 Distillation Units at the Azzawiya oil refinery................................. 8
Figure 2 The fractional distillation process.............................................................. 9
Figure 3 Water-in-oil emulsions................................................................................18
Figure 4 Schematic o f ICP-MS main processes.................................................... 27
Figure 5 Schematic o f a spray chamber...................................................................28
Figure 6 ICP-MS plasma torch................................................................................. 29
Figure 7 Schematic o f sampling and skimmer cones with the extraction
Lenses............................................................................................................. 30
Figure 8 Libyan Sedimentary Basins....................................................................... 39
Figure 9 Pictures o f the emulsions at pH between 2 and 12................................ 51
Figure 10 A picture for El-Sharara, El-Bouri and Amna emulsified crude oils
prepared with the proposed m ethod..........................................................53
Figure 11 A stable transparent microemulsion o f Amna crude oil prepared
with the proposed m ethod...........................................................................55
Figure 12 An unstable unclear microemulsion o f Amna crude oil prepared
with the proposed method without acid and sonication ............56
Figure 13 Separate phases o f Amna crude oil microemulsion prepared
with the proposed method without acid and sonication........................ 57
Figure 14 Calibration curves for Ti, V, Cr, Ni, Cu, Mo, Mn, Cd, Sn and Pb
x
microemulsion standard..............................................................................60
Figure 15 Emulsified El-Sharara Libyan crude oil samples spiked with
10 pg L ' 1 o f a multielement standard solution........................................64
xi
List of Tables
Table 1 The mean concentration o f some trace elements o f West Canada
basin with their ranges in (ppm)...................................................................7
Table 2 Interferences from organic crude oil that may occur in quadrupole
ICP-MS...........................................................................................................34
Table 3 Characteristics o f Libyan Crude O ils........................................................38
Table 4 The operating conditions o f HP Hewlett Packard 4500 ICP-MS 42
Table 5 Used oil HU-1 trace elements concentration A) after forming a
microemulsion with the use of temperature and sonication and B)
after forming a microemulsion without the use o f temperature and
sonication...................................................................................................... 50
Table 6 El-Bouri, El-Sharara and Amna crude oils microemulsion results
with and without 0.1 % HNO3 ...................................................................53
Table 7 Precision (RSDs), LODs, LOQs (ng g '1) and (r2) for trace elements
determination using oil in water microemulsion by IC P-M S 59
Table 8 Figures o f merit for trace elements determination using oil in water
emulsion by ETV-ICP-MS..........................................................................59
Table 9 Comparison o f HU-1 Used Oil analytes results prepared with the
proposed methodology and traditional sample preparation methods
with the certified values.......................................................................................62
Table 10 Comparing NIST 1084a Wear-Metals in Lubricating Oil analytes
results prepared with the proposed methodology and traditional
sam ple preparation methods with the certified v a lu e s ......................... 63
Table 11 Analyte spike recovery in El-Sharara oil sample spiked with 2
and 10 p g L ' 1 standards............................................................................65
Table 12 The analysis o f the HU-1 Used Oil with the proposed method....... 67
Table 13 The analysis o f the NIST 1084a Wear-Metals in Lubricating Oil
with the proposed m ethod....................................................................... 67
Table 14 Comparison between CRM HU-1 microemulsion results obtained
from calibration with aqueous standard solution and results
obtained from calibration with emulsified standard solution...........69
Table 15 Comparison between CRM 1084a microemulsion results obtained
from calibration with aqueous standard solution and results
obtained from calibration with emulsified standard solution............69
Table 16 Mean o f trace elements concentration in emulsified Libyan
crude oil samples in pg g' 1 ......................................................... 71
Table 17 Comparison between the mean concentration o f nickel and
vanadium in three Libyan crude oil samples prepared with
microemulsion, wet digestion, dry ash and microwave
digestion in pg g' 1................................................................................... 72
Chapter 1
1. Introduction
1.1 Occurrences and Importance of Crude Oil and Fractions
Land, sea and air transportation depend almost entirely on products refined from
crude oil. Refineries convert about three quarters o f the crude oil into transportation
fuels. Other refined oil products are used to heat homes and buildings, generate
electricity, and in the manufacture o f lubricants, waxes, plastics, synthetic rubber
and asphalt.
The crude oil industry provides thousands o f jobs in exploration, production,
transportation, refining, distribution and marketing. It also supports a variety o f
technological research and development.
The origin o f crude oil has been the subject o f considerable debate, but it is now
accepted that it is organic in origin and that the raw material was the bodies o f marine
organisms together with water-deposited plant life. Oil was formed from the remains
o f those organisms and plants that lived millions o f years ago in a marine
environment. Over the years, the remains were covered by layers o f mud. Heat and
pressure from these layers helped the remains turn into crude oil [1].
1
1.2 Classification of Crude Oil
Crude oils in general are complex mixtures containing different hydrocarbons
associated with very small amounts of nitrogenous substances and variable amounts
o f organic sulphur compounds. These hydrocarbons may be paraffinic, olefinic,
naphthenic and aromatic in character [1,2]. Crude oil ranges in consistency from
water to tar like solids, and in colour from clear to black. An “average” crude oil
contains about 83.9 % - 86.8 % carbon, 11 % - 14 % hydrogen, 0.06 % - 8.0 % sulfur,
0.02 % - 1.7 % nitrogen, 0.08 % -1.82 % oxygen, 0.00 % - 0.14 % metals, and salts
[1].
Relatively simple crude oil assays are used to classify crude oils as paraffinic,
naphthenic, aromatic or mixed. One assay method (United States Bureau o f Mines) is
based on distillation, and another method (UOP “k” factor) is based on specific
gravity and boiling points [1]. Crude oils are also defined in terms o f API (American
Petroleum Institute) gravity. The higher API gravity is, the lower the specific gravity
and hence the lighter the crude. The heavier crude oil contains more sulphur which
makes it more difficult and expensive to turn it into usable refined products. Crude
oils that contain appreciable quantities o f hydrogen sulphide or other reactive sulphur
compounds are called “sour”. Those with less sulphur are called “sweet”.
The viscosity o f crude oils varies greatly even with oils from the same district. It
increases with rise o f specific gravity; the higher value for both being dependent
mainly upon the presence o f heavier hydrocarbons, but no connection can be traced
between viscosity and specific gravity, oils o f the same specific gravity varying
widely in viscosity. Increase o f temperature causes a rapid decrease in the viscosity
2
and a rise o f a few degrees will often cause a sluggish oil to flow freely. The pour
point o f an oil is the lowest temperature at which it will pour or flow readily.
Density is one o f the principle physical properties in classifying crude oils and it is
defined as the mass per unit volume. Crude oil density is temperature-dependant,
decreasing as temperature rises. Generally, paraffinic hydrocarbons have low
densities, naphthenic, and olefinic hydrocarbons intermediate densities, and aromatic
hydrocarbons high densities. The densities o f crude oils generally lie in the range 0.79
to 0.95 g/cm3 [1].
1.3 Chemical Composition of Oil
1.3.1 Hydrocarbons
Crude oil is a mixture o f hydrocarbon molecules, containing between 1 to 60 carbon
atoms. The properties o f the hydrocarbons depend on the number and arrangement of
the carbon and hydrogen atoms in the molecules. Hydrocarbons containing up to four
carbon atoms are usually gases, those with 5 to 19 carbon atoms are usually liquids,
and those with 20 or more are solids. The refining process uses chemicals, catalysts,
heat, and pressure to separate and combine the basic types o f hydrocarbon molecules
naturally found in crude oil into groups o f similar molecules. The refining process
also rearranges their structures and bonding patterns into different hydrocarbon
molecules and compounds. Therefore it is the type o f hydrocarbon (paraffinic,
naphthenic, or aromatic) rather than its specific chemical compounds that is
significant in the refining process.
3
1.3.2 N onhydrocarbons
Crude oils contain considerable amount o f organic compounds with structures
incorporating one or more atoms o f sulphur, nitrogen, or oxygen in addition to carbon
and hydrogen; and some o f these are associated with metals such as vanadium and
nickel. Crude oil may also contain relatively minor amounts o f suspended inorganic
salts (mainly chlorides) and o f dissolved elemental sulphur and hydrogen sulphide.
1.3.2.1 Sulphur Com pounds
Sulphur may be present in crude oil as hydrogen sulphide (H2S), as compounds (e.g.
sulphides, mercaptans, disulphides, thiophenes, etc.) or as elemental sulphur. Each
crude oil has different amounts and types o f sulphur compounds, but as a rule the
proportion, stability, and complexity o f the compounds are greater in heavier crude-
oil fractions. Hydrogen sulphide is a primary contributor to corrosion in refinery
processing units. Other corrosive substances are elemental sulphur and mercaptans.
Petroleum products containing sulphur compounds produce undesirables such as
sulphuric acid and sulphur dioxide.
1.3.2.2 Oxygen Com pounds
Oxygen compounds such as phenols, ketones, and carboxylic acids occur in crude
oils in varying amounts. The total amount o f combined oxygen in crude oils is
relatively low, ranging from traces to 2 % by weight [1]. Oxygen mainly exists in the
form o f carboxylic acid in the low and medium boiling range distillate fractions. For
this reason, and instead o f determining the total oxygen content, the determination of
the acidity o f the fraction becomes most significant. Consequently, paraffinic crudes
and their distillate fractions are low in acidity, where as asphaltic crudes like
4
Romanian, Venezuelan, Californian contain considerable amounts o f acids ranging
from 0.6 to 1.0 % by weight or higher [1].
1.3.2.3 Nitrogen Compounds
Organonitrogen compounds are present in traces in the lighter fraction o f crude oil;
their concentration increases with increasing boiling point and reaches a maximum in
asphaltic distillation residues. They are relatively stable towards heat and do not
decompose under refinery conditions, so their presence causes problems.
Metalloporphyrins are the most important organonitrogen compounds in crude oils.
Nickel and vanadium porphyrins are commonly the most abundant in crude oil and
used as geochemical biomarkers because they are fairly ubiquitous in nature. At the
same time, they cause problems for they poison catalysts used in refinery processes.
Nitrogen oxides are formed in process furnaces. The decomposition o f nitrogen
compounds in catalytic cracking and hydrocracking processes forms ammonia and
cyanides that can cause corrosion.
1.3.2.4 Salts
Crude oils often contain inorganic salts such as sodium, magnesium and calcium
chloride in suspension or dissolved in entrained water (brine). These salts must be
removed or neutralized before processing to prevent catalyst poisoning, equipment
corrosion, and fouling. Salt corrosion is caused by the hydrolysis o f some metal
chlorides to hydrogen chloride (HCI) and the subsequent formation o f hydrochloric
acid when the crude is heated. Hydrogen chloride may also combine with ammonia to
form ammonium chloride (NH4CI), which causes fouling and corrosion.
5
1.3.2.5 Carbon Dioxide
The decomposition o f bicarbonates present in or added to crude oils, or from the
steam used in the distillation process, produces carbon dioxide.
1.3.2.6 Trace Metals
Numerous trace elements have been detected in crude oils besides nitrogen, oxygen
and sulphur. O f the many metals listed (arsenic, barium, calcium, chromium, copper,
iron, lead, magnesium, manganese, nickel, silver, titanium, vanadium,... etc. ), nickel
and vanadium are the most abundant. Their concentrations depend on the source of
the crude oil and can range between < 1 pg g’1 to more than 1300 pg g"1.
They have been used as biomarkers to provide information on the depositional
environment o f the source rocks, determine the type o f organic source material,
estimate sediment or oil maturity, or to correlate crude oils with other oils or potential
source rocks [3]. The chemical identity o f these geological markers known as
petroporphyrins, varies between sources depending upon the biological conditions
inherent to each site. Vanadium / Nickel ratios do not change with the biodegradation
or weathering o f an oil seep [4,5] therefore each oil contains unique petroporphyrins
(fingerprint) which link the sample to its geographic origins. Consequently, oils from
different origins can be easily distinguished. The stability o f these compounds
enables matching oil spills to their sources even years after the spill occurred [6 ].
Nickel and vanadyl porphyrin concentrations vary depending on the source o f the
crude oil. It is indicated that vanadyl porphyrins are commonly more abundant in
heavy crude oils and the reverse is generally the case for light crude oils [7].
6
Table 1 shows the variation in trace element concentrations even among oils from the
same basin. West Canada basin was chosen to demonstrate the mean concentration of
elements in one basin [3].
Table 1. The mean concentration o f some trace elements o f West Canada basin with
their ranges in ppm [3].
Element Mean concentration ppm Range ppm
S % 0.83 0.05-3.9
V 13.6 0.1-177
Ni 9.38 0.1-74.1
Fe 10.8 0.1-254
Co 0.054 0 .0 0 0 2 -2 .0
Cr 0.093 0.005-1.68
Mn 0.01 0.003-3.85
Zn 0.459 0.025-5.92
As 0.111 0.002-1.99
Sb 0.006 0.0001-0.035
Se 0.052 0.003-0.511
Hg 0.051 0.002-0.399
Na 3.62 0.01-64.7
Cl 39.3 0 .1-1010
Br 0.491 0.002-12.5
I 0.719 0.01-9.0
7
1.4 Petroleum Refining O perations
Petroleum refining begins with the distillation, or fractionation, of crude oils into
separate hydrocarbon groups. The resultant products are directly related to the
characteristics of the crude oil processed. Most distillation products are further
converted into more usable products by changing the size and structure of the
hydrocarbon molecules through cracking, reforming, and other conversion processes.
These converted products are then subjected to various treatment and separation
processes such as extraction, hydro treating, and sweetening to remove undesirable
constituents (e.g. sulphur, hydrogen sulphide, ammonia) and improve product quality.
Figure 1 shows the distillation units at the Azzawiya oil refinery.
Figure. 1 Distillation Units at the Azzawiya oil refinery [8]
1.4.1 Refining O perations. Petroleum refining processes can be separated into
four basic areas:
1.4.1.1 Fractionation (distillation): Crude oil is separated in atmospheric and
vacuum distillation towers into groups of hydrocarbon compounds of
different boiling-point ranges called "fractions" (Figure 2).
Ci to C.j gases
tractionsdecreasing in
density an0 boding point
liquefied petroleum gas
chemicals
fractions m cr«s if|Q in
density and oo ‘mg po in t
petrol for vehicles
column
to Cg naphtha
f lh Cr, to C m petrol(gasoline
Cjq t o C ^ kerojme I paraffin oil!
l! |
cu wc20diesel oilsp H L T L
crude oil
C2 0 t0 C5Q uoricatinq oij-JlLTL
p r u m ^ C20 10 C70 fuel o
600* C
residue
jet fuel, paraffin for lighting and
heating
d ese: fitels
oils, waxes, polishes
fuels forships.factoriesandcentralheating
bitumen for roads and
roofino
Figure. 2 Diagram showing the fractional distillation process and the refinery
products at given temperatures [9].
9
1.4.1.2 Conversion processes change the size and /or structure of
hydrocarbon molecules. These processes include:
• Decomposition (dividing) by thermal and catalytic cracking
to augment the yield o f gasoline.
• Unification (combining) through alkylation and
polymerization such as the use o f polymerization o f olefins
which is effective in the production o f iso-paraffins o f high
knock-rating by which the gasoline is characterized.
• A lteration (rearranging) with isomerization and catalytic
reforming that converting straight chains to branches such
as converting butane or pentane to isobutane or isopentane.
1.4.1.3 T reatm ent. This process prepares the hydrocarbon stream for
additional processing and to prepare finished product. It includes the
removal or separation o f aromatics and naphthenes as well as
impurities and undesirable contaminants such as H2O, salts and
sulphur compounds.
1.4.1.4 Form ulating and Blending. In this process hydrocarbon fractions,
additives, and other components are mixed and combined to produce
finished products.
1.4.2 M ajo r Refinery Products
The major refinery products are liquified petroleum gas (LPG), gasoline, kerosene,
diesel oil, petrochemicals and lubricants, fuel oil and residue.
10
1.5 Elemental Determinations by Atomic Spectrometry •
Information on trace element concentrations in crude oil is very important for the
geochemical characterization o f source rocks and basins and for corrective actions
during oil production and refining (e.g. prevention o f scale formation and catalyst
poisoning, corrosion and pollution control) [3,10,11].
Trace metals occur in crude oil partly as organometallic compounds from which the
geoporphyrins o f V, Ni, Cu, and Zn have been identified [12-15]. Iron, Sr and Mn
contamination could have entered the oil during migration or as pollutants during oil
extraction. The elements Mo and Cr are o f biological origin [13].
There are three major types o f spectrometric methods for identifying the elements
present in samples o f matter and determining their concentrations; optical
spectrometry, mass spectrometry, and X-ray spectrometry [16].
Atomic spectrometric techniques have been used to determine trace elements, among
which are flame atomic absorption spectrometry (FAAS), electrothermal atomization
in graphite furnace (ETAAS), inductively coupled plasma-optical emission
spectrometry (ICP-OES) and inductively coupled plasma-mass spectrometry (ICP-
MS). FAAS is a well established and accessible technique, less prone to spectral
interferences in comparison to ICP-OES and ICP-MS, however, the detection limit is
still poor for a series o f elements for many applications in crude oil such as As, Sb,
Se, Hg and Sn [11,17]. Electrothermal atomization in a graphite furnace (ETAAS)
and Vapor generation techniques (VG) overcome the sensitivity limitations o f FAAS.
Amorim et al. [18] reported that oil samples might be analyzed directly by ETAAS if
low-temperature losses o f volatile compounds such as vanadium compounds are
11
avoided.
The behaviour o f various organic solvents and analytes in ETAAS has been studied
by Tserovesky and Arpadjan [19] who found that a high charring temperature is
necessary to reduce the nonspecific absorbance. For the influence o f the complexing
agent, they reported it is insignificant while the effect o f the nature o f the solvent is
more pronounced for toluene and xylene in comparison with IBMK and BA.
A Perkin-Elmer HGA-700 graphite furnace was used, with tungsten impregnated
graphite tube and using Pd as the chemical modifier in the organic medium.
Analyzing crude oil directly using little or no sample preparation is most suitable for
graphite furnace atomic absorption spectrometry although the organic sulphur content
in heavy oils may influence the determination o f vanadium [2 0 ].
Compared to AAS, ICP-OES offers a wider linear dynamic range, and several
elements can be determined simultaneously. This property is very important for the
multielement analysis o f very small samples [16,18,21]. The high viscosity of
petroleum and many o f its derivatives and the flammability o f the lighter fractions
make it very difficult to analyse these samples directly by ICP-OES or ICP-MS
[11,18,21,22]. As a result, the aspiration o f organic liquids into the plasma normally
requires additional equipment or sample pretreatment in order to maintain plasma
stability, reduce carbon build up and minimize background interferences.
Electrothermal vaporization (ETV) [18], ultrasonic nebulization (USN) [23] or
introduction o f oxygen to the plasma [2 1 ], have been used when introducing crude oil
or its derivatives to the plasma in order to reduce molecular band emissions and
prevent carbon build up.
12
Despite the spectral interferences and the high cost o f ICP-MS, it is considered to be
an attractive technique for the determination o f trace element concentrations in
several organic materials in the petroleum industry, because o f its multielement
capability and low detection limits. ICP-MS detection limits are in the sub parts per
billion range [24] and its ability to measure isotopic ratio is o f particular importance
[25,26].
Multiple calibration curves are often employed in multielemental techniques such as
ICP-OES and ICP-MS to cover the wide range o f metal concentration in crude oils,
from below ng g' 1 to hundreds o f pg g' 1 [11]. The standard addition method is
recommended for the complex matrices in order to get reliable results [10,23] and the
use o f internal standardization is essentially for instrumental drift correction and also
to account for differences between blanks, calibration standards and samples.
1.6 Sample Pretreatment and Preparation
Sample preparation is the critical step o f any analytical protocol, and involves steps
from simple dilution to partial or total digestion. Most methods based on atomic
spectrometric techniques require sample pre-treatment in order to make them
compatible with the employed instrumentation, and also allow easy and efficient
calibration procedures to be used. A variety o f procedures have been used that are
aimed at matrix simplification.
13
Ashing o f the crude oil followed by dissolution o f the ash in mineral acids has been
used [27]. An investigation o f some of the steps involved in the ashing procedures
was studied by Karchmer and Gunn [28] who revealed that unless care is taken, this
method may lead to low results due to the stratification o f the sample in the crucible,
and the loss o f volatiles such as lead and zinc halides, vanadyl and chromyl
compounds. Although this procedure is still largely employed in industry, it is time
consuming and could be unsafe because o f the release o f toxic vapours due to the low
flash point o f petroleum.
Alternatively, wet digestion o f the oil samples ensures that the organic matrix is
mineralized and the total metal content is converted to simple water soluble species.
Wet digestion procedures for oil samples can be performed in closed or open vessels,
using thermal energy or microwave radiation [29-32]. In the closed vessels, risk of
contamination from airborne particulates is reduced, but in both cases, problems arise
due to trace contamination from used digestion vessels and from the relatively large
volume o f mineralizing acids used (especially in the open vessel procedure). The risk
o f explosion still remains when using microwave digestion in closed vessels.
Extraction with acids is an applicable procedure but not with heavy petroleum
products containing high levels o f asphaltenes, and for volatile gasoline that have
very high vapour pressure [11,29], Acid extraction using ultrasound-assisted
digestion in which crude oil was treated with concentrated nitric acid and heated at 85
°C for 30 min has been proposed. The obtained mixture was placed in an ultrasonic
bath for 15 min and then was aspirated directly into an ICP-OES instrument.
Satisfactory recoveries were achieved for standard reference materials used to
14
validate the method [21,33].
Dilution o f crude oil with organic solvents {e.g. MIBK, kerosene, xy lene, etc) [11,
27,32,34,35] is by far the most studied and used direct introduction technique for ICP
instruments [11,36], because it reduces sample preparation time, decreases analyte
losses and reduces sample contamination [20]. However, other difficulties arise from
the wide range o f densities, viscosities, flammability and the increased care required
for safe disposal. In addition, the increased solvent plasma load (SPL) is a critical
problem that has been identified. The solvent load can cause instability and extinction
o f the plasma. Furthermore, the background levels due to carbon build-up [11] are
increased necessitating the introduction o f oxygen to the plasma to reduce molecular
band emissions and prevent carbon build-up. Desolvation devices such as ultrasonic
nebulizers (USN) [11,21,23] have been used to reduce the amount o f solvent
introduced into the plasma.
A multi-element optimization o f the operating parameters for simultaneous ICP-OES
with a charge injection device detector for the analysis o f samples dissolved in
organic solvents was carried out by Chirinos et al. [37]. They found that the nebulizer
pressure is the factor that must be carefully optimized when using a volatile organic
solvent.
Emulsification o f the sample with surfactant agents and water forming oil-in-water
emulsions is an alternative that offers the possibility o f circumventing the problem
identified above. This approach does not require the destruction o f the organic matter
or the use o f large amounts o f organic solvents. The use o f emulsions can reduce the
15
organic content o f the sample solution down to 5% w/w. When the oil is evenly
dispersed in the water phase, the sample behaves similarly to an aqueous solution.
1.7 Emulsion
An emulsion is a heterogeneous system o f two liquid phases, one o f which is
dispersed as microdroplets throughout the other by mechanical agitation [38]. Since
the resulting system has no or little stability, a surfactant is added to make the liquids
more compatible and facilitates the emulsification and often promotes stabilization of
the mixture [39].
Surfactants are usually organic compounds that are amphiphilic. That means; they
contain both hydrophobic and hydrophilic groups. The head is the hydrophilic, water
soluble part whilst the tail is the hydrophobic, water insoluble part . Since they are
soluble in both organic solvents and water, they reduce the surface tension at the
interface between the oil and water molecules and stabilize the emulsion.
The hydrophobic part o f the surfactant is a hydrocarbon chain in either aliphatic or
aromatic form or a mixture o f both while the hydrophilic part is the part by which the
surfactant is classified as anionic, cationic, nonionic or ampholytic which can behave
as either anionic, cationic or nonionic [40 ]. An example o f a surfactant is sodium
dodecylsulphate ( SDS):
CH3-CH2-CH2-CH2-CH2-CH2-CH2-CH2-CH2-CH2-CH2-CH2-S04'Na+
Hydrophobic Hydrophilic
16
Nonionic surfactants are the most commonly used in oil-in-water microemulsions
because they are compatible with the other types o f surfactant and their properties are
little affected by pH.
The amphiphilic nature o f the nonionic surfactant is expressed in terms o f the balance
between the hydrophilic and hydrophobic parts o f the molecule (hydrophile-lipophile
balance (HLB) number) and can be used to characterize the affinity o f surfactants for
aqueous and organic phases. A high HLB number generally indicates good surfactant
solubility in water, while a low HLB number indicates a lower aqueous solubility and
higher relative affinity for the organic phase [40].
The water soluble part o f nonionic surfactants can be hydroxyl groups or
polyoxyethylene chains. There are polyoxyethylated nonylphenols with a wide range
o f oxyethylene chain lengths from 1.5 to 100. Surfactants with low oxyethylene chain
lengths are water insoluble and are water-in-oil emulsifying agents, while longer
oxyethylene chain lengths are water soluble and produce oil-in-water emulsions.
Polyoxyethylated t-octylphenols are available as the Triton-X series which includes
X-114 (E7-8), X-100 (E9-10) and X-102 (E12-13). Surfactants with hydrophile-lipophile
balance (HLB) values between 8 and 18 tend to form oil-in-water emulsions [24,41].
Therefore Triton X-100 (HLB = 13.5) has been successfully employed in the
formation o f emulsions in petroleum oils. Figure 3 shows surfactants surround water
droplets and the polar-hydrophilic end is in the aqueous phase while the hydrophobic
end is in the oil phase [42].
17
Surfactantpolar end
hydrophobic end
particu lates
Figure. 3 Schematic for a water-in-oil emulsions. It shows a water droplet dispersed
in oil with the hydrophilic end o f the surfactant in the aqueous phase while the
hydrophobic end is in the oil phase [42].
18
In the early eighties, Polo-Dies et a l [43] proposed a method for the determination of
lead in gasoline by FAAS using an emulsion. They recommended mixing 1ml of
gasoline with 20 ml o f water and 5 drops o f emulsifier with HLB 13.5 and shaking
vigorously to form an emulsion which was then introduced directly into the flame.
The results showed the applicability o f the procedure and the sensitivity o f the
absorption signals was about 15 times higher than those from aqueous solutions. De
la Guardia and Sanches [44] reported a method for the determination o f manganese in
gasoline by FAAS using an emulsion in which 10 ml o f the sample was mixed with a
sufficient amount o f (1:1) B^.CCU solution. After evaporation o f the excess amount
o f bromine, 4ml o f emulsogen and a small amount o f water were added with stirring
until a clear solution was obtained. This method gave good results when compared
with a colorimetric method. However, care had to be taken because the reaction was
exothermic. V, Ni, Fe, Mg and Na determination was investigated by Platteau and
Carrillo [45] using FAAS. Highly stable crude oil emulsions were prepared by mixing
3g o f homogenized crude oil, 15 ml o f ethyl alcohol and 0.3g o f linear alkylbenzene
sulfonic acid (10 wt%). The homogenized mixture then was subject to a dry ashing
procedure (ignition, burning in muffle furnace at 550 ± 5°C, dissolving the ash with
acids). The method was shown to be reliable and accurate but at the same time it was
time consuming. In addition, changes in V and Na signals due to the ionization effect
for V in a nitrous oxide-acetylene flame and for Na in the air-acetylene flame
required the addition o f ionization suppressants. For Na, 2000 mg L' 1 K was added to
the standards and samples, while Al was used to suppress the ionization effect for V.
19
Aucelio and Curtius [17] determined the concentrations o f As, Se and Sb in gasoline
and kerosene by ETAAS using two sample preparation procedures. The first
procedure involved the formation o f a detergentless microemulsion by mixing an
appropriate amount o f the sample with water and propan-l-ol; (10:25:65) v/v/v for
gasoline and (10:15:75) v/v/v for kerosene and 1 ml o f concentrated nitric acid in a 10
ml volumetric flask. In the second procedure, a surfactant microemulsion was
prepared in which 10 % of the sample was mixed with lm L concentrated nitric acid
and the mixture was sonicated for 5 min, then 4% v/v non-ionic surfactant (Triton X-
100) was added. Mechanical agitation was used in both procedures. The preparation
o f oil samples as surfactant microemulsions were found to be the most appropriate,
although they were stable for only 10 min. However, direct correlation between
analyte signals in the sample and in an aqueous standard were found to be
satisfactory.
Silva et a l [46] described a method for the determination o f lead and copper in
kerosene by ETAAS. A three- component solution was prepared from kerosene,
propan-l-ol and 0.2 % nitric acid (5:11:2 ml respectively). This three component
solution provided adequate stability (24 h) which made it possible to determine both
elements in the presence o f Pd as modifier. Burguera et a l [47] developed a
procedure to form an on-line emulsification o f lubricating oils to determine chromium
by a flow injection system and ETAAS. The surfactant used for this study was
sodium dodecylsulphate (SDS) with an HBL of 40.0 and hexane as co-solvent. It was
considered that the addition o f any modifier would bring no further advantage. The
results were precise and the recovery values were between 99.2 to 102.2%.
20
Aucelio and Curtius [32] described the determination o f silver by ETAAS in used
lubricating oils. In a 10 ml volumetric flask, 0.2 g o f the sample and 0.5 ml
concentrated HNO3 were mixed and sonicated for 5 min. A volume o f 0.5 ml of
xylene was added with 0.4 ml of Triton X-100. Water was added dropwise with
continual agitation. In this study, a comparison was made o f the three methods;
dilution with organic solvent, acid digestion and the formation o f emulsion. The latter
was found to be the most effective, although it was stable for only 30 min. The same
authors with Welz [48] applied the previous procedure to determine Sb and Sn in
used lubricating oil by ETAAS with aqueous calibration. The accuracy and
repeatability o f the method was verified by using two standard reference materials
(SRM 1084a and SRM 1085a). Ru was used as a modifier for both elements and
results showed good correlation between absorbance signals for spiked emulsions and
aqueous standards.
A three component system (gasoline-ethanol-water) was prepared by Ozcan and
Akman [49] to determine Cu, Co and Pb in gasoline by ETAAS using an aqueous
standard addition method. 1 ml o f gasoline was mixed with 2.5 ml o f water and 0.5
ml o f concentrated HNO3 followed by the addition o f standard solution then
completion to 10 ml with 96% ethanol. It was reported that the addition o f nitric acid
to the three component system is required in order to attain accurate determination of
the analytes. Results were verified by microwave digestion using HN0 3 , where it was
found that there was no significant difference between the two methods. Matos Reyes
and Campos [50] developed a method for the determination o f Ni and Pb in diesel
and gasoline samples stabilized as a microemulsion, using graphite furnace atomic
21
absorption spectrometry. Long term sample stabilization was obtained by mixing 3.3
ml o f the sample with 6.5 ml propan-l-ol and 0.1 ml o f 50 % v/v HNO3. A
transparent microemulsion was attained which was stable for more than 15 days.
Aqueous modifiers such as Pd and Mg showed good performance for Pb
measurement.
The determination o f trace metals in lubricating oils using atomic spectrometric
techniques has been reviewed by Aucelio et a l [51] highlighting problems related to
sample pretreatment and calibration, as well as strategies to overcome them.
Aluminum was determined by Burguera et a l [52] in lubricating oils emulsified in
a sequential injection analysis system by ETAAS. 0.5 ml o f the sample was mixed
with 1 ml o f sec-butanol solution and 1 ml o f the surfactant mixture then they were
subjected to 5 sequences during which standard addition was used in order to study
the matrix interference on the aluminum absorbance. No significant difference was
found when compared with that obtained from a single calibration curve.
Inductively coupled plasma optical emission spectrometry has been used successfully
for the determination o f trace elements in crude oil and its derivatives. ICP-OES was
used by Souza et a l [53] for the determination o f Ni, Mo, Cr, V, and Ti in used
lubricating oil. 0.2 ml o f sample was acidified using 0.5 ml concentrated HNO3 then
emulsified by adding 0.5 ml xylene as co-solvent and 0.6 ml Triton X-100 as
surfactant. An inorganic standard was used for calibration and three different certified
lubricating oils were analyzed. Although the emulsion was stable for only 40 min,
good accuracy was achieved for Ni, Mo, V and Ti while for Cr the recovery was
slightly worse, however such behaviour for Cr is not unusual in oil samples
22
[53,55,56].
A procedure to prepare crude oil samples as detergentless microemulsions to
determine Mo, Zn, Cd, Ti, Ni, V, Fe, Mn, Cr and Co by ICP-OES was demonstrated
by Souza et al. [54]. The composition o f the microemulsions was 0.6 g o f crude oil
(previously dissolved in 0.5 ml o f xylene) mixed with 0.4 ml o f concentrated nitric
acid. Then propan-l-ol and water were added in an alternate way (1.1 ml o f propan-l-
ol followed by 0.25 ml o f water) until a final mass o f 10 g was attained. Oxygen was
used in the nebulizer gas flow in order to minimize carbon building up and
background. Standard reference material (SRM 1634c) was used to verify the
accuracy o f the method and the recoveries were between 97.9% and 103.8%. Souza et
al. [55] also compared two sample emulsification procedures (Triton X-100 emulsion
and detergentless emulsions) for the determination o f Mo, Cr, V and Ti in diesel and
fuel oil by ICP-OES. For detergentless emulsions, 2.5 g o f the sample was acidified
with 0.5 ml o f concentrated nitric acid and mixed with 6 ml o f propan-l-ol. Water
was used as a complement o f these compositions. For detergent emulsion, 1.5 g o f the
sample previously dissolved in xylene was placed in a 10 ml volumetric flask with
0.5 ml o f concentrated nitric acid. The mixture was placed in an ultrasonic path for 5
min, then 0.3 ml o f Triton X-100 was added followed by water. The whole
compositions were sonicated for 5 min after vigorous shaking for 2 min. In the two
cases (Triton X-100 emulsion and detergentless emulsions), milky homogeneous
emulsions were achieved which separated shortly into two phases that could be
readily reconstituted after manual shaking. Good recoveries and better results were
obtained for detergent emulsions with concentrated nitric acid, with limits of
23
detection at the ng g' 1 level. Oxygen was used as auxiliary gas flow to minimize
carbon buildup and plasma background.
Not only crude oil and its derivatives were studied using the emulsification procedure
but vegetable oils, margarine and butter were investigated as well by Souza et al.
[56]. ICP-OES was used for determination o f six elements (Cd, Co, Cr, Cu, Ni and
Mn) in olive oil, soy oil, margarine and butter which were prepared using two
procedures (detergent and detergentless emulsions). In order to prepare detergent
emulsions in a 10 ml volumetric flask, 0.2 g o f the sample, 0.5 ml o f concentrated
HNO3 with an amount between 0.1 and 2 g o f Triton X-100 were added. It was
reported that the Triton X-100 emulsion for soy and olive oils gave very short
stabilities (less than 3 min). While for margarine and butter, even when the samples
were previously dissolved in 0.5 ml of xylene, Triton X-100 emulsions were not
formed. The second procedure described by Souza involved the formation o f
detergentless emulsions by weighing an amount between 0.1 and 1 g o f the sample
into a 10 ml volumetric flask with 7 g o f propan-l-ol and 0.5 ml o f HNO3. Margarine
and butter were dissolved in 0.5 ml o f xylene before any addition. After vigorous
shaking the emulsions remained stable for a few hours. Good sensitivities with limits
o f detection in the ng g' 1 range were achieved for the detergentless emulsions.
As some elements are found in the oil at very low concentration levels, inductively
coupled plasma mass spectrometry could be a remarkable alternative, because o f its
high sensitivity and simultaneous detection that can be carried out easily and rapidly.
A new approach for introducing crude oil directly into ICP-MS by forming a
microemulsion using tetralin and Triton X-100 was described by Lord [24]. About
24
0.5 g o f crude oil with an equivalent amount o f tetralin were weighed in a tared 60-ml
glass bottle and the contents were mixed until a homogeneous mixture was achieved.
Then 1 g o f Triton X-100 was added and the mixture was mechanically agitated until
reaching homogeneity. De-ionized water was added gradually with continual
agitation until a final mass o f 50 g was attained. The author reported the formation of
a very stable emulsion with no phase separation even after several months o f storage.
Accuracy was verified by analyzing two standard reference materials (NBS 1634b
and NBS 1085), and the results obtained were in good agreement with the certified
values.
Al-Swaidan [10] provided a new automated technique for trace elements analysis by
sequential injection analysis / inductively coupled plasma-mass spectrometry using an
emulsion o f crude oil. 0.5 g o f oil was mixed with 1.5 ml o f tetralin, 0.5 ml o f Triton
X-100 and 5 ml o f 40 % nitric acid with graduate addition o f water until 50 ml of
homogenized solution was obtained. The sequential injection system easily
introduces the samples to the ICP-MS. This technique enabled good results for Pb
and Ni, while low concentration for V was obtained due to its background.
Al-Swaidan [57] also studied the determination of vanadium and nickel in some
Saudi Arabian crude oils and petroleum products (aviation turbine oil, gasoline and
diesel fuel oil) by ICP-MS using the previous technique described by Lord [24] and
the concentrations were measured using a standard addition method. Reasonable
detection limits were obtained and the recoveries o f added metals were between 98 -
103 %.
25
This technique was successfully applied on light fractions o f crude oil as well. V, Co,
Ni, As, Hg and Pb were determined in naphtha by ICP-MS using Triton X-100 to
form an emulsion without the addition o f a co-solvent. Kumar and Gangadharan [22]
mixed 2 ml o f naphtha with 1ml o f 2.5 % solution o f Triton X-100 in a capped 5 ml
container, with stirring with a magnetic stirrer for 20 min. Immediately after
emulsification the solution was introduced into the ICP-MS. The recovery for Ni and
Pb was close to the added value, for V was 60% and almost no recovery was attained
for Hg and As when adding aqueous standard solutions to the emulsion. They
recommended not to use an aqueous standard for calibration for analyzing emulsified
naphtha. Saint’Pierre et al. [38] treated gasoline with concentrated HNO3 and Triton
X-100 to form an emulsion to determine Cu, Mn, Ni, and Sn by electrothermal
vaporization ETV ICP-MS. They used the procedure described by Aucelio and
Curtius [17]. They reported that this emulsion was stable for only few minutes and
they recommended pre-concentrating the emulsion by repeated pipetting and drying.
Gasoline was emulsified using tetralin and Triton X-100 by Heilmann et al. [58] to
determine sulphur by Isotope Dilution ICP-MS. They used the procedure described
by Lord [24] and they reported that the use o f transparent microemulsions is a
necessary precondition for precise and accurate sulphur analysis in gasoline and
related fuel samples. A satisfactory accuracy was obtained by analyzing two different
certified gas oil reference materials using the proposed procedure and comparing the
recovery with those obtained by microwave assisted digestion.
Castillo et al. [59] described a simple method for a semiquantitative simultaneous
determination o f various metals in olive oil using direct emulsion nebulization with
ICP-MS. Approximately 2 g of oil was mixed with 1.5 ml of Triton X-100 and
stirred mechanically and the homogenized mixture had a final weight of 50 g. In
order to get a stable emulsion, the addition of HNO3 was not recommended. Results
from spike and recovery experiments at the level of 100 and 200 ng mL"1 were 93 -
136 % for all elements (Ba, Cd, Co, Cr, Cu, Ge, Mn, Ni, TI, Pb, U and V) except for
Zr which was found to range between 73.8 - 76.2 % . The detection limits were
found to be suitable for very low concentrations of metals in olive oil.
1.8 Inductively Coupled Plasm a-M ass Spectrom etry (ICP-MS)
ICP-MS is a fast, precise and accurate multi-element analytical technique for the
simultaneous determination of trace elements in liquid and solid samples. Nearly all
the elements in the periodic table can be analyzed by ICP-MS. The analytical range
extends from ppt (pg g"1) to ppm (pg g’1). ICP-MS consists of the following
components:
sample introduction system, excitation source, ion transport system, mass separation
device, detector and data processing (Figure 4).
Sample Introduction and Aerosol Generation
M ass discriminator and Detector
Ionization by Argon Plasma
Data AnalysisnFigure. 4 Schematic of the main components and processes of an ICP-MS [60]
27
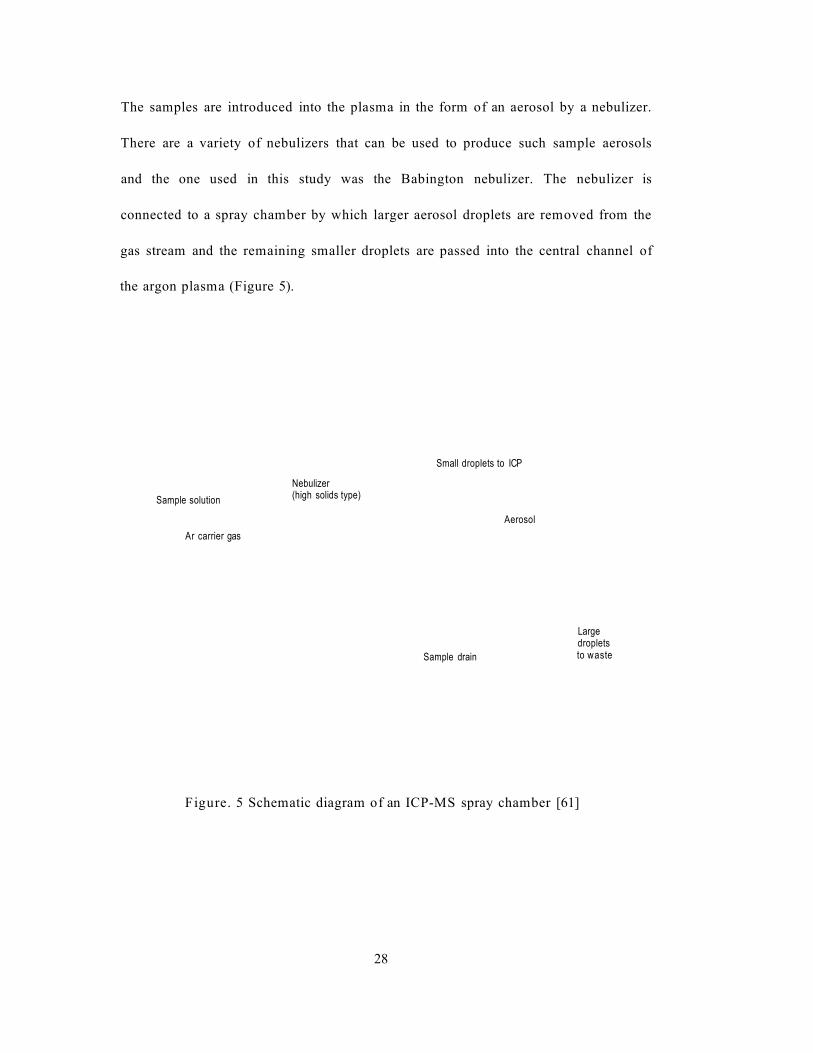
The samples are introduced into the plasma in the form of an aerosol by a nebulizer.
There are a variety of nebulizers that can be used to produce such sample aerosols
and the one used in this study was the Babington nebulizer. The nebulizer is
connected to a spray chamber by which larger aerosol droplets are removed from the
gas stream and the remaining smaller droplets are passed into the central channel of
the argon plasma (Figure 5).
Sample solution
Ar carrier gas
Nebulizer (high solids type)
Small droplets to ICP
Aerosol
Sample drain
Large droplets to waste
Figure. 5 Schematic diagram of an ICP-MS spray chamber [61]
28
The plasma is generated in a quartz torch, which consists of three concentric quartz
tubes. The outer quartz tube introduces the auxiliary gas flow to the inner annular
space. A flow of Ar gas carries the sample aerosol to the plasma through the central
tube. The plasma is generated by applying a spark from a Tesla coil on the argon gas
passing through the central tube of the quartz torch. The spark generates free
electrons and ions which are coupled to the magnetic field formed as a result of the
radio frequency current passing through the cooled copper coil placed around the
torch (Figure 6 ). Temperatures in the plasma range from 6000 to 10,000 K. Once the
aerosol droplets are introduced to the high temperature plasma, they are vaporized,
atomized, then ionized [62].
rapid oscillation o f / electrons -> HEAT (
Radio frequency v o lta g e in d u ces oscillation o f Ar ions and
- 1 0 , 0 0 0 K)
Plasma gas
Quartz "torch" m ade of concen tric tub es
Auxiliary or coolan t gas
Carrier or injector or nebulizer gas
RF load coil
Sam p le a eroso l is carried through cen ter of plasm a -> dried, d issociated , atom ized, ionized - 6 5 0 0 K.
Figure. 6 ICP-MS plasma torch [61]
29
The produced ions are transferred to the mass spectrometer by an ion transport system
that consists of the interface region and the ion lens system that perform the
separation of the ions from the photons and residual neutral material. The ions in the
centre of the plasma are sampled into the quadrupole mass spectrometer through the
interface region that consists of two successive Ni cones with 1mm diameter. The
first extraction of the ions is through the orifice of the sample cone into the region
between the two cones where the pressure is about 1-3 torr by rotary vacuum pump.
Further extraction for the ion beam is through the orifice of the skimmer cone into the
ion lens system in the front part of the mass spectrometer where the pressure is about
(10° - 10'4 torr) by turbo molecular vacuum pump. The positively charged ion lens
extracts the positive ions from a matrix of neutral species and focuses the ion beam
into the mass spectrometer (Figure 7).
Skimrcone
Figure. 7 Schematic of an ICP-MS sampling and skimmer cones with the extraction
lenses [61]
30
The most commonly used mass separation device in ICP-MS is a quadrupole mass
spectrometer which acts as a mass filter that separates ions according to their
mass/charge ratio. The separated ions pass through the mass spectrometer to the
detector to be measured. Ion signals are measured with an electron multiplier, which
has its inside walls covered with a metal oxide. A negative voltage is applied to the
multiplier to attract the positive ions. When the ions get in contact with the metal
oxide wall they eject further electrons. These secondary electrons, which are
accelerated down the tube by the potential gradient, hit another section o f the coating
and more secondary electrons are emitted. This process is repeated many times, so
that in the end one ion collision leads to about 108 electrons. The multiplier can be
operated in the pulse count or in the analogue mode depending on the concentration
o f the analytes being measured. In the pulse count mode the negative voltage applied
is higher and more secondary electrons are produced. The electrons are detected as a
single pulse. This mode is used for concentrations ranging from the detection limit up
to 1 mg L '1. The analogue mode (one ion collision leads to about 104 electrons) is
suitable for concentrations between 1 and 100 mg L’1. In this mode the multiplier
does not become saturated. The ion intensity is converted to a pulse counting signal.
The signal is measured as a current which is subsequently converted into counts per
seconds (cps).
31
1.8.1 Instrument Optimization and Tuning
The stability o f the signal intensity provided by ICP-MS instruments depends on the
plasma operating conditions. Instrument optimization involves maximizing the
signal-to-noise ratio (usually for the middle o f the mass range isotope such as 103Rh)
by finding the optimal nebulizer gas flow rate, ion lens voltages and RF power. At the
same time, care must be taken to minimize the production o f doubly charged ions
(increases with decreasing nebulizer gas flow and also depends on the position of the
plasma relative to the interface cones) and o f molecular ions such as oxides
(decreases with decreasing nebulizer gas flow and also depends on the position of the
plasma relative to the interface cones).
1.8.2 Interferences
A few interferences do occur in ICP-MS, but these are generally predictable and can
often be corrected for or may be minimized by optimizing instrument operating
conditions. Three types o f interferences can occur in ICP-MS measurements:
1.8.2.1 Isobaric Interferences
co co 9 f.A #They occur for equal mass isotopes of different elements (e.g. Fe on Ni Ni on
64Zn 48Ca on 48Ti) and these are best avoided by choosing alternative isotopes.
1.8.2.2 Molecular (or Polyatomic) Interferences
They occur due to the recombination of sample and matrix ions with Ar or other
matrix components (e.g. O, N, C l , .........etc) in the cooler region o f the plasma.
(e.g. 40A rl6O on 56Fe 47Ti160 on 63Cu 40Ar35Cl on 75As 40Ar2 o n 80Se)
They can be avoided using alternative analyte isotopes or by applying correction
factors determined by analyzing interference solutions. They can also be reduced or
32
eliminated by using more appropriate sample introduction systems such as ultrasonic
nebulization (USN) and electrothermal vaporization (ETV) or optimizing instrument
operating conditions.
1.8.2.3 Doubly- Charged Ion Interferences
They occur due to relatively rare doubly-charged matrix or sample ions with twice the
mass o f the analyte and hence the same mass/charge ratio (e.g. 90Zr++ on 45Sc+). It can
generally be minimized by optimizing instrument operating conditions.
The volatile compounds are enriched in the aerosol/vapor stream that enters the
plasma, due to their higher vapor pressure. The presence o f those volatile organic
compounds in a crude oil sample will cause signal enhancement thus increasing the
polyatomic ion background [24]. The determination o f some elements such as V, Cr
and Fe by ICP-MS is known to suffer from the polyatomic isobaric interferences on
51V caused by 34S 16OH+, on 56Fe caused by 40Ar 160 + and on 52Cr caused by
40A r12C+and 35C1160 + [63]. The deposited carbon on the cooler surfaces o f the sample
skimmer cone and ion lenses o f ICP-MS, affects the transport efficiencies o f ions and
also carbon-argon species cause polyatomic interferences, which affect the
determination o f Mg, Cr and some other elements [23,64,65]. Table 2 depicts some
important interferences in quadropole ICP-MS that are expected from organic crude
oil matrices.
33
Table 2. Interferences from organic crude oil that may occur in quadrupole ICP-MS.
Isotopic abundances quoted in brackets [23]
Measured Isotope % Principle Interferences
“ Al (100) u C ‘4N ;“ C ,4NH
Mg (78.7);2<>Mg (11.17) “ C “ C ;UC 'JC
44Ca (2.06) “ C 160 l60
4/Ti (7.28) “ S,/0 ; 3(>A r“ C
“ Cr (83.79);“ Cr (9.55) 4UA r“ C;4UA r,4C
“ Fe (2.19) 4UA r,/0
0UNi (26.23); “ Ni (3.66) Jt,A r“ C “ C;J0A r,3C 13C;J5A r“ Cu C
6JC u(69.17);"C u (30.91) 4UA r^N a;“ S33S;“ S‘0O l/O;“ S 't,O2H
00Zn (27.81) 4UA r'3C '3C;33S33S;34S33S
1.8.3. M atrix Effects
Clogging o f the orifices in either or both o f the interface cones may be a problem
when samples with high total dissolved solid (TDS) contents or oil samples are
analyzed. The problem may be overcome by sample dilution or using an
alternative sample introduction system (e.g. Ultrasonic nebulizer with a
desolvation unit).
34
1.9 Reliable Measurements
1.9.1 Method Validation
Method Validation is the process o f proving that an analytical method is acceptable
for its anticipated purpose and it has a direct impact on the quality o f the analytical
data. In general, methods for regulatory submission most include studies on
specificity, linearity, accuracy, precision, detection limit and quantification limit.
1.9.1.1 Specificity & selectivity
It is the ability o f the method to accurately measure the analyte response in the
presence o f all potential sample components [6 6 ]. Therefore, in order to select a
method for a particular analysis, we should take into consideration its ability to give
accurate and precise results free of interferences and matrix effects especially in
crude oil samples that contain high levels o f organic compounds. For example, when
selecting a method to analyze crude oil samples, there are some important points that
should be focused on, such as: the volatiles content o f the crude that may be lost
during some steps in sample preparation techniques, the stability o f the analytes of
interest in the specimen solution and choosing the right technique that is most suitable
to measure the concentration o f the analytes in the sample accurately, precisely and
with no interferences.
1.9.1.2 Accuracy or Bias
It is the closeness o f the measured value to the true value for the sample. Accuracy is
usually determined in one of four ways. First, accuracy can be assessed by analyzing
a CRM and comparing the obtained result to the certified value. The second approach
is to compare test results from the new method with results from an existing accurate
35
method. The third approach is a recovery study, which is performed by spiking
analyte in blank matrices. The fourth approach is the standard addition technique,
which can also be used to determine the recovery o f spiked analyte
1.9.1.3 Precision
Precision is the closeness o f the measured values to each other. An instrument
precision study is performed by analyzing one sample solution 10 times to test the
performance o f the instrument by SD or RSD.
1.9.1.4 Limit o f Detection (LOD)
It is the smallest concentration o f analyte which can meaningfully be detected. It is
also defined as 3*SD° where SD°is the standard deviation o f the blank.
1.9.1.5 Limit of Quantification (LOQ)
It is the lowest amount o f analyte in a sample which can be quantitatively determined.
It is also defined as 1 0 *S D o where SD°is the standard deviation o f the blank.
36
1.10 Characterisation o f Libyan Crude Oils
Giant oil fields were discovered in Libya from 1956 to 1961. Libya started exporting
oil in 1961 and by 1966 it was the 7th largest oil-producing nation in the world. The
extraordinary discoveries in the Sirt basin, where 19 o f 21 giant fields were located
with recoverable reserves of 40 billion barrels o f oil (bbl) [67], attracted the
international exploration companies all around the world to make further discoveries
in Libya.
Aside from the Sirt basin, there are other onshore explorations, including areas in the
Ghadames and Murzuq basins plus other explored areas such as Kufra (in the
southeastern desert) and Crenaica-Botnan (near the Egyptian border) (Figure 8).
Ghadames is Libya's second-most explored basin, and is linked geologically with oil
and gas structures in Algeria and Tunisia. Murzuq has been a successful area for oil
and gas exploration in recent years, with new fields including the El-Sharara and NC-
174 (Elephant) fields [67].
There are also major discoveries in the Mediterranean at the north west o f Libya
where the offshore oil fields El- Bouri and Al-Jurf are found.
In this study, three Libyan crude oils were selected from different basins to determine
the trace elements using microemulsion as a sample introduction technique into the
plasma, for ICP-MS analysis. The characterizations o f the selected oils are as follows:
a) El-Bouri oil field off Libya’s western coast is the largest producing oil field at
around 110,000 bbl/d, in the Mediterranean sea. Italy’s Eni is the developer of
the field, which was discovered in 1976 at a depth o f 8,700 feet. It is
paraffinic with API gravity o f 26 and 1.8 % S content.
37
b) El-Sharara oil field is in the Murzuq basin, in the desert south o f Tripoli,
producing around 100,000 bbl/d o f light sweet oil. Repsol is the developer o f the
field and it leads a European consortium, which consists o f Austria’s OMV and
Total o f France. The crude oil is paraffmic with API gravity o f 41.5 and a low S
content o f 0 .6 %.
c) Amna crude oil was supplied by National oil Corporation. It is paraffmic with
API gravity o f 36.7 and a low S content o f 0.17 %.
Table 3, shows the main characterizations o f El-Bouri, El-Sharara and Amna crude
oils and Figure 8 shows the locations of main basins in Libya.
Table 3 Characteristics o f Libyan Crude Oils [68,69]
C rude Oil El- Bouri E l-Sharara Amna
Specific G ravity a t 15.6/15.6 °C 0.8986 0.8179 0.8412
Density a t 15 °C 0.8981 0.8170 0.8374
A PI G ravity 26.0 41.5 36.7
Total Sulphur, w t% 1.8 0 .6 0.17
P our Point, °C + 6 <- 33 + 24
Type Paraffmic Paraffmic Paraffmic
38
u r\ t. IN n I Vj> n /
B G T N A N
M e s s a
1Naraors
TS a ri r
Q S a r i r R e f i n e r y
J O N
400 Km
H A D A M E S: - ■ V ..
H a m a d 3 e l M s n ra
Figure. 8 The map of Libya with six sedimentary basins; Sirt, Ghadames, Murzuq,
Kufra, Crenaica-Botnan and offshore Tripoli basin [70]
39
1.11 The approach adopted in the present study
1. The microemulsion formation was optimized and factors affecting the stability of
the microemulsion were studied.
2. Calibration curves were established using emulsified multielement aqueous
standards.
3. In order to validate the method, two certified reference materials; HU-1, (Used
Oil) and NIST 1084a, (Wear Metals in Lubricating Oil) were emulsified and the
obtained results were compared to other results from three different preparation
methods (dry ash, wet digestion and microwave digestion).
4. A spike recovery test was made by spiking a significant amount o f the standard
solution to the emulsified samples which was then introduced to the plasma.
5. Analysis o f two reference materials (HU-1, (Used Oil) and NIST 1084a, (Wear
Metals in Lubricating Oil)) prepared with the proposed method in order to confirm
the accuracy o f the applied method.
6 . A calibration using simple aqueous multielement standards was carried out.
7. Three Libyan crude oil samples were emulsified using the proposed methodology
and introduced into the plasma in order to measure the trace elements (Ti, V, Ni, Cu,
Mo, Mn, Cd, Sn and Pb) using ICP-MS.
8 . A comparison was made between the results o f the crude oil samples obtained
using the microemulsion procedure to those obtained using dry ash, wet digestion and
microwave digestion.
40
1.12 The Motivation
Demand from the petroleum industries for determination o f trace metals such as Ni,
V, Hg, As, and Pb in crude oil and its derivatives makes it very necessary to find an
alternative, simple, rapid, and accurate sample preparation technique for simultaneous
determination o f trace metals. Those metals cause several problems in refinery
processes because they poison catalysts and cause corrosion to the furnaces, and
boilers, and consequently reduce the quality o f petroleum products.
Introducing the crude oils directly to the plasma with out pre-treatment, leads to a
variety o f problems. However, wet digestion and dry ash procedures are time
consuming and the sample may be exposed to contamination and there is the
possibility o f the loss o f the analyte during the preparation steps. There is therefore, a
need to develop an alternative sample preparation method. Emulsification o f the
crude oil has been shown to be a successful alternative technique.
1.13 The Aims
To develop an accurate and fast method for trace element determination in crude
oils and to apply the method in routine analysis.
To allow access to the high sensitivity o f ICP-MS for crude oil analysis without
requiring acid decomposition o f the crude oil samples.
To eliminate any potential loss o f analyte elements due to volatilization or
precipitation during the digestion procedures.
To reduce the time for sample preparation to a minimum.
To overcome the problem o f carbon build-up on the mass spectrometer interface
To characterize selected Libyan crude oils quantitatively
41
Chapter 2
2. Experimental
2.1 Instrum entation
The spectrometer used in this study was a Hewlett Packard 4500 quadrupole
inductively coupled plasma mass spectrometer (model number HP 4500 G1820A,
manufactured in Japan) equipped with a Babington nebulizer. Argon 99.95% was
used as the plasma gas. A peristaltic pump was used to feed the nebulization system
with sample and standard solutions. A CE precision Ultrasonic Bath from England
was used for microemulsion preparation. A ST Hotplate and a microwave digestion
unit from CEM Corp. (USA) were used for acid dissolution o f samples. The operating
conditions are listed in Table 4.
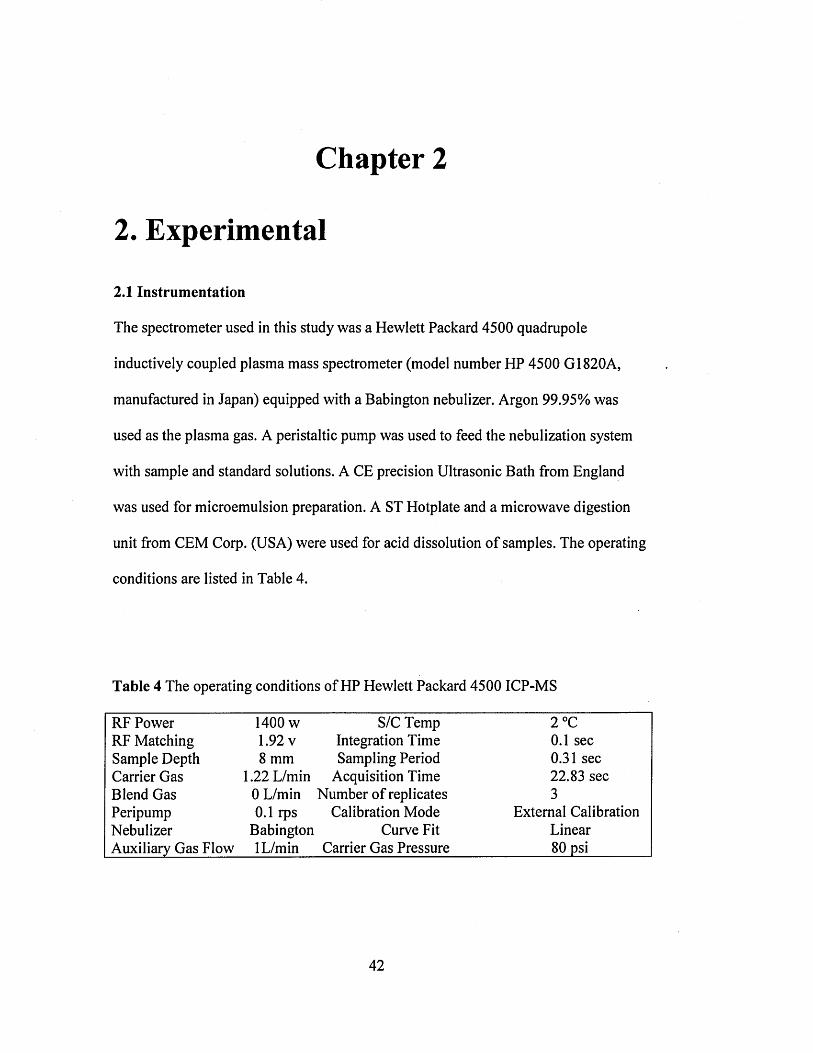
Table 4 The operating conditions of HP Hewlett Packard 4500 ICP-MS
RF Power 1400 w S/C Temp 2 °CRF Matching 1.92 v Integration Time 0.1 secSample Depth 8 mm Sampling Period 0.31 secCarrier Gas 1.22 L/min Acquisition Time 22.83 secBlend Gas 0 L/min Number o f replicates 3Peripump 0.1 rps Calibration Mode External CalibrationNebulizer Babington Curve Fit LinearAuxiliary Gas Flow 1 L/min Carrier Gas Pressure 80 psi
42
2.2 Reagents
The water used in this study was ultra pure water obtained from an ELGA system,
ultra ionic model, manufactured in UK. All glassware were soaked in 20% v/v nitric
acid for several days and rinsed with hot nitric acid then with de-ionized water prior
to use. Ti, V, Cr, Mn, Ni, Cu, Mo, Cd, Sn, and Pb standard solutions were prepared
fresh from individual element stock standard solutions (1 0 0 0 pg ml*1) supplied by
BDH Poole, England, and were used for calibration after specific serial dilution.
Tetralin (1,2,3,4-tetrahydronaphthalene) supplied by Fluka AG was employed as the
co-solvent. A non-ionic surfactant Triton X-100 98-100% (Isooctylphenoxy
polyethoxy ethanol) supplied by BDH Poole, England was used as the emulsifying
agent. Aristar grade nitric acid 69% Sp.g 1.42, sulphuric acid 95% Sp.g 1.84 and
hydrogen peroxide 30% (supplied by BDH Poole, England) were used for this study.
Analytical accuracy was evaluated by using certified reference material 1084a (wear
metals in lubricating oils) supplied by NIST and HU-1 (used oil) supplied by SCP
Science. Magnesium nitrate (supplied by BDH Poole, England) was used as an ashing
aid in the dry ash procedure. Indium stock standard solution (1000 pg ml*1) (supplied
by BDH Poole, England) was used as an internal standard. Three Libyan crude oil
samples (EI-Bouri, El-Sharara and Amna) were supplied by the Libyan Petroleum
Institute.
43
2.3 Sample Preparation
2.3.1 Dry Ashing
A 0.5 g aliquot o f crude oil was weighed into a porcelain crucible and magnesium
nitrate was added. The sample was burned and the residual carbon was then heated in
a muffle furnace at 525 °C until a white ash was obtained. Then the inorganic residue
is digested in dilute nitric acid. After filtration, the sample was made up to the
volume (25 ml) with de-ionised water.
2.3.2 Wet Digestion
A 0.1 g aliquot o f homogenized oil sample was weighed into a 100 ml beaker and 3
ml o f sulphuric acid was added. The mixture was heated gently to avoid charring for
about 15 minutes. Then 5 ml o f nitric acid was added and the mixture boiled for 30
minutes after which the mixture was put aside to cool. 3 ml o f hydrogen peroxide
was added dropwise to the cold solution and the mixture boiled until a clear solution
was obtained. The solution was filtered into a 100 ml flask and made up to the mark
with de-ionised water [71].
2.3.3 Microwave Digestion
Amounts o f 0.1 g o f oil were placed in a Teflon bomb containing 2 ml o f
concentrated nitric acid. Samples were subjected four times to the following
digestion program: 5 min at 300 W, 1 min at 0 W and 5 min at 600 W. The Teflon
bombs were allowed to cool down (25 min) before each o f the subsequent runs, and a
new aliquot o f 2 ml o f concentrated H N 03 (second and third runs) and 1 ml H2O2
(fourth run) was added to the vessel. The contents were then transferred to a 100 ml
volumetric flask and diluted with de-ionised water [33].
44
2.3.4 Microemulsion Preparation
Oil-in-water microemulsions were prepared, as follows, using a specific sequence in
order to guarantee its homogeneity: 0.1 g o f a homogenous crude oil sample was
weighed into a 100 ml clean and dry volumetric flask. An equivalent weight of
Tetralin is added to the flask and the mixture was agitated mechanically using an
ultrasonic bath for 7 min. 0.3 g o f Triton X-100 is added to the solution and the
o omixture was mechanically agitated for 20 min at a temperature o f 45 C to 55 C until
a homogenous solution was obtained. 5 ml o f de-ionized water was added dropwise
with continual agitation, then the solution was made up to the mark with 0.1 % HNO3
after adding In as an internal standard to get a final concentration o f 20 ng ml' 1 in the
blank, standard and sample solutions. It is noteworthy that the order in which the
components were mixed together is critical for successful microemulsion formation.
45
Chapter 3
3. Results and Discussion
One of the most important features o f an atomic spectrometric analysis is, the
development o f an appropriate sample preparation procedure, which must be simple
and able to convert the sample to a form compatible with the sample introduction
system and atomizer. The other goal in choosing the sample preparation procedure is
to minimize interferences on the analyte signal.
Crude oil and its derivatives are, in general, difficult to analyze because they have a
high organic load and are viscous. Several procedures have been applied for this kind
o f sample. One o f the most frequently used is emulsification o f the sample using
surfactants (detergent emulsions). Emulsification has been successfully applied to oils
because the procedure decreases the organic load and therefore reduces the
interferences due to the viscosity o f the samples and the emulsified oil samples are
compatible with sample introduction into the plasma.
3.1 O ptim ization of the M icroemulsion Form ation
The optimization o f the ratio between oil and surfactant in order to form
a microemulsion with good and long term stability was investigated. About 0.1% w/v
sample was used in order to decrease the amount o f oil introduced to the plasma and
to avoid problems associated with polyatomic interferences and the matrix effect.
This amount o f oil was dissolved in an equivalent amount of tetralin, the co-solvent,
prior to any further treatment. Tetralin was preferred to other organic solvents such as
46
xylene, because an emulsion with a lower vapour pressure was produced. The
presence o f volatile organic compounds can increase the level o f polyatomic ion
background. Lord [24] studied the effect o f volatility by comparing the background
spectra for microemulsions containing 1 % (w/w) either xylene or tetralin as co
solvents individually. He found that the high vapour pressure o f crude oils caused
enhancement o f the polyatomic ion background and the resultant volatile compounds
were enriched in the aerosol (vapour pressure) that entered the plasma affecting its
temperature distributions and the abundance o f analyte ions. He also found that the
vapour pressure o f the xylene was about 16 times higher than when using tetralin.
In this study, Triton X-100 was chosen as the surfactant because it is readily available
in most laboratories. In addition, Triton X-100 (non-ionic surfactant) compared to the
other surfactants such as anionic ones (eg. sodium dodecylsulphate), does not
introduce cations such as sodium which gives rise to high background radiation in the
plasma. Besides, anionic surfactants require an alkaline pH in order to stabilise
aqueous solutions [24].
It has been reported that the mean droplet size o f the emulsion depends on the
surfactant type and concentration [72]. Therefore, the stability o f the formed
microemulsion increases with surfactant concentration [73], although at low and high
surfactant concentrations microemulsions were unstable. The instability at high
concentration o f the surfactant could be due to the formation o f large droplets [74].
Thus, in the proposed methodology, the investigated amount o f surfactant (Triton X-
100) was varied between 0.1 - 0.4 % w/v. The resultant microemulsion was inspected
visually in terms o f homogeneity, stability and appearance. The solution containing
47
0.1 % w/v surfactant was found to be unstable, quickly separating into the constituent
phases. Microemulsions formed with 0.2 % w/v and 0.4 % w/v o f the surfactant
showed better homogeneity but rapid separation into two phases was observed and
visible oil droplets were clearly seen. It was found that the optimal value o f the
surfactant was 0.3 % w/v.
The formed emulsion exhibited good homogeneity, with no noticeable oil droplets,
and was stable for more than three months.
3.2 Factors Affecting Microemulsion Stability
In addition to the concentration o f the surfactant, which was found to be critical for
stability o f the microemulsion, other factors were found to be important. These
included sonication and temperature, acidity and dryness o f the glassware.
3.2.1 Sonication and Temperature
Sonication and temperature are essential for the formation o f a homogeneous
transparent microemulsion with a small emulsion droplet size (EDS) that is stable for
a long time. It has been demonstrated that the application o f ultrasound can result in
the formation o f microemulsions with very small EDS. Sonication causes droplet
deformation and disruption, and as a result EDS decreases [75]. Accordingly, many
emulsion properties such as stability and colour depend on the EDS and size
distributions. Lord [24] reported that the droplet size o f the prepared microemulsion
which exhibited stability that lasted for several months was between 10 to 60 nm. The
importance o f using temperature in forming good microemulsion has been described
48
in the literature [75,76]. It was concluded that temperature reduces the emulsion
viscosity and interfacial tension, facilitating droplet break-up.
In this study, both temperature along with sonication were found to strongly affect the
stability o f the emulsions. The temperature required to form a good microemulsion
was found to range between 45°C to 55°C. At these temperatures, the viscosity o f the
oil decreases enabling good homogeneity with the co-solvent and the Triton X-100.
In addition, the micoemulsion exhibits good stability, even after cooling, which
ensures that reliable results are obtained for the measured elements.
In order to demonstrate the influence o f temperature and sonication on the
homogeneity o f the microemulsion and confirm whether reliable results can be
obtained using this sample preparation method, CRM HU-1 used oil was emulsified
using the proposed procedure with and without heat and sonication. Results in Table
5 show that those two factors can affect the accuracy o f the results. Results for nickel
was 45.5 pg g ' 1 with heating and sonication and 37.4 pg g' 1 without. Cr, Mn and Pb
results were also found to be higher at 12.7, 18, 20 pg g' 1 with sonication and heating,
compared with 8.1, 15.1, 17.9 pg g' 1 respectively without sonication and heating. In
contrast, the results o f Ti, V and Cd were not affected.
49
Table 5. Used oil HU-1 trace elements concentration A) after forming a
microemulsion with the use o f temperature and sonication and B) after forming a
microemulsion without the use o f temperature and sonication.
ElementsA
Used oil HU-1 g g g ' 1
BUsed oil HU-1
g g g ' 1
Certified values f tg g 1
Ti 10.7 ± 1.5 9.5 ± 0.3 9 ± 2V 7.5 ± 0.6 6.7 ±0 .3 7 ±0 .5Cr 12.7± 6.8 8.1 ± 6 .2 15 ± 2
Mn 18.0 ± 1 .4 15.1 ± 0 .4 18 ± 1
Ni 45.5 ± 3 .7 37.4 ± 1.3 45 ± 3Cd 15.7 ± 1.5 14.0 ± 0 .2 15 ± 1Pb 20.1 ± 1.9 17.9 ± 0 .3 2 0 ± 1
3.2.2 Acidity (pH)
Acidification o f the emulsion with strong inorganic acids allows the use o f inorganic
aqueous standards for calibration. It has been reported that the use o f acidified
emulsions enables a direct correlation between the signal o f the analyte in the oil and
the signal o f analyte in aqueous standards [18]. Acidification o f the microemulsion
was used to convert metallic solid particles as well as metallorganic or oxide analyte
species into dissolved inorganic analyte species. Such conversion improves the
stability o f the analytes in the sample, while minimizing the possibility o f
precipitation or adsorption o f analyte species onto the sample container walls [51,55].
Poteau et al [77] investigated the influence o f pH values (2, 4, 6 , 8 , 11, 12) on the
stability o f oil-in-water emulsions, and they reported that the emulsion is much more
50
stable at either pH 2 or 12, with the latter preferred, because asphaltenes contain more
acidic groups than basic groups. Figure 9 published by Poteau et al [77] shows a
picture of 6 emulsions prepared at different pH values ranging from 2 to 12 and it can
be seen that the emulsion is more stable at pH = 2 and pH = 12 . Thiem and Watson
[78] investigated the extraction efficiencies of emulsions for 21 elements in oil and
transmission fluids by ICP-OES using different acids; HC1, HNO3, H2SO4, and a
(75:25) mixture of HC1 and HNO3. They found that both HC1 and HNO3 have good
extraction efficiency with the recommendation to use HNO3 if Ag and Pb were
among the elements of interest.
pH=8 pH=l l p H = 1 2
Figure. 9 Pictures of the emulsions formed after centrifugation for 30 min at pH
between 2 and 12 [77].
51
The pH for the prepared microemulsion used in this study was 2.4 and it was found to
provide good stability, which lasted more than three months without phase separation.
In order to verify the significance o f acidifying the microemulsion prior to
introducing it into the plasma, El-Bouri, El-Sharara and Amna crude oil samples were
emulsified using the proposed procedure with and without the addition o f 0.1 % v/v
nitric acid. From the visual inspection o f the samples, the acidified microemulsions
were clear, transparent, homogeneous and stable while the non-acidified
microemulsion was cloudy and unclear. Figure 10 shows a picture for the emulsified
crude oils (a) El-Sharara, (b) El-Bouri and (c) Amna prepared with the proposed
method.
It is noticeable in Table 6 that the vanadium results for the El-Bouri, El-Sharara and
Amna oil samples have increased from 22.2, 0.79, 0.6 pg g’1 in the acidified
microemulsion to 51.8, 1.4, 1.2 pg g’1 in the non-acidified microemulsion,
respectively. The nickel results were 20.0, <0.1, 2.1 pg g' 1 in the acidified
microemulsion then increased to 48.4, 1.1, 7.1 pg g' 1 in the non-acidified
microemulsion. This behaviour was similar to that observed for vanadium. This
increase may be due to the polyatomic isobaric interference on 51V caused by
34S16OH+ [20,63]. Interferences on Ni may be caused by
36A rI2C12C;36A r13C 13C;38A r12C12C [23]. For Ti, Mn, Cu, Sn Mo and Pb
measurements, this trend was not observed.
52
Table 6 El-Bouri, El-Sharara and Amna crude oils microemulsion results with and
without 0.1 % HNO3 A and B, respectively. The results are in pg g '1; for emulsified
samples without acid (n=5) and for emulsified samples with the use of acid (n=5).
Element SampleW et digestion
M"g g '
Microwave
digestion pg g '1
Microemulsion
A p g g 1
Microemulsion
B p g g '1
V
El-Bouri 22.4 ± 1.8 22.0 ±0 .8 22.2 ± 1.1 51.8 ± 8.4
El-Sharara 0.5 ±0.1 0.5 ± 0.02 0.79 ± 0.07 1.4 ± 0 .2
Amna 0.24 ± 0.08 0.25 ±0.01 0.60 ± 0.02 1.2 ± 0 .2
Ni
El-Bouri 23.8 ± 1.8 19.8 ± 1.0 20.0 ±1.4 48.4 ± 8 .5
El-Sharara < 0 .05 0.6 ± 0 .2 <0.1 1.1 ±0.1
Amna 2.8 ±0.07 2.7 ± 0.4 2.1 ±0.1 7.1 ± 0 .5
Figure. 10 A picture for the emulsified crude oils prepared with the proposed
method, (a) El-Sharara, (b) El-Bouri and (c) Amna
53
3.2.3 Dryness o f Glassware and Order of Addition o f Emulsion Constituents
During this study, it was found that preparing the samples in wet glassware resulted
in an unstable emulsion. In addition, the order in which the constituents o f the
emulsion were added together has been found to be critical [24]. Consequently the
following procedure was developed: A small portion o f oil is weighed in a clean dry
flask followed by an equivalent amount o f co-solvent (Tetralin) with mechanical
agitation to homogenize the crude oil. Then an appropriate amount o f surfactant
(Triton X-100) is added with a continuous agitation. After that a small amount o f de
ionized water (approximately 5 ml) is added dropwise with continuous agitation, then
the flask is filled up to the mark with 0.1 % HNO3 to obtain a clear transparent stable
solution. Figure 11 shows a microemulsion prepared from Amna crude oil using the
proposed method. It can be seen that the microemulsion is clear, transparent,
homogeneous and stable. It does not contain any undissolved particles. In contrast,
Figure. 12 shows the same crude prepared with the proposed procedure but without
the use o f heating, ultrasonic radiation, and the adding o f nitric acid. The resulting
solution was unclear and unstable, and after about 5 hours, it separated into distinct
phases (Figure. 13).
54
Figure. 11 A stable transparent microemulsion of Amna crude oil prepared with the
proposed method : 0 .1% w/v of oil was mixed with 0 .1% w/v tetralin with
mechanical agitation using the ultrasonic bath at temperature between 45°C to 55°C ,
then 0.3% w/v Triton X-100 is added with a continuous agitation. After that, 5 ml of
de-ionized water was added drop by drop with a continuous agitation then the flask
was filled up to the mark with 0.1 % HNO3.
55
Figure. 12 An unstable unclear microemulsion of Amna crude oil prepared with the proposed method without the addition of acid and sonication.
56
Figure. 13 Separate phases of Amna crude oil microemulsion prepared with the proposed method without the addition of acid and sonication.
57
3.3 Analytical Figure o f Merit
In this study, calibration curves were established using microemulsions containing
increasing concentrations o f inorganic standards 0.1, 1, 10, 100 pg L '1, and In 20 pg
L ' 1 as an internal standard added to both standard solutions and samples.
A blank was prepared in the same manner with the addition o f 20 pg L ' 1 o f In.
Good linearity for all ten elements was observed. Limits o f detection (LOD) and
limits o f quantification (LOQ) were calculated using 3 times standard deviation o f ten
measurements o f blank and 10 times standard deviation o f ten measurements of
blank, respectively. LOD was between 0.1 ng g' 1 and 0.7 ng g’1 for all elements, and
4.8 ng g' 1 for Cr. LOQ was between 0.2 ng g' 1 and 2.4 ng g ' 1 for all elements, and
16.1 ng g' 1 for Cr. The relative standard deviation was < 5% for all elements and
30.9% for Cr. The correlation coefficient (r2) was 1.000 for all elements as can be
seen in Table 7. Comparing LOD for Mn, Ni, Cu and Sn with those obtained by ETV-
ICP-MS [38] (results displayed in Table 8) shows that they are very similar with a
slightly higher Sn detection limit obtained by ICP-MS using the proposed method.
58
Table 7. Precision (RSDs), LODs, LOQs (ng g '1) and (r2) for trace elements
determination using oil in water microemulsion by ICP-MS; number o f replicates =10
Element LOD ng g*1 LOQ ng g' 1 RSD % ....r2 "
4/Ti 0.7 2.4 4.8 1.000
i lV 0.1 0.5 3.3 1.000
5JCr 4.8 16.1 30.9 1.000
"Mn 0.1 0.2 2.1 1.000
bUNi 0.1 0.4 3.4 1.000
"Cu 0.2 0.6 4.8 1.000
"M o 0.1 0.3 2.1 1.000
lu Cd 0.1 0.5 1.6 1.000
U8Sn 0.6 2.1 3.4 1.000
m Pb 0.1 0.3 1.5 1.000
Table 8 . Figures o f merit for trace elements determination using oil in water
emulsion by ETV-ICP-MS [38].
Element. .
LOD (pg L '1)
b3Cu 0.9979 0 .2 2
bbMn 0.9996 0 .0 2
5aNi 0.9966 0.38
. 12USn 0.9991 0.03
59
1800000
1600000
1400000
1200000
_ 1000000 c3o
° 800000
600000
400000
200000
00 20 40 60 80 100 120
Concentration ng/ml
Figure. 14 Calibration curves for Ti, V, Cr, Ni, Cu, Mo, Mn, Cd, Sn and Pb
microemulsion standard solutions analysed using ICP-MS. Refer to the relative
standard deviation in Table 7.
60
3.4 Method Validation
The method was validated by comparing the obtained results for two certified
reference materials; HU-1, (Used Oil) and NIST 1084a, (Wear Metals in Lubricating
Oil) prepared using the emulsification procedure with those obtained using three
different preparation methods; wet digestion, dry ash and microwave digestion. The
results obtained for HU-1 used oil and NIST 1084a are given in Tables 9&10,
respectively and comparison o f the results shown in both tables indicates that there is
a very good agreement between the four methods.
Table 9, generally shows a very good agreement between the results o f the four
procedures with excellent performance for all elements when the microemulsion
method was used. A decrease in performance is seen for Cr may be due to the
increased background signal caused by the organic matter. The decrease in Ni, Mo,
Cd and Pb results with the dry ash procedure may have been due to the volatility of
the compounds o f those elements during the ashing step.
A statistical F-Test was applied on the results o f Table 9 (comparing microemulsion
with wet digestion, dry ash and microwave digestion, respectively) and it was found
that the calculated F values were 1.02, 1.29 and 1.36 which were less than the F value
from the table F5^(0.05) = 6.26. The results proved that the variances between the
results are likely to be the same. An unpaired t-Test was also performed and the
calculated t values were - 0.04, 0.05 and 0.036 which were less than t7 from tables
/>(0.01,0.025,0.05)= 2.998, 2.365, 1.895 which means that there was no significant
difference between the results. F-Test was also applied on the results o f Table 10
(comparing microemulsion with wet digestion, dry ash and microwave digestion,
61
respectively) and it was found that the calculated lv a lu e s were 0.12, 1.18 and 2.37
which were less than the F value from the table F5(̂ (0.05) = 6.26. The results proved
that the variances between the results are likely to be similar. An unpaired t-Test was
also performed and the calculated t values were -0.24, 0.033 and 0.007 which were
less than t7 from tables ^(0.01,0.025,0.05)= 2.998, 2.365, 1.895 which confirmed
that there was no significant difference between the results [81].
Table 9 Comparison o f HU-1 Used Oil analytes results prepared with the proposed
methodology and traditional sample preparation methods with the certified values ±
standard deviation.(n=5)
E lementW et Digestion
H gg ' 1
Dry Ash
ngg ' 1
Microemulsion
ngg '1
Microwave
ngg ' 1
Certified values
ligg'1
Ti 15.6 ± 2 .8 13 ± 1.1 10.7 ± 1.5 12.5 ± 0 .6 9 ± 2
V 7.5 ± 0.4 6.9 ± 0.6 7.5 ± 0.6 7.1 ± 0 .4 7 ± 0 .5
Cr 17.2 ± 1.1 15.5 ± 1 .4 12.7± 6.8 15.2 ± 0 .7 15 ± 2
Mn 20.1 ± 1 .4 17.1 ±0 .3 18.0 ± 1.4 16.5 ± 2 .0 18 ± 1
Ni 46.9 ± 0 .9 40.3 ± 3 .6 45.5 ± 3 .7 40.2 ±2.1 45 ± 3
Mo 11.5 ± 0 .4 9.5 ± 0.9 12.4 ± 0.9 10.4 ± 0 .6 11 ± 1
Cd 12.4 ± 0 .6 9.8 ± 0.8 15.7 ± 1.5 12.4 ± 0 .7 15 ± 1
Pb 2 2 .2 ± 1.6 16.3 ± 1.1 20.1 ± 1.9 17.6 ± 1.0 2 0 ± 1
62
As shown in Table 10, the results obtained for Ti, V, Ni, Cu and Mo in the1084a
CRM are in good agreement using the four methods, and also with the certified
values. Low Cr measured values have been reported by others [53,55,56]. The low
result was attributed to the increased background signal caused by the organic matter
[53]. Both the emulsification and dry ash procedure results were lower than those
obtained by wet and microwave digestion procedures.
The results show that emulsion formation can be successfully applied to the
determination o f trace elements in crude oil. The results are reliable and sample
preparation is less time consuming.
Table 10 Comparing NIST 1084a Wear-Metals in Lubricating Oil analytes results
prepared with the proposed methodology and traditional sample preparation methods
with the certified values ± standard deviation.
E lementW et Digestion
Pgg'1
Dry Ash
P g g 1
Emulsion
P g g 1
M icrowave
Pgg'1
Certified values
Pgg*1
Ti 96.9 ± 2.5 101.8 ± 2 .5 95.4 ± 1 .8 95.0 ± 2 .0 100.4 ± 3 .8
V 97.4 ± 1 .4 95.8 ± 1.9 95.2 ± 1 .8 97.3 ±3 .1 95.9 ± 9 .4
Cr 96.2 ± 0.3 90.5 ± 1 .2 77.7 ±4 .1 89.6 ± 2.6 98.3 ± 0 .8
Ni 99 ± 0.7 92.8 ±2 .1 99.8 ± 1 .9 97.4 ± 3 .4 99.7 ± 1 .6
Cu 99.2 ±2 .1 96.8 ± 2 .8 99.4 ± 1 .5 93.7 ± 2.7 100.0 ± 1.9
Mo 104.2 ± 1.6 94.1 ± 3 .8 94.9 ± 3.0 92.0 ± 2.5 100.3 ± 1 .4
Sn 98.1 ± 0 .2 81.8 ± 0 .9 94.2 ± 2 .6 82.6 ± 2.5 97.2 ± 2 .6
Pb 96 ± 2 .8 82.9 ± 2.5 85.8 ± 8 .6 93.8 ± 2 .0 101.1 ± 1 .3
63
3.5 Recovery Test
In order to evaluate the accuracy of the method, a spike recovery test was performed
on the Elsharara crude oil (Figure 15). Multielement standards were used to spike the
samples so that the emulsion solutions contained 2 and 10 pg L '1 respectively. Table
11, shows the good recovery of the 2 pg L 1 spike, ranging from 95% to 120% for all
elements, while Mo and Sn recoveries were 83.4% and 77.8% respectively. The
recovery was improved for the 10 pg L 1 spike, ranging from 93.3% to 101.0 % with
relative standard deviation less than 5% for all elements except for Cr, where the
result was higher in the two spikes. This behaviour has been observed before
[53,55,56] without a possible explanation. Despite the variable results across the
study, the determination of Cr is not crucial in oil samples. This demonstrates that
the method developed here is appropriate for oil samples but possibly not for other
kind of samples where Cr is important.
Figure. 15. Emulsified El-Sharara Libyan crude oil samples spiked with 10 pg L 1 of
a multielement standard solution.
64
Table 11 Analyte recovery in El-Sharara oil sample spiked with 2 and 10 pg L ' 1
standards. (n= 5)
ElementSpike concn: 2 pg L'1 Spike concn: 10 pgL*1
Mean Recovery % RSD % Mean Recovery % RSD %
Ti 2.4 120.0 26.5 10.0 100.3 4.8
V 2.1 106.0 1.6 10.0 100.0 3.3
Cr 3.8 194.0 21.6 15.1 151.1 30.9
Mn 2.2 110.2 1.3 10.0 100.2 2.1
Ni 2.0 98.1 33.0 9.6 96.3 3.4
• Cu 2.1 103.3 16.3 9.7 97.3 4.8
Mo 1.7 83.4 2.5 9.5 95.2 2.1
Cd 1.9 95.8 13.0 9.9 99.3 1.6
Sn 1.6 77.8 3.8 9.3 93.3 3.4
Pb 2.1 103.9 8.9 10.1 101.0 1.5
The excellent results obtained from the spike recovery test indicate that the proposed
procedure can be applied to the determination o f low element concentrations in crude
oil without the risk o f interference or analyte transport associated problems or high
background.
65
3.6 Analysis o f Reference Materials
The accuracy o f the method was evaluated by the analysis o f two standard reference
materials HU-1 used oil and NIST SRM 1084a using the emulsification procedure.
Table 12 shows the good recovery for the eight elements determined in emulsified
HU-1 used oil. Apart from chromium, the recoveries for the rest o f the elements
ranged from 100.1 % to 119.9 % . The chromium recovery was 85.1 % . This
decrease may be due to the increased background signal caused by the organic matter.
As shown in Table 13, good recovery (between 94.7% and 100.1 %) for eight
elements o f NIST 1084a were obtained. Excellent agreement with the certified results
was obtained for Ni, V, and Cu. There was a slight decrease in Cr and Pb recovery,
79.1% and 84.8 %, respectively. Such behaviour for Cr in crude oils was also
reported by other authors [53,55,56]. A statistical t-test was applied (comparing the
measured and certified values for HU-1 used oil) and it was found that the calculated
t values for all elements in Table 12 is less than ts from tables (0.01) = 3.365 and in
Table 13 (comparing the measured and certified values for NIST SRM 1084a) is less
than from tables (0.01) = 4.541. Consequently, there was no significant difference
between the measured and certified results at a = 0.01 [81]. Cr and Ti calculated t
values for 1084a CRM were slightly higher.
The results achieved for the analysis o f both CRMs, confirm the accuracy o f the
proposed method for both low and high element concentrations, especially for
vanadium, nickel and copper measurements in oil samples along with satisfactory
results for other elements. The method developed is suitable for routine application
66
because sample preparation is less time consuming and does not require prior
removal o f the hydrocarbons before sample analysis.
Table 12 The analysis o f the HU-1 Used Oil with the proposed method ± standard
deviation (n=6 ). t$ from tables (0.01) = 3.365
E lementMeasured value
Pgg'1
Certified value
Pgg'1
Recovery
%
Calculated t
value
Ti 10.7 ± 1 .5 9 ± 2 119.9 2.9
V 7.5 ± 0.6 7 ± 0 .5 107.2 1.9
Cr 12.7± 6.8 15 ± 2 85.1 -0.7
Mn 18.0 ± 1 .4 18 ± 1 100.1 0.0
Ni 45.5 ± 3 .7 45 ± 3 101.2 0.3
Mo 12.4 ± 0 .9 11 ± 1 112.7 3.1
Cd 15.7 ± 1.5 15 ± 1 105.1 1.1
Pb 20.1 ± 1 .9 20 ± 1 100.9 0.2
Table 13 The analysis o f the NIST 1084a Wear-Metals in Lubricating Oil with the
proposed method ± standard deviation (n=4). ti from tables (0.01) = 4.541
Elem ent Measured value Pgg'1
Certified value Pgg'1
Recovery%
Calculated t value
Ti 95.4 ± 1 .8 100.4 ± 3 .8 95.0 -5.5
V 95.2 ± 1 .8 95.9 ± 9 .4 99.3 -0.7
Cr 77.7 ± 4 .1 98.3 ± 0 .8 79.1 -9.9
Ni 99.8 ± 1 .9 99.7 ± 1.6 100.1 0.1
Cu 99.4 ± 1 .5 100.0 ± 1.9 99.4 -0.3
Mo 94.9 ± 3.0 100.3 ± 1 .4 94.7 -3.5
Sn 94.2 ± 2.6 97.2 ± 2 .6 96.9 -2.2
Pb 85.8 ± 8 .6 101.1 ± 1 .3 84.8 -3.5
67
3.7 Calibration with aqueous standard solutions
Aqueous analyte solutions, containing increasing concentrations o f multielement
standards (0 .1, 1.0 , 10 and 100 ng m l'^were analysed and good calibration curves
were obtained. These curves enabled correlation between analyte signal of the
specimen microemulsion and the signal o f the analyte solutions. Tables 14&15, show
good agreement between the results o f both CRMs (1084a and HU-1) obtained by
calibration with inorganic aqueous standards and others obtained by calibration with
emulsified standards. A paired t-test was applied (comparing results from the
emulsified standard solution with those from the aqueous standard solutions for both
CRMs HU-1 and 1084a) and it was found that the calculated / values for Tables
14&15 were t = 2.734 and 2.677 respectively. These values were less than the t
values from the table /v=7(0 .01 ) = 2.998 confirming that there was no significant
difference between the two types o f standard solutions used [81].
Both tables demonstrate very good agreement between the results obtained using the
aqueous simple standard solutions and the certified values. Despite the difference in
sample matrix between the aqueous standards used for calibration and the emulsified
samples, the aqueous standard solutions can be used successfully at least as a rough
guide to give an idea about trace elements content in the sample or it can also be used
effectively in semiquantitative analysis.
68
Table 14 Comparison between CRM HU-1 microemulsion results obtained from
calibration with aqueous standard solution and results obtained from calibration with
emulsified standard solution
ElementAqueous Standard
Solution n g g '1
Emulsified Standard
Solution n g g '1
C.V
P g g 1
Ti 13.0 ± 0 .8 10.7 ± 1 .5 9 ± 2
V 7.9 ± 0.6 7.5 ± 0.6 7 ± 0 .5
Cr 13.2 ± 5 .6 12.7± 6.8 15 ± 2
Mn 18.2 ± 1.1 18.0 ± 1 .4 18 ± 1
Ni 46.3 ± 1 .8 45.5 ± 3 .7 45 ± 3
Mo 13.1 ± 1 .0 12.4 ± 0.9 11 ± 1
Cd 16.8 ± 1 .8 15.7 ± 1 .5 15 ± 1
Pb 20.0 ± 1 .7 20.1 ± 1 .9 20 ± 1
Table 15 Comparison between CRM 1084a microemulsion results obtained from
calibration with aqueous standard solution and results obtained from calibration with
emulsified standard solution
ElementAqueous Standard
Solution n g g '1
Emulsified Standard
Solution jxg g'1C .V g g g 1
Ti 103.1 ± 1 .6 95.4 ± 1 .8 100.4 ± 3 .8
V 102.8 ± 1 .7 95.2 ± 1 .8 95.9 ± 9.4
Cr 91.02 ± 5 .4 77.7 ±4 .1 98.3 ± 0 .8
Ni 104.7 ± 2 .5 99.8 ± 1 .9 99.7 ± 1 .6
Cu 100.4 ± 2 .4 99.4 ± 1 .5 100.0 ± 1.9
Mo 100.3 ± 2 .4 94.9 ± 3 .0 100.3 ± 1.4
Sn 91.5 ± 1 .0 94.2 ± 2.6 97.2 ± 2 .6
Pb 89.9 ± 3 .5 85.8 ± 8 .6 101.1 ± 1.3
69
3.8 Real Samples Results
In order to assess the analytical capability o f the proposed method, three Libyan
crude oil samples were investigated for their trace elements content using
microemulsion formation. El-Bouri, El-Sharara and Amna crude oils were emulsified
using the proposed procedure (section 2.3.4) by dissolving the oils in tetralin then
adding Triton X-100 , 5 ml o f water, and 20 pg L ' 1 o f indium as an internal standard
followed by 0.1 % nitric acid. Table 16, displays the concentration o f Ti, V, Ni, Cu,
Mo, Mn, Cd, Sn and Pb in the El-Bouri, El-Sharara and Amna samples. El- Bouri
crude oil was found to contain 2 2 .2 pg g' 1 vanadium and 20.1 pg g*1 nickel with a
trace o f cadmium (0.02 pg g’1), while Ti, Mn, Cu, Mo, Sn and Pb were below the
detection limit o f the instrument. The El-Sharara crude oil was found to contain 0.79
pg g' 1 o f vanadium while the other selected elements were below the detection limit.
Amna crude oil, contained 0.6 pg g' 1 vanadium, 0.05 pg g*1 manganese,
2.1 pg g' 1 nickel and 0.3 pg g' 1 lead, while the other elements concentration was
below the detection limit. The low levels o f these elements reflect the high quality of
Libyan crude oils, which make them suitable for the European market [79]. These oils
do not contain high amounts o f impurities, which require difficult and very expensive
refinery processes to get rid o f the elements. For example, Venezuelan crude oil
contains 1400 pg g' 1 o f vanadium [80] which is undesirable as it deactivates the
catalysts used in refineries, and causes corrosion in the refinery boilers and furnaces.
70
Table 16 . Mean o f trace elements concentration in emulsified Libyan crude oil
samples in pg g ' 1 ± standard deviation; number o f replicates (n= 5)
ElementEl-Bouri
Pg g*1
El-Sharara
P g g ' 1
Amna
P g g ' 1
Ti < 0 .7 < 0 .7 <0.7
V 2 2 .2 ± 1.1 0.79 ± 0 .07 0 .6 ± 0 .02
Mn < 0.1 < 0.1 0.05 ±0.01
Ni 20.1 ±1.4 < 0.1 2.1 ± 0 .12
Cu < 0.2 < 0 .2 < 0 .2
Mo < 0.1 < 0.1 < 0.1
Cd 0.02 ± 0.3 < 0.1 < 0.1
Sn < 0 .6 < 0 .6 < 0 .6
Pb < 0.1 < 0.1 0.3 ± 0.04
The nickel and vanadium results obtained for El-Bouri, El-Sharara and Amna were
confirmed by wet digestion, dry ash and microwave digestion and the results are
shown in Table 17. Comparison of the results obtained indicates that there is very
good agreement between the four methods. With regard to the vanadium results, the
agreement between the four methods was close apart from the El-Bouri dry ash
method (17.5 pg g' 1 compared to 22.4 pg g '1). With regard to the nickel results, also
there was agreement between the four methods although the El-Bouri dry ash method
71
gave a slightly lower result than those for the other methods. In El-Sharara crude oil,
the wet digestion and the emulsion methods quote results that were below the
detection limit. In contrast, the results for the other two methods were slightly higher.
Amna crude oil results, exhibited good agreement between the four methods.
A statistical F-Test was applied (comparing the microemulsion results with the wet
digestion results, in the order shown in Table 17) and the calculated F values were
2.67,2.04, 4.93, 1.65 and 2.93 which were less than the F value from the table Fs,s
(0.05) = 5.05. The results proved that the variances between the results are likely to
be the same [81].
Table 17. Comparison between the mean concentration o f nickel and vanadium in
three Libyan crude oil samples prepared with microemulsion, wet digestion, dry ash
and microwave digestion in pg g' 1 ± standard deviation
Element Sample Wet digestion
F g g 1
Dry Ash
Fg g' 1
Microemulsion
F g g ' 1
Microwave
Fg g 1
V
El-Bouri 22.4 ± 1 .8 17.5 ±0.1 2 2 .2 ± 1.1 2 2 .0 ± 0.8
El-Sharara 0.5 ±0.1 0.40 ± 0 .02 0.79 ± 0.07 0.5 ± 0.02
AMNA 0.24 ±0.08 0 .2 0 ± 0.01 0 .6 ± 0 .0 2 0.25 ±0.01
Ni
El-Bouri 23.8 ± 1.8 15.0 ±0.01 20.1 ±1.4 19.8 ± 1.0
El-Sharara <0.05 0.1 ± 0 .2 < 0.1 0 .6 ± 0.2
AMNA 2.8 ± 0.07 2 .0 ± 0.1 2.1 ± 0.1 2.7 ± 0.4
72
It can be seen from the previous results that there is a variation in nickel and
vanadium concentrations in different crude oil samples from different basins in
Libya. The resultant vanadium / nickel ratios do not change with the biodegradation
or weathering o f an oil seep. Therefore, this ratio can be used as a fingerprint in order
to link the crude oil to its geographic origin. This enables matching oil spills to their
origin even after many years.
73
Chapter 4
4.1 ConclusionIn the present study, a simple analytical method for the determination o f Ti, V, Cr,
Mn, Ni, Cu, Mo, Cd, Sn, and Pb in crude oils by ICP-MS was developed. Samples
were emulsified and introduced into the plasma as microemulsions. The experimental
parameters were optimized to enable the sensitive, accurate and precise determination
o f these elements in crude oil samples. Calibration curves were established using
tetralin and Triton X-100 employing analyte inorganic standards and In as an internal
standard. The limits o f detection and quantification were in the ng g’1 range.
Two certified reference materials (HU-1 used oil and 1084a wear metals in
lubricating oil) were emulsified and introduced into the plasma in order to estimate
the accuracy o f the method. The results were compared with those obtained from dry
ash, wet digestion and microwave digestion and found to be satisfactory. In order to
evaluate the accuracy o f the method, a spike recovery test was carried out and good
results were obtained. The two emulsified reference materials (HU-1 used oil and
1084a) were analysed using aqueous standards and the results were compared with
those obtained by calibration with emulsified standards. Three Libyan crude oil
samples were analysed using the proposed methodology and the results were
compared with the traditional ones (dry ash, wet digestion and microwave digestion).
Very good agreement between the four methods was achieved.
74
In this study, a transparent stable microemulsion was used successfully without the
need for an oxygen stream and no carbon build up was observed. The stability o f the
microemulsion lasted more than three months without phase separation or any change
in appearance. Furthermore, microemulsion sample introduction was found to be a
very effective technique for the determination o f trace elements in crude oil. The
major advantage o f the microemulsion approach was that it is less time consuming. It
presents the possibility o f highly sensitive analysis which does not require
decomposition, and allows the use o f inorganic standards. Any potential loss of
analyte elements due to volatilization or precipitation during the decomposition
procedure is eliminated. The probability o f introducing contamination is also reduced.
75
4.2 RecommendationsIdentifying the gaps in knowledge on the stability and homogeneity o f the formed
microemulsion is an essential part o f this study. Therefore, the following
recommendations for further research are suggested:
First, a considerable amount o f work still needs to be done to ensure the suitability of
the depicted technique for the other fractions o f crude oil, especially the light
fractions such as the naphtha. This should focus on the effect o f temperature on the
stability o f some volatile analytes such as mercury in the formed microemulsion.
Second, it would be beneficial to measure the size o f the microemulsion droplets
formed with the proposed method. Further studies on the effect o f heat and sonication
on the emulsion droplet size are also recommended because the stability o f the
micoemulsion increases with the decrease in the emulsion droplet size.
Third, a comparison between detergent and detergentless microemulsions using
different spectrometric techniques, in terms o f stability and the quality o f the results
is highly recommended.
Fourth, it would be useful to study the chemical composition o f crude oils before and
after the emulsification and to investigate any possible changes that may occur
because o f the presence o f an oxidising agent.
Fifth, applying different acids or a mix o f some acids such as HC1 and HNO3 , in
order to acidify the microemulsion could give further knowledge on the stability of
the analytes o f interest in the microemulsion. In addition, employing hydrogen
76
peroxide instead o f HNO3 , may provide information to help improve the stability of
the microemulsion, and consequently the quality o f the obtained data.
Sixth, as the choice o f the surfactant has a main role in the stability o f the prepared
microemulsion, studying the possibility o f applying mixed surfactants, non-ionic and
anionic, will be very useful and may lead to new knowledge on crude oil
microemulsion formation.
77
REFERENCES
1 Hobson, G. (1984). Modem petroleum technology. 5th ed., New York, John
Wiley & Sons.
2 Brame, J. and King, J.(1955). Fuel: solid, liquid and gaseous. 5th ed., London,
Edward Arnold.
3 Filby, R. (1994). Origin and nature o f trace element species in crude oils,
bitumens and kerogens: implications for correlation and other geochemical
Studies. Geological Society, 78, 203-219.
4 Hunt, J. (1996). Petroleum geochemistry and geology. 2nd ed., New York, W.H.
Freeman and Company.
5 Barwise, A. ( 1990). Role o f Nickel and Vanadium in Petroleum Classification.
Energy & Fuels, 4, 647-652.
6 Wang, Z. and Fingas, M. (2003). Development o f oil hydrocarbon fingerprinting
and identification techniques. Marine Pollution Bulletin, 47,423-452
7 Cantu, R. Stencel, J. Czemuszewicz, R. Jaffe, P. and Lash, T. (2000). Surfactant-
enhanced partitioning o f nickel and vanadyl deoxophylloerythroetioporphyrins
from crude oil into water and their analysis using surface-enhanced Resonance
raman spectroscopy. Environmental Science & Technology. 34, 192-198.
8 Azzawiya Oil Refining Company, (2008). Distillation Units, [online], Last
accessed 13 November 2008 at: http://www.azzawiyaoil.com/
78
9 The institute o f petroleum. Coryton Refinery - Refining Processes, [online], Last
accessed 13 November 2008 at:
http://www.energyinst.org.uk/education/coryton/page7.htm
10 Al-Swaidan, H. (1996). The determination o f lead, nickel and vanadium in Saudi
Arabian crude oil by sequential injection analysis/inductively-coupled plasma
mass spectrometry. Talanta, 43,1313-1319.
11 Duyck, C. Miekeley, N. Porto da Silveira, C. Aucelio, R. Campos, R. Grinberg,
P. and Brandao, G. (2007). The determination o f trace elements in crude oil and
its heavy fractions by atomic spectrometry. Spectrochimica Acta, 62, 939-951.
12 Czemuszewicz, R. (2000). Geochemistry o f porphyrins: biological, industrial and
environmental aspects. Journal o f Porphyrins and Phthalocyanines, 4, 426-431.
13 Lopez, L. and Lo Monaco, S. (2004). Geochemical implications o f trace elements
and sulfur in the saturate, aromatic and resin fractions o f crude oil from the Mara
and Mara Oeste fields, Venezuela. Fuel, 83, 365-374.
14 Xu, H. Que, G. and Yu, D. (2005). Characterization o f petroporphyrins using
ultraviolet-visible spectroscopy and laser desorption ionization time-of- flight
mass spectrometry. Energy & Fuels. 19. 517-524.
15 Grigsby, R. and Green, J. (1997). High-resolution mass spectrometric analysis o f
a vanadyl porphyrin fraction isolated from the >700 °C Resid o f Cerro Negro
heavy petroleum. Energy & Fuels, 11, 602-609.
16 Skoog, D. Holler, F. and Nieman, T. (1998). Principles o f instrumental analysis.
5th ed. Philadelphia, Saunders.
79
17 Aucelio, R. and Curtius, A. (2002). Evaluation o f electrothermal atomic
absorption spectrometry for trace determination o f Sb, As and Se in gasoline and
kerosene using microemulsion sample introduction and two approaches for
chemical modification. Journal o f Analytical Atomic Spectrometry, 17, 242-247.
18 Amorim, F. Welz, B. Costa, A. Lepri, F. Vale, M. and Ferreira, S. (2007).
Determination o f vanadium in petroleum and petroleum products using atomic
spectrometric techniques. Talanta 72,349-359.
19 Tserovsky, E. and Arpadjan, S. (1991). Behaviour o f various organic solvents and
analytes in electrothermal atomic absorption spectrometry. Journal o f Analytical
Atomic Spectrometry. 6 , 487-491.
20 Nakamoto, Y. Ishimaru, T. Endo, N. and Matsusaki, K. (2004). Determination of
vanadium in heavy oils by atomic absorption spectrometry using a graphite
furnace coated with tungsten. Analytical Sciences, 20, 739-741
21 Wang, T. Jia, X. and Wu, J. (2003). Direct determination o f metals in organics by
inductively coupled plasma atomic emission spectrometry in aqueous matrices.
Journal o f Pharmaceutical and Biomedical Analysis 33, 639-646
22 Kumar, S. and Gangadharan, S. (1999). Determination o f trace elements in
naphtha by inductively coupled plasma mass spectrometry using water-in-oil
emulsions. Journal o f Analytical Atomic Spectrometry, 14, 967-971.
23 Duyck, C. Miekeley, N. Porto da Silveira, C. and Szatmari, P. (2002). Trace
element determination in crude oil and its fractions by inductively coupled
80
plasma mass spectrometry using ultrasonic nebulization o f toluene solutions.
Spectrochimica Acta. 57, 1979-1990.
24 Lord, C. (1991). Determination o f trace metals in crude oil by inductively
coupled plasma mass spectrometry with microemulsion sample introduction.
Analytical Chemistry. 63, 1594-1599.
25 Evans, P. Wolff-Briche, C. and Fairman, B. (2001). High accuracy analysis o f
low level sulfur in diesel fuel by isotope dilution high resolution ICP-MS, using
silicon for mass bias correction o f natural isotope ratios. Journal o f Analytical
Atomic Spectrometry, 16, 964-969.
26 Dreyfus, S. Pecheyran, C. Lienemann, C. Magnier, C. Prinzhofer, A. and Donard,
0 . (2007). Determination o f lead isotope ratios in crude oils with Q-ICP/MS.
Journal o f Analytical Atomic Spectrometry, 22, 351-360.
27 American society for testing and materials (2000). A STM D 5863 - 00a: Standard
test methods fo r determination o f nickel, vanadium, iron and sodium in crude
oils and residual fue ls by flam e atomic absorption spectrometry. Pennsylvania,
ASTM.
28 Karchmer, J. and Gunn, E. (1952). Determination o f trace metals in petroleum
fractions. Analytical Chemistry. 24, 1733-1741.
29 Kowalewska, Z, Ruszczynska, A. and Bulska, E. (2005). Cu determination in
crude oil distillation products by atomic absorption and inductively coupled
plasma mass spectrometry after analyte transfer to aqueous solution.
Spectrochimica Acta. 60, 351-359.
81
30 Zeiner, M. Steffan, I. And Cindric I. (2005). Determination o f trace elements in
olive oil by ICP-AES and ETA-AAS: A pilot study on the geographical
characterization. Microchemical Journal. 81, 171- 176.
31 Cindric, I. Zeiner, M. and Steffan, I. (2007). Trace elemental characterization of
edible oils by ICP-AES and GFAAS. Microchemical Journal, 85, 136-139.
32 Aucelio, R. and Curtius, A. (2000). Comparative study o f electrothermal atomic
absorption spectrometric methods for the determination o f silver in used
lubricating oils. Analyst, 125, 1673-1679.
33 Souza, R. Saraceno, A. P. da Silveira, C. and Aucelio, R. (2006). Determination
o f trace elements in crude oil by ICP-OES using ultrasound-assisted acid
extraction. Journal o f Analytical Atomic Spectrometry, 21, 1345-1349.
34 Hardaway, C. Sneddon, J. and Beck, J. (2004). Determination o f metals in crude
oil by atomic spectroscopy. Analytical Letters, 37, 2881 - 2899.
35 Fabec, J and Ruschak, M. (1985). Determination o f nickel, vanadium, and sulfur
in crudes and heavy crude fractions by inductively coupled argon plasma/atomic
emission spectrometry and flame atomic absorption spectrometry. Analytical
Chemistry, 57, 1853-1863.
36 American society for testing and materials (2005). A STM D 5708-05: Standard
test methods fo r determination o f nickel, vanadium and iron in crude oils and
residual fue ls by inductively coupled plasma (ICP) atomic emission spectrometry.
Pennsylvania, ASTM.
37 Chirinos, J. Fernandez, A. and Franquiz, J. (1998). Multi-element optimization of
the operating parameters for inductively coupled plasma atomic emission
82
spectrometry with a charge injection device detector for the analysis o f samples
dissolved in organic solvents. Journal o f Analytical Atomic Spectrometry,13, 995-
1000.
38 Saint’Pierre, T. Dias, L. Pozebon, D. Aucelio, R. Curtius, A. and Welz, B.
(2002). Determination o f Cu, Mn, Ni and Sn in gasoline by electrothermal
vaporization inductively coupled plasma mass spectrometry, and
emulsion sample introduction. Spectrochimica Acta, 57, 1991-2001.
39 Salager, J-L. (2006). Emulsion phase inversion phenomena. In: Sjoblom, J. (ed).
Emulsions and emulsion stability. 2nd ed., Taylor & Francis, 185-226.
40 Attwood, D. and Florence, A. (1983 ). Surfactant systems : their chemistry,
pharmacy and biology. London, Chapman and Hall.
41 Krusberski, N. (2003). An evaluation o f emulsions in calibration strategies fo r oil
analysis by ICP-OES. MSc o f Science, Faculty o f Science, Rand Afrikaans
University.
42 Lee, R. (1999). Agents which promote and stabilize water-in-oil emulsions. Spill
Science & Technology Bulletin, 5, 117-126.
43 Polo-Diez, L. Hemandez-Mendez, J. and Pedraz-Penalva, F. (1980). Analytical
applications o f emulsions: determination o f lead in gasoline by atomic-absorption
spectrophotometry. Analyst, 105, 37-42.
44 De la Guardia, M. and Sanchez, M. (1982). Determination o f manganese in
gasolines by atomic absorption spectroscopy using emulsions. Atomic
spectroscopy, 3, 36-38.
83
45 Platteau, O. and Carrillo, M. (1995). Determination o f metallic elements in crude
oil-water emulsions by flame AAS. Fuel, 74, 761-767.
46 Silva, I. Campos, R. and Curtius, A. (1993). Determination o f lead and copper in
kerosene by electrothermal atomic absorption spectrometry: stabilization of
metals in organic media by a three-component solution. Journal o f Analytical
Atomic Spectrometry, 8 , 749-754.
47 Burguera, J. de Salager, R. Burguera, M. Salager, J. Rondon, C. Carrero, P.
Gallignani, M. Brunetto, M. and Bricerio, M. (2000). On-line emulsification o f
lubricating oils in a flow-injection system for chromium determination by
electrothermal atomic absorption spectrometry. Journal o f Analytical Atomic
Spectrometry, 15, 549-555.
48 Aucelio, R. Curtius, A. and Welz, B. (2000). Sequential determination o f Sb and
Sn in used lubricating oil by electrothermal atomic absorption spectrometry using
Ru as a permanent modifier and microemulsion sample introduction. Journal o f
Analytical Atomic Spectrometry, 15, 1389-1393.
49 Ozcan, M. and Akman, S. (2005). Determination o f Cu, Co and Pb in gasoline by
electrothermal atomic absorption spectrometry using aqueous standard addition in
gasoline-ethanol-water three-component system. Spectrochimica Acta, 60, 399-
402.
50 Matos Reyes, M. and Campos, R. (2005). Graphite furnace atomic absorption
spectrometric determination o f Ni and Pb in diesel and gasoline samples
stabilized as microemulsion using conventional and permanent modifiers.
Spectrochimica Acta, 60, 615- 624.
84
51 Aucelio, R. Souza, R. Campose, R. Miekeley, N. and Porto da Silveira, C.
(2007). The determination o f trace metals in lubricating oils by atomic
spectrometry. Spectrochimica Acta , 62, 952-961.
52 Burguera, J. Burguera, M. Anton, R. Salager, J. Arandia, M. Rondon, C. Carrero,
P. Petit de Pena, Y. Brunetto, R. and Gallignani, M. (2005). Determination of
aluminum by electrothermal atomic absorption spectroscopy in lubricating oils
emulsified in a sequential injection analysis system. Talanta, 6 8 , 179-186.
53 Souza, R. Silvera, C. and Aucelio, R. (2004). Determination o f refractory
elements in used lubricating oil by ICP-OES employing emulsified sample
introduction and calibration with inorganic standards. Analytical Sciences, 20,
351-355.
54 Souza, R. Meliande, A. Silveira, C. and Aucelio, R. (2006).Determination o f Mo,
Zn, Cd, Ti, Ni, V, Fe, Mn, Cr and Co in crude oil using inductively coupled
plasma optical emission spectrometry and sample introduction as detergentless
microemulsions. Microchemical Journal, 82, 137-141.
55 Souza, R. Mathias, B. Scarminio, I. Silveira, C. and Aucelio, R. (2006).
Comparison between two sample emulsification procedures for the determination
o f Mo, Cr, V and Ti in diesel and fuel oil by ICP-OES along with factorial
design. Microchim Acta, 153, 219-225.
56 Souza, R. Mathias, B. Silveira, C. and Aucelio, R. (2005). Inductively coupled
plasma optical emission spectrometry for trace multi-element determination in
vegetable oils, margarine and butter after stabilization with propan-1-ol and
water. Spectrochimica Acta , 60, 711 - 715.
85
57 Al- Swaidan, H. (1993). Trace determination o f vanadium and nickel in Saudi
Arabian petroleum and petroleum products by microemulsion ICP-MS. Atomic
Spectroscopy, 14, 170-173.
58 Heilmann, J. Boulyga, S. and Heumann, K. (2004). Accurate determination of
sulfur in gasoline and related fuel samples using isotope dilution ICP-MS with
direct sample injection and microwave-assisted digestion. Analytical and
Bioanalytical Chemistry, 380, 190-197.
59 Castillo, J. Jimenez, M. and Ebdon, L. (1999). Semiquantitative simultaneous
determination o f metals in olive oil using direct emulsion nebulization. Journal o f
Analytical Atomic Spectrometry, 14, 1515-1518.
60 Worley, J and Kvech, S. (2002). ICP-MS. [online], Last accessed 13 November
2008 at:
http://www.cee.vt.edu/ewr/environmental/teach/smprimer/icpms/icpms.htm
61 Agilent Technologies, (2005). ICP-MS Inductively Coupled Plasma Mass
Spectrometry, [online]. Last accessed 16 November 2008 at:
http://www.chem.agilent.com/Library/primers/Public/ICP-MS_Primer-Web.pdf
62 Montaser, A. (1998). Inductively coupled plasma mass spectrometry. New York,
Wiley-VCH.
63 Yeh, C. and Jiang, S. (2004). Speciation o f V, Cr and Fe by capillary
electrophoresis-bandpass reaction cell inductively coupled plasma mass
spectrometry. Journal o f Chromatography A, 1029, 255-261.
86
64 Olsen, S. Westerlund, S. and Visser, R. (1997). Analysis o f metals in condensates
and naphtha by inductively coupled plasma mass spectrometry. Analyst, 122
1229-1234.
65 Akinlua, A. Torto, N. and Ajayi, T. (2008).Determination o f rare earth elements
in Niger Delta crude oils by inductively coupled plasma-mass spectrometry. Fuel,
87, 1469-1477.
66 Fifield, F. and Kealey, D. (1990). Principles and practice o f analytical chemistry.
3rd ed. Blackie.
67 National Oil Corporation, (2005), Exploration History 1957-2004, [online], Last
accessed 13 November 2008.
at:http://en.noclibya.com.ly/index.php?option=com_content&task=view&id=57&
Itemid= 1 &limit= 1 &limitstart=0
68 Petroleum Research Centre, (2001), Crude assay report: Bouri crude oil.
Unpublished.
69 Petroleum Research Centre, (2001), Evaluation ofAm na crude oil. Unpublished.
70 Biltayib, B. (2006). Oil production in Libya using an ISO 14001 environmental
management system, [online]. Doktor ingenieur (Dr.-ing.), The Faculty of
Geosciences, Geo-Engineering and Mining (3), The Technische Universitat
Bergakaemie Freiberg. Last accessed 16 November 2008 at: https://fridolin.tu-
freiberg.de/archiv/pdf/GeotechnikBergbauBiltayibBiltayib_M092545.pdf
71 Almetnani, A. (2004). Determination o f trace elements in crude oil by inductively
coupled plasma mass spectrometry (ICP-MS) using emulsion sample introduction
87
technique.MSc Dissertation, School o f Science and Mathematics, Sheffield
Hallam University.
72 Tcholakova, S. Denkov, N. and Danner, T. (2004) Role o f surfactant type and
concentration for the mean drop size during emulsification in turbulent flow.
Langmuir, 20, 7444-7458.
73 Ahmed, N. (1999). Stability and rheology o f heavy crude oil-in-water emulsion
stabilized by an anionic-nonionic surfactant mixture. Petroleum Science and
Technology, 17, 553-576.
74 Tal-Figiel, B. (2007).The formation o f stable w/o, o/w,w/o/w cosmetic emulsions
in an ultrasonic field. Chemical Engineering Research and Design, 85, 730-734.
75 Jafari, S. He, Y. and Bhandari, B. (2007). Production o f sub-micron emulsions by
ultrasound and microfluidization techniques. Journal o f Food Engineering, 82,
478-488.
76 Burguera, J. Quintana, I. Salager, J. Burguera, M. Rondon, C. Carrero, P. Anton,
R. and Petit de Pena, Y. (1999). The use of emulsions for the determination of
methylmercury and inorganic mercury in fish-eggs oil by cold vapour generation
in a flow injection system with atomic absorption spectrometric detection.
Analyst,124,593-599.
77 Poteau, S. Argillier, J. Dominique, L. Pincet, F. and Perez, E. (2005). Influence of
pH on stability and dynamic properties o f asphaltenes and other amphiphilic
molecules at the oil-water interface. Energy & Fuels, 19, 1337-1341.
78 Thiem, T. and Watson, J. (1997). Extraction efficiencies o f emulsions for 21
elements in oil and transmission fluids by inductively coupled plasma
spectroscopy. Microchemical Journal 57,245-250.
79 UK Trade and Investment Team in Libya. (2005), Libya oil and gas: a guide to
doing business in the Libyan oil and gas sector [online], Last accessed 12
November 2008 at:
http://www.exportlink.co.uk/features/documents/libya_oilandgas_may05.pdf
80 Hoffman, D. (1979). Embryotoxic Effects of Crude Oil Containing Nickel and
Vanadium in Mallards. Bull. Emironm. Contain. Toxicol. 23,203-206.
81 Miller, J.C and Miller, J.N. (1988). Statistics for analytical chemistry. 2nd ed.,
Chichester, Ellis Horwood.
89
Appe
ndix
A <L>J3
*3<Dcoin3o
coUi-i3*3a>ool-iOh3.2*■+3cSos'So
£<u(U
-C
6£3
00
X53H
o £> *<3 3 •2 .2C3f t CO
•a PC •a ,< * 8
oftEoOs.2‘K3Ew
ftPs_o\n3Ew
•a<u3
cuE<l>W
3 "OC u 3 w3 P
ft£
n-1 Cl3 $ ft ft
ftsoE<s
E•̂ t+Offi+ftf c-n y cj uu o»s <*> I- •—2 iE win
+CO
Eo
CO
ft
cEo
E c '2 i o ?
o- ftso vO 0 s m in
+ + o o
o' o' O in m 3M 7 X+ + c CO CO oV? so f t o ' o ' v-o o ^
y y|<L> +O g CO $ 2 spg U ONP ft o 3 'S '^ft ft fVj
g I60 CJ3 3 Q co
Hft
j:(N
e i s
o.E
+coE•n
su60
X)CO 3u uCO x~c/f ft<
ft
U
sEo
E £ 2 mo w g
H£■*to+
o+CO60(NO
3CO
60<
ft3ft•3
C
£o
6 y 2m o Z© w S
©+CO60<N©‘
3CO
ftCO
Hft
X)3ftT3
15 I3 1 O CO nJ -
E g 2in o Z o “ S
'•SVOOV+o<NffiE
in<N+CO
ftfto"U3U
Hft
£"3
ft3OE<u3o
■g ON Pc oin
VO+CO
3<u60
ftft
o3a<*
3CO
CO
E+CO
3CO
Hft
ft3ft
C/3
= Sa
mpl
e, L
ASA
=Lin
ear
alky
lben
zene
su
lfoni
c ac
id,
E=E
mul
sion
, B=
B
utte
r, M
= M
arga
rine
}
40 min
One week
MilkyseparatesShortly3 min
doesn't form E* for B* &
M*
3 months
0.5 ml conc. HNOj|
88
'to
g
© w g
B c 9in o 2
©
« ffl
0.5 ml conc. HNOj
5 ml 40% h n o 3
ei
§
- 0
6
° pH
HN03Not
recommen-ded
0.2 ml S + 0.5 ml xylenre + 0.6 ml TritonX-100
0.6 g S + 0.5 ml xylene + propanol +H20
1) 2.5g S + 6 ml propanol + H202) 1.5 g S + xylene + 0.3 ml TritonX-100 + H20
1) 0. lg S + 7 g propanol2) 0.2 g S + 0.2 g TritonX-100
0.5 g S + 0.5 g tetraline + 1 g Triton X-100+H2O
0.5 g S + 1.5 ml tetraline + 0.5 ml Triton X-100
0.5 g S + 0.5 g tetraline +1 g Triton X-100
2 ml S + 1 ml 2.5 % Triton X-100
60 % S + 4 % Triton X-100
O<Nffi4*oo1XcoHbe+uJGis<L>be©+CZJbe©
2 g S + 1.5 ml TritonX-100
Surfactant
Detergentless
1) Detergentless2) Surfactant
Surfactant
Surfactant
Surfactant
Surfactant
Surfactant
| Surfactant
Surfactant
Ni, Mo, Cr, V, Ti
Mo, Zn, Cd,Ti, Ni, V, Fe, Mn, Cr, Co
Mo, Cr, V, Ti
Cd, Co Cr, Cu, Ni, Mn
Li, Al, Ti, V, Mn, Fe, Co, Ni, Cu, Zn, Sr,
Mo, Ag, Cd, Sn, Sb, Ba, Pb
>%cu
>Z
V, Vo, Ni, As, Hg, Pb
Cu, Mn, Ni, Sn
00
Ba, Cd, Co, Cr, Cu, Mn, Ni, TI, Pb, U,
V,Zn
ICP-OES
ICP-OES
ICP-OES
ICP-OES
ICP-MS
SIA/ICP-MS
ICP-MS
ICP-MS
ETV/ICP-MS
I ICP-MS
ICP-MS
Lubricating Oils
Crude Oil
Diesel & Fuel Oil
Olive & Soy Oil, Butter & Margarine
Crude Oil
Crude Oil
Crude Oil
Naphtha
Gasoline
| Gasoline
Olive Oil
in
54
inin
56
24
o
57
22
38
00m
59
<N