34
lyondellbasell.com Deutsche Bank 5 th Annual Global Industrials & Basic Materials Conference Doug Pike VP – Investor Relations June 4, 2014

lyondellbasell.com
Deutsche Bank 5th Annual Global Industrials & Basic Materials Conference Doug Pike VP – Investor Relations June 4, 2014

lyondellbasell.com
Cautionary Statement
2
The statements in this presentation relating to matters that are not historical facts are forward-looking statements. These forward-looking statements are based upon assumptions of management which are believed to be reasonable at the time made and are subject to significant risks and uncertainties. Actual results could differ materially based on factors including, but not limited to, the business cyclicality of the chemical, polymers and refining industries; the availability, cost and price volatility of raw materials and utilities, particularly the cost of oil, natural gas, and associated natural gas liquids; competitive product and pricing pressures; labor conditions; our ability to attract and retain key personnel; operating interruptions (including leaks, explosions, fires, weather-related incidents, mechanical failure, unscheduled downtime, supplier disruptions, labor shortages, strikes, work stoppages or other labor difficulties, transportation interruptions, spills and releases and other environmental risks); the supply/demand balances for our and our joint ventures’ products, and the related effects of industry production capacities and operating rates; our ability to achieve expected cost savings and other synergies; legal and environmental proceedings; tax rulings, consequences or proceedings; technological developments, and our ability to develop new products and process technologies; potential governmental regulatory actions; political unrest and terrorist acts; risks and uncertainties posed by international operations, including foreign currency fluctuations; and our ability to comply with debt covenants and service our debt. Additional factors that could cause results to differ materially from those described in the forward-looking statements can be found in the “Risk Factors” section of our Form 10-K for the year ended December 31, 2013, which can be found at www.lyondellbasell.com on the Investor Relations page and on the Securities and Exchange Commission’s website at www.sec.gov. The illustrative results or returns of growth projects are not in any way intended to be, nor should they be taken as, indicators or guarantees of performance. The assumptions on which they are based are not projections and do not necessarily represent the Company’s expectations and future performance. You should not rely on illustrated results or returns or these assumptions as being indicative of our future results or returns. This presentation contains time sensitive information that is accurate only as of the date hereof. Information contained in this presentation is unaudited and is subject to change. We undertake no obligation to update the information presented herein except as required by law.

lyondellbasell.com
Information Related to Financial Measures
3
We have included EBITDA in this presentation, which is a non-GAAP measure, as we believe that EBITDA is a measure commonly used by investors. However, EBITDA, as presented herein, may not be comparable to a similarly titled measure reported by other companies due to differences in the way the measure is calculated. For purposes of this presentation, EBITDA means income from continuing operations plus interest expense (net), provision for (benefit from) income taxes, and depreciation & amortization. EBITDA should not be considered an alternative to profit or operating profit for any period as an indicator of our performance, or as an alternative to operating cash flows as a measure of our liquidity. See slides # 23 and 25 for reconciliations of EBITDA to net income. While we also believe that free cash flow (FCF) is a measure commonly used by investors, free cash flow, as presented herein, may not be comparable to a similarly titled measure reported by other companies due to differences in the way the measure is calculated. For purposes of this presentation, free cash flow means net cash provided by operating activities minus capital expenditures.

lyondellbasell.com
First Quarter, 2014 Highlights
4
EBITDA
LTM EBITDA - $6,394 million LTM EPS – $6.93 per share
($ in millions) Income from Continuing Operations
($ in millions, except per share data) 1Q'14 4Q'13 1Q'13
EBITDA $1,668 $1,543 $1,585
Income from Continuing Operations $943 $1,177 $906
Diluted Earnings ($ / share) from Continuing Operations $1.72 $2.11 $1.56
500
1,000
1,500
$2,000
1Q'13 2Q'13 3Q'13 4Q'13 1Q'14
300
600
900
1,200
1Q'13 2Q'13 3Q'13 4Q'13 1Q'14

lyondellbasell.com
3,671
6,435
1,949
0
3,750
7,500
11,250
$15,000
Source of Cash Use of CashCash from Ops Capex Dividends Share Repurchases
0
400
800
1,200
$1,600
2011 2012 2013Base Growth
1,500
3,000
4,500
$6,000
2011 2012 2013Capex Free Cash Flow
5
Indexed Cash Fixed Cost(1)
Free Cash Flow(2)
Capital Expenditures
2011 – 2013 Cash Deployment
Key Financial Statistics
($ in millions) ($ in millions)
($ in millions)
1) Cash fixed costs include costs related to compensation, travel, insurance, third party services, maintenance, marketing, selling, and administration; 2) Free Cash Flow = net cash provided by operating activities – capex
25%
50%
75%
100%
2008 2009 2010 2011 2012 2013
(Indexed to 2008)

lyondellbasell.com
Our Businesses Benefit from Shale Advantage and Differentiated Positions
Shale Advantage U.S. Olefins Chain • U.S. ethylene • U.S. polyethylene • EO & EG
Shale Advantage & Differentiated Positions
• Oxyfuels • C4 chemicals • Acetyls
Differentiated Positions • Propylene oxide and derivatives
• Polypropylene compounding and Polybutene-1
• Technology segment • Joint ventures • Catalloy
Commodity Products
• European olefins and polyolefins
• Refined products • Styrene • U.S. polypropylene
6
(1) EBITDA presented in this chart excludes “other”, which includes items not allocated to the segments. U.S. polyethylene benefits from shale gas advantage and is therefore included in the “Shale advantage” portion of the chart rather than the “commodity products” portion.
2013 EBITDA(1)
Shale Advantage
Shale Advantage + Differentiated Positions
Differentiated Positions
Commodity Products

lyondellbasell.com
20
40
¢60
2003 2004 2005 2006 2007 2008 2009 2010 2011 2012 2013 2014 YTD
Ethane Premium to Fuel Value ("Frac Spread" )
(¢ / gal)Midstream (Fractionation &
Pipelines)
Source: Third party consultants. 2014YTD as of April 2014.
Chemicals (Ethylene Crackers)
Upstream (Natural Gas E&P)
Evolution of Shale Gas Value Chain
7
4
8
$12
2003 2004 2005 2006 2007 2008 2009 2010 2011 2012 2013 2014 YTD
Natural Gas Price
($ / MMBTU)
20
40
¢60
2003 2004 2005 2006 2007 2008 2009 2010 2011 2012 2013 2014 YTD
Ethylene Margin
(¢ / lb)

lyondellbasell.com
Global Naphtha Cracking
N. America 40-60 ¢/lb
Ethane CrackersMiddle East 10 - 15¢/lb
Ethane Crackers3 - 6¢/lb
60%40%
Cost
of E
thyle
ne P
rodu
ction
40% 60%
Low Cost Ethane Has Improved North American Competitiveness
3%
84%
13%
naphtha
68%
14%
10%8%
ethane
69%
15%
11%5%
ethane
8%7%
74%
11%
naphtha
North America
Western Europe Northeast Asia
Middle East
8
Feedstock Mix by Region Global Cost of Ethylene Curve
• U.S. cost of ethylene production, at 10-15 ¢/lb, competes with Middle Eastern production • Europe and Asia still dependent on higher cost naphtha
Source: Third party consultants and LYB estimates.

lyondellbasell.com
30
60
90
120
$150
5
10
15
20
$25
2008 2009 2010 2011 2012 2013
Global Market – Naphtha Crackers Set The Price
Sources: LYB estimates, third party consultants. Crude oil and natural gas data updated through April 2014.
9
U.S. Crude Oil vs. Natural Gas Price Cost of Ethylene Production
Crude Oil
Natural Gas
Delta
($/ MMBTU) ($/ bbl)
U.S. shale gas revolution is a significant driver of profitability in North American Olefins and Polyolefins and Intermediates and Derivatives segments
15
30
45
60
NE Asia Naphtha U.S.Ethane
2011 2012 2013 2014 YTD
(¢ / lb)
(2011 - 2013) Avg. U.S. Ethylene Price

lyondellbasell.com
Favorable Supply/Demand Balances
10
U.S. Ethane Supply/Demand Ethylene Global Operating Rates
Source: Third party consultants and LYB estimates.
• Ethane production is expected to continue exceeding demand
• N. America ethylene industry effective operating rate ~ 95% in 2013
65%
70%
75%
80%
85%
90%
95%
100%
200
250
300
350
400
450
500
550
2008 2010 2012 2014 2016 2018 2020
Effective Operating R
ate (EOR
)
Cap
acity
/ D
eman
d (b
illio
ns o
f pou
nds)
Demand
Capacity
World Effective Operating Rate(LYB View)
Forecast
0
500
1000
1500
2000
2500
2012 2014 2016 2018 2020
Base CapacityDemand
Forecast
Additional Demand
Supply
(MBPD)

lyondellbasell.com
U.S. Capacity Additions and Global Transport: Small Impact on the Cost Curve
2013 Ocean Transport Volume (Ethylene Equivalent)
Global Ethylene Cost Curve Post N. America Announced Additions
11
Source: Third party consultants.
20132018
Global Naphtha Cracking40-60 ¢/lb
N. America
Ethane CrackersMiddle East 10 - 15¢/lb
Ethane Crackers3 - 6¢/lbC
ost o
f Eth
ylen
e Pr
oduc
tion
Global Capacity
50%40%
Post announced capacity expansions, Naphtha represents ~ 50% of supply
0
20
40
60
80
100
EthyleneDerivatives
Ethylene AnnouncedEthane Export
(Billion Lbs)

lyondellbasell.com
Pre-2009
NGLs
ImportedLiquids
LocalLiquids
O&P – Americas: Feedstock Flexibility Boosts Profitability
~ 90% of ethylene production in 2013 from NGLs, and almost 100% from U.S. sourced feedstocks
11.0 B lbs. ethylene capacity
12
LYB U.S. Ethylene Cracker Feedstock Flexibility
9.9 B lbs. ethylene capacity
11.8 B lbs. ethylene capacity
Source: LYB. Note: Percentages based on volume of feedstock consumed. Future feedstock mix is LYB estimate.
2016E
NGLs
Local Liquids
2013
NGLs
Local Liquids

lyondellbasell.com
O&P – EAI: Driven by Our Differentiated Position
13
• O&P EAI portfolio is more than European olefins and commodity polyolefins – Global polypropylene compounds – Middle East and Asian JVs – Premium grades of polyolefins (Catalloy, Polybutene-1)
• Differentiated products typically can represent $350 - $550 million per year over the cycle
Indexed O&P EAI EBITDA Scenarios (1)
(1) O&P EAI trough, mid-cycle and peak EBITDA values are based on LYB estimates.
0.5
1.0
1.5
2.0
Trough Mid-Cycle Peak 2012 2013
Differentiated / Stable Businesses Commodity / Cyclical Olefins & Polyolefins
(EBITDA Indexed, Mid-Cycle = 1.0)

lyondellbasell.com
The European Olefins Market is Difficult but LYB Has Generated Profit
West Europe Olefins Operating Rate
LYB Advantaged Raw Materials
14
• LYB has captured value through both:
• Above industry operating rates
• Processing cost advantaged raw materials
0%
20%
40%
60%
80%
100%
Q1'13 Q2'13 Q3'13 Q4'13 Q1'14
LYB Industry
0%
10%
20%
30%
40%
50%
Q1'13 Q2'13 Q3'13 Q4'13 Q1'14
(% of LYB European Ethylene Production)
Source: Third party consultants and LYB estimates.

lyondellbasell.com
0
40
80
120
160
Methanol Cash Margin MTBE Spread
Pre-Shale Post Shale
(cents/gal)
Proprietary TechnologyProprietary Technology + Natural gas opportunitiesNatural gas and NGL opportunitiesUndifferentiated
I&D: Key Businesses Advantages
15
2011 – 2013 Average Intermediates & Derivatives EBITDA(1)
PO C4's / Oxyfuels Acetyls EO &
Derivatives
Proprietary Technology
Advantaged NGL / Crude Oil Price Ratio
(1) EBITDA, as presented in this chart, excludes intrasegment eliminations. (2) Source: Economics of PO technologies are based on third party consultants and 2012 LYB data and estimates. (3) Pre-shale refers to year 2000 while post-shale refers to year 2012.
Economics of PO Technologies(2)
I&D Benefits from Shale(3)

lyondellbasell.com
20
40
$60
Brent 3-2-1 LLS 3-2-1 WTI 3-2-1 Maya 2-1-1 WCS 2-1-1(Canadian)
2012 2013 2014 YTD
($ / bbl)
Source: Bloomberg and Wall Street research. Notes: Maya 2-1-1 based on LLS pricing. WCS refers to west Canadian select vs. Gulf Coast products. 2014 YTD as of April 2014.
Refining: Profitability Has Been Driven by Geography and Complexity
Refining Spreads
Pipeline Capacity Increase
16
New Pipeline Capacity to Houston
Houston Eagle Ford
Port Arthur
WTI - Cushing
Heavy crude oils from Canada
LLS St James
$104 WTS
Midland
$94
$82
$102
Waterborne (FOB) Brent: $108 Maya: $93
April 2014 average crude oil prices ($/bbl)
0
600
1,200
1,800
2012 2013 2014 2015
(MBPD)End 2013
2014
2015

lyondellbasell.com
Cash Deployment Hierarchy
Current Status Comments
~ $800 - $900 million/yr
Base Capex • First priorities for cash
~$750 million avg. per year over next
2 years Growth Capex • High-return in advantaged
businesses
$0.70/share per quarter
Interim Dividend
• Fund through the cycle with cash flow from operations
Balance of cash generated
Share Repurchases /
Special Dividend /
Acquisitions
• Discretionary cash returned to shareholders
• M&A if strategic and meaningfully accretive
Foundation
Discretionary Opportunities
17
~$375 million/yr(1) Interest
(1) Interest expense includes interest on the $1 billion bond issued in February 2014.

lyondellbasell.com
Growth and Operational Improvement Programs
• 2012 - 2013, spending ~ $350 million on completed projects • By end of 2013, pre-tax earnings of ~ $300 - $350 million from completed
growth and improvement programs at 2013 industry conditions
18
Possible/ Developing
Growth Projects ~ $400 Million ~ $100 - $175 Million
Operational Improvements Minimal ~ $250 – 400 Million
Complete & Active Growth
Projects ~ $1,700 Million ~ $1,200 – 1,400 Million
Opportunities Capital Investments Pre-tax Earnings
(1) Costs are based on company estimates and earnings values are based on FY2013 industry benchmark margins.

lyondellbasell.com
Projects Completed and Active
19
(1) Costs are based on recent company estimates and potential pre-tax values are based on FY 2013 industry benchmark margins.
Project Cost ($Million) Start-up Potential Pre-Tax Earnings
($ Million/year)Increase Ethane Capability and Midwest debottlenecks ~$50 2012 $150 - $180
EU Butadiene Expansion ~$100 Mid 2013 $40 - $50Methanol Restart ~$180 Late 2013 $250 - $260PE Debottleneck ~$20 Early 2014 $10 - $20La Porte Expansion ~$510 Mid 2014 $300 - $350Channelview Expansion ~$200 Early 2015 $90 - $110Corpus Christi Expansion ~$600 Late 2015 $300 - $350PP Compounding Growth ~ $40 2013 - 2016 $70 - $90New PE line ~ $400 Mid 2017 $50 - $100PO/TBA Joint Venture MOU 2018 $70 - $90
Total ~ $2,100 ~ $1,300 - $1,600
Complete In Construction/Permit Obtained In Development

lyondellbasell.com
Appendix

lyondellbasell.com
2013 – 2014 Reconciliation of Segment Information to Consolidated Financial Information
21
Reconciliation of Segment Information to Consolidated Financial Information 2013 2014 (Millions of U.S. dollars) Q1 Q2 Q3 Q4 Total Q1 Sales and other operating revenues: Olefins & Polyolefins - Americas $ 3,244 $ 3,251 $ 3,315 $ 3,279 $ 13,089 $ 3,357 Olefins & Polyolefins - Europe, Asia, International 3,800 3,708 3,594 3,583 14,685 3,778 Intermediates & Derivatives 2,282 2,217 2,452 2,521 9,472 2,429 Refining 2,468 3,077 3,177 2,976 11,698 2,756 Technology 134 132 124 142 532 136 Other (1,259) (1,282) (1,510) (1,363) (5,414) (1,321) Continuing Operations $ 10,669 $ 11,103 $ 11,152 $ 11,138 $ 44,062 $ 11,135 Operating income (loss): Olefins & Polyolefins - Americas $ 821 $ 872 $ 759 $ 801 $ 3,253 $ 656 Olefins & Polyolefins - Europe, Asia, International 93 189 78 17 377 225 Intermediates & Derivatives 323 285 371 321 1,300 316 Refining (17) (16) (37) 92 22 86 Technology 50 39 35 33 157 60 Other (3) (5) 1 - - (7) (3) Continuing Operations $ 1,267 $ 1,364 $ 1,207 $ 1,264 $ 5,102 $ 1,340 Depreciation and amortization: Olefins & Polyolefins - Americas $ 75 $ 69 $ 73 $ 76 $ 293 $ 73 Olefins & Polyolefins - Europe, Asia, International 77 76 78 56 287 70 Intermediates & Derivatives 48 50 50 56 204 55 Refining 36 37 45 42 160 42 Technology 17 20 16 22 75 16 Other - - 2 - - - - 2 - - Continuing Operations $ 253 $ 254 $ 262 $ 252 $ 1,021 $ 256 EBITDA: (a)
Olefins & Polyolefins - Americas $ 898 $ 951 $ 841 $ 883 $ 3,573 $ 736 Olefins & Polyolefins - Europe, Asia, International 225 295 204 115 839 356 Intermediates & Derivatives 373 338 427 354 1,492 375 Refining 20 20 8 134 182 129 Technology 66 59 52 55 232 76 Other 3 (11) (1) 2 (7) (4) Continuing Operations $ 1,585 $ 1,652 $ 1,531 $ 1,543 $ 6,311 $ 1,668 Capital, turnarounds and IT deferred spending: Olefins & Polyolefins - Americas $ 122 $ 122 $ 218 $ 183 $ 645 $ 231 Olefins & Polyolefins - Europe, Asia, International 63 46 44 76 229 33 Intermediates & Derivatives 106 141 119 77 443 45 Refining 93 67 36 13 209 32 Technology 7 6 7 10 30 2 Other - - 5 (1) 1 5 - - Total 391 387 423 360 1,561 343 Deferred charges included above - - - - - - - - - - - - Continuing Operations $ 391 $ 387 $ 423 $ 360 $ 1,561 $ 343 (a) See slide # 23 for EBITDA calculation.

lyondellbasell.com
2013 – 2014 Reconciliation of EBITDA to Income from Continuing Operations
22
EBITDA Calculation
2013 2014
(Millions of U.S. dollars) Q1 Q2 Q3 Q4 Total Q1
Net income attributable to the Company shareholders $ 901 $ 929 $ 853 $ 1,174 $ 3,857 $ 945
Net income (loss) attributable to non-controlling interests (1) (2) (2) 1 (4) (1)
(Income) loss from discontinued operations, net of tax 6 (4) 3 2 7 (1)
Income from continuing operations 906 923 854 1,177 3,860 943
Provision for income taxes 357 410 339 30 1,136 383
Depreciation and amortization 253 254 262 252 1,021 256
Interest expense, net 69 65 76 84 294 86
EBITDA $ 1,585 $ 1,652 $ 1,531 $ 1,543 $ 6,311 $ 1,668

lyondellbasell.com 23
2011 – 2012 Reconciliation of Segment Information to Consolidated Financial Information
$ 14,880 $ 12,93415,591 14,5219,500 9,658
13,706 13,291506 498
(6,000) (5,550)$ 48,183 $ 45,352
$ 1,855 $ 2,650435 127
1,156 1,430809 334107 122(25) 13
$ 4,337 $ 4,676
$ 246 $ 281262 285186 194153 14884 73
- 2$ 931 $ 983
$ 2,137 $ 2,968865 548
1,410 1,621977 481191 197(111) (7)
$ 5,469 $ 5,808
$ 425 $ 468235 254101 159
224 13626 4317 5
1,028 1,065(7) (5)
$ 1,021 $ 1,060
Other
Depreciation and amortization:Olefins & Polyolefins - Americas
20122011(Millions of U.S. dollars)
Reconciliation of Segment Information to Consolidated Financial Information
Technology
OtherTechnology
Continuing Operations
Intermediates & Derivatives
Operating income (loss):
RefiningIntermediates & Derivatives
OtherContinuing Operations
Olefins & Polyolefins - AmericasOlefins & Polyolefins - Europe, Asia, International
Technology
Intermediates & DerivativesRefining
Olefins & Polyolefins - Europe, Asia, International
Sales and other operating revenues: Olefins & Polyolefins - Americas
Deferred charges included above
Intermediates & Derivatives
Intermediates & Derivatives
Technology
Total
Refining
Olefins & Polyolefins - Europe, Asia, International
EBITDA: (a)
Continuing Operations
Other
Olefins & Polyolefins - Europe, Asia, International
Refining
Other
RefiningTechnology
Olefins & Polyolefins - Europe, Asia, International
Continuing Operations
Olefins & Polyolefins - AmericasCapital, turnarounds and IT deferred spending:
Olefins & Polyolefins - Americas
Continuing Operations
(a) See slide # 25 for EBITDA calculation.

lyondellbasell.com
2011 – 2012 Reconciliation of EBITDA to Income from Continuing Operations
24
$ 2,147 $ 2,848
(7) (14)
332 24
2,472 2,858
1,059 1,327
931 983
1,007 640
$ 5,469 $ 5,808
Provision for income taxes
Income from continuing operations
EBITDA
Depreciation and amortization
Interest expense, net
Net loss attributable to non-controlling interests
(Income) loss from discontinued operations, net of tax
Net income attributable to the Company shareholders
2011(Millions of U.S. dollars) 2012
EBITDA Calculation

lyondellbasell.com 25
World-Class Scale With Leading Positions
0153045
607590
105
BASF Dow SABIC LYB DuPont
USD,
bill
ions
Source of data: revenues chart from capital IQ. Positions based on LyondellBasell wholly owned capacity and pro rata share of JV capacities as of December 31, 2013.
2013 Revenues Chemicals Ethylene #5 Propylene #5 Propylene Oxide #2 Polymers Polyolefins (PE + PP) #3 Polypropylene #1 Polyethylene #5 Polypropylene Compounds #1 Fuels Oxyfuels #1 Technology and R&D Polyolefin Licensing #3
Products Global Capacity Position
Bayport, TX, USA
($ in millions, except per share data) FY 2013 FY 2012 FY 2011 EBITDA $6,311 $5,808 $5,469
Income from Continuing Operations
$3,860 $2,858 $2,472
Diluted Earnings ($/share) from Continuing Operations
$6.76 $4.96 $4.32

lyondellbasell.com
Diversified and Vertically Integrated Portfolio
Technology Intermediates & Derivatives
Olefins & Polyolefins Europe Asia & International
Olefins & Polyolefins Americas
Refining
Wellhead
Refining
Olefins
Olefin Derivatives
2nd Level Derivatives
Capturing value along the chain
Styrene
Glycols Glycol Ethers Butanediol
PP Compounding
Ethylene Oxide Acetyls Propylene
Oxide Polybutene-1
Aromatics Fuels
Crude Natural Gas Liquids
Olefins
Glycols Glycol Ethers
Refining
Technology
Catalloy Process Resins
Polypropylene Polyethylene
Olefins Crackers
Technology
PP Compounding
26
Oxyfuels

lyondellbasell.com
LYB Has Diverse Footprint and End Uses
27
Sales by Region Chemical Sales by End Use(1)
N. America sales represent ~ 55% of total company revenues
(1) Estimated based on LYB 2012 third party chemical sales (O&P and Intermediates & Derivatives segments excluding olefin fuel products and oxyfuel sales) and third party industry volume estimates of product end uses.
10,000
20,000
30,000
40,000
$50,000
2011 2012 2013
North America Europe ROW
(USD Millions)

lyondellbasell.com
LYB Operates With a Simple Direct Back to Basics Strategy
28
• Top decile safety performance • Fixed costs – flat to down • Top priority – existing assets • Advantaged growth Results:
Operational Excellence
Technology Driven Growth
Performance Culture
Portfolio Management
Cost Reduction
Capital Discipline
Results:

lyondellbasell.com
Projects Annual Potential Values & Completion Timeline
29
200
400
600
800
1,000
$1,200
BDExpansion
MethanolRestart
PEDebottleneck
La PorteExpansion
ChannelviewExpansion
CorpusChristi
Expansion
2013 2014 2015
Q2
Q4 Q1
Q1
Q3
Q4
Annual Potential Value(1) ($ Million/ yr)
1) Annual potential values are based on FY 2013 industry benchmark margins.
Completed

lyondellbasell.com
Sources: Third party consultant, LYB. (1) - Includes LYB wholly owned capacity and 100% of JV capacity as of December 31, 2013. Light olefins capacity based on combined ethylene and propylene capacities. (2) - Includes Indelpro JV.
Product Capacity Position and Footprint
Facilities 6 Crackers 4 sites(2)
6 sites
Capacity(1)
9.9 Bn lbs (ethylene)
4.4 Bn lbs 5.9 Bn lbs
Product Light Olefins Polypropylene Polyethylene
NA Ranking #1
#1
#3
Strong Capacity Position + U.S. Natural Gas Liquids Advantage
• Largest light olefins producer in North America
– Significant competitive advantage with scale, feedstock supply flexibility and vertical integration
• Third largest polyethylene producer in North America
– Broad product portfolio
• Largest polypropylene producer in North America
– High degree of integration
– Catalloy adds specialty component
Olefins & Polyolefins – Americas
30
lyondellbasell.com
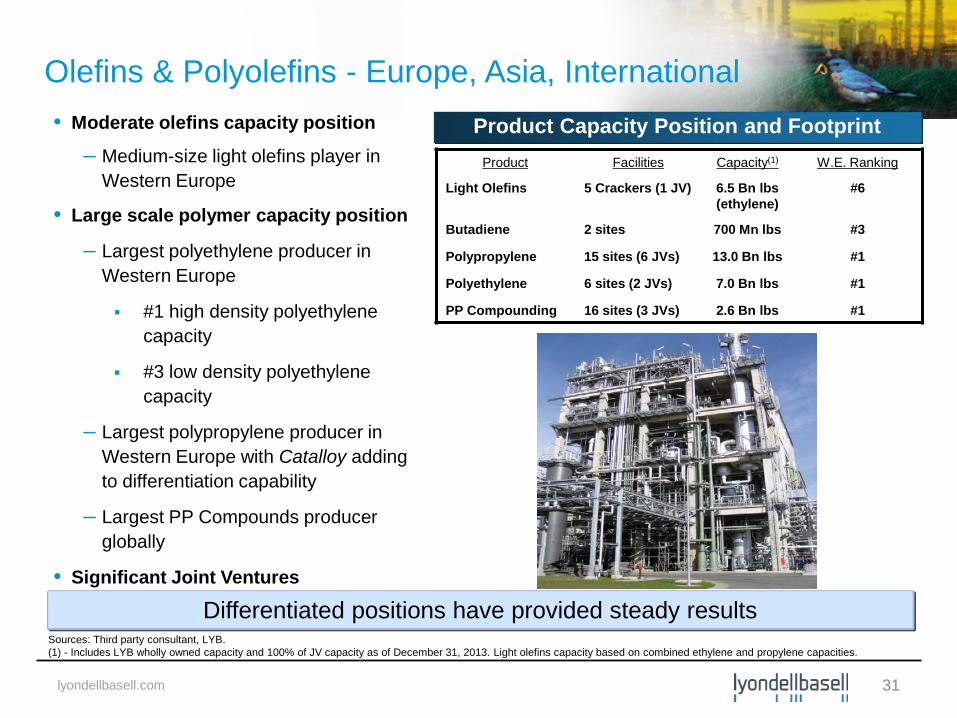
Sources: Third party consultant, LYB. (1) - Includes LYB wholly owned capacity and 100% of JV capacity as of December 31, 2013. Light olefins capacity based on combined ethylene and propylene capacities.
• Moderate olefins capacity position
– Medium-size light olefins player in Western Europe
• Large scale polymer capacity position
– Largest polyethylene producer in Western Europe
#1 high density polyethylene capacity
#3 low density polyethylene capacity
– Largest polypropylene producer in Western Europe with Catalloy adding to differentiation capability
– Largest PP Compounds producer globally
• Significant Joint Ventures
– 8 JVs in Middle East and Asia-Pacific
Product Facilities Capacity(1) W.E. Ranking
Light Olefins 5 Crackers (1 JV) 6.5 Bn lbs (ethylene)
#6
Butadiene 2 sites 700 Mn lbs #3
Polypropylene 15 sites (6 JVs) 13.0 Bn lbs #1
Polyethylene 6 sites (2 JVs) 7.0 Bn lbs #1
PP Compounding 16 sites (3 JVs) 2.6 Bn lbs #1
Product Capacity Position and Footprint
Olefins & Polyolefins - Europe, Asia, International
31
Differentiated positions have provided steady results
lyondellbasell.com
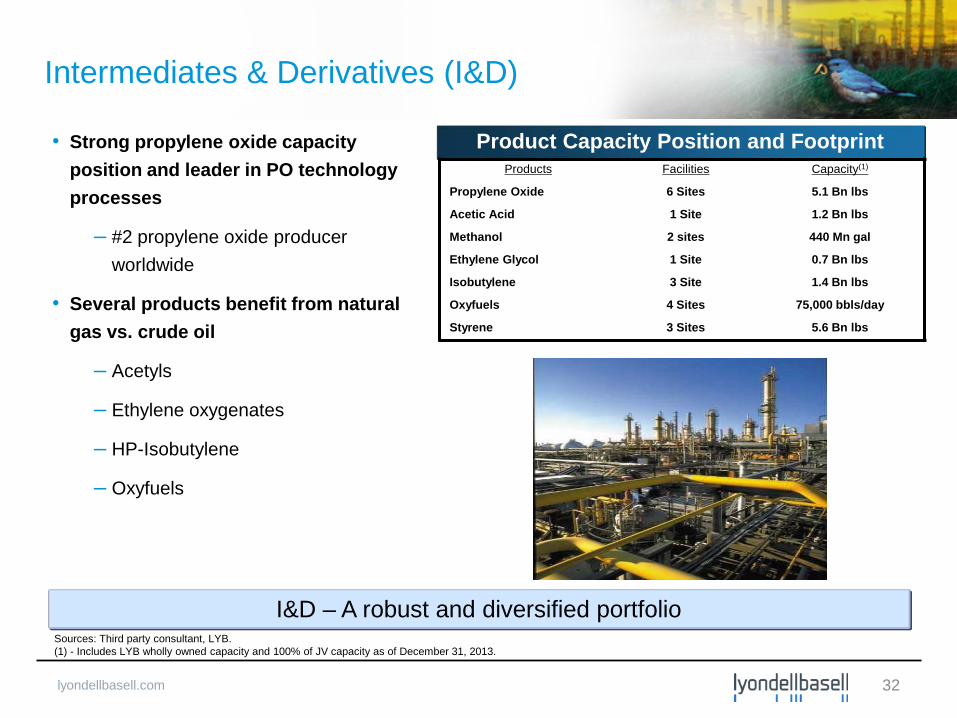
Sources: Third party consultant, LYB. (1) - Includes LYB wholly owned capacity and 100% of JV capacity as of December 31, 2013.
Product Capacity Position and Footprint
I&D – A robust and diversified portfolio
• Strong propylene oxide capacity position and leader in PO technology processes
– #2 propylene oxide producer worldwide
• Several products benefit from natural gas vs. crude oil
– Acetyls
– Ethylene oxygenates
– HP-Isobutylene
– Oxyfuels
Intermediates & Derivatives (I&D)
Products Facilities Capacity(1)
Propylene Oxide 6 Sites 5.1 Bn lbs
Acetic Acid 1 Site 1.2 Bn lbs
Methanol 2 sites 440 Mn gal
Ethylene Glycol 1 Site 0.7 Bn lbs
Isobutylene 3 Site 1.4 Bn lbs
Oxyfuels 4 Sites 75,000 bbls/day
Styrene 3 Sites 5.6 Bn lbs
32

lyondellbasell.com
Refinery Units Number of Units Capacity
Crude 2 268 MBPD
Houston Refinery
Refining
World class, high conversion, highly integrated refinery
33
• Independent gulf coast refinery
– Crude capacity of 268 MBPD
– Nelson complexity index of 12.5
• Process heavy, high sulfur crude oil
– Typically sold at discount
• Benchmark spread
– Maya 2-1-1
– Diesel production approximately equal to gasoline

lyondellbasell.com 34
O&P - Americas
Intermediates & Derivatives
O&P – EAI & Technology
Refining
Segment Annual EBITDA Profile
1,000
2,000
3,000
$4,000
2011 2012 2013
(USD, Millions)
300
600
900
$1,200
2011 2012 2013
O&P-EAI Technology
(USD, Millions)
500
1,000
1,500
$2,000
2011 2012 2013
(USD, Millions)
250
500
750
$1,000
2011 2012 2013
(USD, Millions)


