Page 1
Developing Recommendations for a Management
Plan in La Playuela Beach, Puerto Rico
Sponsoring Agency:
Department of Natural and Environmental Resources Submitted by: Austin Rose, Tim Marschall, Tyler Tao
Page 2
ii
Abstract
This project, sponsored by the Department of Natural and Environmental Resources
(DNER), seeks to propose aspects of a new management plan for La Playuela in Cabo Rojo, Puerto
Rico. The project team analyzed the current state of the environment as well as social impacts on La
Playuela. A proposal outlining steps to decrease environmental impact was presented to the DNER
on December 14th, 2015. The team suggested a vehicle limit of 136 cars and additional management
strategies for La Playuela.
Page 3
iii
Acknowledgements
First we would like to thank our ID2050 instructor Anna Jaysane-Darr, and our advisors, Dr.
Karla Mendoza-Abarca and Dr. Frederick Hart, for their continued guidance before and during our
time in Puerto Rico. We would also like to thank WPI's research librarian Laura Hanlan, who was a
crucial help in choosing, finding, and citing a number of sources.
From the time spent with the DNER in Puerto Rico, we owe a huge thanks to María Rivera-
Vázquez. She acted as our main contact person within the department and personally drove us all
around the island, arranged meetings with personnel we had questions for, acted as our translator
when needed, and much more. We would like to thank a number of the people we met with to collect
data, information about La Playuela, or information about the Limits of Acceptable Change System.
These are in particular Oscar Díaz-Marrero, Ernesto Díaz-Valázque and Edgardo González.
Finally, we would like to thank the two people who, primarily, requested that we do this
project. Those are Juan Casanova, a land manager in Cabo Rojo, and Darién López, the director of
the forest management division in the DNER. Without their concern, this project would not have
begun.
Page 4
iv
Executive Summary
We are a team of students from Worcester Polytechnic Institute, who completed a project in
coordination with Puerto Rico’s Department of Natural and Environmental Resources (DNER). The
purpose of the project was to produce recommendations regarding the specifics of a future
management plan for La Playuela – a protected area within the DNER’s jurisdiction, which they
identified as critically in need of new regulation. This document is the final product of that project.
La Playuela is officially recognized as a National Natural Landmark for its unique geography,
diverse collection of vegetation, and its importance as a habitat for a number of endangered or
endemic species. At the same time, its small strip of beachfront is a frequent destination for local and
international tourism alike. In the past 15 years especially, La Playuela has seen an unprecedented
spike in visitors. This has resulted in proportional degradation to the ecology. Among the many
problems: mangroves are dying, wildlife species are nesting less frequently, and litter is more abundant.
We used multiple methods in order to understand La Playuela’s recent development, and
develop educated strategies for its management. We conducted personal interviews with various
personnel who either knew personally about the problems facing La Playuela, or who had previously
worked on management plans in different regions of Puerto Rico. We constructed and administered
a written survey to beachgoers to evaluate the level of public information on these issues, and to gauge
what management strategies would be most well received. We compared satellite images of the area
to observe shrinking plant life density. Lastly, we applied Geographical Information Systems (GIS)
techniques to measure spatial parameters of the beachfront and calculate an occupancy capacity.
Page 5
v
Initially, we considered recommending that the new management plan be modeled on a
framework called the Limits of Acceptable Change (LAC). However, a main result of our interviews
with experts on the LAC was that La Playuela is not an ideal candidate for an LAC management plan;
the LAC is an excellent preventative measure, but La Playuela is not only in need of prevention - it is
in need of restoration. The main result of our interviews with people who have witnessed La Playuela’s
degradation first hand was that the strip of mangrove forest adjacent to the beachfront is the area
most critically in need restoration. Beachgoers frequently set up their equipment beneath the
mangroves for shade, and to use the branches for hanging bags. This regular abuse has taken a major
toll on the once dense strip of mangrove.
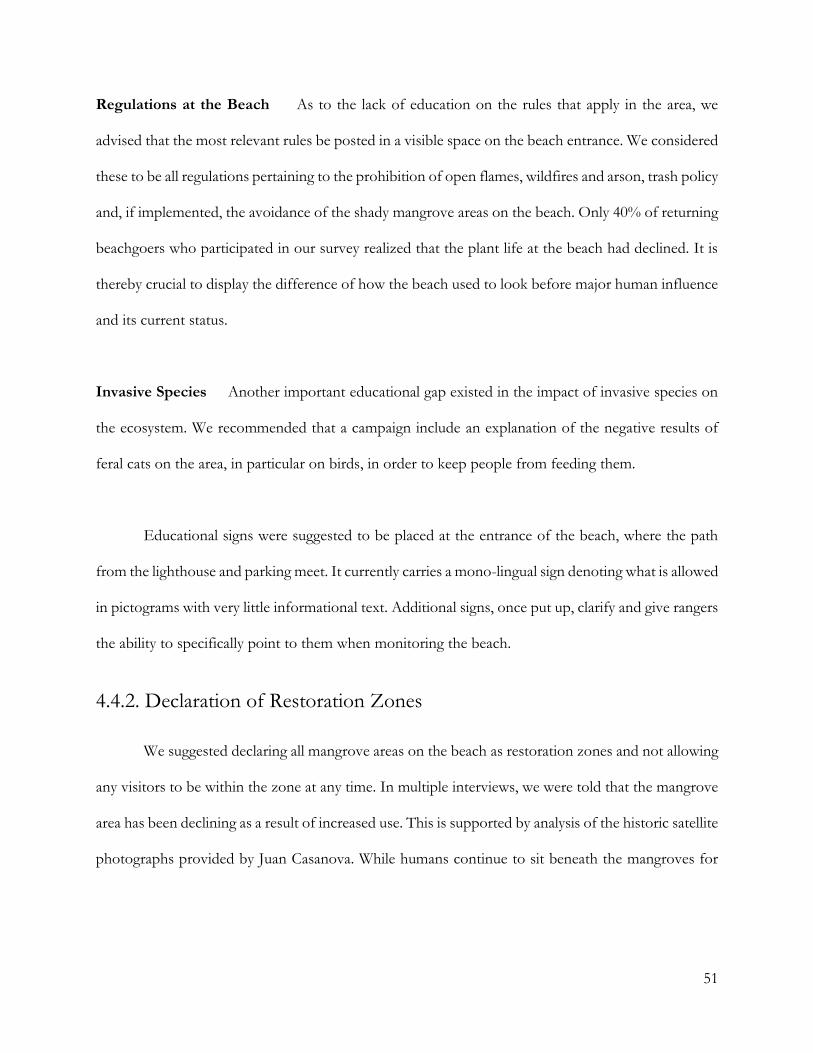
Our primary recommendation for the new management plan is that it disallow people from
occupying the area within the mangroves – restricting them to stay on the beachfront. To accompany
that restriction, we propose a proportional reduction in the maximum number of cars allowed by the
parking facility, so to account for the reduction in usable beach space. By calculating the square footage
of non-mangrove beachfront, considering the typical size of a group, and how much space they should
need to be comfortable, we arrived at our proposed parking capacity: 136 cars. After that point, the
beach does not have space to healthily accommodate everyone.
In addition to this occupancy limit, we proposed a number of alternative strategies that may
help curb degradation without explicitly restricting access. The results of our surveys helped indicate
which of these strategies will be the most well received by the public. Finally, we offered a few methods
for evaluating, in future years, how successful a management plan has been in its restoration goals.
Page 6
vi
The project team produced the following video to give an overview of the project.
It can be opened in a browser by clicking on the picture below:
Page 7
vii
Authorship
The project team collaboratively wrote and edited this document. While preliminary writing
for each section was completed by individual authors, contributions to each were made by all team
members. Austin Rose documented our methodology structure and compiled interview results. Tim
Marschall headed the research into the legal and political aspects of this project and led the team in
creating our survey. Tyler Tao took on background research, focusing on the environmental aspect of
the project, and aided the team in the translation of documents only published in Spanish. However,
no part of this project or paper was completed exclusively by one member. This makes it impossible
to distinguish the exact contributions of each individual.
Page 8
viii
Table of Contents
Abstract ........................................................................................................................................................... ii Acknowledgements ....................................................................................................................................... iii Executive Summary ...................................................................................................................................... iv
Authorship .................................................................................................................................................... vii Table of Contents ....................................................................................................................................... viii Table of Figures ............................................................................................................................................. x
1 . Introduction .............................................................................................................................................. 1
2 . Background ............................................................................................................................................... 4
2.1. Department of Natural and Environmental Resources ............................................................... 4
2.2. Cabo Rojo Municipality ..................................................................................................................... 5
2.3. Boquerón State Forest ....................................................................................................................... 6
2.4. Cabo Rojo National Wildlife Refuge ............................................................................................... 7
2.5. La Playuela ........................................................................................................................................... 7
2.6. Local Usage of the Beach .................................................................................................................. 9
2.7. Wildlife ............................................................................................................................................... 10
2.7.1. Threats to Wildlife .................................................................................................................... 11
2.8. Wildfires ............................................................................................................................................. 17
2.9. Limits of Acceptable Change Framework .................................................................................... 18
2.9.1. Goals of LAC Plans .................................................................................................................. 18
2.9.2. Key Principles ............................................................................................................................ 19
2.9.3. Case Studies ............................................................................................................................... 23
2.10. Summary .......................................................................................................................................... 26
3 . Methodology ........................................................................................................................................... 27
3.1. Identifying Primary Area Concerns ............................................................................................... 28
3.1.1. Personal Observation ............................................................................................................... 29
3.1.2. Interviews ................................................................................................................................... 29
3.1.3. Additional Data ......................................................................................................................... 31
3.2. Public Opinion and Level of Information.................................................................................... 32
3.3. Compilation of Deliverables ........................................................................................................... 33
3.3.1. Developing a Map of Critical Zones ...................................................................................... 33
3.3.2. Calculating a Base Limit ........................................................................................................... 34
3.3.3. Developing Additional Recommendations ........................................................................... 34
3.4. Summary ............................................................................................................................................ 35
Page 9
ix
4 . Findings and Analysis ............................................................................................................................ 36
4.1. Assessment of the Ecologic Situation at La Playuela.................................................................. 37
4.1.1. Analysis of Historical Photographs ........................................................................................ 37
4.1.2. Interviews ................................................................................................................................... 39
4.2. Assessment of the Usage of La Playuela....................................................................................... 41
4.2.1. Survey Response ....................................................................................................................... 42
4.3. Assessment of La Playuela’s Capacity ........................................................................................... 46
4.4. Future Legislation............................................................................................................................. 49
4.4.1. Educational Campaigns............................................................................................................ 50
4.4.2. Declaration of Restoration Zones .......................................................................................... 51
4.4.3. Carry-In Carry-Out Trash Policy ............................................................................................ 52
4.4.4. Reservation Ticketing System ................................................................................................. 54
4.4.5. Indicators to effectively implement the LAC in the Future ............................................... 55
5 . Conclusion ............................................................................................................................................... 56
Works Cited .................................................................................................................................................. 59
Appendix A : National Natural Landmark Cabo Rojo Brief .................................................... 65
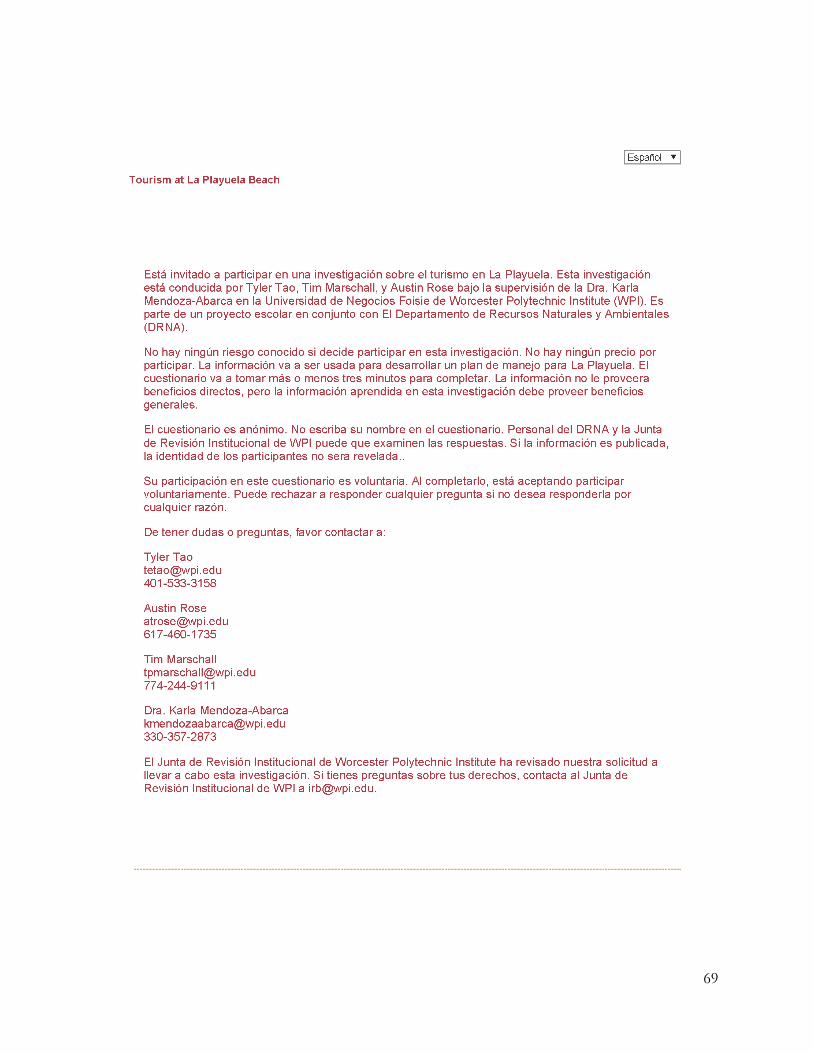
Appendix B : Surveys ...................................................................................................................... 66
Appendix C : Satellite Photographs .............................................................................................. 72
Appendix D : Interview with Oscar Diaz-Marrero .................................................................... 77
Appendix E : Interview with Ernesto Díaz-Valázquez ............................................................. 78
Appendix F : Interview with Juan Casanova and Dárien López .............................................. 79
Appendix G : Interview with Mike Morel ................................................................................... 81
Appendix H : Interview with Edgardo González ...................................................................... 82
Appendix I : Survey Response ...................................................................................................... 83
Page 10
x
Table of Figures
Figure 1 La Playuela with Boats and Visitors ................................................................................................ 2
Figure 2 Cabo Rojo is the southwestern-most municipality in Puerto Rico ............................................. 5
Figure 3 Satellite GIS image of Southwest Puerto Rico with the Boquerón State Forest highlighted in yellow ................................................................................................................................................................... 6
Figure 4 Satellite image of La Playuela............................................................................................................ 7
Figure 5 View of the Beach at La Playuela ..................................................................................................... 8
Figure 6 Entrance to the Los Morillos Lighthouse ..................................................................................... 10
Figure 7 Clockwise from lower left: Yellow-shouldered blackbird, Antillean Manatee, Hawksbill Sea Turtle, Mangrove Roots .................................................................................................................................. 12
Figure 8 Range of the Yellow-shouldered Blackbird .................................................................................. 14
Figure 9 The mangrove area at La Playuela ................................................................................................. 16
Figure 10 The five steps in our modified LAC plan ................................................................................... 22
Figure 11 Flowchart detailing steps taken by the WPI team ..................................................................... 28
Figure 12 Gantt chart of tasks to be completed while in Puerto Rico..................................................... 35
Figure 13 Comparison of Satellite Photographs of La Playuela ............................................................... 38
Figure 14 Time spent by beachgoers on La Playuela.................................................................................. 43
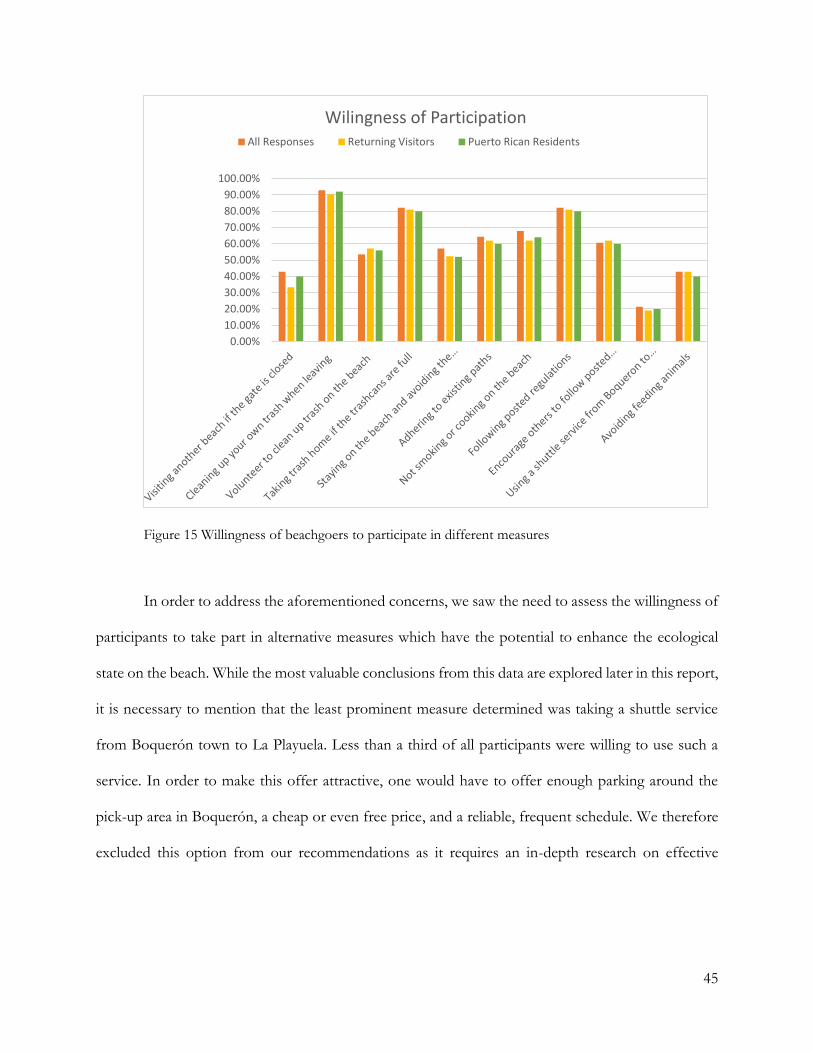
Figure 15 Willingness of beachgoers to participate in different measures .............................................. 45
Figure 16 Polygon in Google Earth Pro encapsulating available-use zone ............................................. 47
Figure 17 Spatial parameters of available-use polygon ............................................................................... 47
Figure 18 Calculations to determine parking capacity ................................................................................ 49
Page 11
1
1. Introduction
Preserving nature is one of the most significant challenges of the 21st century. According to
the World Wildlife Foundation (WWF), 46 to 58 thousand square miles of forest are eradicated
annually. The negative human impact on nature has severe implications for the health of ecosystems
all around the globe (WWF, 2015).
In Puerto Rico, natural degradation has historically been driven primarily by agriculture.
Deforestation on the island reached a peak of 90% eradication in 1940. It has since been grown back
to around 60% today. Deforestation is shrinking due to numerous projects dedicated to restoring the
island’s natural landscape (Miller & Lugo, 2009).
The Department of Natural and Environmental Resources (DNER) is the commonwealth’s
publicly funded governmental organization focused on conserving Puerto Rico’s natural resources and
promoting environmental sustainability. The DNER manages several protected areas on the island,
one of them being the Boquerón State Forest. It fulfills its mission through a variety of means, such
as gathering valuable demographic and environmental data, animal tracking, and regulating protected
refuges in Puerto Rico (Resources, 2012).
In the case of La Playuela, a beach located in the southwest end of Puerto Rico in the
municipality of Cabo Rojo, natural degradation is heavily correlated with human usage. According to
Ernesto Diaz, Director of the DNER Coastal Zone Management Program, no more than 700 people
should be on the beach at the same time, however Juan Casanova and Dárien López suggested that at
peak times, there is up to 3000 people swarming the area (Casanova, 2015).
Page 12
2
Figure 1 La Playuela with Boats and Visitors
In particular, the island’s inhabitants use the beach as a recreational destination for weekend
trips as seen in Figure 1. La Playuela is a part of the Boquerón State Forest, yet the use of the area
does not follow the standards established in the regulations of the forest. The beach is first and
foremost protected, yet people often treat the beach as public.
The DNER is well aware of the significant ecological degradation the La Playuela area has
undergone in recent years. Even though the department has worked towards more regulation, for
example by declaring parking zones and marking them with signs, they plan on implementing a more
sensible management plan to minimize the human impact on the area. This plan has to be based on
Page 13
3
scientifically founded recommendations for specific limits and alternative strategies to accomplish
their sustainability goals. Finding a sustainable balance between the incentives for local tourism, and
the need for ecological preservation, is the overarching goal of the project described here.
Existing limits on tourism in La Playuela are mainly based on the carrying capacity of the
declared parking zones. Additionally, the DNER has rangers stationed at the entrance of the area,
which are supposed to administer the amount of cars, close the gate when the facility is full, and check
the beach periodically for violations of regulations, such as open fires. Due to personnel constraints,
this practice has proven to be ineffective. Additionally, rangers often do not close the gate when they
are supposed to, as the current limit has no enforceable basis such as an administrative order and no
scientific background, but rather derives from experience. The DNER would like to implement a new
plan which is not solely based on limits due to physical space available, but instead based on a scientific
evaluation of what the ecology can sustain.
That particular goal - to change the usage of an area so that ecology and human use are in
balance - is very common for any organization concerned with the environment. Thus, the United
States Department of Agriculture (USDA) formalized a general framework that managers can use to
guide their planning, called the “Limits of Acceptable Change (Cole, Frissell, Lucas, Petersen, &
Stankey) System for Wilderness Planning.” Even though the words “wilderness planning” appear in
the title, the LAC is general enough to be applicable in planning for all types of land and usage,
including beachfront tourism on La Playuela. The DNER has tasked our project team with applying
this framework to help determine a specific, implementable set of limits and strategies for minimizing
the negative impact of tourism on the ecology in La Playuela.
Page 14
4
In particular, we proposed a limit 136 cars or 545 people that can be allowed at the beach at
the same time. Additionally, we recommended implementing a more comprehensive educational
campaign, a carry in carry out policy and lastly an information system for reservations on the beach.
The data and suggestions we presented will guide the development of new rules and restrictions for
La Playuela, meaning that this project has the potential to impact not only the ecological health of the
area, but also its social and economic environment.
2. Background
Some preliminary information about La Playuela and the opposing ideals of unrestricted use
to aid economic development and imposed regulations to preserve biodiversity are detailed in the
following sections. A summary of the framework suggested by the DNER is provided as a general
method to satisfactorily compromise the two ideals. The framework summary is followed by two case
studies demonstrating how the framework can be applied.
2.1. Department of Natural and Environmental Resources
The Department of Natural and Environmental Resources (DNER) is a publicly funded
agency of the government of Puerto Rico. It was established by law in 1972 to ensure the sustainability
and conservation of Puerto Rico’s natural resources ("Ley Orgánica del Departamento de Recursos
Naturales," 1972, 20 June).
The DNER is responsible for the management of several public properties, one of them being
the Boquerón State Forest which includes La Playuela (DRNA, 2009).
Page 15
5
Depending on the declaration of the land, the DNER has the legal jurisdiction to enforce rules
and regulations pertaining to protected areas through fines. ("Ley de Bosques de Puerto Rico," 1975,
June 1).
2.2. Cabo Rojo Municipality
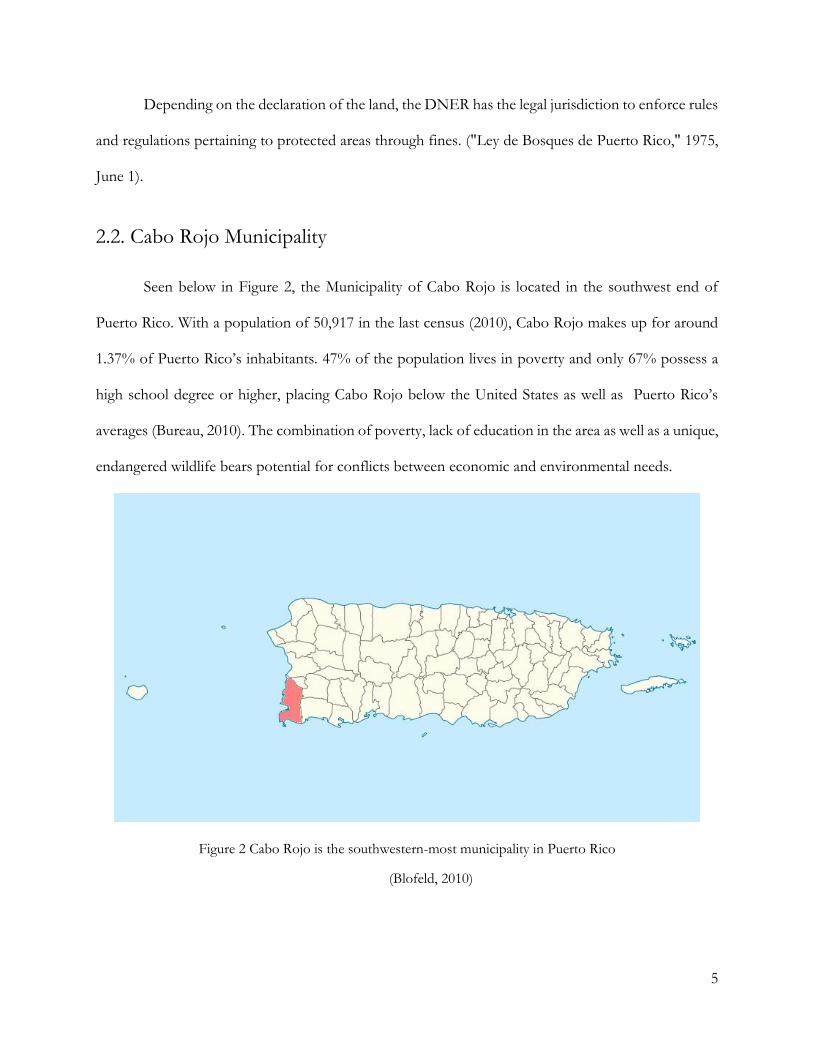
Seen below in Figure 2, the Municipality of Cabo Rojo is located in the southwest end of
Puerto Rico. With a population of 50,917 in the last census (2010), Cabo Rojo makes up for around
1.37% of Puerto Rico’s inhabitants. 47% of the population lives in poverty and only 67% possess a
high school degree or higher, placing Cabo Rojo below the United States as well as Puerto Rico’s
averages (Bureau, 2010). The combination of poverty, lack of education in the area as well as a unique,
endangered wildlife bears potential for conflicts between economic and environmental needs.
Figure 2 Cabo Rojo is the southwestern-most municipality in Puerto Rico
(Blofeld, 2010)
Page 16
6
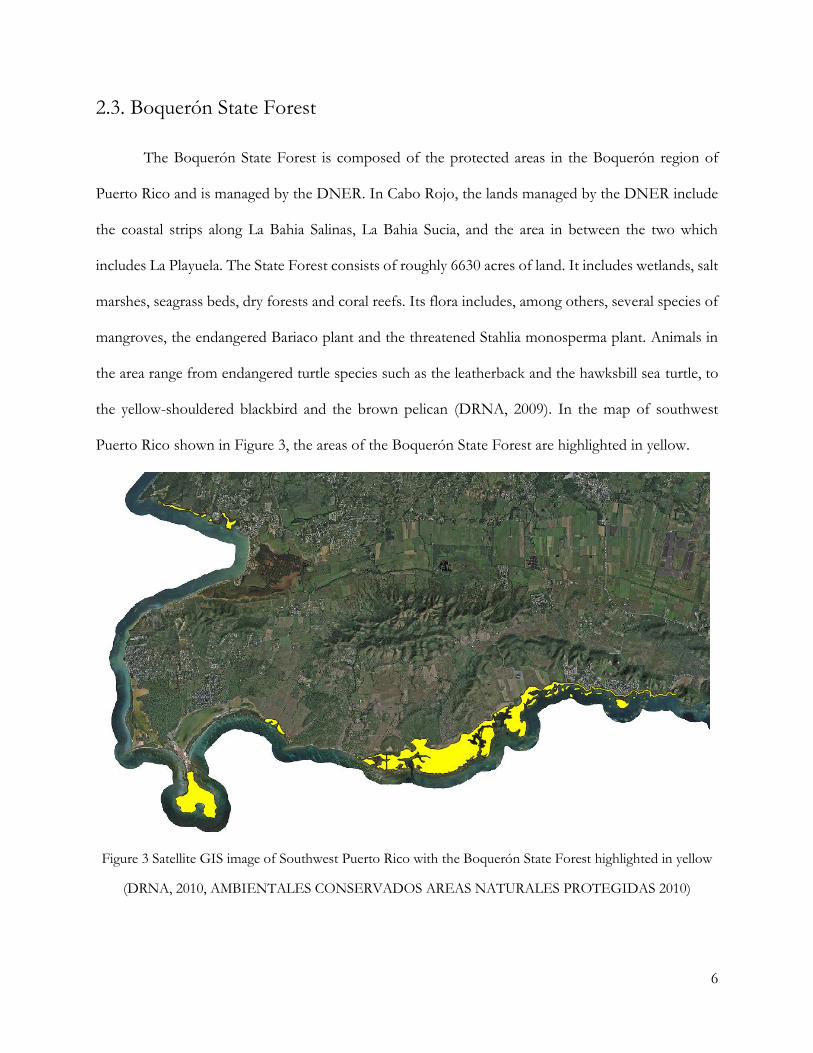
2.3. Boquerón State Forest
The Boquerón State Forest is composed of the protected areas in the Boquerón region of
Puerto Rico and is managed by the DNER. In Cabo Rojo, the lands managed by the DNER include
the coastal strips along La Bahia Salinas, La Bahia Sucia, and the area in between the two which
includes La Playuela. The State Forest consists of roughly 6630 acres of land. It includes wetlands, salt
marshes, seagrass beds, dry forests and coral reefs. Its flora includes, among others, several species of
mangroves, the endangered Bariaco plant and the threatened Stahlia monosperma plant. Animals in
the area range from endangered turtle species such as the leatherback and the hawksbill sea turtle, to
the yellow-shouldered blackbird and the brown pelican (DRNA, 2009). In the map of southwest
Puerto Rico shown in Figure 3, the areas of the Boquerón State Forest are highlighted in yellow.
Figure 3 Satellite GIS image of Southwest Puerto Rico with the Boquerón State Forest highlighted in yellow
(DRNA, 2010, AMBIENTALES CONSERVADOS AREAS NATURALES PROTEGIDAS 2010)
Page 17
7
2.4. Cabo Rojo National Wildlife Refuge
The Cabo Rojo National Wildlife Refuge (NWR), managed by the United States Fish and
Wildlife Service (FWS) begins directly north of La Playuela and stretches inland. All visitors arriving
to La Playuela via land must pass by the Cabo Rojo NWR. One important distinction is that the
DNER manages the coastal areas, while the FWS manages only inland areas in Cabo Rojo. The refuge
encompasses 1836 acres of land. Due to its past use of cattle raising and agriculture, the area contains
high levels of non-native plant species, though the FWS is gradually reintroducing native vegetation
("Cabo Rojo National Wildlife Refuge," n.d.). A large amount of the land is salt flats used in a
commercial sea salt farming operation closely monitored by the FWS. The Cabo Rojo Salt Flats are a
well-known migratory bird hotspot and are home to a few bird species year round (PRCCC, 2013).
The Cabo Rojo NWR and La Playuela have closely linked ecosystems and changes in either will
inevitably affect the other.
2.5. La Playuela
Figure 4 Satellite image of La Playuela
(DRNA, 2010)
Page 18
8
La Playuela, shown in Figure 4, is located in the southwest corner of Puerto Rico and is a
tombolo between La Bahía Salinas to the west and La Bahía Sucia to the east encompassing a total of
583 acres of land (Casanova, 2015). Limestone cliffs on either side of the beach allow hiking and the
Los Morrillos lighthouse is located on the western side. The region hosts diverse ecosystems, including
dry forests, mangrove forests, and sea flats (Service, 2015). Additionally, the area gained recognition
as a National Natural Landmark as being an “excellent example of a tombolo (tied island) with double
spit, mangroves, beaches, reddish cliffs, xeric vegetation, and seabird nesting habitat” according to a
brief we obtained from Carolyn Morales, National Natural Landmarks Coordinator for the Southeast
Region with the National Park Service (Appendix A).
Figure 5 View of the Beach at La Playuela
Cabo Rojo is well known for hosting some of the most beautiful beaches in the Caribbean.
One of these is the beach at La Playuela, seen in Figure 5. It was chosen among the top beaches in
Page 19
9
the Caribbean by users of the travel portal TripAdvisor (tripadvisor, 2015). Due to this, the area has
seen a dramatic spike in visitors over the past few years (Casanova, 2015).
2.6. Local Usage of the Beach
Cabo Rojo with its attractive beaches serves the people of the island as a holiday refuge. Locals
venture to the municipality, and in particular to the Boquerón State Forest, during weekends and over
the summer. Forms of recreation at La Playuela include boating, hiking and, most obviously,
swimming and relaxation. The threats to the area are a result of the overuse of the beach area
(Casanova, 2015). The implications of this overuse are manifold.
Boating has implications for corals, as misplaced anchors can destroy reefs, which can be
detrimental to the marine ecology. Additionally, boats are a direct threat to Manatees, which roam the
bay. Hiking has resulted in several manmade paths throughout the area, without regard to ecology and
long term sustainability. For example, one path along a cliff edge is becoming continuously more
dangerous as erosion has made it increasingly narrower, making it more likely for hikers to trip and
fall onto the sharp rocks in the bay. Most importantly, however, is the actual visitation of the beach
for relaxation. A large amount of people uses the beach at once, particularly in summer during holidays
such as the 4th of July. Visitors often disregard regulations, e.g. by cooking on an open fire on the
beach, risking wildfires (Casanova, 2015). Another issue is trash disposal, as a significant amount of
visitors leave their trash on the beach which subsequently gets taken into the wetlands and salt flats
by the wind. It also has attracted stray cats, which are invasive to the area. Lastly, people tend to seek
protection from the sun in the shade of the mangroves on the back end of the beach. The continued
usage of that land has led to a significant decline in mangroves (Casanova, 2015). Posted signs indicate
Page 20
10
what activities are and are not allowed in the state forest. There are two similar signs at La Playuela,
one for the hiking area around Los Morrillos Lighthouse shown in Figure 6 below, and another for
the beach itself.
Figure 6 Entrance to the Los Morillos Lighthouse
2.7. Wildlife
The US Fish and Wildlife Service has identified 76 endangered species that reside in Puerto
Rico ("Listed species believed to or known to occur in Puerto Rico," 2015). The species identified by
the FWS as residents of the Cabo Rojo NWR are the Yellow-shouldered Blackbird; two endangered
plant species, Arustuda chaseae and Eugenia woodburyana; and one threatened plant species, Stahlia
monosperma ("Threatened and Endangered Species on National Wildlife Refuges Database," n.d.).
La Playuela and its surrounding waters in conjunction with much of the Cabo Rojo NWR and the
Boquerón State Forest at La Playuela compose at least part time habitat of many species in addition
Page 21
11
to those listed above including the Hawksbill sea turtle and Antillean manatee, both of which are
endangered, and at least 22 species of shorebirds, many of which are threatened, protected or
endangered (PRCCC, 2013; "Antillean Manatee Fact Sheet," 2013; "Hawksbill Turtle (Eretmochelys
imbricata)," 2014). These species depend upon the stability of the area and the specific properties of
the available land to nest and live for all or part of the year. In the past 100 years, large scale changes
in the climate have increased dramatically in stark contrast to the relative consistency of past weather
and oceanic conditions. Coupled with human interference, decreasing available food sources, and
habitat area, environmental changes can easily outpace the species’ individual capacities to adapt to
change. This allows non-native species to gain a foothold and begin to overtake native species
(PRCCC, 2013).
2.7.1. Threats to Wildlife
The overwhelming majority of threats to the livelihood and well-being of wildlife species are
the direct result of human activity. At La Playuela beach, the DNER is primarily interested in
degradation of the environment leading to habitat loss of endangered species, such as the Antillean
manatee, the Hawksbill sea turtle, and the Yellow-shouldered blackbird, all shown in Figure 7. Both
marine species reside at least part time in these waters, and the land is critical habitat for the blackbird.
This section identifies some specific threats posed to each of these animals.
Page 22
12
Figure 7 Clockwise from lower left: Yellow-shouldered blackbird, Antillean Manatee, Hawksbill Sea Turtle, Mangrove Roots
(Morel, 2010, Yellow-shouldered blackbird)(Kok, 2012, Manatee)(Rogers, 2011, Hawksbill Sea Turtle/ Carey
de Concha)
Antillean Manatee Sometimes referred to as sea cows, manatees can vary widely in size and have
a diet mainly composed of seagrass. In Puerto Rico, they are usually about 8-9 feet long and live to
around 27 years ("Antillean Manatee Fact Sheet," 2013). Boat strikes are the most common cause of
human related manatee deaths. In addition, boats can damage or kill seagrass beds, thereby reducing
the amount of individual manatees that the area can support. Another danger to manatees is repeated
Page 23
13
human interaction and feeding. Manatees can learn to swim nearer to boats looking for food, which
increases their risk of being hit, knocked out, or struck by the boat’s propeller. Some individual
manatees may become dependent upon handouts and starve when the tourist season wanes and the
animal cannot hunt for itself. Pollutants and chemicals discharged into the ocean can affect the
composition of the water in certain areas making them uninhabitable and killing the manatees already
living there ("Antillean Manatee Fact Sheet," 2013).
Hawksbill Sea Turtle Hawksbill sea turtles are medium sized sea turtles that can be found
around the world with multiple nesting sites in Puerto Rico ("Hawksbill Turtle (Eretmochelys
imbricata)," 2014). Pollution is one of the greatest dangers to sea turtles. Oil or chemical spills leave
beaches unfit for nesting. Garbage such as plastics and discarded fishing gear can cause death from
suffocation or entanglement. Hawksbill turtles often eat plastic bags as they mistake them for jellyfish.
The turtle’s stomach fills with plastic and it stops feeling hungry, eventually dying from starvation.
Recreational watercraft, fishing vessels, and commercial ships can also pose a threat to sea turtles.
Groundings and boat anchors dropped on coral can kill individual colonies or even the entire reef.
Coral reefs provide shelter and a reliable source of sponges for turtles to eat and the loss of reefs can
force them to move elsewhere (Recovery Plan for Hawksbill Turtles in the U.S. Carribean, Atlantic
and Gulf of Mexico, 1993). Though all species of sea turtle can be found around the globe, many
individuals return to the beach where they were born to nest. If the beach is unfit, or an acceptable
nesting location cannot be found, the turtles may return to the ocean without laying their eggs or
accidentally damage clutches of eggs previously laid decreasing the size of the hatchlings the following
year ("Threats to Sea Turtles," 2014).
Page 24
14
Yellow-shouldered Blackbird While the yellow-shouldered blackbird is not the only bird
species endemic to Puerto Rico, it is unique in the fact that a majority of its current habitat is located
in southwest Puerto Rico. Once found throughout the island, the blackbird is now in danger of
extinction (Post, 2011). The species has been endangered since 1976 due to a combination of habitat
loss, nonnative predators, and, most significantly, brood parasitism by the shiny cowbird. Rather than
care for its own young, the shiny cowbird lays its eggs in the nests of other species, oftentimes
destroying the eggs of the host birds (Lowther, 2011). In just a seven-year period from 1975 to 1982,
the blackbird population declined by 85%. Due to human intervention reducing the population of
shiny cowbirds, the number of blackbirds increased into the mid 2000's, but without funding to
continue the reduction program, the blackbird population has once again begun to decline. Without a
renewed plan to manage the shiny cowbird population, the yellow shouldered blackbird may become
extinct within the next 50 years (Liu, 2015). Figure 8 is a map from the International Union for
Conservation of Nature depicting the past range of the yellow-shouldered blackbird in red and the
current range of the blackbird in yellow. Within the shown range, the blackbird will nest in various
locations dependent upon the terrain and land features available (Post, 2011).
Figure 8 Range of the Yellow-shouldered Blackbird
("Agelaius xanthomus," n.d.)
Current Range
Past Range
Page 25
15
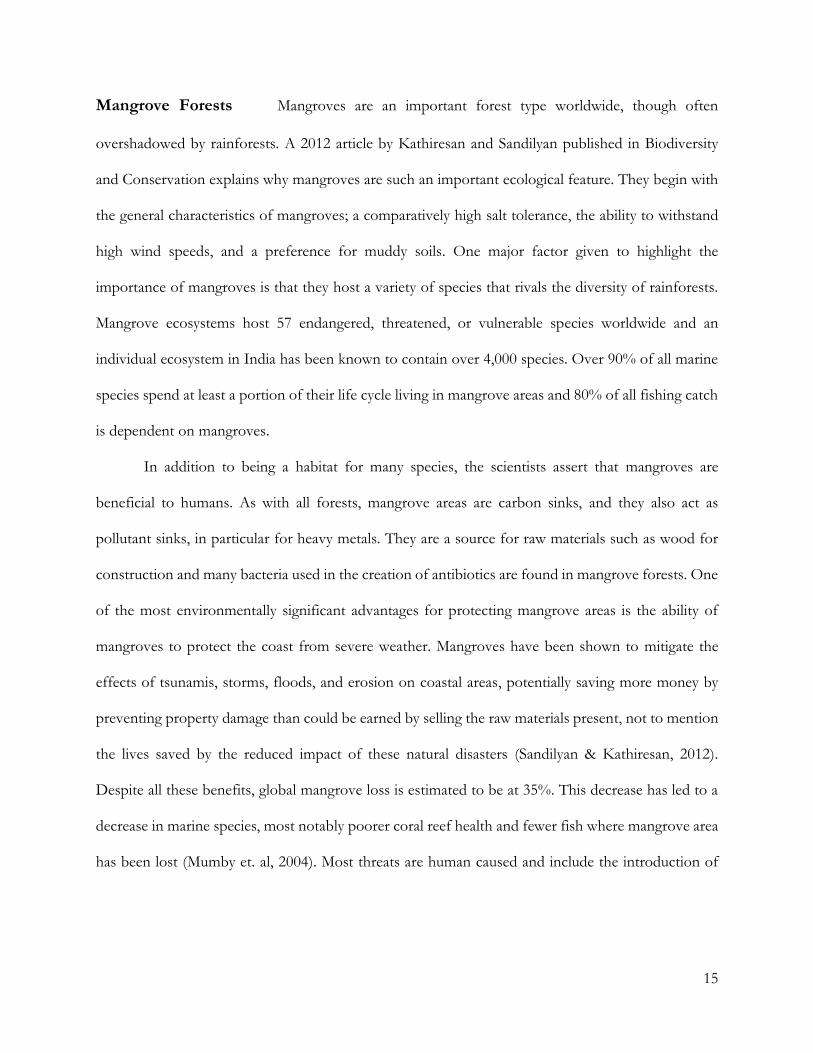
Mangrove Forests Mangroves are an important forest type worldwide, though often
overshadowed by rainforests. A 2012 article by Kathiresan and Sandilyan published in Biodiversity
and Conservation explains why mangroves are such an important ecological feature. They begin with
the general characteristics of mangroves; a comparatively high salt tolerance, the ability to withstand
high wind speeds, and a preference for muddy soils. One major factor given to highlight the
importance of mangroves is that they host a variety of species that rivals the diversity of rainforests.
Mangrove ecosystems host 57 endangered, threatened, or vulnerable species worldwide and an
individual ecosystem in India has been known to contain over 4,000 species. Over 90% of all marine
species spend at least a portion of their life cycle living in mangrove areas and 80% of all fishing catch
is dependent on mangroves.
In addition to being a habitat for many species, the scientists assert that mangroves are
beneficial to humans. As with all forests, mangrove areas are carbon sinks, and they also act as
pollutant sinks, in particular for heavy metals. They are a source for raw materials such as wood for
construction and many bacteria used in the creation of antibiotics are found in mangrove forests. One
of the most environmentally significant advantages for protecting mangrove areas is the ability of
mangroves to protect the coast from severe weather. Mangroves have been shown to mitigate the
effects of tsunamis, storms, floods, and erosion on coastal areas, potentially saving more money by
preventing property damage than could be earned by selling the raw materials present, not to mention
the lives saved by the reduced impact of these natural disasters (Sandilyan & Kathiresan, 2012).
Despite all these benefits, global mangrove loss is estimated to be at 35%. This decrease has led to a
decrease in marine species, most notably poorer coral reef health and fewer fish where mangrove area
has been lost (Mumby et. al, 2004). Most threats are human caused and include the introduction of
Page 26
16
non-native species, clearing for construction or agriculture, harvesting the trees for wood, or
environmental changes such as altered river paths that affect the salinity of existing water bodies.
Figure 9 The mangrove area at La Playuela
Four species of mangroves have been identified in Puerto Rico; the Red Mangrove,
Rhizophora mangle; the Black Mangrove, Avicennia germinans; the White Mangrove, Laguncularia
racemosa; and the Button Mangrove, Conocarpus erectus. Figure 9 shows the mangrove area at La
Playuela. While each of the species have a status of least concern (as opposed to threatened, vulnerable,
endangered, or extinct), the population of each is declining ("Avicennia germinans," 2010;
"Conocarpus erectus," 2010; "Laguncularia racemosa," 2010; "Rhizophora mangle," 2015). The link
between mangroves, coral reefs, and seagrass has weightier implications. Mangrove health is critical
Page 27
17
to the survival of many endangered and threatened species even though the mangroves themselves
are not endangered or threatened.
2.8. Wildfires
In 2014, Puerto Rico had 3,647 wildfires that burned 16,292 acres (National Interagency Fire
Center). As many as 90 percent of wildfires in the United States are caused by humans, according to
the U.S. Department of Interior. Some human-caused fires result from campfires left unattended, the
burning of debris, negligently discarded cigarettes and intentional acts of arson ("Wildfires," 2015).
Wildfires are a growing problem in La Playuela. In the last 3 years on this one small tombolo, there
has been at least one wildfire per year. A single fire in 2015 destroyed around 30 acres of land
(Casanova, 2015). Whether due to negligence or malice, the broad majority of wildfires are the result
of human use. In our time at La Playuela surveying people and observing the area, we noticed
discarded charcoal, which was most likely used for cooking. This is despite the fact that open fires are
expressly illegal in state forest areas ("Ley de Bosques de Puerto Rico," 1975, June 1). The dense
volume of people using the area at peak times, combined with the single small road point of egress,
make La Playuela an exceptionally dangerous place for a wildfire to occur. The main parking facility
can hold up to 120 vehicles. When it fills, people continue to park on the road, on spaces which are
explicitly marked as non-parking zones. Alternatively, visitors walk from much further away. In the
event of a wildfire, it is impossible to efficiently evacuate the large amount of people and vehicles,
before allowing a fire response vehicle to come through.
Page 28
18
2.9. Limits of Acceptable Change Framework
The “Limits of Acceptable Change” framework, sometimes followed by “for wilderness
planning” or “for managing national protected area,” is a framework for balancing the needs of the
environment with the impacts of tourism originally written by Cole, Frissell, Lucas, Petersen, and
Stankey for the US Department of Agriculture. In this section, the Limits of Acceptable Change
method will be described and evaluated as a management strategy for conservation of any area used
by humans.
The LAC system is a framework for establishing acceptable and appropriate resource and
social conditions in recreation settings. The LAC has been developed in response to the need of park
managers for a means of coping with increasing demands on recreational areas in a progressive,
measurable way. The LAC also represents a reformulation of the recreational carrying capacity
concept, with the primary emphasis now on the conditions desired in the area rather than on how
much use an area can tolerate (Cole et al., 1985).
At La Playuela beach, the natural desire for increasing consumerism and recreation exists at
sharp odds with the sustainability of the existing natural resources (Morel, 2015, 9 November).
Therefore, regulation in La Playuela is an obvious candidate for the application of LAC. Since the area
only became a popular tourist attraction in recent years, there is a better opportunity for well-calculated
regulations to prevent degradation from reaching a rate that is out of the control of the DNER.
2.9.1. Goals of LAC Plans
Implementing a plan developed using the Limits of Acceptable Change guidelines will allow
conservation by limiting use of key areas before degradation of the environment advances to a stage
Page 29
19
that cannot be repaired. The LAC provides a way to satisfactorily meet two conflicting goals. In most
cases where the LAC is applied, including this case, meeting the demand for tourist activities and
conserving the environment are the two conflicting ideals.
2.9.2. Key Principles
According to “Managing Visitor Impact” by the National Oceanic and Atmospheric
Administration (NOAA), there are three main points to keep in mind when implementing the LAC
method. They are:
1) Change in the environment is inevitable, so it should be managed;
2) There is a bare minimum level at which the environment can survive;
3) And that tourism should be allowed to impact the environment only until this minimum
level is reached ("Managing Visitor Impacts," n.d.).
These three statements direct the creation of the conservation plan. Rather than using carrying
capacity, which is a numeric visitor cap, to define the acceptable use of a site, the LAC approach
examines the amount of impact caused by different types of activity. While sunbathing and use of
recreational watercraft require vastly different resources, they are both viewed the same under the
carrying capacity management framework. The impact of each tourist cannot be assumed equal.
However, in any area used by humans, there will be an environmental impact associated with that use.
The LAC approach acknowledges that both the state of the environment and unrestricted tourist use
must be compromised in order to create the maximum benefits both economically and
environmentally. In light of this fact, one objective, called the primary goal, is given priority over the
other objective, the secondary goal. The primary goal is only compromised until the bare minimum
Page 30
20
sustainable level is reached. The secondary goal is compromised as much as necessary to ensure the
primary goal is being met. In almost all areas, the primary goal is maintaining sustainable
environmental conditions since growth of the tourism industry outpaces natural regeneration of
wildlife areas. Therefore, LAC limits touristic activities when there is a threat of irreparable damage to
the environment ("Managing Visitor Impacts," n.d.).
Many documents describe the process of implementing a LAC management plan, though the
original framework was written in 1985 by Cole, Frissell, Lucas, Petersen, and Stankey for the US
Department of Agriculture. The general steps have been modified numerous times to fit the unique
needs of different environments around the world. However, some of the basic steps remain the same.
Our modified version of the LAC plan for La Playuela consists of five steps displayed in Figure
10. First, the agency or managing body responsible for the care of the target area must identify the
need for a conservation strategy and long term goals for the area. Next, the agency must gather
information about the current state of the environment with particular focus on trends or specific
concerns. Third, the agency should carefully select what indicators will be used to monitor the
situation. The choice of indicators is dependent upon the technology, expertise of employees, and
funds available to the agency. Then, the agency is able to determine the most effective time and
manner to take action when the limit of each indicator is breached. This may involve multiple options
for restoring environmental conditions to be chosen per indicator based on the situation. After every
possible action is determined, the agency must evaluate the cost and feasibility of each while taking
care to allow feedback from all stakeholders. Finally, continuous monitoring of the area and chosen
indicators leads the agency to take appropriate measures to decrease impact when needed. At all steps
in the process, the agency should regularly analyze the effectiveness of the program and make
Page 31
21
necessary adjustments when there are changes in the environment (Drumm & Moore, 2002). After
the concerns and goals have been established by the agency in charge of the area to be affected by the
management plan, any of the subsequent steps can be undertaken by external bodies in conjunction
with or working for the agency. Researchers or experts in the field of specific methods of data
collection may be brought in to oversee the selection and monitoring of indicators. Community
organizations may be able to coordinate the continuous monitoring required by the LAC framework.
In the case of the La Playuela project, the WPI project team has been tasked with proposing indicators
and action plans to rectify environmental degradation to the managing body, which is the DNER.
Page 32
22
Figure 10 The five steps in our modified LAC plan
For the LAC approach to function, there must be an overarching entity that monitors the
chosen indicators and has the power to limit tourist activity in the area. This can be a governmental
organization, nonprofit organization, or a group of community members working for an agency with
the authority to implement regulations and with the resources to consistently monitor the environment
(Secretariat of the Convention on Biological Diversity, 2002). Indicators are chosen by the managing
body and must be measurable. Quantitative measurements are preferred, as they reduce the chance of
Page 33
23
biased data collection and make upper and lower limits are more straightforward. Though available
technology and manpower may limit which properties can be measured, collecting data from diverse
sources produces a more thorough understanding of changes that are occurring. Constant monitoring
is required to ensure indicators do not fall outside the range of allowable levels. Regular data collection
will highlight trends that foreshadow larger issues, possibly allowing the prevention of them altogether.
The LAC is best suited to governmental agencies, as they have more resources and legal influence
than smaller, local conservation groups. Management with the authority to implement changes
regarding availability and allowed use of an area can more efficiently restore the environment to an
acceptable state. In addition, governmental agencies have existing connections with the community
affected by new regulations and the ability to clearly communicate these standards to the residents
(Secretariat of the Convention on Biological Diversity, 2002).
2.9.3. Case Studies
The following subsections describe some case studies that illustrate how the LAC framework
has been adapted to suit coastal areas rather than wilderness areas. They provide useful insight to the
benefits of following the LAC method. Moreover, it is beneficial to see how other management teams
have adapted the core plan to fit their individual needs.
Boating in Balearic Islands Spain This study conducted by Diedrich, Huguet, and
Subirana in 2011 describes the creation of a management plan based on the Limits of Acceptable
Change framework to regulate recreational boating in a bay, Calla Xinxelli, which is part of an island
in the Mediterranean Sea. While the Limits of Acceptable Change original framework was intended
Page 34
24
for protecting land, the concept is applicable to marine environments where the area of interest is well
defined and the needs of the environment are at odds with human use of resources. Demand for
recreational boating in Calla Xinxelli coupled with its small size poses a risk to the safety of tourists as
well as the survival of a threatened species of seagrass.
The team identified the stakeholders as the government, private sector, and civil society. They
used GIS and aerial photographs along with surveys to measure eight indicators including number of
boats present, area of beach and sandy bottom, demographics of visitors, and visitor satisfaction.
Based on the data collected, a maximum number of boats in the bay, minimum distance between
boats, and damage to seagrass was incorporated into proposed solutions. Multiple solutions were
proposed to allow the managing body to choose the level of importance of social factors as well as
the amount of funding available (Diedrich, Huguet, & Subirana, 2011).
Managing Snorkeling Tourism in Thailand This study conducted by Roman, Dearden &
Rollins (2007) aimed to reduce touristic impact to a coral reef in the Marine Protected Area of Koh
Chang National Marine Park in Thailand. The study focused on reducing tourists walking on the coral,
referred to by the researchers as trampling. Trampling can harm and kill coral colonies decreasing the
habitat of many other marine species. The researchers identified a disparity in likeliness of being
trampled based on the type of coral. In addition, in areas where the depth at low tide is greater than
3m, trampling cannot possibly occur. Therefore, the researchers sought to implement a plan such that
high levels of tourism be allowed in areas with resilient types of corals or a low tide above the limit,
making the problem nonexistent, while limiting tourism in more sensitive areas. The team used a
Page 35
25
cartographical map in conjunction with the LAC framework to zone the area based on their respective
conditions.
Zoning is a system that divides one large area into multiple sub areas with varying properties.
The sections might be divided based on where certain plants or animals particularly sensitive to
environmental changes reside or where each tourist activity takes place. Each sub area can then have
its own subset of regulations dependent upon each section’s specific needs such as restricting access
to the most vulnerable areas and directing most tourism to more resilient areas. Using zoning enables
the authorities to allow varying levels of tourism in each zone as well as monitor the at risk areas more
closely.
The zoning plan in the study was created in the following order: First, vulnerable areas with
high biodiversity were zoned as Conservation Areas with use limited to monitoring and research only.
Using tourist feedback collected from surveys administered by the researchers, areas suitable for
snorkeling tourism were sectioned into Tourism and Ecotourism Zones. The survey data suggested
that tourists were most satisfied with a snorkeling experience located in waters with low coral mortality
and high coral diversity with 35 or fewer others at the site. Under the LAC model, number of tourists
per site and coral mortality were selected as indicators. An acceptable range for the coral mortality
index for all sites was proposed to cap the maximum allowed mortality at 50%. The ideal number of
snorkelers per site was chosen to be <30. Although coral diversity affected the experience of the
tourists, it was not linked to touristic impact and was not chosen as an indicator. Ecotourism Zones
contained somewhat vulnerable areas while Tourism Zones were comprised of low vulnerability
corals. The recommended LAC values for the Ecotourism Zones were lower than the values for the
Tourism Zones to ensure a lower visitor impact (Roman, Dearden, & Rollins, 2007).
Page 36
26
Creating zones is not only beneficial for the wildlife. The distinction between zones enables
visitors to choose the site offering their desired experience. Management becomes more effective
under zoning plans. Rather than creating acceptable indicator limits for an entire area, at-risk portions
can be given stricter limits while other sections that can support greater resource use bear the majority
of the impact. In the area surrounding La Playuela, as well as on the beach itself, there are varying land
structures and human use patterns. By separating the area into zones, it will be possible to limit access
to areas that cannot withstand heavy foot traffic or that are primary habitats for protected and
endangered species. Using zoning strategies combined with the LAC framework to create regulations
for La Playuela beach will result in higher overall tourist usage while still providing the environment
with adequate protection.
2.10. Summary
La Playuela has seen a drastic increase in popularity over the past decade. A sensible approach
to regulation, balancing and combining the opposing incentives of touristic growth and wildlife
preservation, is therefore crucial to prepare the protected area for the future. With an increase in
human activity in the area, it is necessary to consider, estimate, and limit touristic effects, minimizing
both direct and secondary threats to multiple endangered species.
Taking into consideration the manifold threats pertaining to the area and their causes, as well
as the history and natural significance of this part of the Boquerón State Forest, allows for the
recommendation of sensible limits to ensure a more sustainable future of the area. The Limits of
Acceptable Change framework is a method for limiting the environmental impact of tourism that has
been implemented worldwide. Its versatility allows it to be adapted to any area where there is both
Page 37
27
wildlife and tourism. While it provides a structure and sequential steps, the LAC framework is broad
enough to be useful to all management organizations. For these reasons, it can be a useful strategy to
guide the DNER in creating new regulations in the La Playuela beach area.
3. Methodology
In order to make sensible suggestions, we developed an understanding of the area in a cultural,
historical and ecological sense. This involved gathering and analyzing as much historic data about the
area as possible, seeking related trends in touristic usage volume and ecological degradation. Sources
of information included geographical data, photographs, reports generated by the DNER, as well as
personal interviews with employees of the DNER and related organizations familiar with the area.
The data served as the basis for a cartographical map highlighting the most critical zones in terms of
tourism contribution to natural degradation. A firsthand look at La Playuela beach enabled us to collect
valuable usage data through surveying and gain an understanding of local environmental issues in
order to establish a baseline of usage levels to ensure sustainable ecological growth. This baseline then
served as rationale for the suggestions we develop for the DNER.
This chapter describes the steps we followed in order to construct our recommendations for
the DNER and their eventual management plan for La Playuela. We first identified the most
significant management concerns affecting the area. We accomplished this through personal
observation, by considering interviews with knowledgeable personnel, and by analyzing relevant
historical data. We then evaluated how informed the beach-going public is about these management
concerns, and how willingly they would abide by a selection of potential new management strategies.
Finally, we combined these results to decide what regions of La Playuela can continue sustaining use,
Page 38
28
and what regions should be explicitly preserved under a new management plan. With all of this
information, we were able to propose a revised occupancy maximum given the spatial constraints of
the usable area, and to propose which alternative management strategies - supplemental to an
occupancy maximum – we found most likely to be effective. A graphic displaying these steps is shown
in Figure 11.
Figure 11 Flowchart detailing steps taken by the WPI team
3.1. Identifying Primary Area Concerns
The paramount goal of the project is to enable the DNER to implement a sensible regulatory
framework ensuring that La Playuela beach as well as the surrounding area flourishes both from an
environmental as well as from a touristic perspective. The first step in order to solve this issue was to
Page 39
29
research the causes and patterns of degradation in the area. We needed to establish what specific
problems we wish to solve, ensuring that we can keep a practical limit on the scope of our project,
whether it is species losing habitats, flora being trampled, evacuation procedures being unsafe, or some
combination of issues. The proceeding subsections detail various approaches involved in the
collection of this information.
3.1.1. Personal Observation
Some usage problems, such as an abundance of litter, were obvious to identify upon visiting
La Playuela. During the time we spent there, we hiked the entire area, making observations and taking
photographs that would corroborate any additional historical perspective we could gain.
3.1.2. Interviews
The most abundant source of historical context regarding La Playuela's development came
from meetings and emails with various directors, managers, and researchers working in the DNER or
the FWS. Through these interviews, we were able to gain a firm understanding of the challenges of
wildlife preservation and in particular the issues and approaches that have been taken at La Playuela
and the problems they are trying to address. The proceeding subsections detail the goals and
significance of each conversation.
Ernesto Díaz-Valázquez Mr. Díaz-Valázquez is the Director of the DNER’s Coastal Zone
Management Program. He has been involved in a number of land management plans regarding coastal
Page 40
30
zones. From a discussion with him, we hoped to gain some insight about the steps involved in applying
the LAC framework to a management plan.
Edgardo González Mr. González is the former Chief of the Forest Bureau at the DNER, and
an expert on the use of the LAC framework in a wide variety of management plans. From a discussion
with him, we intended to get an opinion of how the LAC might be adapted for relevance to La
Playuela, given its history.
Oscar Díaz-Marrero Mr. Díaz-Marrero is the Manager of the Cabo Rojo National Wildlife
Refuge, for the FWS, and has been for more than 10 years. From a discussion with him, we sought to
learn about how La Playuela fits into the broader Cabo Rojo Wildlife Refuge. We asked about relevant
past management plans in wildlife refuges, and about any further references he could point us to for
numerical data concerning La Playuela wildlife.
Mike Morel Mr. Morel is a field researcher for the FWS. We were pointed to him as a good source
for numerical data concerning nesting and migratory patterns of the various species in La Playuela.
We inquired for this data, as well as for his personal observations about the trends in recent years.
Juan Casanova and Darién López Mr. Casanova and Mrs. López are the two people most
responsible for noticing the need for a management plan in La Playuela, and requesting that this
project take place. Juan Casanova is the DNER’s Land Manager for La Playuela, and Darién López is
the Director of their Forest Management Division. With over 10 years of managing La Playuela, Mr.
Page 41
31
Casanova has had the most significant in-person exposure to the area over the years of anyone we
talked to. From our conversations, we wanted to learn a number of details about the eventual
management plan we would recommend for. We asked about the biggest problems directly resulting
from tourism, why tourism has spiked so suddenly in recent years, about existing or previous efforts
to curb overuse and manage the area, and finally about the resources and limitations that would be
involved with the enforcement of any new policies.
3.1.3. Additional Data
In the many conversations we had to learn about the problems in La Playuela, we specifically
sought out any data from previous research we could possibly get regarding the area over the past
several years. It is important that the data we collected cover several past years, to ensure that any
trends in the data could be correlated with the increased human usage La Playuela has seen in that
time. The proceeding subsections detail what sources of data we were able to find.
Hawksbill Sea Turtle Nesting From our conversations with Mike Morel, we were referred to
Dr. Carlos E. Diez, who is in charge of a program collecting Hawksbill Sea Turtle nesting data in Cabo
Rojo. We contacted him to request access to any data relevant to our concerns in La Playuela.
Yellow Shouldered Blackbird Migratory Patterns To get a better understanding of the
challenges and changes shorebirds experience at La Playuela, we contacted Katsi Ramos, field
researcher and bird expert at the DNER. In particular, we looked for information on the yellow-
shouldered blackbirds’ migratory patterns, nesting and population statistics.
Page 42
32
Marine Life Stranding The DNER referred us to Yamita Rodriguez who collects data when
marine animals become stranded on shore. We contacted her to request access to any data relevant to
our concern in La Playuela.
Satellite Photographs Assessing the state of degradation was a challenge, as the amount of data
on the ecology at La Playuela is rather limited. One of the few tools we were able to acquire is satellite
photos. The DNER is in possession of satellite pictures spanning over 60 years, up to the beginning
of the new millennium. Additionally, we were able to obtain satellite pictures through Google Earth
Pro and its sources. Lastly, we obtained a GIS dataset containing a high resolution image from 2010
alongside several layers of geographical data such as soil types and roads. Comparing these images
allowed us to make an objective judgement of the degradation at la Playuela over time.
3.2. Public Opinion and Level of Information
The cultural impact of our project is a significant consideration. In order to assess the public’s
knowledge and opinion as well as openness to change, we spent two weekend days on the La Playuela
beachfront surveying the visitors. November is a time of comparatively low tourism at La Playuela
with not many people visiting. Due to the fact that there were not enough groups to utilize a sampling
technique, we asked all beachgoers if they would be willing to complete our survey. Data was collected
by asking one member from each group at the beach to fill out a short questionnaire, which is included
in Appendix B. The survey was made available in English and Spanish. It included questions that
helped us to assess several relevant social questions, such as, but not limited to, whether the public
Page 43
33
understands that the beach is a protected area, what degradation they have personally noticed in recent
years, and what subset of some potential new policies they would be most receptive to. The answers
to these questions helped to inform our recommendations regarding whether an educational campaign
should be a major part of this management plan and what alternative strategies for preservation may
be the most successful. Surveys included some initial questions specifically to provide some context
and legitimacy, such as questions regarding residency in the municipality and on the island as well as
questions inquiring about the frequency and length of reoccurring visits of the beach. Additionally,
we asked a question about group sizes in order to find how many people the average group consists
of as well as a question about the time of year the participant is most likely to visit the beach in order
to derive the peak season. The latter third of the questions inquired about change over time in litter
and plant life, customer satisfaction and most importantly, which measures visitors are willing to
participate in to enhance the quality of the beach.
3.3. Compilation of Deliverables
The last step to reach our goal of developing sensible recommendations was to analyze the
data received and compile the results into easily readable, informational documents. The following
points explain this approach to the deliverables in detail.
3.3.1. Developing a Map of Critical Zones
One of the deliverables was in form of a map containing the most critical zones, i.e. which
zones of La Playuela can continue sustaining use, and what parts must be explicitly preserved under a
new management plan. In order to provide an accurate assessment, we utilized a geographical
Page 44
34
information system (GIS) based on data we received. In general, a geographic information system is
“a facility for preparing, presenting, and interpreting facts that pertain to the surface of the earth”
(Tomlin, 2013). Then, we applied GIS techniques to evaluate the spatial constraints within the
boundaries of these continued-use areas. We used QGIS (formerly Quantum GIS), a free, open-source
GIS program, as well as Google Earth Pro, to develop these maps.
3.3.2. Calculating a Base Limit
With the exact amount of available space known, we derived a figure for what should be the
maximum occupancy at La Playuela – a number at which people entering should be turned away at
the gate. In deriving this number, we considered the average group size according to our surveys, the
size of beach towels, and the amount of space psychological studies suggest a human needs to be
comfortable. Regard to fire safety as well as other advantages and disadvantages of the limit such as
social impact must be taken into account in the evaluation of the number.
3.3.3. Developing Additional Recommendations
A single number is not going to solve all issues pertaining to the area. In fact, the LAC
specifically refrains from just using a singular number, but instead tailoring management plans to the
acceptable state of the ecology through various techniques. A crucial part of the project was to
highlight which additional measures may be helpful to the area in the future and enhance the efficiency
of the proposed limit, such as the development of an educational campaign. These suggestions were
heavily dependent on the aforementioned survey results.
Page 45
35
Lastly, we developed a set of indicators the DNER can keep track of in order to effectively
apply the LAC framework in the future. As the framework is largely dependent on indicators and
time-based data, we had very limited room to apply the framework with the current state of
information. The development of these indicators for future use, however, can have a large impact on
the efficient management of the area and therefore had to be part of the deliverables. All of our
compiled analysis, limits and suggestions were compiled into a report to be delivered to the DNER.
3.4. Summary
As can be seen in the Gantt chart in Figure 12, we have allocated our time on site to each of
the aforementioned tasks. While some were ongoing through most of the term, others, such as
surveying, were undertaken at a single point in time.
Figure 12 Gantt chart of tasks to be completed while in Puerto Rico
Page 46
36
In creating our report for the DNER, we took into account many factors that influence the
viability of our suggestions. Through interviews with many professionals concerned with the wellbeing
of La Playuela and the wildlife it contains as well as surveying members of the community who will
be affected by new regulations, we formulated a report which will be used to guide future legislation
ensuring new regulations will benefit both the town and environment.
4. Findings and Analysis
The results in the following section serve the purpose of providing the DNER with an
overview and scientific analysis on La Playuela beach. In order to guide the agency in the development
of a management plan, the findings have been compiled into a report including history, analysis and
suggested steps for enhancing the ecological situation in the area. Using various data sources, we were
able to derive numbers for the amount of parking spaces that should be offered to address the
manifold challenges pertaining to the sensible usage of the beach. Additionally, our suggestions
targeted infrastructural, ecological and educational shortcomings in order to enhance both the
ecological situation as well as the touristic experience on the beach. Lastly, we developed a set of
several meaningful indicators to be monitored by the DNER in order to be able to apply the LAC
framework in future years with relevant data. All suggestions are subject to resources available to the
DNER and their feasibility will have to be taken into consideration at the point of development of
the management plan.
Page 47
37
4.1. Assessment of the Ecologic Situation at La Playuela
The first part of our analysis centered on the ecological state of la Playuela and its
surroundings. Most of our conclusions derived from personal interviews with experts on the area. An
assessment of the ecological state of the area would have been dependent on data over the time. There
merely was not enough of this time based data available to draw detailed conclusions aside from
personal interviews and historical, aerial photographs.
4.1.1. Analysis of Historical Photographs
The DNER supplied us with several high quality aerial photographs spanning sixty years of
La Playuela’s development, up to 1996. These photos gave us an insight as to how mangrove density
and distribution have changed over this time. Additionally, we used Google Earth Pro to collect
several more satellite photos of the area, to fill the gap between the 90’s and present day. Between
these sources, we observed and analyzed a comprehensive picture of how the ecological features of
La Playuela have changed. Figure 13 shows the difference between three select photos, 1936, 1996 and
2015. The loss of mangroves is particularly obvious in the circled zone. The connection between the
parking area in the lower left corner and the beach strip was entirely filled with mangroves, sharply
distinguishing the two. 60 years later, the mangroves have become scarcer and the connection is very
obvious. Today, another 19 years later, this trend has continued and even less mangroves can be found
growing on the beach despite the fact that parking is no longer allowed in the area adjacent to the
beach.
Page 48
38
Figure 13 Comparison of Satellite Photographs of La Playuela
Page 49
39
4.1.2. Interviews
The project team conducted in person and email interviews with many professionals within
both the DNER and the FWS. More detailed findings from our communications can be found in
Appendix D – Appendix H. Both governmental organizations manage land in Cabo Rojo and have
many scientists working on conservation and research in the area. We spoke to individuals possessing
a variety of job titles, many of whom work in the field daily and have observed changes in social and
environmental conditions firsthand. From the DNER we spoke to Ernesto Díaz-Valázquez, Juan
Casanova, Dárien López, and Edgardo Gonzáles. In addition, we met Oscar Díaz-Marrero and Mike
Morel from the Fish and Wildlife Service in Cabo Rojo.
There was a general consensus among all individuals we interviewed that environmental
conditions at La Playuela have begun to degrade rapidly in the past decades. Wildfires, littering, and
damage to the marine ecosystem in the bay from boating were mentioned as growing issues by all
familiar with the area. All of these problems negatively affect the wildlife; Mr. Morel noticed a much
smaller bird population in 2015 than in years prior. Mr. González noted the absence of amenities such
as restrooms and plentiful trash barrels offered at public beaches at La Playuela, though the DNER
has no intentions of adding either. Human activity on the beach is causing change at rates that cannot
be sustained for much longer.
Dárien López and Juan Casanova work regularly at La Playuela and were able to share with
us the most information about the area. Both emphasized that La Playuela is first and foremost a
protected area and the needs of plants and animals are put first by the DNER. They have been
Page 50
40
opposed to adding more facilities and waste collection areas because they are an eyesore that detracts
from the beauty of the landscape. As the beach is not public, they are not obligated to do so. In fact,
adding them would not necessarily benefit the environment. So far, the beach has remained free of
any man-made objects, save for a few signs.
However, many of their observations indicated that the general public does not take the same
care in protecting the beach. Though the rangers enforce a car limit, Mrs. López explained that visitors
simply park along the road in front of the gate and walk to the beach, taking shortcuts through the
vegetation. She spoke about wildfires in the area, caused unintentionally by those who illegally cook
on open flames or by arsonists with criminal intent. Perhaps the most prevalent issue is litter.
Everything from single napkins to entire shopping bags of trash were seen left on the beach during
our visit. About five years ago, the mangroves were thick enough that the wetlands behind could not
be seen, according to Mr. Casanova. Now, he said, the wind can carry the trash throughout the forest.
These issues combined with an inability to control the number of people contributing to them created
a situation in which it is impossible for park rangers to adequately patrol the beach.
Ernesto Díaz-Valázquez and Edgardo Gonzáles both advised us to develop potential
management strategies for the area as a more effective way of controlling degradation at La Playuela
than a visitor cap. While both are familiar with the LAC framework, Mr. Gonzáles acknowledged that
using a LAC plan is not the only option available, nor will we necessarily attain the best results by
strictly adhering to the LAC format. He said, for example, if the conditions are already past an
acceptable point, taking action should be top priority with less focus on environmental indicators. At
La Playuela, it is already known that degradation has occurred past acceptable levels. From our
Page 51
41
conversations with both Mr. Díaz-Valázquez and Mr. Gonzáles, we decided to look into potential
management actions in addition to calculating a proposed numeric visitor limit.
From our communications, we determined that the DNER does not possess the resources
needed to develop and implement a complete LAC management framework for the area at the current
time. However, we learned that implementation of a visitor cap by itself is unlikely to be sufficient
action to allow the wildlife at La Playuela to flourish as it did in years past. Therefore, the visitor cap
must be combined with additional management strategies for the maximum benefit.
4.2. Assessment of the Usage of La Playuela
The second component of our analysis focused on the usage of the beach. Apart from data
gathered through interviews and very limited data on the amount of visitors, we were unable to
establish other external data sources. However, it was crucial to the project to have knowledge on the
usage of the beach. In order to address this issue, we developed and administered a survey among
visitors. Alongside with research on the effectiveness of education, the aforementioned visitation
statistics, an analysis of comparable evacuation times in case of a fire, we were able to develop coherent
numbers on the amount of cars that the DNER should allow in the area.
A successful management plan involves the larger picture including a full diagnosis of the area,
alongside historical and cultural significance. By understanding the conflict, the area, the legal and
institutional framework attached to the area and by developing management objectives, it becomes
possible to offer a larger set of solutions.
Page 52
42
4.2.1. Survey Response
As the degradation of the ecology at La Playuela is caused by human influence, it was of utmost
importance to gather information on the perception of the beach in the public; knowledge about the
area, in particular pertaining to the protected status of it; and lastly the willingness to follow measures
to enhance the ecological state of the beach.
We designed a survey in Appendix B to gather this data. It was distributed to visitor groups
on the beach during the weekend of the 14th and 15th of November, 2015. Even though this weekend
falls outside the tourist season and thereby limited access to willing participants, we were able to gather
28 responses over the two days. The participant selection was solely limited by the physical presence
on the beach and the property of one response per group.
The main problem the beach incurs is an overbearing amount of visitors at the same time. In
order to address this issue, we mainly considered three factors in our survey. The first was growth in
reoccurring visitors, as it gives a sense of the increase in visitation over time. The second was frequency
of visitation, as it provides an understanding of how important beachgoers consider visiting this
specific beach is as well as how impactful an educational campaign can be. Throughput is the last
factor we considered, as it helps to realize how the beach becomes overcrowded and which
countermeasures are most effective. La Playuela is considered to be a special venue, as the beach is
visited less than once a month by the largest group of participants in our survey and because the
timeframe of visitation has peaks between two to three hours and more than five. The pattern is even
more prominent in returning visitors. Figure 14 shows a line diagram displaying the categories we used
for time spent on the beach on the x-axis, while the y-axis shows the percentage of participants.
Page 53
43
Figure 14 Time spent by beachgoers on La Playuela
This suggests that, while most visitors do not visit on a frequent basis, if they do, they stay for
a long time and thereby enhance the potential of visitors compounding throughout the day. A low
visitation frequency additionally suggests that beachgoers have to be properly educated before their
visit, contrary to areas in which repeat visitors come on a more frequent basis and thereby possess an
understanding of the rules and regulations. This becomes even more significant during the summer
season in the third quarter of the year, which is the most popular time to visit according to our survey
data.
The pressure on the beach is constantly growing and with it, the need for an effective
management plan. We were able to find a linear growth in returning visitors throughout time and a
comparatively high number of first time visitors (25%), therefore our data does not show any sign of
relief for the beach. This conclusion is to be taken while bearing in mind that we surveyed on a
0.00%
5.00%
10.00%
15.00%
20.00%
25.00%
30.00%
One hour orless
1-2 hours 2-3 hours 3-4 hours 4-5 hours More than 5hours
Time spent on the Beach
Including First Time Visitors Excluding First Time Visitors
Page 54
44
weekend outside of peak times and may change when more data becomes available, as long time
visitors could be avoiding peak times on purpose.
La Playuela is said to be a weekend and holiday venue mainly for Puerto Ricans, who drive
there from all across the island. We found that 89% of participants live in Puerto Rico, but only 29%
were from Cabo Rojo. This bears conflict potential, as it suggests that visitors incur a substantial drive
specifically to visit the beach, thus making them less likely to accept going to other venues if necessary.
Our data shows that only 40% of the Puerto Rican group were willing to visit another beach if the
gate is closed. A solution to this issue therefore has to address the need of an information system that
allows visitors to determine available space before making the drive. Figure 15 displays the different
proposed measures on the x-axis with bars. The group of all respondents is in orange, solely returning
visitors in yellow and solely Puerto Rican residents in green. The y-axis displays the percentage of
respondents that expressed their willingness to participate in the respective measure.
Page 55
45
Figure 15 Willingness of beachgoers to participate in different measures
In order to address the aforementioned concerns, we saw the need to assess the willingness of
participants to take part in alternative measures which have the potential to enhance the ecological
state on the beach. While the most valuable conclusions from this data are explored later in this report,
it is necessary to mention that the least prominent measure determined was taking a shuttle service
from Boquerón town to La Playuela. Less than a third of all participants were willing to use such a
service. In order to make this offer attractive, one would have to offer enough parking around the
pick-up area in Boquerón, a cheap or even free price, and a reliable, frequent schedule. We therefore
excluded this option from our recommendations as it requires an in-depth research on effective
0.00%
10.00%
20.00%
30.00%
40.00%
50.00%
60.00%
70.00%
80.00%
90.00%
100.00%
Wilingness of ParticipationAll Responses Returning Visitors Puerto Rican Residents
Page 56
46
schedules, parking capabilities in Boquerón, as well as financial, legislative and organizational
concerns. We did, however, recommend bearing the option in mind for long-term management.
As previously stated, our survey days fell during a time of low tourism and the visitor count
on the beach was much lower than peak times. In fact, we confirmed the most attractive tourist season
is during the summer and early fall, as most returning visitors usually go to the beach in the second or
third quarter of the year (52.38% and 76.19%, respectively). Therefore, the resulting data is not
necessarily representative of all visitors over the course of a year. We recommended that the DNER
re-administer the survey during the summer months to gain a more comprehensive understanding of
the varying views held by beachgoers.
4.3. Assessment of La Playuela’s Capacity
The third component of our analysis focused on determining the size of the area at La Playuela
that should remain available for the public, after the most critical areas have been declared for
restoration – prohibiting beachgoers from entering the area. Then we translated that capacity into a
limit on the number of cars which should be permitted in the parking facility by considering the space
that a typical car’s group would need to be comfortable. The number we arrived at represents an
absolute maximum which, if exceeded, would guarantee that tourists are occupying the restoration
zone.
Figure 16 below uses Google Earth Pro to superimpose a polygon representing this available-
use area onto a satellite photo of the La Playuela beachfront. Figure 17 shows the Google Earth ‘more
info’ window with the spatial parameters of that polygon, including the area: 1567 meters squared.
Page 57
47
Figure 16 Polygon in Google Earth Pro encapsulating available-use zone
Figure 17 Spatial parameters of available-use polygon
Page 58
48
To convert this number into a maximum number of vehicles, we considered how many people
a typical car will hold, and thus what square area that group should have available to be comfortable.
Our survey results indicate that, unsurprisingly, the typical car brings roughly four people. We assumed
that each person brings a beach towel for themselves, measuring in at 30 inches by 70 inches, or 1.355
meters squared (D. C., n.d.). The group can be reasonably expected to be comfortable with 3 feet of
space around them (Augustin, 2014). Altogether, with four towels next to each other and 3 feet of
buffer space, we get that each car’s group will occupy an average of slightly over 5.4 square meters of
the 1567 available. Dividing these two results yields the capacity: there should be no more than 136
cars allowed at once, which equates to approximately 545 people.
We used Mathcad software to illustrate the process and result of these calculations, shown
below in Figure 18.
Page 59
49
Figure 18 Calculations to determine parking capacity
4.4. Future Legislation
As the DNER is a governmental body, it seeks to create new laws and regulations for La
Playuela to decrease the amount of degradation. The Forest Act of Puerto Rico, Law 133, created in
1975, grants the government the authority to create regulations as deemed necessary to protect the
environment and the ability to issue fines when any regulation created under the law or the law itself
is broken ("Ley de Bosques de Puerto Rico," 1975, June 1). There are a variety of legislative options
available to the DNER, though all actions are limited by the available funds and personnel. However,
the project team was unable to analyze the resources necessary for implementing our proposed
strategies. Upon identifying the need for additional managerial action, the DNER would perform the
analysis and select the most effective strategy. Creating explicit conditions through regulations for
Page 60
50
what is acceptable and what is not allows the vigilantes and rangers to enforce the agreed upon limits
consistently. The most immediate proposed change resulting from this report is a strict limit in the
number of visitors allowed at La Playuela.
4.4.1. Educational Campaigns
One issue we found surveying was that while most people (85.71%) do know that the beach
is in a protected area, they are not aware of why it is protected and what regulations pertain to it. For
example, only 92.86% of participants were willing to clean up their own trash and merely 64.29% are
willing to adhere to existing paths. Additionally, less than half of all beachgoers we asked considered
to avoid feeding animals as an option. This poses a threat to the ecosystem at La Playuela, as invasive
species, in particular stray cats, are having a detrimental impact on shorebirds (Bies, 2014)
Therefore, we suggested running an educational campaign aimed at making visitors aware of
the regulations and the effects of different actions on the beach. In particular, we advised
implementing in the campaign:
Reasons for the Protected Status An effective campaign educates visitors as to why the area is
protected, thereby enabling them to understand the reasoning behind regulations. In this case, it must
highlight that La Playuela and its surrounding area are a habitat of several endangered species, living
in a unique ecosystem which even gained recognition as a National Natural Landmark. We advised
that all endangered species, their relevance, dangers to their habitat and the unique geographic
situation be included.
Page 61
51
Regulations at the Beach As to the lack of education on the rules that apply in the area, we
advised that the most relevant rules be posted in a visible space on the beach entrance. We considered
these to be all regulations pertaining to the prohibition of open flames, wildfires and arson, trash policy
and, if implemented, the avoidance of the shady mangrove areas on the beach. Only 40% of returning
beachgoers who participated in our survey realized that the plant life at the beach had declined. It is
thereby crucial to display the difference of how the beach used to look before major human influence
and its current status.
Invasive Species Another important educational gap existed in the impact of invasive species on
the ecosystem. We recommended that a campaign include an explanation of the negative results of
feral cats on the area, in particular on birds, in order to keep people from feeding them.
Educational signs were suggested to be placed at the entrance of the beach, where the path
from the lighthouse and parking meet. It currently carries a mono-lingual sign denoting what is allowed
in pictograms with very little informational text. Additional signs, once put up, clarify and give rangers
the ability to specifically point to them when monitoring the beach.
4.4.2. Declaration of Restoration Zones
We suggested declaring all mangrove areas on the beach as restoration zones and not allowing
any visitors to be within the zone at any time. In multiple interviews, we were told that the mangrove
area has been declining as a result of increased use. This is supported by analysis of the historic satellite
photographs provided by Juan Casanova. While humans continue to sit beneath the mangroves for
Page 62
52
shade and disturb the vegetation, the plant population will continue to decline. Reduced mangroves
have already affected the integrity of the beach and have allowed litter to be spread much more readily
by the wind. Mr. Gonzales expressed a need for a buffer zone between areas integral to the wellbeing
of vegetation and areas approved for heavy human use. Disallowing human activity in mangrove areas
promotes an increase in tree density and creates additional habitats for wildlife.
Signs marking the beginning of the buffer zone have to educate people on the significance of
mangroves to the natural area as well as the difference in tree density throughout the time, as only
40% of returning beachgoers who participated in our survey realized that the plant life at the beach
had declined. It is thereby crucial to display the difference of how the beach used to look before major
human influence and its current status.
Without the availability of mangrove areas providing shady locations to relax, beachgoers are
likely to spend less time at La Playuela per visit, increasing the throughput of the beach. Other beaches
offering more amenities and fewer restrictions provide alternative locations for those who require
shelter from the sun. Implementing this strategy has the potential to benefit the entire beach, not only
the restoration areas.
4.4.3. Carry-In Carry-Out Trash Policy
Litter is a big problem at La Playuela. When the beach first became popular, the amount of
garbage left on the beach skyrocketed. In more recent years, litter has declined, but remains an issue.
The DNER is unwilling to increase the number of trash receptacles or place them in more easily
accessed locations as it would detract from the scenery (Casanova, 2015). There are currently two sets
of receptacles, located in each main parking area. This means that there are no receptacles on the
Page 63
53
beach or hiking trails. Unfortunately, some visitors leave their trash behind as they exit the area rather
than carry it to the appropriate location.
Carry In Carry Out is a trash policy used in certain other parks throughout the United States
including all state parks in Maryland and southwest Pennsylvania, most state parks in Wisconsin and
Delaware, and some state parks in Ohio, Virginia and Washington D.C. ("Being Green at our Parks
and at home," 2009; "Carry in / carry out," 2013; "Delaware State Parks Rules," n.d.; "Leave no Trace,"
n.d.; "Picnic Areas & Shelters in Ohio State Parks," 2015). The program consists of removing all trash
receptacles from the area and instead providing small bags for visitors to place their trash in and bring
it home with them. This program aligns with the DNER’s vision for preserving the beauty of the area
by eliminating trash receptacles altogether which are eyesores and food sources of stray animals. The
responsibility of trash collection is clearly and directly placed on the visitors themselves. While all
refuse collected at La Playuela is currently regarded as trash and treated as such, a Carry In Carry Out
policy may indirectly lead to an increase in recycling. In bringing their waste home, visitors may be
inclined to use reusable containers and recycle their cans rather than throw them in the trash
("Delaware State Parks Rules," n.d.). In an interview with an employee of the state of Delaware
working with the state parks, the Carry In Carry Out policy in Delaware is enforced by the Park
Natural Resources Police. Signs are posted about the policy and bags are provided for collecting waste
for transportation out of the park. Savings from eliminating trash removal in the Delaware parks have
amounted to $55,000 (Wilson, 2015). Our survey clearly showed that people are willing to clean up
their trash (92.86%) and most are willing to take their trash home if the trashcans are overflowing
(82.14%). This leads us to the conclusion, that a Carry In Carry Out policy is feasible at La Playuela,
as long as visitors are sufficiently educated on the matter.
Page 64
54
4.4.4. Reservation Ticketing System
Suggested by Mr. Diaz, an online reservation system would allow rangers to more easily keep
track of the number of visitors to La Playuela. He proposed that such a system would make the
demand and limited availability more visible, therefore highlighting conservation efforts in the area.
Considering that 89% of visitors in our survey were Puerto Rican, but 71% were not from Cabo Rojo,
led us to the suspicion that most incur a substantial drive, especially in combination with the result
that 60% are not willing to visit another beach if the gates are closed. A reservation system addresses
this problem. The system has to inform visitors about availability at the beach during the time frame
they want to visit, which not only leads to an effective limitation on visitors, but also provides the
auxiliary benefit of a decreased number of cars turned away at the gate resulting in higher visitor
satisfaction. In order for this to be effective, people will have to be informed that there is no entry
without reservation at least during the peak season. The reservations need to be checked by rangers
upon entry. An additional advantage is that this provides the DNER with accurate visitation statistics
during high frequentation times. However, the logistics involved in developing such a system are not
insignificant. Time, money, and expertise are needed to get such a website functioning properly. For
one, it has to be responsive in order to enable visitors to make a reservation on site if there is space
available. The system can track visitor statistics, which requires data collection capabilities. Overall,
we deemed such a system as an incredibly valuable option, if implemented correctly.
Page 65
55
4.4.5. Indicators to effectively implement the LAC in the Future
As stated earlier, we were not able to apply the Limits of Acceptable Change framework due
to a lack of relevant data over time on the area. In order to address this issue, we proposed to the
DNER to record the following sets of data:
Tree Density Throughout our research, we found that a major issue in the area is that less
mangroves exist on the backside of the beach, due to the unsustainable use by beachgoers (Casanova,
2015, Morel, 2015, 9 November). Objectively recording data on tree density therefore serves as a basis
of a sensible recommendation of an acceptable limit in this matter. Tree density is measurable by
counting the number of stems at the beach and dividing the area by this number (Sampling Trees,
2011). The density should be tracked periodically, once a year at minimum.
Nesting Data Another particular useful measure is nesting data, as it provides another objective
measurement of the ecological state in the area. Bird nesting data serves as an indicator of species
diversity and enables analysis of trends over time. The same applies to turtle nests. All data has to be
recorded periodically and taking into consideration the different nesting seasons the species follow.
Visitor Statistics Periodical visitor statistics are another measure that helps to establish usage
patterns, core seasons and accurately quantifies overcrowding. This data can be gathered most easily
and reliably through a well-established information system, but alternatively can be collected by
manual counting. In addition to these counts, a survey can be administered annually during the peak
season to establish the effectiveness of measures.
Page 66
56
Trash A more unconventional measurement we propose is to collect trash on the beach monthly
and weigh it. This allows for an objective comparison of the effectiveness of the Carry In Carry Out
policy proposed and enables the establishment of a basic acceptance level in the area. Additionally, it
helps to develop more effective educational campaigns.
Pictures Determining change in an ecological system is not necessarily obvious, as vegetation
changes by season. Annual pictures, taken in the exact same conditions such as date, time and location,
allow for a differentiation of changes over time. While satellite pictures are preferred, they are harder
to obtain, in particular in exact same conditions. We therefore propose taking pictures from the top
of the lighthouse towards the beach, which provides an insightful overview of the area, in which
changes are detectable. Pictures should be taken once during summer and once during winter, to see
differences during and outside of peak times.
5. Conclusion
The result is clear from our findings, that La Playuela cannot healthily sustain the volume of
visitors that it currently experiences. The most obvious manifestation of this issue is seen in the
increasing trash and decreasing density of the mangroves immediately adjacent to the beach. Our
primary recommendation for La Playuela’s management plan is that it prohibit tourists from setting
up under the mangroves. As it stands now, beneath the mangroves is the very first place tourists seek
to occupy – since their canopy offers the only shade around, and their branches offer support for
Page 67
57
hanging bags. It’s a natural location for beachgoers to occupy, so they will continue to do so unless
explicitly prohibited.
However, it would be counterproductive to reduce the available space on the beach without
adjusting the maximum number of simultaneous visitors accordingly. To determine a reasonable
occupancy cap, we measured the square footage of usable beachfront which does not fall under the
mangroves and applied considerations for how many people a typical car brings as well as how much
room is needed for a group to be reasonably comfortable. We measured the usable area to be 1567
m2. Our surveys indicated that a typical car will bring four people to the beach. A normal beach towel
– one for each person – measures in at 30 inches x 70 inches, or 1.355 m2. Each group can be
reasonably expected to be comfortable with 3 feet of space around them. This means the typical car’s
occupants should take up slightly over 5.4 m2 of the 1567 m2 of beach space available. Dividing these
two results yields the capacity: there should be no more than 136 cars allowed at once, approximately
545 people.
To reduce the number of visitors turned away at the gate, a reservation system is a promising
option. Although it requires knowledge of computer systems to implement, if offers many benefits to
the rangers on patrol and the visitors. Beachgoers will be able to reserve spots in advance and know
if the beach has reached capacity before arriving. Rangers will not have to guess when the beach is
full. Once implemented, visitor statistics such as number of people per group and exact number of
visitors per day can be easily recorded and stored digitally by the municipality or the DNER.
An educational campaign accompanying any new regulations will inform visitors of the
acceptable uses of the beach and explain why certain conditions are problematic. Instances of
accidental wildfires may be reduced by explaining their causes. To combat the issue with litter at the
Page 68
58
beach and in the surrounding forest, we suggest implementing a Carry In Carry Out policy in which
the trash barrels are removed and beachgoers are instead provided small plastic bags to bring their
refuse home with them. Signs denoting which activities are allowed and disallowed in text as well as
pictograms will clarify existing regulations. Educational materials explaining why La Playuela is
protected and that its wellbeing is dependent upon the conscientiousness of all visitors involves the
community in the conservation efforts.
Additionally, we suggest that the DNER starts collecting data on several indicators which will
help to establish minimal acceptable limits of the ecological state in the future. We recommend the
following four indicators: tree density, which gives an objective measure of change in larger timeframes
and should be assessed yearly; turtle and bird nesting, which helps assessing animal populations and
trends and needs to be assessed during species relevant nesting times; visitor statistics, which indicates
popularity of the beach and should be assessed continually, particularly however in peak season; and
lastly, amount of trash, which should be assessed monthly in order to understand how much trash
accrues on the beach and how that changes through seasons. Additionally, the DNER should
administer a survey during different seasons to gather information on demographics, the attitude of
visitors towards the beach and proposed measures, as well as knowledge about the area.
Page 69
59
Works Cited
Agelaius xanthomus. (n.d.). Retrieved from http://maps.iucnredlist.org/map.html?id=22724209
Antillean Manatee Fact Sheet. (2013). Retrieved from
http://www.fws.gov/caribbean/es/manatee_factsheet.html
Augustin, S. (2014). Personal Space at the Beach. Retrieved from
https://www.psychologytoday.com/blog/people-places-and-things/201406/personal-space-
the-beach
Avicennia germinans. (2010). Retrieved from http://www.iucnredlist.org/details/178811/0
Being Green at our Parks and at home. (2009). Retrieved from http://loveourparks.blogspot.com/
Bies, L. (2014). Feral Cats: Impacts of an Invasive Species. In T. W. Society (Ed.).
Blofeld, D. (2010). Location of Cabo Rojo in Puerto Rico. Photograph. Retrieved from
https://en.wikipedia.org/wiki/Cabo_Rojo,_Puerto_Rico#/media/File:Locator_map_Puert
o_Rico_Cabo_Rojo.png
Bureau, U. S. C. (2010). Profile of General Population and Housing Characteristics: 2010
Demographic Profile Data.
Cabo Rojo National Wildlife Refuge. (n.d.). Retrieved from
http://www.fws.gov/Refuges/profiles/index.cfm?id=41521
Page 70
60
Carry in / carry out. (2013). Retrieved from http://dnr.wi.gov/topic/parks/shelters/carryout.html
Cole, D., Frissell, S., Lucas, R., Petersen, M., & Stankey, G. (1985). The Limits of Acceptable Change
(LAC) System for Wilderness Planning. Government Printing Office Retrieved from
http://www.fs.fed.us/cdt/carrying_capacity/lac_system_for_wilderness_planning_1985_G
TR_INT_176.pdf.
Conocarpus erectus. (2010). Retrieved from http://www.iucnredlist.org/details/178806/0
D, C. (n.d.). Bath Towels vs. Beach Towels. Retrieved from
http://www.overstock.com/guides/bath-towels-vs-beach-towels
Delaware State Parks Rules. (n.d.). Retrieved from http://www.destateparks.com/rules/cico.asp
Depertment of Natural and Environmental Resources (2012). Puerto Rico DRNA. Retrieved from
http://www.drna.gobierno.pr/
Diedrich, A., Huguet, P. B., & Subirana, J. T. (2011). Methodology for applying the Limits of
Acceptable Change process to the management of recreational boating in the Balearic
Islands, Spain (Western Mediterranean). Ocean & Coastal Management, 54(4), 341-351.
doi:10.1016/j.ocecoaman.2010.12.009
DRNA. (2009). Bosques de Puerto Rico Bosque Estatal de Boquerón. In D. d. R. N. y. Ambientales
(Ed.), (Vol. P-036): DRNA.
DRNA (Cartographer). (2010). AMBIENTALES CONSERVADOS AREAS NATURALES
PROTEGIDAS 2010
Page 71
61
Drumm, A., & Moore, A. (2002). Ecotourism Development: A Manual for Conservation Planners and
Managers Vol. Volume 1. An introduction to Ecotourism Planning. A. Singer (Ed.)
Retrieved from
https://www.google.com/url?sa=t&rct=j&q=&esrc=s&source=web&cd=1&cad=rja&uact
=8&ved=0CB8QFjAAahUKEwiyp-
Gj7tvHAhUEdz4KHddkA3Y&url=http%3A%2F%2Frmportal.net%2Flibrary%2Fcontent
%2Ftools%2Fbiodiversity-conservation-tools%2Fputting-conservation-in-context-
cd%2Fsocio-economic-assessments-and-alternative-livelihoods-resources%2F6-
51a.pdf%2Fat_download%2Ffile&usg=AFQjCNGJxZCVgcmMKMIPmiZW-
3zfxh6Rug&sig2=rPFy6ZAyStK4dH8aEWb8Kw
Hawksbill Turtle (Eretmochelys imbricata). (2014). Retrieved from
http://www.nmfs.noaa.gov/pr/species/turtles/hawksbill.htm
Laguncularia racemosa. (2010). Retrieved from http://www.iucnredlist.org/details/178798/0
Leave no Trace. (n.d.). Retrieved from
http://www.nps.gov/fone/planyourvisit/upload/FONE%20Trash%20Free%20Poster.pdf
Ley de Bosques de Puerto Rico, (1975, June 1).
Ley Orgánica del Departamento de Recursos Naturales, (1972, 20 June).
Listed species believed to or known to occur in Puerto Rico. (2015). Retrieved from
http://ecos.fws.gov/tess_public/reports/species-listed-by-state-
report?state=PR&status=listed
Page 72
62
Liu, I. A. (2015). Conservation genetics and genetic mating system of the yellow-shouldered
blackbird (Agelaius xanthomus), an endangered island endemic. Conservation Genetics, 16(5),
1041-1053. doi:10.1007/s10592-015-0721-5
Lowther, P. E. (2011). Molothrus bonariensis. Retrieved from
http://neotropical.birds.cornell.edu/portal/species/lifehistory?p_p_spp=672716
Managing Visitor Impacts. (n.d.). NOAA.
Miller, G. L., & Lugo, A. E. (2009). Guide to the Ecological Systems of Puerto Rico. Retrieved from
http://www.fs.fed.us/global/iitf/pubs/IITF_gtr35.pdf.
Mumby, P. J., Edwards, A. J., Arias-Gonzalez, J. E., Lindeman, K. C., Blackwell, P. G., Gall, A., . . .
Llewellyn, G. (2004). Mangroves enhance the biomass of coral reef fish communities in the
Caribbean. Nature, 427, 533-536. doi:10.1038/nature02286
Picnic Areas & Shelters in Ohio State Parks. (2015). Retrieved from
http://parks.ohiodnr.gov/picnic
Post, W. (2011). Agelaius xanthomus. Retrieved from
http://neotropical.birds.cornell.edu/portal/species/overview?p_p_spp=666636
P. R. C. C. C. (2013). Puerto Rico's State of the Climate 2010-2013: Assessing Puerto Rico's Social-Ecological
Vulnerabilities in a Changing Climate. Retrieved from San Juan, PR:
Page 73
63
Recovery Plan for Hawksbill Turtles in the U.S. Carribean, Atlantic and Gulf of Mexico. (1993). St.
Petersburg, Florida: National Marine Fisheries Service Retrieved from
http://www.nmfs.noaa.gov/pr/pdfs/recovery/turtle_hawksbill_atlantic.pdf.
Rhizophora mangle. (2015). Retrieved from http://www.iucnredlist.org/details/178851/0
Roman, G. S. J., Dearden, P., & Rollins, R. (2007). Application of Zoning and "Limits of Acceptable
Change" to Manage Snorkelling Tourism. Environmental Management, 39(6), 819-830.
doi:10.1007/s00267-006-0145-6
Sandilyan, S., & Kathiresan, K. (2012). Mangrove conservation: a global perspective. Biodiversity and
Conservation, 21(14), 3523-3542. doi:10.1007/s10531-012-0388-x
Secretariat of the Convention on Biological Diversity. (2002). Biological Diversity and Tourism:
Development of Guidelines for Sustainable Tourism in Vulnerable Ecosystems.
Threatened and Endangered Species on National Wildlife Refuges Database. (n.d.). Retrieved from
http://www.fws.gov/refuges/databases/ThreatenedEndangeredSpecies/State_Display.cfm
Threats to Sea Turtles. (2014). Retrieved from
http://www.nmfs.noaa.gov/pr/species/turtles/threats.htm
tripadvisor. (2015). Top 25 Beaches — Caribbean. Retrieved from
http://www.tripadvisor.com/TravelersChoice-Beaches-cTop-g147237#16
United States Fish and Wildlife Service. (2015). Cabo Rojo Natural Wildlife Refuge - Habitats.
Page 74
64
Wildfires. (2015). Retrieved from http://www.iii.org/fact-statistic/wildfires
Wilson, J. (2015) Delaware Division of Parks and Recreation/Interviewer: T. Tao.
WWF. (2015). Deforestation. Threats. Retrieved from
http://www.worldwildlife.org/threats/deforestation
Page 75
65
Appendix A: National Natural Landmark Cabo Rojo Brief
Page 76
66
Appendix B: Surveys
The team offered the survey in both English and Spanish to increase participation.
Page 82
72
Appendix C: Satellite Photographs
1936
Courtesy of the DNER
(1936, Cabo Rojo)
Page 83
73
1963
Courtesy of the DNER
(1963, Cabo Rojo)
1977
Courtesy of the DNER
(1977, Cabo Rojo)
Page 84
74
1983
Courtesy of the DNER
(1983, Cabo Rojo)
1996
Courtesy of the DNER
(1996, Cabo Rojo)
Page 85
75
2009
Obtained from Google Earth Pro
(DigitalGlobe, 2009)
2010
Obtained from Google Earth Pro
(DigitalGlobe, 2010)
Page 86
76
2012
Obtained from Google Earth Pro
(DigitalGlobe, 2012)
Page 87
77
Appendix D: Interview with Oscar Diaz-Marrero
Mr. Diaz met with us on 4th November, 2015 at one of the US Forest Service Offices in Cabo
Rojo. Wildfires at La Playuela have been killing native species and cannot be easily controlled. He
mentioned a native species of grass, Arustuda chaseae, and detailed the current actions being taken to
reintroduce it to La Playuela. This native grass is fire resistant, slowing the progression of wildfires
because it grows in dense clumps, unlike the invasive African grasses that currently dominate the area.
He pointed out that the grass is not, however, completely fire proof. Mr. Diaz informed us that of all
the beautiful sights in Puerto Rico, La Playuela is one of only four National Natural Landmarks as
designated by the National Parks Service for its unique geography. At the end of our interview, he
pointed us to Mike Morel, who we should ask for turtle data.
Page 88
78
Appendix E: Interview with Ernesto Díaz-Valázquez
We met Mr. Díaz-Valázquez on the 5th of November 2015 in the main office of the DNER in
San Juan. Throughout our interview, he helped us understand more about the development process
of a management plan. In particular, he highlighted that a limit on the amount of visitors alone is not
going to solve the problem in the area. More general thresholds should be used to restrict
environmental change. Mr. Díaz-Valázquez identified forest fires, drug smuggling, and anchoring of
jet skis and boats as some of the current issues at La Playuela. He informed us that there is a shuttle
service from the town of Boquerón to La Playuela, but it is unreliable and not often utilized. Also that
the busiest times of year are Easter week, Fourth of July weekend, long weekends, and May through
August. In addition, he pointed us toward Edgardo Gonzáles who worked on the most recent LAC
plan in Puerto Rico.
Other resources suggested to us by Mr. Díaz-Valázquez were the website for the Carribean
regional ocean partnership, carribeanllcc.org, caricoos.org, pr1930.revistatp.com for images dating
back to 1930, and Google Earth to view areal images dating back to 1993.
Page 89
79
Appendix F: Interview with Juan Casanova and Dárien López
Juan Casanova and Dárien López met with us on the 6th of November 2015 at La Playuela.
Mr. Casanova works full-time in Cabo Rojo, managing La Playuela and the other protected areas in
the surrounding municipalities since 2010, while Mrs. López oversees many protected areas in varying
locations. Mrs. López acted as a translator for Mr. Casanova, as well as shared her own knowledge of
the area with the project team.
They discussed many problems related to enforcing the current visitor limit. The current car
limit is 120 cars, approximately equivalent to 750 people. Mrs. López explained the limit was increased
from 80 cars due to pressure from the mayor’s office. After the limit is reached, people park along
both sides of the road leading into La Playuela and walk to the beach. As they walk, littering and
shortcuts through vegetation increase the damage to the area. Unfortunately, neither Mr. Casanova
nor Mrs. López have any statistics regarding arrivals to the area by car or boat. In the past, the area
was only visited by locals who used the area to camp. It did not become a tourist destination until
students from the University of Mayaguez posted pictures online and tourism companies created the
tagline “If you don’t visit La Playuela, you didn’t visit Puerto Rico.” During the summer, the southwest
of Puerto Rico is the center for tourism with 60-80 thousand visitors present in a single weekend.
The salt flats north of La Playuela host most of the migratory birds in Puerto Rico. When the
sea level rises, the ocean connects with the wetlands directly behind the beach. The increased salinity
alters plant life with the potential for affecting species distribution. Mr. Casanova noted that
approximately 5 years ago, it was not possible to see the wetland from the beach through the
mangrove. The team observed that it is now possible to easily see through the mangroves from any
Page 90
80
location on the beach and even walk directly through to the wetlands. He informed us that one of the
largest implications of this is that trash now is taken by the wind and distributed throughout the
wetlands. Another issue is wildfires. Earlier this year, there was a 30 acre wildfire; last year, a total of
three wildfires occurred. In Puerto Rico, 95% of all fires are caused by human activity, either accidental
or criminal. Rangers do not always patrol the beach and, due to lack of personnel, cannot be expected
to constantly monitor beach activities.
In our development of recommendations, Mr. Casanova and Mrs. López had some requests.
They do not wish to add more trash receptacles or place them in conspicuous locations at the beach.
As the DNER has recently decreased in size, the department does not have many available resources
for implementing new strategies. Keeping this in mind is an integral component to suggesting relevant
management strategies for future action.
Page 91
81
Appendix G: Interview with Mike Morel
We had the chance to have a brief exchange with Mike Morel via e-mail. Mr. Morel has been
living in Cabo Rojo since 1973 and has visited La Playuela many times over the decades. He described
the beach as being rarely visited up until approximately the new millennium. He observed that the
Brown Pelican has moved out of the area due to the destruction of their habitat. Stray cats have
become more prevalent, which are a harm to nesting birds and may pose a threat to emerging sea
turtles as well.
In terms of beach usage, he sees an issue in the lack of bathroom facilities, the allowance of
too many people on the beach and poorly managed trash disposal. Overall, Mr. Morel believes the
area is in “dire need of a management plan”.
Page 92
82
Appendix H: Interview with Edgardo González
Our meeting with Mr. Gonzáles took place on the 10th November, 2015 at the DNER Forest
Service office in San Juan. He discouraged using a simple visitor cap as a primary method to restore
the area and told us not to be confined by the LAC model. He suggested exploring alternative
strategies to a visitor cap such as creating a map denoting what should become a zone of restoration
along with an educational campaign to ensure the public will respect the restored areas. We spoke
about the importance of prioritizing the condition of the environment and the benefits of creating
buffer zones between areas of restoration and areas approved for human use. Between the zone of
restoration and areas for visitor use, Mr. Gonzáles emphasized a buffer zone for areas that used to
have wildlife activity, i.e. sea turtle nesting. Along with any restoration strategies, an accompanying
educational program serves to maintain what has been restored through clear explanations of why the
area is protected and the importance of conservation efforts at La Playuela. In any of our suggestions,
specific criteria for the vigilantes monitoring the beach is necessary. He gave the example of closing
the entrance when people on the beach pass the buffer zone. Mr. González suggested including our
recommendations for an administrative order in addition to a carrying capacity.
Page 93
83
Appendix I: Survey Response
These are the results we obtained from the survey we conducted on November 14th and 15th, 2015.
Do you live in Puerto Rico?
Yes No Total Respondents
25 3 28
Percentage 89.29% 10.71% 100.00%
Do you live in Cabo Rojo?
Yes No Total Respondents
7 18 25
Percentage 28.00% 72.00% 100.00%
How long have you been coming to the beach? (Excludes first time visitors)
Less than a year
Less than five years
Less than ten years
More than ten years
Total Respondents
4 5 5 7 21
Percentage 19.05% 23.81% 23.81% 33.33% 100.00%
How often do you come to this beach?
Never been here before
Less than once a month
Once a month
Once a week
More than once a week
Total Respondents
7 12 6 3 0 28
Percentage 25.00% 42.86% 21.43% 10.71% 0.00% 100.00%
How many people do you usually come with?
One person Two persons
Three persons
Four persons Five persons
More than five persons Total Respondents
5 7 5 4 3 4 28
Percentage 17.86% 25.00% 17.86% 14.29% 10.71% 14.29% 100.00%
Page 94
84
How much time do you usually spend on a visit?
One hour or less 1-2 hours 2-3 hours 3-4 hours 4-5 hours
More than 5 hours Total Respondents
1 5 8 6 2 6 28
Percentage 3.57% 17.86% 28.57% 21.43% 7.14% 21.43% 100.00%
How much time do you usually spend on a visit? (Excludes first time visitors)
One hour or less 1-2 hours 2-3 hours 3-4 hours 4-5 hours
More than 5 hours Total Respondents
0 3 6 5 2 5 21
Percentage 0.00% 14.29% 28.57% 23.81% 9.52% 23.81% 100.00%
Are you aware that the beach is part of a natural protected area?
Yes No Total
24 4 28
Percentage 85.71% 14.29% 100.00%
What time(s) of the year do you usually visit the beach? (You may choose multiple answers)
Jan-Mar Apr-Jun Jul-Sep Oct-Dec Total Respondents
7 11 16 8 21
Percentage 33.33% 52.38% 76.19% 38.10% 100.00%
How has the plant life changed at La Playuela since you first visited? (Excludes first time visitors)
It has increased
It has stayed the same
It has decreased Total
6 6 8 20
Percentage 30.00% 30.00% 40.00% 100.00%
Page 95
85
How has the amount of litter changed at La Playuela since you first visited? (Excludes first time visitors)
It has increased
It has stayed the same
It has decreased Total
6 6 9 21
Percentage 28.57% 28.57% 42.86% 100.00%
Compared to your last visit to La Playuela, were your expectations met today? (Excludes first time visitors)
Yes No Total Respondents
16 5 21
Percentage 76.19% 23.81% 100.00%
What activities are you willing to participate in to improve the quality of the beach?
Visiting another beach if the gate is closed
Cleaning up your own trash when leaving
Volunteer to clean up trash on the beach
Taking trash home if the trashcans are full
Staying on the beach and avoiding the tree areas
Adhering to existing paths
12 26 15 23 16 18
Percentage 42.86% 92.86% 53.57% 82.14% 57.14% 64.29%
Not smoking or cooking on the beach
Following posted regulations
Encourage others to follow posted regulations
Using a shuttle service from Boqueron to the beach instead of driving
Avoiding feeding animals
Total Respondents
19 23 17 6 12 28
Percentage 67.86% 82.14% 60.71% 21.43% 42.86% 100.00%
Page 96
86
What activities are you willing to participate in to improve the quality of the beach? (Excludes first time visitors)
Visiting another beach if the gate is closed
Cleaning up your own trash when leaving
Volunteer to clean up trash on the beach
Taking trash home if the trashcans are full
Staying on the beach and avoiding the tree areas
Adhering to existing paths
7 19 12 17 11 13
Percentage 33.33% 90.48% 57.14% 80.95% 52.38% 61.90%
Not smoking or cooking on the beach
Following posted regulations
Encourage others to follow posted regulations
Using a shuttle service from Boqueron to the beach instead of driving
Avoiding feeding animals
Total Respondents
13 17 13 4 9 21
Percentage 61.90% 80.95% 61.90% 19.05% 42.86% 100.00%
What activities are you willing to participate in to improve the quality of the beach? (Only Puerto Ricans)
Visiting another beach if the gate is closed
Cleaning up your own trash when leaving
Volunteer to clean up trash on the beach
Taking trash home if the trashcans are full
Staying on the beach and avoiding the tree areas
Adhering to existing paths
10 23 14 20 13 15
Percentage 40.00% 92.00% 56.00% 80.00% 52.00% 60.00%
Not smoking or cooking on the beach
Following posted regulations
Encourage others to follow posted regulations
Using a shuttle service from Boqueron to the beach instead of driving
Avoiding feeding animals
Total Respondents
16 20 15 5 10 25
Percentage 64.00% 80.00% 60.00% 20.00% 40.00% 100.00%