DEVELOPMENT OF A COARSE WOODY DEBRIS DATABASE FOR THE PRINCE GEORGE TIMBER SUPPLY AREA – FINAL REPORT Prepared for Slocan Group Plateau Forest Products Limited Box 2000 Vanderhoof, B.C. V0J 3A0 Prepared by Timberline Forest Inventory Consultants Ltd. 1579 9 th Avenue Prince George, B.C. V2L 3R8 March 31, 2003
Transcript
DEVELOPMENT OF A COARSE WOODY DEBRIS DATABASE FOR THE PRINCE GEORGE TIMBER SUPPLY AREA –
4.1 Research of Existing Digital Data ............................................................................................... 3 4.2 Digital Data Sources Obtained for Database Development ........................................................ 3
4.2.1 CWD Data - SBSmk1 Biogeoclimatic Unit Study ............................................................... 3 4.2.2 CWD Data - TFL 30 VRI Phase 2 Sampling Program ......................................................... 3 4.2.3 CWD Data - McGregor Model Forest Terrestrial Ecosystem Mapping ............................... 3 4.2.4 CWD Study - Vanderhoof Forest District............................................................................. 4 4.2.5 Post-Harvest CWD Volumes Data - Prince George Forest Region ...................................... 4 4.2.6 Provincial Ecology Program Snag Mensuration Data........................................................... 4
4.3 Database Development ................................................................................................................ 5 5.0 RECOMMENDATIONS.............................................................................................................. 11
5.1 Potential Future Data Sources ................................................................................................... 11 5.2 Database Maintenance and Updates .......................................................................................... 11
LIST OF TABLES Table 1 Data Sources for PG TSA CWD/Snag Database 31/03/03 ......................................................... 4 Table 2 tbl_CWD Attribute Fields in the PG_TSA_CWD_310303 Database ......................................... 5 Table 3 tbl_POST_HARVEST_CWD Attribute Fields in the PG_TSA_CWD_310303 Database......... 7 Table 4 tbl_SNAGS_COMPILED Attribute Fields in the PG_TSA_CWD_310303 Database............... 8 Table 5 tbl_SNAGS_UNCOMPILED Attribute Fields in the PG_TSA_CWD_310303 Database ......... 9
LIST OF APPENDICES Appendix I Data Collection Method Summary – CWD - DeLong Study Appendix II Data Collection Method Summary – Post Harvest CWD Appendix III Data Collection Method Summary - Provincial Ecology Program Mensuration Data –
Snags Appendix IV Data Collection Method Summary - L & M Lumber’s CWD Study - Vanderhoof Forest
District Appendix V Prince George TSA Coarse Woody Database 31/03/03 (CD under separate cover)
DEVELOPMENT OF CWD DATABASE FOR THE PRINCE GEORGE TIMBER SUPPLY AREA - FINAL REPORT 2003
1
1.0 ACKNOWLEDGMENTS This project grew from a concept originally proposed by Dean Marshall of Plateau Forest Products Ltd. Nancy Densmore, John Parminter, Bob Krahn, Craig DeLong, (Ministry of Forests), Paul Sanborn, Bruce Rogers, Patience Byman (UNBC), Eric LoFroth, Doug Wilson (WLAP), Bill Wade (Canfor), Gillian Radcliffe (Madrone Consultants Ltd., Duncan), Stuart Sinclair, Raymond Reilly (Avison), Gilbert Proulx (Alpha Wildlife), Steven Monai (NIVMA), Susan Stevenson and Peet Vahi provided valuable input, direction and contact information. Digital plot data was provided by Nancy Densmore, John Parminter, Doug Wilson, Bob Krahn and Craig DeLong. Funding for the project was provided through the Forest Investment Account. 2.0 INTRODUCTION 2.1 Background Coarse woody debris (CWD) and snag field data has been collected in B.C for a considerable period of time. A range of project specifications, methods and objectives have been used in collecting this data. Most CWD projects in the past have focused on CWD volumes and accumulations in unmanaged stands. However some recent projects have focused on sampling CWD in recently harvested stands (post-harvest CWD). CWD data may be collected as part of Vegetation Resource Inventory phase 2 sampling, NIVMA TRENDS plot installations, or in projects designed specifically to sample CWD in a range of stand types and Biogeoclimatic units (SBSmc2, SBSdk, etc.) Snags, also know as wildlife trees, are standing dead trees. The trees may have succumbed to the normal mortality spiral, or been killed by disease or pest infestation, fire, lightning, etc. Snag data from unmanaged stands has traditionally been collected in cruise plots, some VRI phase 1 and phase 2 plots, and through plots established throughout the province by the Ministry of Forests’ provincial Ecology Program. 2.2 Objectives In February 2003 Plateau Forest Products Ltd. retained Timberline Forest Inventory Consultants Ltd. to obtain and collate CWD and snag digital data currently available in the Prince George Timber Supply Area (PGTSA). The goal of this project is the development of a CWD/snag database to support future sustainable forest management (SFM) initiatives in the PGTSA by Plateau Forest Products or other interested parties. The database would form a CWD/snag resource available to any interested parties for use in biological diversity, biological richness, or other habitat element criteria development for SFM monitoring or modeling activities. The process of developing a PGTSA-level CWD/snag database entailed:
• researching potential sources of suitable digital data; • obtaining permission from the appropriate data custodian to use the data; • obtaining a complete set of the digital data; • modifying the different datasets into a standardized tabular format in a single MS/Access
database; and • producing a report outlining methods employed, data sources, attribute class definitions and
metadata, as well as recommendations for future development of the database.
DEVELOPMENT OF CWD DATABASE FOR THE PRINCE GEORGE TIMBER SUPPLY AREA - FINAL REPORT 2003
2
2.3 Description of Project Area The project area comprises the PGTSA, which lies in the west central interior of B.C. The PGTSA consists of the Vanderhoof, Fort St. James and Prince George Forest Districts. The project sought to obtain digital data for CWD and snags available within the PGTSA. 2.4 Scope No new inventories were conducted for the purposes of this project. Instead, use was made of existing, available digital CWD and snag data from the PGTSA. No data quality assessment was conducted for this project. The quality and accuracy (spatial and thematic) of the digital data to be incorporated into the MS/Access database was assumed to be acceptable. The objectives and specifications of different past projects lead to different suites of attributes being sampled in the field. However, for the objectives of this project, the following CWD and snag attributes were considered key for latter data applications:
• species; • diameter (or DBH for snags); • length (or height for snags); • decay class/ wildlife tree decay class; • tilt angle; • transect length; and • age.
Effort was made to incorporate any other attributes collected into the database. In particular efforts were made to include all ecological attributes (Biogeoclimatic unit, ecosystem unit, elevation, and other site and soil attributes) and stand attributes (stand age, structural stage, basal area, stand volume etc.) To ensure the database was developed in a timely manner, and given certain fiscal considerations, the following assumptions were made regarding potential sources and the nature of the data:
• the snag and CWD data to be obtained would already be in a digital format; • the data would be from the PGTSA only; and • would be made available by government, industry or consulting.
3.0 PROJECT DELIVERABLES The following are the project deliverables to be provided to Plateau Forest Products Ltd.:
• a MicrosoftACCESS 2000 digital database of the digital CWD/snag data currently available for the Prince George Timber Supply Area; and
• a final report outlining project methodology, contracts, data sources and their metadata, attribute definitions, and recommendations for continuing development of the database.
DEVELOPMENT OF CWD DATABASE FOR THE PRINCE GEORGE TIMBER SUPPLY AREA - FINAL REPORT 2003
3
4.0 METHODS The following section briefly outlines the steps taken in developing the CWD/snags database for the PGTSA to the end of March 2003. 4.1 Research of Existing Digital Data Mecailla Christensen of Timberline Forest Inventory Consultants’ Ecology Department in Prince George conducted extensive phone and email communications with resource inventory and wildlife professionals from government, industry and consulting. This occurred in late February and early March 2003. She initially focused on key government and academic professionals. These professionals were aware of CWD sampling activities that had taken place provincially, as well as within the PGTSA itself. These contacts included Nancy Densmore, John Parminter, Bob Krahn and Craig DeLong (MoF), Eric Lofroth and Doug Wilson (WLAP), and Paul Sanborn (UNBC). These contacts either released appropriate digital data in their possession, or referred Timberline to the appropriate custodians of the digital CWD data. Other persons contacted by Timberline included Peet Vahi, formerly of Avison Management Services, Bill Wade (Canfor), Gillian Radcliffe (Madrone Consultants Ltd.), Stuart Sinclair and Raymond Reilly (Avison), Gilbert Proulx (Alpha Wildlife), Patience Byman and Bruce Rogers (UNBC), Steven Monai (NIVMA), Susan Stevenson and Ruth Lloyd. Following contact with these professionals it became clear what appropriate CWD and snag digital data was currently available from the PGTSA. 4.2 Digital Data Sources Obtained for Database Development 4.2.1 CWD Data - SBSmk1 Biogeoclimatic Unit Study This data was provided by Craig DeLong (MoF). The data formed part of a thesis completed by him using field data from 40 plots completed in 1993, 1994 and 1995 in the SBSmk1 Biogeoclimatic unit. This CWD data was collected for unmanaged stands and was summarized in an MS/Excel spreadsheet containing 2316 records. See Appendix I for greater detail on the project and sampling methods. 4.2.2 CWD Data - TFL 30 VRI Phase 2 Sampling Program Bob Krahn and Alf Kivari (MoF) released this VRI Phase 2 CWD data on March 11, 2003. The data consists of 799 records of raw plot data from 96 VRI Phase 2 full vegetation plots. CWD data was collected per VRI phase 2 sampling procedures. Sampling was conducted by Timberline in 2000, with sampling occurring in seven different Biogeoclimatic units throughout TFL 30. CWD sampling followed the procedures prescribed in Vegetation Resources Inventory Ground Sampling Procedures, 1997. 4.2.3 CWD Data - McGregor Model Forest Terrestrial Ecosystem Mapping This CWD field data formed part of the Terrestrial Ecosystem Mapping (TEM) project conducted on Canfor’s Tree Farm License 30 (TFL 30). Ecological data was collected in 1996 and 1997 by crews from a consortium of three ecosystem mapping firms (Oikos, Timberline, and Industrial Forestry Services (IFS)). However, only IFS crews were charged with collecting CWD data for the project. CWD data (131 records) was available for 16 plots located in three Biogeoclimatic units in the TFL. CWD data was captured on Ministry of Forests FS 882(7) CWD Ecosystem Field Forms following procedures as outlined in Luttmerding et al., 1998.
DEVELOPMENT OF CWD DATABASE FOR THE PRINCE GEORGE TIMBER SUPPLY AREA - FINAL REPORT 2003
4
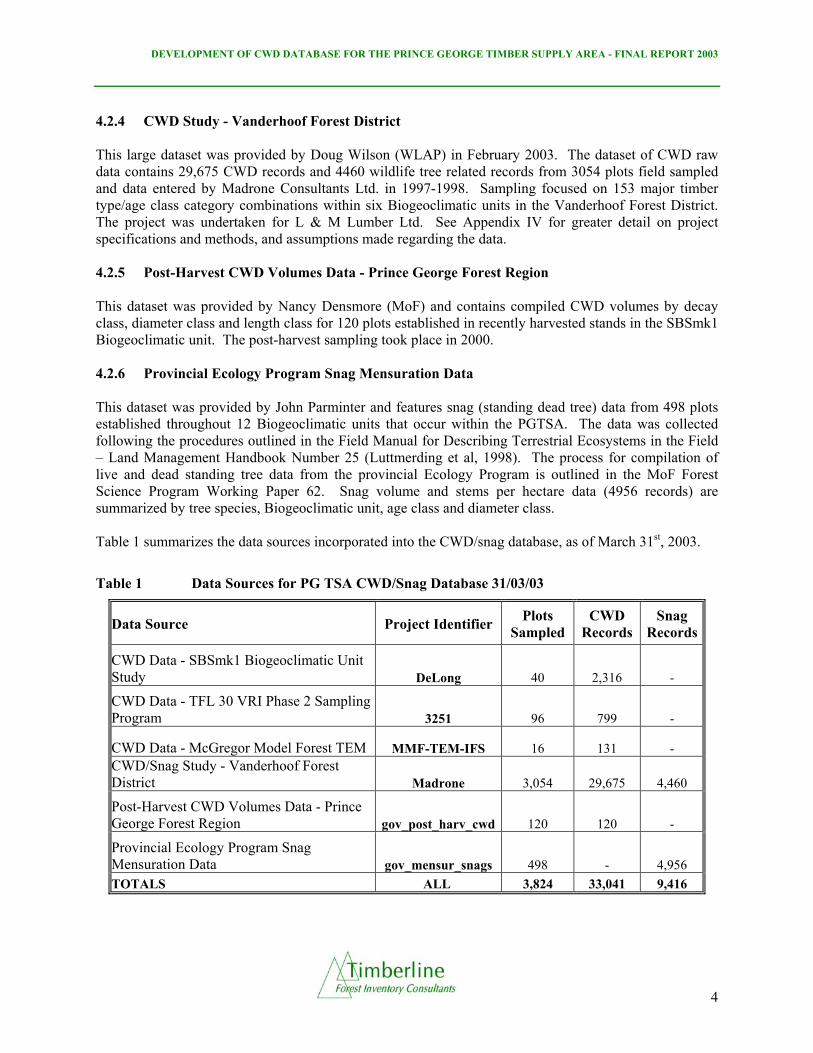
4.2.4 CWD Study - Vanderhoof Forest District This large dataset was provided by Doug Wilson (WLAP) in February 2003. The dataset of CWD raw data contains 29,675 CWD records and 4460 wildlife tree related records from 3054 plots field sampled and data entered by Madrone Consultants Ltd. in 1997-1998. Sampling focused on 153 major timber type/age class category combinations within six Biogeoclimatic units in the Vanderhoof Forest District. The project was undertaken for L & M Lumber Ltd. See Appendix IV for greater detail on project specifications and methods, and assumptions made regarding the data. 4.2.5 Post-Harvest CWD Volumes Data - Prince George Forest Region This dataset was provided by Nancy Densmore (MoF) and contains compiled CWD volumes by decay class, diameter class and length class for 120 plots established in recently harvested stands in the SBSmk1 Biogeoclimatic unit. The post-harvest sampling took place in 2000. 4.2.6 Provincial Ecology Program Snag Mensuration Data This dataset was provided by John Parminter and features snag (standing dead tree) data from 498 plots established throughout 12 Biogeoclimatic units that occur within the PGTSA. The data was collected following the procedures outlined in the Field Manual for Describing Terrestrial Ecosystems in the Field – Land Management Handbook Number 25 (Luttmerding et al, 1998). The process for compilation of live and dead standing tree data from the provincial Ecology Program is outlined in the MoF Forest Science Program Working Paper 62. Snag volume and stems per hectare data (4956 records) are summarized by tree species, Biogeoclimatic unit, age class and diameter class. Table 1 summarizes the data sources incorporated into the CWD/snag database, as of March 31st, 2003.
Table 1 Data Sources for PG TSA CWD/Snag Database 31/03/03
Data Source Project Identifier Plots Sampled
CWD Records
Snag Records
CWD Data - SBSmk1 Biogeoclimatic Unit Study DeLong 40 2,316 -
CWD Data - TFL 30 VRI Phase 2 Sampling Program 3251 96 799 -
CWD Data - McGregor Model Forest TEM MMF-TEM-IFS 16 131 - CWD/Snag Study - Vanderhoof Forest District Madrone 3,054 29,675 4,460
Post-Harvest CWD Volumes Data - Prince George Forest Region gov_post_harv_cwd 120 120 -
Provincial Ecology Program Snag Mensuration Data gov_mensur_snags 498 - 4,956 TOTALS ALL 3,824 33,041 9,416
DEVELOPMENT OF CWD DATABASE FOR THE PRINCE GEORGE TIMBER SUPPLY AREA - FINAL REPORT 2003
5
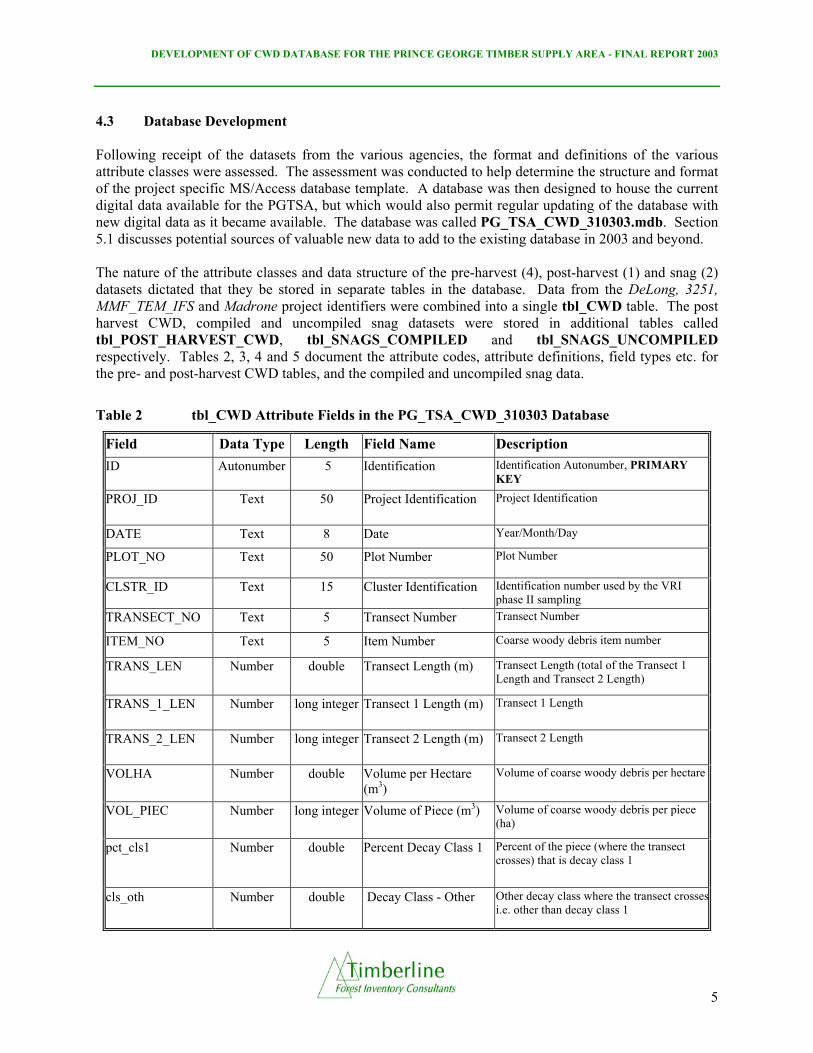
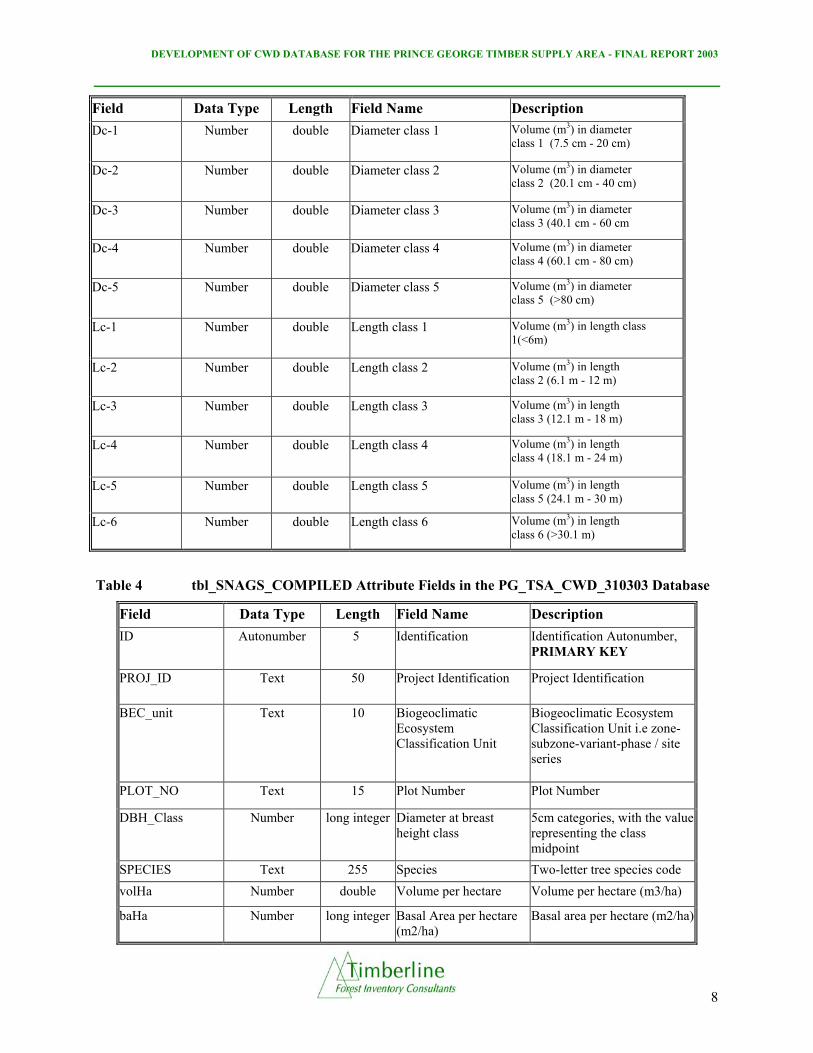
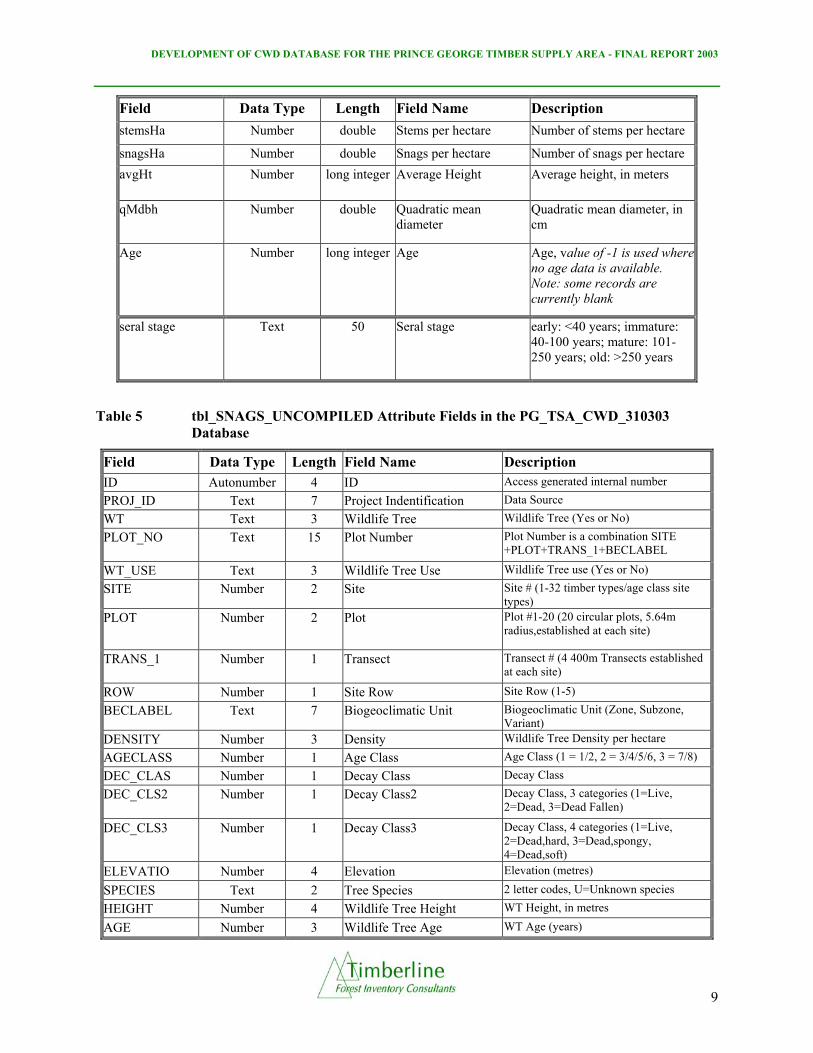
4.3 Database Development Following receipt of the datasets from the various agencies, the format and definitions of the various attribute classes were assessed. The assessment was conducted to help determine the structure and format of the project specific MS/Access database template. A database was then designed to house the current digital data available for the PGTSA, but which would also permit regular updating of the database with new digital data as it became available. The database was called PG_TSA_CWD_310303.mdb. Section 5.1 discusses potential sources of valuable new data to add to the existing database in 2003 and beyond. The nature of the attribute classes and data structure of the pre-harvest (4), post-harvest (1) and snag (2) datasets dictated that they be stored in separate tables in the database. Data from the DeLong, 3251, MMF_TEM_IFS and Madrone project identifiers were combined into a single tbl_CWD table. The post harvest CWD, compiled and uncompiled snag datasets were stored in additional tables called tbl_POST_HARVEST_CWD, tbl_SNAGS_COMPILED and tbl_SNAGS_UNCOMPILED respectively. Tables 2, 3, 4 and 5 document the attribute codes, attribute definitions, field types etc. for the pre- and post-harvest CWD tables, and the compiled and uncompiled snag data.
Table 2 tbl_CWD Attribute Fields in the PG_TSA_CWD_310303 Database
Field Data Type Length Field Name Description ID Autonumber 5 Identification Identification Autonumber, PRIMARY
KEY
PROJ_ID Text 50 Project Identification Project Identification
DATE Text 8 Date Year/Month/Day
PLOT_NO Text 50 Plot Number Plot Number
CLSTR_ID Text 15 Cluster Identification Identification number used by the VRI phase II sampling
TRANSECT_NO Text 5 Transect Number Transect Number
ITEM_NO Text 5 Item Number Coarse woody debris item number
TRANS_LEN Number double Transect Length (m) Transect Length (total of the Transect 1 Length and Transect 2 Length)
TRANS_1_LEN Number long integer Transect 1 Length (m) Transect 1 Length
TRANS_2_LEN Number long integer Transect 2 Length (m) Transect 2 Length
VOLHA Number double Volume per Hectare (m3)
Volume of coarse woody debris per hectare
VOL_PIEC Number long integer Volume of Piece (m3) Volume of coarse woody debris per piece (ha)
pct_cls1 Number double Percent Decay Class 1 Percent of the piece (where the transect crosses) that is decay class 1
cls_oth Number double Decay Class - Other Other decay class where the transect crossesi.e. other than decay class 1
DEVELOPMENT OF CWD DATABASE FOR THE PRINCE GEORGE TIMBER SUPPLY AREA - FINAL REPORT 2003
6
Field Data Type Length Field Name Description DECAY_CLASS Text 1 Decay Class of CWD
piece Refers to large (>7.5 cm diameter) dead and down coarse woody debris at various stages of decomposition, located above the soil, and not self-supporting. Standing trees and stumps are considered self-supporting. It is described by 5 decay classes, from 1 - little decay, to 5 highly decayed/decomposed (RIC, 1997a)
DIAMETER Number double Diameter of CWD piece (cm)
Diameter of coarse woody debris
LENGTH Number double Length of CWD piece (m)
Length of coarse woody debris
ALENGTH Number double Length of CWD Accumulation (m)
Length of Accumulations, in meters (refer to VRI Phase 2 standards)
ANGLE Number double Angle Tilt angle in degrees (pieces only)
ADEPTH Number double Depth of Accumulations (m)
Depth of Accumulations, in meters (refer to VRI Phase 2 standards)
Height off ground (cm)
Number long integer Height above ground (cm)
Height of CWD piece above ground, measured in cm.
SPECIES Text 5 Species Species of coarse woody debris
adj_angle Number double piece_no Number double TYPE1 Number long integer CWD Structural
Function Type 1 Large Concealed Spaces - reproduction / resting / escape (RRE); Keisker (1996)
TYPE2 Number long integer CWD Structural Function Type 2
Small Concealed Spaces at or below ground level - (RRE); Keisker (1996)
TYPE3 Number long integer CWD Structural Function Type 3
Small Concealed Spaces above ground level- (RRE); Keisker (1996)
TYPE4 Number long integer CWD Structural Function Type 4
Long Concealed Spaces - Travel; Keisker (1996)
TYPE5 Number long integer CWD Structural Function Type 5
Large or Elevated, Long Material Clear of vegetation - Travel; Keisker (1996)
TYPE6 Number long integer CWD Structural Function Type 6
Invertebrates in Wood or surrounding litter/humus - Foraging; Keisker (1996)
Zone Text 5 Zone Biogeoclimatic Zone
SubZone Text 5 Subzone Biogeoclimatic Subzone
BEC_VAR Text 5 Variant Biogeoclimatic Variant
BEC_P Text 5 Phase Biogeoclimatic Phase
SiteSeries Text 4 Site Series Site Series Number
Structural Stage Text 2 Structural Stage Structural Stage Code (1998 TEM Standards)
DEVELOPMENT OF CWD DATABASE FOR THE PRINCE GEORGE TIMBER SUPPLY AREA - FINAL REPORT 2003
7
Field Data Type Length Field Name Description BEC_unit Text 15 Biogeoclimatic
Ecosystem Classification Unit
Biogeoclimatic Ecosystem Classification Unit i.e Zone-Subzone-Variant-phase / Site Series
Ecosection Text 5 Ecosection Ecosection
SLOPE Number double Slope Slope (%) gradient of land
ASPECT Number double Aspect The orientation of a slope by means of compass points
ELEV Number double Elevation Elevation in meters above sea level
NtsMapsheet Text 50 NtsMapsheet National Topographic Series location, identification for each mapsheet at all scales
UTMZone Text 50 UTMZone Universal Transverse Mercator: A grid present on most topographic maps and used for quantitative descriptions of locations (RIC 1994)
UTMNorthing Number long integer UTMNorthing UTMNorthing
UTMEasting Number long integer UTMEasting UTMEasting
AirPhotoNum Text 50 Air Photo Number Aerial Photography Number
SiteNotes Text 255 Site Notes Site Notes
Table 3 tbl_POST_HARVEST_CWD Attribute Fields in the PG_TSA_CWD_310303 Database
Field Data Type Length Field Name Description ID Autonumber 5 Identification Identification Autonumber,
PRIMARY KEY
PROJ_ID Text 50 Project Identification Project Identification
PLOT_NO Text 50 Plot Number Plot Number
Zone Text 5 Zone Biogeoclimatic Zone
SubZone Text 5 Subzone Biogeoclimatic Subzone
BEC_VAR Text 5 Variant Biogeoclimatic Variant
BEC_unit Text 10 Biogeoclimatic Ecosystem Classification Unit
Biogeoclimatic Ecosystem Classification Unit i.e Zone-Subzone-Variant-phase / Site Series
Total Volume Number double Total Volume Volume of coarse woody debris (m3)
De-1 Number double Decay class 1 Volume in decay class 1(m3)
De-2 Number double Decay class 2 Volume in decay class 2 (m3)
De-3 Number double Decay class 3 Volume in decay class 3 (m3)
De-4 Number double Decay class 4 Volume in decay class 4 (m3)
De-5 Number double Decay class 5 Volume in decay class 5 (m3)
DEVELOPMENT OF CWD DATABASE FOR THE PRINCE GEORGE TIMBER SUPPLY AREA - FINAL REPORT 2003
8
Field Data Type Length Field Name Description Dc-1 Number double Diameter class 1 Volume (m3) in diameter
class 1 (7.5 cm - 20 cm)
Dc-2 Number double Diameter class 2 Volume (m3) in diameter class 2 (20.1 cm - 40 cm)
Dc-3 Number double Diameter class 3 Volume (m3) in diameter class 3 (40.1 cm - 60 cm
Dc-4 Number double Diameter class 4 Volume (m3) in diameter class 4 (60.1 cm - 80 cm)
Dc-5 Number double Diameter class 5 Volume (m3) in diameter class 5 (>80 cm)
Lc-1 Number double Length class 1 Volume (m3) in length class 1(<6m)
Lc-2 Number double Length class 2 Volume (m3) in length class 2 (6.1 m - 12 m)
Lc-3 Number double Length class 3 Volume (m3) in length class 3 (12.1 m - 18 m)
Lc-4 Number double Length class 4 Volume (m3) in length class 4 (18.1 m - 24 m)
Lc-5 Number double Length class 5 Volume (m3) in length class 5 (24.1 m - 30 m)
Lc-6 Number double Length class 6 Volume (m3) in length class 6 (>30.1 m)
Table 4 tbl_SNAGS_COMPILED Attribute Fields in the PG_TSA_CWD_310303 Database
Field Data Type Length Field Name Description ID Autonumber 5 Identification Identification Autonumber,
PRIMARY KEY
PROJ_ID Text 50 Project Identification Project Identification
BEC_unit Text 10 Biogeoclimatic Ecosystem Classification Unit
Biogeoclimatic Ecosystem Classification Unit i.e zone-subzone-variant-phase / site series
PLOT_NO Text 15 Plot Number Plot Number
DBH_Class Number long integer Diameter at breast height class
5cm categories, with the value representing the class midpoint
SPECIES Text 255 Species Two-letter tree species code volHa Number double Volume per hectare Volume per hectare (m3/ha)
baHa Number long integer Basal Area per hectare (m2/ha)
Basal area per hectare (m2/ha)
DEVELOPMENT OF CWD DATABASE FOR THE PRINCE GEORGE TIMBER SUPPLY AREA - FINAL REPORT 2003
9
Field Data Type Length Field Name Description stemsHa Number double Stems per hectare Number of stems per hectare
snagsHa Number double Snags per hectare Number of snags per hectare avgHt Number long integer Average Height Average height, in meters
qMdbh Number double Quadratic mean diameter
Quadratic mean diameter, in cm
Age Number long integer Age Age, value of -1 is used where no age data is available. Note: some records are currently blank
seral stage Text 50 Seral stage early: <40 years; immature: 40-100 years; mature: 101-250 years; old: >250 years
Table 5 tbl_SNAGS_UNCOMPILED Attribute Fields in the PG_TSA_CWD_310303 Database
Field Data Type Length Field Name Description ID Autonumber 4 ID Access generated internal number PROJ_ID Text 7 Project Indentification Data Source
WT Text 3 Wildlife Tree Wildlife Tree (Yes or No)
PLOT_NO Text 15 Plot Number Plot Number is a combination SITE +PLOT+TRANS_1+BECLABEL
WT_USE Text 3 Wildlife Tree Use Wildlife Tree use (Yes or No)
SITE Number 2 Site Site # (1-32 timber types/age class site types)
PLOT Number 2 Plot Plot #1-20 (20 circular plots, 5.64m radius,established at each site)
TRANS_1 Number 1 Transect Transect # (4 400m Transects established at each site)
ROW Number 1 Site Row Site Row (1-5)
BECLABEL Text 7 Biogeoclimatic Unit Biogeoclimatic Unit (Zone, Subzone, Variant)
DENSITY Number 3 Density Wildlife Tree Density per hectare
AGECLASS Number 1 Age Class Age Class (1 = 1/2, 2 = 3/4/5/6, 3 = 7/8)
DEC_CLAS Number 1 Decay Class Decay Class DEC_CLS2 Number 1 Decay Class2 Decay Class, 3 categories (1=Live,
ROOTCOND Number 1 Root Condition Root Condition (1=Dangerous, 2=Safe) CROWNCON Number 1 Crown Condition Crown Condition
SAPWOOD Number 1 Sapwood Sapwood
HEARTWOO Number 1 Heartwood Heartwood DEADLIMB Text 1 Dead Limbs Dead Limbs
HAZARDOU Text 1 Hazardous Top Hazardous Top
WITCHES Text 1 Witches Broom Witches Broom SPLTRUNK Text 1 Split Trunk Split Trunk TREEDAMG Text 1 Tree Damage Tree Damage CANKERS Text 1 Butt/Stem Cankers Butt/Stem Cankers
FUNGUS Text 1 Fungal Bodies Fungal Bodies
SLOUGHIN Text 1 Sloughing Bark Sloughing Bark BROKETOP Text 1 Broken Top Broken Top
INSECTS Number 1 Insects Insects
TREATMEN Number 1 Treatment Injuries Treatment Injuries VEGETATI Number 1 Vegetation problems Vegetation problems
WILDLIFE Number 1 Wildlife Damage Wildlife Damage
DISEASE Number 1 Disease Disease ABIOTIC Number 1 Abiotic Abiotic
OPENEST Number 1 Open Nest Open Nest
CAVNEST Number 1 Cavity Nest Cavity Nest REC_FEED Number 1 Recent Feeding Recent Feeding
PER_RST Number 1 Perching/Roosting Perching/Roosting
DEN_NEST Number 1 Denning/Nesting Denning/Nesting MARKTREE Number 1 Mark Tree Mark Tree
TYPE1-10 Number 1 Wildlife Tree Type 10 Types identified per Keisker 2000 (Working Paper 50, page 18) 1=Yes, 0=No
LEAN Number 2 Tree Lean % lean from vertical
HAB_RATE Text 6 Wildlife Habitat Rating Habitat Rating (Low, Medium, or High)
SUM_DEFE Number 1 Total Number of Tree Defects
Total Tree Defects (Sum)
SUM_USE Number 1 Total Wildlife Tree Usage Total Wildlife Tree Usage (Sum)
DEAD_CLS Text 1 Cause of Tree Death Cause of Death Class (1=Insects, 2=Treatment Injuries, 3=Vegetation problems, 4=Wildlife Damage, 5=Disease, 6=Abiotic)
DEVELOPMENT OF CWD DATABASE FOR THE PRINCE GEORGE TIMBER SUPPLY AREA - FINAL REPORT 2003
11
5.0 RECOMMENDATIONS 5.1 Potential Future Data Sources The PG TSA CWD/snag database has been developed with an assumption that it will be continually updated with additional regional CWD or snag digital data as this information becomes available in the coming months and years. Research into various data sources revealed that a provincial-level CWD database containing CWD volume summaries by plot is expected to be released in April or May, 2003. This has potential to be a very valuable source of compiled CWD data. The database would contain CWD volume and piece summaries by diameter class, decay class and length class for field plots throughout the province, with related ecological and stand information, if available. Nancy Densmore (MoF) and Ruth Lloyd (Consultant) have been very active in this initiative. Potential exists to obtain digital data from a number of “wet belt” studies conducted in the PG TSA by Susan Stevenson and Mike Jull (Bruce Rogers, pers. comm.). These studies collected pre- and post-harvest CWD data from stands in the ESSF and ICH Biogeoclimatic units. There are a number of known or potential sources of digital data that may be incorporated into the current database. Time constraints and data availability precluded some digital CWD data from being incorporated into the current version. The Northern Interior Vegetation Management Association’s (NIVMA) TRENDS database is a valuable potential source of CWD data. The NIVMA CWD sampling methodology is modified somewhat from the VRI Ground Sampling Procedures but uses a line intercept approach to sample a total of 30m of ground along two transects. Permission from a NIVMA member would be required before the data could be released. It is estimated that data is currently available in digital format for 150 NIVMA CWD plots throughout the PG TSA. Some recommendations that can enhance available snag and CWD data include:
• conducting a project to extracted snag data from existing cruise compilations and linking this snag data to stand and ecological attributes;
• adjusting cruise plots procedures slightly to permit collection of specific wildlife tree data for the dead trees contained in the prism sweep; and
• collecting empirical data (snags per hectare, DBH, species, wildlife tree code etc.) for dead trees during any future VRI phase 1 field sampling conducted in the PG TSA. Most phase 1 sampling currently collects empirical data on live trees, with the focus of sampling live stems that can be interpreted from air photos.
5.2 Database Maintenance and Updates Much of the CWD and snag data in the database as it currently exists in raw plot form. It is recommended that this data be compiled to produce CWD volumes by decay class, diameter class and length class (where possible). This will enhance its utility for resource professionals in SFM planning and interpretations. This compilation should follow the format and methods used for the provincial database that will become available shortly. This will facilitate the incorporation of the provincial data into the PG TSA database, and standardize the two datasets.
DEVELOPMENT OF CWD DATABASE FOR THE PRINCE GEORGE TIMBER SUPPLY AREA - FINAL REPORT 2003
12
6.0 REFERENCES B.C. Ministry of Environment, Lands, and Parks and B.C. Ministry of Forests. 1998. Field Manual for
Describing Terrestrial Ecosystems. Land Management Handbook 25. B.C. Ministry of Forests. 2001. Mensuration data from the provincial ecology program. For. Sci. Prog.,
B.C. Min. For., Victoria, B.C. Work. Pap. 62/2001. B.C. Ministry of Forests, Resources Inventory Branch. 1997. Vegetation Resources Inventory Ground
Sampling Procedures. B.C. Min. For., Resources Inventory Branch, Victoria, B.C. DeLong, C. and W.B. Kessler, W.B. 2000. Ecological characteristics of mature forest remnants left by
wildfire. Forest Ecology and Management 131:93-106. Lofroth, E. 1992. Measurement of habitat elements at the stand level. Pages 25-29 in L. Ramsey, ed.
Methodology for monitoring wildlife diversity in B.C. forests. Proc. Workshop, 27 Feb 1992. B.C. Min. Env., Lands and Parks, Victoria, BC.
Luttmerding, H.A., D.A. Demarchi, E.C. Lea, D.V. Meidinger, and T. Vold (editors). 1990. Describing
ecosystems in the field. 2nd ed. B.C. Min. Environ., Lands and Parks and B.C. Min. For., Victoria, B.C. Ministry of Environment Manual No. 11.
Madrone Consultants Ltd. 1999. Inventories of Wildlife Trees and Coarse Woody Debris Resources and
Associated Birds and Small Mammals in the Major Timber Types in the Vanderhoof Forest District. Final Report.
Trowbridge, R., B. Hawkes, A. Macadam, and J. Parminter. 1989. Field handbook for prescribed fire
assessments in British Columbia: Logging Slash Fuels. FRDA Handbook 001. 63p. van Wagner, C.E. 1968. The line intersect method in forest fuel sampling. For. Sci. 14: 20-26.
DEVELOPMENT OF CWD DATABASE FOR THE PRINCE GEORGE TIMBER SUPPLY AREA - FINAL REPORT 2003
APPENDICES
DEVELOPMENT OF CWD DATABASE FOR THE PRINCE GEORGE TIMBER SUPPLY AREA - FINAL REPORT 2003
APPENDIX I
DATA COLLECTION METHODS SUMMARY
CWD – DeLong Study
DEVELOPMENT OF CWD DATABASE FOR THE PRINCE GEORGE TIMBER SUPPLY AREA - FINAL REPORT 2003
SAMPLING METHODS USED FOR DELONG PROJECT IN SBSmk1
This study by Craig DeLong focused on island remnants as defined as a patch of older forest
surrounded by younger forest where the size of the patch is not larger than 10 hectares. The definition
invokes the findings of DeLong and Tanner (1996) that wildfires less than 1000 ha in total area have
remnant sizes of < 10 ha.
DeLong used quadrant plot sampling techniques to compare various ecological attributes between
island remnants and large contiguous forest patches. He produced maps of stand age for the whole study
area and more detailed maps of individual wildfires to identify potential sample sites. Potential island
remnant sample locations were also outlined on air photos to assist in field location.
The following selection criteria was used to minimize between-site variation in the sample.
1) sites must have been mesic in moisture regime and range from poor to medium in nutrient
regime;
2) sites must be classified into either the PlSb - Feathermoss site series (SBSmk1/06) or Sx -
Huckleberry site series (SBSmk1/01) (DeLong et. al. 1993);
3) sites must occur on morainal or lacustrine soils;
4) slope position must be either level or mid-slope;
5) slope gradient must be less than 20%;
6) sites must have no evidence of prior tree cutting due to harvesting or thinning operations; and
7) sample plots must be at least one tree length (approx. 20-30m) from obvious clearings, stands of
another age, or other stands not meeting these criteria.
Once a suitable stand was located a 30m by 30m plot was established in the stand at the first
available location that satisfied the selection criteria. The method of plot location approximates the relevé
method, which represents a compromise between complete subjectivity and complete randomness
(Barbour et. al. 1987). A total of 40 plots were sampled, 10 each in three different age classes of fire
origin stands (40-70, 71-140, 141+) and 10 in island remnants within the 40-70 year old stands. Sampling
occurred between May and September in 1994 and 1995.
DEVELOPMENT OF CWD DATABASE FOR THE PRINCE GEORGE TIMBER SUPPLY AREA - FINAL REPORT 2003
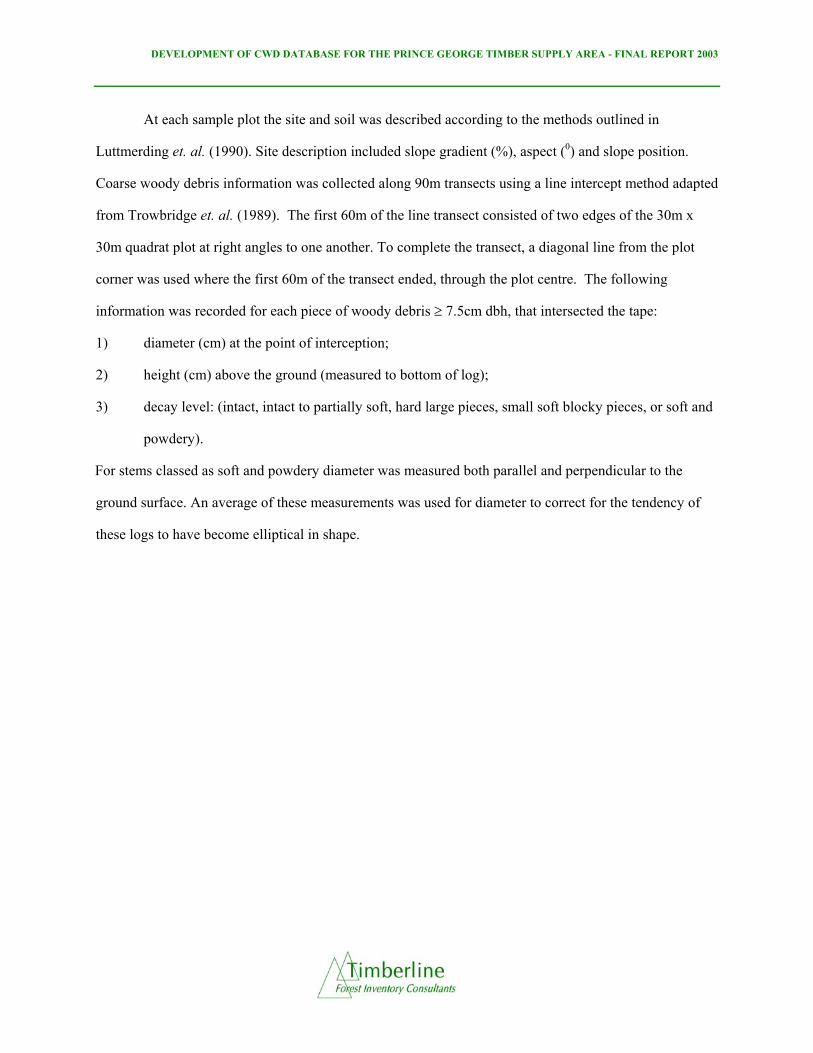
At each sample plot the site and soil was described according to the methods outlined in
Luttmerding et. al. (1990). Site description included slope gradient (%), aspect (0) and slope position.
Coarse woody debris information was collected along 90m transects using a line intercept method adapted
from Trowbridge et. al. (1989). The first 60m of the line transect consisted of two edges of the 30m x
30m quadrat plot at right angles to one another. To complete the transect, a diagonal line from the plot
corner was used where the first 60m of the transect ended, through the plot centre. The following
information was recorded for each piece of woody debris ≥ 7.5cm dbh, that intersected the tape:
1) diameter (cm) at the point of interception;
2) height (cm) above the ground (measured to bottom of log);
3) decay level: (intact, intact to partially soft, hard large pieces, small soft blocky pieces, or soft and
powdery).
For stems classed as soft and powdery diameter was measured both parallel and perpendicular to the
ground surface. An average of these measurements was used for diameter to correct for the tendency of
these logs to have become elliptical in shape.
DEVELOPMENT OF CWD DATABASE FOR THE PRINCE GEORGE TIMBER SUPPLY AREA - FINAL REPORT 2003
APPENDIX II
DATA COLLECTION METHODS SUMMARY POST HARVEST CWD
DEVELOPMENT OF CWD DATABASE FOR THE PRINCE GEORGE TIMBER SUPPLY AREA - FINAL REPORT 2003
FIELD MEASUREMENTS FOR POST-HARVEST CWD SAMPLING The Provincial Woody Debris Committee developed a long-term woody debris strategy for B.C. This included an extensive pilot project carried out in three interior forest regions in 2001, to examine Biogeoclimatic units that might be considered to be most at risk of compromising site sustainability and biodiversity through removal of woody material. This entailed, in part, the assessment of volume, decay and length class distribution of CWD remaining on a site after clearcut or clearcut with reserves harvesting. Field Procedures A 100 by 100 m grid overlay was used to generate random, systematic sample points to cover the area of the block. Sampling transects originated in a random, systematic manner from each sample point. A modification of the line intersect method (van Wagner 1968, Trowbridge et al., 1989) was used so that each plot consisted of two spokes, with each spoke having three 50m transects. The transects were separated from each other by a 120° angle. A total transect length of 300m was sampled at each plot. The following was collected for each transect:
• plot number; • transect number; • bearing; • slope distance; • slope angle (correct for slope in the field); and • horizontal distance.
All pieces along the transect ≥ 10cm in diameter were tallied and measured following Lofroth (1992). The following information was collected for each piece:
• diameter at intersection of transect, (large end diameter may be collected if requested regionally); • estimated length class (of portion of log ≥ 10cm diameter) Vegetation Resources Inventory (VRI)
• tilt angle if greater than 15°; • species; • decay Class (5 classes); and • hollow or Solid (if hollow, inside diameter and length of hollow)
DEVELOPMENT OF CWD DATABASE FOR THE PRINCE GEORGE TIMBER SUPPLY AREA - FINAL REPORT 2003
APPENDIX III
DATA COLLECTION METHODS SUMMARY Provincial Ecology Program Mensuration Data - Snags
DEVELOPMENT OF CWD DATABASE FOR THE PRINCE GEORGE TIMBER SUPPLY AREA - FINAL REPORT 2003
Background
Mensuration data were collected as part of the standard ecosystem plot description used by the provincial ecology program beginning in the mid-1970s. A full suite of site, soil, vegetation, Mensuration, wildlife and range data was used to develop the Biogeoclimatic Ecosystem Classification (BEC) system. Mensuration sampling focused on paired prism plots randomly located from the centre of the ecology plot. Tallied trees included all live and dead trees greater than 7.5cm DBH, and were measured for species, DBH, tree class, pathological remarks and crown class. The compiled results for each ecology plot represent the average of the two prism plots that were compiled separately. Compilation results included gross volume per hectare, stems per hectare, average volume per tree, average DBH, and average height, by species for each plot. The compilation generated stand and stock data for each plot, including plot ID, species, and DBH class (5cm classes, with class names representing the midpoint), with live stems per hectare, gross volume per hectare, average height, quadratic mean DBH, basal area per hectare and snags per hectare by species and DBH class. Age was also generated where available in the source data.
DEVELOPMENT OF CWD DATABASE FOR THE PRINCE GEORGE TIMBER SUPPLY AREA - FINAL REPORT 2003
APPENDIX IV
DATA COLLECTION METHODS SUMMARY L & M Lumber’s CWD Study - Vanderhoof Forest District
DEVELOPMENT OF CWD DATABASE FOR THE PRINCE GEORGE TIMBER SUPPLY AREA - FINAL REPORT 2003
Plot Establishment and Sampling Methods by Madrone The Madrone data contained various fields that would be difficult to understand in the absence of the project final report. As such, fields were simplified to make it comprehensible in the final CWD Access database. Revisions were made to plot location information and transect number information. In the original dataset, all locations of the plots (BGC unit locations) were coded, making it difficult to tell what the plot’s site identification was. A certain amount of decoding of database fields and attributes was required based on patterns observed in the dataset provided by Doug Wilson (WLAP). A total of 153 sample sites were established during this project. These sample sites fell into one of 32 sample strata (sites) across a range of BGC units. This was not explicitly stated in the report, but is evident from the dataset. A total of six BGC units were examined (SBSdk, SBSmc3, SBSmc2, SBSdw2, SBSdw3, and ESSFmv1). While the target may initially have been to sample each stratum in each BGC unit, this did not actually take place. Each sample site was composed of four 400m long transects, running parallel to each other (see figure on following page). There were 20 plot centres established systematically along the transects. The 20 plots were not always evenly distributed on the transect lines (i.e. 5 on each transect), as was originally mentioned in the Madrone Report’s materials and methods section. Inside the 20 plots, two transects (each 24 m in length) were created in order to take measurements of CWD. A random azimuth was chosen for the first transect and the second was positioned 90 degrees from the first. Wildlife tree (snag) information was sampled in each of the 20 circular plots (5.64m radius). Snags over 10cm DBH were tallied and detailed information about each wildlife tree was collected. Plot numbering for these complex plot installations was somewhat confusing in the Madrone dataset. However, close examination of the internal data in the various Excel fields (especially transect-related fields) led to the differentiation of the various site/plot/transect combinations. Transect numbering in the CWD Access database was made unique to ensure the two types of transects completed during the study would not be confused with each other. Tree species and BGC units had number codes that needed to be translated into the more common letter codes by means of a key.
DEVELOPMENT OF CWD DATABASE FOR THE PRINCE GEORGE TIMBER SUPPLY AREA - FINAL REPORT 2003
APPENDIX V
PRINCE GEORGE TSA COARSE WOODY DEBRIS DATABASE 31/03/03