AIAA 2000-0504 Development of a Flush Airdata Sensing System on a Sharp-Nosed Vehicle for Flight at Mach 3 to 8 Mark C. Davis, Joseph W. Pahle, John Terry White, and Laurie A. Marshall NASA Dryden Flight Research Center Edwards, California Michael J. Mashburn Micro Craft, Inc. Tullahoma, Tennessee Rick Franks Sverdrup Corp. Arnold Air Force Base, Tennessee 38th Aerospace Sciences Meeting and Exhibit 10–13 January 2000 / Reno, NV For permission to copy or republish, contact the American Institute of Aeronautics and Astronautics, 1801 Alexander Bell Drive, Suite 500, Reston, Virginia 22091.
Transcript
For permission to copy or republish, contact the American Institute of Aeronautics and Astronautics370 L'Enfant Promenade, S.W., Washington, D.C. 20024
AIAA 2000-0504
Development of a Flush Airdata Sensing System on a Sharp-Nosed Vehicle for Flight at Mach 3 to 8
Mark C. Davis, Joseph W. Pahle,John Terry White, and Laurie A. MarshallNASA Dryden Flight Research Center Edwards, California
Michael J. MashburnMicro Craft, Inc.Tullahoma, Tennessee
Rick FranksSverdrup Corp.Arnold Air Force Base, Tennessee
38th Aerospace Sciences Meeting and Exhibit
10–13 January 2000 / Reno, NV
For permission to copy or republish, contact the American Institute of Aeronautics and Astronautics, 1801 Alexander Bell Drive, Suite 500, Reston, Virginia 22091.
DEVELOPMENT OF A FLUSH AIRDATA SENSING SYSTEM ON A SHARP-NOSED VEHICLE FOR FLIGHT AT MACH 3 TO 8
Mark C. Davis,* Joseph W. Pahle,† John Terry White,‡ and Laurie A. Marshall§
NASA Dryden Flight Research CenterEdwards, California
Michael J. Mashburn¶
Micro Craft, Inc.Tullahoma, Tennessee
Rick Franks#
Sverdrup Corp.Arnold Air Force Base, Tennessee
Abstract
NASA Dryden Flight Research Center has developa flush airdata sensing (FADS) system on a sharp-noswedge-shaped vehicle. This paper details the design calibration of a real-time angle-of-attack estimatioscheme developed to meet the onboard airdmeasurement requirements for a research vehequipped with a supersonic-combustion ramjet engiThe FADS system has been designed to performflights at Mach 3–8 and at –6°–12° angle of attack. Tdescription of the FADS architecture includes polayout, pneumatic design, and hardware integratioPredictive models of static and dynamic performanare compared with wind-tunnel results across the Maand angle-of-attack range. Results indicate that staangle-of-attack accuracy and pneumatic lag can adequately characterized and incorporated into a retime algorithm.
Copyright 2000 by the American Institute of Aeronautics anAstronautics, Inc. No copyright is asserted in the United States unTitle 17, U.S. Code. The U.S. Government has a royalty-free liceto exercise all rights under the copyright claimed herein for Govemental purposes. All other rights are reserved by the copyright own
dder
nsern-er.
eded,
andnataiclene. inhertn.
cechticbeal-
Nomenclature
Acronyms
FADS flush airdata sensing
INS inertial navigation system
PPT precision pressure transducer
SCRamjet supersonic-combustion ramjet
Symbols
transducer calibration as a function of Mach number
D diameter of lines from port to transducer,in.
angle of attack at front of vehicle, deg
angle of attack at rear of vehicle, deg
angle of attack for pseudodifferential transducers, deg
g acceleration caused by gravity, ft/sec2
i arbitrary integer
k lag constant
L pneumatic line
L length, ft
PPPT measured pressure at transducer, lbf/ft2
Pport measured pressure at port, lbf/ft2
dynamic pressure, lbf/ft2
CPPT
FADSα1
FADSα2
FADSα3
q
ronautics and Astronautics
ceen
bleacke toeic
e, ajet
of anrs,ics
ofg
t ofsingemht
the ofrtsetoveinee
theckteeda
n ofers
q1 weighting function
s Laplace frequency variable
Ve effective volume of the measurement system, ft3
X/L body axis location
angle of attack, deg
bias angle of attack, deg
reference angle of attack derived from the FADS algorithm, deg
αINS angle of attack derived from the inertial navigation system, deg
µ dynamic viscosity of the air in the line, lbm/(ft/sec)
τ time constant
Introduction
The National Aeronautics and Space Administrationand aerospace community are developing air-breathingpropulsion systems capable of flight at hypersonicspeeds. One promising concept is the supersonic-combustion ramjet (SCRamjet) engine.1 The currentdesign of SCRamjets allows supersonic combustion tooccur only in a narrow operating range.
Dynamic pressure and angle of attack aretwo of the critical parameters that determine the flowinto the engine inlet. Accurate measurement of theseparameters is desired for real-time control and isrequired for postflight analysis. Accurately estimatingangle of attack from the inertial navigation system (INS)alone is difficult because of atmospheric variations andsensor installation and performance.2 This requirementled to the development of a nonintrusive system, theflush airdata sensing (FADS) system, that has the abilityto measure angle of attack in real time and allow theremainder of the airdata parameters to be reconstructedpostflight.
The FADS concept uses a matrix of flush surfaports to infer airdata. The FADS system has besuccessfully applied to a variety of blunt forebodies,3–7
and one feasibility study1 has been conducted for asharp-nosed, hypersonic configuration. To be a viasystem, the FADS system must measure angle of attto within 0.5° (because of the criticality of incidencangle of the engine inlet); measure dynamic pressurewithin 5 percent for postflight analysis; and survive thintense thermal environment in which a hypersonvehicle flies.8 This paper presents the architecturestimation algorithms, and wind-tunnel calibration ofFADS system intended for a sharp-nosed, SCRamtest vehicle.
Note that use of trade names or names manufacturers in this document does not constituteofficial endorsement of such products or manufactureeither expressed or implied, by the National Aeronautand Space Administration.
Flush Airdata Sensing System Architecture Overview
This section describes the pneumatic architecturethe FADS system. The port layout, the sensintransducer characteristics, and the pneumatic layouthe pressure sensing system are described. The sencomponents that comprise the real-time airdata systare distinguished from those used for the postfligalgorithm.
Pressure Port Layout
A matrix of nine pressure ports is used to sense airdata parameters. Figure 1 shows the locationsthese ports on the vehicle forebody. Four po(indicated by the highlighted symbols along thcenterline of the forebody in figure 1) are used indirectly sense the angle of attack. The remaining fipressure ports (indicated by the open symbols figure 1) are used for postflight evaluation of thremaining airdata parameters. To save real-timbandwidth and ensure a high data throughput, system architecture decouples the angle-of-attaestimation from the remainder of the postflighalgorithm. Only the pressure data from thangle-of-attack ports is used in real time and combinwith the inertial angle of attack to estimate high-fidelity, vehicle angle of attack.
Pressure Transducers
The nine pressures are sensed using a combinatioabsolute and differential precision pressure transduc
α
αest
αFADS
α true
β
∆
q( ) α( )
2American Institute of Aeronautics and Astronautics
ime
ndticsogsry
theer
portd a
ts.
e are beeseng in
(PPTs). Figure 2 shows the pneumatic layout of thesesensors. Differences between the pairs of upper andlower ramp surface pressures (ports 2 and 4; ports 3and 5) are sensed by differential pressure transducers toprovide high accuracy and a high-resolutionmeasurement for use by the real-time algorithm. Eachdifferential pair is also “teed” to an absolute pressuretransducer that allows the absolute pressure level at eachport to be sensed or calculated. The forebody side ports(ports 6 and 8; ports 7 and 9), although not used by thereal-time algorithm, are sensed in a similar manner. Thesingle stagnation pressure (port 1) is sensed using anabsolute sensor.
All of the pressure transducers have serial digitaloutputs, which are connected through an individuallyaddressable, multidrop RS-485 bus. The sensors alsoprovide an optional analog output. The PPT digitaloutput is the primary signal used in the real-time andpostflight algorithms. The analog signal is recorded onlyfor postflight analysis and provides data redundancy ifthe digital signal fails. The pressure transducers use apiezo-resistive bridge technology and have a built-indigital temperature compensation over a range from –40to 80 °C.
The manufacturer’s specified accuracy for the sensoroutput for both digital and analog is 0.05 percent of fullscale.9 Laboratory tests conducted at the NASA DrydenFlight Research Center (Edwards, California) haveshown the sensors to be accurate to within 0.025 percentof the full-scale value. Table 1 shows the types ofsensors used in this design and the sensor full-scale
ranges. The sensors used as a part of the real-tsystem architecture are indicated with an asterisk.
Pneumatic Layout
Table 2 shows the line lengths, tubing diameters, aentrapped volumes for the various pneumacomponents (fig. 2). The effective volume in table 2 alincludes the entrapped volume of the pneumatic fittinand the transducer volumes. Results from preliminaoblique shock theory10 and engineering judgment wereused in the placement of the pressure ports on vehicle. The pressure port size on the upper and lowramp surfaces was 0.04-in. diameter. The pressure size on the leading edge and sides of the vehicle hadiameter of 0.02 in. to limit stagnation heating effecAll ports were drilled normal to the surface.
The “teed” pneumatic lines required to obtain thabsolute pressure levels for ports 3 and 5 and 6 and 8a cause for concern because of latencies that mayintroduced into the sensed pressure signals. Thlatencies are especially critical for the real-time sensisystem. The effects of these latencies will be analyzeddetail in the Results and Discussion section.
Table 1. Sensor type at each port location.
Sensoridentification
PortParameter
sensedSensortype
Range,lbf/in2
PPT 1 1Total
pressureAbsolute 0–15
PPT 2 * 2, 4 α Differential ±5
PPT 3 * 2 α Absolute 0–15
PPT 4 * 3, 5 α Differential ±5
PPT 5 * 5 α Absolute 0–15
PPT 6 6, 8 β Differential ±5
PPT 7 6 β Absolute 0–15
PPT 8 7, 9 β Differential ±5
PPT 9 9 β Absolute 0–15
Table 2. Pneumatic layout characteristics.
Linenumber
Linelength, in.
Tubediameter, in.
Volume,in3
L1A 84 0.063 0.3502
L2A 45 0.063 0.2381
L2B 37 0.063 0.2049
L3A 44 0.063 0.2340
L4A 16 0.063 0.1176
L4B 25 0.063 0.1550
L5A 24 0.063 0.1509
L6A 36 0.063 0.2007
L6B 38 0.063 0.2090
L7A 37 0.063 0.2049
L8A 36 0.063 0.2007
L8B 24 0.063 0.1509
L9A 35 0.063 0.1966
3American Institute of Aeronautics and Astronautics
atats.s A
lesitherele-lipereta atec.
k-S-
mnchyyeric
lyle,orsn.re
Wind-Tunnel Facilities, Equipment, Test Conditions, and Procedures
This section describes the facilities, procedures,equipment, and tests conditions for a series ofwind-tunnel experiments conducted to evaluate theFADS system. The basic measurement systems wereevaluated over a broad range of Mach numbers, and adata set allowing a preliminary airdata calibration wasobtained.
Facilities
All wind-tunnel testing occurred at the ArnoldEngineering Development Center (Arnold Air ForceBase, Tennessee) Von Karman Facility in tunnels A andB. Tunnel A is a 40- by 40-in., continuous,closed-circuit, variable-density, supersonic wind tunnelwith a Mach number range of 1.5 to 5.5. The tunnel isserved by a main compressor system that provides awide range of mass flow and stagnation pressures to amaximum of 195 lbf/in2 absolute.11
Tunnel B is a continuous, closed-circuit, hypersonicwind tunnel with a 50-in.–diameter test section. TunnelB uses two axisymmetric, contoured nozzles thatprovide two fixed Mach numbers of 6 and 8 with anoperating pressure range of 20 to 300 lbf/in2 absolute atMach 6 and 50 to 900 lbf/in2 absolute at Mach 8.11
Wind-Tunnel Test Equipment
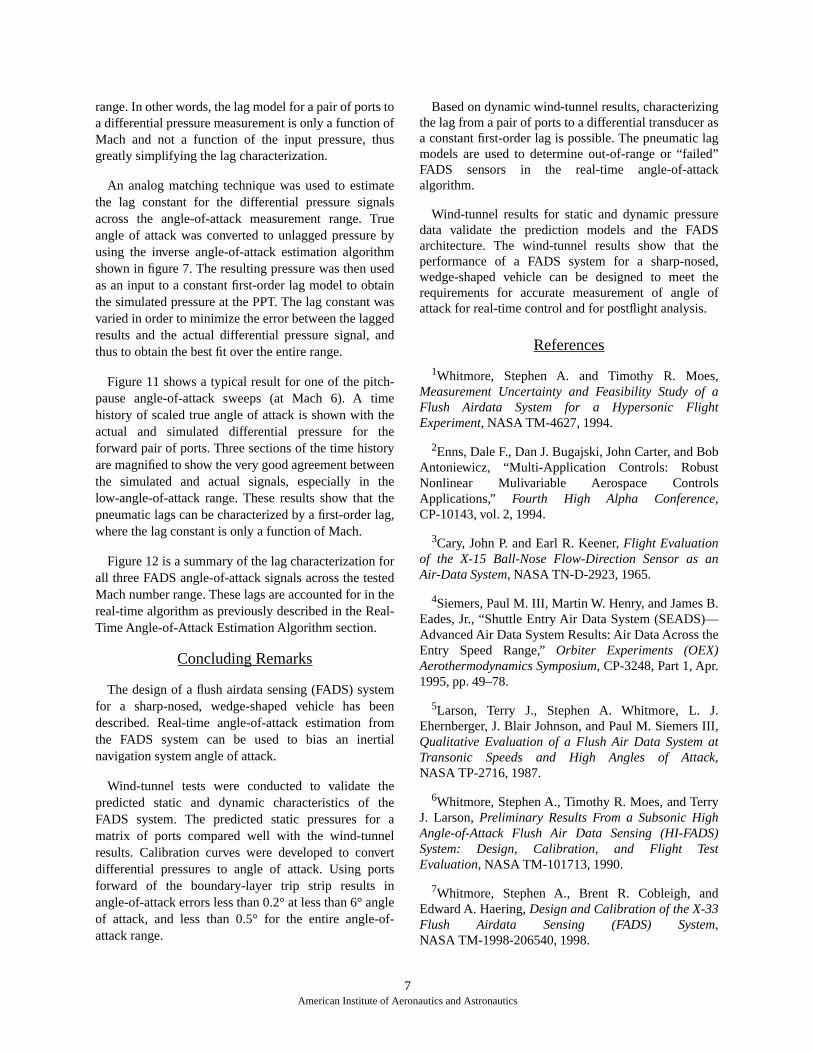
Figure 3 shows the internal layout of the test articlewith nine PPTs and one inclinometer. The sensors wereenclosed in cooling jackets to ensure that the sensoroperating limits were not exceeded during the test. Aninclinometer measured the model incidence angle over arange of ±14.5° with an accuracy of 0.02-percent fullscale. The model used in the test was an 80-percent–scale model of the SCRamjet test vehicle forebody. Themodel was designed for hypersonic testing for extendedperiods. The model was milled from solid bar stock ofheat-treated and solution-annealed 316 stainless steel.12
The model had a boundary-layer trip strip installed justaft of pressure port 4 (fig. 1). The wind-tunnelpneumatic system was designed to duplicate the flighthardware.
Analog and digital outputs from the PPTs weresensed during the wind-tunnel tests. Digital data werepolled from all PPTs at a rate of 48.8 samples/sec.Analog data were obtained using a 16-bit analog-to-digital converter unit controlled by the wind-tunnel
computer. Figure 4 shows a schematic of the dacquisition system used for the wind-tunnel tesFigures 5 and 6 show the model as mounted in tunneland B for testing.
Wind-Tunnel Test Procedures and Conditions
Wind-tunnel data were taken during constant angof attack and sideslip and during pitch-pause runs wsweeps in angles of attack and sideslip. Data wobtained over a Mach number range of 3 to 8, an angof-attack range of –6° to 12°, and an angle-of-sidesrange of ±3°. In the pitch-pause maneuvers, data wobtained in 1-deg increments. Angle-of-sideslip dawere obtained in 0.5-deg increments. The dwell timeeach pitch-pause data point was approximately 15 sTable 3 shows the wind-tunnel conditions.
Real-Time Angle-of-Attack Estimation Algorithm
The primary function of the real-time angle-of-attacestimation algorithm is to provide a pneumaticallybased measurement estimate of the bias in the INderived angle of attack. The real-time FADS algorithis composed of two basic routines, FADS calibratioand signal selection. These algorithms require Manumber, which is provided by the INS. At relativelhigh velocities, inertial Mach number is sufficientlaccurate when used with a representative atmosphmodel.
For the sensor configuration shown in figure 2, onthree unique angle-of-attack estimates are availabalthough four pressure ports and four pressure sensare designated for real-time angle-of-attack estimatioThe individual angle-of-attack measurements aas follows:
(1)
where α1 is the forward angle-of-attack estimate, α2 isthe rear angle-of-attack estimate, and α3 is thepseudodifferential angle-of-attack estimate.
4American Institute of Aeronautics and Astronautics
dy-gelseal
ut-ht isrueedchd
inINSreeSs of is by
hesrst-ree
ght
thegilsre
thethlag
cknged or
relf. A
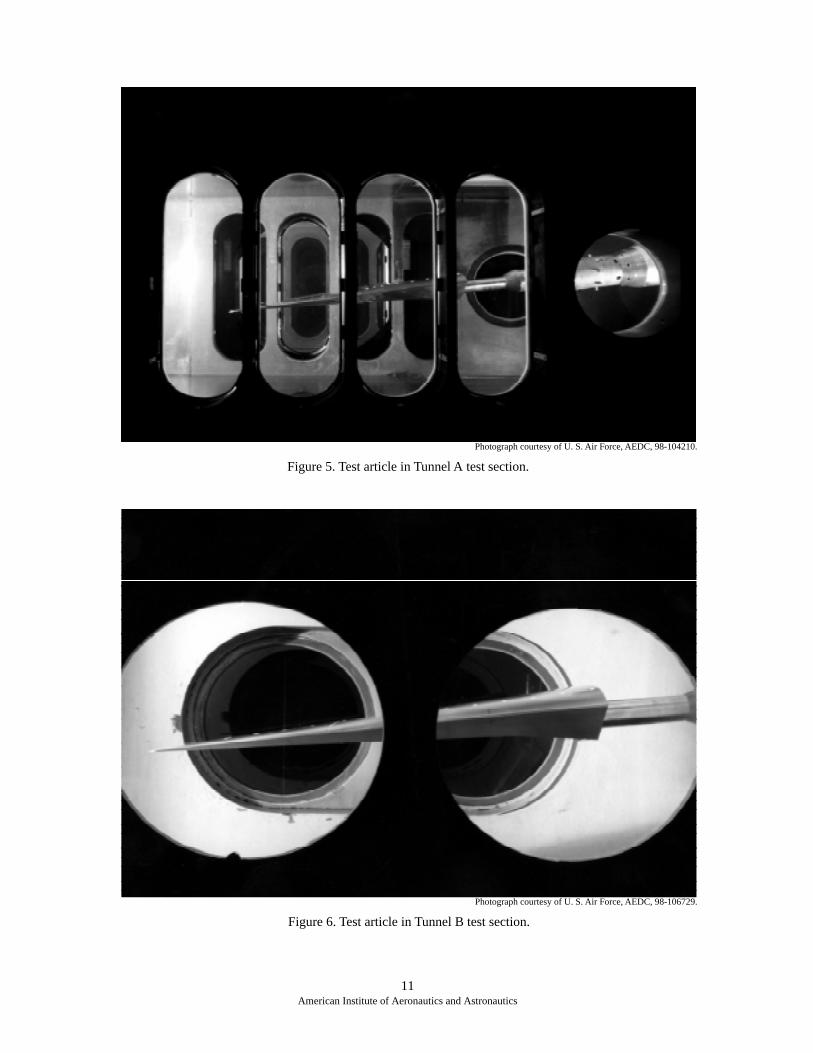
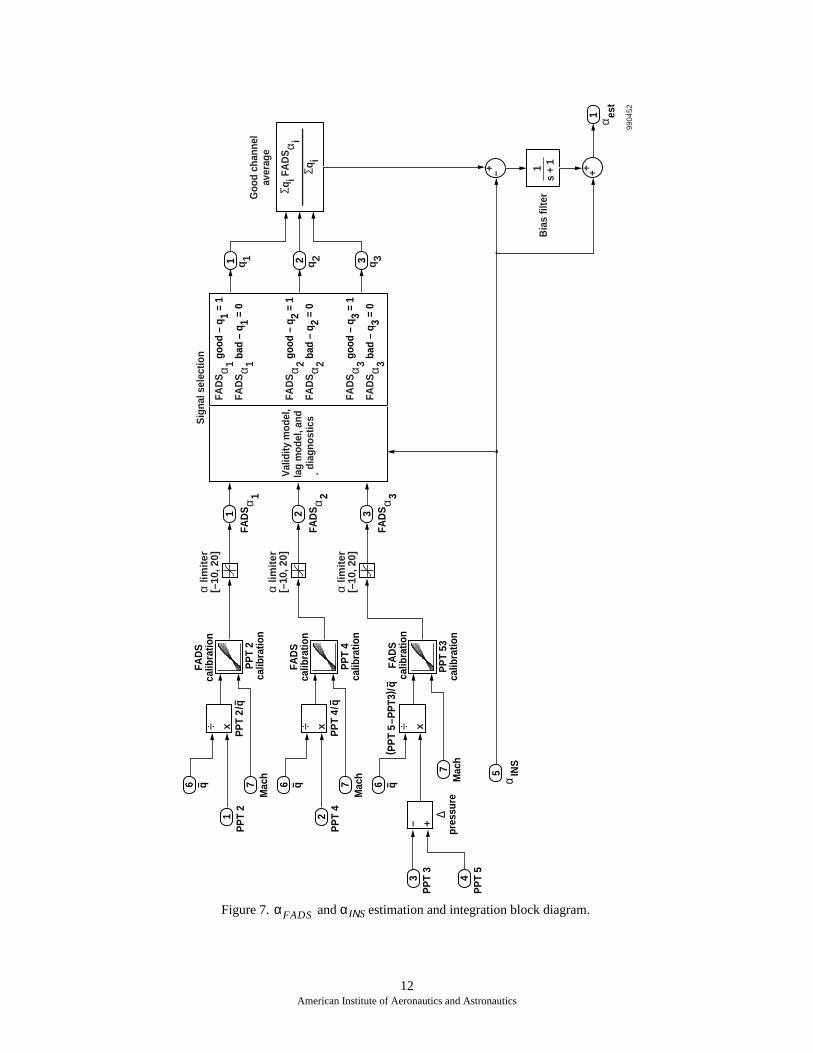
Figure 7 shows the angle-of-attack estimationalgorithm in block diagram form. For PPT 2, PPT 4, andthe difference between PPT 3 and PPT 5, a calibrationcurve of differential pressure as a function of angle of
attack for each Mach number is required. These steastate calibration curves were initially predicted usinengineering methods, then refined with wind-tunndata. The block diagram in figure 7 shows thecalibration curves implemented as two-dimensiontable lookups.
The sensor selection routine is used to determine oof-range or “failed” FADS sensors. Because the fligcontrol system is single-string, the INS angle of attackassumed to be an unfailed but biased estimate of tangle of attack. The INS angle of attack is passthrough a first-order lag filter corresponding to eaFADS angle-of-attack pneumatic lag model derivefrom wind-tunnel data. (This model will be described the Results and Discussion section.) These lagged angle-of-attack signals are then compared to the thcorresponding FADS angle-of-attack signals. A FADangle-of-attack signal is considered “failed” if thicomparison exceeds a threshold for a fixed lengthtime. The threshold is a function of Mach number anddependent on the amount of lag that can be toleratedthe system.
The final FADS angle of attack is the average of t“unfailed” signals. This final FADS angle of attack ithen used to bias the INS angle of attack through a fiorder filter as shown in figure 7. If all FADS sensors adeclared failed, the bias will fade to 0 and thuncompensated INS angle of attack is used in the flicontrol laws.
Other significant airdata parameters sensed by FADS system are derived from postflight data usinnonlinear regression algorithms. Reference 1 detahow these postflight airdata estimation algorithms adeveloped.
Results and Discussion
This section discusses the data obtained in wind-tunnel test. Results are compared with bopredicted static pressure and simulated pneumatic results.
Steady-State Pressure
The calibration curves used to derive angle of attafrom the pressure data were initially developed usiengineering analysis. Newtonian flow theory was usto obtain stagnation pressure. Oblique shock theoryPrandtl-Meyer expansion methods,10 depending onangle-of-attack and flow conditions on the wedge, weused to solve for surface pressures on the wedge itse
Table 3. Wind-tunnel test summary.
Testcondition
Mach number Remark
Reynolds number,mil/ft3 4 5 6 8
β sweepat –6° α
× × × × × Basic 3.00
β sweepat –4° α
× × × × × Basic 3.00
β sweepat –2° α
× × × × × Basic 3.00
β sweepat 0° α
× × × × × Basic 3.00
β sweepat 2° α
× × × × × Basic 3.00
β sweepat 4° α
× × × × × Basic 3.00
β sweepat 6° α
× × × × × Basic 3.00
β sweepat 8° α
× × × × × Basic 3.00
β sweepat 10° α
× × × × × Basic 3.00
β sweepat 12° α
× × × × × Basic 3.00
α sweepat 0° β
× × × × × Hysteresis/Lag effects
3.00
α sweepat 3° β
× × × × × Hysteresis/Lag effects
3.00
α sweepat 0° β
× × × Reynolds number effects
1.80
α sweepat 3° β
× × × Reynolds number effects
1.80
α sweepat 0° β
× × Reynolds number effects
3.76
α sweepat 3° β
× × Reynolds number effects
3.76
5American Institute of Aeronautics and Astronautics
tsck,
ack thehef-he
hende
ed,rentag toAair
gthTheas a
nt
)ute
6,to
entsgebyhetsurealtionent
wind-tunnel test was then conducted to validate theinitial pressure model of the FADS system.
Figures 8(a)–(d) show the comparison of thepredicted pressure model and the wind-tunnel data as afunction of angle of attack for Mach numbers of 3, 4,and 8. The wind-tunnel data are shown as open symbolsand the predicted data are shown as solid symbols.Results for the other Mach numbers listed in table 3 aresimilar to the Mach 8 results.
Results from port 2 (fig. 8(a)) indicate that thepredicted pressures compare very well with thewind-tunnel pressures. Results from port 4 (fig. 8(c))indicate similar results; the exception is the Mach 8 casein which pressure for the high angles of attack wasunderpredicted. This slight underprediction may becaused by flow separation at the high Mach numbers.
The two rear ports (ports 3 and 5) show largedifferences, especially on the lower ramp port 5 (fig. 1).The results for port 3 (fig. 8(b)) indicate goodagreement, except for the Mach 3 case in which a smallslope change appears in the wind-tunnel results. Thecause for this difference is unknown, but may bebecause of data acquisition errors. The results for port 5(fig. 8(d)) indicate an overprediction of the pressures atthe high angles of attack at Mach 3 and 4 and anunderprediction at Mach 8. This difference is mostlikely caused by the presence of the boundary-layer tripstrip located in front of port 5. The simple predictionmodels used for the wind-tunnel comparisons could notinclude a boundary-layer trip strip. The boundary-layertrip strip was installed on the model in a manner similarto that planned for the flight vehicle. Overall, thepredicted pressures compared well with the wind-tunnelpressures for ports located forward of the boundary-layer trip strip. Additional corrections for boundary-layer trip strip effects could be developed for port 5 toreduce the errors even further.
Pressure data obtained from the wind-tunnel test wereused as input to the angle-of-attack estimation routinespreviously described (fig. 7). True angle of attack andtunnel dynamic pressure were used as inputs instead ofthe INS parameters that will be used in the flightsoftware. Figure 9 shows angle-of-attack error
across the angle-of-attack range forthe same Mach numbers as shown in figure 8.Figure 9(a) shows the angle-of-attack error for theforward pair of ports, and figure 9(b) shows theangle-of-attack error for the aft pair of ports.
The angle-of-attack error shown for the forward porgenerally is less than 0.2° at less than 6° angle of attaand is less than 0.5° across the entire angle-of-attenvelope. These excellent results are consistent withpressure results shown in figures 8(a) and 8(c). Tresults for the aft pair of ports show large angle-oattack errors, especially at the high angles of attack. Ttrends in angle-of-attack error are consistent with terrors in predicted pressures shown in figures 8(b) a8(d). The results show the viability of the real-timangle-of-attack estimation method.
Pneumatic Lag
Because the FADS system is pneumatically-baspressure lags must be taken into account. For the curangle-of-attack estimation design, the pneumatic lmodels are used in the sensor selection routinedetermine out-of-range or “failed” FADS sensors. pressure lag model was developed for each port (or pof ports) in the system because tubes of different lenwere used for each sensor (figs. 1–2 and table 2). pressure lag from each port to sensor was modeled first-order lag:13
(2)
where k is a nonlinear function of the measuremegeometry and the input pressure Pport. The lag constant,k, can be represented by the following form:
(3)
where D is the diameter of the tube, L is the tube length,and Ve is the effective volume. Equations (2) and (3characterize the lag from a single port to an absolpressure measurement.
Figure 10 shows wind-tunnel data from a Mach dynamic, pitch-pause angle-of-attack sweep (–6° 12°). As seen in the absolute pressure measurem(PPT 3 and PPT 5), the lag characteristics chansignificantly over the pressure range as predicted equation (3). In contrast, the lag characteristic of tdifferential pressure transducer from a pair of por(PPT 2) remains relatively constant across the pressrange. This empirical observation allows the differentipressure lags to be adequately characterized by equa(2) with a constant lag factor across the measurem
α true αFADS–( )
PPPT
Pport-------------
ks k+----------- ,=
k1τ---
Pport
µ------------- g πD
4
128L Ve--------------------- ,= =
6American Institute of Aeronautics and Astronautics
ng aslagd”k
reS
hed,the
of
,at
ob
n
.
he
.III,tk
ryh)t
d
range. In other words, the lag model for a pair of ports toa differential pressure measurement is only a function ofMach and not a function of the input pressure, thusgreatly simplifying the lag characterization.
An analog matching technique was used to estimatethe lag constant for the differential pressure signalsacross the angle-of-attack measurement range. Trueangle of attack was converted to unlagged pressure byusing the inverse angle-of-attack estimation algorithmshown in figure 7. The resulting pressure was then usedas an input to a constant first-order lag model to obtainthe simulated pressure at the PPT. The lag constant wasvaried in order to minimize the error between the laggedresults and the actual differential pressure signal, andthus to obtain the best fit over the entire range.
Figure 11 shows a typical result for one of the pitch-pause angle-of-attack sweeps (at Mach 6). A timehistory of scaled true angle of attack is shown with theactual and simulated differential pressure for theforward pair of ports. Three sections of the time historyare magnified to show the very good agreement betweenthe simulated and actual signals, especially in thelow-angle-of-attack range. These results show that thepneumatic lags can be characterized by a first-order lag,where the lag constant is only a function of Mach.
Figure 12 is a summary of the lag characterization forall three FADS angle-of-attack signals across the testedMach number range. These lags are accounted for in thereal-time algorithm as previously described in the Real-Time Angle-of-Attack Estimation Algorithm section.
Concluding Remarks
The design of a flush airdata sensing (FADS) systemfor a sharp-nosed, wedge-shaped vehicle has beendescribed. Real-time angle-of-attack estimation fromthe FADS system can be used to bias an inertialnavigation system angle of attack.
Wind-tunnel tests were conducted to validate thepredicted static and dynamic characteristics of theFADS system. The predicted static pressures for amatrix of ports compared well with the wind-tunnelresults. Calibration curves were developed to convertdifferential pressures to angle of attack. Using portsforward of the boundary-layer trip strip results inangle-of-attack errors less than 0.2° at less than 6° angleof attack, and less than 0.5° for the entire angle-of-attack range.
Based on dynamic wind-tunnel results, characterizithe lag from a pair of ports to a differential transducera constant first-order lag is possible. The pneumatic models are used to determine out-of-range or “faileFADS sensors in the real-time angle-of-attacalgorithm.
Wind-tunnel results for static and dynamic pressudata validate the prediction models and the FADarchitecture. The wind-tunnel results show that tperformance of a FADS system for a sharp-nosewedge-shaped vehicle can be designed to meet requirements for accurate measurement of angleattack for real-time control and for postflight analysis.
References
1Whitmore, Stephen A. and Timothy R. MoesMeasurement Uncertainty and Feasibility Study of Flush Airdata System for a Hypersonic FlighExperiment, NASA TM-4627, 1994.
2Enns, Dale F., Dan J. Bugajski, John Carter, and BAntoniewicz, “Multi-Application Controls: RobustNonlinear Mulivariable Aerospace ControlsApplications,” Fourth High Alpha Conference,CP-10143, vol. 2, 1994.
3Cary, John P. and Earl R. Keener, Flight Evaluationof the X-15 Ball-Nose Flow-Direction Sensor as aAir-Data System, NASA TN-D-2923, 1965.
4Siemers, Paul M. III, Martin W. Henry, and James BEades, Jr., “Shuttle Entry Air Data System (SEADS)—Advanced Air Data System Results: Air Data Across tEntry Speed Range,” Orbiter Experiments (OEX)Aerothermodynamics Symposium, CP-3248, Part 1, Apr.1995, pp. 49–78.
5Larson, Terry J., Stephen A. Whitmore, L. JEhernberger, J. Blair Johnson, and Paul M. Siemers Qualitative Evaluation of a Flush Air Data System aTransonic Speeds and High Angles of Attac,NASA TP-2716, 1987.
6Whitmore, Stephen A., Timothy R. Moes, and TerJ. Larson, Preliminary Results From a Subsonic HigAngle-of-Attack Flush Air Data Sensing (HI-FADSSystem: Design, Calibration, and Flight TesEvaluation, NASA TM-101713, 1990.
7Whitmore, Stephen A., Brent R. Cobleigh, anEdward A. Haering, Design and Calibration of the X-33Flush Airdata Sensing (FADS) System,NASA TM-1998-206540, 1998.
7American Institute of Aeronautics and Astronautics
II,l
e
8Anderson, John D., Jr., Hypersonic and HighTemperature Gas Dynamics, McGraw-Hill BookCompany, New York, 1989.
9Solid State Electronics Center, Precision PressureTransducer PPT and PPT-R: User’s ManualVersion 2.4, Honeywell, Inc., 1996.
10Ames Research Staff, Equations, Tables, andCharts for Compressible Flow, Report 1135, 1953.
11Boudreau, A. H., Performance and OperationalCharacteristics of AEDC/VKF Tunnels A, B, and C,AEDC-TR-80-48, July 1981.
12Avallone, Eugene A. and Theodore Baumeister Ieds., Marks’ Standard Handbook for MechanicaEngineers, 10th ed., McGraw-Hill, Boston,Massachusetts, 1996.
13Lamb, J. P., Jr., The Influence of GeometryParameters Upon Lag Error in Airborne PressurMeasuring Systems, WADC TR-57-351, July 1957.
8American Institute of Aeronautics and Astronautics
9American Institute of Aeronautics and Astronautics
Figure 1. Test article pressure port locations.
Left side view990448
Bottom planform
Looking aft
Port 1
(Port 2) (Port 3)
Port 4Port 5
Port 6
Port 7
Port 8Port 9
Port 2Port 3
Port 7
Port 6
Port 4 Port 5
( ) Indicates port is located on test article upper fuselage
X/L = 0 X/L = 0.67X/L = 0.40
X/L = 0 X/L = 0.67X/L = 0.31
Port 1
[ ] Indicates port is located on test article right side of the fuselage
[Port 8][Port 9]
Boundary- layer trip strip
Boundary-layer trip strip
Figure 2. Wind-tunnel model pressure transducer connectivities.
990449
Port 8Port 9
Port 6Port 7
Port 1
Left side
Right side
Lower surface
Port 2Port 3
Upper surface
Port 4Port 5
L2BL2A
L3A
Side internal view
Top internal view
Absolute PPTDifferential PPT
PPT 3
PPT 4
PPT 2
PPT 5
PPT 1
PPT 9
PPT 8
PPT 6
PPT 7
L5A
L4BL4A
L1A
L6B
L9A
L7A
L6AL8B
L8A
Boundary-layer trip strip
10American Institute of Aeronautics and Astronautics
Figure 3. Internal layout of wind-tunnel model.
990450
PPTPPT
Cooling jacket
Cooling jacketCooling jacket
Inclinometer
Figure 4. Wind-tunnel test setup.
Inclinometer
Analog signal acquisitionsystem with signal-conditioning boardsand analog-to-digitalconversion boards
PPT
Test article
RS-485 to RS-232 converters
Computer
To facilitycomputers
Control Room
Ground
Direct-currentpower
990451
PPT PPT PPT PPTPPTPPTPPTPPT
11American Institute of Aeronautics and Astronautics
Photograph courtesy of U. S. Air Force, AEDC, 98-104210.
Figure 5. Test article in Tunnel A test section.
Photograph courtesy of U. S. Air Force, AEDC, 98-106729.
Figure 6. Test article in Tunnel B test section.
12American Institute of Aeronautics and Astronautics
Figure 7. and αΙΝS estimation and integration block diagram.
PP
T 4
calib
ratio
n
FAD
Sca
libra
tion
Val
idity
mod
el,
lag
mod
el, a
nd
diag
nost
ics
FAD
Sα 3 g
ood
– q 3 =
1
FAD
Sα 3 b
ad –
q3 =
0
FAD
Sα 2 g
ood
– q 2 =
1
FAD
Sα 2 b
ad –
q2 =
0
FAD
Sα 1 g
ood
– q 1 =
1
FAD
Sα 1 b
ad –
q1 =
0
Sig
nal s
elec
tion
Σqi F
AD
Sα i
Σqi
+ – +
Bia
s fil
ter
αIN
S
α est
+
9904
52
1s
+ 1
Goo
d ch
anne
lav
erag
e
21
5
1
3q2
2
α lim
iter
[–10
, 20]
( PP
T 5–
PP
T3) /
q–
PP
T 4/
q–
FAD
Sca
libra
tion
FAD
Sα
1
FAD
Sα
2
FAD
Sα
3
3
6
1
α lim
iter
[–10
, 20]
PP
T 2
calib
ratio
n
PP
T 2/
q–
q– 7M
ach
PP
T 2
FAD
Sca
libra
tion
1
α lim
iter
[–10
, 20]
q1
q3
÷ x
6
2
q– 7M
ach
PP
T 4
÷ x
6
3
PP
T 53
calib
ratio
n
q–
7M
ach
∆pr
essu
re
PP
T 3
4P
PT
5
÷ x– +
αFADS
13American Institute of Aeronautics and Astronautics
(a) Pressure as a function of angle of attack for port 2.
Wind-tunnel measuredPredicted
Pressure
α, deg– 8 – 6 – 4 – 2 0 2 4 6 8 10 12 14
Mach 3
Mach 4
Mach 8
990453
(b) Pressure as a function of angle of attack for port 3.
Figure 8. Comparison of empirical and wind-tunnel data for the αFADS.
Wind-tunnel measuredPredicted
Pressure
α, deg– 8 – 6 – 4 – 2 0 2 4 6 8 10 12 14
Mach 3
Mach 4
Mach 8
990454
14American Institute of Aeronautics and Astronautics
(c) Pressure as a function of angle of attack for port 4.
Wind-tunnel measuredPredicted
Pressure
α, deg– 8 – 6 – 4 – 2 0 2 4 6 8 10 12 14
Mach 3
Mach 4
Mach 8
990455
(d) Pressure as a function of angle of attack for port 5.
Figure 8. Concluded.
Wind-tunnel measuredPredicted
Pressure
α, deg– 8 – 6 – 4 – 2 0 2 4 6 8 10 12 14
Mach 3
Mach 4
Mach 8
990456
15American Institute of Aeronautics and Astronautics
(a) Forward ports ( ).
5 0 5 10
990457
.5
1.0
1.5
1.0
.5
0
2.0Mach 3Mach 4Mach 8
αtrue
– α
FADS,deg
α true, deg
FADSα1(b) Aft ports ( ).
5 0 5 10
990458
.5
1.0
1.5
1.0
.5
0
2.0Mach 3Mach 4Mach 8
αtrue
– α
FADS,deg
α true, deg
FADSα2 and FADSα3
Figure 9. Angle-of-attack error as a function of true angle of attack.α true αFADS–( )
Figure 10. Typical wind-tunnel pitch-pause angle-of-attack sweep for Mach 6.
150Time, sec
100500 300250200
Measuredpressures,
lbf/ft2
990459
PPT 2PPT 3PPT 5
PPT 3 (absolute forward, upper port)
PPT 5 (absolute aft, lower port)
PPT 2 (differential forward ports)
16American Institute of Aeronautics and Astronautics
Figure 11. Simulated and actual pressure lag characteristics for Mach 6 pitch-pause angle-of-attack sweep.
0 50 100 150Time, sec
200 250 300
Scaled αPPT 2 actualPPT 2 simulated
30 32 34 36 38
α step from – 5° to – 4°
α step from 3° to 4°
α step from 9° to 10°
Time, sec146 148 150 152 154
Time, sec242 244 246 248
PPT 2 (actualand measured),
lbf/ft2
PPT 2 (actualand measured),
lbf/ft2
Time, sec990460
Figure 12. Summary of lag characteristics for all three angle-of-attack estimations as a function of Mach number.
3 4 5 6 7 81
3
5
7
9
11
13
15
Mach number
Lag constant,rad/sec
990461
FADSα1 (PPT 2)
FADSα2 (PPT 4)
FADSα3 (PPT 5–PPT 3)
REPORT DOCUMENTATION PAGE
Form ApprovedOMB No. 0704-0188
Public reporting burden for this collection of information is estimated to average 1 hour per response, including the time for reviewing instructions, searching existing data sources, gathering andmaintaining the data needed, and completing and reviewing the collection of information. Send comments regarding this burden estimate or any other aspect of this collection of information,including suggestions for reducing this burden, to Washington Headquarters Services, Directorate for Information Operations and Reports, 1215 Jefferson Davis Highway, Suite 1204, Arlington,VA 22202-4302, and to the Office of Management and Budget, Paperwork Reduction Project (0704-0188), Washington, DC 20503.
1. AGENCY USE ONLY (Leave blank) 2. REPORT DATE 3. REPORT TYPE AND DATES COVERED
4. TITLE AND SUBTITLE 5. FUNDING NUMBERS
6. AUTHOR(S)
8. PERFORMING ORGANIZATION REPORT NUMBER
7. PERFORMING ORGANIZATION NAME(S) AND ADDRESS(ES)
9. SPONSORING/MONITORING AGENCY NAME(S) AND ADDRESS(ES) 10. SPONSORING/MONITORING AGENCY REPORT NUMBER
11. SUPPLEMENTARY NOTES
12a. DISTRIBUTION/AVAILABILITY STATEMENT 12b. DISTRIBUTION CODE
13. ABSTRACT (Maximum 200 words)
14. SUBJECT TERMS 15. NUMBER OF PAGES
16. PRICE CODE
17. SECURITY CLASSIFICATION OF REPORT
18. SECURITY CLASSIFICATION OF THIS PAGE
19. SECURITY CLASSIFICATION OF ABSTRACT
20. LIMITATION OF ABSTRACT
NSN 7540-01-280-5500 Standard Form 298 (Rev. 2-89)
Prescribed by ANSI Std. Z39-18298-102
Development of a Flush Airdata Sensing System on a Sharp-NosedVehicle for Flight at Mach 3 to 8
WU 522-51-54-00-50-00-X43
Mark C. Davis, Joseph W. Pahle, John Terry White, Laurie A. Marshall,Michael J. Mashburn, and Rick Franks
NASA Dryden Flight Research CenterP.O. Box 273Edwards, California 93523-0273
H-2390
National Aeronautics and Space AdministrationWashington, DC 20546-0001 AIAA 2000-0504
NASA Dryden Flight Research Center has developed a flush airdata sensing (FADS) system on a sharp-nosed,wedge-shaped vehicle. This paper details the design and calibration of a real-time angle-of-attack estimationscheme developed to meet the onboard airdata measurement requirements for a research vehicle equipped witha supersonic-combustion ramjet engine. The FADS system has been designed to perform in flights at Mach 3–8 and at –6°–12° angle of attack. The description of the FADS architecture includes port layout, pneumaticdesign, and hardware integration. Predictive models of static and dynamic performance are compared withwind-tunnel results across the Mach and angle-of-attack range. Results indicate that static angle-of-attackaccuracy and pneumatic lag can be adequately characterized and incorporated into a real-time algorithm.
Paper presented at 38th AIAA Aerospace Sciences Meeting and Exhibit, 10-13 January 2000, Reno, NV, AIAA 2000-0504. M. Davis, J. Pahle, J. White and L. Marshall of NASA Dryden Flight Research Center, Edwards, CA.M. Mashburn of Micro Craft, Inc., Tullahoma, TN. Rick Franks of Sverdrup Corp., Arnold AFB, TN.
Unclassified—UnlimitedSubject Category 06
This report is available at http://www.dfrc.nasa.gov/DTRS/