TESIS DOCTORAL DEVELOPMENT OF A LASER-BASED ANALYTICAL PLATFORM FOR THE LIBS INSPECTION OF INDIVIDUAL NANOPARTICLES WITHIN AN ATMOSPHERIC PRESSURE OPTICAL TRAP Pablo Purohit Pacheco Directores: José Javier Laserna Vázquez y Francisco Javier Fortes Román UNIVERSIDAD DE MÁLAGA Departamento de Química Analítica Málaga 2020
Transcript
TESIS DOCTORAL
DEVELOPMENT OF A LASER-BASED ANALYTICAL PLATFORM FOR THE LIBS INSPECTION OF INDIVIDUAL NANOPARTICLES
WITHIN AN ATMOSPHERIC PRESSURE OPTICAL TRAP
Pablo Purohit Pacheco
Directores: José Javier Laserna Vázquez y Francisco Javier Fortes Román
UNIVERSIDAD DE MÁLAGA
Departamento de Química Analítica
Málaga 2020
Doctoral Thesis
DEVELOPMENT OF A LASER-BASED ANALYTICAL PLATFORM FOR THE LIBS INSPECTION OF INDIVIDUAL NANOPARTICLES WITHIN AN
ATMOSPHERIC PRESSURE OPTICAL TRAP
by
Pablo Purohit Pacheco
THESIS SUBMITTED IN PARTIAL FULFILMENT OF THE REQUIREMENTS
TO APPLY FOR THE DEGREE OF DOCTOR IN CHEMISTRY
Department of Analytical Chemistry
Faculty of Sciences
University of Málaga
Málaga, 2020
AUTOR: Pablo Purohit Pacheco
http://orcid.org/0000-0001-5839-8064
EDITA: Publicaciones y Divulgación Científica. Universidad de Málaga
Esta obra está bajo una licencia de Creative Commons Reconocimiento-NoComercial-SinObraDerivada 4.0 Internacional:http://creativecommons.org/licenses/by-nc-nd/4.0/legalcodeCualquier parte de esta obra se puede reproducir sin autorización pero con el reconocimiento y atribución de los autores.No se puede hacer uso comercial de la obra y no se puede alterar, transformar o hacer obras derivadas.
Esta Tesis Doctoral está depositada en el Repositorio Institucional de la Universidad de Málaga (RIUMA): riuma.uma.es
DECLARACIÓN DE AUTORÍA Y ORIGINALIDAD DE LA TESIS PRESENTADA PARA OBTENER EL TÍTULO DE DOCTOR
D./Dña PABLO PUROHIT PACHECO Estudiante del programa de doctorado QUIMICA Y TECNOLOGÍAS QUÍMICAS. MATERIALES Y NANOTECNOLOGÍA de la Universidad de Málaga, autor/a de la tesis, presentada para la obtención del título de doctor por la Universidad de Málaga, titulada: DEVELOPMENT OF A LASER-BASED ANALYTICAL PLATFORM FOR THE LIBS INSPECTION OF INDIVIDUAL NANOPARTICLES WITHIN AN ATMOSPHERIC PRESSURE OPTICAL TRAP.
Realizada bajo la tutorización de JOSÉ JAVIER LASERNA VÁZQUEZ y dirección de JOSÉ JAVIER LASERNA VÁZQUEZ Y FRANCISCO JAVIER FORTES ROMÁN (si tuviera varios directores deberá hacer constar el nombre de todos)
DECLARO QUE:
La tesis presentada es una obra original que no infringe los derechos de propiedad intelectual ni los derechos de propiedad industrial u otros, conforme al ordenamiento jurídico vigente (Real Decreto Legislativo 1/1996, de 12 de abril, por el que se aprueba el texto refundido de la Ley de Propiedad Intelectual, regularizando, aclarando y armonizando las disposiciones legales vigentes sobre la materia), modificado por la Ley 2/2019, de 1 de marzo.
Igualmente asumo, ante a la Universidad de Málaga y ante cualquier otra instancia, la responsabilidad que pudiera derivarse en caso de plagio de contenidos en la tesis presentada, conforme al ordenamiento jurídico vigente.
En Málaga, a 01 de MARZO de 2020
Fdo.:
I
DEVELOPMENT OF A LASER-BASED ANALYTICAL PLATFORM FOR THE LIBS INSPECTION OF INDIVIDUAL NANOPARTICLES WITHIN AN
ATMOSPHERIC PRESSURE OPTICAL TRAP
por PABLO PUROHIT PACHECO
Directores
José Javier Laserna Vázquez
Catedrático de Universidad
Departamento de Química Analítica
Universidad de Málaga
Francisco Javier Fortes Román
Doctor en Química
Departamento de Química Analítica
Universidad de Málaga
Memoria de Tesis presentada para optar al grado de Doctor en Química
PABLO PUROHIT PACHECO
Málaga, marzo de 2020
III
JOSÉ JAVIER LASERNA VÁZQUEZ, Catedrático de Química Analítica de la Universidad de Málaga, y FRANCISCO JAVIER FORTES ROMÁN, Investigador Postdoctoral del Departamento de Química Analítica de la Universidad de Málaga.
CERTIFICAN
Que PABLO PUROHIT PACHECO ha realizado bajo su dirección la presente Tesis Doctoral titulada “DEVELOPMENT OF A LASER-BASED ANALYTICAL PLATFORM FOR THE LIBS INSPECTION OF INDIVIDUAL NANOPARTICLES WITHIN AN ATMOSPHERIC PRESSURE OPTICAL TRAP” en el UMALASERLAB, grupo de investigación perteneciente al Departamento de Química Analítica de la Universidad de Málaga, y que el conjunto de publicaciones aportadas para avalar el trabajo científico no han sido utilizadas en Tesis anteriores, reuniendo a nuestro juicio los requisitos necesarios y autorizando, por tanto, su presentación para optar al grado de Doctor en Química.
Y para que así conste a los efectos oportunos firman la presente en Málaga, marzo de 2020.
Prof. Dr. José Javier Laserna Vázquez Dr. Francisco Javier Fortes Román
V
TESIS DOCTORAL POR COMPENDIO DE PUBLICACIONES
En cumplimiento de los requisitos especificados en el Reglamento de Doctorado de la Universidad de Málaga, la presente Tesis Doctoral ha sido autorizada por los Directores de Tesis y el Órgano Responsable del Programa de Doctorado para ser presentada en el formato de “compendio de publicaciones”.
Las referencias de los artículos en los que el doctorando figura como primer autor y que avalan la presente Tesis Doctoral se detallan a continuación de acuerdo a su orden cronológico de publicación:
1. Purohit, P., Fortes, F. J. & Laserna, J. J. “Atomization efficiency and photon yield inlaser-induced breakdown spectroscopy analysis of single nanoparticles in an opticaltrap”. Spectrochim. Acta - Part B At. Spectrosc. 130, 75–81 (2017).
2. Purohit, P., Fortes, F. J. & Laserna, J. J. “Spectral Identification in the AttogramRegime through Laser-Induced Emission of Single Optically Trapped Nanoparticlesin Air”. Angew. Chemie - Int. Ed. 56, 14178–14182 (2017).
3. Purohit, P., Fortes, F. J. & Laserna, J. J. “Subfemtogram Simultaneous ElementalDetection in Multicomponent Nanomatrices Using Laser-Induced Plasma EmissionSpectroscopy within Atmospheric Pressure Optical Traps”. Anal. Chem. 91, 7444–7449 (2019).
4. Purohit, P., Samadi, A., Bendix, P. M., Laserna, J. J. & Oddershede, L. B. "Opticaltrapping reveals differences in dielectric and optical properties of coppernanoparticles compared to their oxides and ferrites". Sci. Rep. 10, 1198 (2020).
Málaga, marzo de 2020
Prof. Dr. José Javier Laserna Vázquez Dr. Francisco Javier Fortes Román
VII
Acknowledgements
As I reach the end of this road full of ups and downs that the pre-doctoral period has proven to be, it feels great to have the chance to thank each every person that has helped me get here both scientifically and personally. This section may be a little longer than usual, but there are many helping hands without whom I would had never made it this far and multiple little histories that are worth addressing to understand how significant these years have been to me.
First, I would like to thank Professor Javier Laserna for granting me the chance to carry out my research in the privileged scientific environment that the UMALASERLAB group truly is. Thanks for all the hard work poured into guiding me to successfully complete this project you entrusted me with, for the patience required to carry on with some of ideas I presented to you (getting into Angewandte Chemie was no easy task at all!) as well as for your clever advising, which I will surely make use of not only as a professional, but as an individual as well. All in all, I consider myself to be really lucky for working in LIBS and living up to your “the more lasers, the more fun” catchphrase.
It is without a doubt that working alongside my co-director Francisco Javier Fortes has resulted in my best contributions to the laboratory. Your ability to come up with the right twist to improve our experiments and make the most out of our results is invaluable. I truly do not think I would have been able to reach some of the relevant conclusions presented in this thesis had you not been there to take a critical look at data from multiple points of view. Still, the most important lesson you have taught me is to consider problems and obstacles merely as opportunities to put into practice all we have learnt along our paths… and there is always a way to deal with them! Thank you for always cheering me up and brightening my almost-perpetual cloudy mood.
This journey began by chance when I met Professor Jose Miguel Vadillo (I am not entirely sure if he is OK with me referring to him in such a formal manner, but I find it to be quite appropriated given the context) in a beer shop a bit before graduating in Chemistry. After speaking to him about the research topics of UMALASERLAB and his guided tour through the laboratory I realized I had found exactly the topic I was looking for and willing to put thousands of hours over the next few years. Thank you for bringing me into the lab, for always being there to lend a hand with our experiments, for the laughs and, of course, for the music.
VIII
I have mentioned before how the infrastructure found at the laboratory is outstanding, yet its most valuable asset is the amazing people that form part of this group and they deserve to be acknowledged here.
First off, I would like to thank Xavi for the countless hours we have spent together, for filling every coffee pause and lunch break with a nice conversation on pretty much every single possible topic and for being a great colleague and a friend. On a same page I have to mention Tomás, we have managed to survive months of laboratory sessions for years with no physical damage received and that is quite a feature! Thank you both for always been keen on helping me.
Of course I have to thank Luisa, Patricia, Sadia and Belén with whom I could always count for tasks ranging from finding a particular lens or solving complicated bureaucratic stuff to getting a good deal of spicy sauces into an airplane. By the way, Sadia, I owe you a Bollywood choreography!
There are many colleagues with whom I have had the luck of partially sharing these years. It was great coming to the lab knowing that they were here to make a nice day out of every single day and bidding farewell to them as they left the group was particularly difficult. Marina was the first person I worked with in the laboratory and she did really well in teaching me the basics of LIBS and the instrumentation involved on the experiments and I am really thankful for your patience and camaraderie. I got the chance of working alongside my classmate Samara for some time as well and I can only say that having a person capable of laughing even through the harder days was great as that positive energy was quite contagious. I had a great time sharing with both of you different symposiums and trips. I want to thank David for the casual heavy metal and random internet stuff chats, Paula and Rocío for always taking good care of me and Rubén for being an awesome person. More recently, Laura joined the lab and all the nerdy conversations have just been priceless, thank you for being such a colorful person.
My pre-doctoral stay at the Niels Bohr Institute in Copenhagen was an extremely important period and a great experience that helped me grow personally. I am thankful to Professor Lene Oddershede for welcoming me into her group and the rewarding scientific discussions, to Akbar Samadi for all his hard work and patience and to Poul Martin not only for his help, but also for the football! I would also like to extend my gratitude to the rest of the group (Younes, Henrik, Guillermo…) for their kindness and making it really easy to integrate with them.
IX
Of course, all of this would not have been possible without the economic support of the FPI grant associated to the research project CTQ2014-56058P, funded by the Ministerior de Economía y Competitividad (MINECO) of the Spanish government.
Being part of a family in which many languages are spoken has tons of advantages, yet, in order to make sure that everyone understands the words directed to them, I need to give myself the freedom to switch back and forth between English and Spanish and to break from the highly technical scientific speech to a more informal register for the following personal acknowledgements.
En primer lugar, me gustaría agradecer a mi familia por su apoyo incondicional en todo momento de mi vida. Hay mil y un motivos adicionales por los que daros las gracias, podría llenar dos tesis como esta sin lugar a dudas, pero como creo que es mejor recitároslos en persona, voy a dejar en estas líneas una simple pincelada de lo que suponéis para mí. Empezaré por dar las gracias a mi tío Pedro. Tu pasión por la naturaleza y la ornitología tienen mucho que ver con que la ciencia se haya convertido en mi vida. Los primeros pasos en este camino los di contigo. También os agradezco a ti, a la tita Lola y al primo Pedro que seáis un colosal ejemplo de fuerza y superación, sois simplemente admirables. Se hace difícil continuar a partir de aquí, tengo tantísimas cosas que decir de cada uno que se me entremezclan, ¡vaya familia más magnífica tienes, mamá! Bueno, quizás pueda seguir por agradecer a mi tía Ara el que me contagiara el gusanillo de la lectura y siempre me haya animado a devorar libros, una afición sin la cual no estaría hoy donde estoy (¡escribiendo un libro ni más ni menos!). Muchísimas gracias por haber estado a nuestro lado especialmente en este 2019 tan duro, tita, no se me ocurre una palabra de entre las miles que he aprendido que sea capaz de plasmar el grado de agradecimiento que tengo. Ya que hablamos de palabras, y conectando precisamente con el párrafo que precede a éste, tengo la suerte de conocer miles de ellas en diferentes idiomas y gran parte de “culpa” de eso la tienen mi tía Concha y mi tío Antonio, quienes se aseguraron de mantenerme bien ocupado en mis veranos en Fuente de Piedra con actividades como mis primeras clases de inglés, ¡las aproveché bien! Igual que aproveché las ocasiones en las que mi primo Juan Ignacio me dejaba el PC, gracias, primo, no sólo porque aprendí a manejarme con ordenadores desde pequeño sino porque también conocí mundos maravillosos, como el del Día del Tentáculo o Indiana Jones: Fate of Atlantis, que han ayudado a desarrollar mi imaginación. Me enorgullece ver el padrazo en el que te has convertido y verte con María José, Ignacio y Ángela, el torbellino de la familia. Aprovecho para dar las gracias mi prima Conchi, con quien siempre he tenido una conexión especial gracias a la música, importante protagonista en la vida de ambos, por estar siempre a mi lado enseñándome a ponerle buena cara los malos días y que la vida da mucho de sí. También quiero agradecer a mi tía
X
Juana todas las veces que me ha acogido, me ha traído, me ha llevado, las numerosas sesiones de cine y el poder contar con ella siempre sin importar la adversidad de la circunstancia. Por último quiero dejar a la persona que más me ha influenciado para ser como soy ahora, mi prima Arantxa. Más una hermana que una prima, gracias por todo lo que me has enseñado, el amor por la fantasía, por culturas diferentes. No me cabe duda de que todas y cada una de las amistades que tengo a día de hoy han conectado conmigo precisamente por estas cosas. E infinitas gracias a ti y a Manolo por Diana, cuya llegada ha supuesto un impulso anímico muy importante para lograr finalizar este trabajo.
No puedo cerrar estas líneas sin acordarme de mi abuela, mama Joaquina, quien me ha dado a todas estas maravillosas personas. Ojalá estuvieras aquí para vernos ahora. Te echamos de menos y te queremos mucho.
Málaga and Mumbai are physically separated by ca. 7700 km, yet this distance is but a few millimeters to me as this city from India is as much a part of me as my hometown is. The reason? Well, I am one of those lucky few to also have a wonderful (and quite large!) family in that land of wonders and there is not a single day I cannot feel their support and love. I would like to thank my uncle Papu for his humor and his admirable skill to cheer everyone up as well as to my auntie Girija. Thanks to my brother Jay and my sister Kiran for being the definition of awesome and putting so much color and joy into this life you rock like no one else. Of course I want to thank Ritesh and little Virat for lovingly looking after Kiran. On the other hand, Nanda didi thank you for all your love and for being the only one who calls me Pritvi, a name full of meaning which I cherish. Jitu, Bahvna, Shourya, I owe you a visit, no matter what part of the world! This is also true in your case, Ruchika! Thank you for being there and for having a smile that gives sense to this world. I cannot stress enough how proud I am of my heritage and for being part of this family.
I have to save a paragraph to the man I one day aspire to be like, my grandfather, Radhakrishna Purohit, or as we lovingly refer to him: “Daddy”. Getting just a 1% close to the example you are would be enough to call a whole life cycle successful. Thank you for guiding me, for always having a useful word of advice, for teaching me how to improve as a person and to put all my efforts into caring for what is really important: our loved ones and their well-being. Nothing makes happier than knowing that you look at me with pride. You are an integral part of everything I have managed to achieve. Life is all about progress. Life is all about coming up. Life is all about facing problems and not letting them best us. There is nothing we cannot overcome and there is no reason for us to surrender. There is no lesson more valuable than this one and I learnt it from you. Thank you.
XI
Vuelvo al castellano para dar las gracias a las magníficas personas a las que tengo el honor de llamar amigos, personas que me han aguantado casi las mismas pataletas que mi madre, ¡bendita paciencia!
Me gustaría empezar por dar las gracias a Paco. Eres una de las personas más valiosas que conozco y un amigo de los que presumir, te mereces todo lo absolutamente mejor de este mundo. Por otro lado, Arturo, gracias por empujarme siempre hacia adelante y a enfrentar cada día como una posible aventura, ¡cuántas cosas me habría perdido sin ti!
Fran, Machu, hemos recorrido medio mundo juntos. Hemos visto auténticas maravillas y hemos vivido experiencias de todas las clases (¿meditar en una ermita budista en lo alto de una montaña en Busan, Corea del Sur? Hecho). La conexión que existe entre nosotros es una de las cosas que más aprecio y siento daros tanto la lata y que en especial vosotros me hayáis aguantado tantas tonterías a lo largo de estos casi 12 años que llevamos juntos. La vida nos ha mandado a cada uno a una punta del país y a saber qué nos espera en el futuro, pero sé que sea donde sea, puedo contar con vosotros. Gracias. Y, bueno, Fer, a ti la vida te ha mandado a la otra punta del planeta y aún con la abismal diferencia horaria puedo encontrar en ti buenos consejos. Gracias por todas las horas de música que hemos echado lo largo de estos muchísimos años, cosa que, por supuesto, también he de agradecer a Pat y a Andy.
Gracias a la familia de Club Averno, donde siempre he encontrado un hueco para despejar la mente después de un día duro ya sea con una conversación agradable, un juego de mesa o una partida de rol. Me habéis aportado mucho en estos años y entre todos me habéis ayudado a ser un tipo mil veces más sociable. Gracias a todos. Por cierto, voy a mencionar a alguien a quien sé que le hará ilusión estar incluido de manera explícita en estas líneas; un saludo, Cristian (la ocasión es formal, ¡espero que lo entiendas!).
Patry, has sido mi mayor apoyo durante estos cuatro años de tesis doctoral. Aunque sé que he volcado más peso sobre ti del que debería y que las cosas no han sido tan ideales como esperábamos, quiero que sepas que no habría podido completar el proyecto sin contar con tu ayuda, tus palabras de ánimo, tu disposición a escucharme, tu capacidad para calmarme, para hacerme mejor y tu cariño. Además, me he sentido tremendamente integrado en el seno de una familia que me ha acogido como a uno más. Fernando, Mariángeles, Saray, Juanma, gracias por todos los buenos momentos, pelis, teatro, viajes, torneos... ¡Hasta las meriendas de Carmina, que me han cargado las pilas más de una vez! Muchísimas gracias una vez más.
XII
Por último, me gustaría dar las gracias a mis padres. Dos personas que han sacrificado tiempo, esfuerzo, salud, dinero y todo de buen agrado para proporcionarme un ambiente ideal en el cual estudiar y formarme profesionalmente. Siempre habéis buscado protegerme y facilitarme las cosas. La deuda que tengo con vosotros es impagable, por lo que sólo puedo esperar que sintáis que todo el esfuerzo que habéis invertido en mí ha merecido la pena, que he aprovechado las oportunidades que me habéis abierto y que veáis en mí una persona de provecho, ya que para eso me habéis educado. Por todo lo que me habéis aguantado y sufrido, por todos los consejos, el apoyo, el amor, por darme lo mejor de vosotros siempre, gracias.
Luck as a constant
- Periphery
A mis padres.
A Diana.
1
Table of contents
Summary in Spanish ...........................................................................................................................5 Objectives ........................................................................................................................................ 19 Introduction ..................................................................................................................................... 23
1. A brief history of nanoscience ............................................................................................... 23
2. Nanotechnology: an ever-evolving challenge for Analytical Chemistry ................................ 27
2.1 Modeling and predictive simulations ........................................................................... 28
2.2 Characterization of the morphology and surface properties of nanostructures ......... 28
2.3 Compositional analysis of nanoparticulate matter ...................................................... 30
Chapters ........................................................................................................................................... 75 Chapter 1: Atomization efficiency and photon yield in laser-induced breakdown spectroscopy analysis of single nanoparticles in an optical trap .................................................. 77
Chapter 2: Spectral identification in the attogram regime through laser-induced emission of single optically-trapped nanoparticles in air ............................................................................. 97
Chapter 4: Optical trapping reveals differences in dielectric and optical properties of copper nanoparticles compared to their oxides and ferrites ..................................................... 139
2.3 TEM imaging ................................................................................................................. 141
3. Results and discussion ......................................................................................................... 142
3.1 Particle characterization and power spectra acquisition ............................................. 142
3.2 Optical trapping strength of individual CuNPs and ferrites depends on particle size and chemical nature .................................................................................................... 143 3.3 Optical cross sections and polarizability of CuNPs ....................................................... 145 3.4 Effect of oxidized shell on optical properties of CuNPs ................................................ 148 3.5 Plasmonic heating of irradiated CuNPs ......................................................................... 149
Appendix: Contributions to scientific journals ............................................................................. 161
5
Summary in Spanish
En cumplimiento con el Reglamento de Doctorado de la Universidad de Málaga para las tesis presentadas para optar al grado de doctor con mención internacional, la presente tesis doctoral se encuentra redactada en inglés, por lo que se incluye un resumen en castellano del contenido de la memoria.
Sugerido por primera vez a finales de la década de 1950 por el premio Nobel en Física Richard Feynman, la nanotecnología se ha convertido en uno de los campos de la ciencia multidisciplinar más relevantes a lo largo de las dos últimas décadas. Las aplicaciones ya comercializadas de los nanomateriales así como la continua aparición de propuestas que aumentan el espectro de posibles escenarios donde estos pueden ser útiles motivan que el interés científico así como la inversión proveniente de fuentes tantos privadas como públicas en el área siga en aumento actualmente. Los nuevos diseños de nanoestructuras derivados del mayor grado de control y precisión en los procesos de diseño y síntesis muestran un alto grado de complejidad tanto morfológica como composicional, parámetros que han de ser meticulosamente asegurados para el correcto funcionamiento del material. Debido a la constante evolución de las nanopartículas, la Química Analítica como área de conocimiento debe responder a las particularidades que conlleva la caracterización de los mismos y proponer estrategias adaptadas para arrojar resultados con robustez y con el nivel suficiente de precisión, llegando en algunos caso a ser deseable una resolución de partícula individual.
Algunas técnicas analíticas de uso bien establecido como la espectrometría de masas o distintas espectroscopías de absorción y emisión cuenta con un abundante catálogo de métodos diseñados específicamente para trasladar las ventajas que estas técnicas poseen para la caracterización de materiales “masivos” al terreno de los nanomateriales. Todas las etapas del proceso analítico necesitan ser redefinidas para el uso de las mencionadas herramientas analíticas, la toma de muestras, la preparación de las mismas, la forma de realizar las medidas experimentales o los métodos de procesado de datos. No obstante, estas técnicas también exportan a la nanoinspección limitaciones tales como el número de elementos detectables en una única medida mientras que se generan nuevas incógnitas tales como el número de partículas responsables de la señal detectada.
La espectroscopía de plasmas inducidos por láser (conocida por su acrónimo en inglés, LIBS) ha demostrado desde principio de siglo ser una de las técnicas más versátiles disponibles para la caracterización química de materiales, tal y como puede concluirse de las numerosas y diversas aplicaciones recogidas en la literatura. La adaptabilidad de LIBS se
Summary in Spanish
6
traduce, además, en una gran sinergia que permite combinar esta espectroscopía con otras técnicas para mejorar el rendimiento analítico individual de cada una de ellas. Algunos ejemplos contrastados de combinaciones de LIBS incluyen Raman-LIBS o LIBS-espectrometría de masas. En otras ventajas asociadas a la técnica están la escasa o nula necesidad de protocolos de preparación de muestras o la posibilidad de obtener espectros a lo largo de una amplia ventana de longitudes de onda, pudiéndose identificar por tanto varios elementos constituyentes del analito simultáneamente con un único disparo del láser de análisis.
En esta tesis doctoral se presenta un sensor basado en LIBS como técnica de inspección para la caracterización de nanopartículas individuales. Dado que las propiedades de estos materiales están estrechamente ligadas a su tamaño, morfología y composición, la mínima alteración de cualquiera de estos tres parámetros podría suponer una fuerte caída en su rendimiento, es por ello que la posibilidad de determinar la mayor cantidad de estos en la misma medida es una característica de interés a la hora de elegir la estrategia de análisis. En este aspecto, la combinación de LIBS con el atrapado óptico a presión atmosférica podría cumplir estos requisitos puesto que las especies capturadas en el seno de la trampa habrían de poseer unas características morfológicas específicas, introduciendo una etapa de exclusión previa a la determinación cualitativa completa de su composición química. Además, introduciendo el uso del catapultado óptico para producir corrientes de aerosol secas que resulten en una partícula entrando en la trampa se evitan posibles alteraciones de los analitos causado por el uso de disolventes y se asegura que la preparación de la muestra sea mínima. El cuerpo de este trabajo se divide en cuatro capítulos que corresponden a las publicaciones científicas derivadas del trabajo realizado a lo largo de la etapa pre-doctoral en orden cronológico. A lo largo de estos capítulos se recoge en primer lugar el desarrollo del sensor y la parametrización sistemática de los diferentes factores que influyen en el análisis LIBS (densidad de energía, condiciones de adquisición o la posición partícula-láser de análisis) y a la trampa óptica (rigidez de la trampa, manipulación de la partícula atrapada). A posteriori, se muestran las capacidades analíticas de la tecnología OC-OT-LIBS propuesta haciendo énfasis en los tamaños y masas mínimas detectables haciendo uso de ella y respondiendo a cuestiones fundamentales como los mecanismos de disociación y excitación que tienen lugar durante la interacción láser-materia a través de los espectros obtenidos. Además, dado que el atrapado óptico en aire a presión atmosférica es aún un terreno poco explorado, se recogen resultados novedosos respecto a las posibilidades ofrecidas por la técnica descubierta por el Premio Nobel Arthur Ashkin. Por último, durante la estancia pre-doctoral en el Instituto Niels Bohr de la Universidad de Copenhagen se llevaron a cabo experimentos de atrapado óptico en un aspecto más clásico (usando agua como medio de atrapado y objetivos de enfoque del
Summary in Spanish
7
láser de trapping de corta distancia y alta magnificación) que permiten dar un contexto a las propiedades físicas de la trampa óptica propuesta para la plataforma OC-OT-LIBS y resaltan, por primera vez, la sensibilidad de las pinzas ópticas a ligeros cambios composicionales de las partículas bajo estudio.
A continuación se resumen detalladamente los capítulos que integran esta tesis, comenzando por los objetivos de cada trabajo, resultados obtenidos e interpretación de los mismos y conclusiones extraídas.
Capítulo 1. Eficiencia de atomización y producción de fotones en el análisis mediante espectroscopía de plasmas inducidos por láser de nanopartículas individuales en una trampa óptica
La tecnología OC-OT-LIBS fue por presentada por primera vez en 2014 por nuestro grupo en un trabajo publicado por Fortes, Fernández-Bravo y Laserna en Spectrochimica Acta Parte B. En dicho artículo los autores demostraron la posibilidad de aislar una partícula individual perteneciente a un aerosol sólido producido mediante eyección por catapultado óptico en una trampa óptica formada con un láser continuo de Ar+ (λ trabajo = 514.5 nm) a presión atmosférica y de someterla a análisis LIBS. Gracias a la intervención secuencial de estas tres técnicas se pudieron inspeccionar partículas de composición, naturaleza química y tamaños diferentes siendo las más pequeña de ellas de Al2O3 con un tamaño medio de 100 nm. Estos estudios condujeron a establecer un límite de detección para Al de 200 attogramos, suponiendo los primeros y prometedores pasos de la tecnología.
Sin embargo, el estado desarrollo de OC-OT-LIBS aún dejaba lugar a la exploración de factores básicos tales como los parámetros que condicionan la señal LIBS (como la fluencia o el retraso en la adquisición del detector) y su relación con la masa y el tamaño de las partículas inspeccionadas. En este primer capítulo se busca adicionalmente presentar una plataforma instrumental robusta a la par que flexible con un protocolo de alineado sencillo para facilitar el trabajo con el sensor y habilitar líneas con objeto de estudiar parámetros experimentales adicionales como la rigidez de la trampa en función del tamaño de partícula. Las muestras usadas son partículas de grafito de tamaño promedio entre 2 µm y 400 nm con masas de 9 picogramos y 75 femtogramos, respectivamente. Ambos tipos de partícula en formato polvo fueron depositadas en portaobjetos de vidrio de 200 µm de espesor y cubiertas con una cubeta de plástico de 10 mm de paso de luz para evitar la pérdida de muestra por difusión a la atmósfera del laboratorio tras la eyección o por corrientes de aire.
Summary in Spanish
8
Los espectros LIBS, además de confirmar la capacidad de detectar las partículas, el número de ellas inspeccionado en el evento registrado y establecer un límite de detección para el C, se usaron extraer la eficiencia del proceso de disociación y excitación. Se busca establecer una conexión entre estos resultados y los mecanismos responsables de la disociación y la excitación de las muestras, que pudo ser discernido en base a resultados de estudios resueltos en el tiempo de imágenes de plasmas inducidos por láser.
La plataforma OC-OT-LIBS sufrió modificaciones con respecto a la primera versión publicada. Para facilitar la comprensión del diseño, se estableció un sistema de coordenadas cartesiano tridimensional con centro en la partícula levitada. En el eje x del instrumento se ubicaron las líneas de catapultado óptico y excitación de la partícula, ambas tareas llevadas a cabo por el mismo láser pulsado (Nd:YAG, λ = 1064 nm, 6 ns de ancho de pulso). En esta ocasión, el catapultado óptico se realizó gracias a la onda de choque generada por un plasma inducido por láser en aire. En el mismo eje, una cámara CMOS acoplada a un objetivo de microscopio 10x permitió monitorizar el movimiento de las partículas para calibrar la fuerza de la trampa. Tras la producción del aerosol, las partículas fueron atrapadas en el eje z usando un láser continuo Nd:YAG a 532 nm de longitud de onda. La potencia de salida de este láser era de 300 mW y se enfocó haciendo uso de un objetivo de microscopio de larga distancia de trabajo (magnificación 20x) para lograr establecer la trampa óptica lejos de la base de la cámara de la muestra, evitando así que partículas depositadas de nuevo tras el catapultado interfirieran en el análisis. La línea de detección LIBS, consistente en un par de lentes biconvexas para enfocar la radiación del plasma a la apertura de una fibra óptica conectada a un espectrómetro integrado en el tiempo, así como la cámara iCCD empleada para alinear el instrumento y realizar los estudios de imágenes con resolución temporal se instalaron en el eje y. Se hizo uso de dos generadores de pulso para sincronizar el disparo del láser de análisis con la apertura del espectrómetro, pudiéndose así modificar el retraso en la adquisición de los espectros.
Se desarrolló una rutina de alineado del instrumento consistente en varios pasos. En primer lugar, se toma una imagen de un plasma generado en aire libre de muestra. Esta imagen indica la posición exacta en el plano xz en la que debe ubicarse la partícula para ser interceptada por el láser de análisis. La localización de la partícula atrapada pudo ser monitorizada en tiempo real registrando la luz del haz de atrapado dispersada por ésta con la cámara iCCD. De no coincidir la ubicación con el centro del plasma de aire observado en el paso anterior, la partícula se manipula moviendo el objetivo de atrapado a lo largo del eje z hasta corregir la posición. El origen del sistema de coordenadas (0,0,0) se estableció en la intercepción entre el centro del plasma de aire y la partícula. Por último, para alinear la detección de la señal LIBS, la fibra óptica conectada al detector se desacopló para hacer
Summary in Spanish
9
pasar por ella un puntero láser rojo. La luz roja sigue el camino inverso de la luz del plasma y atraviesa la celda de la muestra entrando en la iCDD, indicando así si es necesario reajustar la etapa en la que se encuentra montada la fibra.
Mediante observación con la cámara CMOS del eje x se pudo confirmar que la trampa desarrollada era lo suficientemente estable para aislar partículas y mantenerlas atrapadas a pesar de las colisiones con otras partículas del aerosol previas a la relajación de la circulación del mismo. Las partículas se pudieron manipular a lo largo del eje z y mantuvieron su posición durante el tiempo requerido para proceder al análisis. Tanto las partículas de 2 µm de tamaño como las de 400 nm se lograron mantener atrapadas en aire a presión atmosférica durante periodos de tiempo de 8 horas a temperatura ambiente.
La rigidez de la trampa se calculó en base al movimiento browniano de la partícula dentro de la trampa, registrado por la cámara CMOS, tras extraer las coordenadas del centro de gravedad de la partícula en cada frame de vídeo guardado usando una rutina desarrollada para el software ImageJ. La matriz de posiciones obtenida se introdujo en el software Tweezpal, arrojando éste lo valores de la rigidez de la trampa en los ejes z, vertical, e y, horizontal, (kz y ky, respectivamente). Dado que la morfología de las partículas empleadas es esférica, se puede asumir que las fuerzas ópticas que éstas experimentan en ambas direcciones laterales son iguales y, por tanto, kx = ky. Se pudo observar que, de acuerdo con la teoría, la fuerza de atrapado de las partículas de 2 µm fue el doble que la observada para partículas de 400 nm y cómo el atrapado en la dirección lateral superó por dos órdenes de magnitud la fuerza del atrapado coaxial con el eje de atrapado, lo cual se debe a la mayor magnitud de la fuerza de gradiente, responsable de mantener las partículas en el foco del láser, en la dirección horizontal, donde las fuerzas de extinción que empujan a la partícula fuera de la trampa son más débiles.
Dos parámetros se estudiaron sistemáticamente para optimizar la señal LIBS, la densidad de energía sobre la muestra (Fluencia, F = J/cm2). La necesidad de este estudio vino motivada principalmente por la restricción de que cada partícula atrapa puede someterse a LIBS una única vez, imponiendo pues un régimen de trabajo de disparo único.
La fluencia sobre la partícula se varió desplazando a lo largo del eje x el objetivo de enfoque del láser de análisis y, por tanto, el punto en el cual éste se enfocaba. El barrido de posiciones se realizó desde 1.5 mm antes de la partícula (-1.5 mm) hasta 1.5 mm después de la partícula (+1.5 mm), manteniéndose como 0 la posición en la cual el foco quedaba exactamente encima de la partícula atrapada. La energía se mantuvo constante a 260 mJ y se monitorizó la evolución de la señal de la transición principal de la banda molecular de CN a 388.3 nm.
Summary in Spanish
10
La distribución de señal permitió observar que las condiciones de trabajo más favorables eran aquellas en las que el foco quedaba lejos de la partícula ya que así se logró evitar la interferencia en el espectro de líneas de aire, cuyo plasma se forma de manera inevitable junto al de la partícula. Por otra parte, el estudio de retraso en la adquisición de la señal demostró que un valor total de retraso de 5.28 µm suponía una mejora en la relación señal-ruido para la señal monitorizada debido a un descenso conjunto del fondo del espectro y de la intensidad de las señales iónicas originadas por el plasma de aire, principalmente N(II). Estos estudios resultaron en una disminución de la desviación estándar de la señal del 30-50% al 10% para las micropartículas y al 19% para las esferas de 400 nm de diámetro, valores inferiores a los habitualmente encontrados en LIBS sobre aerosoles, además, la eficiencia de muestro resultó ser del 100%, es decir, todo disparo sobre una partícula resultó en un espectro LIBS con señal de CN. El límite de detección para el C se estableció en 1.7 fg tras la optimización de la señal.
Se puso observar experimentalmente que trabajar con valores de fluencia inferiores al umbral de ruptura dieléctrica del aire resultaba en la ausencia de señal de la partícula. Este hecho sugiere la existencia de una relación directa entre el plasma de aire y la disociación y excitación de la partícula. Este mecanismo, que resta relevancia a la interacción directa entre la partícula y el pulso láser, fue propuesto en trabajos anteriores, donde se demostró que el plasma de aire al ir evolucionando a lo largo de su tiempo de vida engulla la partícula y la atomiza mediante trasferencia de energía en forma de calor. Este mecanismo es consistente con las imágenes resueltas en el tiempo obtenidas usando la cámara iCCD para plasmas de diferentes partículas y enfocando el pulso de muestreo en distintas posiciones. En ellas se pudo contemplar cómo el plasma, al crecer en volumen con el paso del tiempo incluía a la partícula en su zona periférica. La intensidad LIBS registrada en el caso de excitar la partícula con el foco localizado en la posición +1.5 mm resultó ser ligeramente inferior a la obtenida para la posición -1.5 mm, esto puede deberse a que el plasma en el primer caso engulle a la partícula casi 700 ns después por lo que dispone de una menor cantidad de energía que transferir, al perderse parte de ésta en el transcurso del proceso de expansión.
En último lugar, para establecer la eficiencia de excitación de cada tamaño de partícula se calculó la producción de fotones por gramo de muestra. Para ello, se calculó el número de fotones requeridos para generar en el detector una única cuenta a la longitud de onda de interés según la expresión:
𝑆𝑆 =𝜔𝜔𝑑𝑑
𝑄𝑄𝐸𝐸𝜓𝜓
Summary in Spanish
11
Donde S es la sensibilidad del detector, ωd, la profundidad del píxel donde se recoge la luz de la λ de trabajo, QE, la eficiencia cuántica del detector y ψ, el convertidor AD de 16 bits del espectrómetro empleado. Tras esto, haciendo uso del valor de la intensidad neta de la señal de interés en el espectro, se pudo obtener el número de fotones que había recogido el detector. No obstante, es importante tener en cuenta las pérdidas de fotones a lo largo del camino desde la fuente, el plasma, hasta la matriz del detector. Para ello, se procedió a recorrer el camino de la luz en sentido detector-fuente, teniendo en cuenta el acople fibra-espectrómetro, la reflexión en cada una de las superficies ópticas atravesadas y los fotones emitidos por el plasma en direcciones diferentes a la de colección suponiendo su geometría esférica. Los resultados de este estudio indican que la eficiencia de excitación es superior cuanto más pequeño es el tamaño de partícula (2.78x10²⁰ fotones g-1 emitidos por las partículas de grafito de 400 nm por 2.72x10¹⁸ emitidos por las de 2 µm). En base al mecanismo propuesto para la disociación de la partícula y la excitación de los átomos liberados, este hecho puede atribuirse a que el menor número de enlaces a disociar presentes en las partículas de menor tamaño resulta en una fracción mayor de energía del plasma de aire que destinar a la promoción de fragmentos a niveles excitados.
Capítulo 2. Identificación espectral en el régimen de los attogramos usando espectroscopía de emisión inducida por láser de nanopartículas atrapadas ópticamente en aire
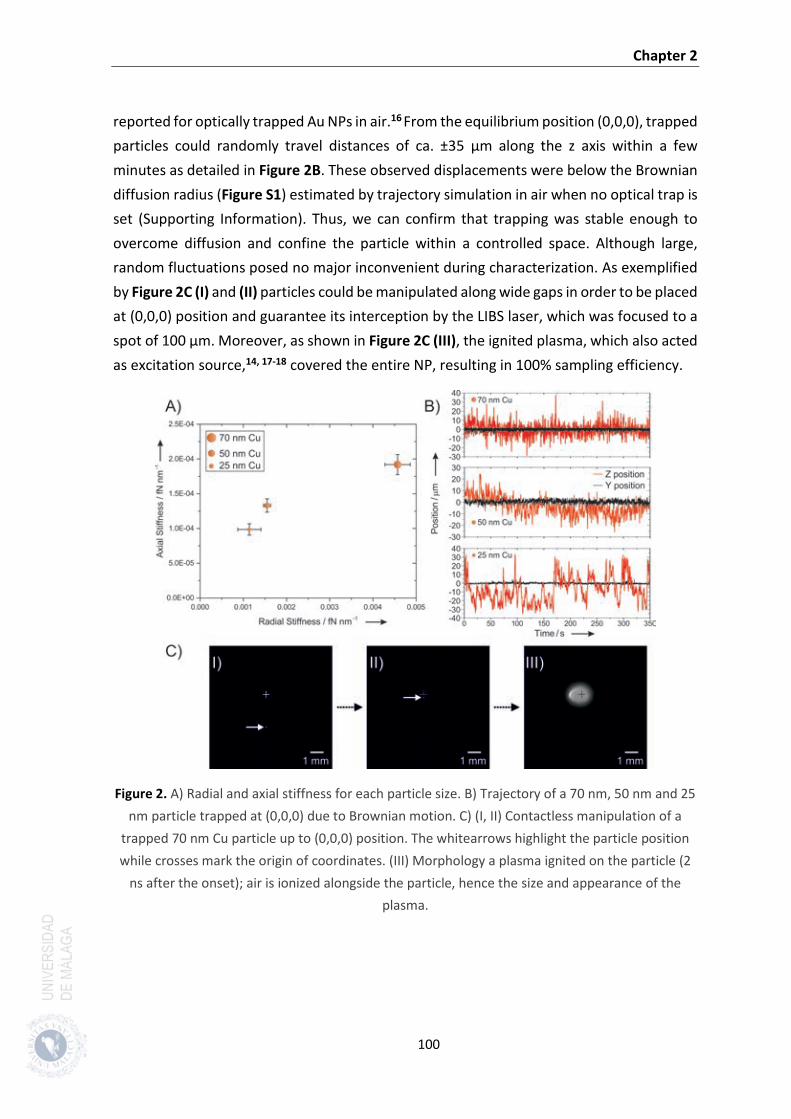
El objetivo fundamental de este capítulo fue el lograr establecer tamaños mínimos de partícula aislables y analizables por el sensor OC-OT-LIBS descrito en el primer capítulo. Para ello, se emplearon NPs de Cu de 25, 50 y 70 nm de tamaño promedio con masas de 0.073, 0.586 y 1.61 fg respectivamente. El primer reto enfrentado fue asegurar el atrapado de las partículas a pesar de la baja presión de radiación en el foco consecuencia del uso de un objetivo de larga distancia de trabajo necesario para llevar a cabo los experimentos reduciendo interferencias de otras partículas en el espectro. Estas condiciones podrían implicar un valor bajo de la fuerza de gradiente por debajo del necesario para mantener las muestras dentro de la trampa. Además de por observación directa mediante las cámaras iCCD y CMOS, se evaluó de manera análoga a la anteriormente descrita la rigidez de la trampa para cara tamaño de partícula. Se pudo comprobar que las fuerzas registradas siguieron de nuevo una tendencia creciente al aumentar el tamaño de la partícula, siendo el atrapado en el eje horizontal más fuerte que en el vertical por órdenes de magnitud. Para asegurar que las partículas se encontraban efectivamente atrapadas en el foco del láser y no simplemente suspendidas y realizando movimiento browniano libre se llevó a cabo una simulación de trayectoria de partículas de tamaño idéntico a las empleadas en los estudios. La simulación se realizó a diferentes temperaturas ajustando en cada caso la viscosidad del
Summary in Spanish
12
aire así como en presencia y ausencia de un campo de atrapado de fuerza idéntica a la obtenida tras el calibrado experimental de la trampa. Las trayectorias de cualquier tamaño de partículas en ausencia de un campo de presión de radiación abarcaban varios cientos de micras incluso en el caso de temperatura ambiente. Por el contrario, al aplicar una fuerza de atrapado, el movimiento de éstas quedaba confinado a un espacio de apenas ±35 µm en el eje vertical y aproximadamente ±10 µm en los ejes x e y. El grado de correlación entre las trayectorias simuladas y las registradas de manera experimental fue lo suficientemente alto para asegurar que las partículas se encontraban atrapadas por efecto del haz láser continuo y no por colisiones con moléculas circundantes. Se pudo comprobar también que las partículas podían ser manipuladas a lo largo del eje z hasta ubicarlas en la coordenada (0,0,0) del sistema y permaneciendo atrapadas hasta 60 minutos en el caso de las NPs de 70 nm. Se observó que el tamaño de los plasmas producidos sobre la partícula era suficiente para cubrir completamente la partícula, lo que llevó a una eficiencia de muestreo del 100%. Por otra parte, se demostró por primera vez el atrapado óptico estable de nanopartículas de Cu en aire empleando una longitud de onda visible, quedando respaldados los resultados experimentales con cálculos teóricos de la polarizabilidad de las partículas que demuestran que las longitud de onda de atrapado usada en el trabajo aseguraba valores de la parte real por encima de los de la parte imaginaria, requisito indispensable para lograr retener las NPs en la trampa.
Para asegurar que los eventos LIBS registrados pertenecían a una única partícula y no a un aglomerado de ellas se desarrolló un método de clasificación basado en la agrupación de las señales netas más bajas registradas. Tras descartar puntos de relación señal ruido menor que 3 y aglomeraciones evidentes, se asumió que los datos de menor intensidad eran lo generados por partículas individuales. En base a la intensidad promedio estos eventos y el triple de la desviación estándar de los mismos, se estableció una ventana de intensidades netas para cada diámetro de partícula estudiado dentro de la cual se podía asegurar que el espectro adquirido pertenecía a una única partícula. Tras aplicar este método de clasificación, se concluyó que todos los tamaños de partícula podían ser detectados con relación señal-ruido superior a 3 empleando la líneas de Cu a 324.7 nm. El estudio de la relación entre la señal registrada y la masa de la partícula inspeccionada resultó en una correlación lineal de coeficiente de regresión r = 0.997 de la cual se pudo extraer un límite de detección para Cu de ≈59 attogramos, siendo directamente detectables masas de 73 ag. Estos valores suponen una sensibilidad sin precedentes en las técnicas espectroscópicas de emisión.
De nuevo, tras realizar los cálculos de la emisión de fotones por gramo de muestra, se pudo observar una mayor eficiencia de excitación conforme el tamaño de la partícula
Summary in Spanish
13
disminuye. Basados en la anterior experiencia con el grafito, este resultado supuso una nueva confirmación del papel principal que juega la interacción plasma de aire-partícula atrapada en la disociación y la excitación de la misma. En este caso, para plasmas generados con similares características físicas, se puede proponer que el mayor número de enlaces Cu-Cu encontrados en las partículas de 70 nm de diámetro requiere de la transferencia de una fracción superior de energía por parte del plasma de aire que las partículas de 50 y 25 nm y, como consecuencia, la fracción que puede ser destinada a excitación disminuye. La correlación lineal entre intensidad LIBS neta y masa de Cu inspeccionada refuerza el argumento puesto que demuestra que los tres tamaños estudiados son completamente disociados en el plasma. Este aumento de la eficiencia de excitación al disminuir el tamaño de partícula se postula como una de las claves de la sensibilidad extrema del sensor OC-OT-LIBS.
Capítulo 3. Detección elemental simultánea de cantidades sub-femtogramo en nanomatrices multicomponente empleando espectroscopía de plasmas inducidos por láser en trampas ópticas a presión atmosférica.
La capacidad de identificar múltiples componente de una muestra en una única medida es una de las principales ventajas asociadas a LIBS. No obstante, hasta el momento, aún quedaba por demostrar que esta cualidad podía ser trasladada al terreno de la nanoinspección usando espectroscopía de plasmas inducidos por láser. En este capítulo, apoyados en el conocimiento previo generado con respecto a la respuesta del Cu en OC-OT-LIBS, se busca demostrar la capacidad de la técnica para detectar varios elementos presentes en una nanopartícula en cantidades de attogramos. Para ello, se emplearon dos tipos de espinela parcialmente sustituidas con Cu+2, en concreto CuFe2O4 y CuZnFe2O4 de 90 nm de tamaño.
En primer lugar se buscó mejorar la productividad de la técnica OC-OT-LIBS introduciendo un sistema de muestreo mejorado usando partículas de Cu de 70 nm. Esta estrategia se basó en el empleo de conos impresos en 3D diseñados como los conos skimmer usados en espectrómetros de masas, esto es, con un orificio en la cúspide de los mismos. Esta apertura, del diámetro justo para permitir el paso del haz de atrapado, actuó de filtro para reducir la densidad el aerosol generado por catapultado óptico puesto que la mayor parte de las partículas eyectadas quedaron retenidas dentro del cono de muestreo al chocar con las paredes del mismo. Como resultado de la implementación de ésta estrategia, se logró duplicar la eficiencia analítica de la técnica, pasando de un registro de aproximadamente 9 eventos por hora a 20 nanopartículas por hora. Además, se aumentó la eficiencia de atrapado, lográndose retener una partícula en 9 de cada 10 eventos de
Summary in Spanish
14
catapultado. El tiempo de análisis se redujo a menos de la mitad (de 6.8 a 3.2 minutos) y gracias al menor número de partículas, la cantidad de eventos atribuibles a una sola NP pasó del 31% al 56%. Esta mejora supuso una mayor facilidad para trabajar con la plataforma, permitiendo calibrar su respuesta para un determinado elemento de manera sencilla.
La ventana espectral empleada durante el análisis de las ferritas cubría desde 260 hasta 430 nm, permitiendo observar señales de todos los metales constituyentes de las NPs (Cu, Fe y Zn). Las líneas más intensas registradas y, por consiguiente, usadas para los la monitorización de los elementos y estudios posteriores tales como el cálculo de límites de detección fueron: Fe (II) a 274.69 nm, Cu (I) a 324.75 nm y Zn (I) a 334.50 nm. La línea iónica de hierro se eligió en detrimento de otras más habituales como la de Fe (I) a 302.04 nm por su buena reproducibilidad partícula a partícula y su buena relación señal-ruido. Para asegurar que los eventos registrados correspondían únicamente a una partícula, se interpoló la señal de Cu de las ferritas en una recta de calibrado hecha con partículas de 25, 50 y 70 nm de Cu puro ya que la masa contenida en estas dos muestras entraba dentro del rango de calibración. Los resultados mostrados en los anteriores capítulos demuestran que ésta aproximación es correcta puesto que partículas de hasta 2 µm de tamaño se disocian completamente en nuestro sistema. Todos los elementos se pudieron detectar simultáneamente con relaciones señal-ruido por encima de 3. A pesar de la mayor cantidad de hierro presente en las partículas de CuZnFe2O4, la señal registrada para este elemento fue mayor en el caso de las NPs de CuZnFe2O4. Esta observación se atribuyó a la presencia de enlaces Zn-O en sustitución parcial de enlaces Cu-O. El menor valor de entalpía de disociación de los enlaces Zn-O permitiría excitar con mayor eficiencia los átomos liberados de esta red cristalina. Usando las intensidades netas presentes en los espectros promedio para cada ferrita se pudieron establecer los límites de detección individuales para cada especie, siendo estos: 575 ag para Fe, 450 ag para Zn y 37 para Cu (usando la recta de regresión), lo que supone una mejora con respecto al anteriormente reportado. Además, se pudo confirmar la detección directa de masas de 770 ag de Fe y 450 ag de Zn.
Dadas las múltiples líneas presentes en los espectros registrados durante los experimentos y la similitud de tamaño entre ambas ferritas, el estudio de la eficiencia de excitación en este caso presentaba un doble interés: comparar la eficiencia entre cada elemento y comprobar si la nanomatriz en la que se encontraban ocluidos influenciaba de alguna manera a este parámetro. En este caso se tomaron todas las líneas correspondientes a los tres analitos presentes en los espectros, esto es, además de las anteriormente mencionadas, el tránsito de Cu (I) a 327.39 nm y los de Fe (II) a 273.95, 274.91 y 275.57 nm. La emisión promedia entre ambas líneas de cobre resultó ser
Summary in Spanish
15
prácticamente idéntica en ambas matrices, lo que evidencia una eficiencia similar de los procesos de disociación y excitación para ambas partículas. Además, este hecho indica una potencial saturación del proceso de excitación, siendo promocionada a estados excitados la población completa de átomos de un determinado elemento gracias a la transferencia de energía desde el plasma del aire. La emisión de fotones por parte del Fe registrada para ambas ferritas confirmó la mayor eficiencia de excitación para este elemento en la espinela con Zn, validando el argumento dado en el párrafo anterior. Por otro lado, la pobre emisión por parte del Zn, anticipada por los datos LIBS, indicó la posible dependencia de la eficiencia de excitación con la energía del estado excitado, parámetro que condiciona la intensidad de una línea junto a otros tales como la fuerza del oscilador o la probabilidad de transición. Al cotejar con la bibliografía la energía de los estados superiores involucrados en cada una de las transiciones monitorizadas se observó que los niveles E1 más bajos correspondían a las líneas de Cu, las más intensas en los espectros, mientras que la línea de Zn poseía el estado excitado de mayor energía (7.76 eV). Además de explicar los resultados obtenidos por LIBS, este hallazgo señala la población preferente de líneas con estados excitados de bajas energía en OC-OT-LIBS, hecho respaldado por la caída exponencial hallada al representar la producción de fotones de cada línea contra la energía del nivel E1. Además de ser compatible con el mecanismo propuesto de interacción plasma de aire-partícula, estos resultados permiten anticipar los elementos que serán detectados con más facilidad en experimentos que empleen la tecnología aquí planteada.
Capítulo 4. Las trampas ópticas revelan diferencias en las propiedades dieléctricas y ópticas de las nanopartículas de cobre en comparación con sus óxidos y ferritas.
El trabajo desarrollado a lo largo de este capítulo se realizó en los laboratorios del Instituto Niels Bohr pertenecientes a la Universidad de Copenhague, Dinamarca, donde el doctorando realizó su estancia pre-doctoral de cuatro meses en el grupo Optical Tweezers bajo la supervisión de la profesora Lene Oddershede.
Durante esta estancia se buscó el obtener datos relacionados con las partículas analizadas en nuestro laboratorio en Málaga para poder contextualizar la trampa desarrollada con otros montajes experimentales más habituales, es decir, haciendo uso de objetivos de microscopio de alta magnificación y apertura numérica y empleando agua como medio de atrapado. Las nanopartículas de Cu de 70, 50 y 25 nm empleadas permitieron, además, realizar estudios de atrapado cuantitativo y calcular propiedades de este material, poco explorado en bibliografía de trapping. La resolución de las pinzas ópticas empleadas en este trabajo permitió evaluar el impacto de la oxidación espontánea
Summary in Spanish
16
del Cu en el atrapado de NPs de este material, sus propiedades tales como la capacidad de producir un calentamiento localizado como otras nanopartículas plasmónicas y la capacidad de manipularlas. También se hizo uso de partículas de 90 nm de CuFe2O4 y CuZnFe2O4 para explorar la variación de dichas propiedades al cambiar la naturaleza química de la partícula de metálica a puramente iónica, estableciendo así un escenario de mayor contraste que el caso de la pasivación superficial de la partícula. El conocimiento arrojado sobre el comportamiento de estas especies podría abrir la puerta a nuevas aplicaciones tales como activación localizada de nanocatalizadores o la nanotermometría usando estos nanomateriales basados en Cu.
El montaje experimental empleado en este capítulo se encontraba integrado en un microscopio vertical donde un láser continuo de Nd:YVO4 funcionando a su longitud de onda fundamental (λ = 1064nm) se enfocó a través de un objetivo de microscopio de inmersión en aceite de factor de magnificación 100x y apertura numérica 1.4 para generar la trampa óptica. El aceite empleado para la inmersión del objetivo poseía un índice de refracción n = 1.54, asegurando así aberraciones esféricas mínimas en el plano de la muestra, ubicado aproximadamente 5 µm por encima de la superficie de la cámara de la muestra, formada por dos portaobjetos de vidrio de 200 µm de espesor. Para visualizar las partículas se usó una cámara CCD mientras que la señal de la trampa se monitorizó proyectando la luz dispersada por éstas en un fotodiodo de cuadrante, cuya traza, que representa el movimiento de la partícula dentro de la trampa óptica se registró en un osciloscopio. La amplitud de la señal adquirida en tiempo real permitía conocer si la trampa se encontraba vacía, con una partícula o con varias de ellas, caso fácilmente detectable por la saturación de la lectura del fotodiodo de cuadrante. A medida que se adquiría señal de las partículas, se generaron espectros de potencia de los cuales se extrajo el valor de la frecuencia (fc) mediante ajuste lorentziano. Este parámetro, característico para cada tamaño de partícula y la potencia del láser empleada permitió conocer la rigidez de la trampa para cada una de las cinco muestras, que se diluyeron en 1.5 ml agua tras agitación en ultrasonidos y filtrado a través de una membrana con poros de 100 nm de diámetro. Para evaluar la concentración resultante de este procedimiento de preparado de muestra así como para cotejar la información morfológica suministrada por el proveedor de las mismas se observaron las partículas mediante microscopía electrónica de transmisión. Se pudo comprobar que las suspensiones preparadas tenían una concentración de partículas suficientemente baja para asegurar que la mayoría de los eventos se debían a una única partícula (normalmente se debía permitir pasar un tiempo de 10 minutos para lograr que una partícula difundiera hacia el seno de la trampa).
Summary in Spanish
17
La trampa óptica empleada ejerció una fuerza armónica sobre las partículas aisladas, lo que se pudo comprobar al representar el histograma de posiciones visitadas por la partícula durante el tiempo de adquisición, cuya forma fue gaussiana, tal y como se preveía. La distribución de posiciones se ensanchó al crecer el tamaño de las partículas puesto que los desplazamientos desde la posición de equilibrio de la trampa aumentan con el diámetro de las mismas. La comprobación de que las partículas se encontraban
atrapadas en un campo de potencial armónico permitió emplear la relación 𝑓𝑓𝑐𝑐 = 𝜅𝜅2𝜋𝜋𝜋𝜋
para
conocer los valores de la fuerza de la trampa (κ). De manera análoga a la observada para otras nanopartículas metálicas como Ag, Au o Pt, la rigidez de la trampa para las NPs de Cu aumentó linealmente con la potencia del láser en el plano de la muestra y el tamaño de la partícula. Es interesante señalar que, a pesar de su mayor tamaño, la fuerza de atrapado de las ferritas resultó ser inferior a la calculada para NPs de Cu de 70 nm, siendo más parecidos los valores obtenidos a los de Cu de 50 nm. Este hecho se atribuyó al cambio de la naturaleza de los enlaces que unen a los átomos constituyentes en cada tipo de partícula. Las ferritas, al estar más restringido el movimiento de los electrones debido al enlace iónico que en las partículas metálicas, poseen una menor polarizabilidad que las nanopartículas de cobre, en las que los electrones circulan libremente alrededor de los núcleos de Cu. Dada la dependencia de la rigidez de la trampa con la polarizabilidad, la fuerza de gradiente es directamente proporcional a αr, la interacción láser-partícula fue menor en el caso de las ferritas. Comparando la rigidez para cada tipo de ferrita se pudo observar un atrapado más débil en el caso de las partículas de CuZnFe2O4, lo que puede deberse al mayor carácter covalente de estas NPs en las que el Zn sustituye parte de los enlaces Cu-O restringiendo aún más la movilidad electrónica y disminuyendo el valor de la permitividad de esta especie en comparación con el CuFe2O4.
El grado de oxidación de las partículas de Cu estudiadas así como el impacto de esta reacción química en las propiedades del material se estudió apoyando los datos experimentales con simulaciones teóricas por modelado de elementos finitos (FEM), que permitió conocer los valores de las secciones cruzadas de absorción y dispersión así como los de la parte real e imaginaria de la polarizabilidad. Se simularon tanto partículas de Cu como de CuO puro de 25, 50 y 70 nm. Del buen grado de correlación de los ratios calculados entre la polarizabilidad obtenida por FEM para las partículas metálicas y los obtenidos a partir de los valores experimentales de κ (ambos parámetros son directamente proporcionales en las condiciones experimentales usadas) se pudo deducir que el grado de oxidación de las partículas no debía ser superior a unos pocos de nanómetros. Para confirmar esta observación, se simularon también partículas de Cu de 70 nm cubiertas una capa de CuO de espesor variable entre 2 y 10 nm. La variación encontrada en los valores
Summary in Spanish
18
de las propiedades ópticas fue pequeña, con lo cual el espesor de las capa de CuO que cubría a las partículas, de existir, no era superior a 10 nm. Es importante señalar que una capa de 10 nm es capaz de invertir el signo de la parte real de la polarizabilidad a longitudes de onda cercanas a la de resonancia del plasmón superficial del Cu (aproximadamente 600 nm), lo cual indica que se podría discernir la existencia de pasivación superficial escogiendo longitudes de onda de atrapado específicas.
Por último, se estudió el calentamiento de las partículas de Cu como consecuencia de la radiación láser recibida al ser atrapadas. Un aumento significativo del valor de la temperatura podría afectar negativamente al atrapado ya que supondría una aceleración del movimiento browniano de las mismas hasta un punto en el cual la fuerza óptica ejercida por el láser no sea suficiente para retenerlas en el foco. De nuevo, se recurrió a simulación FEM para partículas de Cu y partículas tipo núcleo-corteza de Cu-CuO con valores de espesor de cubierta variables a potencias de atrapado variables. Se observaron incrementos de temperatura comparables con los medidos para Au y Pt. Aun siendo insuficientes para provocar la expulsión de las partículas de la trampa, estos valores son interesantes para considerar las nanopartículas de Cu como un potencial material para llevar a cabo estudios de calentamiento plasmónico con posibles aplicaciones como la catálisis heterogénea.
19
Objectives
Nanotechnology has attracted a great deal of attention over the last two decades turning into one of the most active research areas in multidisciplinary science. As a consequence, numerous technical developments are steadily reported in literature. While simple nanodevices based on monoelemental spherical particles are already found in consumer-accessible items, state of the art engineered structures feature intricate morphological designs and chemical compositions to enhance their performance and to be capable of covering the advance demands arising from different industries as they were envisioned to do since their inception. Apart from their commercial potential, as the term “nano” has trespassed the boundaries of technical language and has permeated into general society, the awareness of the threat that particles emitted as a product of human activities or from natural occurrence may pose to the environment and health. This has motivated a number of studies focused on unveiling the toxicity of nanoparticles as well as their fate once released into the media and absorbed by an organism. With nanotechnology becoming a reality, it is the obligation of Analytical Chemistry to provide the researchers working in the field with robust tools to carry out the thorough characterizations required by these particular materials.
Well-stablished analytical techniques such as mass spectrometry, absorption spectroscopy or optical emission spectroscopy have been successfully adapted to perform well with nanoanalytes owed to new methodologies covering new sample preparation pathways, more specific measuring procedures and data processing. Still, classic limitations, such as restricted number of elements detectable within a single event or ambiguous differentiation of particle clusters, inherent to the aforementioned techniques persist when used for nanoinspection.
Over the last two decades, Laser-Induced Breakdown Spectroscopy has become a powerful analytical tool with high adaptability, which has resulted in numerous and diverse applications based on this emission spectroscopy being reported in scientific literature. Among staple features of the technique are its great synergy with other analytical techniques, little to no sample preparation required and the possibility of performing straightforward multielemental chemical characterization.
This work focuses on demonstrating the perspectives of LIBS as a nanoinspection tool as a methodology for the analysis of single nanoparticles is presented. Give that the unique properties of these materials are heavily dependent on size and composition even the slightest changes may alter their function, hence, shape-sensitive tools capable of
Objectives
20
detecting undesired components within a single measuring event are useful for particle-to-particle characterization of an entire NP population. In this sense, the combination of LIBS with optical trapping fulfill these two premises as isolation of species can be restricted to specific morphologies while panoramic spectra are produced usually featuring multiple useful atomic lines. Moreover, by using optical catapulting as a mean of aerosol production, suspension of samples and particle alteration owed to interactions with the solvent are avoided. Since optical catapulting enables the possibility of working with solid samples, one of the main advantages of LIBS, i.e. minimum sampling preparation, is directly carried into nanocharacterization experiments.
The main objectives of the research presented herein can be summarized as follows:
I) To design, build and modify an instrumental platform integrating different laser-based techniques for the production of solid aerosols, the optical isolation of particles from the aerosol stream and the chemical characterization of individual micro- and nanoparticles using laser-induced emission spectroscopy.
II) To demonstrate the capability of the OC-OT-LIBS sensor to stably trap micro- and nanoparticles in air and reach single particle resolution.
III) To study the influence of the different parameters for the three different stages of OC-OT-LIBS analysis and find general optimum working conditions for a variety of samples.
IV) To develop a simple scheme for precise alignment of the different lines composing the analytical platform.
V) To establish the minimum as maximum particle size that can be individually secluded within the optical trap of the instrument.
VI) To calibrate the stiffness of the optical traps as a function of particle size and composition and compare the results with those yield by classical trapping instrument using water as trapping medium.
VII) To demonstrate LIBS detection of single particle of mono- and multielemental chemical composition, thus adapting the technique for nanoinspection.
VIII) To improve the sampling efficiency and relative standard deviation of aerosol analysis using LIBS.
Objectives
21
IX) To quantitatively measure the excitation efficiency as a function of pulse energy, particle size and particle composition by calculating the photon yield or absolute production of photons per sample gram from recorded LIBS spectra.
X) To study the fundamentals and mechanisms leading to particle dissociation and excitation of the free constituent atoms and relate them to the recorded signal.
XI) To establish the minimum directly detectable mass using LIBS as well as the limits of detection of OC-OT-LIBS.
23
Introduction
1. A brief history of nanoscience
“There is plenty of room at the bottom” was the title of the reportedly casual talk delivered by the Nobel Prize in Physics laureate Richard Feynman at Caltech during the meeting of the American Physical Society in 1959.1 He shared a series of personal thoughts with the audience regarding the possibilities that controlling the small scale could potentially offer to the different scientific areas of knowledge. The need for developing and improving tools such as electron beam lithography or electron microscopy in order to do so was also discussed. Despite the positive reception of the lecture and the interest sparked by Feynman’s words, the response, from a scientific production perspective, was rather lukewarm. The printed version of the talk, published in Science and Engineering (1960), was cited merely 7 times in 21 years and it took well over a decade to see the first results of researches inspired by these concepts.
Professor Norio Taniguchi from the Tokyo University of Science coined the term nano-technology in the paper titled “On the Basic Concept of ‘Nano-Techonology´” published in 1974.2 Apart from providing a name to the field hinted by Feynman, Taniguchi defined it as “The processing, separation, consolidation and deformation of material by one atom or one molecule”. In this work, processes with finesse in the order of nanometers for semiconductors, for example, thin film deposition, were discussed. It is of interest to note that this paper circumscribed the scale of interest of the area to 10-9 m, deviating from the focus on single atom manipulation to which the original proposition was prone. However, the term disappeared from scientific literature until 12 years later.
Nanotechnology gained significant relevance during the decade of 1980 starting with the influential paper by Eric Drexler “Molecular engineering: An approach to the development of general capabilities for molecular manipulation”.3 Drexler discussed the work with Feynman before it was published as the work was strongly based on the concepts introduced and the questions posed by the latter, clearly indicated by the opening sentence of the paper, a direct allusion to the 1959 talk. Despite the controversies surrounding the perspective on nanotechnology pushed by Drexler, it is of unanimous consensus that he is one of the great promoters of the field and was key on its popularization due to (unknowingly) rescuing the term in his 1986 book “Engines of creation: The coming era of nanotechnology”.4 Throughout this years, the crucial developments of scanning tunneling microscopy, which later lead to atomic manipulation, or quantum dots synthesis and their possible applications5 helped the field gain momentum.
Introduction
24
By the first half of the 90s, the future of Nanotechnology looked so promising that some researchers were expecting a phenomenon akin to a second Industrial Revolution6 due to the development of new nanomaterials and their prospective implementation to a wide variety of fields, ranging from electronics to catalysis, energy conversion or agriculture. The definition of nanotechnology became broader evolving into the more ambitious term of ‘nanoscience’, which included not only the control over the nanoscale, but also every scientific activity involved in understanding the processes occurring at it and how they result in the different and characteristic qualities of nanostructures. Numerous institutions and laboratories focusing in nanoresearch emerged in this period around the world, mostly in Europe and the United States, with universities being the main promoters of these centers and the governments playing the role of primary funding sources.7 Diverse chemical methods for the synthesis of materials with at least one dimension confined to less than 100 nm were reported. 8, 9
The new millennium brought upon the struggle of providing realistic objectives for nanotechnology based in achievable chemical operations.10 In 2001, Professor Alan MacDiarmid dedicated a part of his Nobel Prize reception lecture to the design and fabrication of electrically conducting organic polymers in the form of nanofibers.11 During his talk, Prof. MacDiarmid labeled nanoscience as an “emerging field”; certainly, it did not take long for the area to establish among the most prominent research topics. Figure 1 shows the exponential growth of the number of published papers under the nanotechnology tag since 2005. The total cites are also plotted in the graph. As anticipated in the lecture, researchers early took into account that the morphologic control of nanomaterials was a key parameter which translated into the enhancement of certain properties of interest in detriment of others. The variety of shapes12, 13 exhibited by the new engineered materials made clear that conceiving nanomaterials just as spheres of diameter below 100 nm was a rather outdated idea. The large amount of contributions available and the fast development of nanoscience motivated the publication of several reviews covering in varying degrees of depth the wide variety of applications, synthetic pathways and characterization methods proposed.
It is interesting to note that the characterization-related advances in nanoscience were put into use in the late 90s and early 2000s to reveal that the relationship between mankind and the nano-world has, in fact, existed for centuries. Nature itself is a great source of nanoparticles, which originate from different processes: volcanic eruptions, photochemical reactions or evaporation of water in the sea aerosols produced by crashing waves.14 The size of some bacteria, 15 algae (diatoms16) and viruses17 is only is down to just a few tens of nanometers. Living organism can also produce nanospores, nanometric
Introduction
25
metabolites and nanovesicles18 or synthesize lipid nanotubes.19 Moreover, different actions humans have performed throughout History, e.g., wood or coal burning, have resulted in accidental generation of nanoparticles. Even craftsmen from ancient civilizations have used, although unbeknownst to them, nanoparticles in their creations. As demonstrated by diverse studies, metallic nanoparticles are present in glassworks dating from Egypt and Mesopotamia.20 Colloidal suspensions containing the particles provided different colors to the matrix. An impressive example of this use is the Roman Lycurgus Cup. The piece exhibits very different colors depending on illumination due to the silver and gold nanoparticles present in the glass.21, 22 Nanocomponents can also be found in medieval glass windows, various pigments, medicines, pottery or weaponry.23
In the present day, “There’s plenty of room at the bottom” has gained immense popularity. It has been cited in so many occasions and has opened so many scientific papers that some journals have unofficially ruled that, unless strict necessity, authors should refrain from alluding to it in the introduction section of their work.24 However, when trying to provide the reader with a notion of the origins of the wide and essential field that nanoscience is, devoting some lines to its impact feels mandatory.
Figure 1. Bibliometric statistics for the “Nanotechnology” category during the years 2005 and 2017, both included. The amount of published articles tagged under the keyword are shown as
bars. Dots represent the number times these papers got cited. Source: Journal of Citation Report. Access date: 2019/05/30.
Introduction
26
Nowadays, the interest in nanotechnology seems to be still far from over. In fact, the number of journals under the category “Nanotechnology and Nanoscience” tripled between 2005 and 2017, while the topic’s aggregate impact factor (IF) increased 2.77 times during the same period. In addition, the top-10 rated journals devoted to Nanoscience and nanotechnology scores impact factors values ranging from 37.490 (Nature Nanotechnology) to 9.598 (Small). The commercialization and widespread availability of nanomaterials are now a reality as they can be found in readily accessible products, e.g. food, cosmetics, clothes.25 Nanomedicine is a recent and promising area currently generating plenty of interest due to the numerous medical devices produced which are undergoing their transition to the clinical environment.26 Along the normalization of the use of nanomaterials several peripheral concerns have appeared as well. If one takes a look back into how science has historically progressed, it is easy to conclude that the rushed use of diverse chemical products before they were understood in full is a recurring mistake.27-
29 A higher consciousness level supported by advances in instrumentation have made us aware of the generation of hazardous nanoparticles by diverse activities that may have a negative impacts upon ecosystems and human health. In consequence, in the last few years, studies regarding nanotoxicity as well as strategies to prevent and control the release of these residues have also gained large attention.
Figure 2. Number of journals in the category of Nanotechnology and Nanoscience (blue squares) and aggregate impact factor of the category (red circles) from 2005 to the latest record available
in JCR, i.e. 2017. Source: Journal of Citation Report. Access date: 2019/05/30.
Introduction
27
2. Nanotechnology: an ever-evolving challenge for Analytical Chemistry
With basic nanostructures (e.g. monoelemental metallic spheres, carbon nanotubes or polymer shell – metallic core composites) steadily permeating the market and increasingly complex engineered materials being reported on an almost daily basis,30-32 Analytical Chemistry is required to develop mature tools that can provide physicochemical details of interest at each of the different stages comprising the fabrication process. From fundamental in-lab compositional measures while optimizing the synthesis to quality control before reaching the consumer and fate, bioavailability and potential recyclability after use.33
If one takes an objective look into the current state of nanomaterials, it is rather straightforward to recognize that the laboratory-to-market transference is by no means trivial despite the optimistic perspectives often featured in the conclusions of papers. The delicate properties of some aforementioned structures may only be reproducible under tightly controlled experimental conditions with multiple slow confirmation steps involved, a routine which hardly suites mass production.34 Sans those tests, and given the strong dependence of properties on particle size and shape,35 the performance of the materials might turn unpredictable and, therefore, uninteresting. In an ideal situation, a technique should be able to meticulously characterize several sample parameters on a single read, require little training and be fast, reproducible and inexpensive. Expecting for one technique to meet all of these conditions is non-realistic; yet standardizing protocols featuring a limited number of tools to verify particle morphology, chemical composition, the presence of impurities and test the properties of interest (conductivity, catalytic activity or surface plasmon resonance wavelength) is a plausible form to face the upcoming challenges in the area. Researchers within the Analytical community are currently focusing their efforts in adapting classic bulk techniques to the uniqueness of nanomaterials while developing new, more specific approaches to nanoparticle characterization.36
This section aims to justify the relevance of the nanoinspection field while contextualizing the research conducted in this doctoral thesis by presenting a short, general vision of common analytical techniques used for the characterization of nanomaterials and the information they yield as well as some significant references where in-depth descriptions of these tools can be found.
Introduction
28
2.1 Modeling and predictive simulations
Theoretical methods have become a powerful resource to design and plan laboratory work as well as to further explain and understand experimental results. Advances in computer hardware and software allow for more detailed scenarios to be described and more complex calculations to be performed within reasonable time frames.37-39 To name a few examples of computational methods, density functional theory (DFT) is widely used in condensed phases to explore the electronic structure of materials, how it relates to the conductive properties exhibited by them and to what extent the presence of other chemical species in the structure impacts those characteristics.40-42 Finite element modeling (FEM) subdivides complex systems into small portions, creating a mesh to simplify solving the equations needed to interrogate the system traits. Via a subsequent assembly of the partial results, FEM delivers an analytical solutions to the whole system. Heating, interaction with electromagnetic fields or optical properties are commonly evaluated by FEM.43, 44 Predictive methods add guidelines to synthesis schemes before entering the laboratory and starting any experimental work at all to better target the qualities desired for the material which justify the increasing interest in developing computing strategies capable of coping with the most recent designs.
2.2 Characterization of the morphology and surface properties of nanostructures
Size and shape are the most crucial parameters of nanomaterials. Size is the universal criteria to ascertain whether the prefix “nano-” is applicable to a given structure. According to the European Commission, a nanomaterial is “a natural, incidental or manufactured material containing particles, in an unbound state or as an aggregate or as an agglomerate where, for 50% or more of the particles in the number size distribution, one or more external dimensions is in the range 1 nm - 100 nm”.45 Moreover, morphology is one of the main parameter regulating the particle functionality.
Visualization-based techniques provide direct and intuitive information on the structure and size of the material under study with single NP resolution. Electron microscopy is commonly used in Transmission (TEM) or Scanning (SEM) mode to record images from which shapes, size distribution, aspect ratios and particle number density can be readily extracted.46-48 SEM and TEM are especially useful for non-spherical shapes.49-51 Generally, these techniques require conductive samples able to withstand high vacuum atmosphere. Sputter-coating with metals is often part of sample preparation protocols which can become in lengthy and difficult in order to avoid alteration of the targets during measures. It is worth noting that some samples might be damaged by the impinging
Introduction
29
electron beam. Nanometric and sub-nanometric resolutions can be achieved by TEM and SEM to explore the NPs surfaces and cores. Complementary chemical analysis techniques (such as energy-dispersive X-ray spectroscopy) can be performed alongside microscopy to qualitatively determine particle composition. Recently environmental scanning electron microscopy (ESEM) has been developed to allow the inspection of damp samples in low-pressure chambers.52-53 ESEM along with scanning transmission electron microscopy (STEM) 54-55 discard the drying step in sample preparation, reducing the chances of NP agglomeration or shrinkage and the associated modification of sample traits.
Among other largely used microscopy techniques are atomic force microscopy (AFM) and near-field scanning optical microscopy (SNOM). AFM can map sample surfaces in 3D on the basis of the deflection of a closely located cantilever tip by van der Waals and electrostatic repulsions.56 After the scan, images with sub-nanometric vertical resolution are generated. AFM is compatible with delicate structures such as bioconjugated materials and tips can be functionalized for further characterization of superficial interactions. Yet, working areas in AFM are rather small, scan times are high and the technique is limited to surfaces. Sample preparation can be complex as well. Likewise, SNOM57 is a surface microscopy limited to small areas that offers high resolution under ambient conditions by breaking the optical resolution limit of light, i.e. probes are placed at distances much smaller than the wavelength of the scanning light. Although SNOM is difficult to perform, it is a versatile technique which allows integration with spectroscopic methods, thus expanding the information yield in the analysis.
Light scattering can also be used to assess the physical properties of nanomaterials. Scattering methods are usually faster and simpler than microscopy techniques since sample preparation is drastically shortened, working conditions are not as demanding and the employed instrumentation is rather accessible. Dynamic light scattering (DLS) is probably the most common of these techniques as it quickly provides the hydrodynamic diameter distribution of NPs suspended in virtually any liquid medium on a wide concentration range. In DLS, the elastic scattering of laser light induced by particle Brownian motion is tracked and the intensity is correlated to particle size, which can be down to 1 nm. DLS is however limited to spherical NPs due to its theoretical background and can be difficult to use in samples featuring high size dispersion.58
On a side note, zeta potential (also denoted as ζ potential) is also worth mentioning since it measures the stability of the sample as a function of its tendency towards aggregation. Zeta potential measures the electric potential near the surface of suspended NPs which are subjected to an external electric field. Due to electrophoresis, NPs migrate towards an electrode at different rates, related to their stability (ζ potentials higher than
Introduction
30
±30 mV generally denote stable suspensions). This technique is influenced by parameters such as pH or solution ionic strength. It is frequently integrated within the same instrument as DLS, making it a popular choice to supplement scattering studies.
2.3 Compositional analysis of nanoparticulate matter
A variety of spectroscopic and spectrometric methodologies have been developed to accurately characterize the chemical composition of nanomaterials as well as other NP parameters by making use of well-established analytical techniques.
UV-Vis spectroscopy may be considered the most simple and most commonly employed of the techniques providing chemical, size, agglomeration state and concentration information, albeit to produce a complete depiction of all these traits, it usually requires of complementary techniques.59 UV-Vis spectroscopy is compatible with a wide variety of nanomaterials. Most NPs feature a characteristic extinction band at a wavelength depending on its composition within the λ range covered by UV-Vis spectrometers with an intensity maximum sensitive to particle size and, in some cases, shape. The recorded bandwidth is also a qualitative indication of the size dispersion in the sample. In UV-Vis spectroscopy, sample preparation schemes are usually straightforward and measurements are very fast, yet the required concentrations are relatively high in comparison to other techniques. Infrared (IR) Spectroscopy works in a similar way and is particularly useful for surface-functionalized NPs. The characteristic vibrational fingerprints of each species is recorded in IR spectra and reveals the structure of the molecules adhere to the outer face of particles with diverse cores, e.g., silica, gold or magnetite. As water is a strong interference in IR spectroscopy, samples allowing drying processes are compressed into pellet form before being interrogated, this step limits the compatibility of the technique and makes quantitative studies difficult as adequate internal standards need to be found for each case. Although possible, “wet” IR spectroscopy make use of organic solvents which may alter the particles and are not well-regarded by the current trend of green chemistry. Raman spectroscopy (RS) is another vibrational technique based on inelastic scattering of light. It has gained immense popularity recently since H2O is a weak Raman scatterer which does not interfere in the measurements. RS provides molecular information with little to no sample preparation required and can be used in out-lab scenarios as well as in combination with other techniques. The Raman effect can be greatly enhanced in the proximity of a metallic surface. Surface enhanced Raman spectroscopy (SERS) has increased spatial resolution for characterizing functionalizing molecules chemically linked to the surface of metallic NPs, which often have Ag or Au cores, hence adding topographical information to RS for the study of nanomaterials and even single particle resolution.60
Introduction
31
Atomic absorption spectroscopy (AAS) is an example of technique for which new signal-processing algorithms have been developed to extract additional parameters besides elemental composition.61 The possibility of working with solid samples along quantification limits in the range of µg L-1, simultaneous multielemental detection62 and speciation are among the advantages of AAS, yet, the cost of the high-resolution continuum source instruments required to acquire such precise data and the instruments status as relatively new additions to the NP analysis filed make use of AAS fall behind that of the better-stablished Mass Spectrometry.
In recent years, the high sensitivity (down to ng L-1) and flexible molecular and atomic information provided by mass spectrometry (MS) has granted this technique a privileged spot among other analytical tools. The rather straightforward hyphenation of MS and separation techniques such as flow field fractionation or differential mobility analysis further contributes to its analytical power. MS which is compatible on an exclusive basis with liquid or suspended analytes and, consequently, requires of sample preparation protocols which can alter the original nanomaterial. One of the most interesting aspects of MS is the possibility to use the time-resolved signals recorded by the spectrometer to reach single nanoparticle resolution.63 By working with sufficiently diluted NP suspensions and fast data acquisition rates, the transient signal produced by each NP can be related to particle size and histograms showing size dispersion can be obtained. Limits of detection (LODs) in single particle mass spectrometry (SP-MS) are exceptionally low, merely attograms in some cases. Yet, the data processing schemes are highly complex and MS cannot perform simultaneous multielemental analysis, hence particle-to-particle compositional differences are virtually inaccessible to SP-MS.
In recent communications, electrochemical methods to identify the chemical composition of single NPs have also been reported.64-65 Individual analysis of nanoparticles and extreme detection is becoming a relevant topic in Analytical Chemistry as minimal variations in composition, e.g., inclusion of impurities during synthesis, from one NP to another in the same production batch may translate into dysfunctional materials which, in some scenarios such as nanomedicine, may pose a serious threat to consumers.
Introduction
32
3. Laser-induced breakdown spectroscopy
3.1 Outlining the evolution of laser-induced breakdown spectroscopy: key milestones towards shaping a leading-edge analytical technology
Laser-induced breakdown spectroscopy, better known by its acronym LIBS, is an analytical technique that allows the identification of neutral atoms, ions and simple di- and triatomic molecular fragments by recording the light emitted from a plasma.66
Soon after the demonstration of the laser action in 1960, Brech and Cross used a ruby laser to generate vapors of metallic and non-metal materials that were excited at a later stage by an auxiliary source (a spark) to characterize the samples by atomic emission spectroscopy.67 A year later, spectra produced exclusively by focused laser light were found to yield reproducible quantitative information of the diverse elements constituting the samples under study.68 These papers constituted the first reports on LIBS experiments and, along other pioneering works during the 1960s, helped to stablish a series of advantages anticipating the potential of LIBS as an analytical tool. By 1966, time-resolved LIBS was reported69 and electron temperature and number density, two fundamental plasma characterization parameters, were calculated for hydrogen plasmas. LIBS applications grew exponentially during the late 1970s and early 80s, especially those tied to the main analytical features of the technique, i.e. multi-elemental detection over a wide variety of matrices, fast analytical response and remote sensing capabilities. Advances in laser sources, PC hardware and software, optics, optical fibers and the invention of compact spectrometers contributed to the development of LIBS instrumentation during the decade of 1990. Moreover, the use of Echelle spectrometers in the early 2000s enabled multielemental simultaneous detection in a spectral region spawning from 200 to 1000 nm.
Over the years, a variety of theoretical as well as experimental strategies have been proposed to overcome the analytical limitations inherent to LIBS. Among commonly mentioned disadvantages of the technique are the strong matrix effects conditioning the analyses, signal pulse-to-pulse fluctuations, the variable plasma–solid interaction between different events and high LODs which greatly hinder applications relying on quantitative LIBS. Calibration-free quantitative analysis (CF-LIBS), based on the calculation of the plasma temperature and electron density was proposed by Palleschi and coworkers in 1999 to avoid the use of standard references materials.70 Recently, Aragon and Aguilera expanded upon the concept of CF-LIBS seeking to reach higher precision degrees for the quantification of minor constituents by relaxing the zero-standards restriction. In their CSigma (Cσ) approach, the authors used just one sample to calibrate every component of a multielemental sample as Cσ graphs allow for several spectral lines for different elements
Introduction
33
to be included within the same curve.71-72 Lower LODs and better qualitative performance of LIBS have also been addressed with the introduction of nanoparticle-enhanced LIBS (NELIBS).73 The magnification experienced by the electromagnetic field of the analysis laser when the sample surface is covered by plasmonic metallic NPs facilitates the ablation process and results in a signal increase and better SNRs.74 Advanced plasma diagnosis strategies have been developed following the results of studies that provided basic insight on parameters influencing laser-produced plasmas. To name a few examples, the role played by the chemical composition of the atmosphere in which the plasma expands was explored by several authors75 while commercialization of femtosecond pulsed lasers by the start of the century has opened a whole new field in laser ablation and LIBS alike with plenty of mechanisms and complex interactions between the laser light and the samples to be comprehended in order to fully exploit their analytical posibilitties.76-77
As of today, the stronger fundamental knowledge in combination with the advances in optics and instrumentation as well as the creation of intuitive spectral libraries and improved data processing algorithms, have expanded the capabilities of the technique to the point where some modern analytical challenges can only be effectively faced using LIBS, turning it into a tool in constant evolution still with a bright, long way ahead before reaching its peak potential.
3.2 Fundamentals of LIBS
When reduced to its simplest, LIBS is a method based on the laser–matter interaction, i.e., on the irradiation of a solid, liquid or gaseous material with a high power density pulse (in the order of a few GW cm−2 or more), leading to the formation of a plasma containing analytical information related to the elements that integrate the chemical signature of the sample.78-79
Figure 3A illustrates a schematic diagram of a basic LIBS instrument working under standard experimental conditions, i.e., with plasmas generated using nanosecond (ns) laser pulses in air at atmospheric pressure. Throughout a single LIBS event, multiple processes take place sequentially over a time lapse of few milliseconds. The evolution sequence of ns-laser induced plasmas is presented in Figure 3B. As shown, when a high-power laser pulse impacts on the surface of the target, only a small fraction of the delivered radiation is absorbed by the sample. The absorbed radiation translates into a high energy density at the focal point that leads to rapid heating melting and vaporization of a thin, slightly deep layer of the surface, followed by a mass removal phenomenon called laser ablation. The ablated material pushes the surrounding atmosphere causing the formation of a shock wave. The evaporated sample fraction expands as a plume above the sample surface, and owed to the high temperature and the free electrons, a plasma cloud is eventually formed.
Introduction
34
Figure 3. A) Basic elements required for LIBS studies. Samples are placed upon adapted stages that might be motorized and remotely controlled via software. B) Sketch of the processes taking place in a LIBS event on a typical ns-LIBS timescale. I) The impinging beam is partially reflected by the sample surface. The remaining portion is absorbed by the target. II) The absorbed radiation causes rapid heating leading to sample sublimation. III) The desorbed material is ionized by the
laser and originates a plasma that mainly emits light of no analytical use. During this stage, sample is still being transferred to the gas phase and is incorporated into the growing plasma. IV) Plasma
expands and heats due to laser-plasma interaction. From a certain electronic density value, plasma turns opaque and the shielding effect terminates both, laser-particle and laser-sample
interaction. V) As the laser pulse ceases, plasma starts decaying. VI) Finally, plasma collapses and a fraction of the ablated material condenses back to solid phase and accumulates inside and
around the periphery of the laser-produced crater.
Introduction
35
This plasma contains electrons, ions neutral atoms and molecular fragment of the sample and the medium. Species are found in both, excited and ground states. As the plasma interacts with the tailing part of the laser pulse it expands while its temperature and electron density increase. Another shock wave, which propagates along the direction of plasma expansion, is also created after ignition. The plasma keeps evolving even after the laser pulse has ended and it takes few milliseconds after the laser light first reaches the sample surface for it to cool down and collapse. Finally, after the plasma disappears, the free sample atoms recrystallize.
The light emitted by laser-produced plasmas is collected into a spectrograph where it is resolved in wavelength in order to obtain analytical information concerning the sample. Additionally, plasma emission may also be resolved in time and space for more specific data. Identification of the spectral lines and measurement of their peak intensity provides qualitative and quantitative information, respectively. Moreover, the peak intensity is determined not only by the concentration of the element in the sample, but also by the properties of the plasma itself. In this sense, laser-induced plasmas are non-stationary bodies and consequently, it strongly depends on several experimental parameters which are covered below.
3.3 Factors affecting laser-induced plasmas
The characteristics and nature of laser-induced plasmas are strongly affected by the laser operating conditions, i.e., laser wavelength (λ), pulse duration (τ), and energy (E). The irradiance (energy per unit time and area) plays the dominant role in defining the quantity and chemical composition of the ablated material. Moreover, the surrounding atmosphere, both in composition and pressure, determines the physicochemical characteristics of the plasma by directly. Specific effects of each of those factors upon the plasma plume have been extensively discussed in the literature by individually attending to the different traits that characterize a laser-produced plasma and how the recorded LIBS signal is impacted by them in the end.80-82
3.3.1 Laser pulse wavelength
The role of the laser wavelength (denoted as λ) is especially critical at several of the aforementioned stages, namely laser ablation, plasma formation, laser-plasma interaction and determination of the physical properties (dynamics) of the plasma as well as the chemical composition.83-84 Although many types of pulsed lasers have been used for ablation, solid state Nd:YAG systems with Gaussian profiles (TEM00 mode) have become the most common choice since they are relatively inexpensive, require little maintenance, can be miniaturized and are easily incorporated into commercial systems. These lasers can
Introduction
36
work either at their fundamental emission wavelength (1064 nm) or with a variety of harmonics (532, 355, 266 or 213 nm).
In laser ablation, wavelength and mass removal rate are generally inversely proportional. The shorter the laser wavelength, the higher the ablation rate. Furthermore, the composition of the vaporized material tends to be more representative of the bulk sample when using blue photons, implying that the fractionation effect is less pronounced if not entirely avoided. The fraction of photons that are absorbed or reflected upon reaching the sample is partially determined by their λ. Wavelength also dictates the predominant mechanisms during the ablation process: depending on the exact laser wavelength employed, ablation may involve thermal and/or non-thermal mechanisms. IR light leads to mainly photothermal processes exhibiting higher degrees of sample atomization whereas photochemical and photophysical pathways that favor the preservation of molecular fragments are preferential when using UV photons. Regarding plasma properties, life time and brightness are usually higher when sparked using 1064 nm light as plasma absorption is greater at longer wavelengths and leads to higher temperature values.
3.3.2 Laser pulse duration
According to its full width at half maximum, the duration (τ) of a laser pulse may be generally classified as short (picosecond (ps) to nanosecond (ns) pulse duration) or ultrashort (femtosecond (fs) pulse duration). Depending on the laser pulse duration, different laser ablation and excitation mechanisms have been described in literature, with ns-LIBS and fs-LIBS being terms often featured in research papers as substantial spectral changes are observed in each case.85-86 Both excitation regimes are capable of producing ablation and cause plasma formation since the energy density is always supplied to the analyte in a period of time short enough to guarantee that the energy redistribution rate inherent to the material is exceeded.87 In fs-LIBS, plasma is formed orders of magnitude of time after the laser pulse is extinguished. The longer τ used in ns-LIBS allows for prolonged plasma-laser pulse interaction as both co-exist in time.88 While the leading edge of the pulse ignites the plasma, the energy provided by the rest of the pulse results in higher temperature and electronic density values in comparison to those associated to fs-LIBS. Subsequently, plasmas from ns pulses tends to feature higher continuum emission intensity, yet, due to their extended emission profiles, detectability of lines belonging to the analyte may be improved as the signals are enhanced by the laser-pulse interaction.89
Introduction
37
3.3.3 Laser pulse energy
As mentioned above, LIBS experiments are affected by the laser pulse energy, E. In fact, the energy density, that is, the energy deposited per area unit is a more relevant parameter than the absolute value of energy. Then, the terms fluence (energy per unit area; F = J cm-2) and irradiance (energy per unit area and time; I = W cm-2) are widely used in LIBS literature.90-91 These quantities are experimentally determined by measuring the spot left by the laser on the material surface. The spot size depends on both the focusing conditions and the laser pulse energy. Energy directly affects the quantity of ablated mass, the diameter and the depth of the sample area affected by the laser pulse, thus conditioning the composition of the plasma, especially if it is non-homogeneous.92 Plasma formation also highly depends on the energy density and reaching a certain fluence threshold value (denoted as Fth) is required. Although LIBS signal intensity scales proportionally to energy density, if the employed F is well above Fth, the optical density of the laser-induced plasma may reach a critical value starting from which it turns totally opaque to the incoming laser radiation. This phenomenon is known as shielding effect and prevents sample-laser interaction, thus saturating the laser ablation and excitation processes.93
Figure 4. Stages of fs laser ablation and LIBS. a) Laser reaches the sample surface and is absorbed, exciting the surface electrons. b) Material starts melting via non-thermal processes. c) Melted
material forms a dome. d) Dome breaks and ablated material in the form of free electrons, atoms and molecules is released into the medium. A shockwave is formed. Thermal vaporization occurs,
thus increasing the mass removal rate e) Plasma ignites and emission starts. f) As laser-plasma interaction does not occur, the plasma plume decays faster than in ns-LIBS and extinguishes after
hundreds of nanoseconds. g) The ablated atoms solidify forming micro and nanoparticles.
Introduction
38
3.3.4 Surrounding atmosphere
As a consequence of the sample evaporation, the plasma expands at supersonic speed towards the medium coaxially to the target’s surface. The interaction between the plume and the surrounding atmosphere is a complex gas-dynamic process due to the sequence of physical processes taking part, including deceleration of the different species, thermalization of the ablated material, occlusion of gas components into the plasma, radiative recombination, and formation of shock waves and clusters. Therefore, the composition and the pressure of the gas medium under which the plasma plume evolves is of relevance for understanding the plasma ignition and its dynamics.94
Gas pressure impacts the sample ablation rate, as well as the expansion and emission of the plume.95 Concerning the plasma dynamics, the general effect of the medium has been reported to be the spatial confinement and slowing down of the plume expansion.96 An increase in the pressure of the atmosphere, regardless of its composition, maximizes the confinement of the plasma and reduces its expansion rate. Moreover, plasma recoiling can take place.97 On the other hand, the composition of the surrounding medium also influences the plasma properties owed to the physical characteristics of the gas. Plasmas generated under He atmosphere exhibit low electronic temperatures and electron densities, whereas high values of both parameters are observed from plasmas formed in Ar ambient.98 Moreover, the kinetics of electron density and plasma temperature decay are low in Ar, whereas He gas leads to a fast decline of both values. This behavior can be argued mainly on the basis of the thermal conductivity of both gases.99 In addition, considering the ionization potential of Ar (15.76 eV) and He (24.58 eV); lower the ionization potentials imply higher the electron densities and plasma temperatures as well as slower decay rates. Figure 5 shows examples of graphite plasmas formed under different ambient conditions.
Figure 5. Bulk graphite spectra taken at variable pressure in a vacuum chamber equipped with a 90º observation window. A) At atmospheric pressure the plasma is confined to the sample surface
and distinction of plasma core and plume is difficult. B) When the pressure is decreased to 0.4 mbar of air, plasma size is several folds larger and different regions can be observed based on
their luminous intensity.
Introduction
39
3.3.5 Emission of the plasma
The Laser-induced plasma is in continuous evolution throughout a LIBS event. As the plasma plume expands, its characteristic size, shape, electronic temperature (Te) and electronic density change promoting the emission of different chemical species during each period of its lifetime. Emission during the first instants after plasma ignition is dominated by unspecific continuum radiation containing no information regarding the different chemical species within the plasma. A few nanoseconds later, continuum starts decaying and emission from ionic species can be neatly observed, usually lasting from hundreds of nanoseconds to around a microsecond. As the plasma cools down, free electrons are combined back with ions and atomic lines owed to photons emitted from neutral atoms arise in the spectra. Both of these processes contribute to lowering the spectral background. Neutral lines can be recorded for longer periods of time than their ionic counterparts, normally up to microseconds. The emission from molecular fragments tends to peak at the later stages of the plasma evolution where its energy is low enough to allow the formation of chemical bonds between the different atomic species and extends up to tens of microseconds. While the particular conditions used for a study may alter the experimental findings, it is of general consensus that the temporal evolution of LIPs follows the described trend.100-102
Taken into account these considerations, the parameters defining the temporal window within which LIBS measurements are acquired must be precisely optimized. Generally, these settings are the acquisition delay (d), defined as the time lapse between laser action or plasma ignition and the start of signal recording by the spectrometer, and the integration time (t), i.e., the width of time gate for the integration of the spectral signal. Most spectrometers nowadays allow tuning acquisition delay and integration time either via direct (the own software of the instrument) or indirect means (external pulse generators). The temporal resolution offered by LIBS-based tools developed for field analysis is typically limited since time-resolved spectrographs often comprise delicate components such as the iCCD cameras used as detectors, a fact in stark contrast to the robustness of the setup favored and required by in-situ applications.103-104
From an entirely spatial point of view, laser-induced plasmas can be divided in two main regions each possessing distinctive physicochemical properties. The plasma core is located close to the sample surface and is characterized by its high electronic temperature, brightness and population density, thus motivating numerous collisions between atoms and free electrons. As a consequence, a large fraction of ions reside within the core and its emission exhibits intense ionic lines and spectral background that can result in reduced signal-to-noise ratios (SNRs) and have a negative impact on the detectability of analytes.
Introduction
40
On the other hand, the plasma plume can, depending on the surrounding medium, extend up to several mm from the sample surface, usually propagates in the opposite direction of the impinging laser pulse, and have a higher population of neutral atoms and molecular fragments.105-106 Figure 6 depicts the typical temporal evolution of laser-induced plasmas and their emission, which also shifts spatially during the plasma lifetime.
It is important to note that plume appearance vary from a quasi-spherical shape in dense atmospheres (such as air at atmospheric pressure) to an elongated morphology under vacuum conditions or if the surrounding gas is He or Ar. Hence, plasma regions can be deconvoluted by altering the atmosphere, causing the different constituents to migrate within the plume. This can be clearly observed in Figure 5. Reduced pressure values lead to less confined plasmas and have been demonstrated to improve SNR in LIBS spectra as collision rates between species are reduced as well, yet low pressure plasmas are colder and feature weaker emission and reduced life times. Papers focusing on longitudinal space-resolved analysis of plasma plumes expanding under different atmospheres have highlighted the compositional changes that can be found along a LIP and, subsequently, the special attention that must be directed towards addressing the portion of plasma light entering the detector. As an illustrative example, atom recombination to originate molecules may occur preferentially mm away from the core where the temperature is low enough and may then migrate due to thermophoresis towards the plasma periphery. Weiss et al. also evaluated the influence of the angle of observation on LIBS signal demonstrating how atomic distribution in confined plasmas can result in lower intensity due to self-absorption and plasma shielding.107-10
Figure 6. Temporal evolution of the emission from a ns-laser produced plasma. Core and plume are differentiated with predominant emitting species found in each region as a function of time
indicated.
Introduction
41
3.4 LIBS applications
As commented previously, LIBS has gained enormous popularity in the last few years and has established itself as an analytical spectroscopic tool in several fields of applications.110 Therefore, the LIBS community is composed of multidisciplinary researchers with different backgrounds and areas of scientific expertise. In the last decades, a number of useful review articles reported the developments in fundamentals and LIBS applications, some of them have been referred to above while pertinent examples of the latter are alluded to in their corresponding application subsection.
From 2000, the specialized conferences and symposia devoted to LIBS have also contributed to the dissemination of the groundbreaking results and the development of technique. Thanks to the biannual LIBS International Conferences held in 2000 (Pisa, Italy), 2002 (Orlando, USA), 2004 (Malaga, Spain), 2006 (Montreal, Canada), 2008 (Berlin, Germany), 2010 (Memphis, USA), 2012 (Luxor, Egypt), 2014 (Beijing, China), 2016 (Chamonix, France) and 2018 (Atlanta, USA) the number of publications on the field have increased considerably. Themed issues of the journals Spectrochimica Acta, Part B Atomic Spectroscopy and Applied Optics are usually published with papers presented in specific conferences. Furthermore, regional meetings including Euro-Mediterranean Symposium on LIBS (EMSLIBS) and North American Symposium on LIBS (NASLBS) take place on the year after the major international symposium.
Figure 7 illustrates a few examples of LIBS applicability. A common link between most of the cases shown is that the sample is characterized in an off-lab scenario, e.g., production lines, non-transportable samples such as buildings or planetary exploration. In-situ analysis is needed in those applications where access to the sample is difficult, might be greatly altered in the transport process or may be dangerous to human health (for example, nuclear reactors). In the last few years, continuous advances in reducing the size and weight while increasing the capabilities of lasers, spectrographs and detectors make possible the development of compact and rugged instrumentation, differing from those normally used in laboratory. Based on the report by Fortes and Laserna, platforms for in-situ analysis can be categorized as portable, remote or stand-off configurations.111
A portable system configuration is a man-portable sensor for field analysis and the operator and the instrument are close to the target. In general, the systems include the laser power supply, a main unit consisting of an adapted transport platform (a case or a backpack, for example) that encloses the detector and a computer, and a hand-held probe with the laser head as well as the focusing and the collection optics. To allow transportation to near anywhere, external power supplies may be used to provide the sensor with an
Introduction
42
autonomy of up to several hours. Since their inception in 1996, handheld systems have been notoriously miniaturized from ca. 15 kg suitcases112 to merely 3kg small control boxes113 or backpacks.114 Portable sensors have been widely used for environmental,115-116 industrial,117 geological,118 or cultural heritage applications.119
Several options can be considered when a LIBS measurement at a certain distance is needed. In remote systems the operator is located far from the target but the laser and the collected signal are transmitted through a fiber optic cable, while in a stand-off system (ST-LIBS) both the laser and the signal are transmitted along an open path. The integration of fiber-optic cables is a solution for applications in which the target is not directly accessible or is located in extreme environments. In cases where a large area must be analyzed, an open-path LIBS configuration should be used. Two configurations are used in ST-LIBS. In coaxial systems, the excitation pulse and the return radiation travel the same optical path albeit in opposing direction and are split by optics upon reaching the instrument in order to direct the sample signature into the detector. Biaxial setups make use of different incident and collection angles to create two different paths, requiring additional care when aligning the system and the sample.
Figure 7. Diverse scenarios in which LIBS have been successfully applied. One of the key advantages that LIBS has contributed to the Analytical community is its versatility. This image
highlight that technique is highly responsive for extreme cases. From planet surfaces, to nanomaterials have been characterized using LIBS, which is also able to work in no-favorable
environments such as under oceanic waters or at high temperature production lines.
Introduction
43
After introducing the fundamentals and describing one of the most important uses of the technique, this subsection presents a broad selection of new areas of research and innovative uses of LIBS, as well as a critical prospective of the most important contributions in each application field.
3.4.1 Cultural heritage
Chemical characterization of archaeological remains allows historians to better comprehend the human activity carried out during the era to which the discovered materials belong and further exploit the information they contain. LIBS has quickly secured a spot among the strongest resources available in archeometry owed to its portability and the compatibility with virtually any kind of sample, from pigments in a painting to different layers on the shell of a bivalve discovered at a prehistoric human settlement.54 Furthermore, the technique is only micro-destructive, fast, allows multielemental characterization with outstanding in-situ spatial resolution and can be easily combined in the same sensor with other approaches such as Raman spectroscopy or laser-induced fluorescence (LIF).120 The façade of the Cathedral of Malaga was analyzed by a ST-LIBS sensor, mapping the building from a distance of ca. 30 meters from the users.121 LIBS-based strategies for the recognition of restorations and fakes have also been proposed.122
Recently, field application of underwater-LIBS for submerged cultural heritage was demonstrated by Guirado et al. using a remote system named AQUALAS.123 The increased pressure conditions in liquid media hinders the generation of plasmas capable of yielding analytical as it imposes a high confinement degree and heat exchange lead to short lifetimes. The combination of these factors results in noisy and weak spectra. In their work, the authors guided laser pulses either in single pulse or multi-pulse configuration through fiber optics into the surface of submerged solids to assess their chemical composition. Double-pulse LIBS was previously proposed as a solution to the issues arising due to water medium as the second pulse forms a new plasma that re-excites the material ablated by the first pulse, which remains suspended within the cavitation bubble formed. These findings were mostly drawn from the in-lab analysis of submerged metals and alloys.124-126 While the main body of the AQUALAS sensor remained on the deck of the boat carrying the users, the pulses traversed 45 meters of fiber optic into the aperture of the laser probe, submerged by a diver to a depth of 30 meters. The probe was enclosed by a protective case that prevented sea water from entering and damaging the system by blowing compressed air at adjustable pressures. Gas current was also used to purge the water from the sample surface. This created a gaseous atmosphere between the probe and the sample that improved the analytical signal as the laser light travelled through a less impeded medium, the pulse-sample coupling was more effective and the plasma expanded over a larger
Introduction
44
space. This application has so far been demonstrated on an exclusive basis for LIBS and is of great interest in archeometry to date shipwrecks.127-129
3.4.2 Industrial analysis
Several parameters have been addressed using LIBS in factories with a variety of sensors being reported since the early 2000s adapted to work with metallic goods , ores or plastic among others.130 For instance, at-line sensors, i.e., probes located at a certain point along the conveyor belt transporting the targets, have been used to classify material such as scrap131 or polymers for their efficient recycling.132-134 Apart from air quality in industrial environments, which is described in sub-section 4, LIBS has also been employed to reveal compositional changes in steel slabs during their fabrication process.135-137 The recent commercialization of user-friendly miniaturized sensors is likely to imply an expansion of the presence of LIBS for routine analysis at factories.138
3.4.3 Security and forensics
Laser-induced breakdown spectroscopy found a niche application at the beginning of the XXI century after the feasibility of discriminating explosive materials based on the emission from molecular fragments contained within their chemical structure while implying minimum risk for the user owed to the standoff configurations was demonstrated.139 One of the most relevant analytical figures of merit concerning the identification of highly energetic materials was the recognition in contaminated fingerprints as well as embedded in matrices containing confusing agents with similar chemical signals, a case where machine-learning methods for data processing was successfully used.140-142 On a similar page, LIBS can also be used by criminalistics as the technique has been reported to provide valuable forensic data concerning gunshot residues143 or evaluating drowning as cause of death according to the elemental distribution of Sr in human teeth.144
3.4.4 LIBS for elemental mapping and chemical imaging
LIBS has been widely used as a surface tool as well as for in-depth profiling of solids.145 The technique allows high spatial resolution for the characterization of heterogeneous solids in a reduced time frame owed to its high repetition rate and fast data acquisition. Chemical mapping in 2D and 3D are valuable for revealing the distribution of species along heterogeneous materials or laminated samples.146 The 2012 publication by Lopez-Quintas et al. proved that LIBS can overcome complex sample morphologies while yielding accurate spatially-resolved compositional information by mapping an engine valve made of different metallic alloys.147 In recent years, software improvements have leaded
Introduction
45
to papers with highly detailed plasma and sample imaging diagnosis results, sparking the interest in this wavelength-resolved tool.148 Multiple experimental configurations, data acquisition schemes and processing routines have been described in literature with most of them employing IR ns pulses to achieve lateral resolutions between 1 and 100 µm. LIBS imaging has been applied several scenarios. In archeometry, analysis of geomaterials by imaging was used to evaluate mineral heterogeneity or paleoclimate conditions endured by animal and vegetal fossil samples.149 In biomedicine, distribution and evolution of Gd-based NPs were monitored in animal kidneys before being excreted.150 Renal clearance and tumor uptake of gold nanoclusters was also studied by LIBS imaging.151 Fundamental spatiotemporal resolved plasma chemistry experiments have been carried out employing image-based diagnosis with a classification scheme for plastic according to recorded plasma plume images having been reported by Negre et al.152
3.4.5 Hyphenated-LIBS for material characterization One of the strongest assets of LIBS is it synergy with other techniques to produce
complementary analytical information. Desorption techniques such as glow discharge (GD) can be used as a previous stage to LIBS in order to improve LIBS signal and resolution as the laser pulse acts only as a re-excitation source for the already ablated material. As no fraction of the energy is devoted to interact with the bulk sample, the promotion to emissive levels of the species in the plasma is more efficient.153 Raman spectroscopy conforms a particularly powerful tandem when used alongside LIBS as one provides exhaustive characterization of the molecular structures present in the sample while the other yield a full elemental profile that is not accessible to RS by itself, hence, the combination is totally orthogonal. Raman-LIBS is further benefited by the fact that both techniques require laser beams of similar intensity, work over analogous time scales and use dispersive detectors. Instrumental platforms hyphenating LIBS and Raman have been used to identify explosives in distant targets even in the presence of confusant agents with ST-LIBS sensors.154-155 Quantitative Raman-LIBS analysis of pharmaceutical samples was -reported by Lednev et al. employing a double pulse configuration.156 Moreover, this combination has been applied in archeometry studies157 and for the surveillance of minerals under simulated Martian atmospheric conditions,158 a task that the SuperCam integrated in the rover built by NASA for the Mars 2020 mission is expected to perform on the surface of the red planet. As mentioned above, LIBS signal can benefit from decreases in pressure, making it a strong candidate for fusion with mass spectrometry and the high vacuum values it requires. Irradiances below plasma formation threshold are used in laser ionization mass spectrometry (LIMS) for soft ablation and direct analysis of solid targets instead of the more commonly used liquid samples other MS methods. Yet, coincidental studies, employing instrumental configurations such as the one shown in Figure 8, can be
Introduction
46
performed to enhance the chemical insight acquired as demonstrated by Delgado et al in a series of papers covering the dual characterization of organics.159-163
Fusion of LIBS with other laser-based strategies to reach new frontiers in the application of this spectroscopy is fully exploited in the works presented herein. The following section is entirely dedicated to the analysis of aerosolized material since description of the fundamentals involved and the evolution of that particular application is necessary to provide the bases for single particle LIBS analysis.
Figure 8. Experimental setup used by Delgado et al. for the discrimination of isomers in
condensed phase by LIBS and LIMS. Reprinted from reference 163 with permission from the authors.
Introduction
47
4. From aerosol characterization to single particle analysis, a new paradigm for LIBS
The scarce amount of sample required to carry out a LIBS analysis has since early development stages been highlighted as a major advantage of the technology.164 In fact the characterization of masses in the nano and femtogram range is routinely performed in LIBS laboratories.165-166 This feature, combined with the possibility of simultaneous multielemental detection, makes LIBS an appealing asset for nanoinspection and has sparked the interest in the field of single particle LIBS studies. Preliminary uses of high power laser sources for chemical analysis of airborne material date from 1979167 yet, the first ad hoc LIBS experiment targeting particulate matter can be traced back to the publication by Radziemski et al. in 1983.168 In the mentioned work, the authors reported the use of LIBS for in-situ direct detection of aerosols in ambient air. Limits of detection were calculated for Na, As, Hg, P and Be in air, the latter being the lowest at merely 0.6 ng per gram of air. Two remarkable conclusions, which ended up serving as stepping stones for the development of the research topic during the 1990s, can be drawn from this paper. The work showcased the adaptability of LIBS to off-lab scenarios, again, an unfeasible situation for other techniques such as Inductively Coupled Plasma-Optical Emission Spectroscopy (ICP-OES), and the low absolute LODs accessible to LIBS, despite having rather high concentration LODs, in the order of ppm typically. Absolute LODs are the main analytical figure of merit found in reference 169 as well. Cl and F were detected in air with minimum masses of 80 ng and 2 µg, respectively.
It is necessary to direct the reader’s attention towards the relative standard deviations (RSDs) reported in reference 5, ranging from 10% on Na results to 30% on Be, attributed by the authors to inhomogeneity of the samples under evaluation. RSD values in this range are still common in LIBS for particulate matter analysis, despite the use of improved experimental setups and sampling schemes. One of such new approaches is the production of aerosol streams via optical catapulting (OC) with LIBS detection introduced by Fortes, Cabalín and Laserna.170-171 Aerosols in LIBS experiments performed at laboratories are often created by nebulizing dissolutions of varying concentration containing the analytes.172 Wet droplets are then be dried by secondary means such as heated nebulizer tip or by the sampling laser. The second case implies that laser light is forced to traverse the water interphase separating the air atmosphere and the particle and that a fraction of the pulse energy must be consumed in evaporating the solvent. The change in the refractive index of the optical path due to the presence water causes some photons to scatter and can slightly shift the focus due to lensing effect, further reducing the energy dose received by the particles. OC-LIBS circumvents the need to dry the droplets
Introduction
48
as streams are directly produced by ejecting dry powders from a microscope glass slide acting as sample platform. By focusing a laser pulse with F < Fth to the back of the support, i.e., the face where the sample is not placed, the photons act merely as a particle pack that transmits momentum as it collides with the surface of the slide, originating a powerful shockwave that propagates along the sample support, eventually reaching the sample and causing it to catapult into the air. OC was originally used for biological purposes, specifically to dissect and transport of histologic specimens from their original surroundings into another container where further studies could be performed.173-175 OC prevented sample contamination by separating the target fraction of living cells by a contactless way that caused minimal to no damage to the remaining tissue. Over a series of works, Fortes et al. characterized the properties of different composition aerosols produced by OC and reported the feasibility of separating multicomponent streams as a function of their characteristic response to OC and ejection velocity in addition to an improvement of the analytical performance of LIBS for aerosol analysis evidenced by sampling rates (number of recorded spectra showing analyte emission) up to a 90%, which are in stark contrast with common rates below 50% found in literature.176-177 Again, sample polydispersity was pointed as the main source of signal variability. It is, in fact, the size and, subsequently, the mass distribution of the particles the major sources of uncertainty in aerosol experiments. The efficiency of particle atomization in laser-induced plasmas, intimately tied to particle size, ultimately governs the number of atoms available for excitation to emitting levels. This is briefly discussed in reference 169, but it was not until some years later that this crucial concept of the dual role played by the sampling laser, serving at the same time as a source of particle atomization and as an excitation source, was thoroughly explored.
Hahn and co-workers paved the way towards single particle LIBS in a series of works covering fundamental aspects of the particle-plasma interaction. Guidelines for conditional data analysis are provided in order to improve the sampling rates in aerosol LIBS based on the number of real hits when analyzing airborne particles.178 This approach prevents analyte signals from being diluted in the signal averaging process, which is widely used for treatment of aerosol data sets. Results corresponding to plasmas formed in absence of particles, thus only featuring background or signals originating from air ionized by the laser pulse, are discarded to reveal the analytes contained in the sampled medium. Conditional analysis has played a major part in the successful implementation of LIBS for standoff analysis of aerosols in industrial environments179, one of the main goals behind the inception of this application, and, more pertinent to this subsection, the quantitative analysis of discrete aerosol particles.180
Introduction
49
Size threshold for complete particle dissociation was among the first questions encompassed in single particle LIBS (SP-LIBS) as it marks the limit from which particles cannot be reliably quantified.181 Further work by different authors explored the complete dissociation threshold for a variety of samples such as glucose and NaHCO3.182 Providing a general threshold value or a compilation related to particle composition are ambitious, if not unfeasible, tasks since the number of parameters that must be standardized may well be exceedingly large. Hence, only illustrative ranges183 can be used to direct new experimental work, hampering the establishment of LIBS as a robust tool for real time and in situ quantitative analysis of aerosols.
When it comes to single particle analysis, unambiguous attribution of spectra to single entities becomes a chimera that researchers must tame, the sooner the better. Imaging of particle plasmas can be of great help in tying the emission to its source. As shown in Figure 9 The temporal evolution of plasma engulfing single borosilicate microparticles in their peripheral area was recorded by Hohreiter and Hahn.184 Particle dissociation and diffusion of its components through the plasma cloud was clearly indicated by intensity distribution. These images are among the most crucial results reported in particle-LIBS since they also provide a basis for discussing mechanisms leading to particle dissociation and excitation, and illustrate the greater relevance of plasma-particle interaction as opposed to pulse-particle interaction. While plasma imaging can be of great help in assessing the question posed earlier in this paragraph and in the fundamental aspects of SP-LIBS, it is not exempt of drawbacks. Namely, it can only be used after the sample has been probed, implying that a particle cluster cannot be discarded beforehand, and, specifically for single particles, it is limited to relatively large particle sizes (ca. 1-2 µm), as smaller ones are not likely to produce enough light to be discriminated from the air plasma. Therefore, complementary pre-LIBS diagnostic approaches are required to verify the presence of single particles, expand the size range of application while maintaining or improving aerosol sampling rates; ultimately, to allow SP-LIBS to delve into the nanoworld. It is indeed in this field that the great synergy LIBS has come in handy.
A fusion-LIBS methodology based in the use of an electrodynamic balance (EDB) has been successfully evaluated as a platform to stably isolate, hold and recognize single particles.185-186 The EDB makes use of a superposition of DC and AC electric fields to levitate charged particles, which are attracted to the center of the balance. The mass of the trappable particles may be discriminated by adjusting the AC field. Tuning of the electric field also allows for particle manipulation and precise positioning regarding focus of the sampling laser, ensuring particle interception at maximum energy density and, subsequently, under optimum dissociation and excitation conditions. Aqueous aerosol
Introduction
50
particles diffused into the EDB and dried upon trapping, forming spherical particles with sizes ranging between 1 and 20 µm of salts dissolved in the nebulized solution. Solutes are subsequently pre-concentrated in the dry droplets. This, besides the good particle size repeatability, largely contributing to reduced RDS values, resulted in LODs which are rarely, if ever, seen in LIBS. To name a few examples, LOD of 60 ppb was calculated for Ni and Pb, 50 ppb for Zn.185 EDB-LIBS has been proved as a robust method for characterizing single microparticles: yet, its applicability to sub-µm or nanometric particles has not been demonstrated, leaving a highly important territory to be explored. Moreover, the implementation of EDB-LIBS to routine in-situ analysis is, in principle, complicated, given the chamber and experimental configuration required for it to yield its full potential.
Figure 9. Time- and wavelength-resolved plasma imaging showing a borosilicate glass particle engulfed by the plasma as it dissociates and its components diffuse in the laser-produced plasma.
Reprinted from reference 184 with permission from the American Chemical Society.
Introduction
51
5. Optical catapulting – optical trapping – LIBS: exploiting the versatility of laser-based tools for the characterization of isolated nanomaterials
A second pathway towards single-particle resolution LIBS was first introduced in
2014 by Fortes, Férnandez-Bravo and Laserna.187 Building upon the base of previous experience with OC-LIBS, the authors introduced a further step in the form of optical trapping (OT) with the intention of isolating particles from the aerosol generated used OC within an optical pressure field. The new approach was named following the sequence in which the three different techniques integrating the instrumental platform actuate, that is, optical catapulting – optical trapping – LIBS (OC-OT-LIBS). Figure 10 shows a timeline covering the year during which these different methodologies were first reported along other important milestones needed for the successful implantation of OC-OT-LIBS. This combination allowed SP-LIBS to work directly on powdered solid samples, avoiding particle suspension in aqueous media prior to analysis. Ejected particles were optically trapped in the focal region of a tightly focused CW laser and once single particles were trapped (and the aerosol relaxed), single shot LIBS spectra were recorded. In their work, Fortes et al. probed 2 µm in diameter graphite spheres and single 100 nm Al2O3 particles setting LODs as low as 200 attograms for Al with direct detection of low femtogram masses, moreover the authors were able to separate mixes featuring both types of particles by adjusting the power of the trapping laser, therefore modifying the interaction between the laser light and the analytes. For the first time, characterization of a single object featuring a size that fell within the classic definition of nanomaterial (at least one dimension of ≤ 100 nm).
Figure 10. Timeline featuring the dates where instrumental development and research advances crucial for the OC-OT-LIBS technology were reported. Publication dates for relevant analytical
figures of merit of OC-OT-LIBS are also indicated.
Introduction
52
The paper, published in Spectrochimica Acta Part B, served as a proof of principle and showcased the potential of merging two well established techniques such as LIBS and OT, both with more than 40 years of history and the relative newcomer OC into a novel, single analytical tool taking full advantage of the characteristics of each component for a common objective: nanoinspection. As this new path was opened, many questions lied ahead, being of particular interest those related to the tight control of the many parameters involved in an OC-OT-LIBS experiment in order increase the robustness of the methodology as well as to evaluate up to which point the boundaries of LIBS could be pushed once again. This dissertation picks up where the 2014 work left, targeting the aforementioned issues and using those findings as stepping stones for the development of the OC-OT-LIBS technology into a fully functional mean for the characterization of nanoparticles.
5.1 Optical trapping
Despite being a widely used in biology and physics, optical tweezers (OT)188 have until recently never been used in the context of Analytical Chemistry. Consequently, this subsection aims to present the reader with the basics of OT and the impact this tool, which has motivated two Nobel Prizes,189-190 has had in general science.
First reported by Ashkin in 1970,191 optical trapping is another technique based on laser-matter interaction. Any particle suspended in fluid media describes random trajectories due to collisions with the molecules of the liquid or the gas, this movement is known as Brownian motion. In OT, the optical forces that spawn when an intense continuum-wave (CW) laser beam is tightly focused to a small spot overcome the Brownian motion to retain particles within the focal region. Micrometric polystyrene particles were the first subjects trapped by a pair counter-propagating laser beams in water and in air. By 1986 steady three-dimensional trapping using a single beam was reported.192 Optical tweezers are a staple for contactless manipulation of single objects ranging from viruses or live bacteria to metallic NPs of different morphologies as they exert forces in the range of femto to picoNewtons allowing for controlled displacements of down to just few nanometers.193
Figure 11 summarizes the essential components of an optical trapping instrument. High numerical aperture (NA) optics are used to focus the Gaussian laser beam creating a steep light intensity gradient between the focus and any position immediately out of the focal region. Upon entering the trap, the particle experiences two kind of optical forces: the extinction forces (FExt), considered repulsive as they expel the object from the trap, and the attractive gradient force (FGrad) which drags the object to the light intensity maximum,
Introduction
53
i.e., towards the center of the trap. FExt result from the sum of two main terms, the scattering (FScat) and absorption (FAbs) and predominate along the trapping axis. A common assumption in literature is that FExt ≈ FScat since FScat tends to be orders of magnitude higher than the absorption term under standard experimental conditions. The repulsive nature of the scattering force is rather straightforward to understand as the photons transfer momentum to the trapped particle upon impact. On the other hand, FGrad, which dominates on the direction perpendicular to the beam propagation axis, is a more complex interaction originating from the interaction between the light and an asymmetric distribution of the surface charge in the particle that can be either naturally-occurring of induced by the laser.194-195 When FGrad exceeds the value of FExt, the object is considered trapped. Once isolated, particles accommodate at an equilibrium position (generically, Qe) with the coordinates (xe, ye, ze) that, due to thermophoretic effects and minor focusing imperfections, is slightly displaced from the exact center of the optical trap. For small displacements from QE, the gradient force can be considered as a restoring force acting like a spring under the classic Hooke’s Law, hence the optical trap is characterized by a stiffness constant (κ) proportional to the intensity of the trapping light. Based on this premise, different models have been developed to extract the values of κ and the forces acting upon trapped particles.196
Figure 11. Typical OT setup installed on an inverted microscope. The CW trapping laser is expanded using appropriate optics to slightly overfill the back aperture of the focusing
microscope objective (MO). This avoid the extremes of the beam, which lead to decreased FGrad, thus enhancing trapping efficiency. Usually, 100x magnification and high N.A. MOs (1.2 or better) are preferred. Light from the particle is condensed, guided and focused on the surface of a QPD. The spatially-resolved trace from the QPD is registered using an oscilloscope and then processed
to yield the trapping stiffness for each axis.
Introduction
54
Two different regimes can be distinguished in OT as a function of the particle radius (r), involving different physics for the characterization of the optical trap. If r is larger than the wavelength used for trapping, then simpler ray optics apply and trapping is explained by transference of photon momentum counteracting the displacement of the beam. Whereas for r << λ, the Rayleigh regime, particles are considered point dipoles and the models are based on the electromagnetic interaction between laser and particle. Optical trapping is commonly performed in water as Brownian motion of the particles can be considered overdamped, facilitate both theoretical and experimental work. Particle monitoring and force measures are performed either by camera-tracking methods or by photodiode-based detection, both methods provide two-dimensional data, yet, forces acting in the lateral directions (Fx and Fy) can be considered equal, especially for spherical particles, thus simplifying calculus. Although slower in data acquisition, detection using complementary metal oxide semiconductor (CMOS), charged coupled device (CCD) or intensified CCD (iCCD) cameras produces more intuitive data. Position of the particle is extracted from each recorded frame using scripts written for software such as MatLab or ImageJ. Scattered laser light can be focused into Quadrant photodiodes (QPDs), which are a popular choice in OT for their high acquisition rates (kHz) as well as their sensitivity to lateral and axial particle displacements, related to voltage changes arising between opposing halves of the QPD.197-198 Calibration using QPDs is performed by using the positions visited by the particle during the acquisition window to produce power spectra.199 Lorentzian fits of these spectra return the value of the corner frequency (fc) for each of the monitored direction. OT experiments have been carried out in different media, i.e., water or vacuum, yet very few works using air at atmospheric pressure as the trapping medium can be found.200 The lack of literature can be attributed to the low viscosity of air, which greatly impulses the Brownian motion of the particles not only making optical trapping difficult, but also leading to more complex equations as some terms cannot be neglected due to common theoretical assumptions are not valid. This was one of the main hindrances faced by OC-OT-LIBS, which strives to keep the maximum possible simplicity in the experimental design to broaden the potential applications of the technology in consonance with the mentality of the LIBS community.
Quantitative OT has been demonstrated for individual specimens as small as 15 nm effective radius quantum dots.201 Plasmonic metallic NPs of Au,202 Ag,203 and Pt204 have been subjected to OT, facilitating the study of the unique properties they study when irradiated using a wavelength in resonance with the surface plasmon for applications such as imaging contrast agents or nanoheating, useful in thermal therapies for the elimination of cancerous tissue or for the fusion of cells and drug-containing vesicles.205-208 Moreover, manipulation of these species allows for precise positioning for space-dependent
Introduction
55
processes. As an example, nanoparticles may catalyze photochemical reactions by serving as antennas to amplify the light absorption rate of the substrates.209 These rates may be further increased by carefully placing the nanoparticles near to the absorbing species rather than randomly suspended across the medium.210
Further description of optical trapping and the equations used for trap calibration can be found in the main chapters of this work, where the simplification steps as well as the effects of the particle under study and medium particularities are fully demonstrated to understand the presented analytical solutions. A sketch of the instrumental platform developed and employed in this thesis is presented in Figure 12.
Figure 12. The OC-OT-LIBS instrument is a 3D analytical platform featuring three different laser-based techniques. Optical Catapulting and Optical trapping are coaxial and work along the z axis. LIBS is used to produce chemical information regarding the isolated particle and acts along the x axis. Multiple detection lines are installed in the system. Spectroscopic data is collected in the y axis by conducting the light of the laser-produced plasma to a time-integrated spectrometer. In
the same axis, plasma imaging and system aligment is performed employing an USB iCDD camera. Particle tracking for posterior trap stiffness calibration is done by an USB CMOS camera. Every
focusing optics in the system and detectors are placed among precision stages allowing fine position tuning of the objects.
Introduction
56
References
[1] Feynman, R. P. “There’s Plenty of Room at the Bottom”. Engineering and Science 23, 22-36 (1960).
[2] Taniguchi, N. “On the Basic Concept of Nano-Technology”. Proc. Intl. Conf. Prod. London 18–23 (1974).
[3] Drexler, K. E. “Molecular Engineering: An Approach to the Development of General Capabilities for Molecular Manipulation”. Proc. Natl. Acad. Sci. 78, 5275–5278 (1981).
[4] Drexler, K. E. “Engines of creation: The coming era of nanotechnology”. New York: Anchor Books. (1986).
[5] Rossetti, R., Nakahara, S. & Brus, L. E. “Quantum Size Effects in the Redox Potentials, Resonance Raman Spectra, and Electronic Spectra of CdS Crystallites in Aqueous Solution”. J. Chem. Phys. 79, 1086–1088 (1983).
[6] Shew, A. “Nanotech’s History An Interesting, Interdisciplinary, Ideological Split”. Technol. Soc. 28, 390–399 (2008).
[7] Schummer, J. “The Global Institutionalization of Nanotechnology Research: A Bibliometric Approach to the Assessment of Science Policy”. Budapest Sci. 70, 669–692 (2007).
[8] Ozin, G. A. “Nanochemistry: Synthesis in Diminishing Dimensions”. Adv. Mater. 4, 612–649 (1992).
[9] Kruis, F. E., Fissan, H. & Peled, A. “Synthesis of Nanoparticles in the Gas Phase for Electronic, Optical and Magnetic Applications—a Review”. J. Aerosol Sci. 29, 511–535 (1998).
[10] Granqvist, N. & Laurila, J. “Rage against Self-Replicating Machines: Framing Science and Fiction in the US Nanotechnology Field”. Organ. Stud. 32, 253–280 (2011).
[11] MacDiarmid, A. G. “Synthetic Metals”: A Novel Role for Organic Polymers (Nobel Lecture). Angew. Chemie Int. Ed. 40, 2581–2590 (2001).
[12] Liu, Z., Zhang, X., Poyraz, S., Surwade, S. P. & Manohar, S. K. “Oxidative Template for Conducting Polymer Nanoclips”. J. Am. Chem. Soc. 132, 13158–13159 (2010).
[13] Wan, M. “A Template-Free Method towards Conducting Polymer Nanostructures”. Adv. Mater. 20, 2926–2932 (2008).
Introduction
57
[14] Jeevanandam, J., Barhoum, A., Chan, Y. S., Dufresne, A. & Danquah, M. K. “Review on Nanoparticles and Nanostructured Materials: History, Sources, Toxicity and Regulations”. Beilstein J. Nanotechnol. 9, 1050–1074 (2018).
[15] Kajander, E. O. & Ciftçioglu, N. “Nanobacteria: An Alternative Mechanism for Pathogenic Intra- and Extracellular Calcification and Stone Formation”. Proc. Natl. Acad. Sci. U. S. A. 95, 8274–8279 (1998).
[16] Svetličić, V., Zutić, V., Pletikapić, G. & Radić, T. M. “Marine Polysaccharide Networks and Diatoms at the Nanometric Scale”. Int. J. Mol. Sci. 14, 20064–20078 (2013).
[17] Fumagalli, L., Esteban-Ferrer, D., Cuervo, A., Carrascosa, J. L. & Gomila, G. “Label-Free Identification of Single Dielectric Nanoparticles and Viruses with Ultraweak Polarization Forces”. Nat. Mater. 11, 808–816 (2012).
[18] de Candia, P., De Rosa, V., Gigantino, V., Botti, G., Ceriello, A. & Matarese, G. “Immunometabolism of Human Autoimmune Diseases: From Metabolites to Extracellular Vesicles”. FEBS Lett. 591, 3119–3134 (2017).
[19] Kamiya, S., Minamikawa, H., Jung, J. H., Yang, B., Masuda, M. & Shimizu, T. “Molecular Structure of Glucopyranosylamide Lipid and Nanotube Morphology”. Langmuir 21, 743–750 (2005).
[20] Brill, R. H. & Cahill, N. D. “A Red Opaque Glass from Sardis and Some Thoughts on Red Opaques in General”. J. Glass Stud. 30, 16–27 (1988).
[21] Barber, D. J. & Freestone, I. C. “An Investigation of the Origin of the Colour of the Lycurgus Cup by Analytical Transmission Electron Microscopy”. Archaeometry 32, 33–45 (1990).
[22] Freestone, I., Meeks, N., Sax, M. & Higgitt, C. “The Lycurgus Cup — A Roman Nanotechnology”. Gold Bull. 40, 270–277 (2007).
[23] Reibold, M., Paufler, P., Levin, A. A., Kochmann, W., Pätzke, N. & Meyer, D. C. “Carbon Nanotubes in an Ancient Damascus Sabre”. Nature 444, 286–286 (2006).
[25] Gupta, R. & Xie, H. “Nanoparticles in Daily Life: Applications, Toxicity and Regulations”. J. Environ. Pathol. Toxicol. Oncol. 37, 209–230 (2018).
[26] Min, Y., Caster, J. M., Eblan, M. J. & Wang, A. Z. “Clinical Translation of Nanomedicine”. Chem. Rev. 115, 11147–11190 (2015).
Introduction
58
[27] Harada, M. “Minamata Disease: Methylmercury Poisoning in Japan Caused by Environmental Pollution”. Crit. Rev. Toxicol. 25, 1–24 (1995).
[28] Velders, G. J. M., Andersen, S. O., Daniel, J. S., Fahey, D. W. & McFarland, M. “The Importance of the Montreal Protocol in Protecting Climate”. Proc. Natl. Acad. Sci. 104, 4814–4819 (2007).
[29] Vargesson, N. “Thalidomide-Induced Teratogenesis: History and Mechanisms”. Birth Defects Res. C. Embryo Today 105 (2), 140–156 (2015).
[30] Liu, Y., Zhou, G., Liu, K. & Cui, Y. “Design of Complex Nanomaterials for Energy Storage: Past Success and Future Opportunity”. Acc. Chem. Res. 50, 2895–2905 (2017).
[31] Yec, C. C. & Zeng, H. C. “Synthesis of complex nanomaterials via Ostwald ripening”. J. Mater. Chem. A 2, 4843–4851 (2014).
[32] Fernandez-Bravo, A., Yao, K., Barnard, E. S., Borys, N. J., Levy, E. S., Tian, B., Tajon, C. A., Moretti, L., Altoe, M. V., Aloni, S., Beketayev, K., Scotognella, F., Cohen, B. E., Chan, E. M. & Schuck, P. J. "Continuous-wave upconverting nanoparticle microlasers". Nat. Nanotechnol. 13, 572–577 (2018).
[33] Hochella, M. F., Mogk, D. W., Ranville, J., Allen, I. C., Luther, G. W., Marr, L. C., McGrail, B. P., Murayama, M., Qafoku, N. P., Rosso, K. M., Sahai, N., Schroeder, P. A., Vikesland, P., Westerhoff, P. & Yang, Y. "Natural, incidental, and engineered nanomaterials and their impacts on the Earth system". Science. 363(2019).
[34] Heuer-Jungemann, A., Feliu, N., Bakaimi, I., Hamaly, M., Alkilany, A., Chakraborty, I., Masood, A., Casula, M. F., Kostopoulou, A., Oh, E., Susumu, K., Stewart, M. H., Medintz, I. L., Stratakis, E., Parak, W. J. & Kanaras, A. G. "The Role of Ligands in the Chemical Synthesis and Applications of Inorganic Nanoparticles". Chem. Rev. 119, 4819–4880 (2019).
[35] Crut, A., Maioli, P., Del Fatti, N. & Vallée, F. “Optical absorption and scattering spectroscopies of single nano-objects”. Chem. Soc. Rev. 43, 3921–3956 (2014).
[36] Richman, E. K. & Hutchison, J. E. “The Nanomaterial Characterization Bottleneck”. ACS Nano 3, 2441–2446 (2009).
[37] Lai, K. C., Han, Y., Spurgeon, P., Huang, W., Thiel, P. A., Liu, D.-J. & Evans, J. W. "Reshaping, Intermixing, and Coarsening for Metallic Nanocrystals: Nonequilibrium Statistical Mechanical and Coarse-Grained Modeling". Chem. Rev. 119, 6670–6768 (2019).
[38] Aikens, C. M. “Electronic Structure of Ligand-Passivated Gold and Silver Nanoclusters”. J. Phys. Chem. Lett. 2, 99–104 (2011).
Introduction
59
[39] Byers, C. P., Zhang, H., Swearer, D. F., Yorulmaz, M., Hoener, B. S., Huang, D., Hoggard, A., Chang, W.-S., Mulvaney, P., Ringe, E., Halas, N. J., Nordlander, P., Link, S. & Landes, C. F. "From tunable core-shell nanoparticles to plasmonic drawbridges: Active control of nanoparticle optical properties". Sci. Adv. 1 (2015).
[40] Xu, B., Wang, H., Wang, W., Gao, L., Li, S., Pan, X., Wang, H., Yang, H., Meng, X., Wu, Q., Zheng, L., Chen, S., Shi, X., Fan, K., Yan, X. & Liu, H. "A Single-Atom Nanozyme for Wound Disinfection Applications". Angew. Chemie Int. Ed. 58, 4911–4916 (2019).
[41] Zhang, C., Wang, W., Duan, A., Zeng, G., Huang, D., Lai, C., Tan, X., Cheng, M., Wang, R., Zhou, C., Xiong, W. & Yang, Y. "Adsorption behavior of engineered carbons and carbon nanomaterials for metal endocrine disruptors: Experiments and theoretical calculation". Chemosphere 222, 184–194 (2019).
[42] Wang, Y., Sun, C., Yang, Z.-D., Yu, H., Pan, P., Pei, L., Zhang, G. & Hu, Y. "Ab initio study of (FeCpVCp) @MoS2 NT — A one-dimensional bimetallic sandwich molecular wire (FeCpVCp) encapsulated into MoS2 nanotube". Chem. Phys. 523, 1–6 (2019).
[43] Ma, H., Tian, P., Pello, J., Bendix, P. M. & Oddershede, L. B. “Heat generation by irradiated complex composite nanostructures”. Nano Lett. 14, 612–619 (2014).
[44] Bachelier, G., Butet, J., Russier-Antoine, I., Jonin, C., Benichou, E. & Brevet, P.-F. "Origin of optical second-harmonic generation in spherical gold nanoparticles: Local surface and nonlocal bulk contributions". Phys. Rev. B 82, 235403 (2010).
[45] European Commission “On the definition of nanomaterial”. Brussels: Official Journal of the European Union (2011).
[46] Hu, J. “Linearly Polarized Emission from Colloidal Semiconductor Quantum Rods”. Science. 292, 2060–2063 (2001).
[47] Zhang, X., Qin, J., Xue, Y., Yu, P., Zhang, B., Wang, L. & Liu, R. "Effect of aspect ratio and surface defects on the photocatalytic activity of ZnO nanorods". Sci. Rep. 4, 4596 (2015).
[48] Busbee, B. D., Obare, S. O. & Murphy, C. J. “An Improved Synthesis of High-Aspect-Ratio Gold Nanorods”. Adv. Mater. 15, 414–416 (2003).
[49] de Jonge, N. & Ross, F. M. “Electron microscopy of specimens in liquid”. Nat. Nanotechnol. 6, 695–704 (2011).
[50] Glaeser, R. M. “Methods for imaging weak-phase objects in electron microscopy”. Rev. Sci. Instrum. 84, 111101 (2013).
Introduction
60
[51] Evans, J. E., Jungjohann, K. L., Browning, N. D. & Arslan, I. “Controlled Growth of Nanoparticles from Solution with In Situ Liquid Transmission Electron Microscopy”. Nano Lett. 11, 2809–2813 (2011).
[52] Donald, A. M. “The use of environmental scanning electron microscopy for imaging wet and insulating materials”. Nat. Mater. 2, 511–516 (2003).
[53] Miljkovic, N., Enright, R. & Wang, E. N. “Effect of Droplet Morphology on Growth Dynamics and Heat Transfer during Condensation on Superhydrophobic Nanostructured Surfaces”. ACS Nano 6, 1776–1785 (2012).
[54] Klein, T., Buhr, E. & Georg Frase, C. “TSEM: A Review of Scanning Electron Microscopy in Transmission Mode and Its Applications”. Adv. Imaging Electron Phys. 171, 297–356 (2012).
[55] de Jonge, N., Bigelow, W. C. & Veith, G. M. “Atmospheric Pressure Scanning Transmission Electron Microscopy”. Nano Lett. 10, 1028–1031 (2010).
[56] Butt, H.-J., Cappella, B. & Kappl, M. “Force measurements with the atomic force microscope: Technique, interpretation and applications”. Surf. Sci. Rep. 59, 1–152 (2005).
[57] Betzig, E., Trautman, J. K., Harris, T. D., Weiner, J. S. & Kostelak, R. L. “Breaking the Diffraction Barrier: Optical Microscopy on a Nanometric Scale”. Science. 251, 1468–1470 (1991).
[58] Lin, P.-C., Lin, S., Wang, P. C. & Sridhar, R. “Techniques for physicochemical characterization of nanomaterials”. Biotechnol. Adv. 32, 711–726 (2014).
[59] Sapsford, K. E., Tyner, K. M., Dair, B. J., Deschamps, J. R. & Medintz, I. L. “Analyzing Nanomaterial Bioconjugates: A Review of Current and Emerging Purification and Characterization Techniques”. Anal. Chem. 83, 4453–4488 (2011).
[60] Nie, Shuming & Emory, S. R. “Probing Single Molecules and Single Nanoparticles by Surface-Enhanced Raman Scattering”. Science. 275, 1102–1106 (1997).
[61] Leopold, K., Brandt, A. & Tarren, H. “Sizing gold nanoparticles using graphite furnace atomic absorption spectrometry”. J. Anal. At. Spectrom. 32, 723–730 (2017).
[62] Ozbek, N. & Ozcan, M. “Simultaneous determination of Co, Al and Fe by HR CS-GFAAS”. Talanta 148, 17–21 (2016).
[63] Laborda, F., Bolea, E. & Jiménez-Lamana, J. “Single particle inductively coupled plasma mass spectrometry: A powerful tool for nanoanalysis”. Anal. Chem. 86, 2270–2278 (2014).
Introduction
61
[64] Holt, L. R., Plowman, B. J., Young, N. P., Tschulik, K. & Compton, R. G. “The Electrochemical Characterization of Single Core-Shell Nanoparticles”. Angew. Chemie – Int. Ed. 55, 397–400 (2016).
[65] Nizamov, S., Kasian, O. & Mirsky, V. M. “Individual Detection and Electrochemically Assisted Identification of Adsorbed Nanoparticles by Using Surface Plasmon Microscopy”. Angew. Chemie Int. Ed. 55, 7247–7251 (2016).
[66] Cremers, D. A. & Radziemski, L. J. “Handbook of Laser-induced Breakdown Spectroscopy. Handbook of Laser-induced Breakdown Spectroscopy” (2006).
[67] Brech, F. & Cross, L. “Optical Microemission Stimulated by a Ruby Laser”. Appl. Spectrosc. 16, 59-64 (1962).
[68] Runge, E. F., Minck, R. W. & Bryan, F. R. “Spectrochemical analysis using a pulsed laser source”. Spectrochim. Acta 20, 733–736 (1964).
[69] Litvak, M. & Edwards, D. “Spectroscopic studies of laser-produced hydrogen plasma”. IEEE J. Quantum Electron. 2, 486–492 (1966).
[70] Ciucci, A., Palleschi, V., Rastelli, S., Salvetti, A., Singh, D. P. & Tognoni, E. "CF-LIPS: A new approach to LIPS spectra analysis". Laser Part. Beams 17, 793–797 (1999).
[71] Aguilera, J. A. & Aragón, C. “Analysis of rocks by CSigma laser-induced breakdown spectroscopy with fused glass sample preparation”. J. Anal. At. Spectrom. 32, 144–152 (2017).
[72] Aragón, C. & Aguilera, J. A. “Direct analysis of aluminum alloys by CSigma laser-induced breakdown spectroscopy”. Anal. Chim. Acta 1009, 12–19 (2018).
[73] Dell’Aglio, M., Alrifai, R. & De Giacomo, A. “Nanoparticle Enhanced Laser Induced Breakdown Spectroscopy (NELIBS), a first review”. Spectrochim. Acta Part B At. Spectrosc. 148, 105–112 (2018).
[74] De Giacomo, A., Gaudiuso, R., Koral, C., Dell’Aglio, M. & De Pascale, O. “Nanoparticle Enhanced Laser Induced Breakdown Spectroscopy: Effect of nanoparticles deposited on sample surface on laser ablation and plasma emission”. Spectrochim. Acta Part B At. Spectrosc. 98, 19–27 (2014).
[75] Effenberger, A. J. & Scott, J. R. “Effect of atmospheric conditions on LIBS spectra”. Sensors 10, 4907–4925 (2010).
Introduction
62
[76] Margetic, V., Pakulev, A., Stockhaus, A., Bolshov, M., Niemax, K. & Hergenröder, R. "A comparison of nanosecond and femtosecond laser-induced plasma spectroscopy of brass samples". Spectrochim. Acta Part B At. Spectrosc. 55, 1771–1785 (2000).
[77] Zeng, X., Mao, X. L., Greif, R. & Russo, R. E. “Experimental investigation of ablation efficiency and plasma expansion during femtosecond and nanosecond laser ablation of silicon”. Appl. Phys. A 80, 237–241 (2005).
[78] Miziolek, A.W., Palleschi, V. & Schechter, I. “Laser-Induced Breakdown Spectroscopy (LIBS): Fundamentals and Applications”, Cambridge University Press, Cambridge (2006).
[79] Radziemski, L.J. & Cremers, D.A. “Laser-Induced Plasma and Applications”, Marcel Dekker, New York (1989).
[80] Aragón, C. & Aguilera, J. A. “Characterization of laser induced plasmas by optical emission spectroscopy: A review of experiments and methods”. Spectrochim. Acta Part B At. Spectrosc. 63, 893–916 (2008).
[81] Russo, R.E., Mao, X.L., Liu, C. & Gonzalez J. “Laser assisted plasma spectrochemistry: laser ablation”. J Anal At Spectrom 19, 1084-1089 (2004).
[83] Hussein, A. E., Diwakar, P. K., Harilal, S. S. & Hassanein, A. “The role of laser wavelength on plasma generation and expansion of ablation plumes in air”. J. Appl. Phys. (2013).
[84] Arantes de Carvalho, G. G., Moros, J., Santos, D., Krug, F. J. & Laserna, J. J. “Direct determination of the nutrient profile in plant materials by femtosecond laser-induced breakdown spectroscopy”. Anal. Chim. Acta 876, 26–38 (2015).
[85] Serrano, J., Moros, J. & Javier Laserna, J. “Molecular signatures in femtosecond laser-induced organic plasmas: comparison with nanosecond laser ablation”. Phys. Chem. Chem. Phys. 18, 2398–2408 (2016).
[86] López-Claros, M., Vadillo, J. M. & Laserna, J. J. “Determination of plasma ignition threshold fluence during femtosecond single-shot laser ablation on metallic samples detected by optical emission spectroscopy”. J. Anal. At. Spectrom. 30, 1730–1735 (2015).
[87] Chichkov, B. N., Momma, C., Nolte, S., von Alvensleben, F. & Tünnermann, A. “Femtosecond, picosecond and nanosecond laser ablation of solids”, Appl. Phys. A 63 109-115 (1996).
Introduction
63
[88] Russo, R. E., Mao, X., González, J. J. & Yoo, J. “Femtosecond vs. Nanosecond laser pulse duration for laser ablation chemical analysis”, Spectroscopy 28, 24–35 (2013).
[89] Sirven, J.B., Bousquet, B., Canioni, L. & Sarger, L. “Time-resolved and time-integrated single-shot laserinduced plasma experiments using nanosecond and femtosecond laser pulses”, Spectrochim. Acta Part B 59, 1033–1039 (2004).
[90] Tognoni, E., Palleschi, V., Corsi, M. & Cristoforetti, G. “Quantitative micro-analysis by laser-induced breakdown spectroscopy: a review of the experimental approaches”. Spectrochim. Acta Part B At. Spectrosc. 57, 1115–1130 (2002).
[91] Benedetti, P. A., Cristoforetti, G., Legnaioli, S., Palleschi, V., Pardini, L., Salvetti, A. & Tognoni, E. "Effect of laser pulse energies in laser induced breakdown spectroscopy in double-pulse configuration". Spectrochim. Acta Part B At. Spectrosc. 60, 1392–1401 (2005).
[92] Cristoforetti, G., Legnaioli, S., Palleschi, V., Tognoni, E. & Benedetti, P. A. “Observation of different mass removal regimes during the laser ablation of an aluminium target in air”. J. Anal. At. Spectrom. 23, 1518 (2008).
[93] Cristoforetti, G., Lorenzetti, G., Benedetti, P. A., Tognoni, E., Legnaioli, S. & Palleschi, V. "Effect of laser parameters on plasma shielding in single and double pulse configurations during the ablation of an aluminium target". J. Phys. D. Appl. Phys. 42, 225207 (2009).
[94] Scott, J. R., Effenberger Jr., A. J. & Hatch, J. J. “Influence of Atmospheric Pressure and Composition on LIBS”, in: S. Musazzi, U. Perini (Eds.), “Laser-induced breakdown spectroscopy”, Springer-Verlag, Berlin pp. 91–116 (2014).
[95] Farid, N., Harilal, S.S, Ding, H. & Hassanein, A. “Emission features and expansion dynamics of nanosecond laser ablation plumes at different ambient pressures”, J. Appl. Phys. 115, 033107 (2014).
[96] Chen, Z., Bleiner, D. & Bogaerts, A. “Effect of ambient pressure on laser ablation and plume expansion dynamics: A numerical simulation”, J. Appl. Phys. 99, 063304 (2006).
[97] Mehrabian, S., Aghaei, M. & Tavassoli, S.H. “Effect of background gas pressure and laser pulse intensity on laser induced plasma radiation of copper samples”, Phys. Plasmas 17, 043301 (2006).
[98] Aguilera, J.A. & Aragón, C.A. “Comparison of the temperatures and electron densities of laser-produced plasmas obtained in air, argon, and helium at atmospheric pressure”, Appl. Phys. A Mater. 69, S475–S478 (1999).
Introduction
64
[99] Vors, E., Gallou, C. & Salmon, L. “Laser-induced breakdown spectroscopy of carbon in helium and nitrogen at high pressure”, Spectrochim. Acta Part B At. Spectrosc. 63, 1198–1204 (2008).
[100] Sirven, J. B., Bousquet, B., Canioni, L. & Sarger, L. “Time-resolved and time-integrated single-shot laser-induced plasma experiments using nanosecond and femtosecond laser pulses”. Spectrochim. Acta Part B At. Spectrosc. 59, 1033–1039 (2004).
[101] Baudelet, M., Boueri, M., Yu, J., Mao, S. S., Piscitelli, V., Mao, X. & Russo, R. E. "Time-resolved ultraviolet laser-induced breakdown spectroscopy for organic material analysis". Spectrochim. Acta Part B At. Spectrosc. 62, 1329–1334 (2007).
[102] Boueri, M., Baudelet, M., Yu, J., Mao, X., Mao, S. S. & Russo, R. "Early stage expansion and time-resolved spectral emission of laser-induced plasma from polymer". Appl. Surf. Sci. 255, 9566–9571 (2009).
[103] De Giacomo, A., Dell’Aglio, M., De Pascale, O., Gaudiuso, R., Palleschi, V., Parigger, C. & Woods, A. "Plasma processes and emission spectra in laser induced plasmas: A point of view". Spectrochim. Acta Part B At. Spectrosc. 100, 180–188 (2014).
[104] Grifoni, E., Legnaioli, S., Lezzerini, M., Lorenzetti, G., Pagnotta, S. & Palleschi, V. "Extracting Time-Resolved Information from Time-Integrated Laser-Induced Breakdown Spectra". J. Spectrosc. 2014, 1–5 (2014).
[105] Siegel, J., Epurescu, G., Perea, A., Gordillo-Vázquez, F. J., Gonzalo, J. & Afonso, C. N. "High spatial resolution in laser-induced breakdown spectroscopy of expanding plasmas". Spectrochim. Acta Part B At. Spectrosc. 60, 915–919 (2005).
[106] Tsai, S.-J. J., Chen, S.-Y., Chung, Y.-S. & Tseng, P.-C. “Spatially Resolved, Laser-Induced Breakdown Spectroscopy, Development, and Application for the Analysis of Al and Si in Nickel-Based Alloys”. Anal. Chem. 78, 7432–7439 (2006).
[107] Al-Shboul, K. F., Harilal, S. S. & Hassanein, A. “Spatio-temporal mapping of ablated species in ultrafast laser-produced graphite plasmas”. Appl. Phys. Lett. (2012).
[108] Al-Shboul, K. F., Harilal, S. S. & Hassanein, A. “Emission features of femtosecond laser ablated carbon plasma in ambient helium”. J. Appl. Phys. (2013).
[109] Weiss, J., Cabalín, L. M. & Laserna, J. J. “Angle of Observation Influence on Emission Signal from Spatially Confined Laser-Induced Plasmas”. Appl. Spectrosc. 71, 87–96 (2017).
[110] Fortes, F. J., Moros, J., Lucena, P., Cabalín, L. M. & Laserna, J. J. “Laser-Induced Breakdown Spectroscopy”. Anal. Chem. 85, 640–669 (2013).
Introduction
65
[111] Fortes, F. J. & Laserna, J. J. “The development of fieldable laser-induced breakdownspectrometer: No limits on the horizon”. Spectrochim. Acta Part B At. Spectrosc. 65, 975–990 (2010).
[112] Cremers, D. A., Yamamoto, K. Y., Foster, L. E. & Ferris, M. J. “Detection of Metals inthe Environment Using a Portable Laser-Induced Breakdown Spectroscopy Instrument”.Appl. Spectrosc. 50, 222–233 (1996).
[113] Goujon, J., Giakoumaki, A., Piñon, V., Musset, O., Anglos, D., Georgiou, E. & Boquillon,J. P. "A compact and portable laser-induced breakdown spectroscopy instrument for singleand double pulse applications". Spectrochim. Acta Part B At. Spectrosc. 63, 1091–1096(2008).
[114] Fortes, F. J., Cuñat, J., Cabalín, L. M. & Laserna, J. J. “In Situ Analytical Assessment andChemical Imaging of Historical Buildings Using a Man-Portable Laser System”. Appl.Spectrosc. 61, 558–564 (2007).
[115] Bertolini, A., Carelli, G., Francesconi, F., Francesconi, M., Marchesini, L., Marsili, P.,Sorrentino, F., Cristoforetti, G., Legnaioli, S., Palleschi, V., Pardini, L. & Salvetti, A. "Modì: anew mobile instrument for in situ double-pulse LIBS analysis". Anal. Bioanal. Chem. 385,240–247 (2006).
[116] Wainner, R., Harmon, R., Miziolek, A., McNesby, K. & French, P. “Analysis ofenvironmental lead contamination: comparison of LIBS field and laboratory instruments”.Spectrochim. Acta Part B At. Spectrosc. 56, 777–793 (2001).
[117] Palanco, S., Alises, A., Cuñat, J., Baena, J. & Laserna, J. J. “Development of a portablelaser-induced plasma spectrometer with fully-automated operation and quantitativeanalysis capabilities”. J. Anal. At. Spectrom. 18, 933–938 (2003).
[118] Cuñat, J., Palanco, S., Carrasco, F., Simón, M. D. & Laserna, J. J. “Portable instrumentand analytical method using laser-induced breakdown spectrometry for in situcharacterization of speleothems in karstic caves”. J. Anal. At. Spectrom. 20, 295–300 (2005).
[119] Giakoumaki, A., Melessanaki, K. & Anglos, D. “Laser-induced breakdown spectroscopy(LIBS) in archaeological science—applications and prospects”. Anal. Bioanal. Chem. 387,749–760 (2007).
[120] Spizzichino, V. & Fantoni, R. “Laser Induced Breakdown Spectroscopy in archeometry:A review of its application and future perspectives”. Spectrochim. Acta Part B At. Spectrosc.99, 201–209 (2014).
Introduction
66
[121] Gaona, I., Lucena, P., Moros, J., Fortes, F. J., Guirado, S., Serrano, J. & Laserna, J. J. "Evaluating the use of standoff LIBS in architectural heritage: surveying the Cathedral of Málaga". J. Anal. At. Spectrom. 28, 810 (2013).
[122] Robbiola, L. & Portier, R. “A global approach to the authentication of ancient bronzes based on the characterization of the alloy–patina–environment system”. J. Cult. Herit. 7, 1–12 (2006).
[123] Guirado, S., Fortes, F. J., Lazic, V. & Laserna, J. J. “Chemical analysis of archeological materials in submarine environments using laser-induced breakdown spectroscopy. On-site trials in the Mediterranean Sea”. Spectrochim. Acta Part B At. Spectrosc. 74–75, 137–143 (2012).
[124] Lazic, V., Colao, F., Fantoni, R. & Spizzicchino, V. “Laser-induced breakdown spectroscopy in water: Improvement of the detection threshold by signal processing”. Spectrochim. Acta Part B At. Spectrosc. 60, 1002–1013 (2005).
[125] De Giacomo, A., Dell’Aglio, M., De Pascale, O. & Capitelli, M. “From single pulse to double pulse ns-Laser Induced Breakdown Spectroscopy under water: Elemental analysis of aqueous solutions and submerged solid samples”. Spectrochim. Acta Part B At. Spectrosc. 62, 721–738 (2007).
[126] López-Claros, M., Dell’Aglio, M., Gaudiuso, R., Santagata, A., De Giacomo, A., Fortes, F. J. & Laserna, J. J. "Double pulse laser induced breakdown spectroscopy of a solid in water: Effect of hydrostatic pressure on laser induced plasma, cavitation bubble and emission spectra". Spectrochim. Acta Part B At. Spectrosc. 133, 63–71 (2017).
[127] Guirado, S., Fortes, F. J., Cabalín, L. M. & Laserna, J. J. “Effect of Pulse Duration in Multi-Pulse Excitation of Silicon in Laser-Induced Breakdown Spectroscopy (LIBS)”. Appl. Spectrosc. 68, 1060–1066 (2014).
[128] Guirado, S., Fortes, F. J. & Laserna, J. J. “Elemental analysis of materials in an underwater archeological shipwreck using a novel remote laser-induced breakdown spectroscopy system”. Talanta 137, 182–188 (2015).
[129] Guirado, S., Fortes, F. J. & Laserna, J. J. “Multi-Pulse Excitation for Underwater Analysis of Copper-Based Alloys Using a Novel Remote Laser-Induced Breakdown Spectroscopy (LIBS) System”. Appl. Spectrosc. 70, 618–626 (2016).
[130] Noll, R., Fricke-Begemann, C., Connemann, S., Meinhardt, C. & Sturm, V. “LIBS analyses for industrial applications – an overview of developments from 2014 to 2018”. J. Anal. At. Spectrom. 33, 945–956 (2018).
Introduction
67
[131] Gurell, J., Bengtson, A., Falkenström, M. & Hansson, B. A. M. “Laser induced breakdown spectroscopy for fast elemental analysis and sorting of metallic scrap pieces using certified reference materials”. Spectrochim. Acta Part B At. Spectrosc. 74–75, 46–50 (2012).
[132] Anzano, J., Bonilla, B., Montull-Ibor, B., Lasheras, R.-J. & Casas-Gonzalez, J. “Classifications of Plastic Polymers based on Spectral Data Analysis with leaser induced Breakdown Spectroscopy”. J. Polym. Eng. 30, (2010).
[133] Lasheras, R. J., Bello-Gálvez, C. & Anzano, J. “Identification of polymers by libs using methods of correlation and normalized coordinates”. Polym. Test. 29, 1057–1064 (2010).
[134] Anzano, J., Bonilla, B., Montull-Ibor, B. & Casas-González, J. “Plastic identification and comparison by multivariate techniques with laser-induced breakdown spectroscopy”. J. Appl. Polym. Sci. 121, 2710–2716 (2011).
[135] Delgado, T., Ruiz, J., Cabalín, L. M. & Laserna, J. J. “Distinction strategies based on discriminant function analysis for particular steel grades at elevated temperature using stand-off LIBS”. J. Anal. At. Spectrom. 31, 2242–2252 (2016).
[136] Ruiz, J., Delgado, T., Cabalín, L. M. & Laserna, J. J. “At-line monitoring of continuous casting sequences of steel using discriminant function analysis and dual-pulse laser-induced breakdown spectroscopy”. J. Anal. At. Spectrom. 32, 1119–1128 (2017).
[137] Cabalín, L. M., Delgado, T., Ruiz, J., Mier, D. & Laserna, J. J. “Stand-off laser-induced breakdown spectroscopy for steel-grade intermix detection in sequence casting operations. At-line monitoring of temporal evolution versus predicted mathematical model”. Spectrochim. Acta Part B At. Spectrosc. 146, 93–100 (2018).
[138] Noll, R., Fricke-Begemann, C., Brunk, M., Connemann, S., Meinhardt, C., Scharun, M., Sturm, V., Makowe, J. & Gehlen, C. "Laser-induced breakdown spectroscopy expands into industrial applications". Spectrochim. Acta Part B At. Spectrosc. 93, 41–51 (2014).
[139] Moros, J., Lorenzo, J. A. & Laserna, J. J. “Standoff detection of explosives: critical comparison for ensuing options on Raman spectroscopy–LIBS sensor fusion”. Anal. Bioanal. Chem. 400, 3353–3365 (2011).
[140] Lucena, P., Gaona, I., Moros, J. & Laserna, J. J. “Location and detection of explosive-contaminated human fingerprints on distant targets using standoff laser-induced breakdown spectroscopy”. Spectrochim. Acta - Part B At. Spectrosc. 85, 71–77 (2013).
Introduction
68
[141] Gaona, I., Serrano, J., Moros, J. & Laserna, J. J. “Range-adaptive standoff recognition of explosive fingerprints on solid surfaces using a supervised learning method and laser-induced breakdown spectroscopy”. Anal. Chem. 86, 5045–5052 (2014).
[142] Moros, J., Serrano, J., Gallego, F. J., Macías, J. & Laserna, J. J. “Recognition of explosives fingerprints on objects for courier services using machine learning methods and laser-induced breakdown spectroscopy”. Talanta 110, 108–117 (2013).
[143] Dockery, C. R. & Goode, S. R. “Laser-induced breakdown spectroscopy for the detection of gunshot residues on the hands of a shooter”. Appl. Opt. 42, 6153-6158 (2003).
[144] Fortes, F. J., Perez-Carceles, M. D., Sibon, A., Luna, A. & Laserna, J. J. “Spatial distribution analysis of strontium in human teeth by laser-induced breakdown spectroscopy: application to diagnosis of seawater drowning”. Int. J. Legal Med. 129, 807–813 (2015).
[145] Vadillo, J. M. & Laserna, J. J. “Laser-induced plasma spectrometry: truly a surface analytical tool”. Spectrochim. Acta Part B At. Spectrosc. 59, 147–161 (2004).
[146] Piñon, V., Mateo, M. P. & Nicolas, G. “Laser-Induced Breakdown Spectroscopy for Chemical Mapping of Materials”. Appl. Spectrosc. Rev. 48, 357–383 (2013).
[147] Lopez-Quintas, I., Mateo, M. P., Piñon, V., Yañez, A. & Nicolas, G. “Mapping of mechanical specimens by laser induced breakdown spectroscopy method: Application to an engine valve”. Spectrochim. Acta Part B At. Spectrosc. 74–75, 109–114 (2012).
[148] Jolivet, L., Leprince, M., Moncayo, S., Sorbier, L., Lienemann, C.-P. & Motto-Ros, V. "Review of the recent advances and applications of LIBS-based imaging". Spectrochim. Acta Part B At. Spectrosc. 151, 41–53 (2019).
[149] Cáceres, J. O., Pelascini, F., Motto-Ros, V., Moncayo, S., Trichard, F., Panczer, G., Marín-Roldán, A., Cruz, J. A., Coronado, I. & Martín-Chivelet, J. "Megapixel multi-elemental imaging by Laser-Induced Breakdown Spectroscopy, a technology with considerable potential for paleoclimate studies". Sci. Rep. 7 (2017).
[150] Gimenez, Y., Busser, B., Trichard, F., Kulesza, A., Laurent, J. M., Zaun, V., Lux, F., Benoit, J. M., Panczer, G., Dugourd, P., Tillement, O., Pelascini, F., Sancey, L. & Motto-Ros, V. "3D Imaging of Nanoparticle Distribution in Biological Tissue by Laser-Induced Breakdown Spectroscopy". Sci. Rep. 6 (2016).
[151] Le Guével, X., Henry, M., Motto-Ros, V., Longo, E., Montañez, M. I., Pelascini, F., De, O., Rochefoucauld, L., Zeitoun, P., Coll, J.-L., Josserand, V. & Sancey, L. "Elemental and optical imaging evaluation of zwitterionic gold nanoclusters in glioblastoma mouse models †". Nanoscale 10, 18657 (2018).
Introduction
69
[152] Negre, E., Motto-Ros, V., Pelascini, F. & Yu, J. “Classification of plastic materials by imaging laser-induced ablation plumes”. Spectrochim. Acta Part B At. Spectrosc. 122, 132–141 (2016).
[153] Tereszchuk, K. A., Vadillo, J. M. & Laserna, J. J. “Depth profile analysis of layered samples using glow discharge assisted Laser-induced Breakdown Spectrometry (GD-LIBS)”. Spectrochim. Acta Part B At. Spectrosc. 64, 378–383 (2009).
[154] Moros, J., Lorenzo, J. A., Lucena, P., Miguel Tobaria, L. & Laserna, J. J. “Simultaneous Raman Spectroscopy−Laser-Induced Breakdown Spectroscopy for Instant Standoff Analysis of Explosives Using a Mobile Integrated Sensor Platform”. Anal. Chem. 82, 1389–1400 (2010).
[155] Moros, J. & Javier Laserna, J. “Unveiling the identity of distant targets through advanced Raman-laser-induced breakdown spectroscopy data fusion strategies”. Talanta 134, 627–639 (2015).
[156] Lednev, V. N., Pershin, S. M., Sdvizhenskii, P. A., Grishin, M. Y., Fedorov, A. N., Bukin, V. V., Oshurko, V. B. & Shchegolikhin, A. N. "Combining Raman and laser induced breakdown spectroscopy by double pulse lasing". Anal. Bioanal. Chem. 410, 277–286 (2018).
[157] Botto, A., Campanella, B., Legnaioli, S., Lezzerini, M., Lorenzetti, G., Pagnotta, S., Poggialini, F. & Palleschi, V. "Applications of laser-induced breakdown spectroscopy in cultural heritage and archaeology: a critical review". J. Anal. At. Spectrom. 34, 81–103 (2019).
[158] Moros, J., ElFaham, M. M. & Laserna, J. J. “Dual-Spectroscopy Platform for the Surveillance of Mars Mineralogy Using a Decisions Fusion Architecture on Simultaneous LIBS-Raman Data”. Anal. Chem. 90, 2079–2087 (2018).
[159] Delgado, T., Vadillo, J. M. & Laserna, J. J. “Laser-induced plasma spectroscopy of organic compounds. Understanding fragmentation processes using ion–photon coincidence measurements”. J. Anal. At. Spectrom. 28, 1377-1384 (2013).
[160] Delgado, T., Alcántara, J. F., Vadillo, J. M. & Laserna, J. J. “Condensed-phase laser ionization time-of-flight mass spectrometry of highly energetic nitro-aromatic compounds”. Rapid Commun. Mass Spectrom. 27, 1807–1813 (2013).
[161] Delgado, T., Vadillo, J. M. & Laserna, J. J. “Pressure Effects in Laser-Induced Plasmas of Trinitrotoluene and Pyrene by Laser-Induced Breakdown Spectroscopy (LIBS)”. Appl. Spectrosc. 68, 33–38 (2014).
Introduction
70
[162] Delgado, T., Vadillo, J. M. & Laserna, J. J. “Primary and recombined emitting speciesin laser-induced plasmas of organic explosives in controlled atmospheres”. J. Anal. At.Spectrom. 29, 1675–1685 (2014).
[163] Delgado, T., Vadillo, J. M. & Laserna, J. J. “Isomer discrimination in condensed phaseby laser-induced breakdown spectrometry and laser-ionization mass spectrometry using atailored paired-pulse excitation scheme”. J. Anal. At. Spectrom. 33, 1469–1476 (2018)
[164] Hahn, W. D. & Omenetto, N. “Laser-Induced Breakdown Spectroscopy (LIBS), Part I:Review of Basic Diagnostics and Plasma-Particle Interactions: Still-Challenging IssuesWithin the Analytical Plasma Community”. Appl. Spectrosc. 64, 335A-366A (2010).
[165] Zorba, V., Mao, X. & Russo, R. E. “Femtosecond laser induced breakdown spectroscopyof Cu at the micron/sub-micron scale”. Spectrochim. Acta - Part B At. Spectrosc. 113, 37–42 (2015).
[166] Goueguel, C., Laville, S., Vidal, F., Sabsabi, M. & Chaker, M. “Investigation ofresonance-enhanced laser-induced breakdown spectroscopy for analysis of aluminiumalloys”. J. Anal. At. Spectrom. 25, 635-644 (2010).
[167] E.B. Belyaev, A.P. Godlevsky, V.E. Zuev, Yu.D. Kopytin. “Remote SpectrochemicalAnalysis of Atmospheric Aerosols Using Lasers”. In: V.E. Zuev, editor. “Determination ofPhysico-Chemical Parameters of the Atmosphere Using High-Power Lasers”. Tomsk, Russia:IAO, 1979.
[168] Radziemski, L. J., Loree, T. R., Cremers, D. A. & Hoffman, N. M. “Time-Resolved Laser-Induced Breakdown Spectrometry of Aerosols”. Anal. Chem. 55, 1246–1252 (1983).
[169] Cremers, D. A. & Radziemski, L. J. “Detection of Chlorine and Fluorine in Air by Laser-Induced Breakdown Spectrometry”. Anal. Chem. 55, 1252–1256 (1983).
[170] Fortes, F. J., Cabalín, L. M. & Laserna, J. J. “Laser-induced breakdown spectroscopy ofsolid aerosols produced by optical catapulting”. Spectrochim. Acta Part B At. Spectrosc. 64,642–648 (2009).
[171] Fortes, F. J. & Laserna, J. J. “Characteristics of solid aerosols produced by opticalcatapulting studied by laser-induced breakdown spectroscopy”. Appl. Surf. Sci. 256, 5924–5928 (2010).
[172] Álvarez-Trujillo, L. A., Lazic, V., Moros, J. & Laserna, J. J. “Simultaneous imaging andemission spectroscopy for the laser-based remote probing of polydisperse saline aerosols”.J. Aerosol Sci. 123, 52–62 (2018).
Introduction
71
[173] Schüitze, K. & Lahr, G. “Identification of expressed genes by laser-mediatedmanipulation of single cells”. Nat. Biotechnol. 16, 737–742 (1998).
[174] Vogel, A., Lorenz, K., Horneffer, V., Hüttmann, G., von Smolinski, D. & Gebert, A."Mechanisms of Laser-Induced Dissection and Transport of Histologic Specimens". Biophys.J. 93, 4481–4500 (2007).
[175] Horneffer, V., Linz, N. & Vogel, A. “Principles of laser-induced separation andtransport of living cells”. J. Biomed. Opt. 12, 054016 (2007).
[176] Abdelhamid, M., Fortes, F. J., Harith, M. A. & Laserna, J. J. “Analysis of explosiveresidues in human fingerprints using optical catapulting–laser-induced breakdownspectroscopy”. J. Anal. At. Spectrom. 26, 1445-1450 (2011).
[177] Abdelhamid, M., Fortes, F. J., Fernández-Bravo, A., Harith, M. A. & Laserna, J. J.“Production of aerosols by optical catapulting: Imaging, performance parameters and laser-induced plasma sampling rate”. Spectrochim. Acta - Part B At. Spectrosc. 89, 1–6 (2013).
[178] Hahn, D. W., Flower, W. L. & Hencken, K. R. “Discrete Particle Detection and MetalEmissions Monitoring Using Laser-Induced Breakdown Spectroscopy”. Appl. Spectrosc. 51,1836–1844 (1997).
[179]Girón, D., Delgado, T., Ruiz, J., Cabalín, L. M. & Laserna, J. J. “In-situ monitoring andcharacterization of airborne solid particles in the hostile environment of a steel industryusing stand-off LIBS”. Measurement 115, 1–10 (2018).
[180] Carranza, J. E., Fisher, B. T., Yoder, G. D. & Hahn, D. W. “On-line analysis of ambientair aerosols using laser-induced breakdown spectroscopy”. Spectrochim. Acta Part B At.Spectrosc. 56, 851–864 (2001).
[181] Carranza, J. E. & Hahn, D. W. “Assessment of the upper particle size limit forquantitative analysis of aerosols using laser-induced breakdown spectroscopy”. Anal.Chem. 74, 5450–5454 (2002).
[182] Vors, E. & Salmon, L. “Laser-induced breakdown spectroscopy (LIBS) for carbon singleshot analysis of micrometer-sized particles”. Anal. Bioanal. Chem. 385, 281–286 (2006).
[183] Hahn, D. W. & Omenetto, N. “Laser-induced breakdown spectroscopy (LIBS), part II:Review of instrumental and methodological approaches to material analysis andapplications to different fields”. Applied Spectroscopy 66, 347–419 (2012).
[184] Hohreiter, V. & Hahn, D. W. “Plasma-particle interactions in a laser-induced plasma:implications for laser-induced breakdown spectroscopy”. Anal. Chem. 78, 1509–14 (2006).
Introduction
72
[185] Järvinen, S. T., Saari, S., Keskinen, J. & Toivonen, J. “Detection of Ni, Pb and Zn in water using electrodynamic single-particle levitation and laser-induced breakdown spectroscopy”. Spectrochim. Acta - Part B At. Spectrosc. 99, 9–14 (2014).
[186] Järvinen, S. T. & Toivonen, J. “Analysis of single mass-regulated particles in precisely controlled trap using laser-induced breakdown spectroscopy”. Opt. Express 24, 1314 (2016).
[187] Fortes, F. J., Fernández-Bravo, A. & Javier Laserna, J. “Chemical characterization of single micro- and nano-particles by optical catapulting-optical trapping-laser-induced breakdown spectroscopy”. Spectrochim. Acta - Part B At. Spectrosc. 100, 78–85 (2014).
[188] Neuman, K. C. & Block, S. M. “Optical trapping”. Rev. Sci. Instrum. 75, 2787–2809 (2004).
[189] Chu, S. “Nobel Lecture: The manipulation of neutral particles”. Rev. Mod. Phys. 70, 685–706 (1998).
[190] Gouesbet, G. “Generalized Lorenz--Mie theories and mechanical effects of laser light, on the occasion of Arthur Ashkin’s receipt of the 2018 Nobel prize in physics for his pioneering work in optical levitation and manipulation: A review”. J. Quant. Spectrosc. Radiat. Transf. 225, 258–277 (2019).
[191] Ashkin, A. “Acceleration and Trapping of Particles by Radiation Pressure”. Phys. Rev. Lett. 24, 156–159 (1970).
[192] Ashkin, A., Dziedzic, J. M., Bjorkholm, J. E. & Chu, S. “Observation of a single-beam gradient force optical trap for dielectric particles”. Opt. Lett. 11, 288 (1986).
[193] Maragò, O. M., Jones, P. H., Gucciardi, P. G., Volpe, G. & Ferrari, A. C. “Optical trapping and manipulation of nanostructures”. Nat. Nanotechnol. 8, 807–19 (2013).
[194] Dienerowitz, M. “Optical manipulation of nanoparticles: a review”. J. Nanophotonics 2, 021875 (2008).
[195] Daly, M., Sergides, M. & Nic Chormaic, S. “Optical trapping and manipulation of micrometer and submicrometer particles”. Laser Photon. Rev. 9, 309–329 (2015).
[196] Berg-Sørensen, K. & Flyvbjerg, H. “Power spectrum analysis for optical tweezers”. Rev. Sci. Instrum. 75, 594–612 (2004).
[197] Ott, D., Reihani, S. N. S. & Oddershede, L. B. “Crosstalk elimination in the detection of dual-beam optical tweezers by spatial filtering”. Rev. Sci. Instrum. 85, 053108 (2014).
Introduction
73
[198] Ott, D., Nader, S., Reihani, S. & Oddershede, L. B. “Simultaneous three-dimensional tracking of individual signals from multi-trap optical tweezers using fast and accurate photodiode detection”. Opt. Express 22, 23661 (2014).
[199] Hansen, P. M., Tolic-Nørrelykke, I. M., Flyvbjerg, H. & Berg-Sørensen, K. “tweezercalib 2.1: Faster version of MatLab package for precise calibration of optical tweezers”. Comput. Phys. Commun. 175, 572–573 (2006).
[200] Jauffred, L., Taheri, S. M.-R., Schmitt, R., Linke, H. & Oddershede, L. B. “Optical Trapping of Gold Nanoparticles in Air”. Nano Lett. 15, 4713–4719 (2015).
[201] Jauffred, L., Richardson, A. C. & Oddershede, L. B. “Three-Dimensional Optical Control of Individual Quantum Dots”. Nano Lett. 8, 3376–3380 (2008).
[202] Hansen, P. M., Bhatia, V. K., Harrit-, N. & Oddershede, L. “Expanding the optical trapping range of gold nanoparticles”. Nano Lett. 5, 1937–1942 (2005).
[203] Bosanac, L., Aabo, T., Bendix, P. M. & Oddershede, L. B. “Efficient optical trapping and visualization of silver nanoparticles”. Nano Lett. 8, 1486–1491 (2008).
[204] Samadi, A., Bendix, P. M. & Oddershede, L. B. “Optical manipulation of individual strongly absorbing platinum nanoparticles”. Nanoscale 9, 18449–18455 (2017).
[205] Samadi, A., Klingberg, H., Jauffred, L., Kjær, A., Bendix, P. M. & Oddershede, L. B. "Platinum nanoparticles: a non-toxic, effective and thermally stable alternative plasmonic material for cancer therapy and bioengineering". Nanoscale 10, 9097–9107 (2018).
[206] Jørgensen, J. T., Norregaard, K., Tian, P., Bendix, P. M., Kjaer, A. & Oddershede, L. B. "Single Particle and PET-based Platform for Identifying Optimal Plasmonic Nano-Heaters for Photothermal Cancer Therapy". Sci. Rep. 6, 1–10 (2016).
[207] Ma, H., Tian, P., Pello, J., Bendix, P. M. & Oddershede, L. B. “Heat generation by irradiated complex composite nanostructures”. Nano Lett. 14, 612–619 (2014).
[208] Jauffred, L., Samadi, A., Klingberg, H., Bendix, P. M. & Oddershede, L. B. “Plasmonic Heating of Nanostructures”. Chem. Rev. 119, 8087–8130 (2019).
[209] Wang, A., Yang, H., Song, T., Sun, Q., Liu, H., Wang, T. & Zeng, H. "Plasmon mediated Fe–O in an octahedral site of cuprospinel by Cu NPs for photocatalytic hydrogen evolution". Nanoscale 9, 15760–15765 (2017).
[210] Watanabe, K., Menzel, D., Nilius, N. & Freund, H.-J. “Photochemistry on Metal Nanoparticles”. Chem. Rev. 106, 4301–4320 (2006)
75
Chapters
The main chapters of the present dissertation consist of the contributions to different scientific journals derived from the results of the research conducted during the pre-doctoral period in chronological order. In agreement with the requirements placed by the University of Malaga, the works are original research published in journals placed within the first quartile (Q1) for any of its categories according to the Journal Citation Report (JCR). The papers have been adapted to the format of the dissertation to provide cohesion between its different parts, yet the text is identical to that found in the references listed below:
1. Purohit, P., Fortes, F. J. & Laserna, J. J. “Atomization efficiency and photon yield in laser-induced breakdown spectroscopy analysis of single nanoparticles in an optical trap”. Spectrochim. Acta - Part B At. Spectrosc. 130, 75–81 (2017). DOI: 10.1016/j.sab.2017.02.009
2. Purohit, P., Fortes, F. J. & Laserna, J. J. “Spectral Identification in the Attogram Regime through Laser-Induced Emission of Single Optically Trapped Nanoparticles in Air”. Angew. Chemie - Int. Ed. 56, 14178–14182 (2017). DOI: 10.1002/anie.201708870
3. Purohit, P., Fortes, F. J. & Laserna, J. J. “Subfemtogram Simultaneous Elemental Detection in Multicomponent Nanomatrices Using Laser-Induced Plasma Emission Spectroscopy within Atmospheric Pressure Optical Traps”. Anal. Chem. 91, 7444–7449 (2019). DOI: 10.1021/acs.analchem.9b01579
4. Purohit, P., Samadi, A., Bendix, P. M., Laserna, J. J. & Oddershede, L. B. "Optical trapping reveals differences in dielectric and optical properties of copper nanoparticles compared to their oxides and ferrites". Sci. Rep. 10, 1198 (2020). DOI: 10.1038/s41598-020-57650-2
77
Chapter 1
Atomization efficiency and photon yield in laser-induced breakdown spectroscopy analysis of single
nanoparticles in an optical trap
Chapter 1
78
1. Introduction
Determination of concentration, composition and size of atmospheric particulate matter is of crucial importance to ensure air quality and safety given their direct impact on the human organism.1-2 Airborne particles are transported in aerosol form and can be classified according to aerodynamic diameter, which ultimately determines atmospheric lifetime and how much of a threat they pose to health, particularly to the respiratory system. Three main inhalable fractions are found: the coarse fraction or PM10 (particle diameter < 10 μm), the fine fraction or PM2.5 (particle diameter < 2.5 μm) and the ultrafine fraction (particle diameter < 100 nm). As size decreases, assimilation of particles becomes easier and deposition on lungs and other organs can exacerbate the symptoms of already existing diseases or originate new conditions. Carbon is one of the main components of particulate material.3 Pure carbon compounds, known as black carbon (BC), of the fine and ultrafine fractions have been related not only to public health issues, but also to global climate change.4-5 Black carbon may be of natural or anthropogenic occurrence. Fuel and biomass burning are deemed the most prominent sources of BC particles. General exposure to ultrafine aerosols of diverse chemical composition is also increasing from other human activities, e.g., the development of nanotechnology, potentially bringing along toxic effects that remark the need of controlling the presence of nanometric materials in air.6
The typical low concentration of these analytes in the atmosphere makes the detection and chemical characterization of particulate matter a challenge that can be taken over only by few analytical techniques of sensitivities as high as single particle resolution. For example, inductively coupled plasma mass spectrometry (ICPMS) in an approach named Single Particle-ICPMS.7 Optical trapping (OT), introduced by Ashkin in the decade of 19708, is a simple yet efficient method of isolating individual airborne particles of sizes down to a few nanometers in diameter9 by retaining them in controlled positions thanks to forces exerted on the particle by the radiation pressure of a tightly focused laser or in a combination of the aforementioned forces with gravity named optical levitation10, OT allows manipulation of trapped particles in addition to probing in order to acquire a wide variety of information of individual specimens given the exceptional synergy it shows when combined with techniques like Raman spectroscopy.11-12
Coupling of OT and laser-induced breakdown spectroscopy (LIBS) mediated by optical catapulting (OC)13-17 for single particle chemical characterization was first demonstrated by Fortes et al.18 in the novel approach OC-OT-LIBS. LIBS is a well-stablished analytical technique that has been successfully applied for the analysis of aerosols19-20 even in-situ21, avoiding lengthy sample collection and preparation since the absolute mass required for LIBS analysis is extremely low, as reported in literature22-24, and independent
Chapter 1
79
from the physical state of the inspected samples. OC-OT-LIBS comprised the sequential intervention of its three consisting techniques: first, the shockwave generated from a laser pulse was used for optically catapulting sample particles into solid aerosol form which were individually trapped in consequence by an Ar+ laser working at λ=514.5 nm. Lastly a Nd:YAG pulsed laser on its fundamental wavelength excited the particle in order to record the spectral emission from laser-induced plasmas of single particles such as 100 nm Al2O3. A limit of detection (LOD) of 200 attograms for Al was reported.18 The actual development stage of OC-OT-LIBS still requires the exploration of some of its features, particularly the factors conditioning the recorded signal and how it relates to particle size and mass. This question is encompassed in the present paper, where influence of energy density and acquisition delay on the LIBS spectra of 400 nm and 2 μm diameter single trapped graphite particles was studied in order to extract the efficiency of particle dissociation processes in the laser-produced plasma via the yield of photon per mass unit. The mechanism leading to particle excitation was concluded based on time-resolved plasma imaging results. Optical forces acting upon both types of particle size were estimated to characterize trapping stability. LOD of 1.7 fg for C was stablished.
2. Experimental
2.1 Instrument configuration
While the core description of the OC-OT-LIBS instrument can be found in a previous work,18 several modifications, shown in Figure 1A, were introduced in the current study. For a simpler explanation on the distribution of the different lines comprising our setup, a Cartesian three-dimensional coordinate system, depicted in Figure 1A, is proposed. This system will be referred to throughout the paper for discussing matters like particle positioning as well (Figure 1B). Optical catapulting and particle excitation are located in the x axis. Both are performed by the same laser, a Q-switched Nd:YAG laser (1064 nm, 6 ns pulse width) guided into the sample-containing cuvette through two high reflectivity mirrors and a 10x high-power focusing objective (15 mm working distance, 0.25 N.A.). Material was catapulted into solid aerosol form by shockwaves from laser-induced plasmas. Such plasmas were ignited in air by the excitation laser. The shockwaves propagated along z axis and were energetic enough to eject the sample from the support upon impacting on it, filling the cuvette with suspended material. Also in this axis, a visualization line consisting of a compact USB 2.0 CMOS camera coupled to a 10x microscope objective (0.30 N.A.) was installed.
Chapter 1
80
Figure 1. A) Experimental Setup. F1-2 are neutral density filters. L1-3 are focusing lenses. OF stands for optical fiber and OTMO, for optical trapping microscope objective. A 635 nm He-Ne red laser pointer (RLP) was used for the multi-alignment procedure. B) Individual particle positioned in the
reference system as seen from the visualization line.
A neutral density filter was placed prior to the camera in order to reduce the intensity of light scattered by trapped particles. After aerosol production, single particles were successfully trapped in air at atmospheric pressure along the z axis by a CW Nd:YAG laser (532 nm, TEM 00) with a power of 300 mW directed to the back aperture of a 20x objective (17.5 mm working distance, 0.40 N.A.). Once isolated at several mm from the support and cuvette walls, particles were excited by single 1064 nm laser shots. Emission from the onset plasma was recorded in the y axis. Plasma light was simultaneously focused into an iCCD camera by a biconvex lens (UV-FS, 25.4 mm diameter, 50 mm focal length) for imaging analysis and by two plano-convex lenses (UV-FS, 50.8 mm diameter, 100 mm focal length) into the tip of an optical fiber (2m length, 600 μm diameter, 0.22 NA) connected to a time-integrated spectrometer for LIBS spectra. Neutral density filters covering a variety of attenuation coefficients could be placed before the iCCD camera if needed. 1064 nm laser action and energy were controlled by a pulse generator. A second pulse generator was used to set the delay between the laser pulse and spectrometer acquisition gate.
Chapter 1
81
2.2 Multi-alignment scheme
A multi-step routine based on the iCCD camera was developed for ensuring the precise alignment of every system component. This procedure is graphically sketched in Figure 2. First, an image of clean air plasma was recorded. The image provided the exact location in the xz plane where the particle had to be situated for it to be intercepted by the excitation laser. Light scattered by a trapped particle was then observed in real time to evaluate its position. By moving the 20x objective along the z axis, the particle was manipulated until placed in the correct position, which marked the origin of our reference system i.e. the (0,0,0) coordinates. Lastly, LIBS detection was aligned by detaching the optical fiber’s end connected to the spectrometer and passing a red laser pointer through it, traversing the collected light inverse path into the cuvette and reaching the camera.
2.3 Samples
Two different diameter graphite particles were used for the conducted studies: 2 μm (volume: 3.4 x 10⁻¹¹ cm3, mass: 9 pg, Sigma-Aldrich, dispersity: 2-12 μm) and 400 nm (volume: 3.3 x 10⁻¹⁴ cm3, mass: 75 fg, MKNano). Sample powder was directly deposited on 200 μm thick glass slides and covered with a standard 10 mm path length disposable plastic cuvette, which prevented loss due to blowing from surrounding air.
Figure 2. Sketch of the multi-alignment procedure.
Chapter 1
82
3. Results and discussion
3.1 Optical trap stability
The optical trap developed here is robust enough for trapped particles to withstand collisions with other particles from the catapulted solid aerosol until complete relaxation, to allow monodimensional manipulation along the trapping laser axis, and, lastly, to keep the particle position during the parameters setting routine preceding the analysis (<1 min, usually). The system allowed particles of 2 microns and 400 nm to be suspended for periods longer than 8 hours in air at room temperature. Multiple particles could be retained along the z axis, but only those resting at the equilibrium position of the trap (xe, ye, ze) would remain long enough to be interrogated by further inspection techniques.
For a better understanding of the forces acting on the particles, the trap strength was calculated on the basis of the Equipartition theorem. While other methods have been used to calculate optical forces acting on trapped graphite particles due to a focused laser beam,25 the present formalism considers a particle to be an oscillator in a harmonic potential, whose particle Brownian motion can be registered to calculate the trap stiffness, k, from the general expression:
12
KBT = 12
k⟨x2⟩ (Eq. 1)
Where KB is the Boltzmann constant and ⟨x2⟩ is the variance of the particle displacement from its equilibrium position (xe). Despite being a widely used simple calibration method, the Equipartition theorem may underestimate rigidity of traps given its dependence on ⟨x2⟩.26 The software developed by Osterman27 employs Boltzmann statistics to diminish the inherent imprecision of Equation 1 and was therefore used to process our data. Particle coordinates were extracted from videos recorded using the visualization camera after every captured frame was converted to image format by running a custom made script for ImageJ software.28 The resulting data matrix units were converted from pixels to μm and then used as input data. Since images provide 2D information, only two constants could be estimated: kz and ky. Table 1 summarizes the spring constant values and ze equilibrium position. As seen, the trapping strength for 2 μm particles is twofold that for 400 nm ones, whereas the lateral stiffness (ky) exceeds its axial homologous (kz) by two orders of magnitude.
Greater trap stiffness in the direction perpendicular to the beam propagation was expected since the gradient force (Fgrad) originating from the light intensity gradient along the laser focusing region is stronger than other optical forces in this direction. The gradient force is a stabilizing force that holds the particle by attracting it to the intensity maximum.
Chapter 1
83
In contrast, the extinction force, (Fext), originated through momentum transfer from incident photons, pushes the particle out of the trap. Two processes contribute to Fext, namely, absorption (Fabs) and, to a larger extent, scattering (Fscat). Fext gains relevance in the trapping axis essentially because of the refractive index difference existing between graphite and air (ngraphite =2.69;29 nair=1.00), which leads to increased scattering cross section of the particle. Also, due to absorption at 532 nm, photophoretic forces (FPP) appearing from surface temperature differences are not negligible and add an instability factor.30 In optical levitation traps, gravity counteracts Fext besides FPP and balance between the three forces determines the system equilibrium position. On a 2 μm graphite particle, gravity exerts an attraction of Fg = mg =9.34 x 10⁻¹⁴ N (g = 9.81 ms-2). The similarity of this attraction force to the stiffness kz (10-14 N μm-1) explains the trapping of these particles. The reduced gravity force for 400 nm (Fg =7.33 x 10⁻¹⁶ N) implies greater ascending forces in this case. As a result, their equilibrium position is further from the laser focus, hence the weaker trap stiffness, quoted in Table 1.
3.2 Fine tuning of the spectroscopic signal
Every individual particle may be subjected to breakdown only once. The restriction of working in single-shot regime imposes the necessity of thoroughly controlling each of the factors conditioning the formation of laser-induced plasmas and the recording of its emission as significant shot-to-shot variability is tied to this specific kind of analysis. The role of excitation laser energy in OC-OT-LIBS was largely discussed in ref. 18. Energy density on the particle and acquisition delay effects will be detailed in depth in the following subsections.
Table 1. Spring constants and z equilibrium position for both employed samples.
Particle diameter
(μm)
kz (N m-1) ky (N m-1) ze (μm)
2.0 5.11 x 10⁻⁸ 3.67 x 10⁻⁶ 137.7
0.4 2.63 x 10⁻⁸ 1.71 x 10⁻⁶ 155.0
Chapter 1
84
3.2.1 Fluence
Plasma formation threshold of graphite particles was found to be above that of air. Typical required excitation energies were in the order of hundreds of mJ, involving high fluences (F ≡ J cm−2). Under these experimental conditions, and given the extremely small sample mass available, air may become a major interference in LIBS spectra. The displacement of the excitation laser focusing objective along the x axis (see Figure 1) allowed control over the fluence at the origin of coordinates.
A systematic study was conducted on 2 μm particles in order to determine the position where plasma formation leaded to the most intense graphite signals while minimizing those emitted by air. In the reference system used for the study, the laser focus position (LFP) was sequentially modified from the particle position (LFP = 0 mm) for a total of 3 mm: 1.5 mm before (negative side of the x axis) and after (positive side of the x axis) the particle. The pulse energy used was 260 mJ. At each position 10 spectra were acquired with the control emissions being CN at 388.3 nm for graphite and N (II) at 399.5 nm for air. Monitoring of the CN band was considered once CN emission from sources other than the particle was discarded by recording spectra from empty traps. Plasma light collection was aligned at the (0,0,0) position in order to register light emitted only from the particle position. Figure 3 shows the intensity variation for each LFP. CN signal improved the more un-focused the pulse was at the particle surface. Laser events at LFP = 0 mm generated exclusively air emission whereas at LFP = -1.5, the most favorable in terms of SNR ratio, clear graphite signal was recorded with largely reduced presence of N(II).
The signal distribution corroborated that the core of the plasma was mainly composed of air regardless of the LFP at which it was generated. Emissions from ionized air concealed those contributed by the particle at LFPs near 0 since the plasma core got progressively closer to the light collection. Fluence at (0,0,0) was estimated at 47 J cm-2
when LFP = -1.5 mm, an order of magnitude below F for LFP = 0 mm (832 J cm-2). LFP = -1.5mm was considered the optimum position for particle excitation. The relative standard deviation (RSD) of this first tuning phase results ranged from 30 % to 50 %. When 400 nm particles were subjected to the same procedure, similar signal distributions were registered. Delimitation of the laser focus position range increased sampling efficiency to a 100% for both sized particles.
Chapter 1
85
3.2.2 Acquisition delay
Delay (d) yielding the highest SNR for CN emission at 388.3 nm was determined by acquiring 2 μm graphite spectra at LFP = +1.5 mm. Despite the lower CN intensity, this position provided more sensitivity to delay during the first two microseconds, allowing a better evaluation of the parameter. When the experiment was repeated for other key LFP settings (0 and -1.5 mm), spectra showed identical trend. Delay was increased starting from its minimum possible value of 1.28 μs (considered as d = 0). Data were recorded every 1 μs from d = 0 to d = 11 μs, when the lapse was increased to 5 μs until plasma completely extinguished. Figure 4 shows the variation of intensities with the delay. After the first microsecond, background and N (II) declined largely and CN became the most intense signal. Although graphite intensity peaked at a slightly shorter delay (3 μs), the best SNR was observed at 4 μs (corresponding to a SNR value of 14, as estimated from data in Figure 4).
Figure 3. CN (388.3 nm) and N (II) (399.5 nm) net intensity distribution versus LFP along the x axis. Data are shown every 0.1 mm from ±1.5 mm to ±1.00 mm and every 0.2 mm from ±0.8 to 0 mm.
Each point is the average of ten individual laser events on ten different single particles. Light collection was kept at 0 mm.
Chapter 1
86
Again, the best experimental conditions were equivalent for 400 nm particles. RSD suffered a noteworthy improvement following collection delay optimization, going down from over 30% to 10% on 2 μm particles and 19% for 400 nm ones. The larger variability for 400 nm particles is due to optical forces sometimes pushing particle slightly out of the (0,0,0) position in the lateral direction, preventing it from being excited in the exact same way in every laser event. Optimized spectra allowed stablishing a LOD for graphite of 1.7 femtograms.
3.3 Mechanisms leading to particle dissociation in OC-OT-LIBS
It should be noted that irradiating the particle after decreasing the energy until F = 47 J cm-2 at LFP = 0 resulted in the absence of plasma formation since it was far below the calculated plasma ignition threshold of air (F = 255 J cm-2). This fact suggests that, instead of a direct particle excitation by the incoming laser beam, particle breakdown results from a secondary ionization process caused by the plasma formed in air, in agreement with the observations by Hohreiter and Hahn31 and Järvinen and Toivonen.32 In Reference 31, it is suggested that plasma first formed in air may serve as excitation source by engulfing the particle in its expansion, with the plasma-particle interaction dominating the evaporation process without direct laser pulse-particle interaction. Their hypothesis was evidenced by time resolved plasma imaging, which clearly located the particle under analysis in the plasma volume by local perturbations induced in the plasma properties. Plasma-particle interactions33 are governed by heat transfer rates (from the plasma to the particle) and mass transfer rates (from the particle to the plasma) and are especially relevant if the excitation pulse rise time is short and the particle diameter is small,34 as in the present study. In order to verify that the conclusions drawn from the aforementioned studies on the role of air plasma in particulate material dissociation and ionization were also applicable in our present work, time-resolved imaging was used by recording 1:1 images of particle plasmas every 100 ns with an integration time of 5 ns at LFPs 1.5, 0.0 and -1.5 mm. The results of this study are shown in Figure 5. Morphology of the plume development was nearly identical to that described by Amodeo et al. for air,35 with the initial almost circular shape becoming elongated within 100 ns. As observed in the image sequence acquired for LFP = -1.5 mm, the front end of the forward-propagating air plasma reaches the particle in position (0,0,0) after ca. 200 ns. However, the backward front of the plasma formed at LFP = +1.5 mm takes more than 900 ns to reach the particle.
Chapter 1
87
Figure 4. Net N (II) and CN signals temporal evolution plotted along spectral background for each delay. Data was acquired a LFP = +1.5 mm. Inset shows CN trend in greater detail.
Since the propagating plasma loses energy with time, the energy available for particle excitation is lower in the second case. This observation is consistent with the smaller intensity of the emissions shown in Figure 3 when the laser focus position is 1.5 mm beyond the particle (ca. 150 units) as compared to the intensity for LFP of -1.5 mm (ca. 300 units). Based on findings from literature and the discussed results, we conclude that the particle may be dissociated and excited by the plasma formed in air when LFP ≠ 0 mm.
The velocity of plasma expansion has been measured as a function of distance by analyzing plume images acquired at various delay times. Figure 6 shows the results up to 7 μs at LFP = -1.5 mm. During the first 500 ns, the speed decreases exponentially and then, the propagation speed drops until the final collapse of the plume. When intercepting the particle, the plasma front propagates at roughly 1250 m/s. The role of the levitated particle on the plume expansion and whether the sudden decrease in propagation speed and distance traveled after the first microsecond is due to the natural energy lose by collisions with the surrounding air or to collisions with the levitated particle remain to be known.
Chapter 1
88
Figure 5. Single particle time-resolved plasma images acquired at laser focus positions: A) +1.5 mm; B) 0 mm; C) -1.5 mm. The laser propagates horizontally from the right. With an integration time of 5 ns, the acquisition delay was incremented in 100 ns steps. In each set of images, the white dashed line marks the axis where the particle is located. Image contrast was adjusted as
required to highlight plasma emission against background.
3.4 Atomization efficiency and photon yield as a function of particle size
In addition to the well-known dependence of the LIBS signal on the ablated mass, when working on particulate material, particle size becomes a crucial parameter as it determines the efficiency of the dissociation processes. Carranza and Hahn denoted spherical SiO2 particles signal intensity loss of linearity with respect to the particle mass for sizes greater than 2.1 μm, which they set as the upper limit for complete particle evaporation.36 This threshold was calculated to be 5 μm for particles containing an elevated percentage of carbon.37
In our previous work, the number of photons produced in single laser events per mass unit was calculated for particles of diverse diameters and an inverse relation between
Chapter 1
89
size and photon yield was established, albeit particle compositions also differed. The same method was employed for calculating the yield in our current experiment. Briefly, the number photons needed to generate a count of signal in the spectrometer was estimated alluding to the equation:
𝑆𝑆 = 𝜔𝜔𝑑𝑑𝑄𝑄𝐸𝐸 𝜓𝜓
(Eq. 2)
Equation 2, relates the sensitivity S to the pixel well depth, ωd, the quantum efficiency, QE, and the 16-bit AD converter, ψ. Then, tracking the light back to its source of generation, i.e. the particle, and accounting the optical elements it travels across, the photons causing the recorded signal were calculated along the production per mass unit. Table 2 summarizes the results for the particles of interest. Twenty spectra per particle size were averaged. As observed, 400 nm particles yielded a photon count per mass unit larger than the 2 μm particles by more than two orders of magnitude. This fact is straightforwardly linked to the particle atomization efficiency.
Depending on the LFP at which a particle is excited, two different regimes lead to its dissociation: pulse-particle interaction (LFP = 0 mm) or, as discussed in section 3.3, plasma-particle interaction (LFP ≠ 0 mm). In the first case, radiation pressure and temperature buildup in the particle cause its eventual explosion. Taking into consideration the used pulse duration (6 ns), temperature plays a more prominent role than pressure.
Table 2. Spectroscopic yield of the tested particles.
Average particle
diameter (μm)
Mass (g) Mean net
I (cts)
Intensity per
mass unit
(cts g-1)
Photon yield
(photons g-1)
2.0 9.34 x 10⁻¹² 1311 1.39 x 10 14 2.72 x 10¹⁸
0.4 7.47 x 10⁻¹⁴ 1090 1.46 x 10 16 2.78 x 10²⁰
Chapter 1
90
Heating does not occur at constant volume; both size particles have enough time to expand as the process takes place after the material characteristic time of mechanical relaxation,38 given by the expression:
𝜏𝜏 = 𝑟𝑟𝑝𝑝𝑐𝑐𝑝𝑝
(Eq. 3)
Where τ is the mechanical relaxation time; rp, is the particle radius and cp, is the speed of sound in the particle, assumed to be 1470 m s-1 as in bulk graphite. Mechanical relaxation time was τ = 680 ps for 2 μm particles and τ = 136 ps for 400 nm particles. In explosions due to overheating, fragments are barely scattered38 and can interact directly with the ongoing pulse. Since the laser penetrates deeper into 400 nm particles, a larger number of smaller, easier to excite, fragments results from their dissociation.39 In the plasma-particle interaction regime, energy transferred from the plasma to the particle prompts the formation of fragments, which are subsequently excited by the same plasma. The larger surface area of 400 nm particles favors a closer interaction with the plasma, thus resulting in an extended dissociation process. Given the lower particle mass and constituent atom number, less energy needs to be employed for its disintegration and can, in turn, be invested in increasing the excitation efficiency, hence the higher number of photons emitted by these particles.
Figure 6. Expansion speed calculated for plasma formed at LFP = -1.5. For the first 500 ns, the decrease is exponential, turning into an almost flat trend from there onwards. Inset displays the
distance traveled by plasma front during the measured time lapse.
Chapter 1
91
Figure 7. Average spectra of 20 A) 2 μm and B) 400 nm particles at LFP = -1.5 mm, d = 4 μs.
Figure 7 shows spectra for both particle sizes. Despite the two orders of magnitude separating the mass of both particles, there is scarce difference among recorded intensities, pointing towards a maximum size for total dissociation of graphite particles existing in the 400 nm-2 μm diameter interval under our experimental conditions to be explored in the future by expanding the range of sizes under study.
4. Conclusions
LIBS was successfully applied for analysis of single airborne graphite solid particles of 400 nm diameter isolated in optical traps with a 100% sampling efficiency. After a multi-alignment procedure to ensure correct positioning of particles and instrument components, the trapping strength was determined by calculating the trap stiffness. Despite the low optical forces being exerted on the particles, trapping was possible due to these forces being in the same order of magnitude of counterbalancing gravity attraction. Particles were found to undergo dissociation and excitation via two different mechanisms as proposed in LIBS bibliography following time-resolved plasma imaging studies: direct laser pulse-particle interaction and plasma-particle interaction, where the particle is evaporated by energy transferred from the expanding air plasma. Absolute production of photons per sample mass unit was calculated for each particle size, corresponding to masses of 9 pg (2 μm) and 75 fg (400 nm). The larger particles emitted 2.72 x 10¹⁸ photons per gram, whereas 75 fg particles yielded 2.78 x 10²⁰ photons g-1, pointing a more efficient dissociation of the smaller sizes which can be attributed to higher fragmentation of 400 nm particles due to the closer particle-plasma interaction taking place in the optical trap.
Chapter 1
92
References
[1] Seaton, A., Godden, D., MacNee, W. & Donaldson, K. “Particulate air pollution and acutehealth effects”. Lancet 345, 176–178 (1995).
[2] Brunekreef, B. & Holgate, S. T. “Air pollution and health”. Lancet 360, 1233–1242 (2002).
[3] Castro, L. M., Pio, C. A., Harrison, R. M. & Smith, D. J. T. “Carbonaceous aerosol in urbanand rural European atmospheres: Estimation of secondary organic carbon concentrations”.Atmos. Environ. 33, 2771–2781 (1999).
[4] Jacobson, M. Z. “Strong radiative heating due to the mixing state of black carbon inatmospheric aerosols”. Nature 409, 695–697 (2001).
[5] Menon, S., Hansen, J., Nazarenko, L. & Luo, Y. “Climate effects of black carbon aerosolsin China and India”. Science 297, 2250–2253 (2002).
[6] Borm, P. J. A., Robbins, D., Haubold, S., Kuhlbusch, T., Fissan, H., Donaldson, K., Schins,R., Stone, V., Kreyling, W., Lademann, J., Krutmann, J., Warheit, D. B. & Oberdorster, E. “Thepotential risks of nanomaterials: A review carried out for ECETOC”. Particle and FibreToxicology vol. 3 (2006).
[7] Laborda, F., Bolea, E. & Jiménez-Lamana, J. “Single particle inductively coupled plasmamass spectrometry: A powerful tool for nanoanalysis”. Anal. Chem. 86, 2270–2278 (2014).
[8] Ashkin, A. “Acceleration and Trapping of Particles by Radiation Pressure”. Phys. Rev.Lett. 24, 156–159 (1970).
[9] Jauffred, L., Taheri, S. M. R., Schmitt, R., Linke, H. & Oddershede, L. B. “Optical Trappingof Gold Nanoparticles in Air”. Nano Lett. 15, 4713–4719 (2015).
[10] Ashkin, A. & Dziedzic, J. M. “Optical levitation by radiation pressure”. Appl. Phys. Lett.19, 283–285 (1971).
[11] McGloin, D., Burnham, D. R., Summers, M. D., Rudd, D., Dewar, N. & Anand, S. "Opticalmanipulation of airborne particles: techniques and applications". Faraday Discuss. 137,335–350 (2008).
[12] Redding, B., Schwab, M. & Pan, Y. Le. “Raman spectroscopy of optically trapped singlebiological micro-particles”. Sensors (2015).
[13] Fortes, F. J., Cabalín, L. M. & Laserna, J. J. “Laser-induced breakdown spectroscopy ofsolid aerosols produced by optical catapulting”. Spectrochim. Acta - Part B At. Spectrosc.64, 642–648 (2009).
Chapter 1
93
[14] Fortes, F. J. & Laserna, J. J. “Characteristics of solid aerosols produced by opticalcatapulting studied by laser-induced breakdown spectroscopy”. Appl. Surf. Sci. 256, 5924–5928 (2010)
[15] Abdelhamid, M., Fortes, F. J., Harith, M. A. & Laserna, J. J. “Analysis of explosiveresidues in human fingerprints using optical catapulting-laser-induced breakdownspectroscopy”. J. Anal. At. Spectrom. (2011).
[16] Abdelhamid, M., Fortes, F. J., Laserna, J. J. & Harith, M. A. “Optical Catapulting LaserInduced Breakdown Spectroscopy (OC-LIBS) and conventional LIBS: A comparative study”.AIP Conference Proceedings (2011).
[17] Abdelhamid, M., Fortes, F. J., Fernández-Bravo, A., Harith, M. A. & Laserna, J. J.“Production of aerosols by optical catapulting: Imaging, performance parameters and laser-induced plasma sampling rate”. Spectrochim. Acta Part B At. Spectrosc. 89, 1–6 (2013).
[18] Fortes, F. J., Fernández-Bravo, A. & Javier Laserna, J. “Chemical characterization ofsingle micro- and nano-particles by optical catapulting-optical trapping-laser-inducedbreakdown spectroscopy”. Spectrochim. Acta - Part B At. Spectrosc. 100, 78–85 (2014).
[19] Hahn, D. W. & Lunden, M. M. “Detection and analysis of aerosol particles by laser-induced breakdown spectroscopy”. Aerosol Sci. Technol. (2000).
[20] Álvarez-Trujillo, L. A., Ferrero, A. & Javier Laserna, “J. Preliminary studies on stand-offlaser induced breakdown spectroscopy detection of aerosols”. J. Anal. At. Spectrom. (2008).
[21] Hettinger, B., Hohreiter, V., Swingle, M. & Hahn, D. W. “Laser-induced breakdownspectroscopy for ambient air particulate monitoring: Correlation of total and speciatedaerosol particle counts”. Appl. Spectrosc. (2006).
[22] Zorba, V., Mao, X. & Russo, R. E. “Ultrafast laser induced breakdown spectroscopy forhigh spatial resolution chemical analysis”. Spectrochim. Acta - Part B At. Spectrosc. 66, 189–192 (2011).
[23] Diwakar, P. K., Loper, K. H., Matiaske, A.-M. & Hahn, D. W. “Laser-induced breakdownspectroscopy for analysis of micro and nanoparticles”. J. Anal. At. Spectrom. 27, 1110(2012).
[24] Järvinen, S. T., Saari, S., Keskinen, J. & Toivonen, J. “Detection of Ni, Pb and Zn in waterusing electrodynamic single-particle levitation and laser-induced breakdown spectroscopy”.Spectrochim. Acta - Part B At. Spectrosc. 99, 9–14 (2014).
Chapter 1
94
[25] Eckerskorn, N., Bowman, R., Kirian, R. A., Awel, S., Wiedorn, M., Küpper, J., Padgett,M. J., Chapman, H. N. & Rode, A. V. "Optically Induced Forces Imposed in an Optical Funnelon a Stream of Particles in Air or Vacuum". Phys. Rev. Appl. 4, 1–14 (2015).
[26] Neuman, K. C. & Block, S. M. “Optical trapping”. Review of Scientific Instruments(2004).
[27] Osterman, N. “TweezPal - Optical tweezers analysis and calibration software”.Comput. Phys. Commun. 181, 1911–1916 (2010).
[28] Abràmoff, M. D., Magalhães, P. J. & Ram, S. J. “Image processing with imageJ”.Biophotonics International 11, 36-42 (2004).
[29] Djurisic, A.B. & Li, E.H. “Optical properties of graphite”, J. Appl. Phys. 85 7404-7410(1999).
[30] Beresnev, S., Chernyak, V. & Fomyagin, G. “Photophoresis of a spherical particle in ararefied gas”. Phys. Fluids A Fluid Dyn. 5, 2043–2052 (1993).
[31] Hohreiter, V. & Hahn, D. W. “Plasma-particle interactions in a laser-induced plasma:Implications for laser-induced breakdown spectroscopy”. Anal. Chem. 78, 1509–1514(2006)
[32] Järvinen, S. T. & Toivonen, J. “Analysis of single mass-regulated particles in preciselycontrolled trap using laser-induced breakdown spectroscopy”. Opt. Express 24, 1314 (2016).
[33] Hahn, W. D. & Omenetto, N. “Laser-Induced Breakdown Spectroscopy (LIBS), Part I:Review of Basic Diagnostics and Plasma-Particle Interactions: Still-Challenging IssuesWithin the Analytical Plasma Community”. Appl. Spectrosc. 64, 335A-366A (2010).
[34] Warren, R.A. “Laser Induced Breakdown Spectroscopy on Suspended ParticulateMatter in an Electrodynamic Balance: Interaction Processes and Analytical Considerations,PhD thesis”, University of Florida (2013).
[35] Amodeo, T., Dutouquet, C., Le Bihan, O., Attoui, M. & Frejafon, E. “On-linedetermination of nanometric and sub-micrometric particle physicochemical characteristicsusing spectral imaging-aided Laser-Induced Breakdown Spectroscopy coupled with aScanning Mobility Particle Sizer”. Spectrochim. Acta - Part B At. Spectrosc. 64, 1141–1152(2009).
[36] Carranza, J. E. & Hahn, D. W. “Assessment of the Upper Particle Size Limit forQuantitative Analysis of Aerosols Using Laser-Induced Breakdown Spectroscopy”. Anal.Chem. 74, 5450–5454 (2002).
Chapter 1
95
[37] Vors, E. & Salmon, L. “Laser-induced breakdown spectroscopy (LIBS) for carbon singleshot analysis of micrometer-sized particles”. Anal. Bioanal. Chem. 385, 281–286 (2006).
[38] Zhigilei, L. V. & Garrison, B. J. “Computer simulation study of damage and ablation ofsubmicron particles from short-pulse laser irradiation”. Appl. Surf. Sci. 127–129, 142–150(1998).
[39] Schoolcraft, T. A., Constable, G. S., Zhigilei, L. V. & Garrison, B. J. “Molecular DynamicsSimulation of the Laser Disintegration of Aerosol Particles”. Anal. Chem. 72, 5143–5150(2000).
97
Chapter 2
Spectral identification in the attogram regime through laser-induced emission of single optically-
trapped nanoparticles in air
Chapter 2
98
1. Introduction
Nanodevices are steadily making their way into an increasing number of applications over a wide range of fields such as electronics1-2 or biomedicine,3 which take advantage of unique features derived from their structure. The individual characterization of these materials demands a great degree of sensitivity. Suitable techniques ranging from spectroscopy4 to mass spectrometry (MS)5 or electrochemistry6-7 have already been proposed. The mentioned methodologies are not exempt of drawbacks, mostly related to difficult isolation of the NPs and the discrimination of the events produced by an individual particle. Other frequent constraints are the need of transferring samples to stabilized liquid media where other chemical species can potentially lead to data alteration or the low number of elements that can be identified simultaneously, caused by instrumental restrictions as in single particle-MS.8 Seeking to avoid sample pre-treatment while offering extreme sensitivity and multi-component detection for single NP analysis, we present a method based in the combination of optical trapping9 (OT) and laser-induced breakdown spectroscopy (LIBS).10 In this approach, sample nanopowder deposited on a support and placed inside a cuvette is catapulted into solid aerosol form by air plasma shockwaves. A single particle is secluded in the optical trap set by a CW laser as the aerosol spreads through the cuvette. Excitation is performed by a single laser shot and full optical emission spectrum from the particle plasma is collected. We set our focus in Cu NPs analysis for the current work. The presence and relevance of Cu in nanotools is increasing11-13 as a substitute for other noble metals (Au and Ag) due to its similar properties, wider availability and the progressive overcome of negative features, e.g., low resistance to oxidation. OT-LIBS was previously used for analysis of single particles such as graphite, Ni or Al2O3 with diameters down to 100 nm.14-15 Herein, we report the first application of OT-LIBS to particles below the 100 nm size threshold. The probing of such NPs, with masses down to the attogram regime, paves the way to set new extreme limits of detection in optical spectroscopy.
2. Results and discussion
The custom-built experimental setup is shown in Figure 1. In addition to the OT and LIBS lines, the instrument included a visualization line consisting of a CMOS camera for particle tracking and an imaging line with an iCCD camera used to align the system to its origin of coordinates, for plasma imaging and to monitor the contactless NP manipulation. Position of the particle was modified as needed along the z axis until placed at (0,0,0), where spectral identification was conducted. Qualitative portions of Cu nanospheres of average sizes 25, 50 and 70 nm were used for the experiments and could be recovered and reused after measuring. Physical characteristics of the samples are given in Table S1.
Chapter 2
99
Figure 1. Experimental setup featuring the multiple lines of the instrument with main components labelled. Optical trapping was performed using a 532 nm Nd:YAG CW laser and a pulsed Nd:YAG
at 1064 nm was used for LIBS analysis.
We utilized a long working distance (WD) and, consequently, low numeric aperture (NA) microscope objective to focus the trapping beam, delivering 140 mW at the sample plane. The use of such objective allowed trapping at several mm from the sample support and particle manipulation over a large length (~ 5 mm for the higher diameter particles) at the cost of reduced radiation pressure at focus. This was crucial to avoid interference of material re-deposited at the support in the measurements. Besides, locating the optical trap far from high particle density regions reduced the number of aerosol-isolated NP collisions, facilitating trapping. Low forces could potentially affect LIBS sampling rate due to the particle position not being steady enough to assure interaction with the excitation laser. To quantitatively evaluate the optical forces acting upon trapped particles, the trap was calibrated for each sample diameter by tracking their Brownian motion. From calibration (see Supporting Information), stiffness of the trap was accessible via its characteristic spring constant k, which accounts for displacements of the particle from its equilibrium position. Figure 2A shows the values of the radial spring constant (ky) and the axial spring constant (kz) for each sample. Trapping strength increased with particle size, as
Chapter 2
100
reported for optically trapped Au NPs in air.16 From the equilibrium position (0,0,0), trapped particles could randomly travel distances of ca. ±35 μm along the z axis within a few minutes as detailed in Figure 2B. These observed displacements were below the Brownian diffusion radius (Figure S1) estimated by trajectory simulation in air when no optical trap is set (Supporting Information). Thus, we can confirm that trapping was stable enough to overcome diffusion and confine the particle within a controlled space. Although large, random fluctuations posed no major inconvenient during characterization. As exemplified by Figure 2C (I) and (II) particles could be manipulated along wide gaps in order to be placed at (0,0,0) position and guarantee its interception by the LIBS laser, which was focused to a spot of 100 µm. Moreover, as shown in Figure 2C (III), the ignited plasma, which also acted
as excitation source,14, 17-18 covered the entire NP, resulting in 100% sampling efficiency.
Figure 2. A) Radial and axial stiffness for each particle size. B) Trajectory of a 70 nm, 50 nm and 25 nm particle trapped at (0,0,0) due to Brownian motion. C) (I, II) Contactless manipulation of a
trapped 70 nm Cu particle up to (0,0,0) position. The whitearrows highlight the particle position while crosses mark the origin of coordinates. (III) Morphology a plasma ignited on the particle (2
ns after the onset); air is ionized alongside the particle, hence the size and appearance of the plasma.
Chapter 2
101
Metallic Cu is known to possess localized surface plasmon resonance (LSPR), usually featuring extinction maxima at wavelengths (λ) ca. 600 nm.19-20 Previous reports indicate that trapping with λ close to or below plasmon resonance is unlikely.21-22 Nevertheless, we successfully isolated each Cu sample for times spanning from minutes to beyond an hour (50 and 70 nm particles) despite using a trapping λ below Cu LSPR, i.e. 532 nm laser radiation. Further discussion on the physics involved in the process and results of studies conducted on 90 nm Ag and Au NPs are provided in the Supporting Information. It should be mentioned that, at sub-fN nm-1 optical forces, the attraction exerted by gravity upon samples (Fg= 7.19 e-4, 5.75 e-3 and 1.57 e-2 fN for 25, 50 and 70 nm respectively) is in the same order of optical forces in the Z axis. This force may contribute to trapping by counteracting the repulsive light momentum force.
As the waist of the described optical trap was 5.9 μm, several particles could get trapped simultaneously at (0,0,0). This scenario presented a hindrance for single NP inspection since particles were separated by distances below the spatial resolution of the LIBS analysis and were consequently consumed as a cluster by the laser-induced plasma. LIBS emission signal depends directly on the sample mass incorporated into the plasma. To uncover whether a single NP or a cluster were actually trapped on the system, a sorting method was used. In this approach, events in data series exhibiting lower intensities of the Cu (I) line at 324.75 nm were considered to point out single particle excitation. Figure 3 illustrates the method applied to a 70 nm Cu data set. First, we calculated the net intensity of every event and discarded those corresponding to very large signals, attributed to clusters. Also, signals with a signal-to-noise ratio (SNR) below 3 were removed as we observed that they corresponded to particles trapped away from the (0,0,0) position by a length from 2 to 3 times the laser spot size. Particles located beyond provided no signal at all. A gap separating low I events became clear as seen in Figure 3B. Mean I (µevents) of the circled events in Figure 3C was calculated to set the upper limit of single particle detection to µevents +3sevents (the standard deviation of µevents). The lower limit was set as three times the standard variation of the encircled events’ background. This range covered signal fluctuation sources such as shot-to-shot energy variation and size dispersion of the sample. No events other than those first assumed as single NPs fell within the limits as shown in the same panel. The sorting of 50 nm and 25 nm Cu particles can be seen in Figure S6.
Chapter 2
102
Figure 3. Sorting of a 70 nm particles data set. A) Raw data set. B) Net intensity of surviving events after exclusion of large clusters and signals with SNR below 3. Red lines indicate the gap
separating high and low net intensity regions C) Attribution of single particle events according to the criteria described in the main text. Events were gathered for clarity. Dashed horizontal line
marks the mean intensity (μ) of the points within the straight horizontal lines. Those lines limit the single-particle intensity window. The inset in C) shows scattering images of two trapped entities.
Although scattering intensity and size of the image can be used to identify large clusters (left), single particles can be discriminated from smaller clusters only through LIBS (right). Scale bars =
200 µm.
Chapter 2
103
Figure 4 shows the average intensity for each particle diameter after using the classification scheme. As expected, Cu signal increased proportionally to particle size. The signal-to-noise ratio (SNR) for the classified data was calculated from Equation 1:
𝑆𝑆𝑆𝑆𝑆𝑆 = 𝜇𝜇 𝐴𝐴𝐴𝐴𝐴𝐴𝐴𝐴𝐴𝐴𝐴𝐴𝐴𝐴 𝑁𝑁𝐴𝐴𝑁𝑁 𝐼𝐼
3𝑠𝑠𝐵𝐵𝐴𝐴𝐵𝐵𝐵𝐵𝐴𝐴𝐴𝐴𝐵𝐵𝐵𝐵𝐵𝐵𝑑𝑑 (Eq. 1)
SNR values were 26, 17 and 6 for 70, 50 and 25 nm Cu respectively (see Table S2 for details). Thus, we can state that OT-LIBS is able to detect and identify Cu NPs of 73 attogram mass. After linearly fitting net intensity versus particle mass, limit of detection (LOD) for Cu was estimated from Equation 2:
LOD = yb +3sb (Eq. 2)
where yb is the average intensity of a blank for each diameter and sb is their average standard deviation. LOD = 58.9 ± 1.8 ag, the mass of a 23 nm NP, was established.
Figure 4. Correlation between each particle’s net emission intensity and its mass (straight line) and absolute production of photons per mass unit for each diameter particle (dashed line).Inset
shows the average spectra for different size Cu NPs. Spectra were shifted for clarity.
Chapter 2
104
The observed linearity suggests that the particles were completely atomized in the plasma. Still, this fact is not equivalent to excitation of every resulting atom. To quantify the excitation efficiency we backtracked the collected light’s path from the detector to the plasma which originated it.14 The number of photons required to spawn a single intensity unit in the detector at the monitored wavelength (324.75 nm) was estimated according to Equation 3:
𝑆𝑆 = 𝜔𝜔𝑑𝑑𝑄𝑄𝐸𝐸𝜓𝜓
(Eq. 3)
where S is the sensitivity of the detector, ωd is the pixel well depth, QE is the quantum efficiency and ψ is the spectrometer’s 16-bit AD converter. The total number of detected photons was then calculated for a given net intensity. Losses due to traversed optical surfaces were then added as illustrated in Figure S7. Following this analysis, we found a higher degree of excitation for smaller particles. Figure 4 shows the photon yield per sample gram associated to each inspected sample size. NPs of 25 nm diameter yielded one order of magnitude more photons (1.26x10²³ photons g-1) than the 70 nm ones (1.34x10²² photons g-1) despite having a mass two orders of magnitude lower.
Results can be discussed on the basis of the energy required for complete particle dissociation. Samples were irradiated using the same pulse energy (260 mJ), mostly consumed to spark and develop the air-particle plasma. Air plasma acted as the main excitation source over direct pulse-NP interaction17-18 hence, the dissociation and excitation processes were governed by heat transmission from the plasma to the particle and by mass transfer from the particle to the plasma. The amount of energy to be supplied by the plasma in order to fully overcome the atomic bonding is higher for larger particles. Therefore, for plasmas of identical characteristics, a larger part of excitation energy was available for promotion to emissive states of dissociated Cu atoms from 25 nm NPs, hence the higher photon yield. When excitation energy was raised to the maximum output given by the LIBS laser (280 mJ), signal increases were observed for each particle size. Thus corroborating the proposed idea under our experimental conditions (Table S3). The large excitation efficiency of small particles is a key element in the attogram sensitivity of OT-LIBS.
3. Conclusions
We have presented a size-sensitive tool combining optical trapping and laser-induced breakdown spectroscopy able to explore full chemical composition of single NPs isolated within an optical trap in air with masses in the attogram regime. The technique features an unprecedented LOD in optical emission spectroscopy of 58.9 ± 1.8 ag. This
Chapter 2
105
extreme sensitivity is due to increased excitation efficiency of smaller particles in laser-induced plasmas as described here. The technique could support new analytic methods over different scientific fields for identification and assessment of the presence of trace elements in complex structures including composite NPs, nanosensors, nanocarriers or even living cells.
Chapter 2
106
References
[1] Freitas, J. N., Gonçalves, A. S. & Nogueira, A. F. “A comprehensive review of the application of chalcogenide nanoparticles in polymer solar cells”. Nanoscale 6, 6371–97 (2014).
[2] Kamyshny, A. & Magdassi, S. “Conductive nanomaterials for printed electronics”. Small 10, 3515–3535 (2014).
[3] De Crozals, G., Bonnet, R., Farre, C. & Chaix, C. “Nanoparticles with multiple properties for biomedical applications: A strategic guide”. Nano Today 11, 435–463 (2016).
[5] Crut, A., Maioli, P., Del Fatti, N. & Vallée, F. “Optical absorption and scattering spectroscopies of single nano-objects”. Chem. Soc. Rev. 43, 3921–3956 (2014).
[5] Montaño, M. D., Olesik, J. W., Barber, A. G., Challis, K. & Ranville, J. F. “Single Particle ICP-MS: Advances toward routine analysis of nanomaterials”. Anal. Bioanal. Chem. 408, 5053–5074 (2016).
[6] Holt, L. R., Plowman, B. J., Young, N. P., Tschulik, K. & Compton, R. G. “The Electrochemical Characterization of Single Core-Shell Nanoparticles”. Angew. Chemie Int. Ed. 128, 405–408 (2016).
[7] Nizamov, S., Kasian, O. & Mirsky, V. M. “Individual Detection and Electrochemically Assisted Identification of Adsorbed Nanoparticles by Using Surface Plasmon Microscopy”. Angew. Chemie Int. Ed. 55, 7247–7251 (2016).
[8] Montaño, M. D., Badiei, H. R., Bazargan, S. & Ranville, J. F. “Improvements in the detection and characterization of engineered nanoparticles using spICP-MS with microsecond dwell times”. Environ. Sci. Nano 1, 338-346 (2014).
[9] Maragò, O. M., Jones, P. H., Gucciardi, P. G., Volpe, G. & Ferrari, A. C. “Optical trapping and manipulation of nanostructures”. Nat. Nanotechnol. 8, 807–819 (2013).
[10] Fortes, F. J., Moros, J., Lucena, P., Cabalín, L. M. & Laserna, J. J. “Laser-Induced Breakdown Spectroscopy”. Anal. Chem. 85, 640–669 (2013).
[11] Magdassi, S., Grouchko, M. & Kamyshny, A. “Copper nanoparticles for printed electronics: Routes towards achieving oxidation stability”. Materials 3, 4626–4638 (2010).
[12] Wang, C., Ling, L., Yao, Y. & Song, Q. “One-step synthesis of fluorescent smart thermo-responsive copper clusters: A potential nanothermometer in living cells”. Nano Res. 8, 1975–1986 (2015).
Chapter 2
107
[13] Sun, J., Hu, T., Xu, X., Wang, L. & Yang, X. “A fluorescent ELISA based on the enzyme-triggered synthesis of poly(thymine)-templated copper nanoparticles”. Nanoscale 8, 16846–16850 (2016).
[14] Fortes, F. J., Fernández-Bravo, A. & Javier Laserna, J. “Chemical characterization of single micro- and nano-particles by optical catapulting-optical trapping-laser-induced breakdown spectroscopy”. Spectrochim. Acta - Part B At. Spectrosc. 100, 78–85 (2014).
[15] Purohit, P., Fortes, F. J. & Laserna, J. J. “Atomization efficiency and photon yield in laser-induced breakdown spectroscopy analysis of single nanoparticles in an optical trap”. Spectrochim. Acta - Part B At. Spectrosc. 130, 75–81 (2017).
[16] Jauffred, L., Taheri, S. M.-R., Schmitt, R., Linke, H. & Oddershede, L. B. “Optical Trapping of Gold Nanoparticles in Air”. Nano Lett. 15, 4713–4719 (2015).
[17] Hahn, W. D. & Omenetto, N. “Laser-Induced Breakdown Spectroscopy (LIBS), Part I: Review of Basic Diagnostics and Plasma-Particle Interactions: Still-Challenging Issues Within the Analytical Plasma Community”. Appl. Spectrosc. 64, 335A-366A (2010).
[18] Hohreiter, V. & Hahn, D. W. “Plasma-particle interactions in a laser-induced plasma: implications for laser-induced breakdown spectroscopy”. Anal. Chem. 78, 1509–14 (2006).
[19] Chan, G. H., Zhao, J., Hicks, E. M., Schatz, G. C. & Van Duyne, R. P. “Plasmonic properties of copper nanoparticles fabricated by nanosphere lithography”. Nano Lett. 7, 1947–1952 (2007).
[20] Susman, M. D., Feldman, Y., Vaskevich, A. & Rubinstein, I. “Chemical deposition and stabilization of plasmonic copper nanoparticle films on transparent substrates”. Chem. Mater. 24, 2501–2508 (2012).
[21] Arias-González, J. R. & Nieto-Vesperinas, M. “Optical forces on small particles: attractive and repulsive nature and plasmon-resonance conditions”. J. Opt. Soc. Am. A 20, 1201 (2003).
[22] Prikulis, J., Svedberg, F., Käll, M., Enger, J., Ramser, K., Goksör, M. & Hanstorp, D. "Optical Spectroscopy of Single Trapped Metal Nanoparticles in Solution". Nano Lett. 4, 115–118 (2004).
109
4. Additional information to chapter 2
S1. Additional experimental procedures
S1.1 Sample preparation
Powdered Cu nanoparticles of 70, 50 and 25 nm average particle diameter (APD), 90 nm APD Ag and 90 nm APD Au were purchased from MKNano (Canada). Particle morphology was spherical in every case. For sample preparation, small qualitative portions were directly deposited on a microscope glass cover of 200 μm thickness, used as support. Sample amount was kept to a minimum in order to form low density solid aerosols and facilitate single particle inspection. A 10 mm path length disposable plastic cuvette glued to the slide was used to prevent sample diffusion into open air. Particles were stored at room temperature under vacuum conditions and away from light after use.
S1.2 Experimental setup
The system can be divided into three axes as seen in Figure 1 in the main text. The x axis consisted of a Q-switched Nd:YAG laser (1064 nm, 6 ns pulse width, 260 mJ pulse energy) used for particle excitation and an USB CMOS camera for visualization. The laser beam was guided by two high-reflectivity mirrors into a 10x high-power objective (15 mm WD, 0.25 NA) that focused the pulse inside the cuvette. The measured laser spot was 100 µm, hence the energy density was 3310 J/cm2. This density, well above the air plasma formation threshold, provided optimum SNR while preventing the cuvette from being damaged due to absorption of the incident radiation. A 10x microscope objective (17.5 mm WD, 0.30 NA) was coupled to the CMOS and a neutral density filter was used to mitigate the particle-scattered light reaching the camera. Two high-reflectivity mirrors directed a CW Nd:YAG laser (532 nm, TEM 00, 300 mW) to the back aperture of a 20x microscope objective (19 mm WD, 0.40 NA) which focused the beam along the z axis, setting up the optical trap. The estimated Depth of Field of the trap was 400 µm, with a beam waist of 5.9 µm. Approximately 140 mW where delivered at the sample plane. Lastly, the plasma diagnose lines were located in the y axis. For optical spectroscopy, a set of two plano-convex lenses (UV-FS, 50.8 mm diameter, 100 mm focal length) carried the plasma light into the aperture of an optical fiber (2 m length, 600 μm diameter, 0.22 NA) connected to a time-integrated spectrometer. An iCCD camera was used for imaging, employing a biconvex lens (UV-FS, 25.4 mm diameter, 50 mm focal length) to focus the inbound radiation. A filter wheel carrying neutral density filters of different attenuation coefficients
Chapter 2
110
was placed after the lens to use if necessary. The optical elements and systems comprising the instrument were mounted upon micrometric stages to adjust their position with high precision. 1064 nm laser operation and spectrometer acquisition gate delay were controlled by linked pulse generators. Throughout the reported experiments, the acquisition delay was kept at 5.28 μs (with 1.28 μs being due to the spectrometer’s electronic delay) in order to reduce the continuum intensity and the presence of emissions from air in the spectra, thus improving the Cu SNR. The gate width for acquisition was 1.1 ms, the shortest time provided by the employed time-integrated spectrometer.
S1.3 Alignment of the OT-LIBS instrument
As mentioned in the main text, in order to create particle streams, the impact from a laser-induced plasma shockwave was required. For originating aerosols, plasmas were ignited in air by a single 1064 nm laser shots. The first air plasma of each series of measures was imaged by the iCCD camera to determine the position where trapped particle had to be placed to interact with the excitation laser, marked by the center of the plasma (as seen in Figure 2C in the main text); the system was aligned to this (0,0,0) spot. Particle location with respect to (0,0,0) was monitored in real time by the iCCD camera and was manipulated along the z axis by modifying the position of the 20x microscope objective focusing the trapping beam. Once the particle was correctly placed, light from a 635 nm He-Ne laser pointer was sent through the optical fiber’s end connected to the spectrometer into the iCCD camera to evaluate the region where light was collected. If out of (0,0,0), the position of the collection line was changed accordingly using the xz mount to which the optical fiber was attached.
S1.4 Calibration of the optical trap
Trapping strength depends on the optical forces exerted on the particle by the focused laser beam. For a Gaussian beam, such as the one employed herein, the trapping potential can be considered harmonic and the forces are usually estimated from models based on Hooke's Law: F= -kx, where k is the trapping stiffness and x is the length of a particle displacement from its equilibrium position. Stiffness is, therefore, a parameter characterizing the optical trapping strength for each diameter particle that is experimentally accessible via recording the Brownian motion of the secluded particles. The program in reference S1 was used to estimate k by applying Boltzmann statistics to acquired data sets. Thanks to this approach, trapping potential can be assessed even when the particle moves far away from the center of the optical trap, as in the case we describe, where the pure harmonic model cannot be applied. Once trapped and, if required, placed at (0,0,0), videos tracking the position of the particle were recorded by the visualization
Chapter 2
111
line. To avoid position shifts due to particle-particle collisions, measurements were started after complete relaxation of the aerosol. A custom script for the software ImageJS2 allowed us to extract the coordinates of the particle’s center of mass from each frame of the video. The resulting matrix was used as input data for the calibration software. From 2D images, only kz and ky could be estimated, but given the spherical morphology of the particles, the remaining radial spring constant, kx, should be equal to ky. Constants were calculated independently. Axial stiffness is exceeded by the lateral one by an order of magnitude as reported in Figure 2A in the main text. This is due to the extinction forces arising from photon absorption by the particle and photon momentum transfer gaining significance over the gradient force, which attracts the particle to the region of maximum intensity gradient, in the z axis.
S2. Additional results and discussion
S2.1 Trajectory simulation for Brownian diffusion radius estimation and optical trap simulation
Any microscopic particle placed in a fluid medium is subjected to Brownian motion. For an optical trap to be considered stable, the displacements of the held particle must be restricted to a length inferior to that of the diffusion radius of the experimented Brownian motion. As mentioned in the main text, to verify whether the described trap conformed with this terms, we simulated the trajectories that Cu particles may cover in air in absence of the optical trap. For this, equations and Matlab codes provided by reference S3 were used.
The motion of a free Brownian particle can be estimated from the Langevin equation:
with 𝒎𝒎𝒙𝒙 ̈ (𝒕𝒕) being the inertial term, 𝜸𝜸�̇�𝒙 (𝒕𝒕), the friction term and �𝟐𝟐𝑲𝑲𝑩𝑩𝑻𝑻𝜸𝜸 𝑾𝑾 (𝒕𝒕)
the white noise, that is, a fluctuating force due to collisions with the close air molecules. In Eq. (S1) m is the mass, 𝜸𝜸 is the friction coefficient, KB is the Boltzmann’s constant and T, the temperature.
For measuring times (tm) well above the momentum relaxation time of the particle under study (τ = m/𝜸𝜸), the inertial term can be neglected and Equation S1 rewritten as follows:
𝒙𝒙𝒊𝒊 = 𝒙𝒙𝒊𝒊−𝟏𝟏 + √𝟐𝟐𝟐𝟐∆𝒕𝒕 𝒘𝒘𝒊𝒊 (Eq. S2)
Chapter 2
112
where D is the diffusion coefficient, related to 𝜸𝜸 by the Einstein relation 𝜸𝜸D=KBT.
Since measuring times for monitoring displacements were greatly superior to the τ in every situation (tm = 100 ms >>> τ70 = 133 ns > τ50 = 48 ns > τ25 = 6 ns for T = 298 K), we opted to use Equation S2 for calculations. Figure S1 presents the results of the simulations for each particle size. Temperatures between room temperature and Cu melting point (1358 K) were studied as radiation absorption by the particles leads to an increase of T and, subsequently, a change in the viscosity of air. As seen, particles are expected to randomly move for hundreds of microns during a lapse of 100 seconds. Such displacements were not experimentally recorded even for longer observation windows (300 seconds in Figure 2B, main text), hence we can confirm the capability of our trap to overcome Brownian diffusion and stably seclude the particle. Moreover, the observed particle positions (Figure 2B in the main text) were in good agreement with the results of the simulations in which the optical trap was included in the model (Figure S2), which further confirms the confining action of optical forces upon trapped particles.
S2.2 Evaluation of the influence of polarizability on trapping: magnitude of the real and the imaginary part of particle polarizability as a function of irradiation wavelength
Main forces acting upon trapped particles are the attracting gradient force (FG) and the repulsive light momentum force, which is usually dominated by scattering and may be defined as FScat = FExtinction – FAbsoption. Polarizability (α) plays a major role in trapping since it can dictate the dominant force acting upon the particle and hint which wavelengths may lead to successful OT. Only when the real part of α (proportional to the gradient force) exceeds the imaginary part (proportional to the light momentum force) trapping becomes truly feasible. To analyze the magnitude of both Re (α) and Im (α) for each of the available particles and discuss the viability of trapping we used the equations published in reference 21 of the main text:
𝑹𝑹𝑹𝑹 (𝜶𝜶) = 𝒂𝒂𝟑𝟑 �𝜺𝜺′−𝟏𝟏��𝜺𝜺′+𝟐𝟐�+ 𝜺𝜺′′ 𝟐𝟐
(𝜺𝜺′+𝟐𝟐)𝟐𝟐+ 𝜺𝜺′′𝟐𝟐 (Eq. S3)
𝑰𝑰𝒎𝒎 (𝜶𝜶) = 𝒂𝒂𝟑𝟑 𝟑𝟑𝜺𝜺′′(𝜺𝜺′+𝟐𝟐)𝟐𝟐+ 𝜺𝜺′′ 𝟐𝟐
(Eq. S4)
where “a” is the particle radius, ε’, the real part of the permittivity and ε’’ the imaginary part of the permittivity. As seen in Figure S3, Re (α) always exceeds Im (α) at the trapping wavelength (λOT = 532 nm) implying that FG may overcome FScat for each sample. For Cu (panels A-C), λOT is slightly below the Re (α) peak, yet at a point where the gap with Im (α) is appreciable. The decrease Im (α) exhibits from 600 nm onwards suggests that,
Chapter 2
113
while trapping is possible with the used λOT, greater stabilities should be achievable by employing longer wavelengths. Silver (panel D), on the other hand, features a region where OT is not possible as Re (α) decreases abruptly to negative values whereas Re (α) reaches its maximum value. Still, λOT is far from this region and, in principle, 90 nm Ag particles should be trappable in a trap set with 532 nm light. Lastly, the polarizability values for Au (panel E) shows that λOT is coincident with Re (α) maximum and a zone of progressive increase of Im (α). Similar to the conclusions drawn for Cu, these results indicate that while 532 nm should be an appropriated wavelength for trapping our gold nanoparticles, longer wavelengths may provide stiffer traps as the gap between Re (α) and Im (α) is larger.
S2.3 OT-LIBS of Ag and Au nanoparticles
Apart from Cu, Ag and Au particles with 90 nm diameter (4 and 7.3 fg particle mass, respectively) were also subjected to OT-LIBS. All experimental variables described for Cu were kept constant in order to provide readily comparable results. In spite of the positive expectations generated from the study of polarizability, trapping of Ag and Au using 532 nm light happened at random. Silver was generally trapped in the form of evident large clusters such as the one presented in Figure S4A. An Ag particle resembling a single sphere was trapped only once (Figure S4B). The spectrum acquired in this event showed clear Ag emission with an acceptable SNR. Trapped gold particles displayed excellent manipulability, but rather weak signals as most of the times the emission would go undetected or feature low SNR even if two particles were probed (Figure S4C). This may be attributed to Au-Au bond needing higher energy to be dissociated among other causes such as partial absorption of emitted Au (I) radiation at 267.59 nm by the cuvette. In conclusion, the lack of trapping reproducibility made the acquisition of enough data and, therefore, the application of statistics and the elaboration of a classification for single Ag or Au particle events difficult. However, some results extracted from these experiments (Figure S4B and S4D) are encouraging enough to continue the studies on both metals after upgrading the experimental set up with a more adequate trapping wavelength.
Chapter 2
114
S2.4 UV-Vis absorption spectroscopy: evaluation of the influence of LSPR in trapping
Oxidation under atmospheric conditions is a crucial limiting factor to the use of Cu as a substitute for other metals in applications depending on plasmonic properties. Oxides modify the surface characteristics of Cu, eventually leading to the loss of the localized surface plasmon resonance. For this reason, we suggested that the development of corrosion layers during the course of the experiment may affect Cu trapping. To back this hypothesis UV-Vis absorption spectra of the particles were acquired. Qualitative sample portions were suspended in methanol and sonicated for 20 min before measuring the absorption profiles using a Cary 60 UV-Vis spectrophotometer (Agilent Technologies). Occurrence of broad bands was expected since contribution of different particle sizes and persistent clusters is recorded rather than solely that of an individual particle. As shown in Figure S5A, 70 and 50 nm Cu features absorption maxima due to metallic copper at 600 nm, in agreement to data found in reference 19 of the main text. Presence of oxides was evidenced by bands between 400 and 550 nm. For 50 nm particles, oxides absorbed a larger fraction of the impinging radiation than their 70 nm counterparts, indicating a higher degree of surface oxidation. The extreme situation is observed for 25 nm particles, where no clear maxima was observed, but rather a broad profile which pointed out how oxidation can disrupt the LSPR of a particle. Hence, the isolation of non-trappable objects as a result of the theoretical restrictions imposed by the LSPR would be viable. This observation is further reinforced by the results on Ag. After being stored under atmospheric conditions, these particles also exhibited absorption due to silver oxide at 475-550nm (Figure S5B).[S4] The appearance of Ag2O can explain Ag trapping using 532 nm radiation. For gold, also displayed in Figure S5B, data show that trapping light was in the vicinity of the absorption maximum of metallic Au, where particles tend to be pushed out of the trap due to large extinction. The strong absorption of Ag/Ag2O and Au particles contributed to magnify the magnitude of the extinction forces (FExtinction = Fscat + Fabsorption), hence the difficulties found for isolating these particles even if under reduced influence of LSPR.
Chapter 2
115
S3. Additional figures and tables
Figure S1. Simulated trajectories due to Brownian diffusion in air for a A) 25 nm particle, B) 50 nm particle and C) 70 nm particle. Positions were calculated every 1 ms. Viscosity of air was adjusted
according to the input temperature.
Chapter 2
116
Figure S2. Simulated trajectories of A) 25 nm, B) 50 nm and C) 70 nm Cu particles isolated within an optical trap of features identical to that of the one described in the main text (values of the radial and lateral stiffness in the simulated traps were those given in figure 2A). Positions were
calculated every 1 µs.
Chapter 2
117
Figure S3. Calculated values of the real (red) and imaginary (light blue) parts of the polarizability for 25, 50 and 70 nm Cu particles and 90 nm Ag and Au particles. The vertical dashed green line
indicates the wavelength of the trapping laser.
Figure S4. LIBS spectrum and corresponding trapped particle image of A) a large silver cluster, B) a single Ag particle, C) two closely trapped Au particles and D) a single Au particle.
Chapter 2
118
Figure S5. Normalized UV-Vis spectra of A) 25, 50 and 70 nm Cu and B) 90 nm Ag and Au. The dashed vertical line indicates the used trapping wavelength.
Chapter 2
119
Figure S6. Results of the classification scheme applied to A) a 50 nm particles data set and B) a 25 nm data set. Dashed lines mark the mean intensity (μ) of the single particle events. Straight lines
delimit the I window within which events could be attributed to individual particles.
Chapter 2
120
Figure S7. Photon yield estimation illustration. The ratio between photons reaching the detector and photons lost at the entrance of the spectrometer is 0.02. At each of the six optical surfaces and the cuvette face (adding two more surfaces) traversed in the path from the plasma to the
optical fiber a photonic loss of 4% was considered. Finally, the plasma was considered as a point source of light and the solid angle for the collection lenses was 0.19 steradian. Results of these studies are given as the absolute production of photons per mass unit to allow straightforward
comparison of data.
Chapter 2
121
Table S1. Physical characteristics of the samples.
Average diameter (nm)
Size dispersion (nm)
Volume (cm3) r.t. density (g cm-3) Mass (fg)
25 ± 3.7 1.95 x 10⁻¹⁸ 8.96
0.073
50 ± 7.5 1.56 x 10⁻¹⁷ 0.586
70 ± 10.5 4.28 x 10⁻¹⁷ 1.61
Table S2. Quantities derived from each average spectrum and used for calculation in the main text.
Table S3. Photon production as a function of excitation pulse energy. For the studied E range, smaller particles are subjected to more efficient excitation.
Average diameter (nm) Photon yield (photons g-1) E = 260 mJ
Photon yield (photons g-1) E = 280 mJ
25 1.31 e23 1.60 e23
50 3.25 e22 3.96 e22
70 2.03 e22 2.64 e22
Chapter 2
122
Additional references
[S1] Osterman, N. “TweezPal - Optical tweezers analysis and calibration software”. Comput. Phys. Commun. 181, 1911–1916 (2010).
[S2] Abràmoff, M. D., Magalhães, P. J. & Ram, S. J. “Image processing with imageJ”. Biophotonics International 11, 36-42 (2004).
[S3] Volpe, G. & Volpe, G. “Simulation of a Brownian particle in an optical trap”. Am. J. Phys. 81, 224–230 (2013).
[S4] Gallardo, O. A. D., Moiraghi, R., Macchione, M. A., Godoy, J. A., Pérez, M. A., Coronado, E. A. & Macagno, V. A. "Silver oxide particles/silver nanoparticles interconversion: susceptibility of forward/backward reactions to the chemical environment at room temperature". RSC Adv. 2 (2012).
123
Chapter 3
Sub-femtogram simultaneous elemental detection in multicomponent nanomatrices using laser-induced plasma emission spectroscopy within atmospheric
pressure optical traps
Chapter 3
124
1. Introduction
The interest in accurate characterization of every component present in cutting-edge nanomaterials is increasing proportionally to their design complexity.1-4 Functional elements that might be present within engineered or natural occurring nanoparticles (NPs) range from light atoms to metalloids like Si, heavier noble metals such as Ag or Au5 or metallic oxides. The latter NPs are of interest in nanostructure research for a variety of application, e.g. as support for further functionalized materials6-7 and as catalyst themselves.8-11 The numerous singularities of nanosamples represent a challenge in constant evolution to the Analytical Chemistry community.
Routine analytical techniques in laboratories such as ICP-AES,12-13 GF-AAS,14-15 IR spectroscopy16 or conventional ICP-MS17 can provide complete depictions of samples containing populations of nanotargets, yet, with the exception of MS, do not operate at single particle (SP) level, are limited in the number detectable species, unsuitable for organics or difficult to use for certain inorganics. Single nanoparticle analysis has for many years struggled to establish itself as a necessary application in studies other than research such as quality control, yet with designs relying heavily on tight control over parameters including shape and composition, the occlusion of non-desired chemical species in individual particles can be crucial for perfect function of materials, hence justifying the efforts in SP analysis. Although numerous approaches to SP-MS have been reported,18-20 this technique is not able to provide panoramic chemical information within the frame of a single reading and often involves tedious data treatment procedures.
Laser-induced breakdown spectroscopy (LIBS) is commonly regarded as a versatile technique able to adapt to multiple extreme scenarios21-22 and has been recognized as an excellent method for aerosol science since early stages of its development.23-24 Aerosol-related LIBS studies were the precursor to SP-LIBS analysis which was successfully applied to microparticles isolated in an electrodynamic balance by Järvinen and coworkers.25-26 Recently, a novel approach named OC-OT-LIBS was introduced as a promising method for analysis of single NPs.27 Under this methodology, particles are stably trapped in air at atmospheric pressure and can be conveniently manipulated for precise positioning prior to LIBS analysis. As a result, the emission spectra from the individually trapped particles is acquired. Thus, the integration of optical catapulting (OC), optical trapping (OT) and LIBS acting sequentially permit straightforward identification of the material inspected. This platform has been successfully used for the chemical analysis of single micro- and nanoparticles down to 25 nm in diameter for Cu NPs28-29 leading to direct detection of masses in the attogram regime and yielding Limits of Detection (LODs) unprecedented in optical emission spectroscopy such as 58.9±1.8 ag for Cu NPs.
Chapter 3
125
Among capabilities still to be addressed using OC-OT-LIBS are its sampling throughput as well as its relation to other techniques and the simultaneous detection of multiple analytes within a single NP inherent to LIBS. In this work, an enhanced sampling strategy is tested seeking to drastically reduce the analysis duration by limiting the number of particles reaching the optical trap and remaining in suspension in the sample chamber during LIBS probing. Multielemental analysis was performed using binary and tertiary spinel samples, CuFe2O4 and CuZn1-xFe2O4, respectively. Herein, simultaneous detection of multiple metallic species all present in attogram quantities in nanomatrices of masses in the low femtogram range is demonstrated. Individual limits of detection are provided for each species along individual excitation efficiency, which fundaments the recorded data and provides insight on the laser-induced mechanisms causing the dissociation and excitation of trapped NPs.
2. Experimental section
2.1 Samples
Inverse spinels CuFe2O4 and CuZn1-xFe2O4 nanoparticles of 90±18 nm diameter (MKNano, Canada) were subjected to LIBS characterization. Physical and compositional properties for both samples are provided in Table 1. Chemical formula of the Zn-containing ferrites was assumed to be CuZnFe2O4 to simplify the mass calculation due to its non-stoichiometric nature and to account for particle-to-particle Zn fraction changes, which was weighed during data averaging process. Provided density values are those of the bulk materials.
2.2 Sample preparation
Dry nanopowders were used throughout the experiments. Samples consisted of qualitative portions of particles (normally, few micrograms) placed on a 200 µm thick microscope cover glass serving as platform. To prevent sample losses caused by diffusion into open air upon laser-induced shockwave impacts, a 10 mm light path disposable plastic cuvette was glued to each cover glass, conforming the sample chamber.
Chapter 3
126
2.3 Instrumental setup
Instrument configuration is thoroughly described in references 27 and 28. Briefly, a ns-pulsed laser emitting at 1064 nm and focused through a 20x long working distance microscope objective was used to eject the nanopowders into aerosol form by creating a shockwave that propagated through the sample platform. Perpendicular to the catapulting laser, and focused by the same objective, impinged a CW laser centered at 532 nm. This laser constituted the optical trap at approximately 15 mm from the chamber base. Location of the trap as well as the position of trapped particles was adjusted by manipulating the microscope objective along the z axis. The whole system was aligned to a (0, 0, 0) coordinate dictated by the intersection of the sampling laser and the particle under inspection as registered using an iCCD camera 27. Once the particle was conveniently placed and the aerosol flow ceased, LIBS analysis was performed using a 10x microscope objective to focus a 6 ns, 1064 nm laser pulse on the particle. The energy density was kept constant at 3.3 x 10³ J cm-2 thus sparking an air plasma that engulfed the trapped NP. Plasma light was directed by a pair of 2" bi-convex lenses into the tip of a 600 µm core diameter optical fiber, connected to a time-integrated spectrometer. Synchronization of the lasers was externally controlled by a pair of pulse and delay generator which allowed the control of the interpulse delay and data acquisition parameters. Acquisition delay time for LIBS analysis was kept at 5.28 µs, thus minimizing spectral background. Figure 1A summarizes the essential components of the OC-OT-LIBS system.
Table 1. Physical properties of the samples and mass fraction for each element in both types of NPs.
CuFe2O4 CuZnFe2O4 CuFe2O4 w% Mass fraction (fg)
Particle size (nm) 90±18 90±18 Cu 26.56 0.55 Density (g cm-3) 5.4 5.5 Fe 46.68 0.96
Average particle mass (fg)
2.06 2.09 O 26.75 0.55
Molecular weight (g mole-1)
239.23 304.62 CuZnFe2O4 w% Mass fraction (fg)
Cu 20.85 0.43 Zn 21.46 0.45 Fe 36.66 0.77 O 21.01 0.44
Chapter 3
127
2.4 Enhanced sampling strategy
In previous articles, a limiting factor to the OC-OT-LIBS technology was the sampling throughput. High density of catapulted aerosols along with elongated persistence times of the suspended particles, which iteratively recirculate inside the sampling chamber due to naturally-occurring convection currents, contributed to extend the length of sampling periods. As a consequence, the aforementioned convection currents increase the number of collisions, resulting in occasional expulsion of trapped particles from the trapping volume. With the objective of thinning aerosol streams and improving the sampling throughput, 3D-printed resin cones, emulating skimmer cones used in mass spectrometry, were tested. The dimensions of the sampling cones are depicted in Figure 1B. Cones were designed to precisely adjust to the chamber width and allowed an easy alignment of the trapping laser beam while keeping intact the location of the optical trap. Tip aperture diameter was 2 mm to accommodate the size of the beam waist while far from the focus. As shown in Figure 1C, by introducing a sampling cone in the chamber, the aerosol stream reaching the optical trap was restricted to that propagating collinear to the cone aperture and the laser trapping. Presence of recirculating material, propelled in every direction during the OC stage, was considerably reduced as it impacted the inner walls of the cone. To evaluate the differences between both strategies, with and without sampling cones, the aerosol streams were monitored by an iCCD camera.
2.5 Data processing and identification of single particle events
Spectral range covered by the detector covered wavelengths between 260 and 430 nm where the three elements under study feature strong emission lines which are not interfered by emissions from the air plasma. The most intense emission lines featured in recorded spectra were used for further studies, i.e. Fe (II) at λ = 274.69 nm, Cu (I) at λ = 324.75 nm and Zn (I) at λ = 334.50 nm. The ionic Fe line was chosen on the basis of its consistent particle-to-particle detectability and improved SNR when compared to Fe (I) emission at 302.04 nm. In bulk studies, the Cu (I) line at 324.75 nm has a tendency to self-absorption which was not observed in SP spectra, this could indicate low number density of Cu atoms in the ground state populating the collected plasma portion30 and, subsequently high excitation efficiency. To extract the net intensity of the emission, background values were calculated for each emission line by averaging 4 nm of their closest signal-free region. Cu (I) signal was used to verify whether recorded spectra corresponded to a single NP or a particle cluster. The system was calibrated by using Cu NPs of 25, 50 and 70 nm in average diameter.
Chapter 3
128
Figure 1. A) Simplified experimental setup featuring the main laser-based lines described in the main text. A visualization line consisting in a biconvex lens and an iCCD camara was located
collinear to the LIBS detection. B) 3D printed cones used for the enhanced sampling strategy. C) Illustration of both sampling schemes tested herein. Concept of the enhanced route is depicted in
the bottom row.
Figure 2 features average net intensity of the line Cu (I) at 324.75 nm for ten single-particle events plotted as function of the particle mass. A high correlation between both parameters was observed. Since the mass fraction of Cu in both ferrites was known, net LIBS signals for Cu resulting from single CuFe2O4 and CuZnFe2O4 NPs analysis were expected to fit properly in the calibration equation. This was motivated by previous results which demonstrated that particles below 2 µm fully dissociate in our system yielding signals proportional to the analyte mass occluded in the laser-induced plasma [27- 29]. Therefore, good adaptation of the processed signals to the linear fit was used as the condition to evidence whether the number of probed particles was one or above one.
Signals meeting the criteria of signal-to-noise ratio (SNR) >3 were considered to be within the limit of detection of OC-OT-LIBS. Limit of detection (LOD) for Fe and Zn were calculated as:
𝐿𝐿𝐿𝐿𝐿𝐿 = 3 𝐶𝐶 𝑆𝑆𝑆𝑆𝐿𝐿𝐵𝐵𝑆𝑆𝑆𝑆𝑆𝑆
Chapter 3
129
Where C is the concentration in w/w %, RSDB is the relative standard deviation of the blank and SBR is the net signal to background ratio. LOD for Cu was estimated from the linear regression in Figure 2. To avoid misestimating background-related quantities, air plasmas ignited in sample-free cuvettes were used as blanks. In this way, alterations originating from seeding effects due to aerosolized NPs close to the focal region are obviated.
3. Results and discussion
3.1 Sampling Statistics
Following the scheme proposed in Figure 1C, a number of twenty laser events were acquired under each sampling strategy. OC-OT-LIBS analysis were performed using CuFe2O4
NPs of 90 nm in diameter. Differences among both sampling schemes were appreciable, and the results are summarized in Table 2. In our study, the trapping efficiency was defined as the number of catapulting events resulting in a particle entering the optical trap and remaining occluded for a period of time long enough to proceed with LIBS characterization. Trapping was considered stable once no confined particle-aerosol collisions could be observed in the iCCD camera. In this aspect, the average time for stable trapping was reduced by ca. 50% when using the sampling cones. Thus, the trapped particles would remain steady performing ordinary Brownian motion after 1.5-2.2 min from the aerosol onset.
Table 2. Sampling statistics for n = 20 under both described sampling schemes.
Regular sampling scheme Enhanced sampling scheme Trapping efficiency (%) 76% 93% Average time for stable
trapping (min) ~ 4.0 < 2.0
Average time for complete analysis (min)
6.8 3.2
SP events (%) 31% 56%
Sampling throughput (NP hour-1)
~ 9 ~ 20
Chapter 3
130
Studies were completed once aerosol stream relaxed and no longer interfered with the focal region of the laser employed for LIBS analysis. Hence, the average time for complete analysis was also shortened in time by a factor of 2.13. Improvements in sampling statistics were related to the significant amount of particles remaining within the cone walls after the catapulting event. With the objective of evaluating whether acquired emission signals originated from individual particles or a clusters, the Cu (I) emission at 324.75 nm of each recorded spectra was fitted into the linear regression shown in Figure 2, perfectly associating each laser event to a defined particle mass. As a result, the percentage of SP events was higher when using the sampling cones, greater than 50%, and the total sampling throughput was improved by a factor of 2. This experiment also proved that sampling cones prevented from aggregates reaching the optical trap and the formation of clusters and agglomerates in the focus.
Figure 2. Cu signal calibration of the OC-OT-LIBS platform using three different average particle sizes. In agreement with previous results on this subject, response was directly proportional to ablated mass, thus verifying that only single particles were probed in each case. Moreover, the limit of quantification (LOQ) of the approach was calculated as LOQ = yb +10sb =236 ag, hence
confirming that Cu quantification in the ferrites was reliable under our experimental conditions.
Chapter 3
131
Figure 3 presents the evolution of aerosol streams as a function of time under each sampling strategy. As observed in the images, the use of a sampling cone favored the formation of a substantially thinner aerosol stream. The frames captured at 105 s revealed that, in contrast, the regular sampling scheme featured heavy aerosol flow. It is worth highlighting that at 105 s barely any suspended material other than the stably trapped particle could be observed when using the sampling cone. Finally, once the trapped particle was stabilized, it could be conveniently manipulated and positioned at the (0,0,0) coordinate for LIBS analysis as shown in Figure 3I-J. Thereby, the inclusion of sampling cones enhances the efficiency of the technology to fully characterize NP populations by resulting in a twofold increment of the number of readings per hour and more favorable probing conditions.
Figure 3. iCCD images for an analysis performed under A-E) regular sampling scheme and F-J) improved sampling scheme. Frames were recorded at identical times up to stable particle
trapping, which happens at t = 105 s for the improved scheme, where axis breaks to the moment before LIBS probing. For reference, the illuminated cone tip is shown in bottom row images. Scale
bar is 300 µm.
Chapter 3
132
3.2 Multilelemental detection
All the metallic atoms constituting both ferrites were successfully detected by LIBS. Average spectra of 29 single particle events for CuFe2O4 and 17 events for CuZnFe2O4 are shown in Figure 4. Average net Intensity of Cu (I) at 324.75 nm was calculated as 919.4±193.1 a.u. for CuFe2O4 and 811.7±137.9 a.u. for CuZnFe2O4. When interpolated in the calibration curve, regression analysis resulted in r = 0.995, indicating a high agreement degree between the calculated Cu mass for each oxide and the experimental mass. Signal-to-noise ratios were 14 for CuFe2O4 and 20 for CuZnFe2O4. Emission intensity for the ionic line Fe (II) at 274.91 nm was slightly higher for CuZnFe2O4: Net I (CuFe2O4) = 247.3 ± 74.1 (SNR = 7), Net I (CuZnFe2O4) = 320.5 ± 124.0 (SNR = 6). This fact may seem counterintuitive provided the ca. 20% lower Fe content available in this ferrite. In previous works, single particles were found to undergo dissociation and excitation in agreement with the mechanisms proposed by Hohreiter and Hahn.31 Briefly, the surrounding air plasma forming alongside the particle plasma, transfers energy to the particle in the form of heat which promotes the breaking of the particle chemical bonds thus freeing atoms into the plasma. Free atoms are then excited to emissive levels also by the air plasma. Both transferences are rate limited. Zn+2 partially substitutes Cu+2 in CuZnFe2O4, introducing a weaker, and subsequently, easier to dissociate bond in the crystalline lattice (∆Hf°Cu-O = 343 Kcal mol-1 whereas ∆Hf°Zn-O = 284 Kcal mol-1). As the quantity of energy required by each particle to fully dissociate is smaller in the case of the Zn-containing ferrite, it is reasonable to assume that a larger fraction of the energy is available for excitation of the free atoms. Zn (I) at 334.50 exhibited a weak intensity profile (Net I = 60 ± 7.5 a.u.), barely within detectability (SNR = 3). Further details on this emission are provided in the section below. Individual LIBS spectra indicate that OC-OT-LIBS can directly and simultaneously detect masses as low as 770 ag of Fe and 450 ag of Zn with theoretical absolute LODs calculated from average spectra of 575 ag for Fe and 304 ag for Zn in multielemental matrices. Furthermore, the LOD for Cu (from the linear regression) was 37 ag. The use of sampling cones herein improved the LOD for Cu using the 324.75 nm line previously established at 58.9 ag29 by ca. 37%.
3.3 Photon yield as a measure of excitation efficiency
For a better understanding of the phenomena occurring during the air plasma-particle interaction and the pathways followed during the atomization and the excitation of the samples, the photon budget was calculated as described elsewhere.27-29 Quantification of photons emitted at a given wavelength provided a solid ground for interpretation of spectra and justification of the analytical performance of OC-OT-LIBS for each species. Figure 5A shows the absolute emission of photons per sample mass unit of
Chapter 3
133
the lines used for LODs calculation along neighboring Fe signal to Fe (II) at 274.91 nm. Despite differences in the Cu (324.75)/Cu (327.39) photon yield ratio found from one matrix to another, the total number of photons emitted by Cu atoms remained virtually constant.
Figure 4. Average spectra of A) 29 single CuFe2O4 events and B) 17 single CuZnFe2O4 events. For better comparison, Zn line is marked with a discontinuous red line. Fe lines at 298.31 nm and
301.90 nm were not considered for statistics due to their lower intensity with respect to that of Fe (II) at 275.91 nm.
Chapter 3
134
An average of 12.7 x 10²¹ photons g-1 were recorded from CuFe2O4 analysis while 12.5 x 10²¹ photons g-1 originated from CuZnFe2O4 NPs, indicating that both samples underwent plasma-particle interactions of similar efficiencies. Moreover, this fact pointed towards a potential saturation of the excitation process for similar-sized NPs with the whole atomic population of a certain element being promoted to emissive states by the air plasma. In agreement with spectral data, Fe atoms are more efficiently excited in CuZnFe2O4 as evidenced by the general increase in photon yield for every monitored line. Yield of the Zn transition was, as expected from LIBS results, poor featuring an order of magnitude less efficiency than other studied lines (5.41 x 10²⁰). Parameters affecting the intensity of an emission line include oscillator strength, transition probability and energy of the level to which electrons are promoted by the excitation source. Figure 5B shows the energy of the upper levels (E1) as found in literature for lines considered in Figure 4A in addition to the gap (∆E) separating E1 and the ground level (E0). E1 for Zn emission at 334.50 nm was the highest of the seven considered transitions with E1= 7.76 eV. In Figure 5C, the photon yield of each transit of CuZnFe2O4 is plotted as function of E1. A decaying profile with acceptable correlation coefficient was found upon data fitting to an exponential function.
Figure 5. A) Average emission of photons per gram for main lines found in both samples. B) E1
energies and ∆E of transits in A. C) Exponential fit of photon yield as a function of E1.
Chapter 3
135
If we consider the finite energy transfer rate in which mechanisms leading to particle atomization and excitation are based, it is reasonable to propose a selective excitation of readily accessible low-lying states in SP-LIBS under the conditions applied herein. E1 for other observable Fe lines, namely, Fe (II) at 298.31 nm and Fe (I) at 302.04 nm were 5.82 eV and 4.19 eV, respectively. These data are compatible with other transitions. The priority population of low E1 levels may be of help to anticipate detection feasibility for different elements by OC-OT-LIBS.
4. Conclusions
Simultaneous multielemental characterization at single particle level using LIBS was demonstrated by probing single 90 nm in diameter NPs of two different oxides, namely CuFe2O4 and CuZnFe2O4, with masses in the order of attograms being successfully detected. Limits of detection were set at 575 ag for Fe, 304 ag for Zn and 37 ag for Cu. Quantification of the photon emission by each constituent element revealed similar dissociation and excitation efficiencies for both samples with slight variations arising from the nature of the chemical bonds present in each multi-component matrix. Moreover, an inverse exponential relation was found between photon yield and upper level energy. This correlation complied with mechanisms described in literature for single particle atomization and excitation and provides new insight on the analytical properties of single nanoparticle LIBS studies. An enhanced sampling strategy based in 3D-printed skimmer-like cones was used to double the sampling throughput of OC-OT-LIBS technology for single nanoparticles with respect to the original sampling approach described in previous work. Overall, we expect the results described in this work to impulse OC-OT-LIBS as a tool for efficient panoramic characterization of nanoparticulate materials obviating any previous sample preparation stage and with straightforward data treatment procedures.
Chapter 3
136
References
[1] Markwalter, C. F., Kantor, A. G., Moore, C. P., Richardson, K. A. & Wright, D. W. “Inorganic Complexes and Metal-Based Nanomaterials for Infectious Disease Diagnostics”. Chem. Rev. 119, 1456–1518 (2019).
[2] Kukkar, D., Vellingiri, K., Kaur, R., Bhardwaj, S. K., Deep, A. & Kim, K.-H. "Nanomaterials for sensing of formaldehyde in air: Principles, applications, and performance evaluation". Nano Res. 12, 225–246 (2019).
[3] Mottaghitalab, F., Farokhi, M., Fatahi, Y., Atyabi, F. & Dinarvand, R. “New insights into designing hybrid nanoparticles for lung cancer: Diagnosis and treatment”. J. Control. Release 295, 250–267 (2019).
[4] Moßhammer, M., Brodersen, K. E., Kühl, M. & Koren, K. “Nanoparticle- and microparticle-based luminescence imaging of chemical species and temperature in aquatic systems: a review”. Microchim. Acta 186, 126 (2019).
[5] Aznar, E., Oroval, M., Pascual, L., Murguía, J. R., Martínez-Máñez, R. & Sancenón, F. "Gated Materials for On-Command Release of Guest Molecules". Chem. Rev. 116, 561–718 (2016).
[6] Ariga, K., Nishikawa, M., Mori, T., Takeya, J., Shrestha, L. K. & Hill, J. P. "Self-assembly as a key player for materials nanoarchitectonics". Sci. Technol. Adv. Mater. 20, 51–95 (2019).
[7] Wang, A., Yang, H., Song, T., Sun, Q., Liu, H., Wang, T. & Zeng, H. "Plasmon mediated Fe–O in an octahedral site of cuprospinel by Cu NPs for photocatalytic hydrogen evolution". Nanoscale 9, 15760–15765 (2017).
[8] Oar-Arteta, L., Aguayo, T., Remiro, A., Bilbao, J. & Gayubo, A. G. “Behavior of a CuFe2O4/γ-Al2O3 Catalyst for the Steam Reforming of Dimethyl Ether in Reaction-Regeneration Cycles”. Ind. Eng. Chem. Res. 54, 11285−11294 (2015).
[9] Li, Y., Shen, J., Hu, Y., Qiu, S., Min, G., Song, Z., Sun, Z. & Li, C. "General Flame Approach to Chainlike MFe 2 O 4 Spinel ( M = Cu , Ni , Co , Zn ) Nanoaggregates for Reduction of Nitroaromatic Compounds". Ind. Eng. Chem. Res. 54, 9750−9757 (2015).
[10] Zhang, T., Zhu, H. & Croue, J. “Production of Sulfate Radical from Peroxymonosulfate Induced by a Magnetically Separable CuFe2O4 Spinel in Water: Efficiency, Stability, and Mechanism”. Environ. Sci. Technol. 47, 2784−2791 (2013).
Chapter 3
137
[11] Cama, C. A., Pelliccione, C. J., Brady, A. B., Li, J., Stach, E. A., Wang, J., Wang, J., Takeuchi, E. S., Takeuchi, K. J. & Marschilok, A. C. "Redox chemistry of a binary transition metal oxide (AB2O4): a study of the Cu2+/Cu0 and Fe3+/Fe0 interconversions observed upon lithiation in a CuFe2O4 battery using X-ray absorption spectroscopy". Phys. Chem. Chem. Phys. 18, 16930–16940 (2016).
[12] Wang, Y.-F., Sun, L.-D., Xiao, J.-W., Feng, W., Zhou, J.-C., Shen, J. & Yan, C.-H. "Rare-Earth Nanoparticles with Enhanced Upconversion Emission and Suppressed Rare-Earth-Ion Leakage". Chem. - A Eur. J. 18, 5558–5564 (2012).
[13] Zhang, S., Metin, Ö., Su, D. & Sun, S. “Monodisperse AgPd Alloy Nanoparticles and Their Superior Catalysis for the Dehydrogenation of Formic Acid”. Angew. Chemie 125, 3769–3772 (2013).
[14] Feichtmeier, N. S., Ruchter, N., Zimmermann, S., Sures, B. & Leopold, K. “A direct solid sampling analysis method for the detection of silver nanoparticles in biological matrices”. Anal. Bioanal. Chem. 408, 295–305 (2016).
[15] Leopold, K., Brandt, A. & Tarren, H. “Sizing gold nanoparticles using graphite furnace atomic absorption spectrometry”. J. Anal. At. Spectrom. 32, 723–730 (2017).
[16] Dendisová, M., Jeništová, A., Parchaňská-Kokaislová, A., Matějka, P., Prokopec, V. & Švecová, M. "The use of infrared spectroscopic techniques to characterize nanomaterials and nanostructures: A review". Anal. Chim. Acta 1031, 1–14 (2018).
[17] Feichtmeier, N. S., Ruchter, N., Zimmermann, S., Sures, B. & Leopold, K. “A direct solid sampling analysis method for the detection of silver nanoparticles in biological matrices”. Anal. Bioanal. Chem. 408, 295–305 (2016).
[18] Montoro Bustos, A. R., Purushotham, K. P., Possolo, A., Farkas, N., Vladár, A. E., Murphy, K. E. & Winchester, M. R. "Validation of Single Particle ICP-MS for Routine Measurements of Nanoparticle Size and Number Size Distribution". Anal. Chem. 90, 14376–14386 (2018).
[19] Gundlach-Graham, A., Hendriks, L., Mehrabi, K. & Günther, D. “Monte Carlo Simulation of Low-Count Signals in Time-of-Flight Mass Spectrometry and Its Application to Single-Particle Detection”. Anal. Chem. 90, 11847–11855 (2018).
[20] Bolea-Fernandez, E., Leite, D., Rua-Ibarz, A., Balcaen, L., Aramendía, M., Resano, M. & Vanhaecke, F. "Characterization of SiO 2 nanoparticles by single particle-inductively coupled plasma-tandem mass spectrometry (SP-ICP-MS/MS)". J. Anal. At. Spectrom. 32, 2140–2152 (2017).
Chapter 3
138
[21] Laserna, J., Vadillo, J. M. & Purohit, P. “Laser-Induced Breakdown Spectroscopy (LIBS): Fast, Effective, and Agile Leading Edge Analytical Technology”. Appl. Spectrosc. 72 (suppl), 35-50 (2018).
[22] Fortes, F. J., Moros, J., Lucena, P., Cabalín, L. M. & Laserna, J. J. “Laser-Induced Breakdown Spectroscopy”. Anal. Chem. 85, 640–669 (2013).
[23] Hahn, D. W. & Omenetto, N. “Laser-Induced Breakdown Spectroscopy (LIBS), Part II: Review of Instrumental and Methodological Approaches to Material Analysis and Applications to Different Fields”. Appl. Spectrosc. 66, 347–419 (2012).
[24] Diwakar, P. K., Loper, K. H., Matiaske, A.-M. & Hahn, D. W. “Laser-induced breakdown spectroscopy for analysis of micro and nanoparticles”. J. Anal. At. Spectrom. 27, 1110 (2012).
[25] Järvinen, S. T. & Toivonen, J. “Analysis of single mass-regulated particles in precisely controlled trap using laser-induced breakdown spectroscopy”. Opt. Express 24, 1314 (2016).
[26] Järvinen, S. T., Saari, S., Keskinen, J. & Toivonen, J. “Detection of Ni, Pb and Zn in water using electrodynamic single-particle levitation and laser-induced breakdown spectroscopy”. Spectrochim. Acta - Part B At. Spectrosc. 99, 9–14 (2014).
[27] Fortes, F. J., Fernández-Bravo, A. & Javier Laserna, J. “Chemical characterization of single micro- and nano-particles by optical catapulting-optical trapping-laser-induced breakdown spectroscopy”. Spectrochim. Acta - Part B At. Spectrosc. 100, 78–85 (2014).
[28] Purohit, P., Fortes, F. J. & Laserna, J. J. “Atomization efficiency and photon yield in laser-induced breakdown spectroscopy analysis of single nanoparticles in an optical trap”. Spectrochim. Acta Part B At. Spectrosc. 130, 75–81 (2017).
[29] Purohit, P., Fortes, F. J. & Laserna, J. J. “Spectral Identification in the Attogram Regime through Laser-Induced Emission of Single Optically Trapped Nanoparticles in Air”. Angew. Chemie - Int. Ed. 56, 14178–14182 (2017).
[30] Hou, J. J., Zhang, L., Zhao, Y., Ma, W. G., Dong, L., Yin, W. B., Xiao, L. T. & Jia, S. T. "Resonance/non-resonance doublet-based self-absorption-free LIBS for quantitative analysis with a wide measurement range". Opt. Express 27, 3409 (2019).
[31] Hohreiter, V. & Hahn, D. W. “Plasma-particle interactions in a laser-induced plasma: implications for laser-induced breakdown spectroscopy”. Anal. Chem. 78, 1509–14 (2006).
139
Chapter 4
Optical trapping reveals differences in dielectric and optical properties of copper nanoparticles compared
to their oxides and ferrites
Note: This work was performed at the laboratories of the Niels Bohr Institute under the supervision of Professor Lene Oddershede as part of a 4 month pre-doctoral stay in the Optical Tweezers research group at the University of Copenhagen, Denmark.
Chapter 4
140
1. Introduction
The unique plasmonic properties of metallic nanoparticles have placed them in a privileged spot among other materials in nanoscience.1-3 Copper nanoparticles (CuNPs) have been proposed for a number of applications within photonics,4 catalysis,5 nanothermometry,6 biosensing7,8 or nanomedicine.9 Nevertheless, the choice of copper tends to fall behind silver, gold or platinum, probably due to its poor stability, i.e., its tendency towards oxidation. Spontaneous formation of cupric oxide (CuO) and Cuprous oxide (Cu2O) leads to changes of plasmonic properties and chemical reactivity10 and is difficult to control. The Cu-containing ferrite CuFe2O4 (cuprospinel) and CuZnFe2O4 nanoparticles belong to the spinel group and derive from magnetite (Fe3O4) with Cu+2 and Zn+2 partially substituting Fe+2 in the crystalline structure. These particles are also of bio-medical interest since cuprospinel can be used as a cytotoxic agent in cancerous cells11 and CuZnFe2O4 has been proposed as an antibacterial agent.12 Moreover, cuprospinel is a material of interest in photocatalytic production of hydrogen.13
In the aforementioned applications the interaction between the Cu nanoparticles and the incoming light is of crucial importance and in certain applications a controlled positioning of the particle is needed. Optical tweezers are a well-known tool by which nano- or microscopic particles can be manipulated and accurately positioned using a highly focused laser beam.14 Not only dielectric particles but also plasmonic nanoparticles made of gold, silver or platinum have been reported individually optically trapped using a tightly focused Gaussian laser beam, one of the simplest implementations of optical tweezers,15-
18 and their interaction with electromagnetic field, including the absorption and scattering of the particles, is relatively well understood.19-23 For copper, however, only larger particles, 1-20 µm, have been reportedly trapped,24 and a quantitative description of the interaction between CuNPs and the electromagnetic field is still lacking.
The optical trap exerts a harmonic potential on the trapped particle and determination of the spring constant characterizing the potential provides a way to quantify how the particle interacts with the EM field. In the current manuscript we demonstrate optical trapping of Cu containing nanoparticles, their oxides and ferrites, and also use the tweezers to explore and quantify their interaction with the EM field. Our results demonstrate that even smaller changes of chemical bonding within metallic nanoparticles, or the presence of an oxide layer, have substantial effect on the particle’s optical properties. Moreover, using Finite Element Modelling (FEM) we calculated relevant optical cross-sections, the polarizability, as well as the expected heating of optically trapped CuNPs. The steep and highly spatially-controlable heating delivered by metallic nanoparticles is of significant interest for catalytic and chemical applications of CuNPs.4
Chapter 4
141
2. Experimental section
2.1 Optics and data acquisition
An inverted microscope (LEICA DMIRB HC) was used to integrate the optical trap, based on a CW Nd:YVO4 laser (λ = 1064 nm, 5 W, Spectra Physics). The laser was focused by an oil immersion objective (HCX, PL, APO, 100x/N.A. = 1.4). The immersion oil had an index of refraction of n = 1.54, ensuring minimum spherical aberration at the sample plane, located approximately at 5 µm from the chamber’s lower surface. A quadrant photodiode (QPD) (S5981, Hamamatsu) placed in the conjugate plane of the condenser’s back focal plane to monitor the trapped particle position. To visualize the trapped particles, a CCD camera (25 Hz frame rate, Sony XC-EI50) was used to detect the backscattered light. When a particle was trapped, we monitored a significant change in the QPD signal; the amplitude of the time series, signifying the variance of the positions visited, increased to a steady value upon successful trapping. Should a second particle enter the trap, the signal on the QPD would again change as described in Reference 16. Also, we performed real-time calculations of the power spectrum of the QPD signal and the characteristic Lorentzian spectrum as displayed in Figure 1G would only emerge when a particle was successfully trapped. A custom-made Labview program was used for processing the time series acquired by the QPD.
2.2 Sample preparation
Dry nanopowdered Cu NPs with mean diameters of 25 nm (Cu25), 50 nm (Cu50) and 70 nm (Cu70) as well as 90 nm in diameter CuFe2O4 and CuZnFe2O4 NPs were purchased from mkNano (Canada). A small portion of the powders (below 1 mg) was suspended in 1.5 ml of ultrapure milliQ water and sonicated for ~20 minutes and then filtered through 100 nm pore diameter membranes to reduce the possible presence of clusters in the trapping chambers. Perfusion chambers were built by using a microscope slide and a cover glass separated by double-sided scotch tape. The volume of the chamber was completely filled with the diluted nano-suspensions.
2.3 TEM imaging
The TEM images of the different particle types shown in Figure 1A-E were obtained using a transmission electron microscope (Philips CM-12 (120 kV) and Philips EM-420 (120 kV)) located at the University of Copenhagen.
Chapter 4
142
3. Results and discussion
3.1 Particle characterization and power spectra acquisition
Diluted suspensions of CuNPs with diameters of 25 nm (Cu25), 50 nm (Cu50) and 70 nm (Cu70), CuFe2O4 (90 nm), and CuZnFe2O4 (90 nm) were prepared as described in section 2.2. To evaluate particle morphology and size, TEM images (see equipment details above) of these suspensions were acquired. Example images are shown in Figure 1A-E and overall, particle sizes and morphologies were found to be in good agreement with those provided by the manufacturer. Figure 1F illustrates the experimental setup with which the particles were individually optically trapped by a tightly focused 1064 nm laser beam. The particle’s positional time series was acquired by a quadrant photodiode (QPD). The recordings on the QPD allowed for assessment of whether one or more particles were optically trapped.16 Due to the high dilution, sonication and filtration of the sample, there was essentially no particle aggregation and most often only a single particle would be trapped; only time series originating from single particle trapping were analysed.
Optical tweezers exert a harmonic force on the trapped NP, Ftrap = -κx, where κ is the spring constant characterizing the optical trap and x is the deviation from the equilibrium position. Hence, if κ is known, the force acting on the particle can be found for any position. For this reason, the current work aims at determining κ for optical trapping of CuNPs. The particle’s dynamics in any translational dimension is well described by the Langevin equation,
where m is the particle’s mass, a(t) its acceleration, 𝑣𝑣 (𝑡𝑡) its velocity, 𝜸𝜸 the friction coefficient, and 𝐹𝐹𝑡𝑡ℎ𝑒𝑒𝑟𝑟𝑒𝑒𝑒𝑒𝑒𝑒(𝑡𝑡) is a time-dependent stochastic force originating from thermal collisions within the medium. In water the particle’s motion is overdamped and the inertial term, ma(t), can be ignored. Hence, the positional power spectrum is given as
𝑷𝑷 (𝒇𝒇) = 𝑲𝑲𝑩𝑩𝑻𝑻𝜸𝜸
𝟏𝟏𝒇𝒇𝟐𝟐+ 𝒇𝒇𝒄𝒄𝟐𝟐
, (Equation 2)
where 𝜸𝜸 = 6πŋR for spherical particles (with R being the particle’s radius and ŋ the medium’s viscosity) and fc= κ/2π𝜸𝜸 denotes the corner frequency. Figure 1G shows power spectra of all trapped particles along with fits (full lines) of Equation 2 using the routines described in reference 26 which return values of fc and hence κ as further discussed in the following section. It is worth noticing that all obtained power spectra are well fitted by Equation 2 and that the signal is entirely different from that of an empty trap (see Supporting Figure S1), both in terms of signal amplitude and appearance.
Chapter 4
143
The inset of Figure 1G demonstrates that all position histograms are Gaussian, as expected because the particle is trapped in a harmonic potential. For pure CuNPs, the width of the histograms, and thereby the variance of the signal, increases with particle size as expected because the smaller the particle, the larger the excursions in the optical trap. For the ferrites, the situation is more complex as not only their size but also their material properties change in comparison to pure CuNPs.
3.2 Optical trapping strength of individual CuNPs and ferrites depends on particle size and chemical nature
The trap stiffnesses in the lateral plane κx (parallel to the laser’s polarization direction) and κy (orthogonal to the laser’s polarization direction) were extracted via power spectral analysis of the time series as described in the preceding section. Values of κ versus laser power are shown in Figure 2A-D. For all particles, the trap stiffness increased linearly with laser power, a hallmark of successful optical trapping.
Figure 1. Electron microscopy images of (A) 70 nm, (B) 50 nm, (C) 25 nm, CuNP. (D) 90 nm CuFe2O4, and (E) 90 nm CuZnFe2O4, nanoparticles. (F) Schematic of the optical trapping
experiment. (G) Power spectra, P(f), of Cu25 (blue up-triangles), Cu50 (red circles), Cu70 (black squares), CuFe2O4 (magenta down-triangle) and CuZnFe2O4 (green diamond) nanoparticles,
trapped by 1064 nm at P=270 mW at the focal plane. Solid lines depict Lorentzian fits (Equation 2) of the spectra using routine from reference 25. Inset shows positional histograms for the trapped
particles along with Gaussian fits (full lines).
Chapter 4
144
As expected, the larger the solid CuNPs, the higher the spring constant, as observed also for solid gold and silver nanoparticles.16-17
The trap stiffnesses of CuFe2O4 and CuZnFe2O4 are shown in Figure 2C-D. In this figure, the lines fitted to the experimentally obtained values of κ for Cu70 and Cu50 (from Figure 2A-B) are shown as dashed black and red lines, respectively, to allow for easy comparison. At all laser powers, the trap stiffnesses for the 90 nm CuFe2O4 and CuZnFe2O4 nanoparticles turned out to be lower than for the 70 nm CuNPs, despite their larger size. This can be attributed to the ionic chemical bonds which conform the oxides restrict the electron mobility through the crystalline structure in stark contrast to the delocalized electron clouds enclosing Cu-Cu bonds in the pure metallic particles, thus leading to a more limited particle-laser light interaction for the ferrites.
In order to compare κ for CuZnFe2O4 NPs versus κ for CuFe2O4 NPs at each laser power (as shown in Figured 2C and 2D), we first used a D’Agostino-Pearson’s K-squared test to assess the normality of the measured distributions of fc (which are directly proportional to κ) at each laser power. The numbers of individual particles measured at each laser power for CuFe2O4 and CuZnFe2O4 are given in Table S1. For each particle, 5 measurements were made, both of fcx and of fcy. As all distributions were found to be normally distributed, we proceeded to perform a Two Sample t-test (including Welch’s correction for unequal variances) as well as a Two Sample Test for Variance (both with significance level = 0.05) as well as a Two Sample Test for Variance (both with significance level = 0.05), in order to compare the two independent distributions of fc for the two particle types measured at each laser power. For all laser powers, the average value of fc is larger for CuFe2O4 particles than for CuZnFe2O4 particles. For laser powers of 223 mW and above, the two data sets representing CuFe2O4 and CuZnFe2O4 NPs, respectively, are significantly different (on a p = 0.05 significance level). At every laser power the two data sets representing CuZnFe2O4 and CuFe2O4 NPs respectively, turned out to be significantly different (on a p = 0.05 significance level). For example, at a laser power of P = 223 mW Welch’s t-test returned a value of p = 0.030 when comparing fcy values and a value of p = 0.031 when comparing fcx values between the two particle types. As κ is directly proportional to fc (fc = κ/2πγ), we find that at all laser powers average values of κ for CuFe2O4 particles are larger than for CuZnFe2O4 particles and for laser powers of 223 mW and higher, this difference is significant on a 0.05 significance level. This is true both in the x and y directions. A plausible reason for this measured difference in trapping strength could be that the Zn-O bond found in CuZnFe2O4 is more covalent than both the Cu-O and Fe-O bonds since Zn+2 features a less metallic behavior than the two other counter cations.
Chapter 4
145
This leads to an overall lower permittivity, thus explaining the lower trapping efficiency observed for the CuZnFe2O4 nanoparticles.
3.3 Optical cross sections and polarizability of CuNPs
The size of the CuNPs investigated here is small enough that they belong to the Rayleigh regime. In the Rayleigh regime, the optical force can be written as 𝑭𝑭 = 𝑭𝑭𝒈𝒈𝒕𝒕𝒂𝒂𝒈𝒈 +𝑭𝑭𝑺𝑺𝒄𝒄𝒂𝒂𝒕𝒕26, 27 , where the gradient force, responsible for optical trapping, is given as:
𝑭𝑭𝒈𝒈𝒕𝒕𝒂𝒂𝒈𝒈 = 𝛼𝛼𝐴𝐴4𝛁𝛁⟨|𝑬𝑬|𝟐𝟐⟩ (Equation 3)
Here, αr is the real part of the polarizability and E is the electric field of the trapping laser.
Figure 2. Trap stiffness for individual Cu, CuFe2O4 and CuZnFe2O4 nanoparticles versus laser power. (A, B) Stiffness in a direction parallel (A) or perpendicular (B) to the laser’s polarization for 70 nm (black squares), 50 nm (red circles), and 25 nm (blue triangles) CuNPs as a function of laser power at the sample plane. Lines show linear fits to data. (C, D) Same for 90 nm CuFe2O4 (magenta triangles) and 90 nm CuZnFe2O4 (green diamonds) nanoparticles. Lines show linear fits to data. In
(C) and (D) the linear fits for 70 nm and 50 nm CuNPs from (A) and (B) are plotted with dashed black and red lines, respectively, to allow for easier comparison between the trapping stiffness of
solid CuNPs and Cu ferrites.
Chapter 4
146
The scattering force, Fscat, destabilizing the optical trap, includes both radiation pressure and spin curl force and is given as:
where 𝐶𝐶𝑒𝑒𝑒𝑒𝑡𝑡 is the extinction cross-section of the particle, ⟨𝐒𝐒⟩ is the time averaged Poynting vector, c is the speed of light, and ⟨𝐋𝐋s⟩ is the time averaged spin density of the
electromagnetic field, ⟨𝐋𝐋s⟩ = 𝜀𝜀04𝜔𝜔𝜔𝜔
{𝑬𝑬 × 𝑬𝑬∗}.
The extinction cross-section is a sum of the scattering and absorption cross-sections: 𝐶𝐶𝑒𝑒𝑒𝑒𝑡𝑡 = 𝐶𝐶𝑠𝑠𝑐𝑐𝑒𝑒𝑡𝑡 + 𝐶𝐶𝑒𝑒𝑎𝑎𝑠𝑠.
The particle’s complex polarizability, α = αr + iαi , is related to its absorption and scattering cross-sections:
𝐶𝐶𝑒𝑒𝑎𝑎𝑠𝑠 = 𝑘𝑘𝜀𝜀0𝛼𝛼𝜔𝜔 (Equation 5)
𝐶𝐶𝑠𝑠𝑐𝑐𝑒𝑒𝑡𝑡 = 𝑘𝑘4
6𝜋𝜋𝜀𝜀02 |𝛼𝛼|2 (Equation 6)
where k = 2πnm/λ0, is the wavenumber, nm is the refractive index of the medium, and λ0 the wavelength in vacuum.
As can be seen from Equation 3, the gradient force is proportional to the real part of the particle’s polarizability, αr, which can be found from Equations 5 and 6 if the cross sections are known. Equation 4 shows that the destabilizing scattering force is proportional to Cscat+ Cabs. In order to obtain stable 3D trapping, the gradient forces most balance or overcome the scattering force. The absorption cross section, Cabs, provides information on the amount of energy absorbed energy by the particle and is directly related to the associated temperature elevation.
To calculate 𝐶𝐶𝑠𝑠𝑐𝑐𝑒𝑒𝑡𝑡 and 𝐶𝐶𝑒𝑒𝑎𝑎𝑠𝑠 for the massive CuNPs, we used finite element modeling (FEM) implemented in COMSOL software to solve the scattering problem in the frequency domain by numerically solving Maxwell’s equations within a discretized space. This procedure has previously been employed to calculate optical properties of metallic nanoparticles and has been shown to provide results reproducing direct experimental measurements.20-21 We used tetrahedral meshes with a mesh size of 1/10 of the particle diameter. This is much below the threshold where further minimizing the mesh size does not change the results. By FEM we found the electric field, E, satisfying the boundary condition:
𝛁𝛁 × 𝜇𝜇𝑟𝑟−1(𝛁𝛁 × 𝑬𝑬) − 𝑘𝑘02 �𝜀𝜀𝑟𝑟 − 𝑖𝑖 𝜎𝜎𝜔𝜔𝜀𝜀0
�𝑬𝑬 = 0 (Equation 7)
Chapter 4
147
Here, 𝑬𝑬 = 𝑬𝑬𝜔𝜔𝑖𝑖𝑐𝑐 + 𝑬𝑬𝑠𝑠𝑐𝑐𝑒𝑒𝑡𝑡, a sum of the incoming and scattered electric fields. 𝜇𝜇𝑟𝑟 and 𝜀𝜀𝑟𝑟 are the frequency dependent relative permeability and permittivities, respectively, 𝜔𝜔 is
angular frequency, 𝜎𝜎 is conductivity and 𝑘𝑘02 = 𝜔𝜔2
𝑐𝑐2 . All optical constants and wavelength
dependent Cu permittivities were deduced from fitting the Brendel-Bormann model to data.22, 23 For CuO, the wavelength dependent permittivities were provided by Nanocomposix, Czech Republic.
From knowledge of E the absorption and scattering cross-sections can be calculated15:
scat) is the scattered Poynting vector along the normal
vector, n, in the outwards direction from the scatterer’s surface that delimits the integral.
The power loss density, q, is given by 𝑞𝑞 = 12𝑆𝑆𝑅𝑅( 𝐽𝐽 ∙ 𝐸𝐸∗), where 𝐽𝐽 = σ 𝐸𝐸 is the current
density within the nanoparticle. Complex conjugates are denoted with an asterisk.
The calculated optical cross sections, Cabs and Cscat, are shown in Figure 3A-C as a function of wavelength both for massive CuNPs and for fully oxidized CuNPs, CuONPs, of different sizes. For all wavelengths, both absorption and scattering cross sections are significantly higher for pure CuNPs than for CuONPs. Exact values for 𝐶𝐶𝑠𝑠𝑐𝑐𝑒𝑒𝑡𝑡 and 𝐶𝐶𝑒𝑒𝑎𝑎𝑠𝑠 at the optical trapping wavelength, 1064 nm, are given in Supporting Table S2.
The real and imaginary parts of the polarizability of CuNPs and CuONPs are shown in Figure 3D-F. From Equation 3 it is clear that αr > 0 is a necessary condition for stable optical trapping. Hence, both CuNPs and CuONPs should be trappable within the whole wavelength window theoretically investigated, however, with CuNPs trapping more strongly than CuONPs, as experimentally observed for 1064 nm (Figure 2). Values for αr and αi at λ =1064 nm are provided in supporting Table S2.
As the gradient force, responsible for optical trapping, is directly proportional to αr (see Equation 3), we used the ratios of αr and of κ for different particle types to compare the calculated expectations for trapping strength to the measured values. This is not a perfect comparison as the scattering force will also contribute to the total force.
However, in this regime the gradient force will dominate the scattering force, and we therefore we calculated the polarizability ratios αr,Cu1/αr,Cu2 and compared these to the corresponding ratios of the measured trap stiffnesses, κCu1/κCu2.
Chapter 4
148
Figure 3. Absorption (red) and scattering (blue) cross-sections as a function of wavelength calculated by FEM for (A) 25 nm, (B) 50 nm, (C) 70 nm CuNPs (solid lines) and CuONPs (dashed
lines). Real (blue) and imaginary (red) parts of polarizability versus wavelength for, (D) 25 nm, (E) 50 nm, (F) 70 nm CuNPs (solid lines) and CuONPs (dashed lines). Semi-log scales were employed
to magnify the behaviour in the NIR region.
These ratios, given in Table 1, demonstrate a good agreement between predicted increase of trapping stiffness as a function of particle size for massive CuNPs and the experimental findings.
3.4 Effect of oxidized shell on optical properties of CuNPs.
To further explore the effects of the oxidization, we performed FEM calculations of CuNPs with an oxidized shell of varying thickness. When Cu oxidizes, it swells, hence, in our simulations, we assumed that half the CuO shell thickness is taken from the CuNP due to the oxidation and the other half is caused by swelling of the oxide layer. For example, in Figure 4A, we consider a CuNP which originally had d=70 nm; 1 nm of this particle oxidizes, which causes an additional swelling of 1 nm, hence, the total thickness of the oxidized shell is 2 nm. Hence, the Cu core has d=68 nm and the overall diameter of the particle including the oxidized shell is 72 nm. FEM results for three different core-shell sizes of Cu-CuxO NPs are presented in Figure 4. It is clear that core-shell NPs with thin CuO shells have optical cross-sections and polarizabilities of similar magnitudes as CuNPs of same size (Figure 3). Thicker CuO layers lead to a significant change of optical properties.
Experimentally we have seen no evidence in the TEM images (as, e.g., shown in Figure 1 A-E) of a swelled oxidized shell. Hence, if such an oxidized shell is present, it is either rather thin or invisible in the TEM images. To further experimentally explore the
Chapter 4
149
possible presence of an oxidized shell on our trapped CuNPs we compared the measured optical trapping strengths to the theoretical predictions for CuNPs with varying degree of oxidation in the following manner: As the gradient force, responsible for optical trapping, is directly proportional to αr (cf. Equation 3), trapping will not be possible at wavelengths where αr is very small or negative. Figure 4F illustrates such a scenario: for a shell thickness of 10 nm, αr is negative around λ=600 nm and such particles are hence not likely to be trappable at 600 nm. Also, we note that polarizability αr, for pure CuNPs, is more than twice that of a fully oxidized NP (Table S2) and hence the effect of oxidation could significantly affect the trapping of the NPs. As the ratios of the calculated polarizabilities for massive and pure CuNPs compared well to the ratios of the experimentally determined trap stiffnesses (Table 1), it is likely that the oxide layer thickness, if present under our experimental conditions during optical trapping, was at most a few nanometers thick and did not change much the optical properties of the CuNPs. The potentially altered optical trapping properties of CuNPs as a function of their spontaneous passivation imply that the degree of oxidation of CuNPs could, in principle, be explored by trapping CuNPs with specific wavelengths. For instance, one could choose laser lines in the interval 600-700 nm where αr changes significantly as with the thickness of the surface oxide layer. As the ratios of the calculated polarizabilities for massive and pure CuNPs compared well to the ratios of the experimentally determined trap stiffnesses (Table 1), it is likely that the oxide layer thickness, if present under our experimental conditions during optical trapping, was at most a few nanometers thick and did not change much the optical properties of the CuNPs.
Table 1. Comparison of experimentally obtained trap stiffness ratios and the corresponding theoretically calculated ratios of the real part of the particles’ polarizability, αr, for different solid CuNPs. The gradient force, responsible for optical trapping, is directly proportional to αr, therefore, the ratios of κ and αr for different particle sizes are expected to be similar.
κy ratio κy ratio values 𝛼𝛼𝑟𝑟 ratio 𝛼𝛼𝑟𝑟 ratio values
Absorption of the laser light by the CuNPs will lead to heating of the particles with the temperature increase of the particle being proportional to Cabs and laser intensity.28
Chapter 4
150
Figure 4. Absorption cross sections and polarization for CuNPs with an oxidized shell of varying thickness calculated by FEM. (A-C) Absorption (red), scattering (blue) cross-sections for CuNPs
with an oxidized shell as a function of wavelength. The semi-log scales were employed to magnify the behaviour in the NIR region. (D-F) Real (blue) and imaginary (red) parts of polarizability versus wavelength. (A,D) Cu core: d=68 nm, oxidized shell: t=2 nm, (B,E) Cu core; d=65 nm, oxidized shell:
This will naturally lead to an increase in temperature of the media surrounding the particle which affects the viscosity of the medium and hence the motion of the particle. This phenomenon is known as Hot Brownian motion29, 30 and has implications for the dynamics of the particle and, hence, for its optical trapping properties.
To estimate the temperature increase of an optically trapped CuNP we use FEM to theoretically predict its plasmonic heating in the laser trap. The temperature of an optically trapped plasmonic nanoparticle equilibrates within nanoseconds21, hence, at the timescales here considered, the temperature can be assumed constant across the particle and decays with distance to the particle’s surface, r, as28, 31
∆𝑻𝑻(𝒕𝒕) = 𝑪𝑪𝒂𝒂𝒂𝒂𝒂𝒂 𝑰𝑰𝟒𝟒𝟒𝟒𝑲𝑲𝒕𝒕
𝒕𝒕 > 𝑹𝑹 (Equation 10)
where I is the trapping laser intensity, R is the radius of nanoparticle, and K is the thermal conductivity of surrounding medium (water). To find Cabs for each particle type we used FEM as described in a preceding section. Figure 5A shows the temperature profiles for three different sizes of optically trapped CuNPs calculated via Equation 5; for these calculations a constant laser power of 270 mW is used because this is the highest laser
Chapter 4
151
power used in the optical trapping experiments for all particle types (as shown in Figure 2). Also, the temperature profile for a CuNP with an oxidized shell (core: dCu=60 nm, shell: tCuO=10 nm) is presented (orange line in Figure 5A-B).
The larger the particle, the higher its temperature. Equation 10 predicts a linear relation between temperature increment and laser power, this is shown in Figure 5B for the same NPs as shown in Figure 5A. Interestingly, the particle with an oxidized shell (orange lines in Figure 5A-B, core=60 nm, shell: t=10 nm) has a temperature that is higher than a similarly sized massive CuNP (80 nm, grey).
Figure 5. Theoretical calculation of plasmonic heating of trapped solid CuNPs and CuNPs with an oxidized shell. (A) Temperature profile around 25 nm (blue), 50 nm (red), 70 nm (black), and 80
nm (grey) solid CuNPs, as well as for a CuNP with an oxidized shell (core: d=60 nm, shell: t=10 nm) under the same conditions as in the optical trapping experiments. (B) Temperature increase as a function of laser power for the same particles as shown in (A). (C) 2D heat profile around a CuNP with an oxidized shell (core: dCu=60 nm, shell:t=10 nm). (D) Temperature increase for CuNPs with
an oxidized shell for varying sizes of the diameter of the core and the thickness of the oxidized shell. For these calculations, λ=1064 nm and P=270 mW.
Chapter 4
152
Figure 5C shows the 2D temperature profile around an irradiated CuNP with an oxidized shell (core: dCu=60 nm, shell:t=10 nm). Interestingly, varying the volume ratio between the Cu core and the oxidized shell can give rise to several hundreds of degrees of difference in the surface temperature at constant laser power. In the calculations the particle is assumed to be located in the focus of a laser beam with a perfect Gaussian intensity profile.
This is not a realistic experimental situation; inherent spherical aberration will inevitably cause distortions of the intensity profile, distortions which are significant at the nanometer scale. Also, optically trapped metallic nanoparticles have been shown to stably trap at positions far from the focus, either below or above, depending in a non-trivial manner on the particle size, material and laser power.30 These effects will cause the laser intensity at the position of the particle to be unpredictable and probably considerably different than in the theoretical situation.
Chemical reaction rates are sensitively dependent on temperature as quantified by the Arrhenius equation. Therefore, heating of CuNPs is likely to be of crucial importance for their catalytic activity.4 In accordance with this, previous studies have demonstrated that the oxidation state of Cu can be modified by laser light.33, 34
4. Conclusions
We demonstrated stable optical trapping of individual Cu, CuFe2O4, and CuZnFe2O4
nanoparticles with diameters in the range of 25-90 nm using NIR light. We found that Cu-ferrites had a weaker interaction with the optical trap compared to CuNPs of similar sizes, which can be attributed to the ionic character of the oxides compared to the metallic character of pure Cu particles. By finite element modelling we calculated the optical properties of CuNPs and their oxidesw and showed that the presence of an oxidized shell can significantly change the optical properties of CuNPs. By tuning the ratio of the Cu core and the thickness of the oxidized shell one can obtain a situation where the real part of the polarizability becomes negative at certain wavelengths, thus rendering the particles non-trappable. Our experimental optical trapping measurements of solid CuNPs in water, however, indicated only minor to no oxidation of the surface. Due to the plasmonic nature of CuNPs, they are expected tow heat significantly in the optical trap. Our theoretical calculations show that if trapped in the focus of the laser beam, temperature increases up to hundreds of degrees Celsius are to be expected, with the exact value being crucially dependent on the particle’s size, oxidation state and position. This temperature increase is likely to affect CuNPs’ catalytic properties. Also, heating might cause ablation of an oxidation layer and restore the physicochemical properties of the pure CuNP. Hence, laser
Chapter 4
153
induced heating may allow for remote control over the particle’s chemical and catalytic properties.
Chapter 4
154
References
[1] McNamara, K. & Tofail, S. A. M. "Nanosystems: the use of nanoalloys, metallic, bimetallic, and magnetic nanoparticles in biomedical applications". Phys. Chem. Chem. Phys. 17, 27981–27995 (2015).
[2] Scholl, J. A., Koh, A. L. & Dionne, J. A. "Quantum plasmon resonances of individual metallic nanoparticles". Nature 483, 421–427 (2012).
[3] Jiang, Z., Le, N. D. B., Gupta, A. & Rotello, V. M. "Cell surface-based sensing with metallic nanoparticles". Chem. Soc. Rev. 44, 4264-4274 (2015).
[4] Baffou, G. & Quidant, R. "Nanoplasmonics for chemistry". Chem. Soc. Rev. 43, 3898 (2014).
[5] Gawande, M. B., Goswami, A., Felpin, F. X., Asefa, T., Huang, X., Silva, R., Zou, X., Zboril, R. & Varma, R. S. "Cu and Cu-Based Nanoparticles: Synthesis and Applications in Catalysis". Chem. Rev. 116, 3722–3811 (2016).
[6] Wang, C., Ling, L., Yao, Y. & Song, Q. "One-step synthesis of fluorescent smart thermo-responsive copper clusters: A potential nanothermometer in living cells". Nano Res. 8, 1975–1986 (2015).
[7] Hu, L., Yuan, Y., Zhang, L., Zhao, J., Majeed, S. & Xu, G. "Copper nanoclusters as peroxidase mimetics and their applications to H2O2 and glucose detection". Anal. Chim. Acta 762, 83–86 (2013).
[8] Wang, Y., Zhang, X., Zhao, L., Bao, T., Wen, W., Zhang, X. & Wang, S. "Integrated amplified aptasensor with in-situ precise preparation of copper nanoclusters for ultrasensitive electrochemical detection of microRNA 21". Biosens. Bioelectron. 98, 386–391 (2017).
[9] Zhang, X., Li, J., Wang, X., Wang, Y., Hang, R., Huang, X., Tang, B. & Chu, P. K. "Effects of copper nanoparticles in porous TiO2 coatings on bacterial resistance and cytocompatibility of osteoblasts and endothelial cells". Mater. Sci. Eng. C 82, 110–120 (2018).
[10] Xu, L., Liang, H.-W., Yang, Y. & Yu, S.-H. "Stability and Reactivity: Positive and Negative Aspects for Nanoparticle Processing". Chem. Rev. 118, 3209–3250 (2018).
[11] Ahamed, M., Akhtar, M. J., Alhadlaq, H. A. & Alshamsan, A. "Copper ferrite nanoparticle-induced cytotoxicity and oxidative stress in human breast cancer MCF-7 cells". Colloids Surfaces B Biointerfaces 142, 46–54 (2016).
Chapter 4
155
[12] Alzahrani, K., Niazy, A., Alswieleh, A., Wahab, R., El-Toni, A. & Alghamdi, H. "Antibacterial activity of trimetal (CuZnFe) oxide nanoparticles". Int. J. Nanomedicine 13, 77–87 (2017).
[13] Wang, A., Yang, H., Song, T., Sun, Q., Liu, H., Wang, T. & Zeng, H. "Plasmon mediated Fe–O in an octahedral site of cuprospinel by Cu NPs for photocatalytic hydrogen evolution". Nanoscale 9, 15760–15765 (2017).
[14] Ashkin, A., Dziedzic, J. M., Bjorkholm, J. E. & Chu, S. "Observation of a single-beam gradient force optical trap for dielectric particles". Opt. Lett. 11, 288 (1986).
[15] Svoboda, K. & Block, S. M. "Optical trapping of metallic Rayleigh particles". Opt. Lett. 19, 930-932 (1994).
[16] Hansen, P. M., Bhatia, V. K., Harrit, N. & Oddershede, L. "Expanding the Optical Trapping Range of Gold Nanoparticles". Nano Lett. 5, 1937–1942 (2005).
[17] Bosanac, L., Aabo, T., Bendix, P. M. & Oddershede, L. B. "Efficient optical trapping and visualization of silver nanoparticles". Nano Lett. 8, 1486–91 (2008).
[18] Samadi, A., Bendix, P. M. & Oddershede, L. B. "Optical manipulation of individual strongly absorbing platinum nanoparticles". Nanoscale 9, 18449–18455 (2017).
[19] Bendix, P. M., Reihani, S. N. & Oddershede, L. B. "Direct measurements of heating by electromagnetically trapped gold nanoparticles on supported lipid bilayers". ACS Nano 4, 2256–2262 (2010).
[20] Ma, H., Tian, P., Pello, J., Bendix, P. M. & Oddershede, L. B. "Heat generation by irradiated complex composite nanostructures". Nano Lett. 14, 612–619 (2014).
[21] Samadi, A., Klingberg, H., Jauffred, L., Kjær, A., Bendix, P. M. & Oddershede, L. B. "Platinum nanoparticles: a non-toxic, effective and thermally stable alternative plasmonic material for cancer therapy and bioengineering". Nanoscale 10, 9097–9107 (2018).
[22] Durdevic, L., Robert, H. M. L., Wattellier, B., Monneret, S. & Baffou, G. "Microscale Temperature Shaping Using Spatial Light Modulation on Gold Nanoparticles". Sci. Rep. 9, 4644 (2019).
[23] Baffou, G., Berto, P., Bermúdez Ureña, E., Quidant, R., Monneret, S., Polleux, J. & Rigneault, H. "Photoinduced Heating of Nanoparticle Arrays". ACS Nano 7, 6478–6488 (2013).
[24] Friese, M. E. J., Enger, J., Rubinsztein-Dunlop, H. & Heckenberg, N. R. "Optical angular-momentum transfer to trapped absorbing particles". Phys. Rev. A 54, 1593–1596 (1996).
Chapter 4
156
[25] Hansen, P. M., Tolić-Nørrelykke, I. M., Flyvbjerg, H. & Berg-Sørensen, K. "tweezercalib 2.0: Faster version of MatLab package for precise calibration of optical tweezers". Comput. Phys. Commun. 174, 518-520 (2006).
[26] Albaladejo, S., Marqués, M. I., Laroche, M. & Sáenz, J. J. "Scattering Forces from the Curl of the Spin Angular Momentum of a Light Field". Phys. Rev. Lett. 102, 113602 (2009).
[27] Lehmuskero, A., Johansson, P., Rubinsztein-Dunlop, H., Tong, L. & Käll, M. "Laser Trapping of Colloidal Metal Nanoparticles". ACS Nano 9, 3453–3469 (2015).
[28] Jauffred, L., Samadi, A., Klingberg, H., Bendix, P. M. & Oddershede, L. B. "Plasmonic Heating of Nanostructures". Chem. Rev. 119, 8087–8130 (2019).
[29] Rings, D., Schachoff, R., Selmke, M., Cichos, F. & Kroy, K. Hot brownian motion. Phys Rev Lett 105, 090604 (2010).
[30] Rings, D., Selmke, M., Cichos, F. & Kroy, K. Theory of Hot Brownian Motion. Soft Matter 7, 3441-3452 (2011).
[31] Goldenberg, H. & Tranter, C. J. "Heat flow in an infinite medium heated by a sphere". Br. J. Appl. Phys. (1952).
[32] Kyrsting, A., Bendix, P. M. & Oddershede, L. B. "Mapping 3D Focal Intensity Exposes the Stable Trapping Positions of Single Nanoparticles". Nano Lett. 13, 31–35 (2013).
[33] Marimuthu, A., Zhang, J. & Linic, S. "Tuning selectivity in propylene epoxidation by plasmon mediated photo-switching of Cu oxidation state". Science. 339, 1590-1593 (2013).
[34] Watanabe, K., Menzel, D., Nilius, N. & Freund, H.-J. Photochemistry on Metal Nanoparticles. Chem. Rev. 106, 4301–4320 (2006).
Chapter 4
157
5. Additional information to chapter 4
S1. Additional information
S1.1 Additional figures and tables
Figure S1. Power spectrum of signal in the lateral directions from the quadrant photodiode (QPD) in the case of an empty trap. Laser power: 240 mW. The amplitude of the signal is
several orders of magnitude smaller than when a particle is trapped (see Figure 1G) and the signal from an empty trap does not have the characteristic Lorentzian shape expected for
successful particle trapping (Figure 1G).
Chapter 4
158
Table S1: Number of individual particles, n, trapped and measured at each laser power for CuFe2O4
and CuZnFe2O4. For each particle, five measurements were made, both of fcx and fcy. All laser powers stated are at the sample plane, in accordance with Figure 2 of the main manuscript.
Cu70 8.50 x 10⁻¹⁷ 7.44 x 10⁻¹⁷ 5.33 x 10⁻³³ 9.5 x 10⁻³⁵
Cu50 2.64 x 10⁻¹⁷ 7.83 x 10⁻¹⁸ 1.73 x 10⁻³³ 2.97 x 10⁻³⁵
Cu25 2.75 x 10⁻¹⁸ 3.20 x 10⁻¹⁹ 3.50 x 10⁻³⁴ 3 x 10−36
CuO70 4.26 x 10⁻¹⁷ 1 x 10⁻¹⁷ 1.99 x 10⁻³³ 4.78 x 10⁻³⁵
CuO50 1.5 x 10⁻¹⁷ 7.5 x 10⁻¹⁹ 5.36 x 10⁻³⁴ 1.68 x 10⁻³⁵
CuO25 1.82 x 10⁻¹⁸ 7.23 x 10⁻²⁰ 1.66 x 10⁻³⁴ 2 x 10−36
CuNP with oxidized shell (core:
d=68nm, shell: t=2nm)
9.92 x 10⁻¹⁷ 8.16 x 10⁻¹⁷ 5.58 x 10⁻³³ 1.11 x 10⁻³⁴
159
Conclusions
A number of final remarks can be concluded from the research conducted in this Doctoral Thesis which are presented below in three main blocks.
A) Instrument-related conclusions:
• The built OC-OT-LIBS platform was modified to allow straightforward integration of different optics and complementary detection lines. A quick and robust procedure for system alignment was developed based on the iCCD observation line to verify that each of the different parts of the instrument were focused the particle spot, which served as the (0, 0, 0) coordinate for the system. Therefore the versatility linked to LIBS when used for in-bulk applications was preserved.
• A sampling scheme based on 3D printed skimmer-like cones improved analytical performance of the OC-OT-LIBS instruments by reducing the time required for a complete analysis and increasing both, the trapping and the sampling efficiency of individual particles, thus resulting in a twofold increment of the technique’s throughput.
B) Optical trapping-related conclusions:
• The system described herein has been proved capable of stably trapping in air and at a large distance from the sample support the different samples used over the described experiments despite trapping forces being orders of magnitude lower per diameter unit when compared to OT in water. This was demonstrated by theoretical simulations comparing unrestricted Brownian motion of the particles in air at different temperatures to position fluctuations when a laser beam exerting the experimentally estimated optical forces upon the same particles and at the same temperatures to account for viscosity changes in the medium.
Conclusions
160
C) LIBS-related conclusions:
• In combination with Optical Catapulting and Optical Trapping, Laser- Induced Breakdown Spectroscopy is a suitable nanoinspection tool with single particle resolution. Individual particles of diameters ranging from 2 µm graphite spheres to 25 nm Cu nanoparticles were consistently detected with sampling rates as high as 100% for the larger particles.
• A straightforward data sorting method was developed to set the boundaries within which a LIBS event could be attributed to a single particle. Through this tool, linear correlation between particle size and particle mass for monoelemental Cu particles was established, thus validating the method. As a consequence, direct detection of individual particles featuring masses in the attogram regime was demonstrated.
• Multielemental detection in isolated nanomatrices was demonstrated. Ferrites featuring up to three different metals were interrogated with full composition appearing in all acquired spectra.
• Absolute limits of detection as low as 575 ag for Fe, 304 ag for Zn and 37 ag for Cu were set following the results of the experiments. These values are unprecedented in optical emission spectroscopy.
D) Excitation mechanisms and efficiency related conclusions:
• Surrounding air plasma formed alongside particle plasma was found to be the main responsible for both particle atomization and excitation.
• Inverse proportionality between excitation efficiency (measured as photons produced per gram of sample) and particle size was found. This observation serves as a proof of the role played by the air plasma. At constant pulse energy the fraction of heat required to fully dissociate a particle is larger for bigger particles, in turn reducing the fraction that can be devoted to atom excitation.
• For lines belonging to different elements present within the same particle, inverse exponential relation was observed between photon yield and upper level energy of the transits. This implies that low lying lines are preferentially populated as the atoms are excited into emissive states and is in agreement with the rate-limited mechanism proposed for particle dissociation and excitation.