International Journal of Food Microbiology 189 (2014) 89–97
Contents lists available at ScienceDirect
International Journal of Food Microbiology
j ourna l homepage: www.e lsev ie r .com/ locate / i j foodmicro
Development of a rapid capture-cum-detection method for Escherichiacoli O157 from apple juice comprising nano-immunomagneticseparation in tandem with surface enhanced Raman scattering
Roya Najafi b,1, Shubhasish Mukherjee c,2, Jim Hudson Jr. c, Anup Sharma d, Pratik Banerjee a,b,⁎a Division of Epidemiology, Biostatistics, and Environmental Health, School of Public Health, The University of Memphis, Memphis, TN 38152, USAb Laboratory of Food Microbiology and Immunochemistry, Department of Food & Animal Sciences, Alabama A&M University, Huntsville, AL 35762, USAc HudsonAlpha Institute for Biotechnology, Huntsville, AL 35806, USAd Department of Physics, Alabama A&M University, Huntsville, AL 35762, USA
⁎ Corresponding author at: Division of Epidemiology, BHealth, School of Public Health, The University of MemphTN 38152, USA. Tel.: +1 901 678 4443.
A combined capture and detection method comprising of nano-immunomagnetic separation (NIMS) andsurface enhanced Raman spectroscopy (SERS) was developed to detect Escherichia coli O157 from liquidmedia including apple juice. The capture antibodies (cAbs) were immobilized on magnetite–gold (Fe3O4/Au) magnetic nanoparticles (MNPs) which were used for separation and concentration of the E. coli O157cells from model liquid food matrix. The capture efficiency (CE) for E. coli O157 using MNP was found tobe approximately 84–94%. No cross reactivity was observed with background non-target organisms.There was a significant difference in the mean CE of bacteria captured by MNP and commercially sourcedimmunomagnetic microbeads (p b 0.05). For the detection of target pathogen, SERS labels were prepared by con-jugating gold nanoparticles with Raman reporter molecules and the detector antibody (dAb). Au-Raman label-dAb was interacted with gold coated MNP-cAb-E. coli O157 complex. The ability of this immunoassay to detectE. coli O157 in apple juice was investigated. We have successfully applied the synthesized Fe3O4/Au nanoclustersto E. coli O157 detection in apple juice using the SERS method. The lowest detectable bacterial cell concentrationin apple juice was 102 CFU/mL with a total analysis time of less than an hour. This method presents a convenientway of preconcentration, separation, and detection of low levels of target pathogen from liquid food matrix.
Food safety is a major public health concern worldwide. According tothe Centers for Disease Control and Prevention (CDC, USA), foodbornepathogens cause 9.4 million illnesses, 55,961 hospitalization and 1351deaths annually in the United States (Scallan et al., 2011). Rapid and sen-sitive detection of pathogens in food products is a critical step in the foodproduction chain to ensure food safety. Conventional detection and iden-tification strategies for microbial pathogens include bacterial colonycounting methods, immunology-based methods involving antigen/antibody interactions, and the polymerase chain reaction (PCR) involvingnucleic acid analysis. These methods are sensitive, inexpensive and cangive both qualitative and quantitative information of the target microor-ganisms, but they are time consuming, labor intensive, andmost of these
iostatistics, and Environmentalis, 338 Robison Hall, Memphis,
.e, Alabama 35811, USA.labama 35007, USA.
methods need initial enrichment for detection of pathogens (Velusamyet al., 2010). Given the perishable nature of most food items, a quick mi-crobial test result will minimize product hold-time at the production fa-cility enabling maximum utilization of the shelf-life of the product,which is a desirable aspect from food producers' point of view. Thus,rapid, sensitive, selective bacterial isolation and detection methods forfood products are critically needed to ensure safety of food products(Bhunia, 2008; Mandal et al., 2011). For microbiological analysis of foodmaterials, sample preparation is often themost critical step. Sample prep-aration involves multiple time-consuming steps such as stomaching, fil-tration and centrifugation in order to lower the so-called “food matrixeffect” on the capture of bacteria (Bhunia, 2008). Furthermore, one ofthe challenges in detection of pathogens is that the number of targetpathogensmay be very low (10 to 1000 bacterial cells) in a given sample.So, there is a need for an efficient pathogen separation and concentrationmethod to detect them successfully, and to avoid false-negative results.Immunomagnetic separation (IMS), an antibody-based method, is awidely used, sensitive, and simple sample preparation and concentrationtechnique that has been successfully applied for isolation of pathogensfrom the food matrix (Bhunia, 2008; Dwivedi and Jaykus, 2011; Xiong
90 R. Najafi et al. / International Journal of Food Microbiology 189 (2014) 89–97
et al., 2014). This separation method eliminates multiple sample prepa-ration steps such as, filtration or centrifugation, and can be applieddirectly to capture the target organisms from a complexmatrix. In tradi-tional IMS, paramagnetic metallic or polystyrene microbeads of varyingdiameters (~1–3 μm, referred as “MMB” hereafter) coatedwith organismspecific antibodies are utilized to immunomagnetically capture bacterialcells from food samples, which are subsequently enumerated and identi-fied by agar plating based methods, or by a follow-up analytical method,such as PCR or ELISA (IMS-PCR or IMS-ELISA) (Bhunia, 2008; Tu et al.,2009). Despite the advantages of this method, limitations such as non-specific adsorption of non-target organisms on the immunomagneticmicrobeads, poor limit of detection, post-IMS detection/identificationtime and costs attributed to relatively high reagent volumes are someof the major drawbacks that preclude widespread application of IMSmethods in food microbiology (Liberti et al., 1996; Tomoyasu, 1998;Varshney et al., 2005). For improvement of IMS methods to counteractsome of the problems mentioned above, magnetic nanoparticles(MNPs) have been used for target analyte capture (Gilmartin andO'kennedy, 2012; Perez-Lopez and Merkoci, 2011; Wang H. et al.,2011; Wang Y. et al., 2011). Nanoparticles with higher surface/volumeratio as compared to commonly used MMB present more contactsurface area for attaching to the target molecules such as bacterialcells. Also the reaction kinetics of magnetic nanoparticles is faster thanMMBs (Liberti et al., 1996; Varshney et al., 2005). The performance ofthe assay can be improved by using nanoparticles (Nps) as labels ortransducers in a single assay (Guven et al., 2011; Naja et al., 2007;Penn et al., 2003; Temur et al., 2010; Wang H. et al., 2011; Wang Y.et al., 2011; Xu et al., 2005). Optical sensing methods such as surfaceenhanced Raman spectroscopy (SERS) are emerging and promisingtechniques for the detection of foodborne pathogens because oftheir sensitivity as well as the simplicity of interpreting the generat-ed data (Bantz et al., 2011; Bhunia, 2008; Dutta et al., 2009). Uniquephysicochemical properties of noble metal Nps provide opticalbiosensing methods with a wide range of potential applicationssuch as multiplexing or label free detection. Some other specific ad-vantages include reducing reagent volumes and detection time, of-fering high sensitivity, lower cost, and eliminating the need forskilled personnel (Perez-Lopez and Merkoci, 2011). Gold (Au) Nps cansignificantly amplify the Raman scattering efficiencies of adsorbedmolecules due to their unique optical properties (Zhou et al.,2010). SERS strongly increases Raman signals from the moleculesattached to nanometer-sized metallic structures (Campion andKambhampati, 1998; Haynes et al., 2005). Due to the high Ramansignal enhancement, SERS allows for the acquisition of amplifiedspectra from single bacterial cells in seconds, even without theneed for labeling or sample amplification (Premasiri et al., 2005).In foodmicrobiological applications, IMS employing noble metal coatedMNP followed by SERS based detection can significantly reduce theover-all assay time, as it does not require any plating of captured bacte-rial cells, and the post-IMS detection by this method takes less timethan IMS-PCR or IMS-ELISA (Chu et al., 2008; Guven et al., 2011;Wang H. et al., 2011; Wang Y. et al., 2011).
In this paper, we report the development of a combined captureand detection approach for Escherichia coli O157 assay utilizingnano-immunomagnetic separation (NIMS) and SERS. For captureand separation of the target microorganisms, magnetic iron Nps(‘core’) were coated with gold Nps (‘shell’) and capture antibodiesin one nanocomposite. These nanocomposites were utilized in theseparation and concentration of the target cells from samples. Subse-quently, the detector antibodies and Raman reporter molecules con-jugated on gold Nps were used for a rapid SERS based detection andenumeration of the captured cells. The assay performance of the newlydeveloped NIMS was evaluated in terms of sensitivity, selectivity, re-agent utilization, and assay time. The assay validation was done usingartificially E. coli O157:H7 spiked apple juice as model food-pathogencombination.
2. Materials and methods
2.1. Reagents and materials
All the chemical and analytical reagents used in this study wereobtained from Sigma-Aldrich (St. Louis, MO), if not mentioned other-wise. Purified mouse anti-E. coli O157 monoclonal antibody (clone 9/140.156.152.11) was obtained from EMD Millipore (Billerica, MA).DynabeadsMAX E. coliO157 and Dynalmagnet for magnetic separationwere purchased from Life Technologies (Carlsbad, CA). Malachite greenisothiocyanate (MGITC) was obtained from Fisher Scientific (Pittsburg,PA). Ultrapure water was used throughout the work.
2.2. Bacterial cultures
Bacterial cultures (target bacteria: E. coli O157:H7 EDL933, ATCC43895; and the other non-O157 bacteria: Listeria monocytogenes ScottA, Bacillus cereus A926, Enterococcus faecalis 102StE3, Staphylococcusepidermidis 101StE1,Micrococcus luteus 4698, and Streptococcus mutans[“Gram-positive group”]; and Citrobacter freundii, Enterobacter cloacae,Escherichia vulneris 301ECD32, Hafnia alvei, Klebsiella oxytoca 503ECE45,Pseudomonas aeruginosa ATCC 10145, and Salmonella Enteritidis 13096[“Gram-negative group”]) were subcultured twice from−80 °C frozenstocks in brain–heart infusion (BHI) broth (Difco Laboratories) at 37 °C.For routine experiments, one hundred microliters of the bacterial cul-ture was added to 10 mL of BHI broth and incubated overnight at37 °C. Fresh overnight grown cultures (1 mL each) were centrifuged(13,000 ×g for 10 min) at room temperature, and the cell pellets werewashed twice in filter (pore size of 0.45 μm) sterilized PBS.
2.3. Synthesis of gold-coated magnetic nanoclusters
The iron oxide/gold (Fe3O4/Au) nanoclusters were prepared by syn-thesizing iron oxide Nps (the core) by oxidizing Fe(OH)2 to Fe3O4 nano-particles with PEI on the surface according to the method describedearlier (Sugimoto and Matijevic, 1980). The 2 nm colloidal gold nano-particles were synthesized by using a method described earlier (Janaet al., 2001). These iron oxide Nps and the gold seed colloids were uti-lized in the synthesis of the ‘core–shell’ iron oxide/gold (Fe3O4/Au)nanoclusters following the procedure outlined by Goon et al. (2009)with some modifications. Briefly, gold seed colloidal solution (94 mL)was stirred with 1.09 mL of Fe3O4 Nps (20 nm) for 1.5 h. Then theFe3O4/Au seed particles were mixed with 80 mL of PEI (0.5 mM) andheated at 60 °C for 3 h. This step was followed by rinsing the solutionthree times with water and removing dissociated Au seeds throughmagnetic separation. The resulting nanoparticles were dispersed inultrapurewater. Finally, themagnetic particle/Au seed aqueous solutionwas stirred with NaOH aqueous solution (110 mL, 0.01 M), and subse-quently, NH2OH ∙HCl and HAuCl4 were added for five iterations. For thefirst iteration, 0.75 mL of NH2OH ∙HCl (0.2 M) and 0.5 mL of HAuCl4(25.4 mM) were added and mixed for 10 min. Then, for the second,third, fourth and fifth iterations, 0.5 mL of NH2OH ∙HCl and 0.25 mL ofHAuCl4 were added resulting in the formation of Fe3O4/Au nanoclusters.
2.4. Synthesis of antibody-conjugated Fe3O4/Au nanocluster (MNP-cAb)and Raman nanoprobes (RNP-dAb)
The conjugation of capture antibody on Fe3O4/Au nanoclusters wasdone by amethod described earlier by Zhou et al. (2010). The concentra-tion of the capture antibody used for the conjugation was 1.15 mg/mL.The obtained antibody conjugated nanocluster was resuspended inPBS and kept at 4 °C. For the synthesis of Raman nanoprobes (RNP-dAbs) containing malachite green isothiocyanate (MGITC) as Ramanlabels and the detector antibody we followed a method described byQian et al. (2008). The antibody concentration on the SERS nanoprobeswas quantified using a NanoDrop spectrophotometer.
91R. Najafi et al. / International Journal of Food Microbiology 189 (2014) 89–97
2.5. Characterization of synthesized nanoparticles
Electron microscopy was used to characterize different nanoparti-cles synthesized in this study. For scanning electron microscopy(SEM), nanoparticle samples were placed on the SEM holder. The sam-ple was dried and sputter coated with a thin layer of gold. SEM imageswere obtained by using a JOEL JSM 6335F scanning electronmicroscope(JOEL, Tokyo, Japan) at an accelerating voltage of 25 keV, in thehigh vac-uum/secondary electron imaging mode of operation. Using the energydispersive spectrometer (EDS) feature of the SEM instrument, the ele-mental analysis of the samples was performed to evaluate the extentof gold-coating on the iron MNPs. For EDS analyses, samples were notsputter coated with gold. For transmission electron microscopy (TEM),approximately 10 μL of nanoparticle solution was directly onto a TEMgrid. The samples on the grid were then allowed to air dry for 10 min.TEMmicrographswere obtained using a JEM1200EX (JEOL)with an ac-celerating voltage of 100 keV.
2.6. Capture efficiency (CE) and the specificity of antibody-conjugatednanocluster
In order to determine the capture efficiency of MNP-cAb, overnightgrown E. coli O157 cells were prepared in BHI. Then, MNP-cAb wasmixed with various concentrations of E. coli (101–108 CFU/mL) and in-cubated for 25min at room temperature (~23 °C) in a shaker incubator.We used two different reaction volumes, 5 μL of the MNP to 250 μL ofbacteria, and 20 μL of the MNP to 1 mL of bacteria. Next, the MNP-cAbs (with potentially captured bacteria) were separated magneticallyusing an external magnetic particle concentrator (MPC, DynaMag; LifeTechnologies, Carlsbad, CA). The magnetically separated MNP-cAbswere washed in PBST three times, and then resuspended again in PBS.This was immediately followed by plating of bacteria captured MNP-cAbs on sorbitol–MacConkey agar supplemented with cefixime–tellu-rite (CT) supplement (CT-SMAC; BBL/Difco, Sparks, MD). The plateswere incubated in amicrobiological incubator (Labline, Fisher Scientific,Pittsburg, PA) for 18–24 h at 37 °C in order to enumerate bacteria. TheCE was calculated according to a method described earlier (Perez andMascini, 1998) utilizing the following equation:
CE% ¼ Cb
Co� 100
where Co is the total number of cells in the sample (CFU/mL), and Cb isthe number of bound cells (CFU/mL).We compared the CE of theMNP-cAbwithDynabeadsMAXMMB(Life Technologies, Carlsbad, CA).Whileperforming IMS using MMBs, in one set of experiments, we followedmanufacturer's recommended protocol using 20 μL of MMB per 1 mLof E. coli O157:H7 suspensions. In another set, we used 5 μL of theMMB with 250 μL of E. coli suspension (to replicate MNP-cAb mediatedIMS, described above).
The specificity of theMNP-cAb was evaluated by testing with a mix-ture of Gram-positive and Gram-negative non-O157 bacteria followinga method described earlier (Banerjee and Bhunia, 2010) with somemodifications. Briefly, the MNP-cAb was added to a mixture of non-O157 bacteria containing “Gram-positive group” and “Gram-negativegroup” (described in Section 2.2) where the final concentration ofeach of the cultures in the non-O157 bacteria mix was 1 × 10⁶ CFU/mL. Following NIMS and washing (3 times), MNP-cAbs were plated onBHI agar. For CE enumeration in the presence of non-target flora,varying concentrations of E. coli O157:H7 (1 × 10⁵–1 × 101 CFU/mL,final concentrations) were separately added to non-O157 bacteria mix(described above). Following NIMS and washing, selective plating(CT-SMAC) was done to enumerate the captured bacteria. The CE wascalculated as above.
2.7. Immunoassay procedure
The immunoassay was based on a sandwich-type immunoassay.Fig. S1 (in the Supplementary information) is a schematic depiction ofthe immunoassay using MNP-cAb mediated NIMS followed by SERSbased detection using Raman nanoprobes (RNP-dAbs). First,immunomagnetic separation and washing of nano-aggregate of MNP-cAb were performed as described in the previous section. Then, RNP-dAbs were added to the MNP-cAb nano-aggregate and incubated for25 min at room temperature (~23 °C). The composite was again sub-jected to magnetic separation, and then the aggregate (RNP-dAbsbound to MNP-cAbs through E. coli O 157:H7) was washed threetimes (Zhou et al., 2010). After the final washing, the sample was resus-pended in PBS for SERS measurement.
2.8. SERS measurement
SERS experiments were performed using the portable EnwaveOptronics EZ Raman I system (Enwave Optronics, Inc., Irvine, CA)which houses a frequency stabilized diode laser with an excitationwavelength of 785 nm and a power of 40 mW. The system uses a fiberoptic probe with a 7 mm focal point, a 100 μm diameter, and a 0.3 nu-merical aperture. This probe transmits the Raman signal to a spectro-photometer equipped with a thermoelectrically cooled (−50 °C) CCDdetector. After placing the sample on the glass slide, the laser beamwas placed orthogonal to the sample surface area, and spectra were re-corded in the spectral range (Raman shift) of 250 cm−1 to 2350 cm−1.The acquisition time for each recorded spectrum was 60 s. For the in-strument control and initial acquisition of spectral data, the in-builtRamanReader data collection software (including TimeChart andTimeTrend functions) (Enwave Optronics) was utilized. The raw spec-tral data was exported to Microsoft Excel for plotting and reporting.
2.9. Validation studies in apple juice
Pasteurized apple juice purchased froma local storewas used direct-ly at room temperature (∼23 °C). E. coli O157:H7 prepared in differentconcentrations (101–108 CFU/mL) as stated above was added to ali-quots of apple juice in microfuge tubes. After thoroughly mixing theMNP-cAbs for 25 min at room temperature by slowly rotating themicrofuge tubes, NIMS was carried out. The samples were washedthrice with PBST to remove any non-specific bindings and were re-dispensed in 0.5 mL of PBS. Next, 0.1 mL of these samples was usedfor a SERS analysis and was also plated on CT-SMAC.
2.10. Statistical analysis
Experiments were performed in duplicates. The average values(three independent experiments) and standard error of means (Std.E.M.) were determined for CFU/mL values (as obtained by MNP-basedcapture and MMB-based capture). The data analysis was done byperformingANOVA (SAS, version 9.4, Cary, NC., USA) and to find out dif-ferences in CE values among different volumes of MNP orMMB, Tukey'stest was performed on a completely randomized design. The limit forstatistical significance was set at p b 0.05.
3. Results and discussion
3.1. Characterization of gold-coated iron nanoclusters and SERS nanoprobes
Scanning electron microscopy (SEM) and transmission electronmicroscopy (TEM) were employed to examine the morphology andintrinsic structure of the synthesized Fe3O4/Au nanoclusters. The visual-ization of the structural property (i.e., the shape) is critical to ensure thesuccess of synthesis process. The shape of the Nps is reported to be animportant parameter for improved SERS signals (Tamer et al., 2011).
92 R. Najafi et al. / International Journal of Food Microbiology 189 (2014) 89–97
Fig. 1a and b shows the SEMand TEMof the synthesized Fe3O4 nanopar-ticles, respectively. It is evident that the Fe3O4 nanoparticles have a cu-boid shape. Fig. 1c and d shows the SEM and TEM of the Fe3O4/Aunanocluster. After coating the Fe3O4 nanoparticles with gold seeds, arough gold nanoshell was formed. Gold nanoparticles (indicated by“➙”) can be seen on the surface of the iron nanoparticles (core) inFig. 1d. TEM and SEM results of both Fe3O4 nanoparticles and theFe3O4/Au nanoclusters showed the difference in the morphology andstructure of Fe3O4 nanoparticles after being coated with gold seeds.The results showed that a single Fe3O4 nanoparticle has a cuboid mor-phology with smooth surfaces. After the nanoparticles were coatedwith gold seeds, the TEM images revealed that many small gold nano-particles had attached to the surface of PEI-coated Fe3O4 and produceda rough surface. The TEM image also revealed that gold nanoparticleswere only on the surface of the Fe3O4 nanoparticles; this was based onthe fact that PEI was coated homogeneously on the Fe3O4 surfaces,and Au was easily deposited onto those surfaces. The energy dispersiveX-ray spectroscopy (EDS) results also verified gold coating on the ironnanoparticles (data not shown). Our nanoparticle characterization re-sults were in agreement with the previous research done by Zhouet al. (2010), where the uniform distribution of gold on Fe3O4 nanopar-ticles was attributed to the homogenous attachment and growth of Auseeds onto the nanoparticles. It is also well documented that cuboidgold nanoparticles exhibited significantly stronger SERS response ascompared to spherical-shaped gold nanoparticles (Gou and Murphy,2005; Narayanan et al., 2008; Tamer et al., 2011).
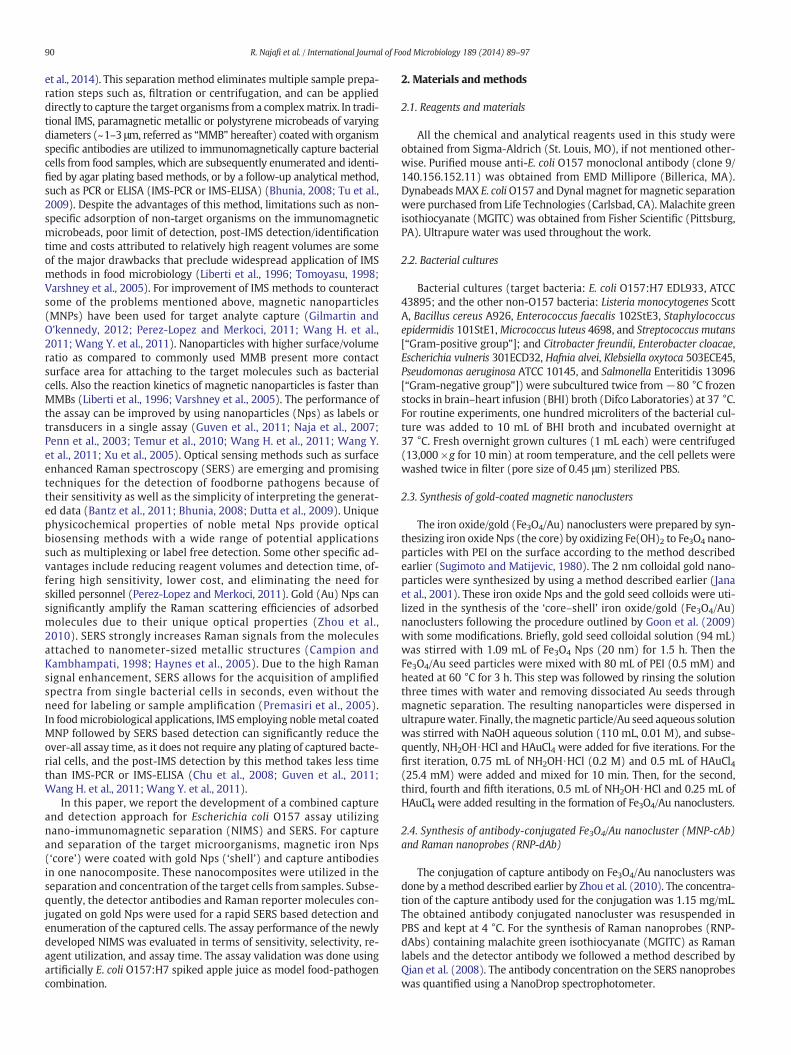
In order to prepare SERS nanoprobes, gold nanoparticles with thesize of 60 nm were functionalized with Raman dye and antibody. Goldnanoparticles with the size of 60–80 nm have shown more efficiencyfor SERS at red (630–650 nm) and near-infrared (780 nm) excitationsas reported previously (Krug et al., 1999). Hence in the present studywe used 60 nm gold nanoparticles at a 780 nm excitation. In order toensure that the gold nanoparticles are covered with dye (MGITC),Raman spectroscopy (SERS) was performed. Fig. 2 shows the Ramansignal of MGITC and SERS nanoprobes composed of gold nanoparticlesthatwere coatedwithMGITC and an antibody. The presence of antibodyon the surface of gold nanoparticles was examined using a NanoDropspectrophotometer. The concentration of antibody in the gold nanopar-ticles and SERS nanoprobes measured at 280 nm was 1.06 mg/mL,which is almost the same as the concentration of antibody used for con-jugation (1.15 mg/mL). Based on the NanoDrop results, modification ofthe Au nanoparticles with antibody was successful. It is also apparent in
Fig. 1. SEM and TEM images showing surface geometry of nanoparticles. The top two panels shGold nanoparticles coated on Fe3O4 nanoparticles are shown by “➙”.
Fig. 2 that the peak intensities of the pure MGITC (spectra a) at regionsof 1180, 1370, and 1620 cm−1 are enhanced (spectra b) using SERSnanoprobes. This characteristic signal enhancement is attributed tothe presence of gold as a SERS substrate, which is in agreement withpreviously reported findings (Neng et al., 2010; Pettinger et al., 2004,2005). The differences in the two spectra can be attributed to theRaman intensities of two different entities represented in Fig. 2,MGITC only (spectra a) and MGITC + Au + dAb (spectra b). The pres-ence of additional moieties (dAb) seems to cause minor alteration ofthe spectral character of spectra b as compared to spectra a in somespectral regions. For example, appearance of a peak in the 530 cm−1 re-gion in spectra b can be attributed to S–S structure. Similarly differentpeaks are related to different species, such as 725 cm−1 (adenine) and1230 cm−1 (amide III), as reported previously (Huang et al., 2010; Luet al., 2011; Maquelin et al., 2002).
3.2. CE of the MNP-cAbs
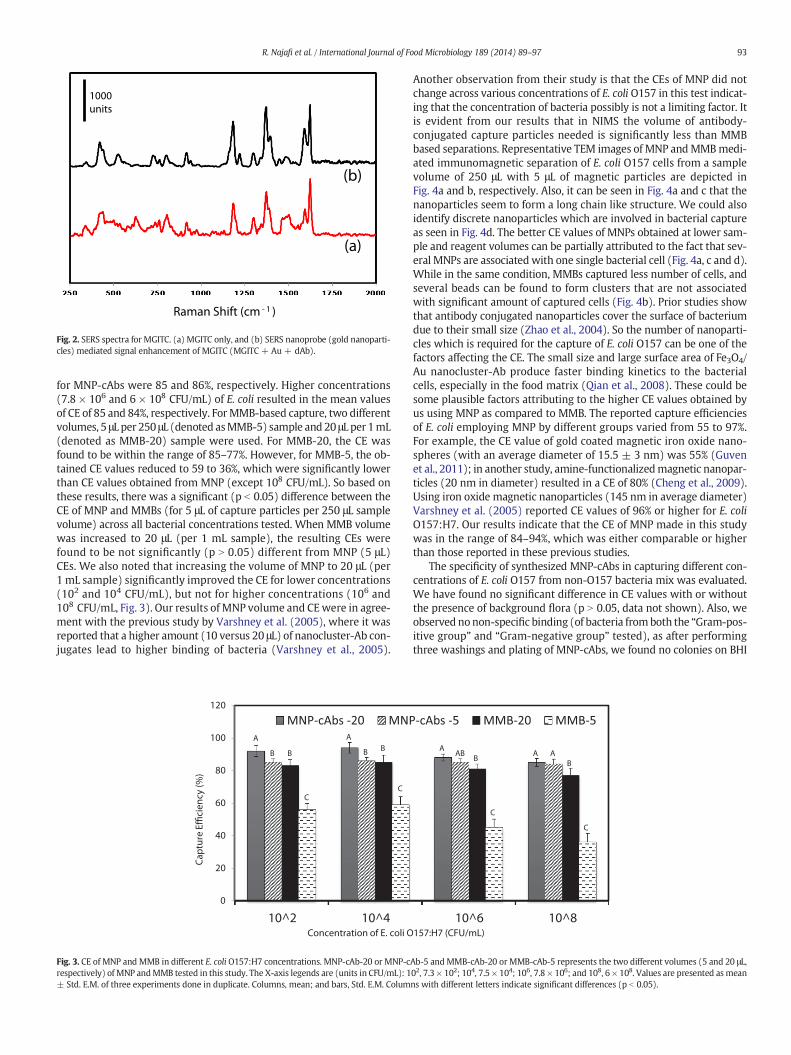
The bacterial concentrations (CFU/mL) for both the control and testsamples were calculated to determine the CEs of NIMS and IMS (MMB-mediated) methods for different bacterial concentrations. Fig. 3 showsthe relationship between bacterial cell concentration and CEs usingMNP-cAbs and MMBs for the immunoreaction time of 25 min in fourdifferent target concentrations. For the four different concentrations ofE. coli O157, the CE values of MNP-cAbs were found to be between84% and 94%. The overall percentage of captured bacteria for E. coliO157 was found to be approximately 85%. Based on the E. coli cell con-centration shown in Fig. 3, there was not a significant difference be-tween the bacteria captured by the Ab-coated nanocluster (NIMS) andthat captured by the anti-E. coli O157 MMBs (traditional IMS) exceptfor 108 CFU/mL. However, it is noteworthy that for NIMS, we used5 μL of theMNP-cAbswith 250 μL of cell-suspension;while for tradition-al IMS 20 μL of the MMBs was reacted with 1 mL sample volume. Ourobjective of utilizing lower reagent and sample volumeswas to evaluateif a nanoparticle-based IMSmethod can be realizedwith lesser amountsof test sample and reagents as compared to a microbead-based IMSmethod. Since the antibody-containing reagents are expensive, hencereduction in reagent volume would reduce the cost per assay. Fortraditional IMS format, when the volume of MMB was reduced to5 μL per 250 μL sample volumes, CE values were found to be signif-icantly (p b 0.05) lower across all four test concentrations (Fig. 3).For 7.3 × 10² and 7.5 × 10⁴ CFU/mL of E. coli, the mean values of CE
ow Fe3O4 nanoparticles (a, b), and bottom two panels show Fe3O4/Au nanocluster (c, d).
Fig. 2. SERS spectra for MGITC. (a) MGITC only, and (b) SERS nanoprobe (gold nanoparti-cles) mediated signal enhancement of MGITC (MGITC + Au + dAb).
93R. Najafi et al. / International Journal of Food Microbiology 189 (2014) 89–97
for MNP-cAbs were 85 and 86%, respectively. Higher concentrations(7.8 × 10⁶ and 6 × 10⁸ CFU/mL) of E. coli resulted in the mean valuesof CE of 85 and 84%, respectively. ForMMB-based capture, two differentvolumes, 5 μL per 250 μL (denoted asMMB-5) sample and 20 μL per 1mL(denoted as MMB-20) sample were used. For MMB-20, the CE wasfound to be within the range of 85–77%. However, for MMB-5, the ob-tained CE values reduced to 59 to 36%, which were significantly lowerthan CE values obtained from MNP (except 108 CFU/mL). So based onthese results, there was a significant (p b 0.05) difference between theCE of MNP and MMBs (for 5 μL of capture particles per 250 μL samplevolume) across all bacterial concentrations tested. When MMB volumewas increased to 20 μL (per 1 mL sample), the resulting CEs werefound to be not significantly (p N 0.05) different from MNP (5 μL)CEs. We also noted that increasing the volume of MNP to 20 μL (per1 mL sample) significantly improved the CE for lower concentrations(102 and 104 CFU/mL), but not for higher concentrations (106 and108 CFU/mL, Fig. 3). Our results of MNP volume and CEwere in agree-ment with the previous study by Varshney et al. (2005), where it wasreported that a higher amount (10 versus 20 μL) of nanocluster-Ab con-jugates lead to higher binding of bacteria (Varshney et al., 2005).
0
20
40
60
80
100
120
10^2 10^4
MNP-cAbs -20 MNP
Capt
ure
Effici
ency
(%)
Concentration of E. coli O
A
B B
C
A
B B
C
Fig. 3. CE of MNP and MMB in different E. coli O157:H7 concentrations. MNP-cAb-20 or MNP-crespectively) of MNP andMMB tested in this study. The X-axis legends are (units in CFU/mL): 1± Std. E.M. of three experiments done in duplicate. Columns, mean; and bars, Std. E.M. Colum
Another observation from their study is that the CEs of MNP did notchange across various concentrations of E. coli O157 in this test indicat-ing that the concentration of bacteria possibly is not a limiting factor. Itis evident from our results that in NIMS the volume of antibody-conjugated capture particles needed is significantly less than MMBbased separations. Representative TEM images of MNP andMMBmedi-ated immunomagnetic separation of E. coli O157 cells from a samplevolume of 250 μL with 5 μL of magnetic particles are depicted inFig. 4a and b, respectively. Also, it can be seen in Fig. 4a and c that thenanoparticles seem to form a long chain like structure. We could alsoidentify discrete nanoparticles which are involved in bacterial captureas seen in Fig. 4d. The better CE values of MNPs obtained at lower sam-ple and reagent volumes can be partially attributed to the fact that sev-eral MNPs are associated with one single bacterial cell (Fig. 4a, c and d).While in the same condition, MMBs captured less number of cells, andseveral beads can be found to form clusters that are not associatedwith significant amount of captured cells (Fig. 4b). Prior studies showthat antibody conjugated nanoparticles cover the surface of bacteriumdue to their small size (Zhao et al., 2004). So the number of nanoparti-cles which is required for the capture of E. coli O157 can be one of thefactors affecting the CE. The small size and large surface area of Fe3O4/Au nanocluster-Ab produce faster binding kinetics to the bacterialcells, especially in the food matrix (Qian et al., 2008). These could besome plausible factors attributing to the higher CE values obtained byus using MNP as compared to MMB. The reported capture efficienciesof E. coli employing MNP by different groups varied from 55 to 97%.For example, the CE value of gold coated magnetic iron oxide nano-spheres (with an average diameter of 15.5 ± 3 nm) was 55% (Guvenet al., 2011); in another study, amine-functionalizedmagnetic nanopar-ticles (20 nm in diameter) resulted in a CE of 80% (Cheng et al., 2009).Using iron oxide magnetic nanoparticles (145 nm in average diameter)Varshney et al. (2005) reported CE values of 96% or higher for E. coliO157:H7. Our results indicate that the CE of MNP made in this studywas in the range of 84–94%, which was either comparable or higherthan those reported in these previous studies.
The specificity of synthesized MNP-cAbs in capturing different con-centrations of E. coli O157 from non-O157 bacteria mix was evaluated.We have found no significant difference in CE values with or withoutthe presence of background flora (p N 0.05, data not shown). Also, weobserved nonon-specific binding (of bacteria fromboth the “Gram-pos-itive group” and “Gram-negative group” tested), as after performingthree washings and plating of MNP-cAbs, we found no colonies on BHI
10^6 10^8
-cAbs -5 MMB-20 MMB-5
157:H7 (CFU/mL)
AAB
B
C
A AB
C
Ab-5 and MMB-cAb-20 or MMB-cAb-5 represents the two different volumes (5 and 20 μL,02, 7.3 × 10²; 104, 7.5 × 10⁴; 106, 7.8 × 10⁶; and 108, 6 × 10⁸. Values are presented as meanns with different letters indicate significant differences (p b 0.05).
Fig. 4. TEM images of nanoparticle andmicrobeadmediated captured E. coliO157:H7. The images are taken after immunomagnetic separation of cells froma sample volume of 250 μLwith5 μL of magnetic particles, nanoparticles (a) and microbeads (b). In some cases, nanoparticles formed “chain-like” nanocluster structures attached to captured bacterial cells (c), whilediscrete nanoparticles are also found to be involved in bacterial capture, as these particles can be seen attached to the cell surfaces as shown in (d). Captured E. coli O157:H7 is shownby “➨” while MNPs or MMBs are indicated by “➙”.
94 R. Najafi et al. / International Journal of Food Microbiology 189 (2014) 89–97
agar plates (data not shown). In a previous study, Guven et al. (2011)reported that washing three times post-IMS with PBST resulted in anoptimal capture efficiency and also eliminated non-specific bindings. Inour study we directly used this protocol and could eliminate attachmentof non-target organisms.
3.3. Detection of E. coli O157 in apple juice using SERS-based sandwichimmunoassay
The newly developed NIMS method was validated in the foodsystem by artificially spiking different concentrations of E. coli O157 incommercial apple juice. The target E. coli O157 acted as a bridge be-tween MNP-cAbs and the Au-Raman label nanoparticles (Fig. S1).After collecting the sample by using an external magnet, SERS analysisof the magnet-separated sample was performed. The SERS spectra forE. coli O157 in apple juice were obtained using Raman-labeled goldnanoparticles (Fig. 5a). The results display typical SERS responses fromthe immunoassay for various concentrations of E. coli O157 (101
through 107 CFU/mL) in apple juice. Based on the SERS result, it isapparent that E. coli O157 could be detected within 5 min through theRaman intensity of the reporter molecule (MGITC). The incremental in-tensities of Raman spectra are directly related to the increasing concen-trations of E. coli cells, which are consistent with the Raman shiftsignature of the MGITC reporter at 1180, 1370, and 1620 cm−1 peakdensities (Fig. 5b). The differential peak intensities as a function ofbacterial cell concentrations are attributed to the fact that higher signalintensity depends on the amount of SERS nanoprobes that are attached
to the target pathogen. The average peak heights at 1620 cm−1 peakdensity were plotted against target concentrations of E. coli (LogCFU/mL) in Fig. 5c. An R2 value of 0.96 was obtained by performinga linear regression analysis of the peak heights versus Log CFU/mL of tar-get E. coli (Fig. 5c). Therefore, the higher the captured cell concentra-tions, the higher is the amount of magnetically separated gold-Ramandye attributing to a higher signal. Various intensities of Raman spectraobtained for different concentrations of E. coli using a SERS based sand-wich immunoassay were shown in previous research (Guven et al.,2011). The SERS based limit of detection (LOD) of their study usingwater samples varies between 27 and 451 CFU/mL. In another study,using silica-coatedMNP andmercaptobenzoic acid (MBA) as Raman re-porter, similar concentration-dependent SERS signal acquisition was re-ported for Staphylococcus aureus and Salmonella Typhimurium (WangH.et al., 2011). The lowest detectable concentration of target bacteria usingtheir methodwas 103 CFU/mL in a 0.5mL total sample volume. The LODof our method was 102 CFU/mL, and we observed no cross reactivitywith other organisms tested. Therefore, the SERS result of the presentstudy was comparable to previous studies mentioned above.
Application of Fe3O4/Au nanocluster mediated NIMS followed bySERS-based detection eliminates many disadvantages of traditionalIMS and ELISA. For example, following MMB mediated traditional IMS,the captured aggregates are enumerated either by plating or by afollow-up analytical method, such as PCR or ELISA. Plating followed byincubation usually takes 18–48 h or longer, while IMS-ELISA or IMS-PCR may take between 2–4 h (Ozalp et al., 2013; Wang et al., 2013a,b). On the contrary, SERS-based detection following NIMS is very
Fig. 5. SERS spectra for E. coli O157:H7 capture in apple juice using MNP. (a) Stacked spectra of different concentrations of E. coli O157:H7-nanoparticle aggregates containing Raman re-porter: No E. coli O157:H7 (spectrum a); 101 CFU/mL (spectrum b); 102 CFU/mL (spectrum c); 103 CFU/mL (spectrum d); 104 CFU/mL (spectrum e); 105 CFU/mL (spectrum f); 106 CFU/mL(spectrum g); and 107 CFU/mL (spectrum h). (b) Stacked spectra showing E. coli O157:H7 concentration dependent Raman shift signature of the MGITC reporter at vibrational frequencyzones of 1180, 1370, and 1620 cm−1. (c) Plot representing SERS intensity at 1620 cm−1 vs. Log CFU/mL of target E. coliO157:H7. The spectra represent themean two independent experimentsdone in duplicate.
95R. Najafi et al. / International Journal of Food Microbiology 189 (2014) 89–97
rapid (less than 10 min). NIMS takes the advantages of the traditionalIMS as the Fe3O4/Au nanoclusters can easily be captured by an externalmagnet due to their unique magnetic properties (Zhou et al., 2010).Moreover, the use of a Raman tag leads to a better signal to noise ratiofor direct detection in food matrices (Wang et al., 2010; Wang Y. et al.,2011; Zhou et al., 2010) without the need of lengthy incubation. SeveralE. coli O157:H7 outbreaks occurred in the last two decades involvingconsumption of unpasteurized apple juice or ciders in North America(Besser et al., 1993; CDC, 1997; Cody et al., 1999; Hilborn et al., 2000;Tamblyn et al., 1999). In the United States, FDA regulation requires a“5-Log pathogen reduction performance standard” for apple juice and
apple cider or if sold raw (un-pasteurized), must carry a warning labelshowing that the product may have potential harmful bacteria (FDA,2001; Mak et al., 2001). With all these actions, there has still beensome E. coli O157:H7 outbreak related to apple juice. So, this is one ofthe reasons for choosing apple juice as a model beverage in this study.In addition, as a food matrix, apple juice is relatively low in suspendedmatters with minimal insoluble particulates, so it could be easily usedin the developed method for the first trial.
The total analysis time of the developed immunoassay was less than60min, including 25min for bacteria capture, 25min for interaction be-tween the captured bacteria and the SERS labeled antibody and less
96 R. Najafi et al. / International Journal of Food Microbiology 189 (2014) 89–97
than total 10min for washing steps and SERSmeasurement. The analy-sis time of this method was comparable to that of the SERS based sand-wich immunoassay developed previously (Guven et al., 2011) and theSERS based detection platform as reported by Temur et al. (2010). Ourresults indicate that multifunctional Fe3O4/Au nanocluster can be suc-cessfully applied to detect E. coli O157:H7 by obtaining the SERS signalin apple juice containing the target pathogen. The Fe3O4 core insidethis nanocomposite can be conveniently used due to its strongmagneticproperties, which, in turn, can lead to the rapid separation and concen-tration of the target analyte. The rough gold shell on the outer part of thenanocomposite results in stability and bacterial detection via a SERSmethod (Zhou et al., 2010).
4. Conclusions
E. coli O157:H7 is a major foodborne pathogen that has been a seri-ous concern in the food industry. Thus, the development of a rapid, sen-sitive and selective detection method for this pathogen is needed. Anew immunoassay has been developed, which is a combination ofNIMS and SERS. Based on the results of food sample analysis, the devel-oped immunoassay can be used for the rapid detection of E. coli O157:H7 in apple juice. The Fe3O4/Au nanocluster is effective in capturing,concentrating, and detecting E. coli O157:H7 via surface enhancedRaman spectroscopy (SERS). The present method is simple and doesnot require time-consuming sample preparation and enrichment.Another advantage of this newly developed method is that it holdsthe potential of multiplexing. Just by incorporating multiple Ramanprobes on the same assay platform, a multiplexed immunoassay canbe developed for simultaneous detection of multiple pathogens infood matrices. The developed immunoassay may also be applicable inparticulate foods, such as ground beef, which will be an extension ofthe present study, and will be conducted in the future.
Supplementary data to this article can be found online at http://dx.doi.org/10.1016/j.ijfoodmicro.2014.07.036.
Acknowledgments
This research was partly supported by grants from the USDA–NIFA(ALAX-012-0210 and 2010-38821-21448) and by start-up funds fromThe University of Memphis. The authors thank Dr. Josh Herring forSEM, and Dr. Omar Skalli and Lou G Boykins for TEM analyses.
References
Banerjee, P.,Bhunia, A.K., 2010. Cell-based biosensor for rapid screening of pathogens andtoxins. Biosens. Bioelectron. 26, 99–106.
CDC, 1997. Outbreaks of Escherichia coliO157:H7 infection and cryptosporidiosis associat-ed with drinking unpasteurized apple cider—Connecticut and New York, October1996. Morb. Mortal. Wkly Rep. 46.
Cheng, Y., Liu, Y.,Huang, J., Li, K.,Zhang, W.,Xian, Y., Jin, L., 2009. Combining biofunctionalmagnetic nanoparticles and ATP bioluminescence for rapid detection of Escherichiacoli. Talanta 77, 1332–1336.
Chu, H., Huang, Y., Zhao, Y., 2008. Silver nanorod arrays as a surface-enhanced Ramanscattering substrate for foodborne pathogenic bacteria detection. Appl. Spectrosc.62, 922–931.
Cody, S.H.,Glynn, M.K.,Farrar, J.A.,Cairns, K.L.,Griffin, P.M.,Kobayashi, J.,Fyfe, M.,Hoffman,R.,King, A.S.,Lewis, J.H.,Swaminathan, B.,Bryant, R.G.,Vugia, D.J., 1999. An outbreak ofEscherichia coli O157:H7 infection from unpasteurized commercial apple juice. Ann.Intern. Med. 130, 202–209.
Dutta, R.K.,Sharma, P.K.,Pandey, A.C., 2009. Surface enhanced Raman spectra of E. coli cellsusing ZnO nanoparticles. Dig. J. Nanomater. Biostruct. 4, 83–87.
Dwivedi, H.P., Jaykus, L.-A., 2011. Detection of pathogens in foods: the current state-of-the-art and future directions. Crit. Rev. Microbiol. 37, 40–63.
FDA, 2001. Hazard Analysis and Critical Control Point (HAACP); Procedures for the Safeand Sanitary Processing and Importing of Juice; Final Rule. Federal Register, pp.6137–6202.
Gilmartin, N.,O'Kennedy, R., 2012. Nanobiotechnologies for the detection and reduction ofpathogens. Enzym. Microb. Technol. 50, 87–95.
Goon, I.Y.,Lai, L.M.H.,Lim, M.,Munroe, P.,Gooding, J.J.,Amal, R., 2009. Fabrication and dis-persion of gold-shell-protected magnetite nanoparticles: systemic control usingpolyethyleneimine. Chem. Mater. 21, 673–681.
Gou, L.,Murphy, C.J., 2005. Fine-tuning the shape of gold nanorods. Chem. Mater. 17,3668–3672.
Guven, B.,Basaran-Akgul, N.,Temur, E.,Tamer, U.,Boyaci, I.H., 2011. SERS-based sandwichimmunoassay using antibody coated magnetic nanoparticles for Escherichia colienumeration. Analyst 136, 740–748.
Hilborn, E.D.,Mshar, P.A.,Fiorentino, T.R.,Dembek, Z.F.,Barrett, T.J.,Howard, R.T.,Cartter, M.L.,2000. An outbreak of Escherichia coli O157:H7 infections and haemolytic uraemic syn-drome associated with consumption of unpasteurized apple cider. Epidemiol. Infect.124, 31–36.
Huang, W.E.,Li, M., Jarvis, R.M.,Goodacre, R.,Banwart, S.A., 2010. Shining light on the mi-crobial world the application of Raman microspectroscopy. Adv. Appl. Microbiol. 70,153–186.
Jana, N.R.,Gearheart, L.,Murphy, C., 2001. Evidence for seed-mediated nucleation in theformation of gold nanoparticles from gold salts. Chem. Mater. 13, 2313–2322.
Krug, J.T.,Wang, G.D., Emory, S.R., Nie, S.M., 1999. Efficient Raman enhancement andintermittent light emission observed in single gold nanocrystals. J. Am. Chem. Soc.121, 9208–9214.
Liberti, P.A.,Chiarappa, J.N.,Hovsepian, A.C.,Rao, C.G., 1996. Bioreceptor ferrofluids: novelcharacteristics and their utility in medical applications. In: Pelizzetti, E. (Ed.), FineParticles Science and Technology. Springer, Netherlands, pp. 777–790.
Lu, X.,Al-Qadiri, H.M., Lin, M.,Rasco, B.A., 2011. Application of mid-infrared and Ramanspectroscopy to the study of bacteria. Food Bioprocess Technol. 4, 919–935.
Mak, P.P., Ingham, B.H., Ingham, S.C., 2001. Validation of apple cider pasteurization treat-ments against Escherichia coli O157:H7, Salmonella, and Listeria monocytogenes. J.Food Prot. 64, 1679–1689.
Mandal, P.K., Biswas, A.K., Choi, K., Pal, U.K., 2011. Methods for rapid detection offoodborne pathogen: an overview. Am. J. Food Technol. 6, 87–102.
Maquelin, K.,Kirschner, C.,Choo-Smith, L.P., van den Braak, N.,Endtz, H.P.,Naumann, D.,Puppels, G.J., 2002. Identification ofmedically relevantmicroorganisms by vibrationalspectroscopy. J. Microbiol. Methods 51, 255–271.
Naja, G.,Bouvrette, P.,Hrapovic, S., Luong, J.H.T., 2007. Raman-based detection of bacteriausing silver nanoparticles conjugated with antibodies. Analyst 132, 679–686.
Narayanan, R.,Lipert, R.J.,Porter, M.D., 2008. Cetyltrimethylammonium bromide-modifiedspherical and cube-like gold nanoparticles as extrinsic Raman labels in surface-enhanced Raman spectroscopy based heterogeneous immunoassays. Anal. Chem.80, 2265–2271.
Neng, J.,Harpster, M.H.,Zhang, H.,Mecham, J.O.,Wilson, W.C.,Johnson, P.A., 2010. A versa-tile SERS-based immunoassay for immunoglobulin detection using antigen-coatedgold nanoparticles andmalachite green-conjugated protein A/G. Biosens. Bioelectron.26, 1009–1015.
Ozalp, V.C., Bayramoglu, G., Arica, M.Y., Oktem, H.A., 2013. Design of a core–shell typeimmuno-magnetic separation system and multiplex PCR for rapid detection of path-ogens from food samples. Appl. Microbiol. Biotechnol. 97, 9541–9551.
Perez, F.G.,Mascini, M., 1998. Immunomagnetic separation with mediated flow injectionanalysis amperometric detection of viable Escherichia coli O157. Anal. Chem. 70,2380–2386.
Perez-Lopez, B.,Merkoci, A., 2011. Nanomaterials based biosensors for food analysis appli-cations. Trends Food Sci. Technol. 22 (11), 625–639.
Pettinger, B.,Ren, B.,Picardi, G., Schuster, R.,Ertl, G., 2004. Nanoscale probing of adsorbedspecies by tip-enhanced Raman spectroscopy. Phys. Rev. Lett. 92, 096101.
Pettinger, B.,Ren, B.,Picardi, G., Schuster, R.,Ertl, G., 2005. Tip‐enhanced Raman spectros-copy (TERS) of malachite green isothiocyanate at Au (III): bleaching behavior underthe influence of high electromagnetic fields. J. Raman Spectrosc. 36, 541–550.
Premasiri, W.R.,Moir, D.T.,Klempner, M.S.,Krieger, N.,Jones, G.,Ziegler, L.D., 2005. Charac-terization of the surface enhanced raman scattering (SERS) of bacteria. J. Phys. Chem.B 109, 312–320.
Qian, X., Peng, X.H.,Ansari, D.O.,Yin-Goen, Q.,Chen, G.Z., Shin, D.M.,Yang, L.,Young, A.N.,Wang, M.D.,Nie, S., 2008. In vivo tumor targeting and spectroscopic detection withsurface-enhanced Raman nanoparticle tags. Nat. Biotechnol. 26, 83–90.
Scallan, E.,Hoekstra, R.M.,Widdowson, M.A.,Hall, A.J.,Griffin, P.M., 2011. Foodborne illnessacquired in the United States. Emerg. Infect. Dis. 17, 1339–1340.
Sugimoto, T.,Matijevic, E., 1980. Formation of uniform spherical magnetite particles bycrystallization from ferrous hydroxide gels. J. Colloid Interface Sci. 74, 227–243.
Tamblyn, S., deGrosbois, J., Taylor, D., Stratton, J., 1999. An outbreak of Escherichia coliO157:H7 infection associated with unpasteurized non-commercial, custom-pressedapple cider—Ontario, 1998. Can. Commun. Dis. Rep. 25, 117–120.
Tamer, U., Boyacı, İ.H., Temur, E., Zengin, A., Dincer, İ., Elerman, Y., 2011. Fabrication ofmagnetic gold nanorod particles for immunomagnetic separation and SERS applica-tion. J. Nanoparticle Res. 13, 3167–3176.
Temur, E.,Boyacı, I.H.,Tamer, U.,Unsal, H.,Aydogan, N., 2010. A highly sensitive detectionplatform based on surface-enhanced Raman scattering for Escherichia coli enumera-tion. Anal. Bioanal. Chem. 397, 1595–1604.
97R. Najafi et al. / International Journal of Food Microbiology 189 (2014) 89–97
Tomoyasu, T., 1998. Improvement of the immunomagnetic separation method selectivefor Escherichia coli O157 strains. Appl. Environ. Microbiol. 64, 376–382.
Tu, S.I.,Reed, S.,Gehring, A.,He, Y.,Paoli, G., 2009. Capture of Escherichia coliO157:H7 usingimmunomagnetic beads of different size and antibody conjugating chemistry.Sensors 9, 717–730.
Varshney, M.,Yang, L., Su, X.L., 2005. Magnetic nanoparticle–antibody conjugates for theseparation of Escherichia coli O157:H7 in ground beef. J. Food Prot. 68, 1804–1811.
Velusamy, V., Arshak, K., Korostynska, O., Oliwa, K., Adley, C., 2010. An overview offoodborne pathogen detection: in the perspective of biosensors. Biotechnol. Adv.28, 232–254.
Wang, H.,Li, Y.,Wang, A.,Slavik, M., 2011. Rapid, sensitive, and simultaneous detection ofthree foodborne pathogens using magnetic nanobead-based immunoseparation andquantum dot-based multiplex immunoassay. J. Food Prot. 74, 2039–2047.
Wang, Y., Ravindranath, S., Irudayaraj, J., 2011. Separation and detection of multiplepathogens in a food matrix by magnetic SERS nanoprobes. Anal. Bioanal. Chem.399, 1271–1278.
Wang, Z.,Wang, J., Yue, T., Yuan, Y., Cai, R., Niu, C., 2013a. Immunomagnetic separationcombined with polymerase chain reaction for the detection of Alicyclobacillusacidoterrestris in apple juice. PLoS One 8, e82376.
Wang, Z.,Yue, T.,Yuan, Y.,Cai, R.,Niu, C.,Guo, C., 2013b. Development and evaluation of animmunomagnetic separation-ELISA for the detection of Alicyclobacillus spp. in applejuice. Int. J. Food Microbiol. 166, 28–33.
Xiong, Q., Cui, X., Saini, J.K., Liu, D., Shan, S., Jin, Y., Lai, W., 2014. Development of animmunomagnetic separation method for efficient enrichment of Escherichia coliO157:H7. Food Control 37, 41–45.
Xu, S., Ji, X., Xu, W., Zhao, B., Dou, X., Bai, Y., Ozaki, Y., 2005. Surface-enhanced Ramanscattering studies on immunoassay. J. Biomed. Opt. 10, 031112.
Zhao, X., Hilliard, L.R.,Mechery, S.J.,Wang, Y., Bagwe, R.P., Jin, S., Tan, W., 2004. A rapidbioassay for single bacterial cell quantitation using bioconjugated nanoparticles.Proc. Natl. Acad. Sci. U. S. A. 101, 15027–15032.
Zhou, X., Xu, W.,Wang, Y., Kuang, Q., Shi, Y., Zhong, L., Zhang, Q., 2010. Fabrication ofcluster/shell Fe3O4/Au nanoparticles and application in protein detection via a SERSmethod. J. Phys. Chem. C 114, 19607–19613.