Development of an Advanced Development of an Advanced Approach for Next- Approach for Next- Generation, High-Resolution, Generation, High-Resolution, Integrated Reservoir Integrated Reservoir Characterization Characterization Performed by: Advanced Resources International Advanced Resources International Houston, Texas September 9, 2003 Tulsa, Oklahoma DOE Award No. DE-FC26-01BC15357
Transcript
Development of an Advanced Development of an Advanced Approach for Next-Generation, Approach for Next-Generation,
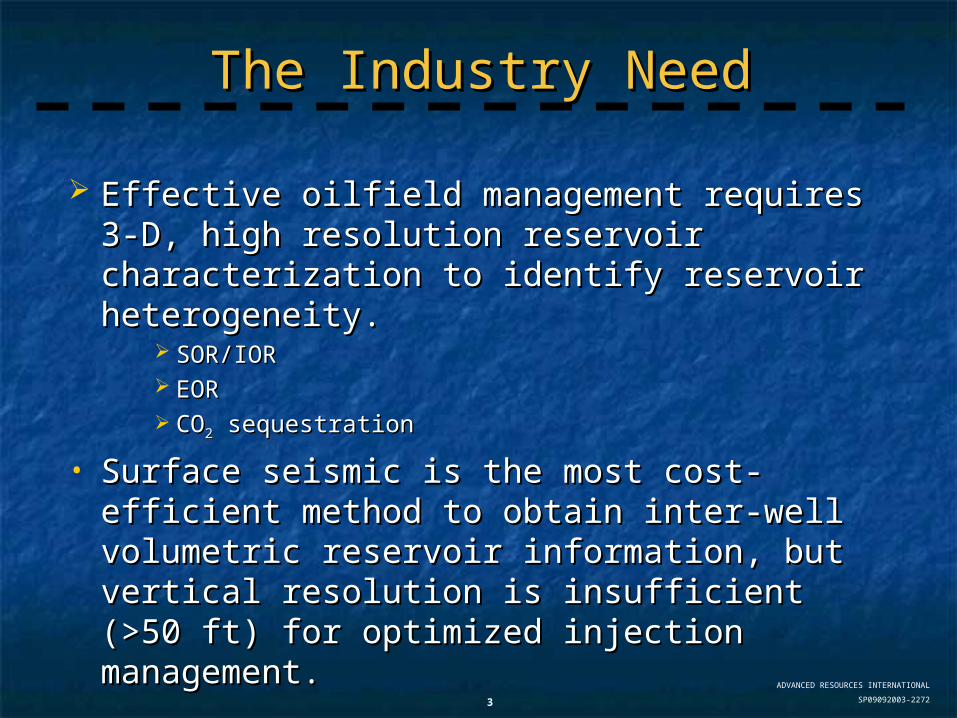
• Surface seismic is the most cost-efficient Surface seismic is the most cost-efficient method to obtain inter-well volumetric method to obtain inter-well volumetric reservoir information, but vertical reservoir information, but vertical resolution is insufficient (>50 ft) for resolution is insufficient (>50 ft) for optimized injection management.optimized injection management.
ADVANCED RESOURCES INTERNATIONAL
SP09092003-22724
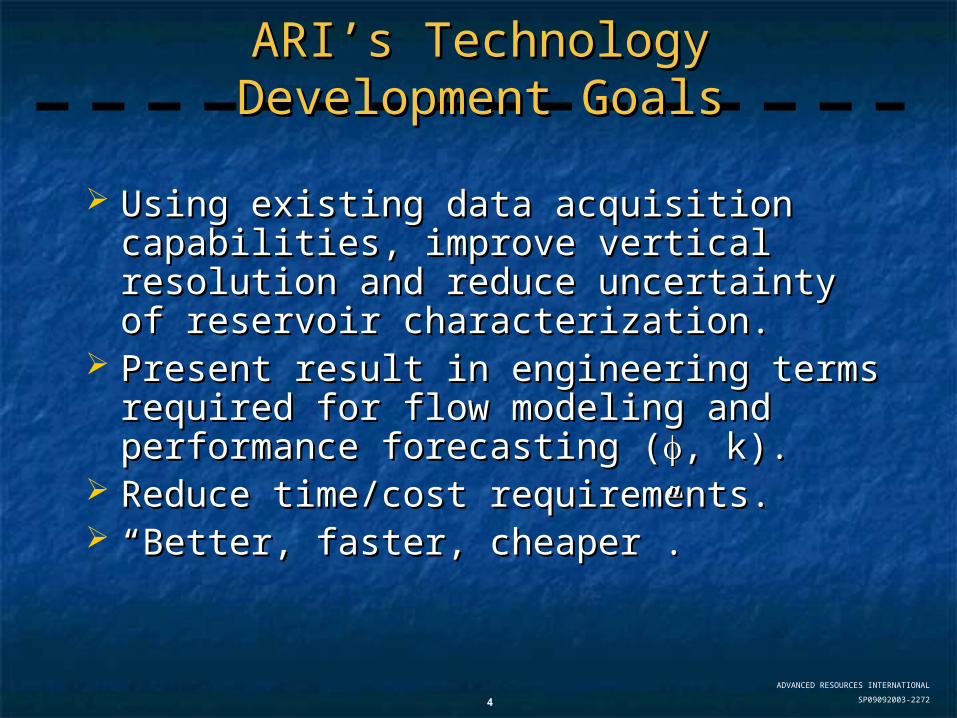
ARI’s Technology Development ARI’s Technology Development GoalsGoals
Using existing data acquisition Using existing data acquisition capabilities, improve vertical resolution capabilities, improve vertical resolution and reduce uncertainty of reservoir and reduce uncertainty of reservoir characterization.characterization.
Present result in engineering terms Present result in engineering terms required for flow modeling and required for flow modeling and performance forecasting (performance forecasting (, k)., k).
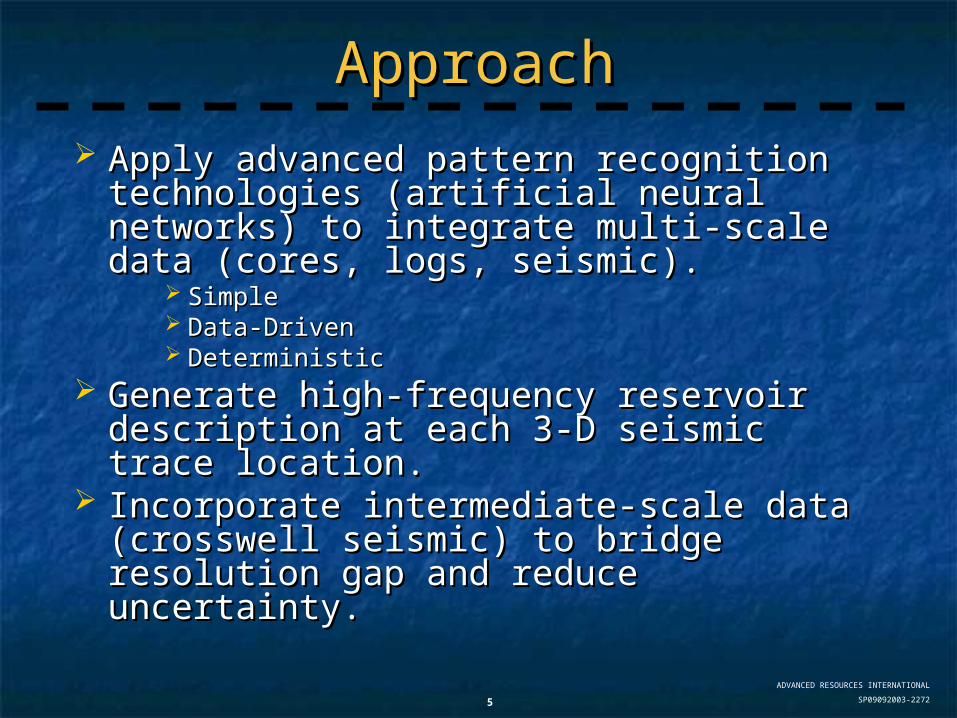
Generate high-frequency reservoir Generate high-frequency reservoir description at each 3-D seismic trace description at each 3-D seismic trace location.location.
Incorporate intermediate-scale data Incorporate intermediate-scale data (crosswell seismic) to bridge resolution (crosswell seismic) to bridge resolution gap and reduce uncertainty.gap and reduce uncertainty.
ADVANCED RESOURCES INTERNATIONAL
SP09092003-22726
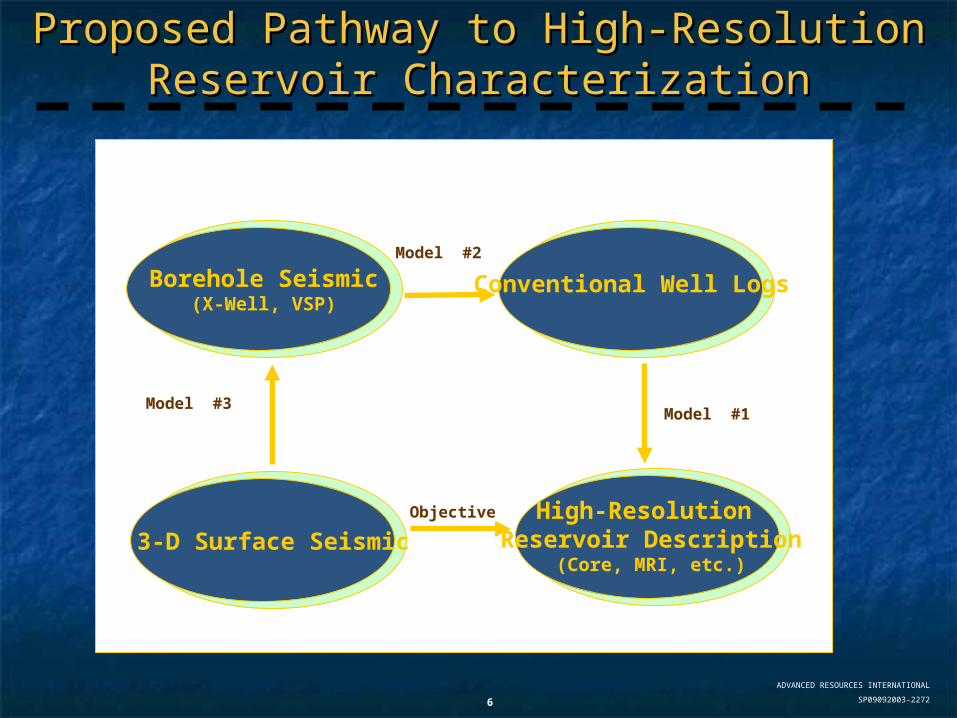
Proposed Pathway to High-Resolution Proposed Pathway to High-Resolution Reservoir CharacterizationReservoir Characterization
Borehole Seismic(X-Well, VSP)
Conventional Well Logs
3-D Surface SeismicHigh-Resolution
Reservoir Description(Core, MRI, etc.)
Objective
Model #3
Model #2
Model #1
ADVANCED RESOURCES INTERNATIONAL
SP09092003-22727
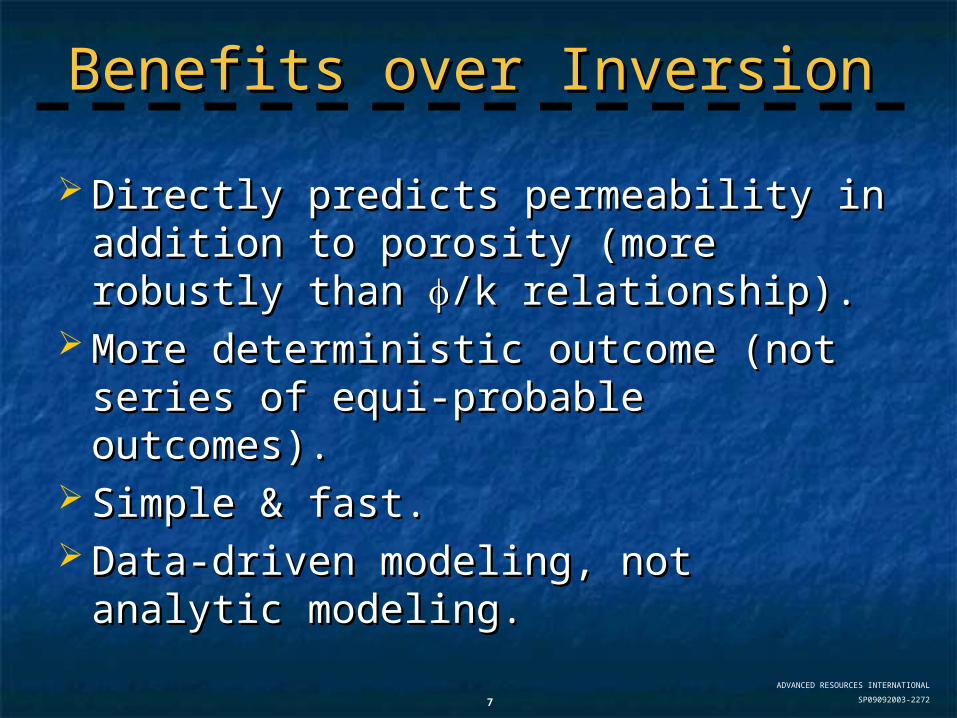
Benefits over InversionBenefits over Inversion
Directly predicts permeability in Directly predicts permeability in addition to porosity (more robustly addition to porosity (more robustly than than /k relationship)./k relationship).
More deterministic outcome (not More deterministic outcome (not series of equi-probable outcomes).series of equi-probable outcomes).
Simple & fast.Simple & fast. Data-driven modeling, not analytic Data-driven modeling, not analytic
modeling.modeling.
ADVANCED RESOURCES INTERNATIONAL
SP09092003-22728
Project ObjectiveProject Objective
Demonstrate and validate the Demonstrate and validate the integrated (virtual integrated (virtual intelligence) procedure at a intelligence) procedure at a single field.single field.
ADVANCED RESOURCES INTERNATIONAL
SP09092003-22729
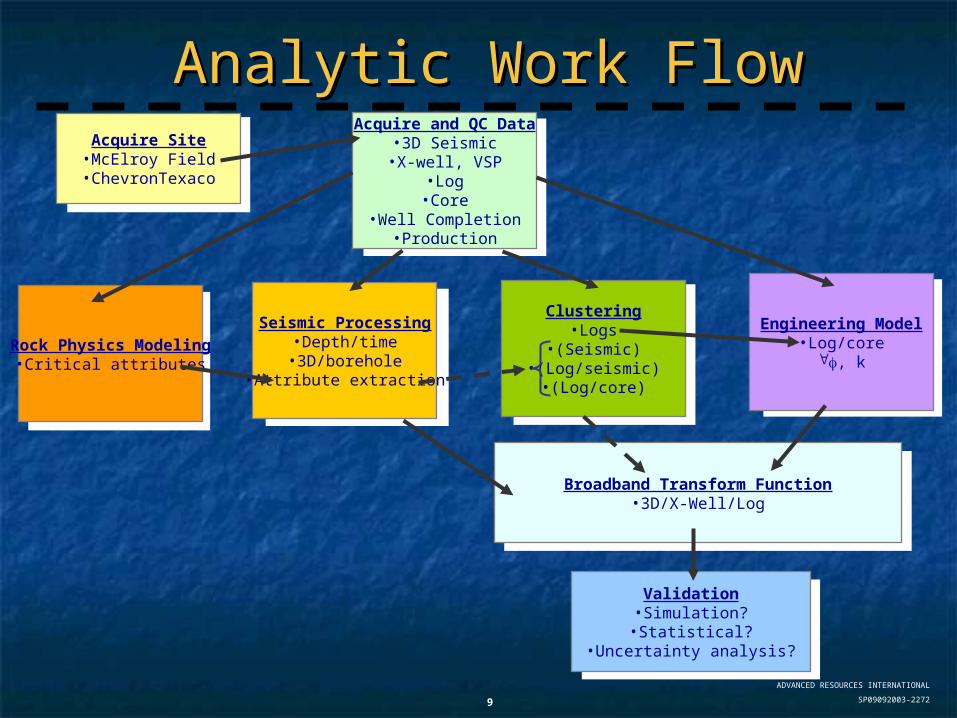
Analytic Work FlowAnalytic Work FlowAcquire and QC Data
•3D Seismic•X-well, VSP
•Log•Core
•Well Completion•Production
Clustering•Logs
•(Seismic)•(Log/seismic)
•(Log/core)
Seismic Processing•Depth/time•3D/borehole
•Attribute extraction
Rock Physics Modeling•Critical attributes
Engineering Model•Log/core
, k
Broadband Transform Function•3D/X-Well/Log
Validation•Simulation?•Statistical?
•Uncertainty analysis?
Acquire Site•McElroy Field
•ChevronTexaco
ADVANCED RESOURCES INTERNATIONAL
SP09092003-227210
Presentation OutlinePresentation Outline
Background and Project DescriptionBackground and Project Description Data Availability and Preliminary Data Availability and Preliminary
ProcessingProcessing Model BuildingModel Building AccomplishmentsAccomplishments
ADVANCED RESOURCES INTERNATIONAL
SP09092003-227211
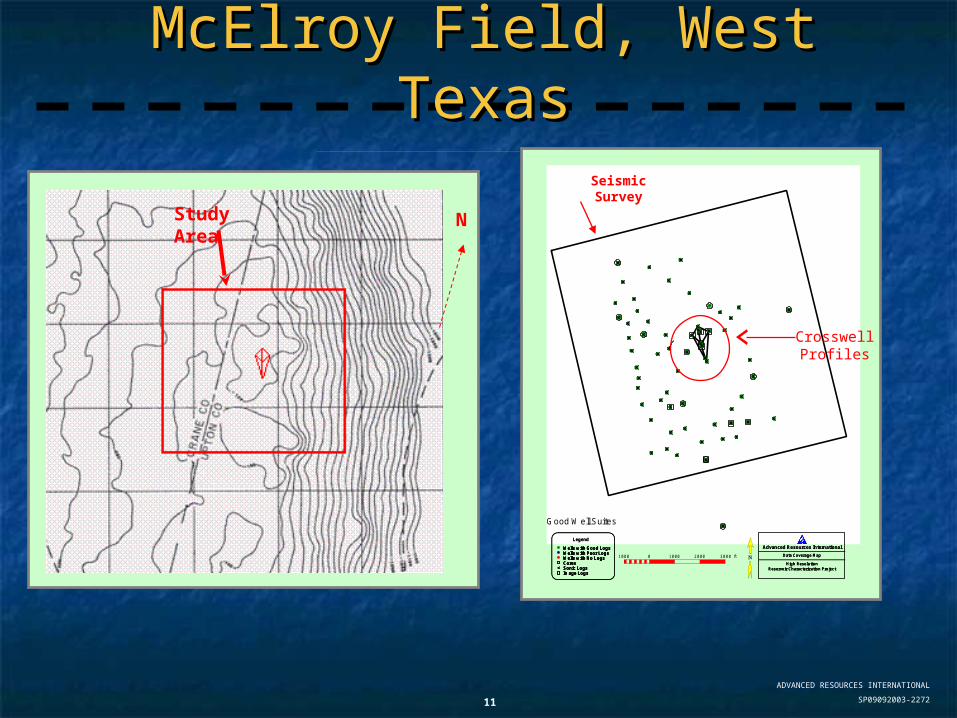
McElroy Field, West TexasMcElroy Field, West Texas
Advanced Resources International
Data Coverage Map
High ResolutionReservoir Characterization Project
Advanced Resources International
Data Coverage Map
High ResolutionReservoir Characterization Project
Wells with Good LogsWells with Poor LogsWells with No LogsCoresSonic LogsImage Logs
Legend
Wells with Good LogsWells with Poor LogsWells with No LogsCoresSonic LogsImage Logs
Wells with Good LogsWells with Poor LogsWells with No LogsCoresSonic LogsImage Logs
Legend
Good W ell Suites
1000 0 1000 2000 3000 ft
Seismic Survey
CrosswellProfiles
Study Area N
ADVANCED RESOURCES INTERNATIONAL
SP09092003-227212
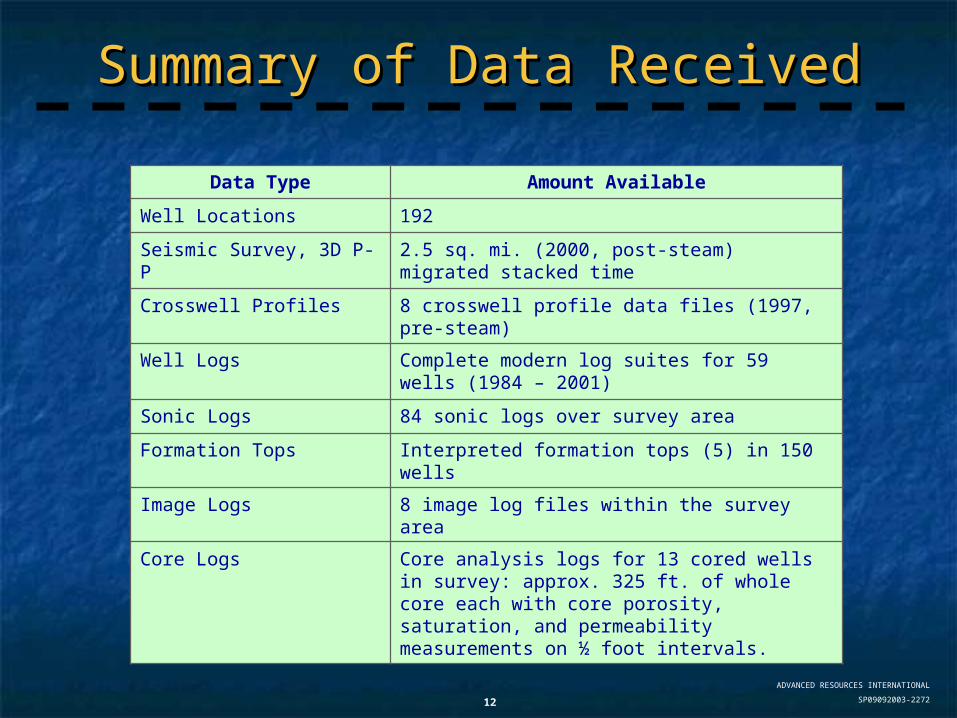
Summary of Data ReceivedSummary of Data Received
Data Type Amount Available
Well Locations 192
Seismic Survey, 3D P-P 2.5 sq. mi. (2000, post-steam) migrated stacked time
Crosswell Profiles 8 crosswell profile data files (1997, pre-steam)
Well Logs Complete modern log suites for 59 wells (1984 – 2001)
Sonic Logs 84 sonic logs over survey area
Formation Tops Interpreted formation tops (5) in 150 wells
Image Logs 8 image log files within the survey area
Core Logs Core analysis logs for 13 cored wells in survey: approx. 325 ft. of whole core each with core porosity, saturation, and permeability measurements on ½ foot intervals.
ADVANCED RESOURCES INTERNATIONAL
SP09092003-227213
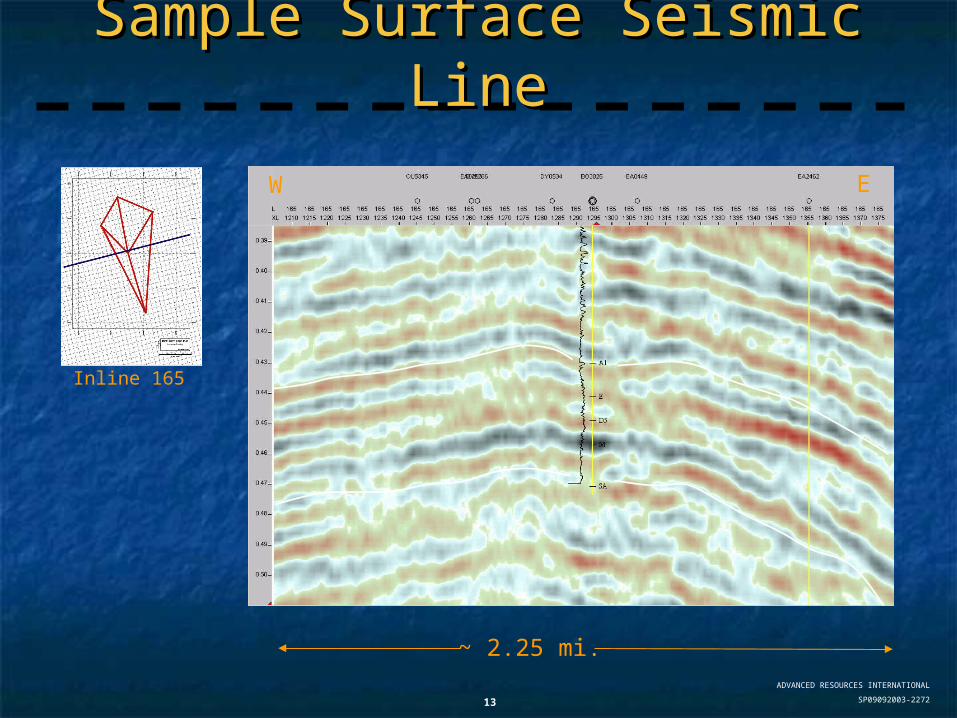
Sample Surface Seismic LineSample Surface Seismic Line
~ 2.25 mi.
W E
Inline 165
ADVANCED RESOURCES INTERNATIONAL
SP09092003-227214
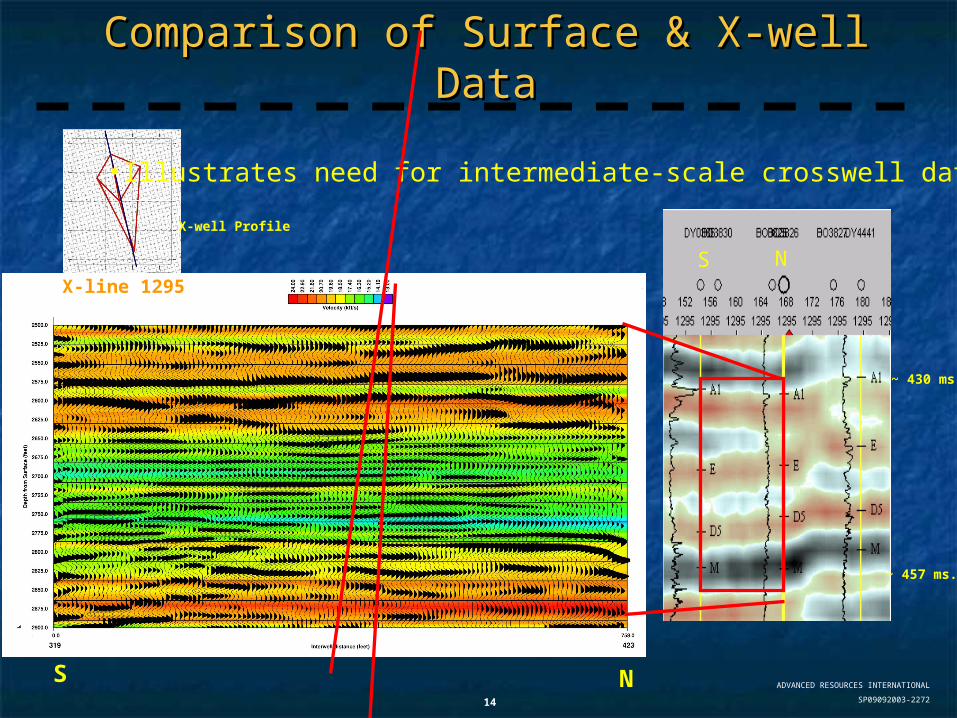
Comparison of Surface & X-well DataComparison of Surface & X-well Data
~ 430 ms.
~ 457 ms.
X-line 1295
X-well Profile
S N
S N
•Illustrates need for intermediate-scale crosswell data!
ADVANCED RESOURCES INTERNATIONAL
SP09092003-227215
Three Main “Data Processing” Three Main “Data Processing” ElementsElements
Rock Physics Modeling - Rock Physics Modeling - ObjectivesObjectives
Identify and prioritize seismic Identify and prioritize seismic attributes most likely to be attributes most likely to be influenced by reservoir properties influenced by reservoir properties of interest (of interest (,seismic facies ,seismic facies thickness).thickness).
Results will be used to select Results will be used to select attributes to include in seismic attributes to include in seismic models.models.
See Topical Report.See Topical Report.
ADVANCED RESOURCES INTERNATIONAL
SP09092003-227217
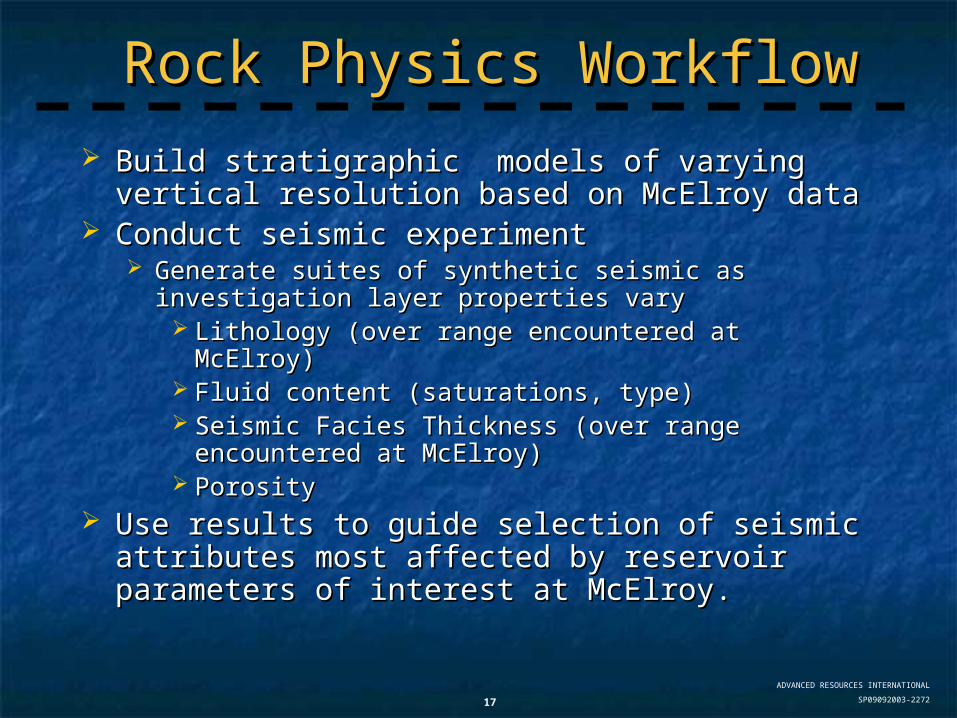
Rock Physics WorkflowRock Physics Workflow Build stratigraphic models of varying vertical Build stratigraphic models of varying vertical
resolution based on McElroy dataresolution based on McElroy data Conduct seismic experimentConduct seismic experiment
Generate suites of synthetic seismic as investigation Generate suites of synthetic seismic as investigation layer properties varylayer properties vary
Lithology (over range encountered at McElroy)Lithology (over range encountered at McElroy) Fluid content (saturations, type)Fluid content (saturations, type) Seismic Facies Thickness (over range Seismic Facies Thickness (over range
encountered at McElroy)encountered at McElroy) PorosityPorosity
Use results to guide selection of seismic Use results to guide selection of seismic attributes most affected by reservoir attributes most affected by reservoir parameters of interest at McElroy.parameters of interest at McElroy.
ADVANCED RESOURCES INTERNATIONAL
SP09092003-227218
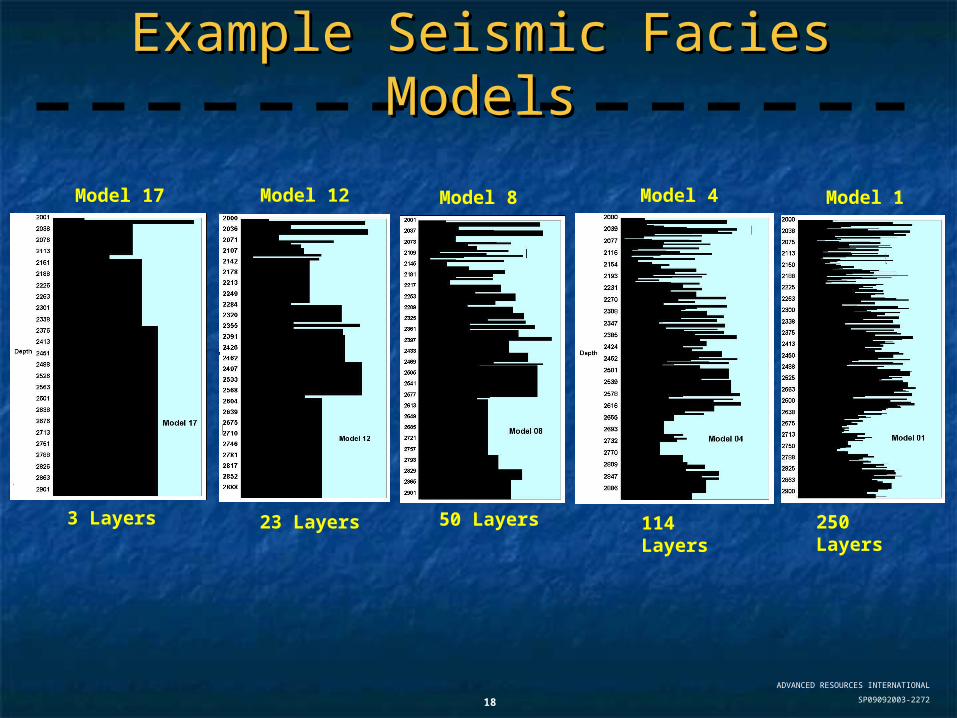
Example Seismic Facies ModelsExample Seismic Facies Models
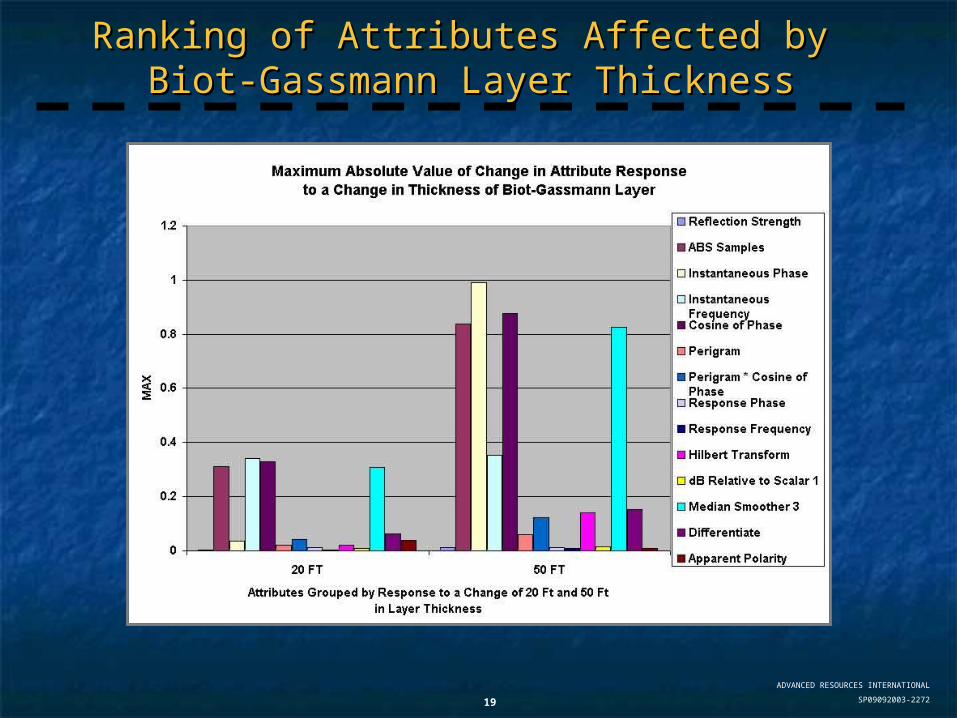
Ranking of Attributes Affected by Ranking of Attributes Affected by Biot-Gassmann Layer ThicknessBiot-Gassmann Layer Thickness
ADVANCED RESOURCES INTERNATIONAL
SP09092003-227220
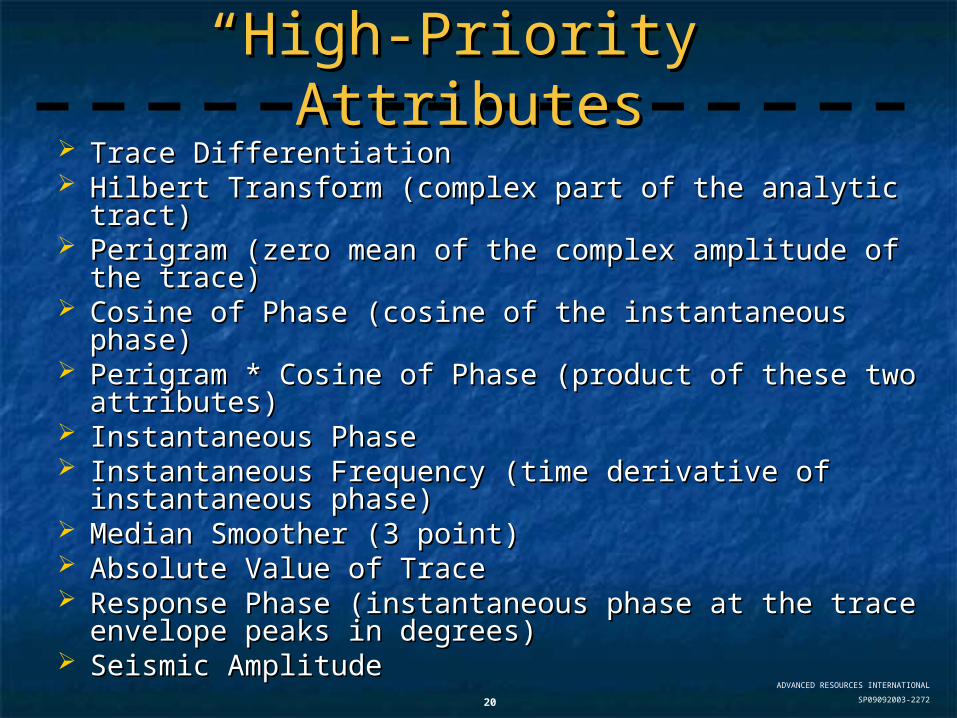
““High-Priority” AttributesHigh-Priority” Attributes Trace DifferentiationTrace Differentiation Hilbert Transform (complex part of the analytic Hilbert Transform (complex part of the analytic
tract)tract) Perigram (zero mean of the complex amplitude of Perigram (zero mean of the complex amplitude of
the trace)the trace) Cosine of Phase (cosine of the instantaneous phase)Cosine of Phase (cosine of the instantaneous phase) Perigram * Cosine of Phase (product of these two Perigram * Cosine of Phase (product of these two
attributes)attributes) Instantaneous PhaseInstantaneous Phase Instantaneous Frequency (time derivative of Instantaneous Frequency (time derivative of
instantaneous phase)instantaneous phase) Median Smoother (3 point)Median Smoother (3 point) Absolute Value of TraceAbsolute Value of Trace Response Phase (instantaneous phase at the trace Response Phase (instantaneous phase at the trace
envelope peaks in degrees)envelope peaks in degrees) Seismic AmplitudeSeismic Amplitude
ADVANCED RESOURCES INTERNATIONAL
SP09092003-227221
Seismic Processing and Attribute Seismic Processing and Attribute Extraction - ObjectivesExtraction - Objectives
Data QC, time/depth conversion, Data QC, time/depth conversion, tie (collocate) surface & X-well tie (collocate) surface & X-well traces.traces.
Calculate and extract “high Calculate and extract “high priority” attributes from depth priority” attributes from depth seismic. seismic.
See Topical Report.See Topical Report.
ADVANCED RESOURCES INTERNATIONAL
SP09092003-227222
Seismic Data QCSeismic Data QC
Two datasets to reprocessTwo datasets to reprocess 2000 vintage surface P-P seismic cube2000 vintage surface P-P seismic cube
~2.5 square mile reflection seismic survey~2.5 square mile reflection seismic survey 176 inlines, 176 crosslines176 inlines, 176 crosslines 55 ft. bin spacing CMP gathers55 ft. bin spacing CMP gathers Central frequency 65 Hz.Central frequency 65 Hz. Zero to 2 sec. data @ 2 ms. samplingZero to 2 sec. data @ 2 ms. sampling
1997 vintage X-well surveys1997 vintage X-well surveys 8 Crosswell seismic surveys8 Crosswell seismic surveys Lengths from 443 ft to 758 ft. in six surveysLengths from 443 ft to 758 ft. in six surveys Two surveys approx. 1,250 ft. very poor qualityTwo surveys approx. 1,250 ft. very poor quality Shot depths approx 1700-2950 ft.Shot depths approx 1700-2950 ft. Receiver depths 2200-2900 ft.Receiver depths 2200-2900 ft. Sample interval 0.15 ms.Sample interval 0.15 ms. Varying Data QualityVarying Data Quality
ADVANCED RESOURCES INTERNATIONAL
SP09092003-227223
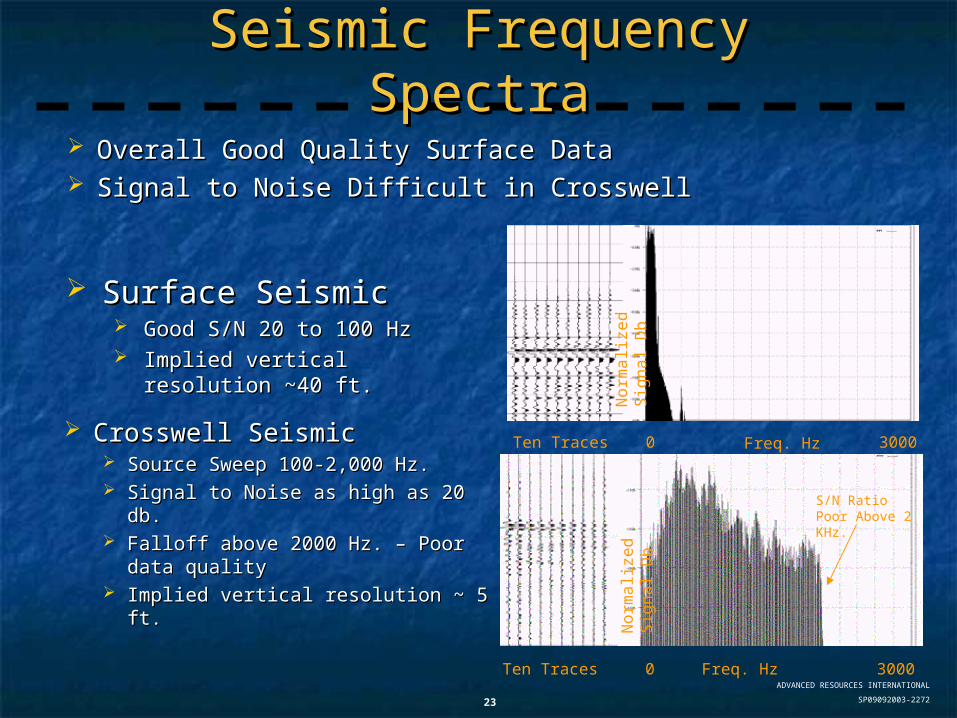
Seismic Frequency SpectraSeismic Frequency Spectra
Surface SeismicSurface Seismic Good S/N 20 to 100 HzGood S/N 20 to 100 Hz Implied vertical resolution Implied vertical resolution
~40 ft.~40 ft.
Crosswell SeismicCrosswell Seismic Source Sweep 100-2,000 Hz.Source Sweep 100-2,000 Hz. Signal to Noise as high as 20 db.Signal to Noise as high as 20 db. Falloff above 2000 Hz. – Poor Falloff above 2000 Hz. – Poor
Overall Good Quality Surface DataOverall Good Quality Surface Data Signal to Noise Difficult in CrosswellSignal to Noise Difficult in Crosswell
Ten Traces 0 Freq. Hz 3000
No
rma
lize
d S
ign
al
Db
Ten Traces Freq. Hz0 3000
No
rma
lize
d S
ign
al
Db
S/N Ratio Poor Above 2 KHz.
ADVANCED RESOURCES INTERNATIONAL
SP09092003-227224
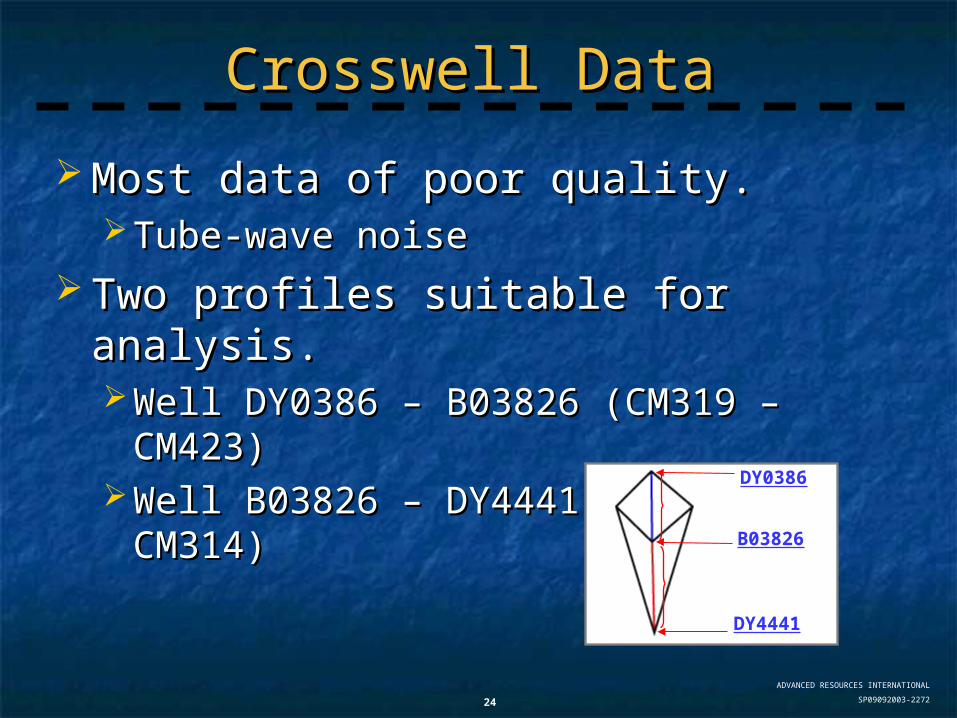
Crosswell DataCrosswell Data
Most data of poor quality.Most data of poor quality. Tube-wave noiseTube-wave noise
Two profiles suitable for analysis.Two profiles suitable for analysis. Well DY0386 – B03826 (CM319 – CM423)Well DY0386 – B03826 (CM319 – CM423) Well B03826 – DY4441 (CM423 – CM314)Well B03826 – DY4441 (CM423 – CM314)
DY0386
B03826
DY4441
ADVANCED RESOURCES INTERNATIONAL
SP09092003-227225
Clustering - ObjectivesClustering - Objectives
Identify trends in log data; adds an Identify trends in log data; adds an important input parameter to ANN important input parameter to ANN analysis.analysis.
Facies definitionFacies definition To be used in log-core model.To be used in log-core model. See Topical Report.See Topical Report.
ADVANCED RESOURCES INTERNATIONAL
SP09092003-227226
The Log Clustering ProcessThe Log Clustering Process
Clustering uses a technique known as Clustering uses a technique known as Self Organizing Maps, or unsupervised Self Organizing Maps, or unsupervised neural networksneural networks
The object is to group data with The object is to group data with similar characteristics into bins, or similar characteristics into bins, or “clusters”“clusters”
Determining what each cluster Determining what each cluster represents (e.g., facies) requires a represents (e.g., facies) requires a priori knowledgepriori knowledge
Overlap can exist between adjacent Overlap can exist between adjacent clustersclusters
ADVANCED RESOURCES INTERNATIONAL
SP09092003-227227
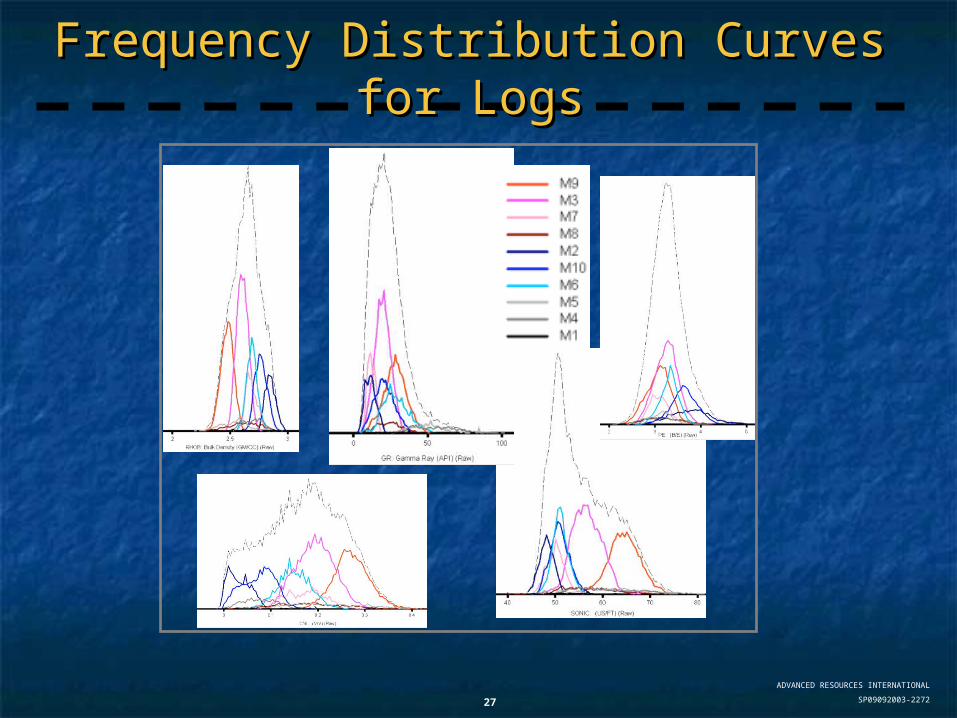
Frequency Distribution Curves for Frequency Distribution Curves for LogsLogs
ADVANCED RESOURCES INTERNATIONAL
SP09092003-227228
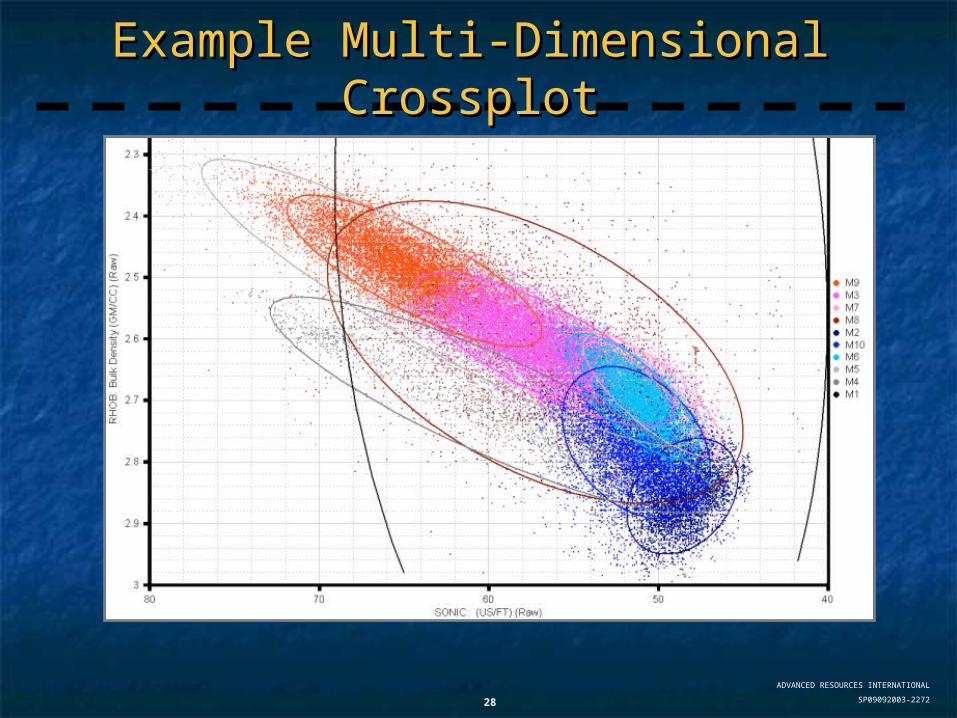
Example Multi-Dimensional Example Multi-Dimensional CrossplotCrossplot
ADVANCED RESOURCES INTERNATIONAL
SP09092003-227229
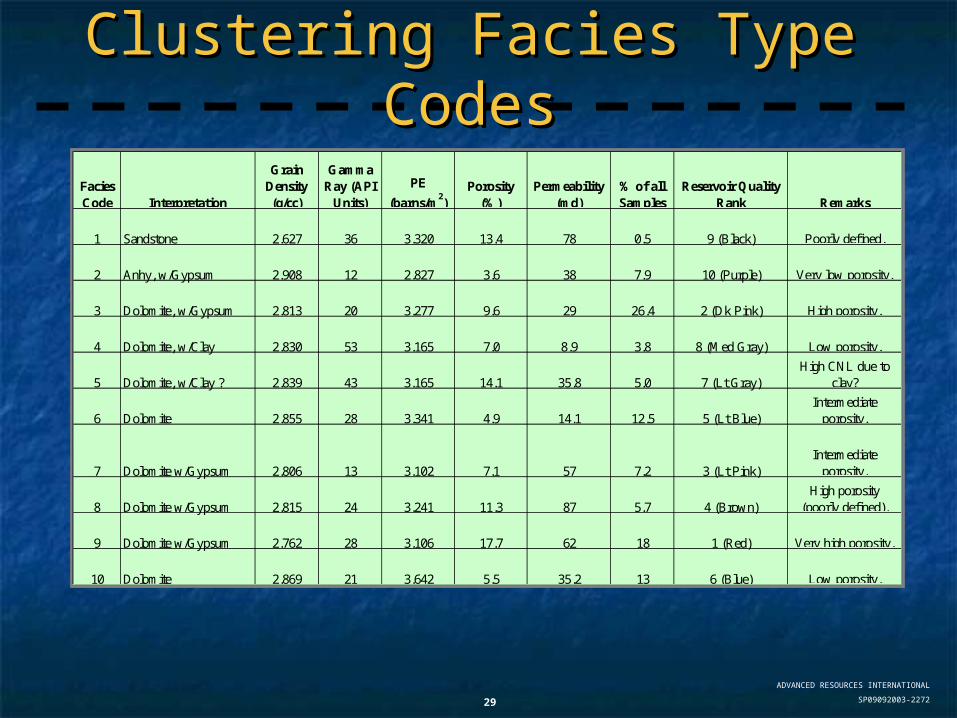
Clustering Facies Type Clustering Facies Type CodesCodes
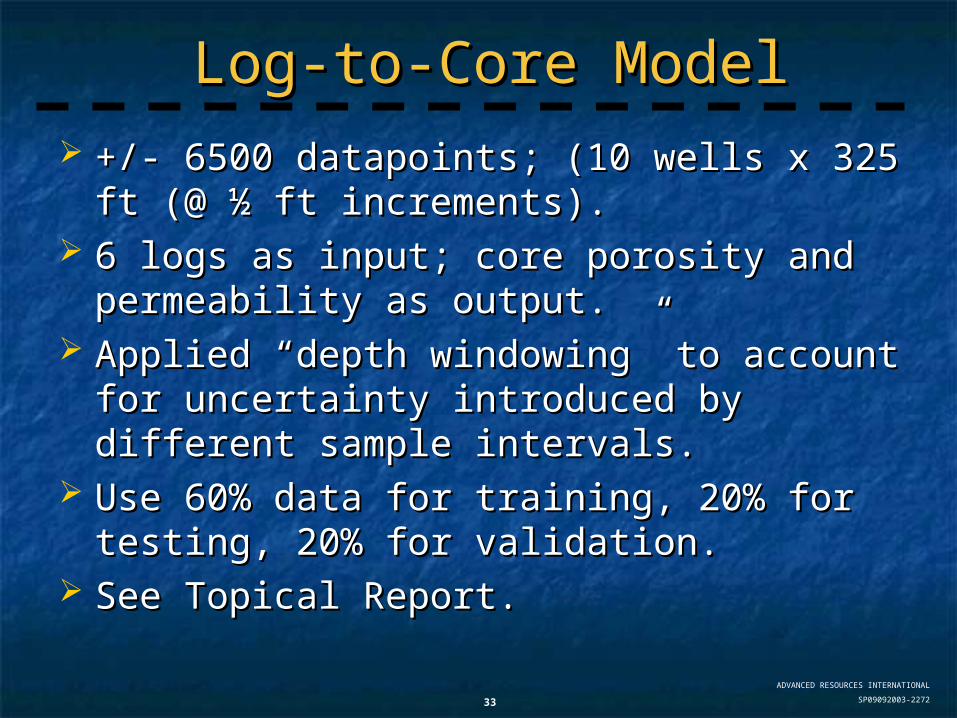
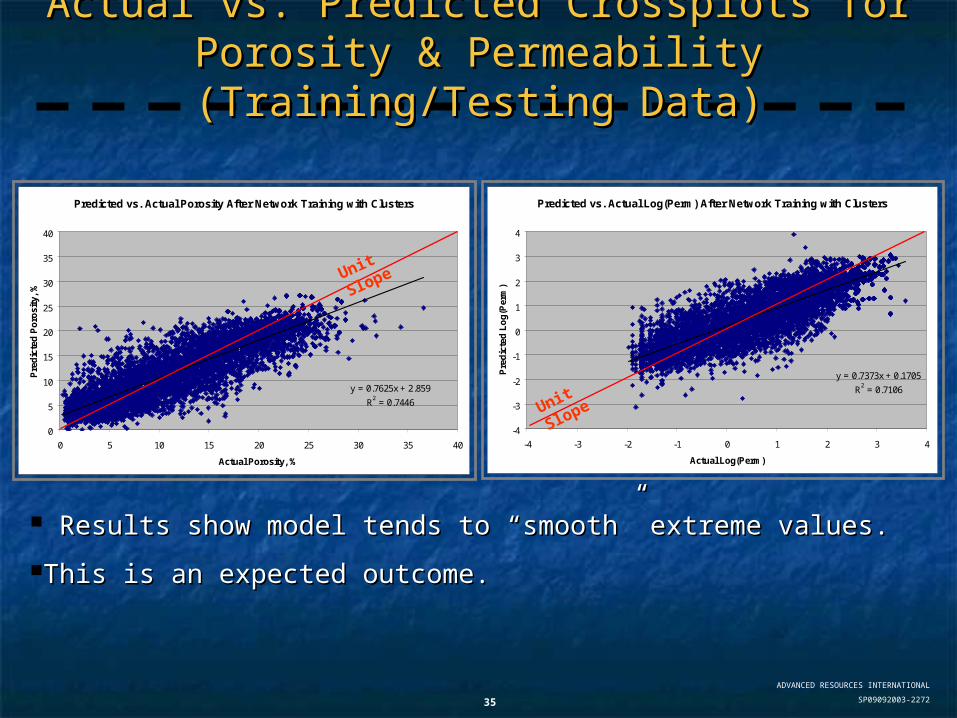
Actual vs. Predicted Crossplots for Porosity & Actual vs. Predicted Crossplots for Porosity & Permeability (Training/Testing Data)Permeability (Training/Testing Data)
Results show model tends to “smooth” extreme values.Results show model tends to “smooth” extreme values.
This is an expected outcome.This is an expected outcome.
Predicted vs. Actual Porosity After Network Training with Clusters
y = 0.7625x + 2.859
R2 = 0.7446
0
5
10
15
20
25
30
35
40
0 5 10 15 20 25 30 35 40
Actual Porosity, %
Pre
dic
ted
Po
rosi
ty,
%
Predicted vs. Actual Log(Perm) After Network Training with Clusters
y = 0.7373x + 0.1705
R2 = 0.7106
-4
-3
-2
-1
0
1
2
3
4
-4 -3 -2 -1 0 1 2 3 4
Actual Log(Perm)
Pre
dic
ted
Lo
g(P
erm
)
Unit
Slope
Unit
Slope
ADVANCED RESOURCES INTERNATIONAL
SP09092003-227236
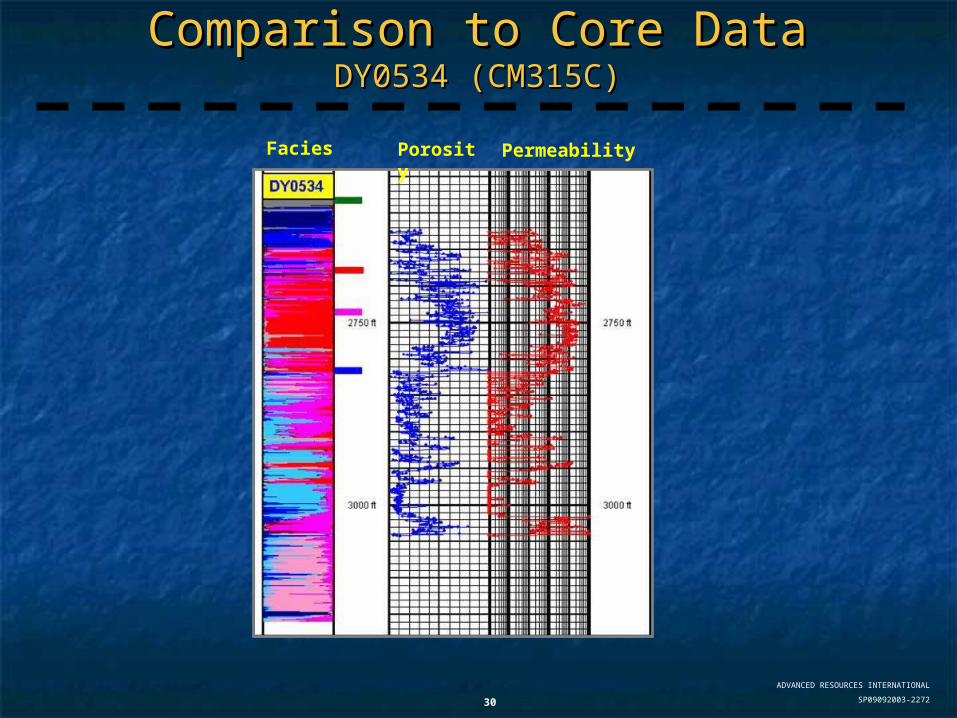
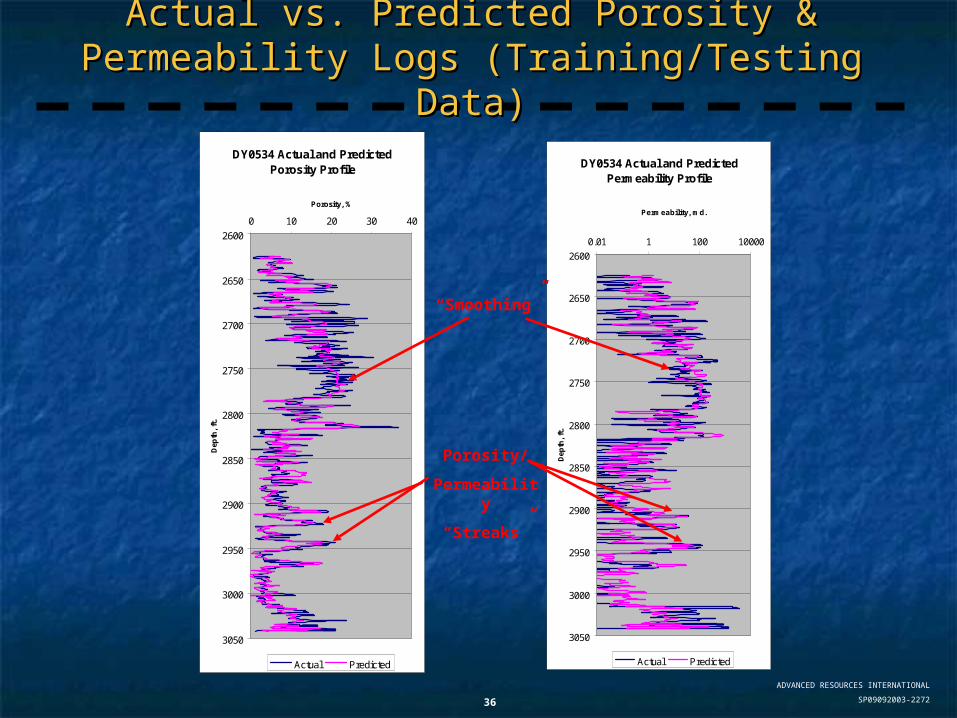
Actual vs. Predicted Porosity & Permeability Actual vs. Predicted Porosity & Permeability Logs (Training/Testing Data)Logs (Training/Testing Data)
DY0534 Actual and Predicted Porosity Profile
2600
2650
2700
2750
2800
2850
2900
2950
3000
3050
0 10 20 30 40
Porosity, %D
epth
, ft
.
Actual Predicted
DY0534 Actual and Predicted Permeability Profile
2600
2650
2700
2750
2800
2850
2900
2950
3000
3050
0.01 1 100 10000
Permeability, md.
Dep
th,
ft.
Actual Predicted
“Smoothing”
Porosity/
Permeability
“Streaks”
ADVANCED RESOURCES INTERNATIONAL
SP09092003-227237
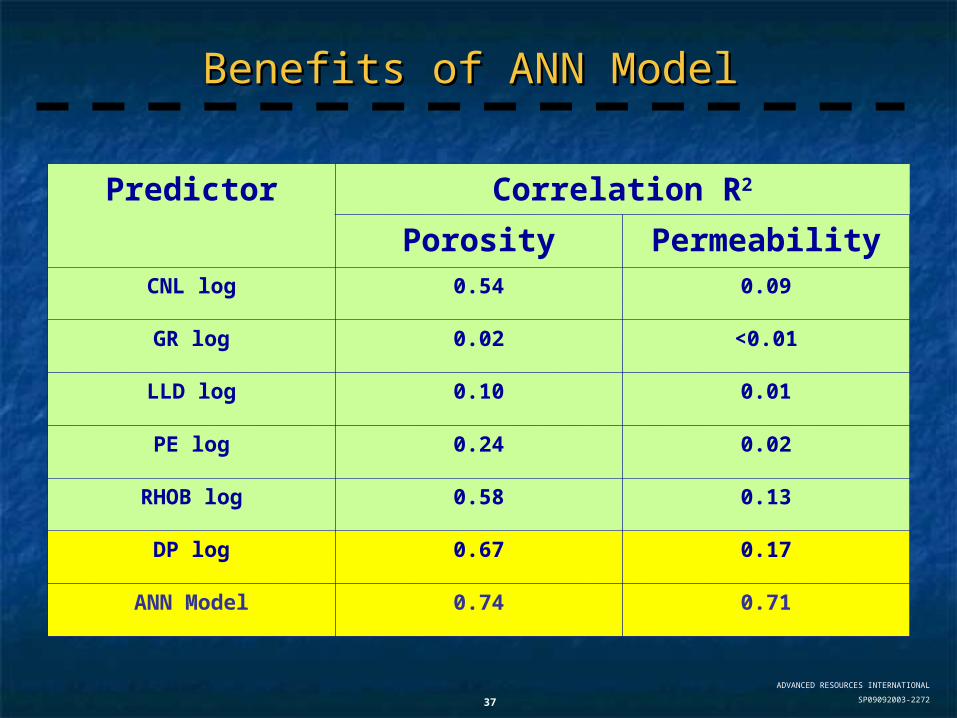
Benefits of ANN ModelBenefits of ANN Model
Predictor Correlation R2
Porosity PermeabilityCNL log 0.54 0.09
GR log 0.02 <0.01
LLD log 0.10 0.01
PE log 0.24 0.02
RHOB log 0.58 0.13
DP log 0.67 0.17
ANN Model 0.74 0.71
ADVANCED RESOURCES INTERNATIONAL
SP09092003-227238
Presentation OutlinePresentation Outline
Background and Project DescriptionBackground and Project Description Data availability and Preliminary Data availability and Preliminary
ProcessingProcessing Model BuildingModel Building Accomplishments & Next StepsAccomplishments & Next Steps
ADVANCED RESOURCES INTERNATIONAL
SP09092003-227239
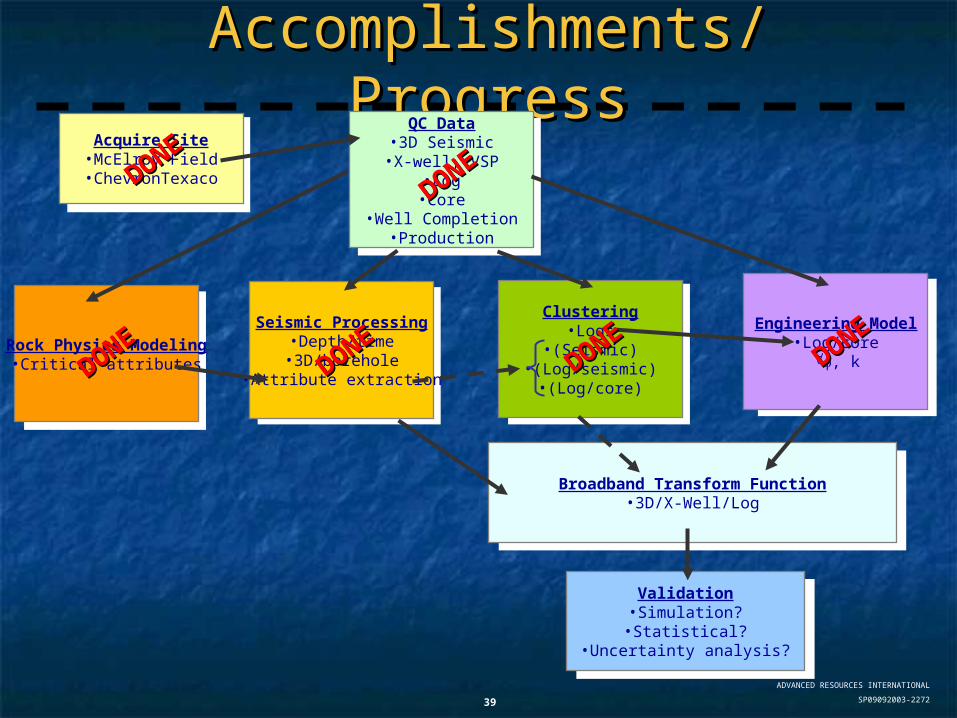
Accomplishments/ProgressAccomplishments/ProgressQC Data
•3D Seismic•X-well, VSP
•Log•Core
•Well Completion•Production
Clustering•Logs
•(Seismic)•(Log/seismic)
•(Log/core)
Seismic Processing•Depth/time•3D/borehole
•Attribute extraction
Engineering Model•Log/core
, k
Broadband Transform Function•3D/X-Well/Log
Validation•Simulation?•Statistical?
•Uncertainty analysis?
DONE
DONE
DONE
DONEDONE
DONEDONE
DONE
Acquire Site•McElroy Field
•ChevronTexacoDONE
DONE
Rock Physics Modeling•Critical attributes
DONE
DONE
ADVANCED RESOURCES INTERNATIONAL
SP09092003-227240
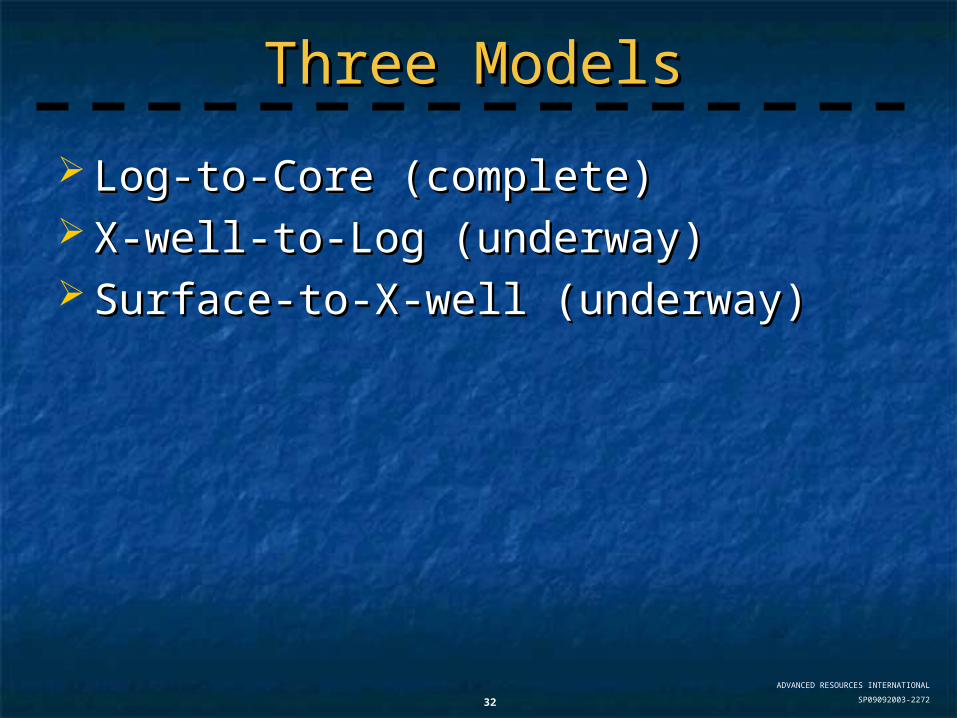
Current FocusCurrent Focus
X-well-to-Log ModelX-well-to-Log Model Surface-to-X-well ModelSurface-to-X-well Model Automate Predictive WorkflowAutomate Predictive Workflow Generate Hi Res 3D Ø and k Generate Hi Res 3D Ø and k
Volumes.Volumes.
ADVANCED RESOURCES INTERNATIONAL
SP09092003-227241
X-well-to-Log ModelX-well-to-Log Model
+/- 2,000 datapoints (3 wells x 325 ft/well x +/- 2,000 datapoints (3 wells x 325 ft/well x ½ ft sample interval).½ ft sample interval).
Increasing to almost 5,000 by using multiple traces.Increasing to almost 5,000 by using multiple traces.
11 X-well attributes as input; 6 logs as 11 X-well attributes as input; 6 logs as output.output.
Will evaluate applicability of “depth windowing”.Will evaluate applicability of “depth windowing”.
60% for training, 20% for testing, 20% for 60% for training, 20% for testing, 20% for validation.validation.
ADVANCED RESOURCES INTERNATIONAL
SP09092003-227242
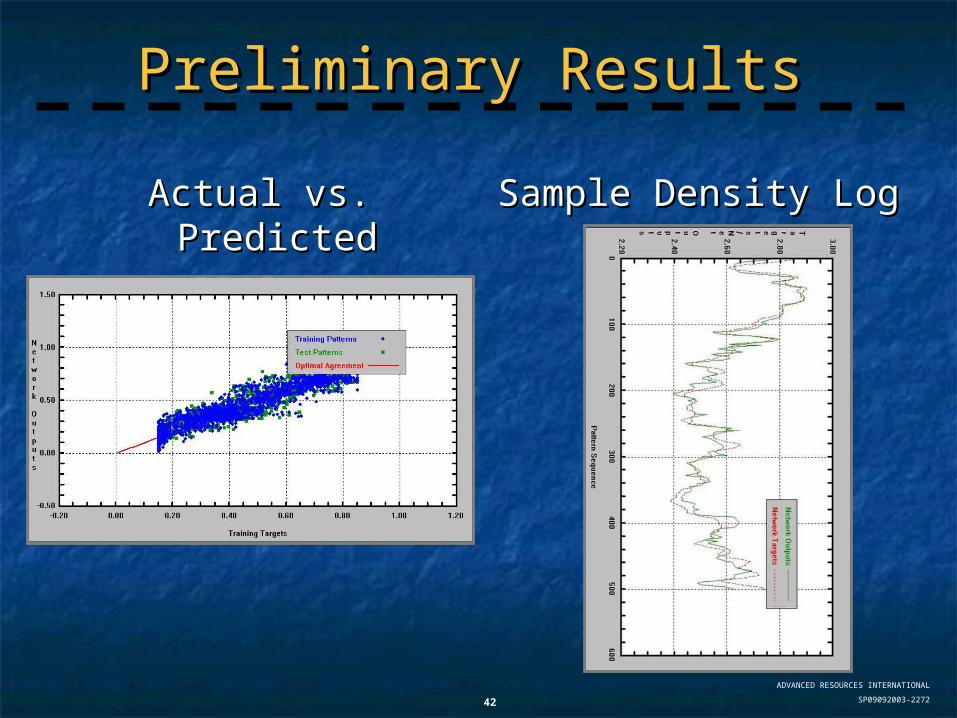
Preliminary ResultsPreliminary Results
Actual vs. PredictedActual vs. Predicted
(all logs)(all logs)Sample Density LogSample Density Log
ADVANCED RESOURCES INTERNATIONAL
SP09092003-227243
Surface-to-X-well ModelSurface-to-X-well Model
+/- 180,000 data points (135 +/- 180,000 data points (135 traces/line x 2 lines x 325 ft/trace x ½ traces/line x 2 lines x 325 ft/trace x ½ ft sample interval).ft sample interval).
11 surface seismic attributes as input; 11 surface seismic attributes as input; 11 X-well seismic attributes as output.11 X-well seismic attributes as output.
Will evaluate application of “depth windowing”.Will evaluate application of “depth windowing”.
60% for training, 20% for testing, 20% 60% for training, 20% for testing, 20% for validation.for validation.
ADVANCED RESOURCES INTERNATIONAL
SP09092003-227244
Workflow AutomationWorkflow Automation Need to generate 37 million prediction valuesNeed to generate 37 million prediction values
Data cube is 1.8 mi x 1.8 mi x 300 ftData cube is 1.8 mi x 1.8 mi x 300 ft 55 ft horizontal resolution (bin spacing)55 ft horizontal resolution (bin spacing) ½ ft vertical resolution (core sampling interval)½ ft vertical resolution (core sampling interval)
176 inlines x 176 crosslines (≈ 31,000 traces)176 inlines x 176 crosslines (≈ 31,000 traces) 300 ft interval300 ft interval ½ ft increments½ ft increments Ø, kØ, k
Scripts being used to feed each 3D seismic trace Scripts being used to feed each 3D seismic trace through each model:through each model:
Timing: Expect to be finished and have 3D Ø/k cube by Timing: Expect to be finished and have 3D Ø/k cube by end of September.end of September.
ADVANCED RESOURCES INTERNATIONAL
SP09092003-227245
ValidationValidation Compare predictions to two cored wells not Compare predictions to two cored wells not
used in study.used in study. Compare predictions to all logs/core, and as Compare predictions to all logs/core, and as
a function of distance from central study a function of distance from central study area.area.
Compare predictions to results of time-Compare predictions to results of time-lapse crosswell survey (pre- vs. post-steam)lapse crosswell survey (pre- vs. post-steam)
Compare predictions to ChevronTexaco’s Compare predictions to ChevronTexaco’s existing inversion model.existing inversion model.