March 2014 Technical Memorandum: UCPRC-TM-2014-03 Development of Hot Mix Asphalt Pavement Performance Properties for Long-Life Pavement Design: Caltrans District 2, Interstate 5, Red Bluff, California Version 1 Authors: James Signore, Bor-Wen Tsai, and Carl L. Monismith Work Conducted as Part of Partnered Pavement Research Center Strategic Plan Element No. 3.18.2: Long-Life Pavement Design for Districts 2 and 4, Interstate 5 Red Bluff and Weed, Interstate 80 Dixon PREPARED FOR: California Department of Transportation Division of Research, Innovation and System Information Office of Roadway Research PREPARED BY: University of California Pavement Research Center UC Davis, UC Berkeley
Transcript
March 2014 Technical Memorandum: UCPRC-TM-2014-03
Development of Hot Mix Asphalt Pavement Performance Properties for
Long-Life Pavement Design: Caltrans District 2, Interstate 5,
Red Bluff, California Version 1
Authors:James Signore, Bor-Wen Tsai, and Carl L. Monismith
Work Conducted as Part of Partnered Pavement Research Center
Strategic Plan Element No. 3.18.2: Long-Life Pavement Design for Districts 2 and 4, Interstate 5 Red Bluff and Weed,
Interstate 80 Dixon
PREPARED FOR: California Department of Transportation Division of Research, Innovation and System
UCPRC-TM-2014-03Title: Development of Hot Mix Asphalt Pavement Performance Properties for Long-life Pavement Design: Caltrans
District 2, Interstate 5, Red Bluff, California Authors: J. Signore, B.-W. Tsai, and C. L. Monismith Caltrans Technical Lead: I. Basheer Prepared for: California Department of Transportation Division of Research, Innovation and System Information Office of Roadway Research
FHWA No.:CA152356A
Date Work Submitted:
October 2012
Publication Date:
October 2016
Strategic Plan Element No.: SPE 3.18.2
Caltrans Project No.: 2356
Status:Stage 6
Version No.:1
Abstract:
In the period 2012 to 2014, Caltrans designed and built three long-life asphalt pavement (LLAP) rehabilitation projects. Two projects were in District 2 on Interstate 5 and one was in District 4 on Interstate 80. This technical memorandum describes the processes by which performance-related test criteria were developed for a pavement section on the project on Interstate 5 just north of Red Bluff, California. The pavement section was designed and constructed as an LLAP section consisting of the following pavement components:
A hot mix asphalt (HMA) surface course containing a polymer-modified asphalt (PG 64-28PM), 15 percent reclaimed asphalt pavement (RAP), and a representative aggregate from the Red Bluff area treated with 1.2 percent lime (marinated)
An HMA intermediate course containing a conventional asphalt binder (PG 64-10) and the same lime-treated aggregate as the surface course plus 25 percent RAP
An HMA rich bottom layer containing conventional asphalt binder (PG 64-10) and the same lime-treated aggregate as the intermediate course, and containing 15 percent RAP
Representative materials were obtained by Caltrans District 2 from the Red Bluff area for the testing to develop the design and performance-related specifications for this project. During the testing of these materials some changes were made in the mix specifications regarding the asphalt binder grade and the inclusion of RAP in the surface mix and in the rich bottom mix; these are described in this memorandum. Caltrans headquarters staff from the Office of Flexible Pavement (formerly the Division of Flexible Pavement) designed the structural pavement sections using material parameters developed from AASHTO T 320 shear testing and AASHTO T 321 fatigue and stiffness testing results. To properly establish testing protocols and parameters, it was also necessary to investigate traffic loading and environmental factors as part of the study. This testing produced the performance-related testing criteria that were included in the project specifications and bid documents. In addition to the AASHTO T 320 and T 321 results used for design and performance-related specifications, results from AASHTO T 324 Hamburg Wheel-Track Testing (HWTT) were required in the performance-based specifications as a consideration for moisture sensitivity. The HWTT results were not used in the design process.
Keywords: Long-life asphalt pavement; reclaimed asphalt pavement (RAP); hot mix asphalt (HMA), shear, fatigue, stiffness and Hamburg Wheel-Track Testing; HMA performance-based specifications Proposals for Implementation: Use HMA shear, fatigue, and stiffness data for structural pavement section design; use these test data and HWTT data to develop performance-based HMA specifications; following construction, provide systematic and periodic pavement performance evaluations for at least five years, and preferably longer.
DISTRIBUTION Stage 5
iii
Related Documents: Monismith, C.L., J.T. Harvey, B.-W. Tsai, F. Long, and J. Signore. 2009. The Phase 1 I-710 Freeway Rehabilitation
Project: Initial Design (1999) to Performance after Five Years of Traffic (2008): Summary Report. (UCPRC-SR-2008-04).
Signore, J. M., B.W. Tsai,, C. L. Monismith. 2014. Development of Hot Mix Asphalt Pavement Performance Properties for Long-Life Pavement Design: Caltrans District 2, Interstate 5, Weed, California. (UCPRC-TM-2014-04).
Signore, J.M., and C.L. Monismith. 2014. Development of Hot Mix Asphalt Pavement Performance Properties for Long-Life Pavement Design: Caltrans District 4, Interstate 80, Solano County, California. (UCPRC-TM-2014-05).
Signatures J. Signore First Author
J. T. Harvey Technical Reviewer
D. Spinner Editor
C. L. Monismith/J. Signore Principal Investigators
I. Basheer Caltrans Technical Lead
T. J. Holland Caltrans Contract Manager
UCPRC-TM-2014-03 iv
DISCLAIMER STATEMENT
This document is disseminated in the interest of information exchange. The contents of this report reflect the
views of the authors who are responsible for the facts and accuracy of the data presented herein. The contents do
not necessarily reflect the official views or policies of the State of California or the Federal Highway
Administration. This publication does not constitute a standard, specification or regulation. This report does not
constitute an endorsement by the Department of any product described herein.
For individuals with sensory disabilities, this document is available in alternate formats. For information, call
(916) 654-8899, TTY 711, or write to California Department of Transportation, Division of Research,
Innovation and System Information, MS-83, P.O. Box 942873, Sacramento, CA 94273-0001.
PROJECT OBJECTIVES
The objectives of Partnered Pavement Research Center Strategic Plan Element (PPRC SPE) 3.18.2 were to
further develop methods for the mechanistic-empirical (M-E) design of flexible pavements, to validate and
improve the process of flexible pavement design and rehabilitation, and to add new information to the State
Standard Materials Library available in the design software CalME.
The long-life asphalt pavement (LLAP) design portion of this SPE had the following objectives:
1. Identification of pilot projects to be utilized for LLAP designs
2. Obtaining representative materials and establishing performance-related test specifications (criteria) for
each of the mixes in the pavement design used on each project
3. Creating asphalt concrete (AC) long-life pavement designs, utilizing M-E concepts for each project
To accomplish these objectives, three long-life pavements were designed and constructed: one on Interstate 5
near Red Bluff, one on Interstate 5 near Weed, and one on Interstate 80 near Dixon.
UCPRC-TM-2014-03 v
TABLE OF CONTENTS
Project Objectives ................................................................................................................................................ iv List of Tables ........................................................................................................................................................ vi List of Figures ...................................................................................................................................................... vii List of Abbreviations ............................................................................................................................................ ix List of Test Methods and Specifications .............................................................................................................. x 1 Introduction .................................................................................................................................................... 1
1.1 Background ............................................................................................................................................ 1 1.2 The Specification Development Process ............................................................................................... 1
1.2.1 Red Bluff Long-Life Asphalt Pavement Design ........................................................................... 2 1.2.2 Development of Performance-Based Specifications by UCPRC .................................................. 3
References ............................................................................................................................................................ 30 Appendix A: Shear Test Mix Results ................................................................................................................ 31 Appendix B: Fatigue and Stiffness Test Mix Results ....................................................................................... 38 Appendix C: Hamburg Wheel-Track Testing Results ..................................................................................... 48 Appendix D: CT 371 Test Results ...................................................................................................................... 56 Appendix E: Development of Fatigue and Stiffness Mix Performance Test Requirements ......................... 57
UCPRC-TM-2014-03 vi
LIST OF TABLES
Table 2.1: Aggregate Properties .............................................................................................................................. 6 Table 2.2: Binder Properties: Red Bluff Project ..................................................................................................... 7 Table 2.3: Binder Properties for December 2010 Valero Binder, Binder from Cores, and Binder from RAP
Determined from MACTEC Tests .................................................................................................................... 9 Table 2.4: Binder Properties for December 2010 Valero Binder and for Blends of Valero Binder and Extracted
Binders Determined from MACTEC Tests .................................................................................................... 10 Table 5.1: Suggested Fatigue Performance Requirements at 200 x 10-6 and 400 x 10-6 Strain ............................ 25 Table 5.2: Suggested Flexural Stiffness Performance Mixes ................................................................................ 26 Table 6.1: Recommended HMA Mix Performance Requirements for Red Bluff Project .................................... 28 Table A.1: Summary of Shear Test Results at 55°C for the Red Bluff PG 64-28PM
Mix Design (LMLC Without Lime) ............................................................................................................... 31 Table A.2: Summary of Shear Test Results for PG 64-28PM Lime Mixes (ME, Red Bluff Project, LMLC) ..... 32 Table A.3: Summary of Shear Test Results for PG 64-10, R25, Lime Mixes (ME, Red Bluff Project, LMLC) . 33 Table A.4: Summary of Shear Test Results for PG 64-10 Mix Design (LMLC) Without Lime .......................... 33 Table B.1: Summary of Fatigue Test Results, Red Bluff Project (20°C, LMLC, 1.2% Lime) ............................. 38 Table B.2: Summary of Frequency Sweep Test Results, Red Bluff Project, PG 64-10 RB Mix (1.2% Lime,
AC = 5.5%, AV = 3%) ................................................................................................................................... 39 Table B.3: Summary of Frequency Sweep Test Results, Red Bluff Project, PG 64-10 (25% RAP, 1.2% Lime,
AC = 5.38% [Virgin Aggregate Basis], AV = 6.0%) ..................................................................................... 40 Table B.4: Summary of Frequency Sweep Test Results Red Bluff Project, PG 64-28PM
(1.2% Lime, AC = 5.0%, AV = 6.0%) ........................................................................................................... 41 Table B.5: Summary of Master Curves and Time-Temperature Relationships for Red Bluff Project ................. 42 Table C.1: Summary of Hamburg Wheel-Tracking Test Results, Red Bluff Project ........................................... 48 Table D.1: Summary of CT 371 TSR Results of Red Bluff Project ..................................................................... 56 Table E.1: Lower Bound Construction of 95% Confidence Band for PG 64-10 RB, 15% RAP, PG 64-10,
25% RAP, and PG 64-28PM, 15% RAP Mixes ............................................................................................. 57
UCPRC-TM-2014-03 vii
LIST OF FIGURES
Figure 2.1: Red Bluff Project aggregate gradings with 25 percent RAP and without RAP. ................................... 5 Figure 3.1: Seven-day moving average of maximum daily surface temperatures and temperatures at a 2 inch
depth for Sacramento based on an analysis using the ICM. ........................................................................... 13 Figure 3.2: Seven-day moving average of maximum daily air temperatures for Cottonwood, Sacramento,
Red Bluff, Redding, and Weed. ...................................................................................................................... 14 Figure 4.1: Ln (repetitions to 5 percent p) versus binder content at 55ºC for Red Bluff PG 64-28PM mix
(without lime). ................................................................................................................................................ 17 Figure 4.2: Fatigue test summary for the Red Bluff project. ................................................................................ 18 Figure 4.3: Summary of stiffness (E*) master curves, Red Bluff project. ............................................................ 18 Figure 4.4: Summary of temperature-shifting relationship (ln aT), Red Bluff project. ......................................... 19 Figure 4.5: Summary of average rut depths (PG 64-10 RAP with lime), Red Bluff Project. ............................... 20 Figure 4.6: Summary of average rut depths (PG 64-10 RB with lime), Red Bluff Project................................... 21 Figure 4.7: Summary of average rut depths (PG 64-28PM with lime), Red Bluff Project. .................................. 21 Figure 5.1: Fatigue 95% confidence bands (PG 64-10 15% RAP RB with 1.2% lime, AC = 5.5%, AV = 3%;
[excluding 6A2 and 7A2 tests]). ..................................................................................................................... 23 Figure A.1: Ln (shear modulus, G) versus binder content for Red Bluff PG 64-28PM mix (55°C, 70 kPa shear
stress, without lime). ....................................................................................................................................... 34 Figure A.2: Ln (permanent shear strain, p after 5,000 load repetitions) versus binder content for Red Bluff
PG 64-28PM mix (55°C, 70 kPa shear stress, without lime). ........................................................................ 34 Figure A.3: Ln (load for repetitions at γp= 5%) versus binder content for Red Bluff PG 64-28PM mix
(55°C, 70 kPa shear stress, without lime). ...................................................................................................... 35 Figure A.4: Summary of shear test results at 45ºC, Ln (Ln(γp)) versus Ln (load repetitions), PG 64-28PM mix
(ME, Red Bluff Project, AC = 5.2% [by weight of aggregate plus lime], 1.2% lime, AV = 3.0%, LMLC). . 35 Figure A.5: Summary of shear test results at 55ºC, Ln (Lnγp) versus Ln (load repetitions), PG 64-28PM mix,
(ME, Red Bluff Project, AC = 5.2% [by weight of virgin aggregate plus lime], AV = 3.0%, LMLC). ........ 36 Figure A.6: Summary of shear test results at 45ºC, Ln (Lnγp) versus Ln (load repetitions), PG 64-10
mix (ME, Red Bluff Project, AC = 5.38% [by weight of virgin aggregate plus lime], 25% RAP, 1.2% lime, AV = 3.0%, LMLC). .................................................................................................. 36
Figure A.7: Ln (p at 5,000 load repetitions) at three shear stress levels and at 45ºC and 55ºC; Red Bluff Project (PG 64-28PM and PG 64-10 mixes). .............................................................................................................. 37
Figure A.8: Ln (G) at three shear stress levels and at 45ºC and 55ºC; Red Bluff Project (PG 64-28PM and PG 64-10 mixes). ............................................................................................................................................ 37
Figure B.1: Summary of fatigue test results, Red Bluff (PG 64-10 RB with 1.2% lime, AC = 5.5%, AV = 3.0%). ........................................................................................................................................................................ 43
Figure B.2: Summary of fatigue test results, Red Bluff (PG 64-10 25% RAP, 1.2% lime, AC* = 5.38% [by weight of virgin aggregate]). .......................................................................................................................... 43
Figure B.3: Summary of fatigue test results, Red Bluff (PG 64-28PM, 1.2%, AC = 5.2%, AV = 6%). .............. 44 Figure B.4: E* master curve, Red Bluff Project (PG 64-10 RB, 1.2% lime, AC = 5.5%, AV =3%). .................. 44 Figure B.5: Temperature-shifting relationship, Red Bluff Project (PG 64-10 RB, 1.2% lime, AC = 5.5%,
AV = 3%). ...................................................................................................................................................... 45 Figure B.6: E* master curve, Red Bluff Project (PG 64-10 25% RAP, 1.2% lime, AC* = 5.38% [by weight of
virgin aggregate], AV = 6.0%). ...................................................................................................................... 45 Figure B.7: Temperature-shifting relationship, Red Bluff Project (PG 64-10 25% RAP, 1.2% lime,
AC* = 5.38% [by weight of virgin aggregate], AV = 6.0%). ......................................................................... 46 Figure B.8: E* master curve, Red Bluff Project (PG 64-28PM, 1.2% lime, AC = 5.2%,AV = 6.0%). ................ 46 Figure B.9: Temperature-shifting relationship, Red Bluff Project (PG 64-28PM, 1.2% lime, AC = 5.2%,
AV = 6.0%). ................................................................................................................................................... 47 Figure C.1: HWTT summary of Red Bluff, PG 64-28PM 15% RAP with 1.2% lime. ........................................ 49
UCPRC-TM-2014-03 viii
Figure C.2: Rutting evolution image and contour plots for PG 64-10 RB mix set #1 after 80,000 passes: (a) original data (lt.), (b) original data (rt.), (c) smoothed in “number of passes” direction (lt.), and (d) smoothed in “number of passes” direction (rt.) (by UCPRC). .................................................................. 50
Figure C.3: Rutting evolution image and contour plots for PG 64-10 RB mix set #2 after 20,000 passes: (a) original data (lt.), (b) original data (rt.), (c) smoothed in “number of passes” direction (lt.), and (d) smoothed in “number of passes” direction (rt.) (by Caltrans). ................................................................. 51
Figure C.4: Rutting evolution image and contour plots for PG 64-10 RAP with lime mix set #1 after 65,150 passes: (a) original data (lt.), (b) original data (rt.), (c) smoothed in “number of passes” direction (lt.), and (d) smoothed in “number of passes” direction (rt.) (by UCPRC). .................................................................. 52
Figure C.5: Rutting evolution image and contour plots for PG 64-10 RAP with lime mix set #2 after 20,000 passes: (a) original data (lt.), (b) original data (rt.), (c) smoothed in “number of passes” direction (lt.), and (d) smoothed in “number of passes” direction (rt.) (by Caltrans). ................................................................. 53
Figure C.6: Rutting evolution image and contour plots for PG 64-28PM 15%RAP with lime mix set #1 after 26,850 passes: (a) original data (lt.), (b) original data (rt.), (c) smoothed in “number of passes” direction (lt.), and (d) smoothed in “number of passes” direction (rt.) (by UCPRC). ................................................... 54
Figure C.7: Rutting evolution image and contour plots for PG 64-28PM with lime mix set #2 after 40,000 passes: (a) original data (lt.), (b) original data (rt.), (c) smoothed in “number of passes” direction (lt.), and (d) smoothed in “number of passes” direction (rt.) (by UCPRC). .................................................................. 55
Figure E.1: Fatigue 95% confidence band, PG 64-10 RB 15% RAP with lime (AC = 5.5%, AV = 3%). ........... 58 Figure E.2: Fatigue 95% confidence band, PG 64-10 25% RAP with lime (AC* = 5.38% [by weight of virgin
aggregate], AV = 6.0%). ................................................................................................................................. 58 Figure E.3: Fatigue 95% confidence band, PG 64-10 25% RAP with lime (AC* = 5.38% [by weight of virgin
aggregate], AV = 6.0%; excluding the 1C1 test). ........................................................................................... 59 Figure E.4: Fatigue 95% confidence band, PG 64-28PM 15% RAP with lime (AC = 5.2%, AV = 6.0%). ......... 59 Figure E.5: Fatigue 95% confidence band, PG 64-28PM 15% RAP with lime (AC = 5.2%, AV = 6.0%;
excluding the 1D2 and 5B1 tests). .................................................................................................................. 60 Figure E.6: Fatigue 95% confidence band, PG 64-28PM 15% RAP with lime (AC = 5.2%, AV = 6.0%;
excluding the 1D2 test). .................................................................................................................................. 60
UCPRC-TM-2014-03 ix
LIST OF ABBREVIATIONS
AASHTO American Association of State Highway and Transportation Officials
AC Asphalt concrete
ASTM American Society for Testing and Materials
CDF Cumulative distribution function
CT Caltrans
GC Clayey gravel
HMA Hot mix asphalt
HWTT Hamburg Wheel-Track Testing
ICM Integrated Climate Model
JPCP Jointed plain concrete pavement
LLAP Long-life asphalt pavement
LMLC Laboratory-mixed, laboratory-compacted
ME Mechanistic-Empirical
NCDC National Climate Data Center
PCC Portland cement concrete
PPRC Partnered Pavement Research Center
RAP Reclaimed Asphalt Pavement
RB Rich bottom
RSCH Repeated simple shear test at constant height
RWC Rolling wheel compaction
SF Shift factor
SHRP Strategic Highway Research Program
SPE Strategic Plan Element
SSD Saturated Surface Dry
SSP Standard Special Provisions
TCF Temperature Conversion Factor
UCPRC University of California Pavement Research Center
WIM Weigh-in-motion
UCPRC-TM-2014-03 x
LIST OF TEST METHODS AND SPECIFICATIONS
AASHTO T 209
Standard Method of Test for Theoretical Maximum Specific Gravity (Gmm) and Density of Hot Mix Asphalt (HMA)
AASHTO T 320
Standard Method of Test for Determining the Permanent Shear Strain and Stiffness of Asphalt Mixtures Using the Superpave Shear Tester (SST)
AASHTO T 321
Standard Method of Test for Determining the Fatigue Life of Compacted Asphalt Mixtures Subjected to Repeated Flexural Bending
AASHTO T 324 (Modified)
Standard Method of Test for Hamburg Wheel-Track Testing of Compacted Hot-Mix Asphalt (HMA)
AASHTO PP3-94
Standard Practice for Quantifying Roughness of Pavements
ASTM D7312 Standard Test Method for Determining the Permanent Shear Strain and Complex Shear Modulus of Asphalt Mixtures Using the Superpave Shear Tester (SST)
ASTM D7460
Standard Test Method for Determining Fatigue Failure of Compacted Asphalt Concrete Subjected to Repeated Flexural Bending
LLP – AC2 Caltrans – Sample Preparation and Testing for Long-Life Hot Mix Asphalt Pavements
UCPRC-TM-2014-03 1
1 INTRODUCTION
1.1 Background
In early December 2009, a Long-Life Asphalt Pavement (LLAP) Technical Working Group for northern
California (consisting of Caltrans headquarters staff, Industry representatives, and researchers from the
University of California Pavement Research Center [UCPRC]) was convened to develop long-life pavement
projects on the state highway system in northern California. In 2010, a number of meetings were held in which
potential sites were discussed. In December of that year, Caltrans District 2—on the recommendation of
Mr. A. Benipal, the State Pavement Engineer—agreed to the use of two pavement sections in that district on
Interstate 5 (I-5) for design and construction as LLAP sections. One section is just north of the City of Red Bluff
(Tehama County, PM 37.0 – PM 41.5 NB/SB) and the other is north of the City of Weed (Siskiyou County,
PM 19.0 – PM 25.3 NB/SB). In 2012, a third LLAP project was initiated on Interstate 80 in District 4 (Solano
County, PM 30.6 – PM 38.70). (Note: In this memorandum, these are referred to as the Red Bluff, Weed, and
Solano projects, respectively.) A decision was made to conduct these projects under Caltrans/UCPRC Partnered
Pavement Research Center Strategic Plan (PPRC SPE) Number 3.15, which was changed soon after to
PPRC SPE 3.18.2.
This memorandum documents the collaboration between Caltrans and the UCPRC to finalize the mix designs, to
perform laboratory mix testing, and to establish the performance criteria for construction of the Red Bluff
section (This memo also occasionally addresses the Weed Project, which was conducted somewhat
concurrently).
1.2 The Specification Development Process
Long-life pavement design in California is based on lessons learned from the construction of the state’s first
LLAP project, the multiphase rehabilitation of the Long Beach Freeway, I-710, in Los Angeles County, which
began in 2001. Monismith et al. (1) summarized the lessons learned from the initial design through the
performance of that project after five years of traffic.
The current process for developing a performance specification for long-life asphalt concrete (AC) mix designs
requires a series of steps, including the selection of a location (including route and post mile range) and the
development of a conceptual pavement design, which in this case were both accomplished by Caltrans (see
Section 1.2.1).
UCPRC-TM-2014-03 2
1.2.1 Red Bluff Long-Life Asphalt Pavement Design
The Red Bluff long-life asphalt pavement (LLAP) section was selected by District 2 staff and then designed by
Caltrans headquarters staff using the California Mechanistic-Empirical Analysis and Design software program
(CalME) design methodology. The existing pavement primarily consisted of thick HMA above cement-treated
base (CTB), with a number of areas where the HMA was stripped at different depths below the surface. The
HMA had extensive alligator cracking in the wheelpaths and some cracking between the wheelpaths. The
pavement design assumed that the existing HMA layers would be removed, while the CTB, which was thought
to be generally intact based on coring and deflection testing, would be left in place.
Based on the availability of reclaimed asphalt pavement (RAP) materials, a decision was made that
consideration should be given to the use of more than 15 percent RAP (an option available to contractors in the
current Caltrans hot mix asphalt [HMA] specifications) in the appropriate layers of the structural pavement
sections. Further, based on the familiarity of District 2 staff with a number of aggregate sources in the district, a
decision was also made that all the HMA used in the project should contain 1.2 percent lime (based on the
weight of the virgin aggregate) applied using the process of marination rather than the alternative, which is the
application of dry lime on damp aggregate.
After a review of as-built information and use of CalME mechanistic-empirical design software by staff from
Caltrans headquarters and the UCPRC—and after consideration of the binder grades for the project area, the
structural condition of the pavement, and other distress types, including low temperature cracking—it was
decided that the pavement layers for the structural section for Red Bluff should consist of the following
components:
A hot mix (HMA) surface course containing a polymer-modified asphalt (PG 64-28PM) containing
15 percent RAP and a representative aggregate from the Red Bluff area treated with 1.2 percent lime
(marinated)
An HMA intermediate course containing a conventional asphalt binder (PG 64-10) and the same lime-
treated aggregate as the surface course plus 25 percent RAP
An HMA rich bottom layer containing conventional asphalt binder (PG 64-10) and the same lime-
treated aggregate as the intermediate course containing 15 percent RAP
After Caltrans delivered this information to the UCPRC, along with aggregates and asphalt materials considered
to represent those that potential bidding contractors would use to construct the Red Bluff pavement, UCPRC
commenced development of the performance-based specification following the steps presented in Section 1.2.2.
UCPRC-TM-2014-03 3
1.2.2 Development of Performance-Based Specifications by UCPRC
As noted, the LLAP Technical Working Group agreed that UCPRC staff would: (1) conduct the necessary
performance tests; (2) provide the required data for the structural pavement designs to Caltrans staff; and
(3) provide the requisite data for the mix performance requirements based on laboratory testing and the traffic
and environment (temperature) in the locations of the three long-life projects. UCPRC staff accomplished this
and developed the specifications for all the asphalt concrete (AC) mixes proposed for each location by following
these steps in Project SPE 3.18.2:
1. Working with local District Materials Engineer (DMEs) and the Division of Asphalt Pavement (later
changed to the Office of Asphalt Pavement), the UCPRC developed mix designs from the materials
identified as potential sources of aggregate and binder that local contractors might use.
2. Using site-specific temperature data (in this case, from the Red Bluff area) and corresponding traffic
data provided by Caltrans, UCPRC developed the minimal performance requirements (i.e., performance
specifications) for AASHTO T 3201 (Repeated Simple Shear Constant Height, RSCH) testing, which is
based on the procedure developed by UCPRC researchers and reported in SHRP-A 415 (7).
3. UCPRC performed RSCH testing at the climate-based temperature calculated in Step 2 to determine the
Optimum Binder Content (OBC) for the mixes using the materials identified by District 2.
4. Following AASHTO T 321 (flexural fatigue and stiffness), UCPRC laboratory staff prepared specimens
at the mix OBCs developed in Step 3, and then tested them. Subsequent statistical analyses of the T 321
test results were conducted and, based upon these results, flexural fatigue and stiffness specifications
(i.e., performance requirements) were developed.
5. Moisture sensitivity testing was accomplished using the HWTT, which was conducted at 50°C. The test
parameters (i.e., performance requirements) recommended were those included in the Caltrans standard
specifications: 12.5 mm maximum rutting at 20,000 cycles.
Once this process concluded, the UCPRC provided performance-based specifications to Caltrans that were
specific for the construction of the Red Bluff project. The same process was used for the Weed project using
materials identified by District 2 near that site, and for the Solano project using the Red Bluff materials data and
traffic and pavement temperature data specific to the Solano site.
1 Modified according to the Lab Procedure, LLP-AC2, “Sample Preparation and Testing for Long-Life Hot Mix Asphalt Pavements,” available at www.dot.ca.gov/hq/esc/Translab/ormt/pdf/LLP-AC2_Sample_Preparation_for_LL_HMA-Pavement.pdf.
UCPRC-TM-2014-03 4
This technical memorandum details these steps as they were carried out for the Red Bluff Project.
References (2) and (3) are technical memoranda that describe similar information for the Weed and Solano
projects, respectively.
Chapter 2 of this memorandum discusses the aggregates, asphalt binder, reclaimed asphalt pavement (RAP), and
lime materials used to create the Red Bluff test specimens. Chapter 3 discusses the traffic and temperature
estimates used to design and to determine material testing parameters. Chapter 4 presents the results of the
laboratory testing of the HMA mixes. Chapter 5 covers the development of the mix performance criteria for
shear (RSCH test), fatigue, and mix stiffness. Chapter 6 presents the recommended test specifications for shear,
fatigue, mix stiffness, and HWTT (the current Caltrans specification). Chapter 7 presents a project overview and
a recommendation based on this work. Appendixes A through E present the detailed results of the performance-
based testing.
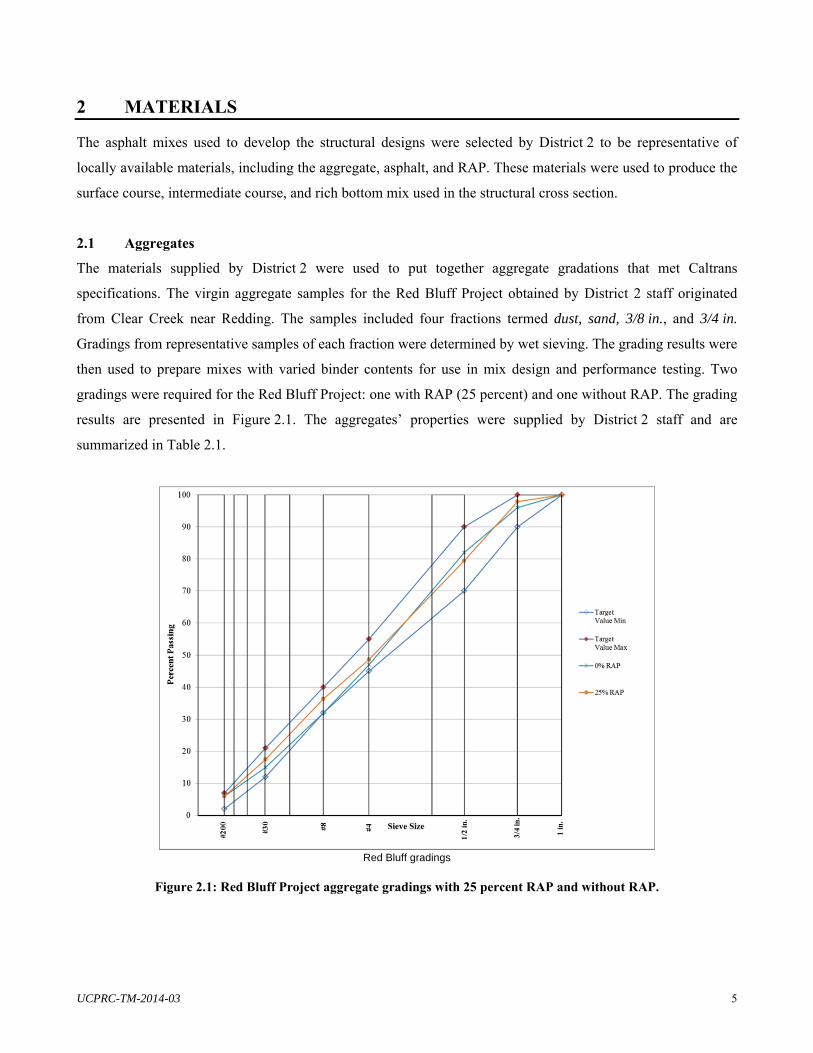
UCPRC-TM-2014-03 5
2 MATERIALS
The asphalt mixes used to develop the structural designs were selected by District 2 to be representative of
locally available materials, including the aggregate, asphalt, and RAP. These materials were used to produce the
surface course, intermediate course, and rich bottom mix used in the structural cross section.
2.1 Aggregates
The materials supplied by District 2 were used to put together aggregate gradations that met Caltrans
specifications. The virgin aggregate samples for the Red Bluff Project obtained by District 2 staff originated
from Clear Creek near Redding. The samples included four fractions termed dust, sand, 3/8 in., and 3/4 in.
Gradings from representative samples of each fraction were determined by wet sieving. The grading results were
then used to prepare mixes with varied binder contents for use in mix design and performance testing. Two
gradings were required for the Red Bluff Project: one with RAP (25 percent) and one without RAP. The grading
results are presented in Figure 2.1. The aggregates’ properties were supplied by District 2 staff and are
summarized in Table 2.1.
Red Bluff gradings
Figure 2.1: Red Bluff Project aggregate gradings with 25 percent RAP and without RAP.
UCPRC-TM-2014-03 6
At the outset of the project, it was agreed that RAP would not be used in the surface course. The performance
tests (shear, fatigue, and HWTT) were performed on this mix. After the tests were completed, and just prior to
construction, District 2 staff made the decision to introduce 15 percent RAP into the mix. Because the contract
documents had been already prepared and there was no time to test this mix with RAP, the performance criteria
in the specification were based on the mix without RAP.
Table 2.1: Aggregate Properties
Redding Clear Creek
Caltrans
Spec. Date Tested: 6/07 5/08 7/08
Test Method Property
CT 205
Crushed particles, coarse aggregate Two fractured face (%)
98 98
Crushed particles, coarse aggregate One fractured faces (%)
99 96
Crushed particles, fine aggregate (#4x#8) One fractured face (%)
98 97 98
CT 211 LA Rattler, loss at 100 rev. (%) 5 5 5 10 LA Rattler, loss at 500 rev. (%) 20 22 23 25
CT 217 Sand equivalent (avg.) 52 65 64 50 AASHTO
T 304 (Method A)
Fine aggregate angularity (%) 45.8 45
ASTM D4791 Flat and elongated particles % by mass @ 3:1 Flat and elongated particles % by mass @ 5:1 0 Report
CT 204 Plasticity index NP CT 229 Fine aggregate durability index 79 77 65
Coarse aggregate durability index 80 80 50
CT 303 Kc factor (not mandatory until further notice) Kf factor (not mandatory until further notice)
CT 206 Bulk specific gravity (oven dry), coarse
aggregate 2.62 2.65 2.639
Absorption, coarse aggregate 1.0 1.3 1.3 CT 207 Bulk specific gravity (SSD) of fine aggregate 2.527
LP-2 Bulk specific gravity (oven dry) of fine aggregate 2.451 CT 207 Absorption of fine aggregate 3.1
CT 208/LP-2 Apparent specific gravity of supplemental fines 2.381 LP-2 Bulk specific gravity of aggregate blend 2.575
CT 208 Specific gravity of fines apparent 2.64
2.2 Asphalt Binders
Two binders, PG 64-16 and PG 64-28PM, were supplied by the Valero Refinery in Benicia, California. The test
properties for these binders, which are summarized in Table 2.2, were obtained from Certificates of Compliance
from the laboratory at the Valero Benicia Asphalt Plant.
UCPRC-TM-2014-03 7
It should be noted that the Valero refinery does not supply the PG 64-10 binder listed in the Red Bluff project
specifications. While a PG 64-10 binder was called for, the PG 64-16 binder was acceptable to Caltrans since it
met all of the specification requirements for the PG 64-10 binder based on a comparison by the researchers of
the PG 64-16 binder test data from the Certificate of Compliance with the PG 64-10 binder specification
requirements. Note: In this technical memorandum, wherever PG 64-10 is referred to in figures or in binder or
performance testing tables, PG 64-16 was actually tested.
Table 2.2: Binder Properties: Red Bluff Project
Property
Caltrans Spec.
PG 64-16
Test Results
Red Bluff (PG 64-16)
Caltrans Spec.
PG 64-28PM
Test Results Red Bluff
(First Supply of
PG 64-28PM
AASHTO Test Method
Original Binder Flash Point, Min. C.O.C., ºC
230 296 230 276 T 48
Viscosity at 135ºC; Pa.s 3.0 0.430 3.0 0.740 T 316
Dynamic Shear: Test Temp, ºC Min. G*/sinkPa
64 64 64 64 T 315
1.0 1.61 1.0 1.64 Solubility in TCE Percent, Min.
99 100 98.5 99.9 T 44
RTFO Test Aged (RAP) Binder
RTFO Test Mass Loss, Max. %
-1.0 -0.121 -1.0 -0.249 T 240
Dynamic Shear: Test Temp. ºC
Min. G*/sinkPa
64 64 64 64
T 315 2.20 3.95 2.20 3.12
Max. @G*sin = 2.2 kPa, degrees
n/a n/a 80 64
Min. Ductility at 25°C, cm 75 100+ n/a n/a T 51 Min. Elastic Recovery@25% n/a n/a 75 84 T 301 PAV Aging Temperature °C
100
100
100
100
R 28
PAV Test Aged (RAP) Binder
Dynamic Shear: Test Temp, ºC
Max. G*sinkPa
28 28 22 22 T 315
5,000 2,580 5,000 1,010 Bending Beam Rheometer:
Test Temp. °C Max. S-Value, MPa
Min. M-Value
-6 -6 -18 -18 T 313
300 79 300 72 0.300 0.386 0.300 0.356
n/a, not applicable
UCPRC-TM-2014-03 8
Valero supplied PG 64-28PM twice. The first supply, taken from the last of Valero’s 2010 production (from a
very limited supply that they were required to keep on hand), was delivered in October 2010 and the second one
was delivered in June 2011. The timing of the delivery of the first batch supplied allowed UCPRC staff to start
mix performance testing early in 2011 and enabled development of the mix performance criteria in time to meet
the deadline for issuance of the bid documents.
The first supply of PG 64-28PM was tested October 5, 2010, and the second on June 4, 2011, by the Valero
laboratory. Test data from the first supply of PG 64-28PM binder are shown in Table 2.2. The PG 64-16 binder
was tested by the Valero laboratory on December 13, 2010; these binder test data are also included in Table 2.2.
2.3 Reclaimed Asphalt Pavement Material
District 2 staff provided the UCPRC with a supply of RAP considered to be representative of the HMA in the
existing pavement near the proposed Red Bluff Project rather than the actual RAP to be used for the project
because the latter was unavailable in sufficient quantities at the time of mix testing. In addition to this supply of
surrogate RAP for mix testing, a number of 3 inch (75 mm) diameter cores of the HMA pavement layer(s) were
extracted from the existing pavement for testing. The cores and other RAP material were sent to the MACTEC
Laboratory in Phoenix, Arizona so their extracted binder properties and the approximate binder contents of the
RAP millings and cores could be determined along with the gradations of the extracted aggregates. The
PG 64-16 binder supplied by Valero was also sent to MACTEC to determine the binder properties of blends of
the new (virgin) binder and of the binders extracted from the cores from the existing pavement and the RAP
millings from another source. Blends of the two extracted binders were obtained using the extracted binder
contents from the cores and RAP millings, the proportion of RAP, and the estimated binder content of the HMA
consisting of the new aggregate and RAP blend. Table 2.3 contains the results of the MACTEC tests on the
PG 64-16 binder received from Valero in December 2010 together with test results on the binders extracted
from the cores and RAP millings. Tests performed on blends of the PG 64-16 and the RAP-extracted and core-
extracted binders were based on the following:
Binder contents determined by extraction were 4.77 percent for the cores and 5.51 percent for the RAP
millings.
Mixes containing virgin aggregate blended with 25 percent RAP from each of the sources were assumed
to have a binder content of 5.0 percent (by weight of aggregate basis).
The results of tests on blends of the PG 64-16 and the extracted binders from the cores and RAP millings are
summarized in Table 2.4. It should be noted that the resulting two blends in Table 2.4 produced the same
PG 70-22 grade classification although the second blend containing the millings resulted in a slightly higher
UCPRC-TM-2014-03 9
PG binder high temperature grade, 75°C versus 73°C, for the core data. These results suggest that using the
binders with added RAP in the Red Bluff project should not result in a rutting problem. Fatigue performance, on
the other hand, is affected by: HMA stiffness; level of tensile strain; layer thickness; and location of the layer in
the pavement structure. Because of this complexity, it is not possible to make a similar statement regarding the
effects of the blended binder on fatigue performance, as it is possible for rutting.
Table 2.3: Binder Properties for December 2010 Valero Binder, Binder from Cores, and Binder from RAP Determined from MACTEC Tests
Property
Caltrans Spec.
PG 64-16
Test Results
Original Binder
PG 64-16 Binder Extracted
from Cores
Binder Extracted from
RAP
AASHTO Test
Method Original Binder
Flash Point, Min. C.O.C., ºC
230
285
n/a
n/a
T 48
Viscosity at 135ºC; Pa.s 3.0 0.466 T 316 Dynamic Shear:
Test Temp, ºC Min. G*/sinkPa
64
64
T 315 1.0 1.48
Solubility in TCE Percent, Min.
99
n/a
T 44
RTFO Test Aged Binder Tests on Original Recovered Asphalt RTFO Test Mass Loss, Max. %
-1.0
-0.124
n/a
n/a
T 240 Dynamic Shear:
Test Temp. ºC Min. G*/sinkPa
64
64
70
76
T 315 2.20 3.71 10.22 6.89 Min. Ductility at 25°C, cm 75 150+ 9.5 8.0 T 51 PAV Aging Temperature °C
100 100 100 100 R 28
PAV Test Aged Binder Dynamic Shear:
Test Temp, ºC Max. G*sinkPa
28
25
37
40 T 315
5,000 3,390 3,040 2,115 Bending Beam Rheometer:
Test Temp. °C Max. S-Value, MPa Min. M-Value
T 313 -6 -12 0 0 300 187 135 112
0.300 0.384 0.365 0.346
Classification Based on Test PG 64-22 PG 70-10 PG 76-10
(or PG 76-16)
n/a, not applicable
UCPRC-TM-2014-03 10
As was noted previously, the decision to allow 15 percent RAP in the surface PG 64-28PM mix and in the
PG 64-10 rich bottom mix was made after all testing discussed in this report was concluded. The results shown
in this technical memorandum for those mixes are for specimens made without RAP.
Table 2.4: Binder Properties for December 2010 Valero Binder and for Blends of Valero Binder and Extracted Binders Determined from MACTEC Tests
Property
Caltrans Spec.
Test Results Valero
PG 64-16 (12/13/10)
Sample
Test Results, Blend of Valero Binder and Extracted Binders
AASHTO Test Method
From Core Samples
From RAP Millings
Original Binder Flash Point, Min. C.O.C., ºC
230
285
n/a
n/a
Viscosity at 135ºC; Pa.s 3.0 0.466 3.08 0.762 T 316 Dynamic Shear:
Test Temp, ºC Min. G*/sinkPa
64
70
70
T 315 1.0 1.48 1.48 2.14
Solubility in TCE Percent, Min.
99
n/a
n/a
n/a
T 44
RTFO Test Aged Binder RTFO Test Mass Loss, Max. %
-1.0
-0.124
-0.250
-0.300
T 240
Dynamic Shear: Test Temp. ºC
Min. G*/sinkPa
64
70
70
T 315 2.20 3.71 3.15 4.69 Min. Ductility at 25°C, cm 75 150+ 108 34 T 51 PAV Aging Temperature °C
Hydrated lime (high-calcium hydrated lime termed, Hi-Cal Hydrate) was supplied by the Chemical Lime
Company. District 2 staff recommended a lime content of 1.2 percent by weight of aggregate and that lime
treatment should follow the process of marination rather than be added as dry lime on damp aggregate. Caltrans
Laboratory Procedure LP-7 (4) was followed to marinate the aggregate for the preparation of the performance
test specimens. It should be noted however that because of the necessity to complete the mix performance tests
in time to meet the deadline for the SSP for the bid document, shear tests on the mix with PG 64-28PM binder
were completed before a decision was made by District 2 Staff to include lime in this mix.
UCPRC-TM-2014-03 12
3 TRAFFIC AND PAVEMENT TEMPERATURE ESTIMATES
Traffic and pavement temperature are two key factors used in determining material test parameters and
pavement performance. Since the test parameters for shear testing are directly related to pavement temperature,
and mix design is related to traffic estimates, how these were selected is discussed below. The data sources used
to obtain these estimates are noted.
3.1 Traffic
Traffic data were obtained from recorded Caltrans weigh-in-motion (WIM) data within the area of the Red Bluff
Project (WIM stations, WIM812 and WIM846). Following the model established in the I-710 Phase 1 LLAP
Project (1), traffic estimates were based on the first five years after opening of the rehabilitated sections to
traffic: 12.6 x 10⁶ ESALs based on a 3 percent linear annual growth rate. To be conservative, this value was
increased to 15.0 x 10⁶ ESALs.
These estimates were used to determine the requirements for the shear test results based on the premise (and
experience) that as long as the mix is properly designed and constructed, the majority of rutting in the HMA
layer will occur during the first five years (1, 5, 7).
The total estimated traffic for a forty year period was used by Caltrans staff to determine the final structural
sections following the CalME design methodology, together with both the fatigue and shear test data provided.
3.2 Pavement Temperatures for Shear Testing
Temperature data covering a period of years for the Red Bluff Project were obtained from the UCPRC pavement
temperature database, the National Climate Data Center (NCDC), and the UCPRC weather station database.
This temperature information was then used to determine the temperature for shear testing of the HMA. Test
temperature selection was based on estimation of pavement temperatures at a 2 in. (50 mm) depth in the HMA.
Selection of this depth was based on analyses that suggest that the maximum shear stress from tires that leads to
rutting occurs at the edge of the tire at about this depth (1). The appropriate test temperature was determined
using the following process:
The seven-day moving average pavement temperature at the nearest major weather station to Red Bluff
in the UCPRC pavement temperature database, which was Sacramento, is shown in Figure 3.1. The
pavement temperature distribution with depth came from use of the Integrated Climate Model (ICM)
and is the same data used in the CalME program. For this computation, temperatures for Sacramento for
a period of thirty years were used (01/01/1961 to 12/31/1990). Although this data is from a prior period,
UCPRC-TM-2014-03 13
the changes in peak air temperatures have not changed enough since then to warrant recalculation of the
pavement temperature database. Assumptions for this computation included an albedo of 0.95, 10 inch
(254 mm) thick asphalt, and constant temperature of 4°C (9°F) at depth of about160 inches (4 m).
Air temperature data for Sacramento, Red Bluff, Redding, and Cottonwood, shown in Figure 3.2, were
used to adjust the pavement temperature at 2 inches depth for Red Bluff (the three sites on Interstate 5
provided a satisfactory measure for air temperature for the project site). The data for Redding, Red
Bluff, and Sacramento come from the NCDC database for the ten-year period of 2001 to 2010, and the
Cottonwood data come from a database of temperatures taken by UCPRC at the Cottonwood Highway
Patrol load control station for the period from November 2002 to August 2006. The air temperature data
indicate that pavement temperatures at Red Bluff, Redding, and Cottonwood at the 95th percentile are
about 5°C (2.7°F) higher than at Sacramento, hence a temperature of 55°C (131°F) was selected for
shear testing at the Red Bluff Project.
Figure 3.1: Seven-day moving average of maximum daily surface temperatures and temperatures at a 2 inch depth for Sacramento based on an analysis using the ICM.
0 10 20 30 40 50 600
10
20
30
40
50
60
70
80
90
100
Temperature (C)
Cum
ula
tive
Pro
babi
lity
(%)
CDF for Composite Pavement Temperatures with Albedo=0.95
50mm depthsurface
UCPRC-TM-2014-03 14
Figure 3.2: Seven-day moving average of maximum daily air temperatures for Cottonwood, Sacramento, Red Bluff, Redding, and Weed.
Note: source data for Sac, Red Bluff, Redding - NCDC 1/1/2001-12/31-2010; Weed 1/7/1984-7/7/1989Source data for Cottonwood - UCPRC Weather database 11/26/2002-8/10/2006
UCPRC-TM-2014-03 15
4 MIX TESTING
The UCPRC subjected samples of the proposed Red Bluff mixes to three performance-related tests—shear,
fatigue and stiffness, and moisture sensitivity—in order to gather data that Caltrans could then use to establish
baseline performance requirements for the mixes. Once these were determined, Caltrans would then use these
requirements in its mix specifications for potential bidders for the contract. The performance test-related results
are presented in this chapter. Appendixes A (shear), B (fatigue and stiffness), and C (moisture sensitivity)
respectively contain the complete results for each type of testing.
4.1 Overview of Test Methods
The HMA performance requirements were developed using the following AASHTO test procedures.
AASHTO T 320 (ASTM D7312), the RSCH, was used to select the design binder content for each of
the mixes to be used in the Red Bluff Project.
AASHTO T 321 (ASTM D7460), the flexural fatigue and frequency sweep test, was used to
determine mix fatigue response and stiffness at the selected design binder content.
AASHTO T 324, Hamburg Wheel-Track Testing (HWTT), was used to evaluate the moisture
sensitivity response of each of the mixes.
All of the specimens for the performance tests, except for the HWTT specimens, were prepared using
rolling wheel compaction. This compaction method was used because the aggregate structure
prepared by this method is similar to that obtained in mixes during pavement construction (5). Rolling
wheel compaction, which was used for a number of years by organizations in Europe (e.g., Royal
Dutch Shell and the French LCPC), was developed during the Strategic Highway Research Program
and published as AASHTO PP3-94. The HWTT specimens were prepared by Superpave Gyratory
Compaction because this is the current requirement in AASHTO T 324.
To define the performance requirements, the UCPRC modified the AASHTO procedures and those
modifications have been reflected in the Caltrans Flexible Pavement Test Method LLP-AC2 (6). The
modifications are detailed in the footnotes to Table 6.1, which shows the HMA performance requirements for
the Red Bluff project.
4.2 Shear Test Results
RSCH testing was conducted with the goal of determining the design binder contents for the PG 64-28PM
surface mix and PG 64-10 intermediate mix in this project and to provide data for the project’s performance test
specifications. Based on the testing regime described in Section 3.2, a shear testing temperature of 55ºC was
UCPRC-TM-2014-03 16
selected to determine the shear test results to select the design binder content for the project’s performance test
specifications. Table A.1 through Table A.4 in Appendix A summarize the complete shear test data.
Initially it was agreed that no lime would be used in the mixes for this project. However, after the initial testing
was completed with the PG 64-28PM mix, Caltrans made a decision to add 1.2 percent lime to the three mix
types. Because of time constraints, selection of the design binder content for the PG 64-28PM was based on the
results of tests without lime. Subsequent testing (shear, stiffness and fatigue, moisture susceptibility) was
conducted on lime-treated mix for all mixes. These data are summarized in Table A.1.
Figure 4.1 illustrates the relationship between the natural log of loading cycles at a permanent shear strain (p) of
5 percent (both mean and median values) versus binder content, in this case for the PG 64-28PM mix. In terms
of the numerical value of repetitions, the median values at 5.0 and 5.5 percent were approximately 2 x 10⁹ and
9 x 10⁶, respectively, a significant reduction in cycles with binder content increase from 5.0 to 5.5 percent.
Based on the shear testing data, and following the SHRP-A-415 design process, a design binder content of
5.2 percent (by weight of aggregate) was selected for the PG 64-28PM mix since the mix appeared to be a
critical mix, in that small changes to binder content resulted in large differences in shear testing performance. A
comparable process was followed for the PG 64-10 25 percent RAP mix; detailed test results are presented in
Appendix A.
Because the decision to add 1.2 percent lime was made after these data were obtained and because of time
constraints, this information served as the basis for the mix testing for the PG 64-28PM mix containing
1.2 percent lime and the PG 64-10 mix with 25 percent RAP and 1.2 percent lime. Table A.2 and Table A.3
present these test data.
It should also be noted that no shear tests were required for the rich bottom mix since it is located at a depth
where the shear stresses from tires would not have a significant effect on rutting, and the pavement temperature
would be less than the upper part of the pavement section.
In the Special Provisions for the Red Bluff Contract (No. 02-3E8104), dated September 19, 2011, performance
requirements for the PG 64-28PM mix with lime include 15 percent RAP. It must be emphasized that the
performance requirements sent to Caltrans presented in this tech memo for the PG 64-28PM mix with lime are
based on tests without RAP.
UCPRC-TM-2014-03 17
Figure 4.1: Ln (repetitions to 5 percent p) versus binder content at 55ºC for Red Bluff PG 64-28PM mix (without lime).
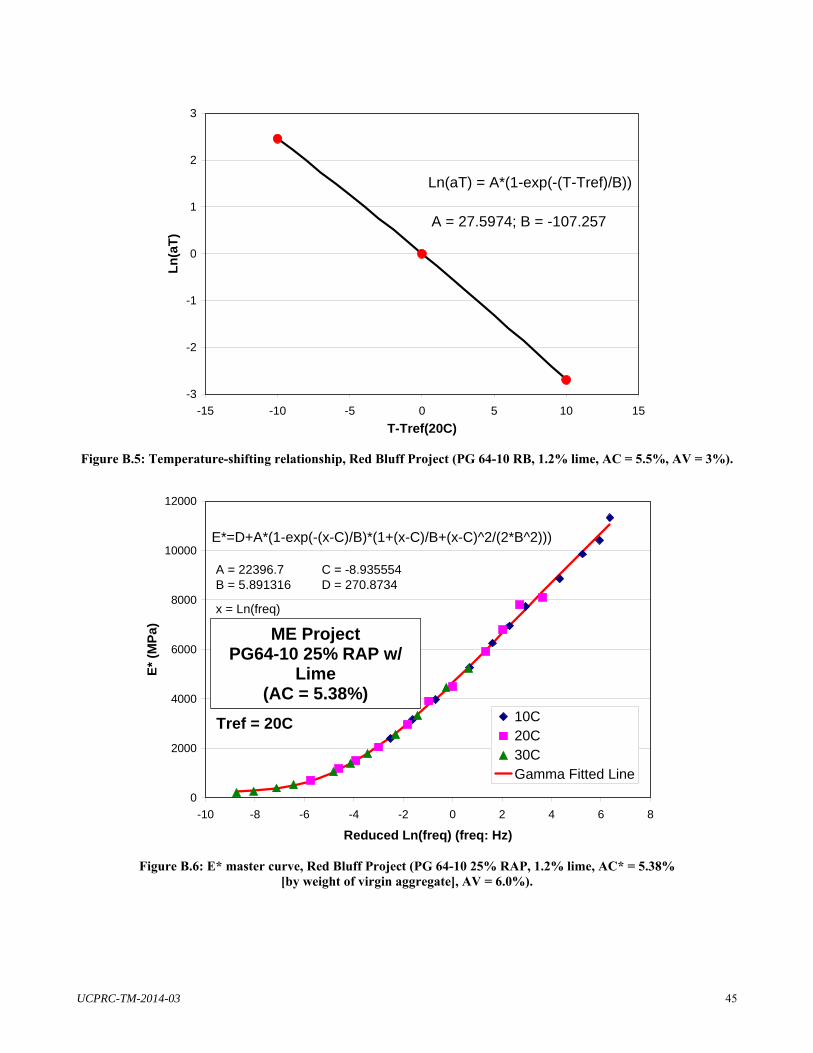
4.3 Fatigue and Stiffness Test Results
After the optimum binder contents of the project mixes were determined, fatigue testing was conducted to
determine the cracking performance and bending stiffness requirements for the specification. Fatigue test data
were obtained at 10ºC, 20ºC, and 30ºC. Frequency sweep test data were obtained at the same three temperatures
for a range in frequencies from 0.01 Hz to 15.2 Hz (Table B.2 through Table B.4 present the flexural stiffness
measurements on beam test specimens). Master curves of stiffness versus frequency were developed from the
data contained in Table B.2 through Table B.4. Table B.5 presents the coefficients for these curves, the
equations for which are shown in the table footnotes. These equations are based on the use of the
interchangebility of time (frequency) and temperature concept, and the use of a genetic algorithm to define the
equations representing the curves.
Figure 4.2 contains plots of the ln(strain) versus ln(Nf) based on the Red Bluff project mix test data. Figure 4.3
contains the plots of the stiffness master curves (defined as E*) shifted to 20ºC as a function of frequency for the
Red Bluff Project. Figure 4.4 summarizes the shift factor, aT, as a function of temperature.
It is important to note that the frequency sweep data (shown in Table B.2 through Table B.5) and the resulting
stiffness master curves were required for the design of the structural pavement sections using the CalME design
methodology and were not required for the mix performance specifications. Stiffness data for the specifications
were taken from the initial stiffness in the flexural fatigue test data.
5
10
15
20
25
30
4.4 4.5 4.6 4.7 4.8 4.9 5 5.1 5.2 5.3 5.4 5.5 5.6
AC (%)
Ln
(Cy
cle
s @
5%
PS
S)
MeanMedian
3.15-ME Project: PG64-28PMME Project: PG64-28PM
UCPRC-TM-2014-03 18
Figure 4.2: Fatigue test summary for the Red Bluff project.
Figure 4.3: Summary of stiffness (E*) master curves, Red Bluff project.
5 DEVELOPMENT OF FATIGUE AND SHEAR MIX PERFORMANCE CRITERIA
5.1 Overview
This section describes the methodology used to determine fatigue and shear performance requirements for the
specifications, based on the laboratory performance testing described in Chapter 4. Details are presented in the
appendixes.
5.2 Fatigue Specification Development
The I-710 rehabilitation projects showed that when setting mix performance requirements, it is important to
recognize the variability of test results when a test is run by different organizations. The approach used on the
Weed project was developed based on discussions with Caltrans and the contractors after the initial I-710 project
and assumes that all of the variability associated with laboratory specimen preparation and testing should be the
responsibility of Caltrans. Mix performance test specifications for I-710 Phase 2 and subsequent phases were
determined by this approach. This chapter uses the results obtained from the shear and fatigue testing discussed
earlier and presents the performance criteria required for the design mixes. The methodology utilized (with the
S-Plus statistical package) is based on the developments described in Appendix F of Reference (7). The fatigue
and stiffness test data used to develop these performance requirements are included in Appendix B. Suggested
specifications based on these data as well as the shear and HWTT test data are discussed in Chapter 6.
In order to satisfy fatigue performance specification requirements, the mean value of the natural logarithm of
fatigue life, Ln(Nf), determined from three fatigue tests at a specified strain level should exceed the specified
lower bound of the regression lines. An example of this is shown in Figure 5.1 for the PG 64-10, 15 percent
RAP, rich bottom (RB) mix. The lower bound represents the lower 95 percent confidence interval. This lower
value is recommended for specification purposes.
UCPRC-TM-2014-03 23
Figure 5.1: Fatigue 95% confidence bands (PG 64-10 15% RAP RB with 1.2% lime, AC = 5.5%, AV = 3%;
[excluding 6A2 and 7A2 tests]).
5.3 RSCH Specification Development
As with the I-710 freeway (1) project, the criteria for the Red Bluff mix designs were selected to accommodate
the traffic estimated for its first five years of operation. Based on the available traffic data, the design value for
this five-year period was 15 x 106 ESALs. After this value was determined, the RSCH criteria listed in Table 6.1
were then developed according to the following equations:
(Nsupply) M (Ndemand) (5.1)
Ndemand was determined as follows:
Ndemand = Design ESALs TCF SF (5.2)
where: TCF = temperature conversion factor; estimated to be 0.12 for California as shown in (7) SF = shift factor, value of 0.04 was used as developed in (7)
The development of the parameters for Ndemand, TCF and SF is documented in the SHRP-A-415 research
report (7). The TCF developed for California and the SF values referred to above were taken from tables in
Chapter 15 of the A-415 report. To determine Nsupply, a reliability multiplier, M, equal to 5 for a reliability level
of 95 percent (7), was used based on RSCH test variance (7) and an estimate in the variance in ln (ESALs). This
value was also taken from a table in Chapter 15 of A-415 (7). For the Red Bluff Project, with its estimated
traffic of 15 106 and the factors shown in Equations (5.1) and (5.2), Nsupply was estimated to be
360,000 repetitions.
4
8
12
16
20
24
28
-9 -8.5 -8 -7.5 -7
Ln(strain)
Ln
(Nf)
95 % Confidence Band: PG64-10RB w/Lime
400 microstrain(mean = 632,186)
200 microstrain(mean = 14,112,678)
Lower Bound
Upper
14.80617(Nf = 2,693,010)
12.11641(Nf = 182,848)
Note: Excluding 6A2 and 7A2 tests
UCPRC-TM-2014-03 24
It should be noted that the shear test results at five percent permanent shear strain shown in Chapter 4 and
Appendix A exceed these values by a significant amount for the Red Bluff Project. Consequently, the analyses
described in Chapter 4 for the fatigue and stiffness values were not performed for the shear test because the
shear test results indicated that the allowed range of binder contents during mix production would not exceed
these values. It should also be noted that the shear test mix data for both projects indicate critical mixes.
Selection of the design binder contents are based on this information.
5.4 Suggested Fatigue and Stiffness Performance Requirements
The data used to develop the 95 percent confidence bands shown in Figure 5.1 are included in Appendix E,
Table E.1. In this figure, the 95 percent confidence bands are based on eight of ten fatigue test results (three at
200 x 10-6 strain and five at 400 x 10-6 strain) for the mixes included in Table B.1. The suggested specification
requirements for this mix are shown in Table 5.1. In Appendix E, Figure E.1 through Figure E.6 contain the
results of the other analyses for all three mixes. The recommendations in Table 5.1 for the PG 64-10 RAP mix
are based on the analysis shown in Figure E.2, and the specifications for the PG 64-28PM mix are based on the
analyses shown in Figure E.5.
A similar approach was used to develop the stiffness requirements shown in Table 5.2.
UCPRC-TM-2014-03 25
Table 5.1: Suggested Fatigue Performance Requirements at 200 x 10-6 and 400 x 10-6 Strain
Mix Type
Min. Requirements for Fatigue Life Repetitions at at 20°C Regression Line
Requirement 200 microstrain 400 microstrain
PG 64-10 15% RAP RB with 1.2%
lime 2,693,010 182,848
Regression line has to be above the lower
bound
Suggested 2,700,000 182,000
PG 64-10 25% RAP with 1.2% lime
935,232 24,933 Regression line has to
be above the lower bound
Suggested 950,000 25,000
PG 64-28 PM 15% RAP with 1.2% lime
345,053,136 23,123,732 Regression line has to
be above the lower bound
Suggested 345,000,000 23,000,000
Notes: 1. For each mix type, the fatigue test results have to comply with the following
requirements: (a) the fatigue life has to comply with the minimum requirement (b) the regression line constructed by three 200 microstrain fatigue tests and three 400 microstrain fatigue tests has to be above the lower bound.
2. The lower bound of PG 64-10 RB 15% RAP with 1.2 lime was based on Figure 5.1 (excluding 6A2 and 7A2 tests).
3. The lower bound of PG 64-10 25% RAP with 1.2% lime was based on Figure E.2 (using all seven data points).
4. The lower bound of PG 64-28PM 15% RAP with 1.2% lime was based on Figure E.5 (excluding 1D2 test).
1. The flexural stiffnesses at 20°C (10 Hz) were based on the flexural fatigue test results. 2. The flexural stiffnesses at 30°C (10 Hz) were based on the flexural frequency sweep test results (only
two data points per mix type).
UCPRC-TM-2014-03 27
6 RECOMMENDED MIX PERFORMANCE SPECIFICATIONS FOR RED BLUFF
The fatigue, stiffness, and shear test parameters are based on the analyses included in Chapter 5. In Table 6.1,
the numbers have been rounded to what are considered to be significant figures for the test values.
HWTT requirements are those cited in the Caltrans standard specification.
UCPRC-TM-2014-03 28
Table 6.1: Recommended HMA Mix Performance Requirements for Red Bluff Project
Design Parameters Test Method Requirement
Permanent deformation (minimum):
PG 64-28PM (with lime)2a PG 64-10 (with RAP and lime)2b
Notes: 1. Included in the testing procedure, Caltrans LLP-AC2, “Sample Preparation and Testing for Long-Life Hot Mix
Asphalt Pavements” (1) 2a. At proposed asphalt binder content (mix containing 1.2% lime) and with mix compacted to 3%+/-0.3%
air voids. 2b. At proposed asphalt binder content (mix containing RAP and 1.2% lime) and with mix compacted to
3%+/-0.3% air voids. 3. In repeated simple shear test at constant height (RSCH) at a temperature of 55C at 100 kPa. 4. Minimum test value measured from tests on three specimens. 5a. At proposed asphalt binder content (mix containing 1.2% lime) and with mix compacted to 6%+/-0.3%
air voids (determined using AASHTO T 209 [Method A]) 5b. At proposed asphalt binder content (mix containing RAP and 1.2% lime) and with mix compacted to
6%+/-0.3% air voids (determined using AASHTO T 209 [Method A]) 5c. At proposed asphalt binder content (mix containing 1.2% lime) and with mix compacted to 3%+/-0.3%
air voids (determined using AASHTO 209 [Method A]) 6. At proposed asphalt binder content, the average mix stiffness at 20C and a 10 Hz load frequency must be in the
range 415,000 to 486,000 psi. At proposed asphalt binder content, the minimum stiffness at 30C and a 10 Hz load frequency must be equal to or greater than 220,000 psi.
7a. At proposed asphalt binder content (mix containing RAP and 1.2% lime), average stiffness at 20C and a 10 Hz load frequency must be in the range 870,000 to 1,000,000 psi.
7b. At proposed asphalt binder content (with 1.2% lime), average stiffness at 20C and a 10 Hz load frequency must be in the range 790,000 to 1,000,000 psi.
8. At 400 x 10-6 strain, results shall be reported for this strain level but may be obtained by extrapolation. Minimum number of repetitions required prior to extrapolation defined within test procedure.
9. At 200 x 10-6 strain, results shall be reported for this strain level but may be obtained by extrapolation. Minimum number of repetitions required prior to extrapolation defined within test procedure.
10. Minimum number of repetitions for rut depth of 0.5 in. at 50C (average of two specimens).
11. The rich bottom (RB) mix contains the same binder as the mix with RAP, i.e., the PG 64-10; the binder content of this mix is increased 0.5% (mix basis) above the binder content used for the mix containing RAP.
UCPRC-TM-2014-03 29
7 SUMMARY AND RECOMMENDATION
7.1 Summary
The purpose of this technical memorandum has been to provide a summary of the process used to develop the
HMA performance-related specifications for the LLAP project on Interstate 5 near Red Bluff. Materials were
obtained and tested, and traffic and environmental conditions were considered by the UCPRC. The test data
developed in this investigation were provided to Caltrans in October 2011 (8) for possible distribution to
potential bidders at a pre-bid meeting on the contract and were used by Caltrans HQ staff for the design of the
pavement section using CalME flexible pavement design methodology. Due to time constraints some of these
test data were developed using HMA specimens that were produced without lime, while the contract required
the use of lime for plant mix.
UCPRC staff performed this investigation beginning with the understanding that Caltrans wanted to include a
higher RAP content (in this case 25 percent) than was typically allowed under the specifications that were
current at that time. However, since these projects were to be designed as long-life pavements, a decision was
made to conduct this extensive test program and develop performance-based HMA specifications similar to
those used for the I-710 projects in the Long Beach area.
7.2 Recommendation
Although it is not a part of this investigation, it is strongly recommended that after the Red Bluff Project is
constructed, there should be systematic and regular pavement performance evaluations conducted for at least
five years, and preferably longer, following an approach like that used on the I-710 Phase 1 Project (1). This
follow up is especially important since this project is the first to use a higher percentage of RAP in HMA mixes
for LLAPs.
UCPRC-TM-2014-03 30
REFERENCES
1. Monismith, C. L., J. T. Harvey, B.-W. Tsai, F. Long, and J. Signore. The Phase 1 I-710 Freeway Rehabilitation Project: Initial Design (1999) to Performance after Five Years of Traffic (2008). Summary Report, UCPRC-SR-2008-04. University of California Pavement Research Center, February 2009, 183 pp.
2. Signore, J.M., B.-W. Tsai, and C.L. Monismith. 2014. Development of Hot Mix Asphalt Pavement Performance Properties for Long-Life Pavement Design: Caltrans District 2, Interstate 5, Weed, California. (UCPRC-TM-2014-04)
3. Signore, J.M., and C.L. Monismith. 2014. Development of Hot-Mix Asphalt Pavement Performance Properties for Long-Life Pavement Design: Caltrans District 4, Interstate 80, Solano County, California. (UCPRC-TM-2014-05)
4. State of California Department of Transportation Lab Procedure, LP-7, “Laboratory Procedure for Treating Aggregate with Lime Slurry,” May 27, 2004, available at: www.dot.ca.gov/hq/esc/Translab/ ormt/pdf/LP_7.pdf.
5. Harvey, J. T., S. Weissman, F. Long, and C. L. Monismith. “Tests to Evaluate the Stiffness and Permanent Deformation Characteristics of Asphalt/Binder Aggregate Mixes, and Their Use in Mix Design and Analysis.” Journal of the Association of Asphalt Paving Technologists, Vol. 70, 2001, pp. 572-604.
6. State of California Department of Transportation Lab Procedure, LLP-AC2, “Sample Preparation and Testing for Long-Life Hot Mix Asphalt Pavements,” August 4, 2012, available at: www.dot.ca.gov/hq/esc/Translab/ormt/pdf/LLP-AC2_Sample_Preparation_for_LL_HMA-Pavement.pdf.
7. Sousa, J. B., J. A. Deacon, S. Weissman, J. T. Harvey, C. L. Monismith, R. B. Leahy, G. Paulsen, and J. S. Coplantz. Permanent Deformation Response of Asphalt-Aggregate Mixes, Report No. SHRP-A-415, Strategic Highway Research Program, National Research Council, Washington, D. C., 1994.
8. Signore, J., B.-W. Tsai, and C. L. Monismith. UCPRC Test Data, Red Bluff and Weed Long-Life Pavement Projects, Test Data Summary. Prepared for the Caltrans Office of Pavements by University of California Pavement Research Center, Institute of Transportation Studies, University of California, Berkeley, October 2011, 26 pp.
UCPRC-TM-2014-03 31
APPENDIX A: SHEAR TEST MIX RESULTS
Appendix A contains: (1) three boxplots for the PG 64-28PM mix without lime for binder content versus
Ln (G*), Ln (permanent shear strain, p, at 5,000 load repetitions), and Ln (load repetitions at p = 5% shear
strain) (Figure A.1 through Figure A.3); (2) Ln (p) versus Ln (load repetitions) for the PG 64-28PM with lime,
at two temperatures and three stress levels (Figure A.4 and Figure A.5); (3) Ln (p) versus Ln (load repetitions)
for the PG 64-10 with RAP and lime, at two temperatures and three stress levels (Figure A.6); and (4) two
boxplots for the PG 64-28PM mix with lime and the PG 64-10/16 mix with RAP and lime at two temperatures
and three stress levels versus Ln (p, at 5,000 load cycles) and L(G) (Figure A.7 and Figure A.8).
Table A.1: Summary of Shear Test Results at 55°C for the Red Bluff PG 64-28PM Mix Design (LMLC Without Lime)
1. “*”: extrapolation 2. RICE value: 2.5160 for AC 4.5%; 2.4924 for AC 5.0%; 2.4837 for AC 5.5% (percent AC was calculated by weight of aggregate). 3. All specimens were laboratory-mixed, laboratory-compacted (LMLC) without lime.
UCPRC-TM-2014-03 32
Table A.2: Summary of Shear Test Results for PG 64-28PM Lime Mixes (ME, Red Bluff Project, LMLC)
Note: 1. “*”: extrapolation 2. RICE value: 2.5122 for AC 4.5%; 2.4935 for AC 5.0%; 2.4756 for AC 5.5% (percent AC was calculated by weight of aggregate). 3. All specimens were laboratory-mixed, laboratory-compacted. Actual binder tested was PG 64-16.
1. “*”: extrapolation 2. PG 64-10 R25 Lime: PG 64-10 binder with AC* = 5.38% (by weight of virgin aggregate plus line); 25% RAP (by weight of total mix);
1.2% lime added (by weight of virgin aggregate). Actual binder tested was PG 64-16. 3. RICE value: 2.4578 for PG 64-10 R25 Lime 4. Percent air-void content was measured using parafilm method. 5. All specimens were laboratory-mixed, laboratory-compacted (LMLC).
UCPRC-TM-2014-03 34
Figure A.1: Ln (shear modulus, G) versus binder content for Red Bluff PG 64-28PM mix (55°C, 70 kPa shear stress, without lime).
Figure A.2: Ln (permanent shear strain, p after 5,000 load repetitions) versus binder content for Red Bluff PG 64-28PM mix (55°C, 70 kPa shear stress, without lime).
4.3
4.4
4.5
4.6
4.7
4.8
AC4.5 AC5.0 AC5.5
Ln(G
*) (
G*:
MP
a)-4
.6-4
.4-4
.2-4
.0-3
.8
AC4.5 AC5.0 AC5.5
Ln
(PS
S @
5,0
00
cyc
les)
UCPRC-TM-2014-03 35
Figure A.3: Ln (load for repetitions at γp= 5%) versus binder content for Red Bluff PG 64-28PM mix (55°C, 70 kPa shear stress, without lime).
Figure A.4: Summary of shear test results at 45ºC, Ln (Ln(γp)) versus Ln (load repetitions), PG 64-28PM mix (ME, Red Bluff Project, AC = 5.2% [by weight of aggregate plus lime], 1.2% lime, AV = 3.0%, LMLC).
1618
2022
24
AC4.5 AC5.0 AC5.5
Ln(C
ycle
s @
5%
PS
S)
1
1.2
1.4
1.6
1.8
2
2.2
2.4
0 2 4 6 8 10 12
Ln(n)
Ln
(-L
nP
SS
)
315-PG6428PM-52-1-1A-7045, AV=2.7%, 75.77 kPa
315-PG6428PM-52-1-2b-7045, AV=2.7%, 75.21 kPa
315-PG6428PM-52-2-1D-7045, AV=2.8%, 78.17 kPa
315-PG6428PM-52-1-1B-10045, AV=3.3%, 101.35 kPa
315-PG6428PM-52-1-2A-10045, AV=2.8%, 100.68 kPa
315-PG6428PM-52-2-3D-10045, AV=3.0%, 100.33 kPa
315-PG6428PM-52-1-3A-13045, AV=3.2%, 132.20 kPa
315-PG6428PM-52-1-3B-13045, AV=3.3%, 133.55 kPa
315-PG6428PM-52-2-2B-13045, AV=3.3%, 133.27 kPa
3.15-ME Red Bluff ProjectPG64-28PM Lime
45C
ME Red Bluff Project PG64-28PM Lime
UCPRC-TM-2014-03 36
Figure A.5: Summary of shear test results at 55ºC, Ln (Lnγp) versus Ln (load repetitions), PG 64-28PM mix, (ME, Red Bluff Project, AC = 5.2% [by weight of virgin aggregate plus lime], AV = 3.0%, LMLC).
Figure A.6: Summary of shear test results at 45ºC, Ln (Lnγp) versus Ln (load repetitions), PG 64-10 mix (ME, Red Bluff Project, AC = 5.38% [by weight of virgin aggregate plus lime],
1. RICE values: 2.4704 for PG 64-10 RB (with lime added; AC = 5.5%); 2.4578 for PG 64-10 RAP (with lime added; AC = 5.38% by weight of virgin aggregate); 2.4890 for PG 64-28PM (with lime added; AC = 5.2%)
2. 25% RAP (by weight of virgin aggregate) was added to PG 64-10 RAP mix. 3. 1.2% of lime (by weight of virgin aggregate) was added to PG 64-10 RAP mix; 1.2% of lime (by weight of
aggregate) was added to both PG 64-10 RB and PG 64-28PM mixes. 4. The source of aggregate is Red Bluff (District 2). 5. The binder source is the Valero refinery. 6. The air-void content was measured with the parafilm method. 7. The beam specimens are laboratory-mixed, laboratory-compacted (LMLC). 8. “*” stands for “extrapolation.” 9. Data shaded yellow might be considered outliers.
UCPRC-TM-2014-03 39
Table B.2: Summary of Frequency Sweep Test Results, Red Bluff Project, PG 64-10 RB Mix (1.2% Lime, AC = 5.5%, AV = 3%)
Figure B.9: Temperature-shifting relationship, Red Bluff Project (PG 64-28PM, 1.2% lime, AC = 5.2%, AV = 6.0%).
-4
-3
-2
-1
0
1
2
3
4
-15 -10 -5 0 5 10 15
T-Tref(20C)
Ln
(aT
)
Ln(aT) = A*(1-exp(-(T-Tref)/B))
A = 17.4683; B = -54.6339
UCPRC-TM-2014-03 48
APPENDIX C: HAMBURG WHEEL-TRACK TESTING RESULTS
Table C.1: Summary of Hamburg Wheel-Tracking Test Results, Red Bluff Project
Mix Type Set Position Specimen Name % AV
(Parafilm)
Average Rut Depth
(mm) 10k
Passes 20k
Passes
PG 64-10 RB with lime
1 (UCPRC)
Rt. 3.15-HAM-6410RB-5.5-3-1B 3.0
3.22 3.41 3.15-HAM-6410RB-5.5-3-1B 3.1
Lt. 3.15-HAM-6410RB-5.5-3-1B 3.2
4.13 4.49 3.15-HAM-6410RB-5.5-3-1B 3.1
2 (Caltrans)
Rt. 3.15-HAM-6410RB-5.5-1-3A 3.1
1.20 2.76 3.15-HAM-6410RB-5.5-4-3A 3.2
Lt. 3.15-HAM-6410RB-5.5-1-2A 3.0
1.25 2.69 3.15-HAM-6410RB-5.5-4-2A 2.9
PG 64-10 RAP with lime
1 (UCPRC)
Rt. 3.15-HAM-RAP-6410-5.38-2-2D 6.0
2.61 3.16 3.15-HAM-RAP-6410-5.38-1-3C 5.9
Lt. 3.15-HAM-RAP-6410-5.38-1-1C 5.8
2.29 2.89 3.15-HAM-RAP-6410-5.38-2-1C 5.8
2 (Caltrans)
Rt. 3.15-HAM-RAP-6410-5.38-1-1D 5.2
2.80 3.37 3.15-HAM-RAP-6410-5.38-2-3C 6.1
Lt. 3.15-HAM-RAP-6410-5.38-2-2C 5.8
2.82 3.25 3.15-HAM-RAP-6410-5.38-2-3D 5.7
PG 64-28PM with lime
1 (UCPRC)
Rt. 3.15-HAM-6428PM-5.2-1-1D 6.1
1.79 2.19 3.15-HAM-6428PM-5.2-2-1D 6.0
Lt. 3.15-HAM-6428PM-5.2-2-2D 5.7
2.62 3.05 3.15-HAM-6428PM-5.2-3-3D 5.9
2 (UCPRC)
Rt. 3.15-HAM-6428PM-5.2-2-2C 6.6
2.35 2.77 3.15-HAM-6428PM-5.2-1-2C 6.8
Lt. 3.15-HAM-6428PM-5.2-1-3C 8.1
2.43 3.11 3.15-HAM-6428PM-5.2-2-3C 7.7
Note: 1. All the specimens were prepared using rolling wheel compaction. 2. Average rut depth was defined as the average of ruts of three middle profile positions from the smoothed
plot.
UCPRC-TM-2014-03 49
Figure C.1: HWTT summary of Red Bluff, PG 64-28PM 15% RAP with 1.2% lime.
-7
-6
-5
-4
-3
-2
-1
0
0 10000 20000 30000 40000 50000 60000 70000
Number of Passes
Ave
rag
e R
ut
Dep
th (
mm
)
UCPRC Set#1 Rt.
UCPRC Set#1 Lt.
UCPRC Set#2 Rt.
UCPRC Set#2 Lt.
3.15 ME Red Bluff PG64-28PM w/LimeME Red Bluff PG64-28 PM w/ Lime
UCPRC-TM-2014-03 50
Figure C.2: Rutting evolution image and contour plots for PG 64-10 RB mix set #1 after 80,000 passes: (a) original data (lt.), (b) original data (rt.), (c) smoothed in “number of passes” direction (lt.), and (d) smoothed in “number of passes” direction (rt.) (by UCPRC).
Figure C.3: Rutting evolution image and contour plots for PG 64-10 RB mix set #2 after 20,000 passes: (a) original data (lt.), (b) original data (rt.), (c) smoothed in “number of passes” direction (lt.), and (d) smoothed in “number of passes” direction (rt.) (by Caltrans).
Number of Passes
Pro
file
Po
sitio
ns
0 5000 10000 15000 20000
24
68
10
-6-6-6-6-6-6-6-6-6-6-6-6 -6-5-5-5-5-5-5
-5
-4-4
-4
-3
-3
-3-3-3-3-3-3
-2
-2-2-2
-2-2-2-2-2-2-2-2-2-2-2-2-2-2-2-2
-2-2-2-2-2-2-2-2-2-2-2-2-2-2-2-2
-2-2-2-2-2-2-2-2-2-2-2
-1
-1-1-1-1
0
Number of Passes
Pro
file
Po
sitio
ns
0 5000 10000 15000 20000
24
68
10
-4.5-4.5-4.5 -4.5-4-4-4
-3.5-3.5-3.5-3.5-3.5
-3.5
-3-3-3-3
-3
-3-3-3-3-3-3-3-3-3-3
-3-3-3-3-3-3-3
-3-3-3-3-3-3-3-3-3-3
-3-3
-3
-2.5-2.5-2.5
-2.5
-2.5-2.5-2.5-2.5-2.5-2.5-2.5-2.5
-2.5-2.5-2.5-2.5-2.5-2.5
-2.5-2.5-2.5-2.5-2.5-2.5-2.5-2.5-2.5
-2.5-2.5-2.5-2.5-2.5-2.5-2.5
-2
-2-2-2
-2
-2-2-2
-2-2-2-2-2-2
-2-2-2-2-2-2-2
-1.5-1.5-1.5-1.5
-1.5
-1.5-1.5-1.5
-1.5
-1.5-1.5-1.5-1.5-1.5
-1-1
-1
-1
-1
-1-1-1
-0.5 0
Number of Passes
Pro
file
Po
sitio
ns
0 5000 10000 15000 20000
24
68
10 -6
-5
-4
-3
-3-2-1
Number of Passes
Pro
file
Po
sitio
ns0 5000 10000 15000 20000
24
68
10 -4.5
-4-3.5
-3
-3
-2.5-2-1.5-1-0.5
(a) Original (Set#2: Lt)
(c) Smoothed in “Number of Passes” (Set#2: Lt)
(b) Original (Set#2: Rt)
(d) Smoothed in “Number of Passes” (Set#2: Rt)
UCPRC-TM-2014-03 52
Figure C.4: Rutting evolution image and contour plots for PG 64-10 RAP with lime mix set #1 after 65,150 passes: (a) original data (lt.), (b) original data (rt.), (c) smoothed in “number of passes” direction (lt.), and (d) smoothed in “number of passes” direction (rt.) (by UCPRC).
Figure C.5: Rutting evolution image and contour plots for PG 64-10 RAP with lime mix set #2 after 20,000 passes: (a) original data (lt.), (b) original data (rt.), (c) smoothed in “number of passes” direction (lt.), and (d) smoothed in “number of passes” direction (rt.) (by Caltrans).
Figure C.6: Rutting evolution image and contour plots for PG 64-28PM 15%RAP with lime mix set #1 after 26,850 passes: (a) original data (lt.), (b) original data (rt.), (c) smoothed in “number of passes” direction (lt.), and (d) smoothed in “number of passes” direction (rt.) (by UCPRC).
Figure C.7: Rutting evolution image and contour plots for PG 64-28PM with lime mix set #2 after 40,000 passes: (a) original data (lt.), (b) original data (rt.), (c) smoothed in “number of passes” direction (lt.), and (d) smoothed in “number of passes” direction (rt.) (by UCPRC).