Development of Pavement Design Standards for Low-Volume Roads in Ethiopia AFCAP/ETH/005/A Assosa – Kurmuk Laterite Base Trials: Design and Construction Report CPR 1578 A. Otto P.A.K. Greening July 2012
Transcript
Development of Pavement Design Standards for Low-Volume Roads in Ethiopia AFCAP/ETH/005/A
Assosa – Kurmuk Laterite Base Trials: Design and Construction Report CPR 1578
A. Otto P.A.K. Greening
July 2012
The behaviour of Laterites varies significantly from other natural materials of high plasticity. The plasticity of laterite contributes significantly to strength upon drying back by acting as “cement” to the nodules. The site on Assosa-Kurmuk road was constructed to demonstrate this principle as well as to investigate the influence of sealed or unsealed shoulders on wheel path moisture and strength both in cut and fill. The results from long term monitoring should provide information that can update current practice in the use of neat natural bases as well as on the use of sealed and unsealed shoulders.
This project was funded by the Africa Community Access Programme (AFCAP) which promotes safe and sustainable access to markets, healthcare, education, employment and social and political networks for rural communities in Africa. Launched in June 2008 and managed by Crown Agents, the five year-long, UK government (DFID) funded project, supports research and knowledge sharing between participating countries to enhance the uptake of low cost, proven solutions for rural access that maximise the use of local resources. The programme is currently active in Ethiopia, Kenya, Ghana, Malawi, Mozambique, Tanzania, Zambia, South Africa, Democratic Republic of Congo and South Sudan and is developing relationships with a number of other countries and regional organisations across Africa. This material has been funded by UKaid from the Department for International Development, however the views expressed do not necessarily reflect the department’s or the managing agent’s official policies. For further information visit https://www.afcap.org
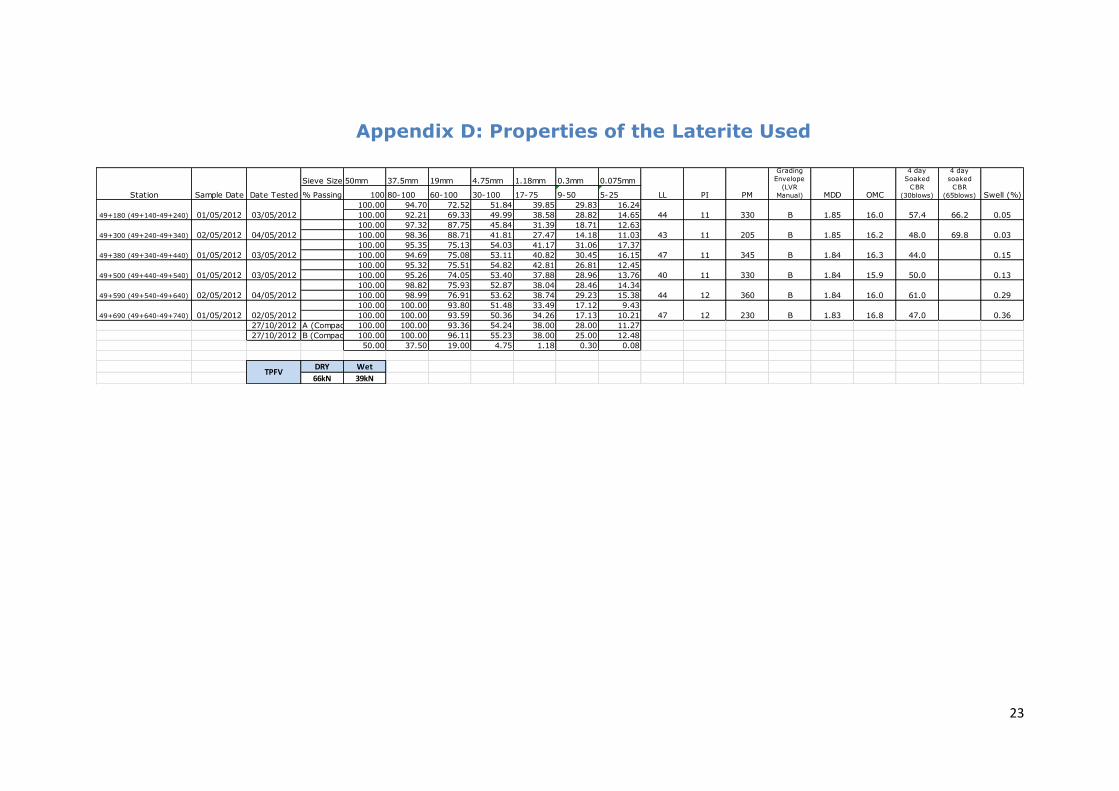
Appendix D: Properties of the Laterite Used .................................................................................... 23
Appendix E: Grading of 1st Layer Chippings ..................................................................................... 24
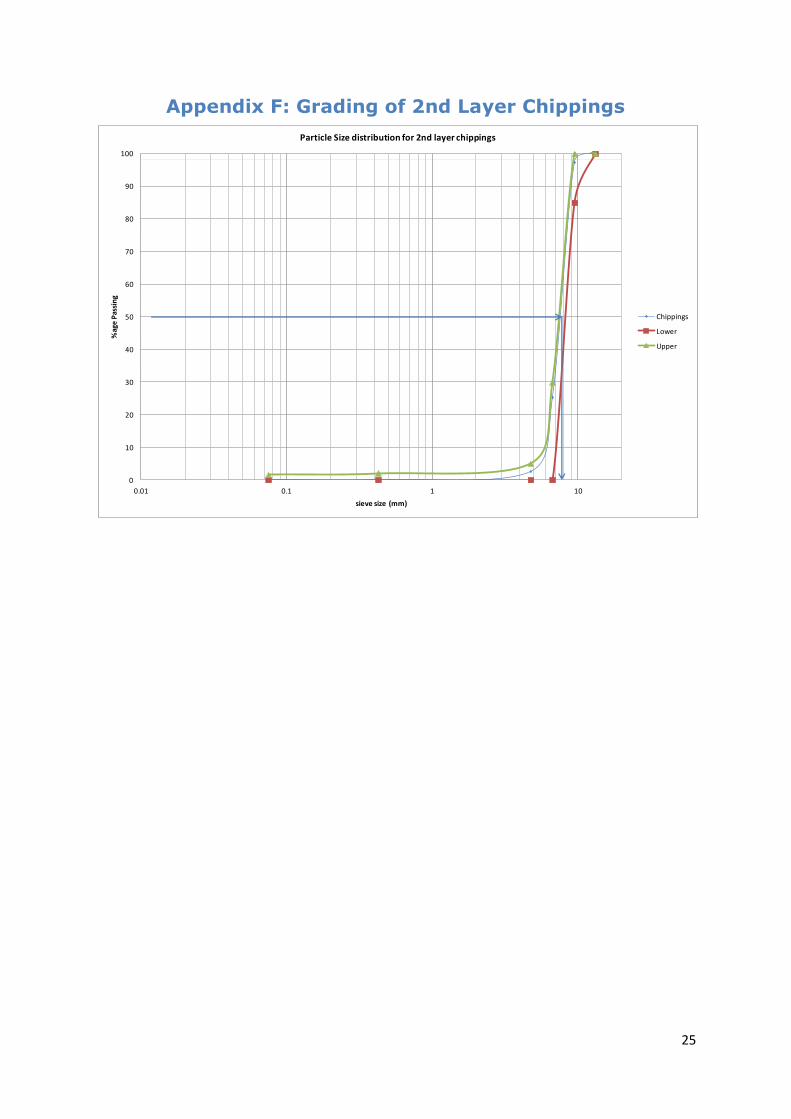
Appendix F: Grading of 2nd Layer Chippings .................................................................................... 25
List of Figures Figure 4-1 Location of the sections on Assosa – Kurmuk road in Western Ethiopia ............................. 4 Figure 5-1 Variation of laboratory CBR value with moisture content at 100% MDD ............................ 6
List of Tables Table 2.1 Conceptual Matrix .............................................................................................................. 2 Table 6.1 Pavement Structure ........................................................................................................... 6 Table 7.1 Chainages and trial sub-sections ......................................................................................... 7 Table 8.1 Summary of Laterite properties used.................................................................................. 7 Table 8.2 Field Compaction Densities ................................................................................................ 8 Table 8.3 DCP CBR values measured on the trial section .................................................................... 9 Table 8.4 Layer 1 bitumen and chippings spread rate ...................................................................... 10 Table 8.5 Layer 2 bitumen and chippings spread rate ...................................................................... 11
1
1 Background
The Development of Pavement Design Standards for roads in Ethiopia is part of the African
Community Access Programme (AFCAP) which has the main goal of providing safe and sustainable
access for poor communities in Africa. Revised manuals have been produced under the Ethiopia
component of AFCAP which reflect current knowledge and practice and provide practitioners in
Ethiopia with a wider choice in the design and construction of rural roads based on results of
successful research.
Included in AFCAP are projects primarily aimed at demonstrating the benefits from the application of
research-based evidence on pavement design standards for Low Volume Roads that will enable
country partners to maximize the use of local resources whilst also assisting the participating road
authorities to undertake research projects. These projects are designed to target country-specific
problems, the results of which will be used to revise and tailor the manuals and promote the cost-
effective provision of roads that facilitate sustainable access and increased mobility, particularly in
rural areas. These draft design standards will be disseminated to stakeholders in the federal and
regional governments, the private sector and academic institutions.
To this end, four initial demonstration/research projects are being undertaken jointly by the Ethiopia
Road Authority (ERA) and TRL. The research objectives have been developed to comply with the
overall AFCAP guidelines and include:
(a) Demonstration of approaches that have been used successfully elsewhere and could be
applicable to roads in Ethiopia. (These include alternative pavement designs, appropriate use of local
materials and various surfacing options).
(b) Research to develop and revise standards and specifications that reflect the prevailing traffic,
climatic, terrain and materials characteristics in the country.
Key activities in the selected projects include laboratory testing, construction of demonstration and
trial sections, monitoring pavement performance, data collection and analysis and reporting the
results with recommendations for any changes to existing pavement design standards and
specifications. The parameters to be measured include traffic volume and composition, pavement
and materials properties, climatic conditions and construction options for different terrain.
The project described in this report is part demonstration and part research in that it builds on
previous research in other countries whilst providing additional information on in-situ moisture
sensitivity for some of the lateritic material found in Ethiopia. Analysis of the performance data will
enable the Ethiopia Road Authority to confirm or refine the ‘Low Volume Roads’ design manual.
2 Site selection
Locations for trial sections to be established in Ethiopia were identified from consultations with ERA and various regional representatives as described in the Site Selection Report (Otto, 2010). Criteria for site selection were agreed as follows:
1. All demonstration and trial test sections to be sealed by way of surface treatment.
2. At least 2 test sections to be an upgrade of what would have been a gravel road to surface treatment.
3. At least 2 test sections to be modified from what would have been asphalt concrete to surface treatment. Control sections can be in the original design for comparison purposes.
4. One test section to be on “black cotton” soil.
2
5. At least 4 out of 5 test sites to be on ERA roads. This will largely simplify logistics associated with construction of the test sections and allow test sections to carry relatively higher traffic during the short monitoring period.
Some changes in emphasis and priority have subsequently been made due to the change in primary responsibility for the research being transferred from the regions to ERA but the above rational has broadly been retained in the selection of the trial described in this report.
The conceptual matrix used in the site selection criteria is shown in Table 2.1.
49+980-50+020 (B/S) 1.25 1.48 −− 20.03 17.13 Not in section
49+280-49+540 (L/S) 1.51 1.48 √ 20.88 17.13 √
49+280-49+540 (L/S) 1.50 1.48 √ Missing 17.13
49+650-49+760 (L/S) 1.49 1.48 √ 20.54 17.13 ++
49+280-49+540 (C/S) 1.51 1.48 √ 19.72 17.13 √
49+650-49+760 (C/S) 1.51 1.48 √ 21.53 17.13 √
49+280-49+540 (R/S) 1.45 1.48 − 21.36 17.13 ++
49+650-49+760 (R/S) 1.48 1.48 √ 20.28 17.13 ++
Project design values
being used for quality
control:
Final
Remarks
MC3000 Bitumen (kg/m2) 19mm Chippings (kg/m2)
1.50kg/m2 or 1.55l/m2 17.55kg/m2 or 0.013m3/m2
Chainage
11
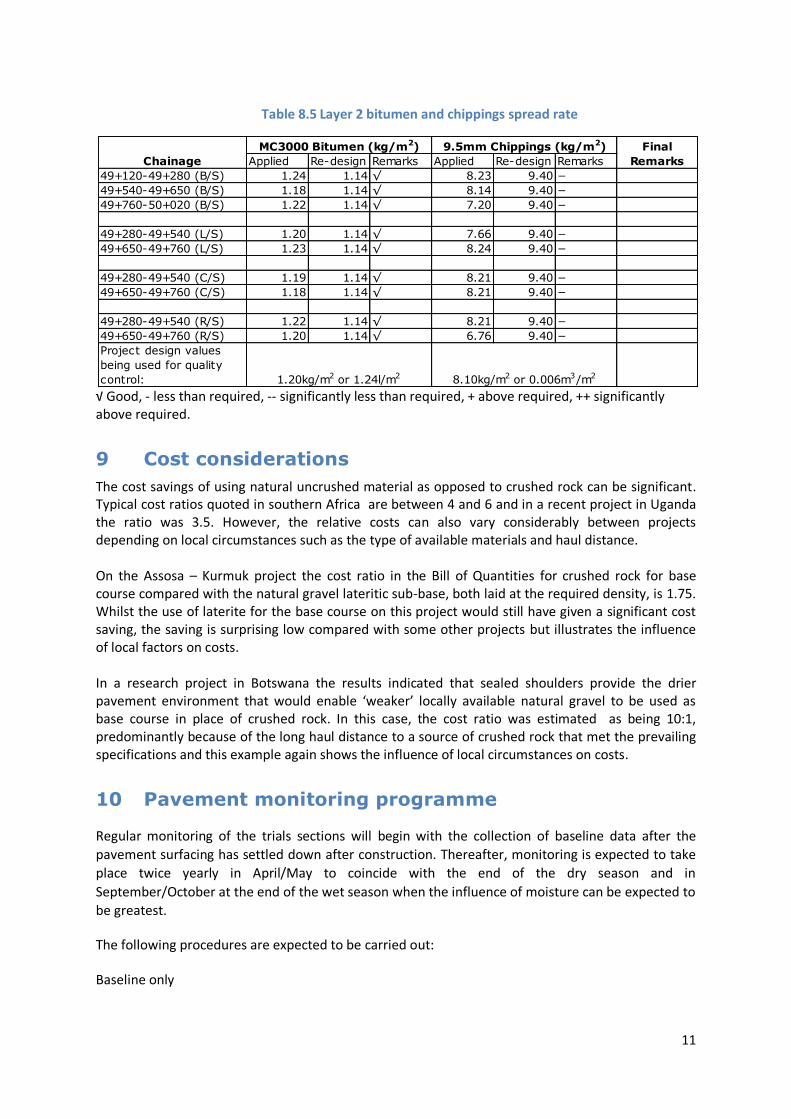
Table 8.5 Layer 2 bitumen and chippings spread rate
√ Good, - less than required, -- significantly less than required, + above required, ++ significantly above required.
9 Cost considerations
The cost savings of using natural uncrushed material as opposed to crushed rock can be significant. Typical cost ratios quoted in southern Africa are between 4 and 6 and in a recent project in Uganda the ratio was 3.5. However, the relative costs can also vary considerably between projects depending on local circumstances such as the type of available materials and haul distance. On the Assosa – Kurmuk project the cost ratio in the Bill of Quantities for crushed rock for base course compared with the natural gravel lateritic sub-base, both laid at the required density, is 1.75. Whilst the use of laterite for the base course on this project would still have given a significant cost saving, the saving is surprising low compared with some other projects but illustrates the influence of local factors on costs. In a research project in Botswana the results indicated that sealed shoulders provide the drier pavement environment that would enable ‘weaker’ locally available natural gravel to be used as base course in place of crushed rock. In this case, the cost ratio was estimated as being 10:1, predominantly because of the long haul distance to a source of crushed rock that met the prevailing specifications and this example again shows the influence of local circumstances on costs.
10 Pavement monitoring programme
Regular monitoring of the trials sections will begin with the collection of baseline data after the
pavement surfacing has settled down after construction. Thereafter, monitoring is expected to take
place twice yearly in April/May to coincide with the end of the dry season and in
September/October at the end of the wet season when the influence of moisture can be expected to
be greatest.
The following procedures are expected to be carried out:
The above sampling and testing procedures are aimed at confirming the as-constructed condition of each of the test sections.
Baseline and subsequent monitoring
Classified traffic counts
Daily classified traffic counts will be undertaken during monitoring
Axle loading
Axle load surveys will be carried out, initially every 6 months, and subsequently at longer intervals when the traffic growth trend has stabilised, so that the actual loading can be related to pavement performance.
Rut depth
If there is considerable moisture ingress then one mode of deterioration of gravel road bases is increased rutting, especially in the outer wheel path, which can be susceptible to moisture ingress. Comparison of any rutting that might occur on the sections with sealed and unsealed shoulders will be an important part of the research.
Strength (DCP/CBR)
Pavement Strength tests in a vertical pavement profile will be carried out using a Dynamic Cone Penetrometer (DCP) at the offset positions indicated below.
Moisture content
Moisture contents at various depths will be measured by taking samples of material for laboratory testing by the specified method and at same position as the DCP at the offsets shown below.
Deflection Beam/FWD
Pavement stiffness will be measured by a deflection beam or possibly by using a Falling Weight Deflectometer (FWD).
Cross sectional moisture and strength tests will be carried out at the following positions at selected locations along the road:
-4.5 -4.0 -3.0 -2.5 CL +2.5 +3.0 +4.0 +4.5
The number of cross sectional measurements to be taken on each section of the trials in each monitoring period will be sufficient to provide results with adequate statistical confidence. Systems will be put in place to enable the time series data to be systematically recorded and analysed.
13
11 References
Gourley, S. C., & Greening, P. A. K. (1999), Performance of Low-Volume Sealed Roads: Results and Recommendations from Studies in Southern Africa (PR/OSC/167/99). Crowthorne: Transport Research Laboratory. Otto, A. (2010). Development of Pavement Design Standards for Low Volume Roads in Ethiopia – Site Selection Report (RPN1276). Crowthorne: Transport Research Laboratory (Report available on direct personal application only).
14
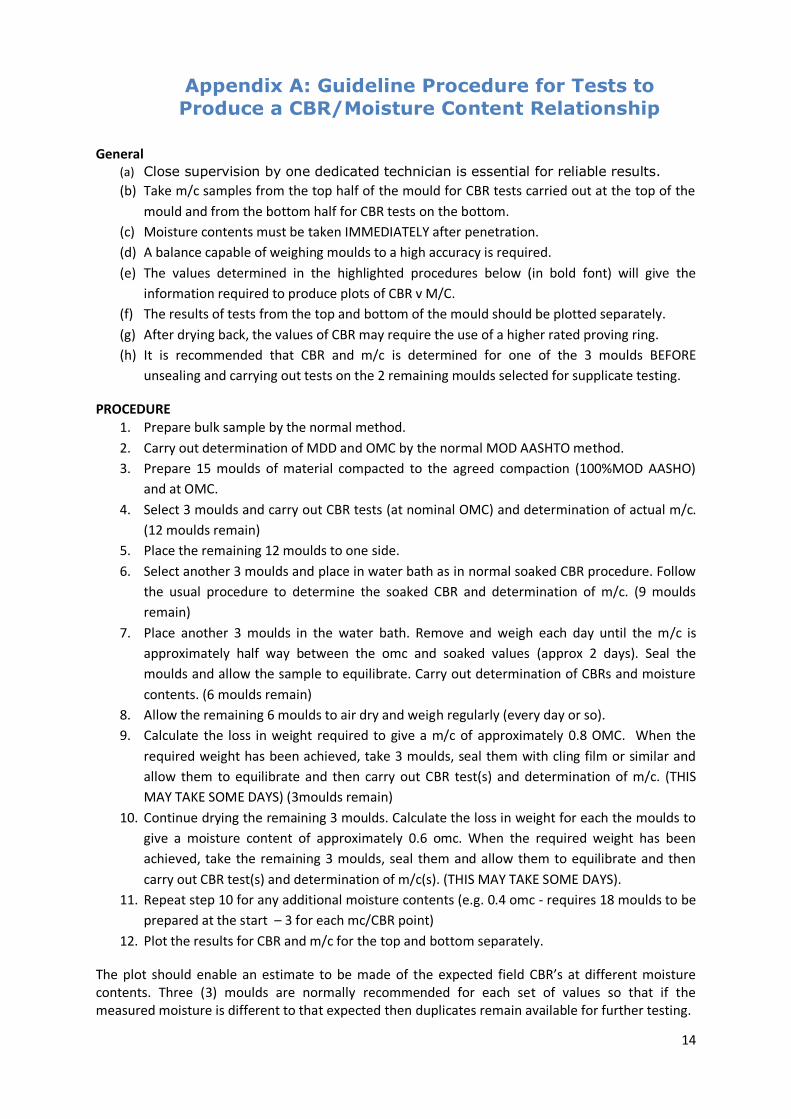
Appendix A: Guideline Procedure for Tests to
Produce a CBR/Moisture Content Relationship
General
(a) Close supervision by one dedicated technician is essential for reliable results.
(b) Take m/c samples from the top half of the mould for CBR tests carried out at the top of the
mould and from the bottom half for CBR tests on the bottom.
(c) Moisture contents must be taken IMMEDIATELY after penetration.
(d) A balance capable of weighing moulds to a high accuracy is required.
(e) The values determined in the highlighted procedures below (in bold font) will give the
information required to produce plots of CBR v M/C.
(f) The results of tests from the top and bottom of the mould should be plotted separately.
(g) After drying back, the values of CBR may require the use of a higher rated proving ring.
(h) It is recommended that CBR and m/c is determined for one of the 3 moulds BEFORE
unsealing and carrying out tests on the 2 remaining moulds selected for supplicate testing.
PROCEDURE 1. Prepare bulk sample by the normal method.
2. Carry out determination of MDD and OMC by the normal MOD AASHTO method.
3. Prepare 15 moulds of material compacted to the agreed compaction (100%MOD AASHO)
and at OMC.
4. Select 3 moulds and carry out CBR tests (at nominal OMC) and determination of actual m/c.
(12 moulds remain)
5. Place the remaining 12 moulds to one side.
6. Select another 3 moulds and place in water bath as in normal soaked CBR procedure. Follow
the usual procedure to determine the soaked CBR and determination of m/c. (9 moulds
remain)
7. Place another 3 moulds in the water bath. Remove and weigh each day until the m/c is
approximately half way between the omc and soaked values (approx 2 days). Seal the
moulds and allow the sample to equilibrate. Carry out determination of CBRs and moisture
contents. (6 moulds remain)
8. Allow the remaining 6 moulds to air dry and weigh regularly (every day or so).
9. Calculate the loss in weight required to give a m/c of approximately 0.8 OMC. When the
required weight has been achieved, take 3 moulds, seal them with cling film or similar and
allow them to equilibrate and then carry out CBR test(s) and determination of m/c. (THIS
MAY TAKE SOME DAYS) (3moulds remain)
10. Continue drying the remaining 3 moulds. Calculate the loss in weight for each the moulds to
give a moisture content of approximately 0.6 omc. When the required weight has been
achieved, take the remaining 3 moulds, seal them and allow them to equilibrate and then
carry out CBR test(s) and determination of m/c(s). (THIS MAY TAKE SOME DAYS).
11. Repeat step 10 for any additional moisture contents (e.g. 0.4 omc - requires 18 moulds to be
prepared at the start – 3 for each mc/CBR point)
12. Plot the results for CBR and m/c for the top and bottom separately.
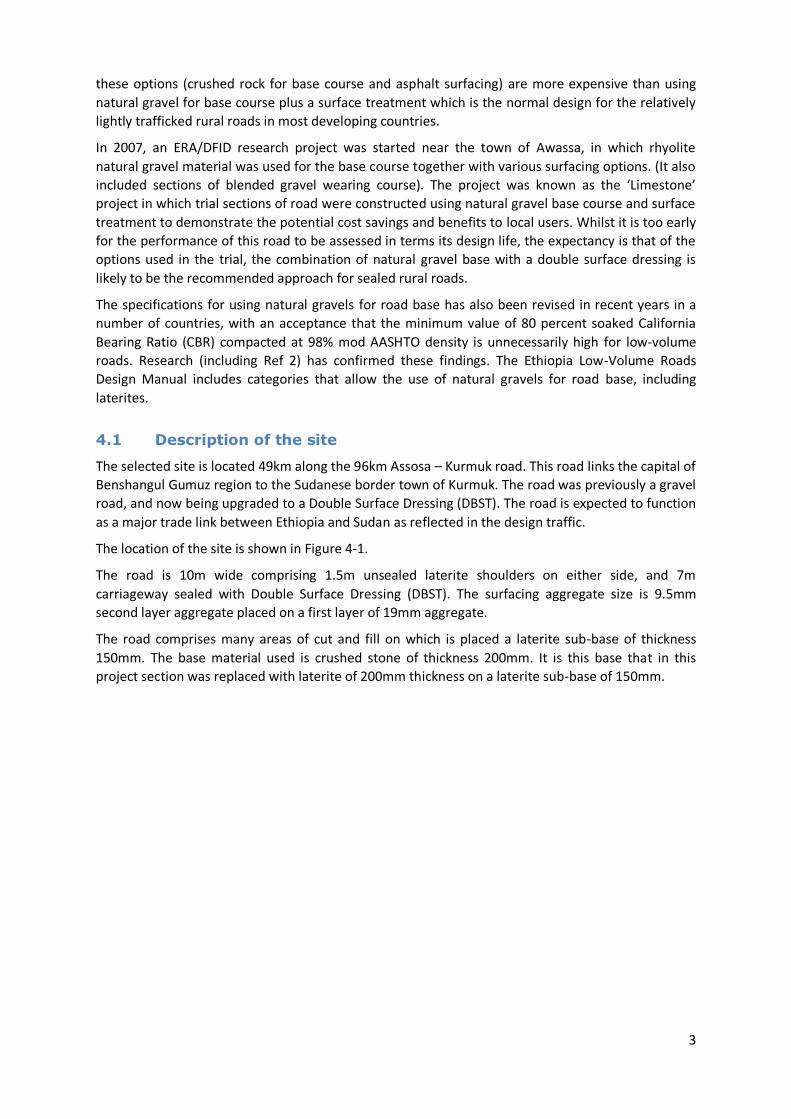
The plot should enable an estimate to be made of the expected field CBR’s at different moisture contents. Three (3) moulds are normally recommended for each set of values so that if the measured moisture is different to that expected then duplicates remain available for further testing.
15
Appendix B: Bill of Quantities
16
Item Description Unit Quantity.
1 Gravel Preparation
1.1
Stockpile laterite gravel at the borrow pit at
chainage 55+700 as directed by consultant. m³ 1,670
1.2
Haul stockpiled laterite gravel from borrow pit at
chainage 55+700 to work location between
chainages 49+120 to 49+970. m³km 10,400
2 Earthworks
2.1
Prepare cut to levels and slopes as specified in the
original contract documents.
2.2
Prepare fill to levels, slopes, materials and strengths
as specified in the original contract documents.
3 Sub-Base Layer
3.1
Prepare and construct sub-base layer to thickness,
levels, slopes, materials and strengths as specified
in the original contract documents.
3.2
Allow at least 21 days for Sub-Base layer to dry
back. Absolutely no traffic is permitted on the
compacted layer during this period. Allow sum for
traffic control. Sum 1
4 Shoulders
4.1
Prepare and construct shoulders to thickness,
levels, slopes, materials and strengths as specified
in the original contract documents.
4.2
Allow at least 21 days for constructed layer to dry
back. Absolutely no traffic is permitted on the
compacted layer during this period. Allow sum for
traffic control. Sum 1
5 Base Layer
5.1
Spread the laterite gravel 7m wide in between
shoulders previously constructed, water to about
2% less than Optimum Moisture Content, compact
to finished thickness of 200mm, transverse slope of
2.5% and density of 98%MDD Mod AASHTO. The
contractor shall devise compaction methods and
techniques to ensure that the densification is
uniform through out the 200mm thickness. m³ 1,190
5.2
Ensure final base surface is truly level and
transversely sloped to 2.5%. Sum 1
5.3
Trim outer edges of pavement layers to achieve
designed side drain dimensions and slopes as per
original contract.
5.4
Allow at least 21 days for constructed layer to dry
back. Absolutely no traffic is permitted on the
compacted layer during this period. Allow sum for
traffic control. Sum 1
6 Drainage
6.1
Construct as specified in the original contract
documents.
7 Surfacing
7.1
Apply priming to the constructed base layer from
chainage 49+120 to 49+970; MC30 at 0.8l/m2. m2 5,950
7.2
Additionally apply priming to shoulders on both
sides of the carriageway from chainage 49+225 to
49+580; MC30 at 0.8l/m2 . m2 1,065
7.3
Construct surface dressing layers to materials,
dimensions, methods and quality as specified in
original contract documents. Additionally if full
width spraying is not used, then the joints of each
surface dressing layer must be staggered away
from each other.
7.4
Additionaly construct surfacing on shoulders to
the same specifications and quality as that applied
to the carriageway; as shown in the drawings
provided on both shoulders at chainages 49+225 to
49+580. m2 1,065
17
Bill of Quantities (cont)
8 Road Furniture
8.1
Install all signposting required within the sections as
specified in the original contract.
8.2
Fabricate galvanized rectangular plate 1.0m long x
0.8m wide. The plate should be fitted on 2
galvanized steel pipes 4.0m long and 100mm
diameter each. Fit the plate by 2 bolts and 2 nuts
on each pipe and weld the nut heads to avoid
theft. Weld 4 steel hooks at the bottom end of
each pipe. Install fabricated signposting at least 1m
off the outer edge of the side drain in 2 concrete
foundations 0.4mX0.4m X 1.0 m. Chainages 49+120
and 49+970. No. 2
8.3
Mark lane edges and centreline using Ethiopian
standard colour paints and spacings. m 2,550
8.4
Install marker posts, same design as per original
contract, on the outer edge of the shoulder at
chainages 49+225, 49+330, 49+460, 49+580,
49+700 No. 5
9 Laboratory Services
9.1
Allow sum for laboratory testing of Gradation,
Atterberg limits and MDD. Samples 6
9.2 Allow for testing in situ compaction and moisture. Points 5