DEVELOPMENT OF ROCK MECHANICS PROPERTIES DATABASE - PROGRESS REPORT Prepared for Nuclear Regulatory Commission Contract NRC-02-93-005 Prepared by Sui-Min (Simon) Hsiung Amitava Ghosh Gerry L. Stirewalt Brent Henderson Craig A. Fenrich Rui Chen Center for Nuclear Waste Regulatory Analyses San Antonio, Texas July 1995
Transcript
DEVELOPMENT OF ROCK MECHANICS PROPERTIESDATABASE - PROGRESS REPORT
Center for Nuclear Waste Regulatory AnalysesSan Antonio, Texas
July 1995
ABSTRACT
The objective of this report is to document progress to date in development of a rock mechanicsproperties database. The approach adopted for developing the rock mechanics properties database is tobuild submodel(s), using EarthVision software and the currently existing three-dimensional (3D)geological framework model for Yucca Mountain, Nevada, developed by the Geology and GeophysicsElement of the Center for Nuclear Waste Regulatory Analyses. Rock mechanics properties to be includedin the database are intact rock properties, joint properties including information related to joint geometry,rock thermal properties, hydrological properties, and values of parameters necessary for rock massclassifications using the Rock Mass Rating and the Norwegian Geotechnical Institute Tunnelling QualityIndex, Q, systems. Rock mass properties can be generated using various relevant properties containedin the database. All four methods in the present version of EarthVision software which were evaluatedin this study exhibit difficulties with incorporating and graphically representing the geometry-relatedproperties of joints in the 3D geological framework model. Extensive effort would be required if thepresent version of EarthVision software were to be used for representing joints in the 3D geologicframework model. Incorporation of an underground excavation in the 3D model is not straightforward.Both methods available in the present version of EarthVision software require an extensive amount of userinvolvement to define the tunnel. Moreover, it is difficult to develop a map of joint network on the tunnelsurfaces with acceptable quality. Consequently, use of the EarthVision software for representing jointsin the 3D geologic framework model as part of database development is not recommended at this time.However, the EarthVision software will still be used for representing variability of rock and jointproperties. In FY96, data collection for the rock properties identified in this report will be initiated.
1 INTRODUCTION ............................1.1 BACKGROUND AND OBJECTIVE .............1.2 SCOPE ...............................
2 ROCK MECHANICS AND HYDROLOGICAL PROPERTIES
. viiviii
. ix
. xi
1-11-11-2
.
2.1 INTACT ROCK PROPERTIES . . . . . . . . . .2.1.1 Rock Properties for Elastic Model .........2.1.2 Properties for Mohr-Coulomb Model .......2.1.3 Properties for Drucker-Prager Model .......2.1.4 Properties for Ubiquitous Joint Model .......2.1.5 Rock Thermal Properties ...............
2.2 JOINT PROPERTIES ......................2.2.1 Joint Mechanical Properties .............2.2.1.1 Mohr-Coulomb Joint Model .............2.2.1.2 Barton-Bandis Joint Model ..............2.2.1.3 Continuously-Yielding Joint Model .........2.2.2 Joint Geometrical Properties .............
2.3 HYDROLOGICAL PROPERTIES ..............2.4 PROPERTIES FOR ROCK MASS CLASSIFICATIONS
. .
2-12-12-12-22-22-22-32-32-32-42-42-52-52-62-6
:.
3 FEASIBILITY ASSESSMENTFOR INCORPORATING ROCK MECHANICS PROPERTIESIN THE 3D GEOLOGICAL FRAMEWORK MODEL ........................3.1 REPRESENTATION OF JOINTS ................................
3.1.1 Essential Joint Data ....................................3.1.2 Modeling Requirements ..................................3.1.2.1 Accommodating Large Numbers of Joints .......................3.1.2.2 Displaying and Downloading Joint Trace Information in Cross Sections ....3.1.2.3 Three-Dimensional Joint Displays and Joint Data Exporting ...........3.1.2.4 Minimum Operator and Central Processing Unit Time to Construct
Three-Dimensional Models ................................3.1.2.5 Minimum Disk Space Requirements ..........................3.1.3 Approaches Considered ..................................3.1.3.1 Method 1 - Merged Faces File .............................3.1.3.2 Method 2 - Volume Model ...............................3.1.3.3 Method 3 - pdat 3D Display ..............................3.1.3.4 Method 4 - Annotation Cross Section Display ...................3.1.4 Summary ...........................................
3-13-13-13-13-13-13-1
3-23-23-23-23-43-43-63-6
v
0 0
CONTENTS (Cont'd)
Section Page
3.2 TUNNEL MODELING ....................................... 3-63.2.1 Approaches Considered .................................. 3-63.2.1.1 Tunnel Modeled as 3grd Fault Using EarthVision Version 2.9 Beta ....... 3-73.2.1.2 Tunnel Modeled as a Zone and Block Using an Unreleased Version
of EarthVision ........................................ 3-93.3 ROCK PROPERTY MODELING ................................. 3-9
3-1 Test case joints modeled using the EarthVision software merged faces file method, with displayproduced using the EarthVision 3D Viewer tool. The lithostratigraphic model has been slicedback to expose the joint surfaces. ..................................... 3-3
3-2 Two representations of test case joints using the EarthVision software Geological StructureBuilder to produce a 3D volume model. (a) Joints as displayed using the EarthVision 3DViewer tool. (b) Joints represented as intersection lines in a cross section created from thevolume model ................................................. 3-5
3-3 The first 1,500 m of the ESF tunnel modeled using EarthVision Version 2.9 Beta. Grid sizeused to construct the model is 5 m, producing the irregular wall surfaces of the tunnel ... . 3-8
3-4 The entire ESF tunnel modeled by Dynamic Graphics, Inc. using an unreleased version ofEarthVision. Note the smoothness of the tunnel walls ........................ 3-10
vii
0 0
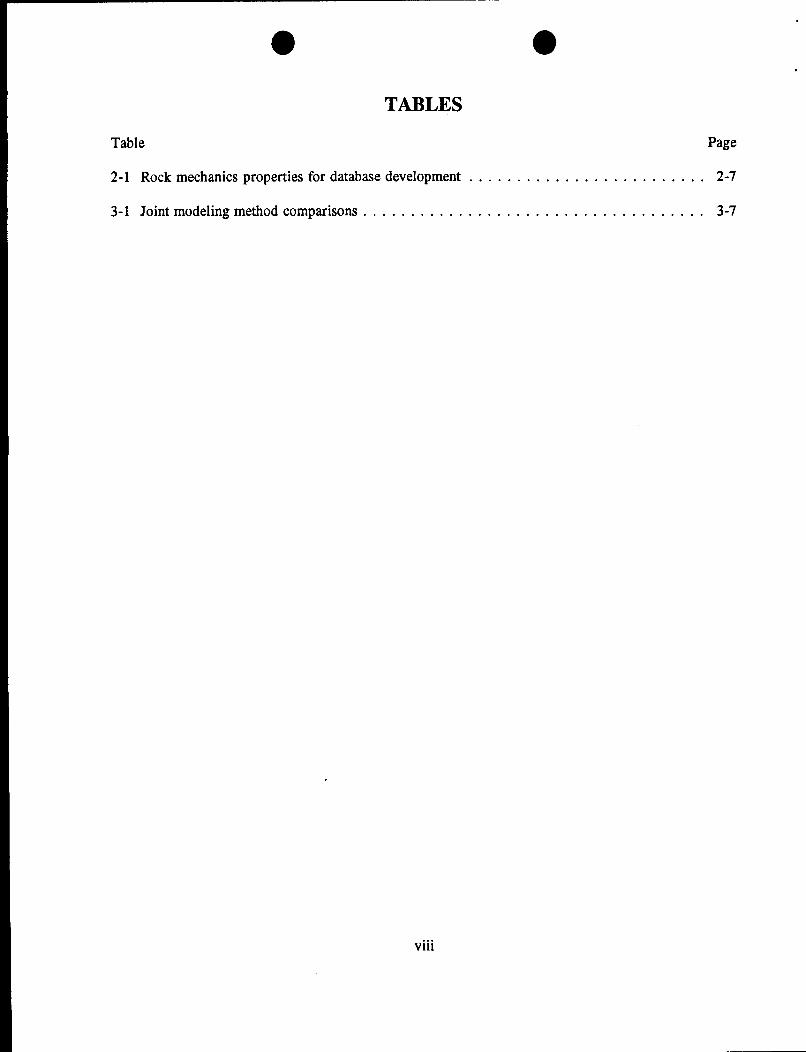
TABLES
Table Page
2-1 Rock mechanics properties for database development ........ ................. 2-7
This report was prepared to document work performed by the Center for Nuclear Waste RegulatoryAnalyses (CNWRA) for the Nuclear Regulatory Commission (NRC) under Contract No. NRC-02-93-005.The activities reported here were performed on behalf of the NRC Office of Nuclear Material Safety andSafeguards (NMSS), Division of Waste Management (DWM). This report is an independent product ofthe CNWRA and does not necessarily reflect the views or regulatory position of the NRC.
The authors thank M.P. Ahola and W.C. Patrick for their review of this report. The authors are alsothankful to Y. Lozano for skillful typing of the report and to J.W. Pryor, who provided a full range ofexpert editorial services to the preparation of the final document.
QUALITY OF DATA, ANALYSES, AND CODE DEVELOPMENT
DATA: Only "synthetic data" were utilized in this database development progress report.
SOFTWARE QUALITY ASSURANCE: The EarthVision software (Version 2.9 Beta) was used in thisreport. This software is commercially available. However, the CNWRA does not have access to thesource code; therefore, it is not controlled under the CNWRA Software Configuration Procedures.
ix
* * / %j
EXECUTIVE SUMMARY
The ongoing Rock Mechanics Research Project under the Repository Design, Construction, andOperations (RDCO) Program Element of the Center for Nuclear Waste Regulatory Analyses (CNWRA)is developing an understanding of the critical parameters associated with Key Technical Uncertainties(KTUs) that are related to prediction of thermal-mechanical (TM) effects on emplacement drift stabilityand thermal-mechanical-hydrological (TMH) effects on the host rock surrounding the engineered barriersystem. After the critical parameters have been identified, realistic near-field rock mechanics analysesusing site-specific data will be required to bound or quantify the effects of these parameters in the contextof the Yucca Mountain (YM) site so that the Nuclear Regulatory Commission (NRC) staff can reviewthe U.S. Department of Energy (DOE) license application in a timely manner. In this context, a rockmechanics properties database is needed to facilitate analyses and modeling related to rock mechanics andTMH coupling.
The approach adopted for developing the rock mechanics properties database is to build a submodel(s)in the three-dimensional (3D) geological framework model for YM, Nevada, which has been developedby the Geology and Geophysics Element of the CNWRA. This 3D geological framework model is to beused by NRC staff during both prelicensing and licensing phases to assess geological models producedby the DOE and its contractors for analysis of site suitability, design considerations, and repositoryperformance. Three steps have been proposed for the construction of a rock mechanics submodel(s) ofthe 3D framework model: (i) identify actual data needs for rock mechanics-related activities, (ii) identifythe source and obtain the data, and (iii) develop the submodel(s). The activity in FY95 focuses on the firststep and assessing the capability of the current 3D geological framework model for representing joints,other rock mechanics property data, and tunnels.
Rock mechanics properties identified in this report are categorized in terms of intact rock properties, jointproperties including joint geometry related properties, rock thermal properties, hydrological properties,and parameter properties for rock mass classifications using the Rock Mass Rating (RMR) and theNorwegian Geotechnical Institute (NGI) Tunnelling Quality Index, Q, systems. Some of the parametersidentified in the report are derived quantities and may not be directly available. Consequently, relevanttest results will need to be collected and processed for generating these parameters.
Modeling material properties (e.g., uniaxial compressive strength) is found to be straightforward. Theproperty values can be added to different lithostratigraphic units in the 3D geological framework model.If sufficient spatial data are available, a 3D submodel with the rock property data can then be built usingthe methods available in the EarthVision software. This approach has been used successfully at theCNWRA to include porosity and saturated hydraulic conductivity properties for characterizinghydrostratigraphic units in a 3D block model. In FY96, gathering of the rock mechanics propertiesidentified in this report and constructing corresponding submodels for the 3D geological framework modelwill begin.
None of the four methods evaluated in this study can be used without considerable difficulty inincorporating and representing joints in the 3D geological framework model using the EarthVisionsoftware. It is recommended that no further effort be made to use the present version of EarthVision asa tool for representing joints in the 3D geologic framework model in the context of rock mechanicsproperties database development at this time.
xi
0 0
Incorporation of an underground opening into the 3D geologic framework model is neither quick norstraightforward. Two methods available in the EarthVision software were tested to include a tunnel inthe model. The amount of preprocessing necessary before incorporating such features into the model isextensive even for a single tunnel. For multiple intersecting tunnels, this preprocessing is excessive.Moreover, the final quality of the joint network map on the tunnel surfaces was of unacceptable quality.It is recommended not to further pursue the use of EarthVision software as a tool for representing theunderground excavations in connection with rock mechanics properties database development.
xii
1 INTRODUCTION
1.1 BACKGROUND AND OBJECTIVE
The proposed high-level nuclear waste repository at Yucca Mountain (YM), Nevada, is to beexcavated about 350 m beneath the surface in the densely welded and devitrified part of the TopopahSpring (TSw2 unit) member of the Paintbrush tuff. The proposed emplacement horizon is about 225 mabove the water table. The YM area is characterized by north to northwest trending mountain rangescomposed of volcanic and volcanoclastic strata that dip eastward. The strata are broken into en-echelonfault blocks. The geomechanical conditions at the site are characterized by a highly jointed rock mass withprominent vertical and subvertical faults and joints.
The emplacement of radioactive waste in this geologic medium will cause major perturbationsto the medium involving coupled thermal, mechanical, hydrological, and chemical processes. Three KeyTechnical Uncertainties (KTUs) have been identified that, among others, could pose a high risk ofnoncompliance with the performance objectives of 10 CFR Part 60. These KTUs are related to thepredictions of (i) thermal-mechanical (TM) (including repetitive seismic load) effects on stability ofemplacement drifts and the Engineered Barrier System (EBS), (ii) thermal-mechanical-hydrological(TMH) (including repetitive seismic load) effects on the host rock surrounding the engineered barriersystem, and (iii) the long-term performance of seals for shafts, ramps, and surface and subsurfaceboreholes. An extensive effort is being made in the ongoing Rock Mechanics Research Project under theCenter for Nuclear Waste Regulatory Analyses (CNWRA), Repository Design, Construction, andOperations (RDCO) Program Element in developing an adequate understanding of the critical parametersassociated with these KTUs and an approach to reduce the uncertainty among these parameters. Theultimate goals of the research project are to develop a sound base for evaluating the U.S. Department ofEnergy (DOE) license application and to provide timely guidance to the DOE.
Upon identifying and understanding the critical parameters of the KTUs, realistic near-field rockmechanics analyses to bound or quantify the effects of these parameters in the context of the YM site willbe performed to better prepare the reviewers for the relevant license review. These analyses will requiresite-specific information (data). It is understood that, at this time, such information for the site is verylimited and scattered in various documents. Consequently, gathering of this information for analysespurposes is tedious, difficult, and time-consuming. A rock mechanics properties database would facilitatethe rock mechanics and TMH coupling related analyses and modeling, especially when the DOE iscurrently conducting site characterization activities and the gathering data is gradually becoming available.
The Geology and Geophysics Element of the CNWRA is developing a three-dimensional (3D)geological framework model for YM, Nevada. The objective of this geological framework model is toprovide the basic geological framework within which variations in geological parameters and features bothin and adjacent to the potential repository area can be viewed and analyzed, submodels can beconstructed, and alternative models can be considered. This 3D geological framework model will be usedby the Nuclear Regulatory Commission (NRC) staff during both prelicensing and licensing phases toevaluate the geological models produced by the DOE and its contractors for analysis of site suitability,design considerations, and repository performance. The 3D model will be used in areas related to regionalfaulting, seismicity, volcanism, and regional hydrology to address several KTUs. To broaden the utilityof this 3D framework model for use in near-field rock mechanical analyses, a submodel(s) thatincorporates rock mechanical and hydrological properties needs to be constructed.
1-1
* m
The rock properties database is envisioned to have the following characteristics. The databaseshould include the TM units along with the faults and major joints mapped within the model boundaries.Different material properties, measured from the cores recovered from different boreholes within themodel boundaries, will be incorporated in the model. The value of a particular property at a givenlocation at which no measurement is available may be estimated from nearby known locations throughsome interpolation technique. The database should be able to create multiple underground excavationswhen needed. It should be possible to visualize the joint pattern and distribution of any required materialproperty along the length of each excavation at any specified cross section or a 3D block. Provisionshould also exist to export necessary information regarding the joint and material properties along anysection through the model or any given 3D block for further analyses.
Three steps have been proposed for the construction of a rock mechanics submodel(s) withinthe 3D framework model. The first step is to identify actual data needs for rock mechanics relatedactivities. The second step is to identify the source and gather the data, and the third step is to developthe submodel(s).
1.2 SCOPE
The focus of rock mechanics properties development in FY95 is to complete the first step. Thespecific activities include:
* Identification of rock mechanics properties and geological information necessary forevaluating emplacement drift stability and retrievability. The identification of data needs isguided by consideration of potential methodologies and tools to be used for the evaluation.
* Identification of hydrological properties that are important for analysis of coupled effects onrepository design and performance. These needs are categorized in terms of objectives of theanalyses, methodologies, and tools to be used for the analyses.
* Assessment of the capability of the current 3D geological framework model for constructinga submodel(s) to include the data identified in the previous two items.
1-2
2 ROCK MECHANICS AND HYDROLOGICAL PROPERTIES
The rock mechanics and hydrological properties needed to facilitate near-field rock mechanics and TMHcoupled analyses and modeling may be divided into two major groups: intact rock properties andjoint-related properties. Another important group of parameters is related to rock mass classifications,mainly for the Rock Mass Rating (RMR) (Bieniawski, 1974; 1976) and the Norwegian GeotechnicalInstitute (NGI) Tunnelling Quality Index, Q, systems (Barton et al., 1974). These parameters will be usedin review of the DOE ground support design for the Exploratory Studies Facilities (ESF) and undergroundfacility. The properties associated with these three groups are presented in the following sections alongwith a separate section for the hydrological properties. It is recognized that rock mass properties aresometimes necessary for near-field rock mechanics and TMH coupled analyses, depending upon theintended objectives. These rock mass properties are not proposed to be included in the database becausethey can be derived or calculated based on various available empirical equations using the relevantparameter values listed in this database.
2.1 INTACT ROCK PROPERTIES
Since the focus for the development of rock mechanics database is to provide informationnecessary for numerical simulation of underground structures, the properties needed for intact rock arepresented in terms of constitutive laws that conceptually represent the material behavior. Several basicconstitutive laws are commonly included in most (both finite and discrete element) numerical codes. Theyinclude elastic, Mohr-Coulomb plasticity, Drucker-Prager plasticity, Hoek and Brown, and ubiquitousjoint models. The data required for the Hoek and Brown failure model are not discussed here becausethe Hoek and Brown model deals with rock mass behavior. Therefore, the data required are likely torepresent an entire or a large portion of a rock unit. Consequently, they do not need to be incorporatedinto the 3D geological framework model.
2.1.1 Rock Properties for Elastic Model
The elastic model describes the simplest form of material behavior and is valid forhomogeneous, isotropic, and continuous material. The stress and strain relation follows Hooke's law. Thefundamental properties required for this model are:
* Unit weight, Af, or mass density, p* Young's modulus, E* Poisson's ratio, v
Alternatively, E and v may be replaced by shear modulus (G) and bulk modulus (K).
Ordinarily, the elastic model is used for a preliminary analysis so that a basic understanding canbe obtained. The resultant understanding will then help determine the amount of detail for subsequentanalysis to solve the problem. Normally, one of the first requirements is to evaluate the potential foryielding or failure due to concentration of stresses. To perform such an evaluation, additional materialmodels are needed, for example, Mohr-Coulomb plasticity, Drucker-Prager plasticity, Hoek and Brown,and ubiquitous joint models. Specific data needed for the Mohr-Coulomb plasticity, Drucker-Pragerplasticity, and ubiquitous joint models are presented in the following subsections.
2-1
* v
2.1.2 Properties for Mohr-Coulomb Model
The Mohr-Coulomb model is most commonly used to determine the plasticity of geomaterials.Material properties included in the Mohr-Coulomb yield criterion for describing the shear yielding are:
* Friction angle, 4* Cohesion, c
For describing yielding caused by tension, a tension limit or strength (7) is necessary. After the yieldcriterion is reached, plastic flow is assumed to occur.
If a nonassociated shear flow rule is considered, then an additional material property, dilationangle (v), is required. It should be noted that the Mohr-Coulomb criterion includes only the major andminor principal stresses in the formulation; the intermediate principal stress is assumed to have no effect.
2.1.3 Properties for Drucker-Prager Model
The Drucker-Prager model is suited for 3D stress analysis since all three principal stresses areconsidered to have an effect on material yielding. This model is used occasionally for two-dimensionalstress analysis. The Drucker-Prager yield function contains two material constants:
* Frictional component of the shear resistance, a* Cohesive component of the shear resistance, X
Usually, the Drucker-Prager yield function is either adjusted to coincide with the outer apicesof the Mohr-Coulomb hexagon, or is inscribed tangentially inside the hexagon (inner bound surface). Ineither case, material properties a and X can be calculated from the cohesion, c, and friction angle, 4.Similar to the Mohr-Coulomb model, if a nonassociated flow rule is used, then an additional materialproperty, dilation angle (i), is required. Also the same as that for the Mohr-Coulomb model, yieldingcaused by tension is governed by a tension limit/strength.
For either the Mohr-Coulomb or Drucker-Prager yield functions, the yield surfaces can hardenor soften according to certain hardening/softening rules based on the variation of the cohesion, friction,and dilatancy with plastic strain through the use of hardening parameters that record some measure ofaccumulated plastic strain. The number of hardening/softening parameters used depends on thehardening/softening rules selected and is usually material specific. These hardening/softening rules andparameters need to be determined through specific testing programs and constitutive model studies. Theywill not be included as basic material properties for the 3D framework model of YM at this stage.
2.1.4 Properties for Ubiquitous Joint Model
The ubiquitous joint model is an anisotropic plasticity material model. This model assumes thata solid is made of an assemblage of thin elements bounded by parallel weak planes. The behavior of theinterfaces between two neighboring elements may be governed by various yielding criteria. The mostcommonly used is the Mohr-Coulomb model. It is also possible for yielding of the solid to occur.Consequently, material properties for both the interface and solid are necessary, if the complete
2-2
* * I7I/
deformation behavior of a ubiquitous joint solid is to be evaluated. The most common material propertiesused for the ubiquitous joint model include:
Other properties that may be included in the ubiquitous joint model are joint dilation angle (0j)and joint spacing (Sj).
2.1.5 Rock Thermal Properties
The following thermal properties are needed for thermal analysis:
* Thermal expansion coefficient, ft* Specific heat, C* Thermal conductivity, kh* Thermal diffusivity, a,
The thermal expansion coefficient, S, is needed to calculate thermal expansion. If linear andisothermal conditions are assumed, , is a constant for each lithostratigraphic unit. However, it is possiblethat , is a function of temperature. Specific heat and thermal conductivity are needed for heat transfer(diffusion) analysis and for coupled temperature-displacement analysis. Usually, there are linear andnonlinear models, the nonlinearity being described by giving conductivity as a function of temperature.
2.2 JOINT PROPERTIES
Joint properties that are of interest include two groups: (i) those that govern the mechanicalbehavior of a joint, and (ii) those related to geometric aspects of joints. Each group is discussedseparately in the following sections.
2.2.1 Joint Mechanical Properties
Joint mechanical properties are important if the behavior of a rock joint is to be simulatedexplicitly in the numerical analysis. Similar to the intact rock properties, the necessary joint mechanicalproperties depend on particular joint constitutive models and their numerical interpretations. Jointconstitutive models commonly used in numerical analyses include: Mohr-Coulomb, Barton-Bandis, and
2-3
0 0
Continuously-Yielding. It should be noted that these joint models are capable of simulating unidirectionalrock joint shear and joint behavior. They have been found inadequate in modeling rock joint shear andjoint behavior under cyclic and dynamic loading conditions (Hsiung et al., 1994). Suitable rock jointmodels for simulating joint cyclic behavior are being developed'. It is not clear if the properties neededfor these new models will be available through the DOE site characterization activities. Therefore, theyare not discussed here. However, the database will be updated when these properties become available.
2.2.1.1 Mohr-Coulomb Joint Model
The Mohr-Coulomb model is the simplest model for determining the strength of rock joints. Thebasic properties necessary for the model include:
Note that these properties are essentially the same as those listed in Section 2.1.4 for the ubiquitous jointmodel. The joint dilation angle, O., is used to simulate joint dilation occurring at the onset of plasticsliding. The Mohr-Coulomb model is an elastic, perfectly plastic model. It does not consider the wearof a joint.
In order to adequately model joint deformation, two parameters are needed:
* Joint normal stiffness, K,* Joint shear stiffness, K,
The joint normal stiffness, K,,, and joint shear stiffness, K3, are assumed to be constant; that is, they areindependent of normal stress.
2.2.1.2 Barton-Bandis Joint Model
In contrast to the Mohr-Coulomb model, the Barton-Bandis joint model was proposed to takeinto consideration the effect of joint surface roughness on joint deformation and strength (Barton et al.,1985). It is a nonlinear joint strength model. Joint parameters in this model include
The attrition of joint surface roughness is usually considered through the reduction of JRC ina piecewise linear fashion. Joint dilation in the Barton-Bandis joint model is assumed to be a function ofJRC. An empirical equation is available for the joint dilation calculation. Therefore, additional
RDCO Task 2.3 activities. A report discussing model development will soon be available.
24
information for the joint dilation angle is not required. The Barton-Bandis joint model assumes a constantK,, while K. may be a constant, or an exponential or a hyperbolic function of normal stress.
2.2.1.3 Continuously-Yielding Joint Model
The Continuously-Yielding model can simulate progressive damage of a joint surface undershear displacement and displays irreversible nonlinear behavior from the onset of shear loading (ITASCAConsulting Group, Inc., 1993; Cundall and Lemos, 1988). The basic parameters used in this model are:
Parameters K,, and K, could be treated as constants in the Continuously-Yielding model orassumed to be exponential functions of joint normal stress. If they are assumed to be functions of jointnormal stress, additional parameters a,,, en, a,, and e, are needed. These parameters are constant values.The basic joint friction angle, Xk, may be the same as the residual joint friction angle, 0 .
It is recognized that some of the joint properties, namely K,,, K,, a e,,, as e, and R for thecorresponding rock joint models, are derived parameters. Since these values may not be readily available,derivation of these parameters from existing laboratory test results may be necessary.
2.2.2 Joint Geometrical Properties
Joint geometrical properties needed in the database include:
* Number of joint sets, Jn* Joint spacing, J,* Joint dimensions* Orientations (dip and strike of each joint or joint set)
The number of joint sets is an important parameter in modeling joints in numerical analysis anda basic parameter for the estimation of the NGI Tunnelling Quality Index, Q, proposed by Barton et al.(1974). This system is used by the DOE in the ground support design of the North Ramp (CRWMSM&O, 1994).
Other important data that need to be collected are the geological mapping data along the ESF.These data are essential for developing various realizations of joint distribution of a particular rock unitof interest. These realizations are expected to provide sufficient bounding of the uncertainties associatedwith the geological mapping data. Each of the realizations will be incorporated into the 3D geologicalframework model, if determined feasible. These realizations will be used for the emplacement driftstability analysis to evaluate the adequacy of ground support design and assess the potential effect of driftinstability on waste packages.
2-5
0 0
2.3 HYDROLOGICAL PROPERTIES
A number of hydrological properties are needed to numerically simulate the effects of coupledTM and TMH processes at YM. These properties include:
Equivalent rock mass permeability may be derived from the matrix and joint permeability ormeasured directly in the field. It is recognized that the joint permeability will need to be generated foreach of the realizations discussed in Section 2.2.2. Data for porosity and water saturations will not becollected in the activities associated with the database development. This information is currentlyincorporated in the 3D geological framework model in a separate activity at the CNWRA.
2.4 PROPERTIES FOR ROCK MASS CLASSIFICATIONS
The DOE uses two rock mass classification methods in the preliminary design of tunnelsupporting system, namely RMR classification and NGI Tunnelling Quality Index, Q (Hardy and Bauer,1989; CRWMS M&O, 1994). To facilitate the design review on the ground support system, it isnecessary to include properties related to these two rock mass classification methods in the rockmechanics property database.
The RMR classification was proposed by Bieniawski (1974; 1976). In this method, five basicclassification parameters are used to obtain a total rock mass rating (or total rating score for a rock mass).The total rock mass rating is then adjusted for joint orientation. The five basic rating parameters are:
* Uniaxial compressive strength, or (alternatively, point load index)* Rock Quality Designation, RQD* Spacing of joints, J,* Condition of joints, J,* Groundwater condition, W,
The RQD is defined as the percentage of core recovered in intact pieces of 100 mm or morein length in the total length of a borehole. The condition of joints accounts for the separation or apertureof joints, their continuity, the surface roughness, the wall condition (hard or soft), and the presence ofinfilling materials in joints. The groundwater condition is determined in terms of the observed rate offlow into the excavation, the ratio of joint water pressure to major principal stress or by some generalqualitative observation of groundwater conditions.
The NGI Tunnelling Quality Index was proposed by Barton et al. (1974), in which an index,Q, for the determination of the tunnelling quality of a rock mass is evaluated according to six basicparameters. These parameters are:
* Rock Quality Designation, RQD* Joint set number, J,,
2-6
(22k
* Joint roughness number, Jr* Joint alteration number, Ja* Stress reduction factor, SRF* Joint water reduction factor, J.
The joint roughness number, J,, accounts for the condition of joint surface and joint wallcontacts. The joint alteration number, Ja, accounts for joint filling conditions and the alternation of joints.Jr and Ja represent the roughness and frictional characteristics of the joint walls or filling materials. TheSRF is a total stress parameter. It measures the loosening load of an excavation through shear zones andclay-bearing rock, rock stress in competent rock, and squeezing loads in plastic incompetent rocks. Thejoint water reduction factor, J,,, is a measure of water pressure.
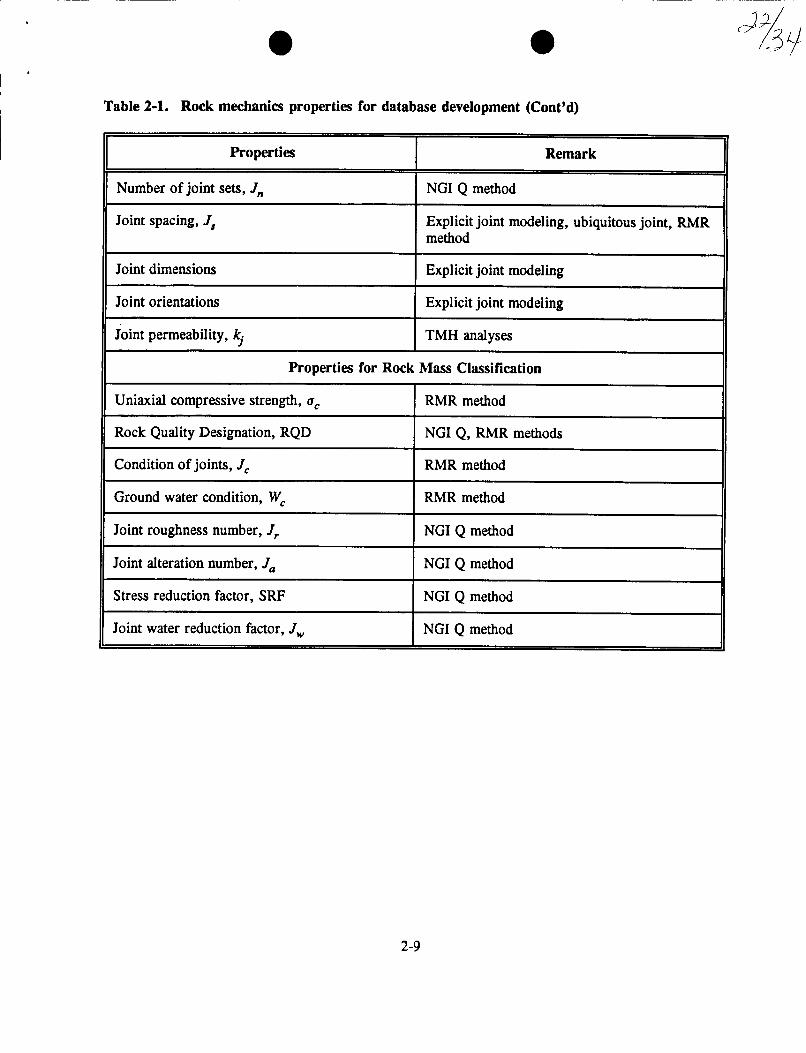
Table 2-1 provides a consolidated list of rock mechanics and hydrological properties to beincluded in the database. Keep in mind that some properties identified in the previous sections can be usedby more than one model. The parameters listed in this table represent the current thinking. If additionalneeds develop in the future, this list will be updated.
Table 2-1. Rock mechanics properties for database development
Properties Remark
Intact Rock Properties
Unit weight of solid, y, or mass density, p Elastic, Mohr-Coulomb, Drucker-Prager,ubiquitous joint
Young's modulus of solid, E Elastic, Mohr-Coulomb, Drucker-Prager,ubiquitous joint
Poisson's ratio of solid, v Elastic, Mohr-Coulomb, Drucker-Prager,ubiquitous joint
Friction angle of solid, 4 Mohr-Coulomb, Drucker-Prager, ubiquitousjoint
Cohesion of solid, c Mohr-Coulomb, Drucker-Prager, ubiquitousjoint
Tension limit/uniaxial tensile strength of solid, Mohr-Coulomb, Drucker-Prager, ubiquitousT joint
Dilation angle of solid, ^, Mohr-Coulomb, Drucker-Prager, ubiquitousjoint
Thermal-Hydrological Properties
Thermal expansion coefficient of solid, i TM, TMH analyses
2-7
Table 2-1. Rock mechanics properties for database development (Cont'd)
Properties Remark
Specific heat, Cp TM, TMH analyses
Thermal conductivity of solid, kh TM, TMH analyses
Normal stress dependent constants for joint Barton-Bandis, Continuously-Yieldingnormal stiffness, an and en
Normal stress dependent constants for joint Continuously-Yieldingshear stiffness, a. and e.
2-8
* S
Table 2-1. Rock mechanics properties for database development (Cont'd)
Properties Remark
Number of joint sets, J,, NGI Q method
Joint spacing, J. Explicit joint modeling, ubiquitous joint, RMRmethod
Joint dimensions Explicit joint modeling
Joint orientations Explicit joint modeling
Joint permeability, kj TMH analyses
Properties for Rock Mass Classification
Uniaxial compressive strength, a, RMR method
Rock Quality Designation, RQD NGI Q, RMR methods
Condition of joints, Jc RMR method
Ground water condition, Wc RMR method
Joint roughness number, Jr NGI Q method
Joint alteration number, Ja NGI Q method
Stress reduction factor, SRF NGI Q method
Joint water reduction factor, Jw, NGI Q method
2-9
3 FEASIBILITY ASSESSMENT FOR INCORPORATING ROCKMECHANICS PROPERTIES IN THE 3D GEOLOGICAL
FRAMEWORK MODEL
This section focuses on the feasibility evaluation of applying EarthVision software (Version 2.9 Beta),developed by Dynamic Graphics, Inc. (1994a), for representing joints, underground excavations, and rockmechanics property data in the 3D geological framework model. The 3D framework model, previouslydescribed by Stirewalt and Henderson (1995), was constructed using field data collected by the DOE andits contractors. Model boundaries, chosen to encompass the potential repository block and faults in andadjacent to it, extend north-south out to about 5 km from the repository block and east-west from MidwayValley to West Ridge.
3.1 REPRESENTATION OF JOINTS
3.1.1 Essential Joint Data
The data required for representing a joint in the 3D geological framework model of YM usingtools available with the EarthVision software are: (i) coordinates of the center of a joint surface; (ii) strikeand dip of the joint surface; (iii) dip projection length (i.e., length of joint trace along dip direction); and(iv) strike projection length (i.e., length of joint trace along strike). These data are obtained through thegeneration of joint distribution realizations as discussed in Section 2.2.2.
3.1.2 Modeling Requirements
3.1.2.1 Accommodating Large Numbers of Joints
A cutoff length (size) will be used to limit the number of joints to be included in a realizationof joint distribution, which are generated as discussed in Section 2.2.2. The total numbers of joints foreach realization are expected to be extremely large. The ability to include this large number of joints inthe 3D geological framework model using EarthVision software is essential.
3.1.2.2 Displaying and Downloading Joint Trace Information in Cross Sections
It is desirable that joint traces in any arbitrary 2D cross sections cut through the 3D frameworkmodel can be displayed and the related geometric information can be easily exported. The ability todisplay the joint data in this manner is important to permit further analysis, for example, potential fordrift instability. The ability to export joint geometric information in the desired cross section is necessaryfor input to a stress analysis code (e.g., UDEC or 3DEC). Using this input, the stress analysis code canprovide a detailed analysis for assessing drift stability or potential changes of near-field permeabilitiesresulting from various perturbations.
3.1.2.3 Three-Dimensional Joint Displays and Joint Data Exporting
Joints need to be displayed in a 3D rock mass block, using the EarthVision 3D viewer tool(Dynamic Graphics, Inc., 1994b). These displays may prove useful for 3D analyses of block stability inwhich the blocks are defined in 3D by the joint surfaces. The displays would also be useful for viewing
3-1
joint traces on the tunnel walls from a vantage point inside the tunnel. As discussed in Section 3.1.2.2,it is desirable that the joint data within a 3D rock mass block of interest can be easily exported forpreparation for detailed rock mechanics and TMH coupled analyses.
3.1.2.4 Minimum Operator and Central Processing Unit Time to Construct Three-DimensionalModels
The time required for an operator to format the joint data so the joint systems can be built andplaced in the 3D model (and in 2D cross sections) should be reasonable compared to the total analysistime, or total time available for the project. The central processing unit time required to actually constructthe 3D joint model should also be reasonable.
3.1.2.5 Minimum Disk Space Requirements
The amount of disk space required to construct and store the 3D joint model should bereasonable compared to the available hardware capacity so that hardware currently in use at the CNWRAand NRC can be used for the joint model construction.
3.1.3 Approaches Considered
Four approaches were considered for including the joints in the 3D model, and each is discussedin this section. Strengths and weaknesses of each approach are presented.
3.1.3.1 Method 1 - Merged Faces File
The first approach, tested by using a set of six synthetic joint surfaces, was the merged facesfile method for including joints in a 3D model. A faces file is a graphics file that is presented in a formatthat can be displayed in the 3D viewer of the EarthVision software (Dynamic Graphics, Inc., 1994b).Using this faces file, the joints can be modeled as 3D planes or surfaces (i.e., faces). Then the surfacesrepresenting the joints can be merged with the graphics file representing the CNWRA 3D geologicalframework model.
A faces file is constructed using the essential data provided for the joint surfaces. The centerof the joint along with the strike and dip are used to define the joint surface in 3D. Then the data pointsfor the joint surfaces are converted to a 2grd file (i.e., the EarthVision surface file for representing faultsand joints) using the EarthVision 2D Trend Gridder (Dynamic Graphics, Inc., 1994b). After conversionto a 2grd file, a faces file is constructed using the EarthVision faces file generation tool (DynamicGraphics, Inc., 1994b). At the final step, all faces files are merged using the EarthVision Faces filemerge tool to construct the joints in the 3D geological framework model.
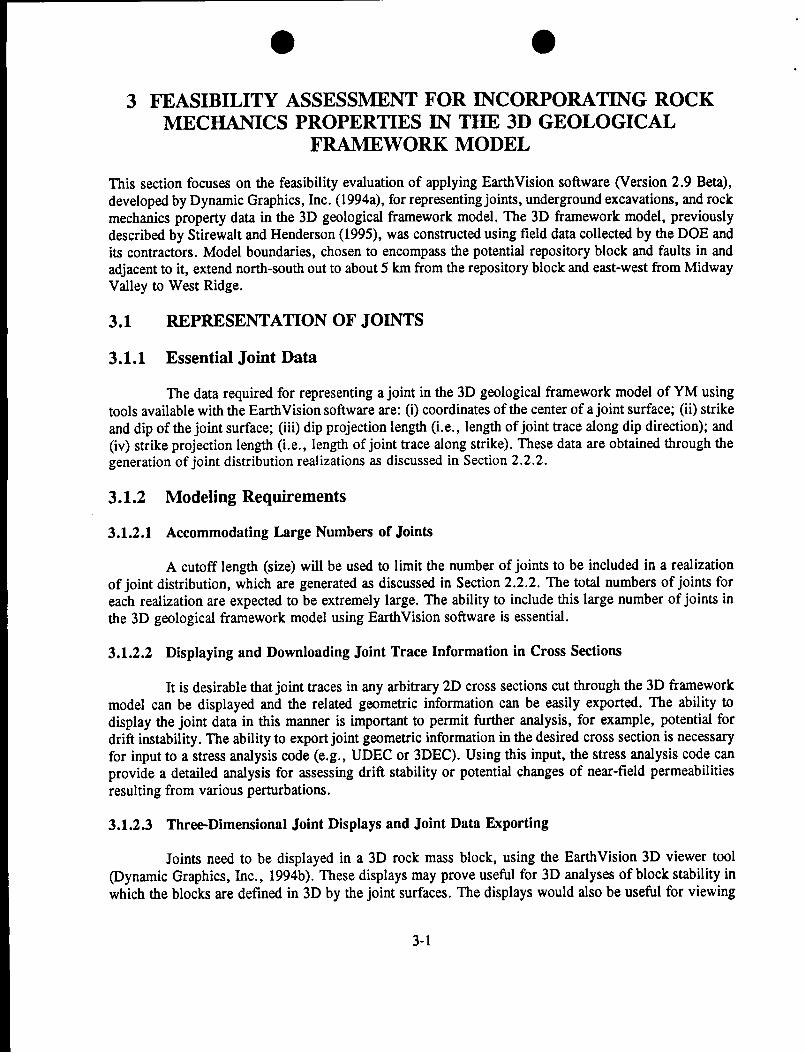
Figure 3-1 illustrates a sample 3D joint model constructed by this approach using a test caseof six joints, modeled using the EarthVision software system merged faces file (Dynamic Graphics, Inc.,1994b). The joints are displayed using the EarthVision 3D Viewer tool (Dynamic Graphics, Inc., 1994b).In the figure, the stratigraphic model has been sliced back to expose the joint surfaces.
3-2
Stratigraphic model
FractureSurfaces1 _ ll
Figure 3-1. Test case joints modeled using the EarthVision software merged faces rile method,with display produced using the Earth Vision 3D Viewer tool. The lithostratigraphic model hasbeen sliced back to expose the joint surfaces.
3-3
* 0 * 3_k
The strength of this approach is that the number of joints that can be modeled may be in excessof 1,0001. However, a weakness exists because the joints cannot be displayed in randomly chosencross-section views. When a cross section is created, all zones, blocks, and faults that intersect the crosssection are displayed in the cross section view. When the joints are modeled as surface files, they arecreated and placed into the 3D model as zones with zero thickness so they will not be displayed in crosssections. It also is not possible to view the intersections of the joints with the tunnel walls because thejoint surface will extend into the tunnel rather than being terminated at the tunnel wall. Furthermore, thecapability does not currently exist in this method to permit processing joint data along a randomly chosencross section in preparation for exporting it to drift stability and TMH coupled analyses.
Joint traces can be viewed only as intersections with a plane of the 3D model, one of whichcould be taken to approximate the tunnel wall, if desired. Viewing the joint traces consists of a two-stepprocess-first, cutting the 3D model using the chair-step function of the 3D viewer and then, second,trimming the joints up to the plane of the chair step cut. However, application of this approach wouldleave the joint surface extending slightly out from the chair-cut plane in the 3D model.
3.1.3.2 Method 2 - Volume Model
This method uses the Geological Structure Builder (GSB) as described in EarthVision Version2.9 Beta (Dynamic Graphics, Inc., 1994a) to create a 3D volume model. Using this method, the jointswould be modeled as small faults within the 3D geological framework model. To create the "faultsurfaces" that represent joints, the data provided for the joint surfaces defined in Section 3.1.1 are used,just as was done for Method 1, to construct data files that represent 3D surfaces. These files are thenconverted into 2grd files, also as for Method 1. Finally, the 2grd files are modeled as faults within theframework model using GSB, which is used to create a sequence file for constructing the 3D volumemodel.
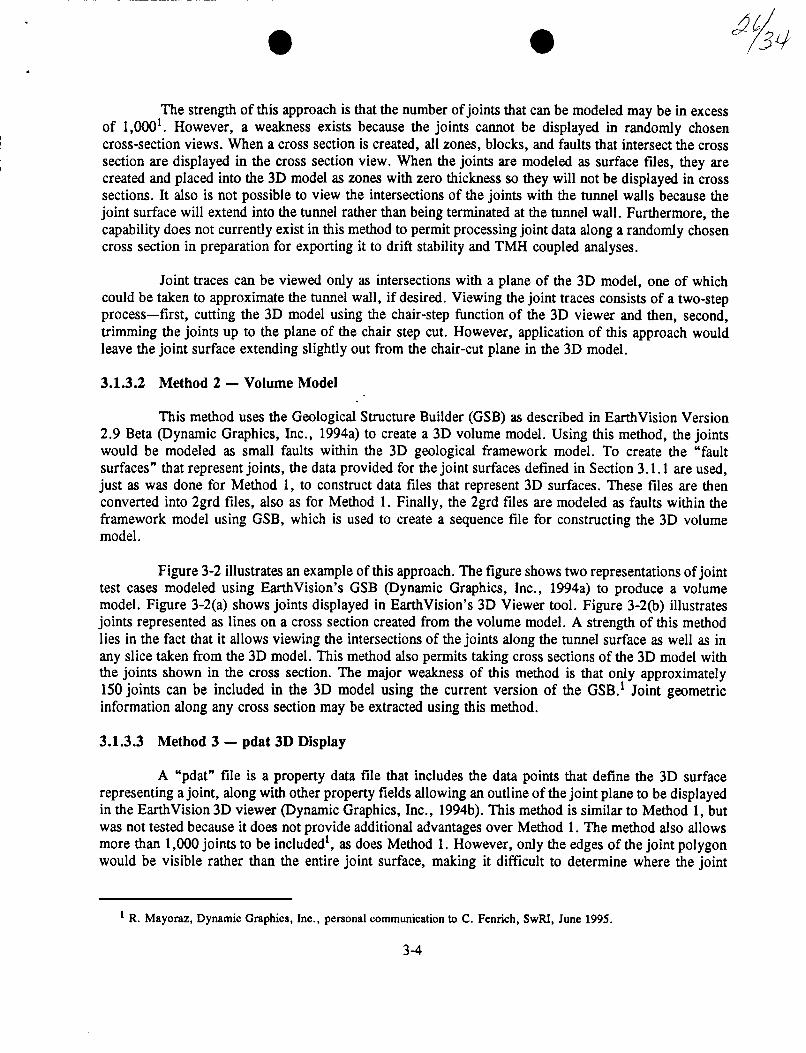
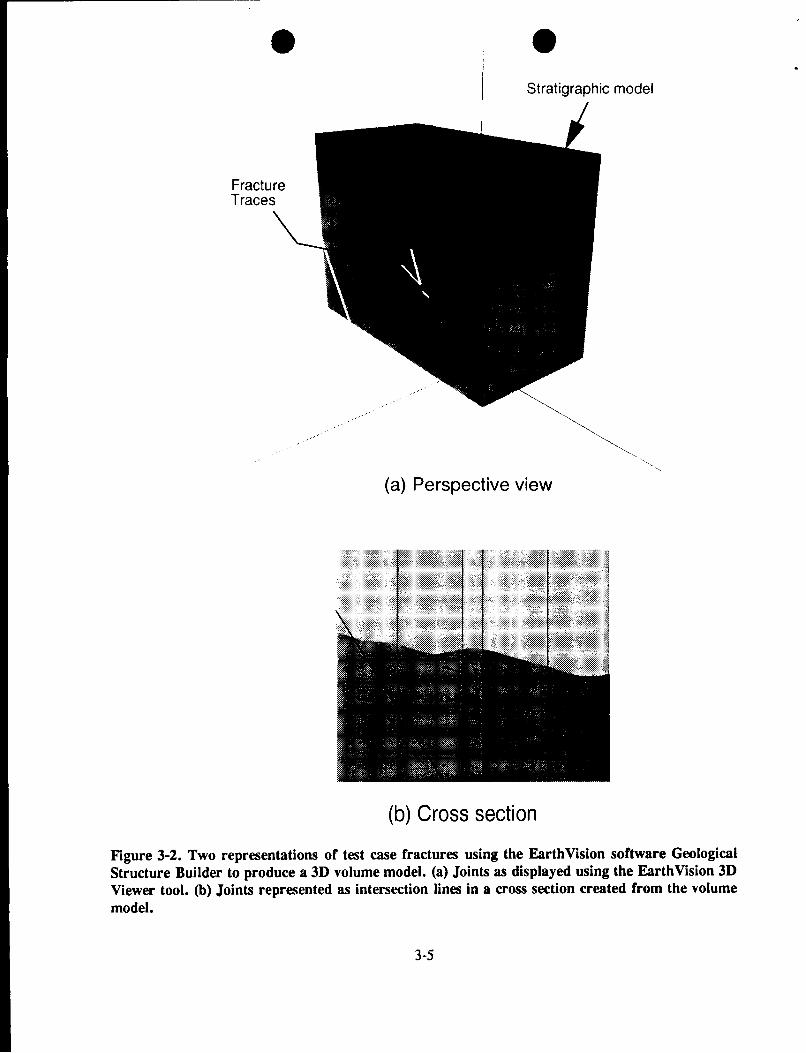
Figure 3-2 illustrates an example of this approach. The figure shows two representations of jointtest cases modeled using EarthVision's GSB (Dynamic Graphics, Inc., 1994a) to produce a volumemodel. Figure 3-2(a) shows joints displayed in EarthVision's 3D Viewer tool. Figure 3-2(b) illustratesjoints represented as lines on a cross section created from the volume model. A strength of this methodlies in the fact that it allows viewing the intersections of the joints along the tunnel surface as well as inany slice taken from the 3D model. This method also permits taking cross sections of the 3D model withthe joints shown in the cross section. The major weakness of this method is that only approximately150 joints can be included in the 3D model using the current version of the GSB.I Joint geometricinformation along any cross section may be extracted using this method.
3.1.3.3 Method 3 - pdat 3D Display
A "pdat" file is a property data file that includes the data points that define the 3D surfacerepresenting a joint, along with other property fields allowing an outline of the joint plane to be displayedin the EarthVision 3D viewer (Dynamic Graphics, Inc., 1994b). This method is similar to Method 1, butwas not tested because it does not provide additional advantages over Method 1. The method also allowsmore than 1,000 joints to be included', as does Method 1. However, only the edges of the joint polygonwould be visible rather than the entire joint surface, making it difficult to determine where the joint
I R. Mayoraz, Dynamic Graphics, Inc., personal communication to C. Fenrich, SwRI, June 1995.
3-4
0Stratigraphic model
i
FractureTraces
(a) Perspective view
(b) Cross section
Figure 3-2. Two representations of test case fractures using the EarthVision software GeologicalStructure Builder to produce a 3D volume model. (a) Joints as displayed using the EarthVision 3DViewer tool. (b) Joints represented as intersection lines in a cross section created from the volumemodel.
3-5
* * C3aL
intersected any designated slice of the 3D model. Hence, if the joints were modeled using this method,they would not appear on any cross sections taken from the 3D framework model. Extracting jointinformation for a particular cross sections is not possible using this method or Method 1.
An annotation file is a text file that defines to the EarthVision editor those points at which lines,text, and symbols are to be drawn. Using the editor, the annotation file can be saved as a PostScript orplot file, which can be printed or plotted on paper. This method requires that custom software be writtento determine the intersection of the 3D joint plane and the cross section plane. Once the intersection hasbeen determined, a line can be drawn on the cross section depicting the intersection of the joint surfacewith the cross section. Due to time constraints and the fact that this method is similar to Method 2, it wasnot tested using the hypothetical joint set.
This method allows more than 1,000 joints to be included on any cross section cut from the 3Dmodel. However, it does not display the joints in the 3D viewer tool. Using this method, the jointgeometric information would be available only along predetermined cross sections.
3.1.4 Summary
Table 3-1 presents a summary comparison of the four methods discussed in Section 3.1.3,including information on estimated operator hours (based on time to construct 100 joints) and CPU time.Methods 1 and 4 (i.e., merged faces file and annotation displays) combined could be used forrepresenting joints in a 3D model and cross sections in the 3D geological framework model using theEarthVision software. Method 1 provides for including the joints in the 3D model, and Method 4, forrepresenting graphically the joints in cross sections taken from the 3D model. By using these twoapproaches, over 1,000 joints can be modeled. However, using of the combined methods would requiresome operator time for formatting the joint data and building the joints. It should also be noted that thejoint number of 1,000 used in the discussion in Sections 3.1.3 and 3.1.4 is arbitrary. The actual numberof joints is likely to be substantially greater than 1,000, even if a cut-off length (size) is used. Furtherstudy will be required to determine if there is a limit for incorporating joints into the 3D geologicframework model.
3.2 TUNNEL MODELING
3.2.1 Approaches Considered
Two different approaches were considered for modeling the repository tunnel. The firstapproach utilized tools in EarthVision Version 2.9 Beta (Dynamic Graphics, Inc., 1994a). The secondapproach utilized tools from Dynamic Graphics, Inc. that are not yet commercially released but madeavailable to the CNWRA for this effort.
3-6
Table 3-1. Joint modeling method comparisons
I l Method 3 Method 4Method 1 Method 2 Property Data Annotation
Requirement Merged faces file Volume model Display Display
Number of joints 1,000+ 50-150 1,000+ 1,000+
Cross-section No Yes No Yesdisplay
3D display Yes Yes Limited, see note 1 Noview joints fromoutside tunnel
3D display Limited, see note 2 Yes Limited, see note 3 Noview joints frominside tunnel
Est. operator time 80 hr 80 hr 40 hr 200 hr to build
(Hours to build toolset; 40 hr to100 joints) build cross
sections with 100faults
Est. CPU time 4 hr 10-12 hr 4 hr 2 hr(Hours to build100 joints)
Est. disk space Approximately 10 Approximately 500 Approximately Approximately(Mb to build 100 Mb for joint faces Mb free to 1 Mb 1 Mbjoints) files generate; approx
100 Mb for finalframework modelwith joints
Note 1: Joints represented by lines rather than by polygon surfaces. Note 2: Joint surfaces not cut away within tunnelvolume, but protrude across tunnel interior. Note 3: Joints represented by lines and may not be visible at tunnel-joint
intersections.
3.2.1.1 Tunnel Modeled as 3grd Fault Using EarthVision Version 2.9 Beta
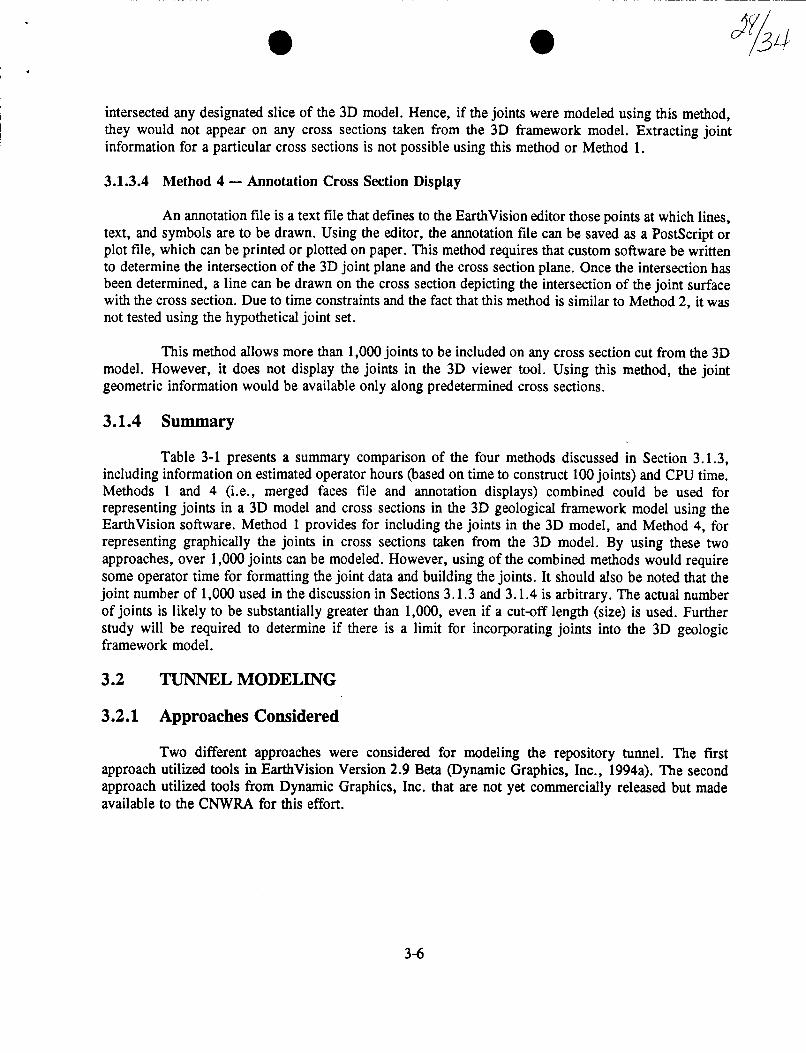
This approach, undertaken at the CNWRA, modeled the tunnel by using digitized map data toproduce a footprint of the tunnel, but without tunnel elevations. Using these data along with the slope ofthe tunnel, the elevation of the tunnel could be determined at each desired location. With these data andby sampling a tunnel data location every 5 m, a property data file was constructed and used to constructa 3grd file. The 3grd file was then used with GSB to generate a fault in the 3D model to mimic the shapeof the tunnel. The tunnel is actually represented as a fault block using this approach. This approachallows the material inside the tunnel to be removed. Figure 3-3 illustrates the tunnel generated using thisapproach.
3-7
* * 9X1
Tunnel
\ ~~~~~~~Stratigraphic model
Fgr33.Tefrt1,50mo h S unlmdlduigErhiinVrin29Bt.Gisize used to construct the model is 5 in, producing the irregular wall surfaces of the tunnel.~~~~~~~~~~~~~~~~~~~~~~~~~~~~~~~~~~~~~~~~~~~~~~~~~~~~~~~~~~~~~~~~~~~
3-8
* 0
3.2.1.2 Tunnel Modeled as a Zone and Block Using an Unreleased Version of EarthVision
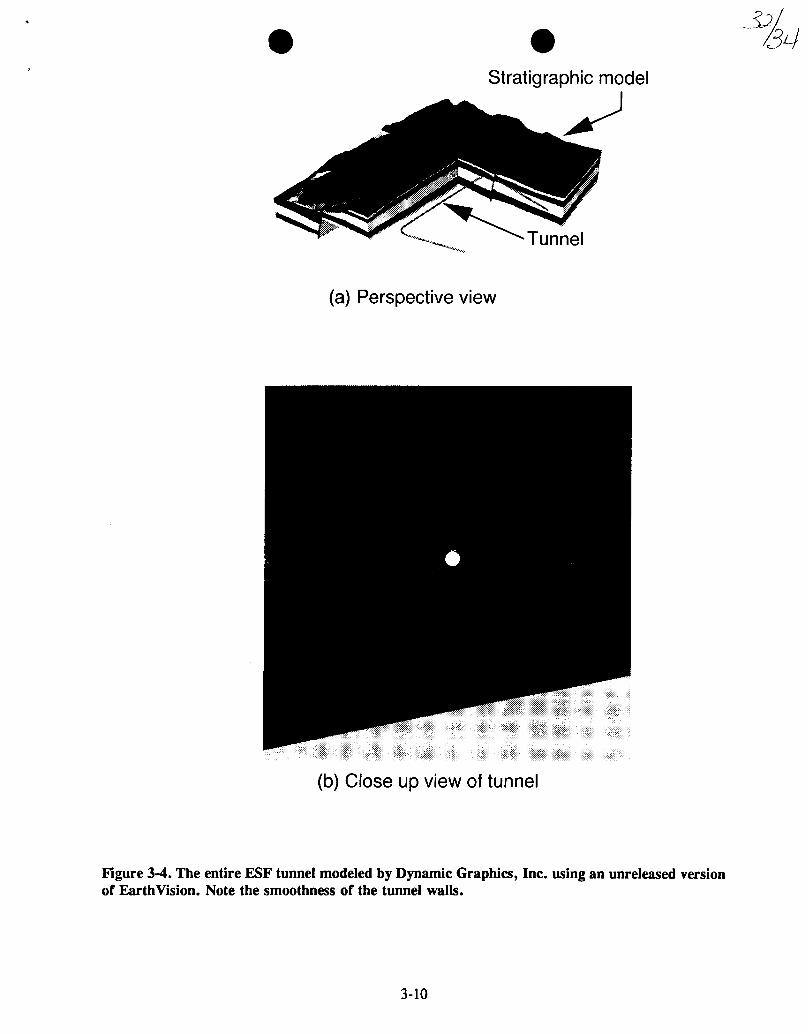
In a test case performed at the request of CNWRA, Dynamic Graphics, Inc. has included theESF tunnel in the 3D geological framework model of YM. This method modeled the tunnel usingpolygons creating the tunnel as a separate zone and block, and incorporating it in the 3D model. In thismethod, the material that is inside the tunnel is what is being modeled, rather than the tunnel surface. Thematerial that lies inside the tunnel is modeled as a separate zone as are the other stratigraphic units. Withthis approach the tunnel "zone" can be turned off or not displayed in the 3D Viewer to create the tunnelin the 3D model. The software used to accomplish this review is not presently available commercially.The tunnel created by Dynamic Graphics, Inc. did have a smooth surface and was modeled in its totallength through the 3D framework model.
Figure 3-4 illustrates a preliminary model of the repository tunnel created by Dynamic Graphics,Inc. using test data supplied by the CNWRA. Dynamic Graphics, Inc. has offered to either model therepository tunnel in more detail as an in-house test case and provide the model to the CNWRA, or toprovide the unreleased software to the CNWRA so that modeling could be undertaken. Use of this newand unreleased software is the preferred approach for producing the best representation of undergroundtunnels in 3D geological framework model. However, the ability of this new approach to include a largenumber of underground tunnels (drifts) will need to be evaluated. Also, since it is not practical torepresent the geometrical properties of joints that intersect tunnels using EarthVision software at thepresent stage, modeling tunnels alone does not seem to be worth the efforts.
3.3 ROCK PROPERTY MODELING
3.3.1 Cross Sections
In the CNWRA test case in which the Young's Modulus, Poisson's ratio, and uniaxialcompressive strength were included in a cross section, rock property data were provided as hardcopyrather than as electronic files. Thus, the data had to be manually entered into a property data file. Theproperty data file was then used to construct the cross-section annotation files. In the test case, crosssections of the 3D model showing rock property data were constructed by first creating the annotationfile displaying only the cross section of the 3D model with no property data. Then, with the aid of acustom program, the rock property data locations and corresponding values were added to the annotationfile.
3.3.2 Property Modeling
The rock property data can be included in the 3D model using the GSB. Inclusion of the datais accomplished by adding property values to different lithostratigraphic units in the 3D model. Thenusing one of the four methods available in the EarthVision Version 2.9 Beta (Dynamic Graphics, Inc.,1994a), along with EarthVision's GSB, a 3D model can be built with the rock property data included inthe zone properties of the model. A 3D test case was not performed since insufficient data are availableat present for the rock properties. However, a 3D model has been constructed at the CNWRA usingporosity and saturated conductivity values, and a similar model can be created when sufficient rockproperty data are available.
3-9
2XL.Stratigraphic model
.04�
(a) Perspective view
(b) Close up view of tunnel
Figure 34. The entire ESF tunnel modeled by Dynamic Graphics, Inc. using an unreleased versionof EarthVision. Note the smoothness of the tunnel walls.
3-10
4 SUMMIARY
Rock mechanical and hydrological properties identified in this report are to be included in the rockmechanics properties database. The identification of data needs is guided by the needs of numericalanalyses in evaluating emplacement drift stability and rock fall potentials during the pre- and post-closureperiods, and the potential for permeability changes in the rock mass surrounding emplacement drifts dueto the effects of mechanical deformation or degradation of rock mass of the heated repository. Theidentification process is also based on the need for developing a capability for effectively evaluating theadequacy of the DOE ground support design for the underground facility. Some of the parametersidentified are derived quantities and may not be obtained directly from DOE site characterization results.In such cases, the relevant test results will be obtained and processed in-house to generate theseparameters before they are incorporated into the 3D geological framework model.
Assessment of the feasibility of incorporating rock mechanics properties into the 3D geological frameworkmodel using the EarthVision software indicates that modeling of material properties (e.g., uniaxialcompressive strength) is relatively straightforward. The data can be incorporated by adding the propertyvalues to different lithostratigraphic units in the 3D geological framework model. Then a 3D model withthe rock property data included can be built using one of the several methods available in EarthVision,along with its GSB. This approach has been used successfully in the past to include porosity and saturatedconductivity properties. In FY96, obtaining rock mechanics properties data identified in Table 2-1 andbuilding of the related submodels for the 3D geological framework model will be initiated.
Representing geometric-related properties (joint and tunnel representations) in the 3D geologicalframework model, however, is not as straightforward. Four methods were studied. The combination ofthe merged faces file and annotation cross section display methods could be used if graphical presentationof joints in cross sections is desirable. This approach will require determination of the intersection of the3D joint plane and the cross section desired before these data can be incorporated into the 3D geologicalframework model. This approach is prohibitively time-consuming, especially when multiple undergroundexcavations are needed, for example, in the emplacement region. A custom software program will needto be developed for determination of such intersections. Due to the potential magnitude of effort that maybe necessary, the use of. the present version of EarthVision, software for representing joints andunderground excavations in the 3D geologic framework model is not recommended at this time.
4-1
5 REFERENCES
Barton, N.R., S.C. Bandis, and K. Bakhtar. 1985. Strength, deformation and conductivity coupling ofjoints. International Journal of Rock Mechanics and Mining Sciences & Geomechanics Abstracts22(3): 121-140.
Barton, N., R. Lien, and J. Lunde. 1974. Engineering classification of rock masses for the design oftunnel support. Rock Mechanics 6: 189-236.
Bieniawski, Z.T. 1974. Geomechanics classification of rock masses and its application in tunnelling.Proceedings of the Third Congress of the International Society for Rock MechanicsII(A): Washington, DC: National Academy of Sciences Printing and Publishing Office: 27-32.
Bieniawski, Z.T. 1976. Rock mass classification in rock engineering. Proceedings of Symposiwn onExploration for Rock Engineering 1: Johannesburg: 97-106.
CRWMS M&O (Civilian Radioactive Waste Management System Management and OperatingContractor). 1994. TS North Ramp Ground Support Scoping Analysis. BABEAOOO-01717-0200-00010 RevO2. ESF Design Package 2C. Las Vegas, NV: CRWMS M&O.
Cundall, P.A., and J.V. Lemos. 1988. Numerical simulation of fault instabilities with the continuously-yielding joint model. Proceedings of the Second International Symposium on Rockburst andSeismicity in Mines. Minneapolis, MN: University of Minnesota.
Dynamic Graphics, Inc. 1994a. EarthVision (Version 2.9 Beta) User's Guide. Alameda, CA: DynamicGraphics, Inc.
Hardy, M.P., and S.J. Bauer. 1989. Drift Design Methodology and Preliminary Application for theYucca Mountain Site Characterization Project. SAND89-0837. Albuquerque, NM: SandiaNational Laboratory.
Hsiung, S.M., A. Ghosh, A.H. Chowdhury, and M.P. Ahola. 1994. Evaluation of Rock Joint Modelsand Computer Code UDECAgainstExperimental Results. NUREG/CR-6216. Washington, DC:Nuclear Regulatory Commission.
ITASCA Consulting Group, Inc. 1993. UDEC Universal Distinct Element Code Version 2.0 Volume I.User's Manual. Minneapolis, MN: ITASCA Consulting Group, Inc.
Stirewalt, G.L., and D.B. Henderson. 1995. A preliminary three-dimensional geological frameworkmodel for Yucca Mountain. Conference Proceedings of the Sixth Annual International High-Level Radioactive Waste Management. La Grange Park, IL: American NuclearSociety: 116-118.