Page 1
University of Calgary
PRISM: University of Calgary's Digital Repository
Graduate Studies The Vault: Electronic Theses and Dissertations
2019-04-02
Development of Upflow Aerobic Granular Sludge
Bioreactor (UAGSBR) for Treatment of High-strength
Organic Wastewater
Hamza, Rania Ahmed Sayed Eid
Hamza, R. A. (2019). Development of Upflow Aerobic Granular Sludge Bioreactor (UAGSBR) for
Treatment of High-strength Organic Wastewater (Unpublished doctoral thesis). University of
Calgary, Calgary, AB.
http://hdl.handle.net/1880/110144
doctoral thesis
University of Calgary graduate students retain copyright ownership and moral rights for their
thesis. You may use this material in any way that is permitted by the Copyright Act or through
licensing that has been assigned to the document. For uses that are not allowable under
copyright legislation or licensing, you are required to seek permission.
Downloaded from PRISM: https://prism.ucalgary.ca
Page 2
UNIVERSITY OF CALGARY
Development of Upflow Aerobic Granular Sludge Bioreactor (UAGSBR)
for
Treatment of High-strength Organic Wastewater
by
Rania Ahmed Hamza Sayed Eid
A THESIS
SUBMITTED TO THE FACULTY OF GRADUATE STUDIES
IN PARTIAL FULFILMENT OF THE REQUIREMENTS FOR THE
DEGREE OF DOCTOR OF PHILOSOPHY
GRADUATE PROGRAM IN CIVIL ENGINEERING
CALGARY, ALBERTA
APRIL, 2019
© Rania Ahmed Hamza Sayed Eid 2019
Page 3
i
Abstract
Industrial wastewater, typically referred to as high-strength wastewater, is a major source of
water pollution due to its elevated organic content. High-strength organic wastewaters are
characterized by chemical oxygen demand (COD) concentrations greater than 4000 mg/L. The
effluents of these industries need to undergo biological treatment to remove the organic matter.
However, conventional biological treatment processes fail to stabilize high-strength
wastewater to regulatory limits. Aerobic treatment processes are not economically feasible for
the treatment of high-strength organic wastewater. Anaerobic processes suffer from low growth
rate of the microorganisms, high sensitivity to toxic loadings, fluctuations in environmental
conditions, and require post treatment to bring the water quality within regulations.
This work aimed at developing an upflow aerobic granular sludge bioreactor (UAGSBR) to
provide a downstream effective treatment process in order to combine the benefit of anaerobic
digestion (i.e., biogas production) with the benefit of aerobic treatment (i.e., better removal of
organics). Moreover, it is hypothesized that effluent of anaerobic treatment provides a
solubilized organic matter suitable for subsequent aerobic treatment because of its reduced
organic strength and enhanced amounts of nitrogen and phosphorus. The combined system will
overcome the limitations of both anaerobic and aerobic systems, such as long treatment
duration and low stability due to rapid bacterial growth, respectively.
In this project, biogranulation, formed by the self-immobilization of microorganisms, was
employed as a novel technology in an upflow semi-pilot-scale bioreactor. These granules are
dense microbial communities packed with different bacterial species, which can achieve rapid
treatment for high volumes of wastewater in a smaller footprint when compared to conventional
biomass. Mechanisms of granule formation and stability considering influential factors such as
system start-up, organic loading rate, food-to-microorganisms ratio, and nutrients addition
Page 4
ii
were examined. Treatment efficiency, assessed in terms of organics and nutrients (nitrogen and
phosphorus) removal, was above 90%. The UAGSBR provides a compact system for high-
strength organics wastewater treatment (at 20-30% spatial footprint of a conventional plant).
Page 5
iii
Acknowledgment
I would like to thank all those who helped me by advice, guidance, contribution, technical and
informational support, and criticism in order to bring this research work up to this level. There
were many people involved in this research work.
First and foremost, my supervisor, Dr. Joo Hwa Tay, who had a major contribution and
significance in this research. His guidance, ideas, and suggestions have been invaluable
throughout my doctoral study. Dr. Tay provided me with unlimited support and was very
generous with his time and devotion to this project. I owe my publications, my scholarships
and honors to him. His words of wisdom, his trust in my capabilities and his continuous
encouragement guided me throughout my PhD journey: “First year, I hold your hands; second
year, we discuss; third year, you lead the way” – Dr. Tay.
I am very grateful to Dr. Joseph Patrick Hettiaratchi for his continuous advice and support. Dr.
Hettiaratchi taught me experimental design and statistical analysis, and more importantly, how
to apply them to get meaningful conclusions. I am very grateful to Dr. Angus Chu for taking
time to explain for me anaerobic processes and giving me feedback on my work. My very
special appreciation goes to Dr. Zhiya Sheng for her continuous assistance. Dr. Sheng taught
me the value and meaning of microbiology and guided all my microbial analysis. I would like
to thank Dr. John Dominic for his valuable advice. His comments and suggestions guided my
early PhD publications.
I would like to extend my gratitude to Mr. Danial Larson, our lab technologist for his consistent
assistance with instruments, experiments, and installation of our reactors. I am grateful to Mr.
Donald Anson and Mr. Mirsad Berbic for their assistance with fabricating our reactors and
Page 6
iv
troubleshooting technical and operational issues. I also want to acknowledge the administrative
support of Ms. Chrissy Thatcher, Ms. Janelle Mcconnell, and Ms. Julie Nagy Kovacs.
I am extremely lucky to have supportive colleagues. My very special thanks go to Oliver Terna
Iorhemen, my true friend and companion in my PhD journey. Oliver’s consistent support,
friendly attitude, assistance, and encouragement have pushed me to discover my best skills and
talents. My gratitude extends to Mohamed Sherif Abdelsamie who has always sacrificed his
time to help me through my lengthy laboratory experiments. Words cannot explain the friendly
family-like environment Jordan Kent created in our team. Jordan took the lead in installing our
reactor and has always helped me in understanding chemical reactions. My sincere gratitude
goes to Shubham Tiwari for his optimistic and calm attitude, and for sharing his creative
research ideas. I would like to thank Muhammed Faizan Khan for the positive and supportive
attitude. I would like to acknowledge Harsh Vashi for creating an ambitious environment. My
gratitude extends to Anrish for her friendly attitude.
I would like to thank my dear friends, Mayada Younes and Fatimah Farag for their continuous
support, love and care. They have always encouraged me, shared their stories of success, and
inspired me to continue my degree.
To those who provided me the motivation and drive to be whom I am, I would like to express
my greatest gratitude to my lovely family. Foremost, I owe my deepest gratitude to my mother,
Zakeya Elmemey, for her unlimited love. She has always supported me, sacrificing her health,
traveling thousands of miles to be with me providing care and support for me and for my
children, and creating a very comfortable and calm environment for me to study. My PhD
would not have been completed without the encouraging words, advice, guidance, strength and
power my father, Ahmed Hamza, has given me. His words of encouragement and trust in my
capabilities have provided me with confidence and led my way through my journey.
Page 7
v
To my love and my greatest support in life, my husband, Ahmed Okasha. Ahmed has always
deeply believed in me, supported my passion for academia, and empowered me to leave my
comfort zone and travel in pursue of my dream. To my lovely children Laila and Yehia who
have been very understanding in supporting me through the degree. They were very mature in
scarifying their playtime and family weekends to allow me to finish my studies. I am deeply
grateful to the tremendous support of my brother, Mostafa Sayed. Mostafa was my very special
life coach, his unconditional love, advice and care have pampered me not only through my
transition to Canada and University of Calgary but also through my very tough moments in my
program. To my beloved sister-in-law, Daniah Mokhtar, I am extremely grateful for her warm
family gatherings, and her love and support during my depressed moments.
I would like to acknowledge the industrial experience that was provided by Acti-Zyme Ltd,
and for providing the engineered granular microorganisms (EGMs) used as part of this work.
From Acti-Zyme (Hycura), I would like to thank Jonathan Lee for sharing his knowledge and
providing me with such valuable internship experience. My appreciation extends to BIAP
(Business Innovation Access Program) of Canada and Mitacs for funding my university-
industry collaborative research.
Last but not least, I would like to acknowledge the financial support of:
Izaak Walton Killam Doctoral Scholarship
Government of Alberta for Queen Elizabeth II Doctoral Scholarship
Natural Sciences and Engineering Research Council of Canada
Faculty of Graduate Studies for Eyes High Doctoral Scholarship
Page 8
vi
Dedicated to the memory of my beloved grandfather, Hamza
Time changes nothing, I can still hear the wisdom in your advice! I am fulfilling my
promise to you, and I herein make my first steps onto my career!
Page 9
vii
Contributions
During my doctoral study, the following peer-reviewed journal articles were produced:
[1] Hamza, R.A., Sheng, Z., Iorhemen, O.T., Zaghloul, M.S., and Tay, J.H (2019).
Optimization of organics to nutrients (COD:N:P) ratio for aerobic granular sludge treating
high-strength organic wastewater. Science of the Total Environment, 650 (part 2), 3168-
3179.
[2] Hamza, R.A., Iorhemen, O.T., Zaghloul, M.S., Sheng, Z., and Tay, J.H. (2018). Impact of
food-to-microorganisms ratio on the stability of aerobic granular sludge treating high-
strength organic wastewater. Water Research,147 (15), 287-298.
[3] Hamza, R.A., Iorhemen, O.T., Zaghloul, M.S., and Tay, J.H (2018). Rapid formation and
characterization of aerobic granules in pilot-scale sequential batch reactor for high-strength
organic wastewater treatment. Journal of Water Process Engineering, 22, 27-33.
[4] Hamza, R.A., Iorhemen, O.T., and Tay, J.H. (2016). Anaerobic-aerobic granular system
for high-strength wastewater treatment in lagoons. Advances in Environmental Research,
5 (3), 169-178.
[5] Hamza, R.A., Iorhemen, O.T., and Tay, J.H. (2016). Advances in biological systems for
the treatment of high-strength wastewater. Journal of Water Process Engineering, 10, 128-
142.
Page 10
viii
Table of Contents
Introduction ............................................................................................................ 1
1.1 Background .................................................................................................................... 1
1.2 Research objectives ........................................................................................................ 4
1.3 Scope of work ................................................................................................................ 4
1.4 Thesis organization ........................................................................................................ 5
Literature Review................................................................................................... 6
2.1 Introduction .................................................................................................................... 6
2.2 Conventional biological technologies ............................................................................ 8
2.2.1 Activated sludge..................................................................................................... 8
2.2.2 Trickling filter. ..................................................................................................... 10
2.2.3 Lagoons. ............................................................................................................... 12
2.3 High-rate anaerobic digesters ...................................................................................... 14
2.3.1 Anaerobic filter. ................................................................................................... 14
2.3.2 Anaerobic fluidized bed bioreactor. ..................................................................... 16
2.3.3 Upflow anaerobic sludge blanket. ........................................................................ 18
2.4 Hybrid treatment systems ............................................................................................ 22
Page 11
ix
2.4.1 Membrane bioreactors. ........................................................................................ 22
2.4.2 Combined anaerobic-aerobic treatment systems. ................................................ 26
2.4.3 Integrated anaerobic-aerobic treatment systems. ................................................. 29
2.5 Summary ...................................................................................................................... 44
Materials and Methods ......................................................................................... 46
3.1 Reactors configuration and experimental set-up .......................................................... 46
3.1.1 Upflow Aerobic granular sludge bioreactor. ....................................................... 46
3.1.2 Upflow anaerobic granular sludge reactor. .......................................................... 47
3.2 Seed cultures ................................................................................................................ 50
3.2.1 Aerobic reactor..................................................................................................... 50
3.2.2 Anaerobic reactor. ................................................................................................ 50
3.3 Media ........................................................................................................................... 50
3.3.1 Aerobic reactor..................................................................................................... 51
3.3.2 Anaerobic reactor. ................................................................................................ 52
3.4 Analytical methods ...................................................................................................... 53
3.4.1 Biomass and wastewater characteristics. ............................................................. 53
3.4.2 Granule structure and morphology observation. .................................................. 53
Page 12
x
3.4.3 Extracellular polymeric substances (EPS) extraction and analysis. .................... 56
3.4.4 Microbial community analysis. ............................................................................ 56
Formation and Characterization of Aerobic Granules ......................................... 58
4.1 Introduction .................................................................................................................. 58
4.2 Experimental set-up and seed sludge ........................................................................... 61
4.3 Media ........................................................................................................................... 61
4.4 Formation and characteristics of granules ................................................................... 62
4.4.1 Settling property................................................................................................... 62
4.4.2 Biomass concentration. ........................................................................................ 62
4.4.3 Granule size distribution. ..................................................................................... 67
4.4.4 Reactor performance and removal efficiencies. ................................................... 69
4.4.5 Pollutants degradation in SBR cycle.................................................................... 75
4.4.6 Biomass activity. .................................................................................................. 77
4.5 Summary ...................................................................................................................... 81
Granule Stability .................................................................................................. 83
5.1 Introduction .................................................................................................................. 83
5.2 Experimental set-up and seed sludge ........................................................................... 88
Page 13
xi
5.3 Media and experimental campaign .............................................................................. 89
5.4 Effects of F/M ratio on the settleability of aerobic granules ....................................... 91
5.5 Reactor performance .................................................................................................... 98
5.5.1 Characteristics of aerobic granules. ..................................................................... 98
5.5.2 Morphology and structure of aerobic granules. ................................................. 103
5.5.3 Pollutants removal efficiencies. ......................................................................... 105
5.6 Analysis of microbial community .............................................................................. 110
5.6.1 Characterization of the main population shifts. ................................................. 110
5.6.2 The role of Thauera in granule formation and stability. .................................... 114
5.6.3 Identification of denitrifiers, and heterotrophic nitrifiers. ................................. 115
5.6.4 The role of microbial diversity in stability. ....................................................... 117
5.7 Mechanisms and perspectives .................................................................................... 119
5.8 Summary .................................................................................................................... 122
Effect of Organics to Nutrients Ratio on Treatment Efficiency ........................ 124
6.1 Introduction ................................................................................................................ 124
6.2 Experimental set-up ................................................................................................... 126
6.2.1 Granule cultivation in SBR. ............................................................................... 126
Page 14
xii
6.2.2 Batch optimization experiments. ....................................................................... 126
6.2.3 Seed sludge and Media. ..................................................................................... 127
6.3 Granule formation and characteristics of aerobic granules in SBRs ......................... 128
6.4 Organics and nutrients degradation in SBR cycle ..................................................... 129
6.5 Organics and nutrients degradation in batch experiments ......................................... 140
6.6 Effects of COD: nutrients ratio and HRT on the treatment efficiency in batch
experiments ........................................................................................................................ 140
6.7 Model equations and parameters in batch experiments ............................................. 149
6.8 Effect of pH on the performance of aerobic granules ................................................ 151
6.9 Nutrient requirements for bacterial growth and biomass yield and EPS production . 152
6.10 Analysis of microbial community .............................................................................. 155
6.10.1 Major microbial functional groups. ............................................................... 156
6.10.2 Microbial selection behaviour........................................................................ 159
6.11 Summary .................................................................................................................... 159
Combined Anaerobic-Aerobic Granular Systems ............................................. 162
7.1 Anaerobic pretreatment .............................................................................................. 162
7.1.1 Experimental setup and seed sludge. ................................................................. 162
Page 15
xiii
7.1.2 Reactor performance and removal efficiencies. ................................................. 162
7.1.3 Microbial community Analysis.......................................................................... 165
7.2 Combined anaerobic-aerobic batch experiments ....................................................... 168
7.2.1 Experimental setup and seed granules. .............................................................. 168
7.2.2 The pH and dissolved oxygen (DO) concentration............................................ 171
7.2.3 The effect of COD:N ratio. ................................................................................ 172
7.2.4 Soluble COD removal. ....................................................................................... 174
7.3 Summary .................................................................................................................... 176
Conclusions ........................................................................................................ 178
8.1 Aerobic granule formation ......................................................................................... 179
8.2 Granule long-term stability ........................................................................................ 180
8.3 Optimization of nutrients addition ............................................................................. 180
8.4 Investigation of anaerobic pretreatment and combined anaerobic-aerobic treatment181
References .............................................................................................................................. 183
Appendix ................................................................................................................................ 217
Page 16
xiv
List of Figures
Fig. 2.1. Activated sludge process: (a) schematic diagram; and (b) aeration basin ................... 9
Fig. 2.2. Typical trickling filter ................................................................................................ 11
Fig. 2.3. Typical reactor configurations used in anaerobic wastewater treatment: (a) completely
stirred tank; (b) anaerobic filter; (c) expanded/ fluidized bed; and (d) upflow anaerobic
sludge blanket .................................................................................................................. 15
Fig. 3.1. Schematic diagram of: (a) UAGSBR dimensions; and (b) system setup .................. 48
Fig. 3.2. Schematic diagram of: (a) UASB dimensions; and (b) system setup ....................... 49
Fig. 4.1. Granulation process from cultivation to maturation at: (a) Day 0; (b) Day 9; (c) Day
20; (d) Day 27; (e) Day 32; (f) Day 44; and (g) Day 75 .................................................. 63
Fig. 4.2. Profiles of SVI30 and SVI30/SVI5 of the reactor ........................................................ 64
Fig. 4.3. Settling test at: (a) Day 20; (b) Day 22; (c) Day 25; (d) Day 27; and (e) Day 41 ..... 65
Fig. 4.4. Profiles of MLSS and MLVSS/MLVSS of the reactor ............................................. 66
Fig. 4.5. Profiles of granules average particle size and granulation percentage ...................... 68
Fig. 4.6. Digital camera images of (a) seed sludge; granules at: (b) 7 days; (c) 14 days; (d) 28
days; (e) 35 days weeks; (f) 45 days; and (g) sludge bed on the 37th day of operation .. 69
Fig. 4.7. Profile of COD removal ............................................................................................ 71
Fig. 4.8. Profile of ammonia removal ...................................................................................... 72
Page 17
xv
Fig. 4.9. Profile of phosphate removal ..................................................................................... 74
Fig. 4.10 COD and SOUR profiles during SBR cycle ............................................................ 76
Fig. 4.11. DO and pH profile during SBR cycle ...................................................................... 79
Fig. 4.12. Variation of COD, ammonia, nitrate and nitrite during SBR cycle ........................ 80
Fig. 5.1. F/M ratio and SVI during the operational period ...................................................... 92
Fig. 5.2. Estimated curve for relationship between SVI and F/M ratio ................................... 95
Fig. 5.3. Estimated marginal means of SVI30 at different F/M ratios ...................................... 97
Fig. 5.4. Biomass concentration during the operational period ............................................... 99
Fig. 5.5 Average diameter of granules and granulation percentage during operational period
........................................................................................................................................ 101
Fig. 5.6. Digital camera images of (a) seed sludge; granules at: (b) 14 days; (c) 33 days; (d) 45
days; (e) 55days; (f) 90 days; (g) 132 days; (h) 190 days; (i) 243days; (j) 280 days; and
(k) 312 days.................................................................................................................... 102
Fig. 5.7. SEM images of granules at: (a) day 33; (c) 55; (e) 80; (g) 102; (i) 132; (k)179; (m)190;
(o) 243; (q) 288; (s) 312; surface of granule at: b) day 33; (d) 55; (f) 80; (h) 102; (j) 132;
(l)179; (n)190; (p) 243; (r) 288; and (t) 312 .................................................................. 105
Fig. 5.8. Profile of COD removal .......................................................................................... 106
Fig. 5.9. Profile of ammonia removal .................................................................................... 108
Fig. 5.10. Profile of phosphorus removal .............................................................................. 109
Page 18
xvi
Fig. 5.11. Microbial community relative abundance at family level ..................................... 112
Fig. 5.12. 3D-EEM fluorescence spectra of aerobic granules on day 288 ............................. 121
Fig. 6.1. COD, NH3-N; NO3-N, and NO2-N degradation profiles in SBR cycles in R1 ....... 131
Fig. 6.2. COD and PO4-P degradation profiles in SBR cycles in R1 ................................... 132
Fig. 6.3. COD degradation profile and pH in SBR cycle in R1 ............................................ 133
Fig. 6.4. COD, NH3-N; NO3-N, and NO2-N degradation profiles in SBR cycle in R2 ......... 134
Fig. 6.5. COD, PO4-P removal profiles in SBR cycle in R2.................................................. 135
Fig. 6.6. COD degradation profile and pH in SBR cycle in R2 ............................................. 136
Fig. 6.7. COD, NH3-N; NO3-N, and NO2-N degradation profiles in SBR cycle in R3 ......... 137
Fig. 6.8. COD, PO4-P removal profiles in SBR cycle in R3.................................................. 138
Fig. 6.9. COD degradation profile and pH in SBR cycle in R3 ............................................. 139
Fig. 6.10. COD degradation profile of batch reactors under different COD:N:P ratios ........ 141
Fig. 6.11. NH3-N degradation profile of batch reactors under different COD:N:P ratios ..... 142
Fig. 6.12. PO4-P concentration profile of batch reactors under different COD:N:P ratios ... 143
Fig. 6.13. pH profile of batch reactors under different COD:N:P ratios ............................... 144
Fig. 6.14. (a) SEM-EDX image scan of a granule slice (b) phosphorus precipitation (c) calcium
precipitation (d) elemental composition map ................................................................ 148
Page 19
xvii
Fig. 6.15. Contours of removal efficiencies at different COD:N and COD: P ratios after 8 hours
for: (a) COD; (b) NH3-N; and (c) PO4-P ....................................................................... 150
Fig. 6.16. PS and PN concentration for TB-EPS ................................................................... 155
Fig. 6.17. Heatmap of dominant genera and major functional groups for N and P removal . 158
Fig. 7.1. (a) Experimental setup; and (b)UASB reactor ........................................................ 163
Fig. 7.2. Profiles of COD in UASB reactor ........................................................................... 164
Fig. 7.3. Microbial community relative abundance at genus level ........................................ 166
Fig. 7.4. Schematic diagram of the anaerobic and the aerobic jars ....................................... 169
Fig. 7.5. Scanning Electron microscope (SEM) image of EGMs .......................................... 169
Fig. 7.6. COD removal efficiency vs. time at granule dose of 0.4 g/L .................................. 175
Page 20
xviii
List of Tables
Table 2.1. Effluent quality for AS, two-stage UASR and two-stage UASR and AS in treating
high-strength fruit industry wastewater* ......................................................................... 28
Table 2.2. Advantages and disadvantages of biological technologies for high-strength
wastewater treatment........................................................................................................ 41
Table 3.1. Synthetic substrate composition of 1L stock solution of COD of 100,000 mg/L .. 52
Table 3.2. Analytical methods ................................................................................................ 54
Table 5.1. Summary of reactor operational parameters ........................................................... 90
Table 5.2. Tests of between-subjects effects .......................................................................... 94
Table 5.3. Dynamics of the reactor microbial community indexes ...................................... 118
Table 6.1. Experimental design for batch reactors ................................................................ 127
Table 6.2. Detailed experimental conditions, organics and nutrients removal efficiencies .. 128
Table 6.3. Characteristics of aerobic granules in R1, R2, and R3 at steady state .................. 129
Table 6.4.Test of between-subjects effects (dependent variable COD removal) ................. 146
Table 6.5. Data for tested variable in ANOVA ..................................................................... 147
Table 6.6. Linearized models Equations and parameters for COD degradation ................... 149
Table 6.7. Observed Yield (YObs) and EPS production per unit COD removed .................... 152
Table 7.1. Initial COD concentrations, environmental conditions and HRT ........................ 170
Page 21
1
Introduction
1.1 Background
Since the early days of the industrialization era, continuous population growth along with
human activities has resulted in the degradation of our environment. Water pollution is
primarily caused by the discharge of inadequately treated industrial and municipal
wastewater in rivers, seas, and oceans. Industrial wastewater is a major source of water
pollution due to its elevated organic content. There are many types of industrial
wastewaters that use organic substances for their main processes. Examples of these
industries include: pharmaceuticals, cosmetics, organic dyes, adhesives, synthetic
detergents, pesticides, textile factories, paper manufacturing plants, oil refining industry,
brewery and fermentation, and metal processing industry (Shi 2009). The effluents of these
industries need to undergo pretreatment followed by biological treatment to remove the
organic matter. However, the effluents of industries, typically referred to as high-strength
wastewater, are posing a challenge in treatment as they contain high amounts of organics
and usually require nutrients adjustment for successful biological treatment. In addition,
increasingly stringent environmental regulations on wastewater discharge are
implemented to overcome the burden on the aquatic environment, leading to increase in
treatment costs.
Biological wastewater treatment provides excellent economic advantages over other treatment
processes not only in terms of capital investment and operating cost, as highlighted by Mittal
(2011), but the opportunity it provides towards the conversion of waste into renewable energy
source (Tay et al. 2010). In addition, unlike other physico-chemical treatment processes,
biological treatments can efficiently degrade industrial compounds without generating toxic
byproducts (Baêta et al. 2015). However, despite the simple concept of biological treatment:
Page 22
2
naturally occurring bacteria removing small organic carbon molecules by “eating” them,
growing, and the wastewater is cleansed, the control of the treatment process is complex. Many
variables can affect the process, including: the composition of the bacterial flora, the changes
in the wastewater passing into the system, the variations in the flow rate, the chemical
composition, pH and temperature, and strength of organics (Davies 2005).
In aerobic treatment, such as conventional activated sludge (CAS), free or dissolved oxygen is
used by microorganism to oxidize organic materials to carbon dioxide (CO2), new biomass and
water (H2O), while anaerobic treatment processes take place in conditions devoid of oxygen
and produce methane (CH4), CO2, and biomass as the end products (Mittal 2011). Aerobic
biological processes are commonly used in the treatment of organic wastewaters for achieving
a high degree of treatment efficiency. They are suitable for the treatment of low-strength
wastewaters (chemical oxygen demand, COD, concentrations less than 1000 mg/L). However,
these systems are deemed not feasible for the treatment of high-strength organic wastewaters
(COD concentrations over 4000 mg/L) due to the excessive demand on energy for aeration and
the generation of huge amounts of sludge that needs to be stabilized and disposed of.
High-strength organic wastewaters are preferably treated in an anaerobic reactor, producing
low surplus sludge and at the same time utilizing the high level of organic content for energy
generation (Chan et al. 2009; Metcalf & Eddy Inc. 2014). However, in practical applications,
anaerobic treatment suffers from low growth rate of the microorganisms, high sensitivity to
toxic loadings, low temperatures, pH changes and fluctuations in environmental conditions, a
low settling rate of biomass, and the need for post treatment of the noxious anaerobic effluent
which often contains ammonium ion (NH4+) and hydrogen sulfide (HS−) (Chan et al. 2009;
Grady et al. 1999; Leitão et al. 2006; Rajeshwari et al. 2000). Moreover, complete stabilization
Page 23
3
of high-strength organic matter cannot be achieved anaerobically; and this results in effluent
quality that usually fails to comply with the standards (Ahammad et al. 2013).
Another major drawback of conventional systems is the poor separation between biomass and
the treated effluent due to the presence of the active biomass in floccular form (Gobi et al.
2011). Clarification tanks, that demand large areas, are necessary for conventional systems. In
contrast, highly compact reactors have been developed for biogranulation processes. For
example, in the upflow anaerobic sludge blanket (UASB) reactor, successful treatment was
achieved at an organic loading rate (OLR) up to 40 kg COD/m3.day (Lettinga et al. 1980) and
until now aerobic granulation has been able to withstand OLR up to 15 kg COD/m3.day in SBR
reactors (Moy et al. 2002; Show et al. 2012). Compared to flocculent sludge, granular biomass
offers better settling ability, higher biomass retention time, more tolerance to toxicity and
resistance to shock loading, denser and stronger microbial structure and results in better solid-
liquid separation (El-Kamah et al. 2010; Liu et al. 2003; Liu and Tay 2004; Maszenan et al.
2011; Qin et al. 2004b; Saleh and Mahmood 2003).
From the foregoing, it is proposed to combine anaerobic and aerobic systems employing
granulation technology for the treatment of high-strength organic wastewater. The
combined system will achieve efficient treatment for high-strength organic wastewater in a
small footprint, provide high quality effluent, low surplus sludge, and at the same time utilize
the concept of resource recovery through generating biogas as a renewable energy source. In
this system, it is hypothesized that the effluent of the anaerobic process contains solubilized
organic matter suitable for subsequent aerobic treatment because of its reduced organic strength
and enhanced organics to nutrients (nitrogen and phosphorus) ratios.
Page 24
4
1.2 Research objectives
The objective of this research study is to develop an uplow aerobic granular sludge semi-pilot-
scale bioreactor (UAGSBR) to achieve further aerobic biological wastewater treatment of high-
strength organic wastewater effluents from anaerobic systems (such as UASB) to produce
effluent of quality that meets the discharge standards. This new technology will be able to
remove the elevated levels of organics in high-strength organic wastewater, while producing
minimal sludge in a more effective and economical manner compared to the conventional
technologies.
The specific objectives of this project are:
1. Investigate the influential operational parameters for rapid formation of aerobic granules in
a sequential batch reactor (SBR) for treatment of high-strength organic wastewater
2. Determine the treatability of high-strength organic wastewater employing the developed
aerobic granular bioreactor
3. Establish the operational boundaries and investigate long-term stability of aerobic granular
sludge for treatment of high-strength organic wastewater
4. Determine the optimal (minimal) nutrients (nitrogen and phosphorus) dosage for efficient
biological process in high-strength organic wastewater treatment using aerobic granular
sludge
5. Investigate the feasibility of using upflow anerobic sludge blanket as pretreatment and test
combined anaerobic-aerobic treatment system
1.3 Scope of work
The project was executed at controlled environmental conditions (laboratory) using synthetic
wastewater in a semi-pilot-scale column type bioreactor operated in a sequential batch mode
Page 25
5
at temperature of 18±2 oC. During the study return activated sludge (RAS) was used as seed
sludge. The characteristics of biomass aggregates before and after development of aerobic
granules were evaluated for physical and chemical characteristics and microbial community
composition. Preliminary evaluation of the feasibility of combining anaerobic-aerobic systems
for treatment of high-strength organics wastewater was tested in sequential anaerobic-aerobic
batch experiments. Upflow anaerobic sludge blanket lab-scale bioreactor was used as a
pretreatment option.
1.4 Thesis organization
Chapter one of this thesis aimed at introducing the problem along with the proposed solution.
Chapter two provided a literature review of the advances in biological treatment for high-
strength organic wastewater. The methodology was illustrated in chapter three. The first two
objectives were realized in chapter four, where an upflow aerobic granular sludge bioreactor
was developed and operated in sequential batch mode for developing mature granules. To
investigate the treatment of wastewater of increasing organic strength (COD range of 2000 to
~ 7500 mg/L), the reactor was operated at increasing OLRs values from 9 to 27 g COD/ L.day.
The third objective was attained in chapter five, where the impact of one influential parameter,
namely, food-to microorganisms ratio, along with its stability boundaries was realized and
optimized. The fourth objective was achieved in chapter six, where the nutrients addition was
optimized. The fifth objective was achieved in chapter seven, where an uflow anaerobic sludge
blanket reactor was investigated for providing pretreatment for COD concentrations up to
~15,000 mg/L. Anaerobic-aerobic batch experiments were conducted to study the feasibility
of combining anaerobic-aerobic systems for treatment of high-strength organic wastewater.
The conclusions of this work were highlighted in chapter eight.
Page 26
6
Literature Review
2.1 Introduction
Industrial wastewater is a major source of water pollution due to its elevated organic
content. There are many types of industrial wastewaters based on different industries.
Organic industrial wastewater is that produced from chemical industries that use o rganic
substances for their main processes. Examples of these industries include pharmaceuticals,
cosmetics, organic dyes, adhesives, synthetic detergents, pesticides, textile factories, paper
manufacturing plants, oil refining industry, brewery and fermentation, and metal
processing industries (Shi 2009). The effluents of these industries, typically referred to as
high-strength wastewater, need to undergo pretreatment followed by biological treatment
to remove the organic matter. However, biological high-strength wastewater treatment is
posing a challenge especially with the more stringent environmental regulations on
wastewater discharge.
Although there is no clear definition of high-strength wastewater, it is generally described
as any wastewater containing contaminants at concentrations greater than domestic
wastewater (NESC 2003). The American National Standard Institute, by way of
recommendation for aerobic treatment units, defines domestic wastewater as any
wastewater with 5-day biochemical oxygen demand (BOD5) of 100 - 300 mg/L and total
suspended solids (TSS) of 100 - 350 mg/L (NSF 2009). Turkdogan-Aydinol (2011)
identified low-strength wastewater as those with chemical oxygen demand (COD)
concentrations < 1000 mg/L.
Unlike municipal wastewater, industrial wastewater is characterized by high organic
strength ranging from 1 – 200 g COD/L (Hai 2014). However, the concentrations of
contaminants in high-strength wastewater vary from one industry to another because of
Page 27
7
the different chemicals used during the main process; hence, a wide range of values have
been identified in the literature. It has been described as wastewater having BOD5
concentration in the range 100 – 3,685 mg/L, TSS from 142 – 4,375 mg/L, and oil and
grease (O & G) from 50 – 14,958 mg/L (Heger n.d.). The organic strength (as mg COD/L)
of some industrial wastewaters is as follows: pharmaceutical effluents 5000 - 15,000,
breweries 1500 - 5000, tannery 200 - 4000, and pulp 800 - 10,000 (Munter 2000; Shi
2009).
The biodegradability of the wastewater plays a major role in biological treatment.
Biodegradability is represented as BOD/COD ratio. Wastewater is considered readily
biodegradable at a BOD/COD ratio ≥ 0.5 (Metcalf & Eddy Inc. 2014). Readily
biodegradable wastewaters such as dairy industry wastewaters with COD value of 2000
mg/L are deemed as low strength level (Ganesh et al. 2007), while petrochemical effluent
of 1000 mg/L COD is considered high-strength (Mutamim et al. 2012, 2013). With less
than 30% biodegradable content in pharmaceutical effluent (Shi 2009), biological
treatment is deemed challenging. In general, Chan (2009) described high-strength
wastewater as any wastewater containing COD concentration above 4000 mg/L.
By means of classifying a suitable COD range for aerobic treatment, it was widely reported
that high-strength wastewaters were identified as those of COD concentration greater than
4000 mg/L, where aerobic treatment is no longer feasible; whereas, an anaerobic treatment
would provide a suitable treatment option that requires no oxygen, produces less excess
sludge, and offers a potential energy source (Cillie et al. 1969; Grady et al. 1999; Rudd et
al. 1985). For the purpose of this review, high-strength wastewater is considered as that
characterized by COD concentration greater than that of domestic level, where
conventional municipal wastewater treatment plants are not capable of handling.
Page 28
8
This chapter provides an overview of the conventional biological high-strength wastewater
treatment technologies alongside their limitations. Advanced biological technologies
introduced during the last five decades for treating high-strength wastewater are reviewed
with focus on high rate anaerobic digesters such as anaerobic filter (AF), anaerobic
fluidized bed reactor (AFBR), and upflow anaerobic sludge blanket (UASB). In addition,
emerging hybrid systems such as membrane bioreactors (MBRs), combined and integrated
anaerobic-aerobic systems are discussed as potential treatment alternatives.
2.2 Conventional biological technologies
Biological wastewater treatment remains an attractive technology because of its economic
advantages over other treatment processes in terms of capital and operating costs (Mittal 2011).
It also offers the opportunity to convert waste into renewable energy (Tay et al. 2010) and
degrade industrial compounds without generating toxic by-products (Baêta et al. 2015). Despite
these advantages, conventional biological treatment processes fail to degrade high-strength
wastewater and produce high quality effluent. The most common conventional biological
treatment systems are outlined below, namely: activated sludge, trickling filter, and lagoons.
2.2.1 Activated sludge.
Aerobic treatment processes such as conventional activated sludge (CAS), Fig. 2.1, are
commonly used in the treatment of low-strength organic wastewaters (COD < 1000 mg/L).
They are not suitable for the treatment of high-strength industrial wastewaters (Chan et al.
2012; Grady et al. 1999). CAS can, however, be used as a polishing step of anaerobically
treated effluents.
A major drawback of CAS is the poor separation between biomass and the treated effluent due
to the presence of active biomass in floccular form (Gobi et al. 2011). The solid-liquid
Page 29
9
separation is imperative to producing high-quality effluent. The secondary clarifiers serve the
purpose of biomass separation from the treated effluent (Patziger et al. 2012). However, poor
settling of activated sludge has been frequently reported (Iritani et al. 2015; Patziger et al. 2012;
Urbain et al. 1993), resulting in suspended solids being carried over the weirs with the effluent.
Fig. 2.1. Activated sludge process: (a) schematic diagram; and (b) aeration basin
Source: Theobald (2017)
The settling velocity of biomass determines the efficiency of the solid-liquid separation (Adav
et al. 2008a). It has been reported that the settling velocity of floccular sludge ranges from 7 -
10 m/h compared to granular biomass which exhibits velocity in the range 25 - 70 m/h (Liu
(a)
(b)
Page 30
10
and Tay 2004). The settling ability of sludge is also indicated by sludge volume index (SVI).
A study found that flocculent sludge of average diameter 0.09 mm had an SVI value of 208
mL/g, as opposed to granular biomass of average diameter 1.9 mm, offering SVI value < 35
mL/g (Liu et al. 2003). In general, flocculent sludge exhibits SVI value > 120 mL/g, while
granular biomass offers considerably reduced SVI value (< 50 mL/g) (Beun et al. 2002; Toh et
al. 2003). Denser and faster settling biomass reduces SVI value, thus enhancing the settling
ability of sludge (Gobi et al. 2011) and resulting in effluent low in suspended solids.
Another phenomenon contributing to poor settling in CAS is sludge bulking in the secondary
clarifier which leads to sludge foaming (Krhutková et al. 2002; de los Reyes III and Raskin
2002; Martins et al. 2004). Sludge bulking is due to the excessive growth of filamentous
bacteria (Liu and Tay 2012; Martins et al. 2004) and excessive extracellular polymeric
substances (EPS) production (Liao et al. 2001; Urbain et al. 1992). The excessive growth of
filamentous bacteria interferes with sludge settling, allowing the unsettled biomass to escape
with the effluent (Han and Qiao 2012).
2.2.2 Trickling filter.
A trickling filter (TF), Fig. 2.2, is a non-submerged fixed bed reactor consisting of highly
permeable packing media in which aerobic condition is maintained via diffusion, forced
aeration, natural convection or splashing. When wastewater is sprayed from the top in TF, it
percolates towards the bottom drain, gradually forming an active fixed film of microorganisms
on the surface of the packing media. The film degrades the organic matter as the wastewater
passes around it. Filter beds are usually round with depth ranging from 4 - 12 m, where for
stone media the filter depth is only 0.9 - 3 m whereas for synthetic media up to 12 m filter
depths have been used (Chowdhury et al. 2010; Metcalf & Eddy Inc. 2014; Mittal 2011).
Page 31
11
Unlike CAS, sludge bulking in the secondary clarifier is not an issue in TF (Metcalf & Eddy
Inc. 2014).
Fig. 2.2. Typical trickling filter
Source: Metcalf & Eddy Inc. (2014)
Trickling filters have been assessed for the treatment of high-strength wastewaters. Kornaros
(2006) evaluated the use of pilot-scale TF as pretreatment of organic dye and varnishes
wastewater (influent COD concentrations up to 10,000 mg/L). COD removal efficiency of 60
- 70% was achieved for a hydraulic loading of 1.1 m3/m2.day and up to 80–85% for a hydraulic
loading 0.6m3/m2.day, with about 30 - 60% of the total COD removal due to air stripping, while
the rest of the COD was removed through biodegradation. TF was employed as primary
Page 32
12
treatment following dissolved air flotation (DAF) system, for abattoir wastewater (total COD
= 3921 mg/L, soluble COD = 1598 mg/L). It was found that the DAF unit reduced TCOD by
22% and sCOD by 16%, while the TF reduced sCOD by 27% only and did not reduce TCOD
(Massé and Masse 2000; Mittal 2011).
Chowdhury (2010) reported that TFs, utilizing plastic media in columns 4.5–6.0 m high, were
used in the treatment of high-strength fruit and vegetable wastewater (3000–4000 mg/L BOD5).
However, it was highlighted that high liquid recirculation rates and forced air circulation were
necessary to achieve BOD5 removals up to 90%. Treatment of wastewater from a squid
processing facility using a rope media TF was reported achieving removal efficiency in terms
of BOD5 of 87% for wastewater influents of BOD5 values up to 3000 mg/L (Park et al. 2001).
However, wastewater treatment using TF results in a net production of total suspended solids.
Therefore, liquid-solids separation is required, and is typically achieved with secondary
clarifiers. In addition, limitation in oxygen transfer remains a major disadvantage of trickling
filters, especially at excessive hydraulic applications which can also result in ponding (Metcalf
& Eddy Inc. 2014). Filter clogging due to the increase in biofilm thickness and headloss are
other problems associated with TFs. TFs are also susceptible to nuisance conditions such as
filter flies (Daigger and Boltz 2011). Oxygen requirements and treatment time in TFs increase
steeply with increasing wastewater strength.
2.2.3 Lagoons.
Lagoons are large basins enclosed by earth embankments in which wastewater is treated using
entirely natural processes involving both algae and bacteria (Mara 2004). Sedimentation and
biodegradation are the pathways for pollutants removal in lagoon systems (Rajbhandari and
Annachhatre 2004). The activities of autotrophic, phototrophic, and heterotrophic
Page 33
13
microorganisms are employed to remove wastewater pollutants (Shpiner et al. 2009).
Anaerobic lagoons are widely used as pretreatment for high-strength organic wastewater. To
minimize the effects of oxygen diffusion from surface, anaerobic lagoons are typically 2 - 5 m
deep (Mara 1997). However, the treatment efficiency for high-strength wastewater in anaerobic
lagoons is limited to only 60% BOD removal (USEPA 2000). Thus, anaerobic lagoons
followed by facultative lagoons are typically used to provide the required treatment (USEPA
2000). Lagoon systems have been employed to treat high-strength wastewaters (Arbeli et al.
2006; Rajbhandari and Annachhatre 2004; Rakkoed et al. 1999; Shpiner et al. 2009).
Lagoons offer the advantages of being very simple to construct, requiring low capital,
operational and maintenance (O&M) costs as well as having good resistance to hydraulic and
organic shock loads (Mara 2003, 2004). The major disadvantage of lagoons is the large land
requirement. However, where space is not a constraint, lagoon systems remain attractive
processes (Orupõld et al. 2000). For most industries, there are spatial constraints; as such,
lagoon systems are not suitable.
In view of the drawbacks of conventional biological systems, new technologies have been
developed to overcome the demerits of these systems. Granular biomass has evolved as a
superior alternative to floccular sludge. Researchers have also proposed integrated or combined
systems of pretreatment or post treatment (biological as well as physico-chemical processes)
as solutions to completely degrade high-strength wastewater (Ahammad et al. 2013; Ahmad et
al. 2003; Chan et al. 2009, 2012; Gobi et al. 2011). Since biological treatment systems are the
most economically sustainable technologies providing lower capital investment and operating
costs without secondary pollution and toxic by-products (Baêta et al. 2015; Chan et al. 2009;
Mittal 2011), the following sections provide a critical review on up-to-date biological
technologies for treating high-strength wastewater.
Page 34
14
2.3 High-rate anaerobic digesters
High-strength organic wastewaters are preferably treated in an anaerobic reactor, producing
low surplus sludge and at the same time utilizing the high level of organic content for energy
generation (Chan et al. 2009; Metcalf & Eddy Inc. 2014). By mid-twentieth century, first
generation high-rate anaerobic reactors were introduced by including intense mechanical
mixing in completely stirred tank reactor (CSTR), Fig. 2.3 (a), and recycling part of microbial
population that was separated from the effluent stream in anaerobic contact reactor. These
anaerobic reactors produced digesters with efficiency 2 - 3 times that of low rate digesters.
However, the wash out of microbial population with the effluent in CSTR, the need for a
degasifier in order to recycle reactor effluent solids in anaerobic contact reactor, along with a
long hydraulic retention time (HRT), 10 - 20 days as opposed to 6 - 16 hours in CAS, limited
the appeal of these processes. Second-generation anaerobic reactors were developed to
overcome those drawbacks, by introducing upflow anaerobic filter incorporating a supporting
media such as gravel (Tauseef et al. 2013). Three of the most common variations of high-rate
anaerobic digesters (Fig. 2.3) are discussed below, namely: anaerobic filter, anaerobic
fluidized-bed reactors, and upflow anaerobic sludge blanket.
2.3.1 Anaerobic filter.
An anaerobic filter (AF), Fig. 2.3 (b), is made up of one or more vertical filter beds containing
some inert material such as rocks, or plastic media, which act as a stationary support surface
for microbial film attachment. AFs were reported to be a favorable attached growth alternative
process for treatment of high-strength wastewaters (Massé and Masse 2000; Young and
McCarty 1969). Generally, wastewaters are pumped upward through the support media
allowing contact between the attached microorganisms and the wastewater. Microbial growth
Page 35
15
also takes place in the voids between the support media. This type of system tends to permit an
adequate solids retention time (SRT) for the methane producing bacteria (Switzenbaum 1983).
Fig. 2.3. Typical reactor configurations used in anaerobic wastewater treatment: (a)
completely stirred tank; (b) anaerobic filter; (c) expanded/ fluidized bed; and (d) upflow
anaerobic sludge blanket
Source: Chernicharo (2007)
Henry (1987) investigated the treatment of leachate from a partially stabilized landfill (COD =
3750 mg/L; BOD/COD = 0.3) and a relatively new landfill (COD=14,000 mg/L; BOD/COD =
0.7) in AFs. Findings from this study showed high COD removal efficiency (90%) at loading
rates of 1.26–1.45 kg COD/m3.day for both leachates. Similarly, Omil et al. (2003) investigated
(a) (b)
(c) (d)
Page 36
16
the treatment of diary wastewater in a two-phase full-scale system composed of 12 m3
anaerobic filter and 28 m3 sequencing batch reactor (SBR) for further organics and nitrogen
removal under aerobic/anoxic conditions. The AF achieved reduction in COD at steady state
operation from 8671 mg/L to 2225 mg/L while the combined system achieved a removal
efficiency of ~91%.
However, bed clogging and hydraulic headloss remain the major drawbacks of AFs
(Rajeshwari et al. 2000). Other limitations of AFs include: low reduction of nutrients,
requirements of further treatment for effluent and sludge, and long start-up time (Tilley et al.
2014). Furthermore, reactor volume is relatively high compared to other high-rate processes
due to the volume taken up by the filter media (Rajeshwari et al. 2000).
2.3.2 Anaerobic fluidized bed bioreactor.
A fluidized bed reactor, Fig. 2.3 (c), is a submerged attached growth process, where the
biomass grows as a bio-layer around small inert particles such as fine sand or activated carbon.
These bio-layer covered particles are maintained in a fluidized state by an upwards directed
flow of water (Metcalf & Eddy Inc. 2014). Anaerobic fluidized bed reactor (AFBR) technology
has been found to be more effective than AF technology as it enhances the transport of
microbial cells from the bulk to the surface and thus increases the contact between
microorganisms and the substrate. In addition, it allows for higher organic loading rates (OLRs)
(Sowmeyan and Swaminathan 2008). Moreover, AFBRs overcome the disadvantages of bed
clogging and hydraulic headloss in AFs. In addition, AFBRs have better hydraulic circulation,
greater surface area per unit of reactor volume, and lower capital cost due to reduced reactor
volumes.
Page 37
17
However, the recycling of effluent may be necessary to achieve bed expansion in AFBRs
(Rajeshwari et al. 2000). As the rate of flow increases, the extent of expansion of the particle
bed also increases. On this basis, the reactor is called an expanded-bed reactor (15 - 25%
expansion), or a fluidized-bed reactor (>25 - 300% expansion) (Tauseef et al. 2013). The AFBR
and the expanded-bed reactors run well on feed that is soluble or contains easily biodegradable
suspended material such as black liquor condensate, whey, whey permeate, etc (Switzenbaum
1983).
AFBRs exhibit many advantages including high settling velocities. The heavy particles in
AFBR have very high settling velocities (about 50 m/h); and this enables the application of
high liquid velocities in the reactor (in the range of 10 to 30 m/h). The high liquid velocity
prevents the accumulation of the inert sediments in the wastewater in the reactor. Biomass
concentration of up to 91,000 mg/L have been reported in AFBR which is possible due to the
high specific surface area available (Farhan et al. 1997). Because of the high biomass
concentration and activity, a very high treatment capacity is obtained (Heijnen et al. 1989).
This is suitable for high-strength wastewater treatment.
Sowmeyan and Swaminathan (2008) investigated the use of inverse (down flow) AFBR,
employing perlite (an expanded volcanic rock) as biomass carrier, for the treatment of high-
strength distillery wastewater. The system achieved COD removal efficiency of 84% at OLR
of 35 kg COD/m3.day. Şen and Demirer (2003) investigated the use of an AFBR with pumice
as the support material for the treatment of textile wastewater. Results indicated that, the
corresponding maximum COD, BOD5 and color removals were found to be around 82%, 94%
and 59%, respectively, for HRT of about 24 h and OLR of 3 kg COD/m3.day. Haroun and Idris
(2009) showed that the use of AFBRs, with activated carbon as support material, can provide
Page 38
18
treatment for textile wastewater (with the influent COD concentration of 2200 mg/L). The
COD, BOD5 and color removal efficiencies were around 98%, 95%, and 65%, respectively.
AFBR was also used for the treatment of thin stillage as a by-product of bioethanol production
plants (130,000 mg TCOD/L and 47,000 mg TSS/L) employing zeolite as the carrier media.
The AFBR showed up to 88% TCOD and 78% TSS removal at organic and solids loading rates
of 29 kg COD/m3.day and 10.5 kg TSS/m3.day respectively, resulting in an effluent with TCOD
of 14400 ± 2800 mg/L and TSS concentration during steady state of 9800 ± 2500 mg/L at an
HRT of 3.5 days (Andalib et al. 2012).
The failure of AFBRs under COD loading rates exceeding 15 kg/m3.day was reported due to
the accumulation of volatile acid in the AFBR and thus a separated-phase fluidized bed system
with an acidification reactor followed by a methanogenic reactor was suggested (Bull et al.
1984). The separated (two)-phase system improved effluent quality compared to a single-phase
AFBR resulting in an effluent with a considerably lower suspended solids concentration. This
was attributed to the superior settling properties and the formation of ethanol and lactate in the
acidification reactor which has been shown to reduce acid sludge production.
2.3.3 Upflow anaerobic sludge blanket.
Upflow anaerobic sludge blanket (UASB), Fig. 2.3 (d), which evolved in the 1970s (Lettinga
et al. 1980), is considered a breakthrough technology in the field of wastewater treatment using
high-rate anaerobic treatment systems. Its distinctive advantage lies in the formation of
granular sludge, without any media for attachment, offering dense and strong microbial
structure, good settling ability, high biomass retention, tolerance to toxicity and resistance to
shock loading when compared to suspended cultures (Adav et al. 2008a; El-Kamah et al. 2010;
Ergüder and Demirer 2005; Luo et al. 2014; Maszenan et al. 2011; Saleh and Mahmood 2003).
Page 39
19
The UASB offers a notable design that combines the whole process of digestion and settlement
in a single reactor, thus reducing footprint requirements (Liu and Tay 2002, 2004). The unique
gas-solid-liquid separator, which separates biogas from sludge granules and treated effluent,
serves for maximizing biomass retention without the need for external clarifier (Tay et al.
2010). In addition, it provides the opportunity to produce biogas, a renewable energy source.
Despite the advances in high-rate anaerobic technology, 90% of the current setups are
considered variations of the conventional UASB. It has been reported that UASB along with
its variant – the expanded granular sludge bed (EGSB) reactor – together account for 72% of
all anaerobic reactors presently in operation across the world (Tauseef et al. 2013). A major
advantage is that UASB technology has comparatively less investment requirements when
compared AF or AFBR (Chan et al. 2009). Moreover, unlike mechanized aerobic systems,
UASB requires less energy and generated lower amounts of sludge. It has been reported that
only one discharge of sludge from a UASB is required per year for a four-meter high reactor
(Gómez 2011).
However, among notable disadvantages, UASB has a long start-up period along with the
requirement for a sufficient amount of granular seed sludge for faster start-up. In addition,
significant wash-out of sludge during the initial phase of the process is likely and the reactor
needs skilled personnel for operation (El-Kamah et al. 2010; Rajeshwari et al. 2000). High
loading rates and the presence of high amounts of suspended solids are other challenges facing
the UASB technology (Gobi et al. 2011). It has been reported that a maximum allowable OLR
for UASB reactor treating cheese-whey wastewater (TCOD = 5.4 - 77.3 g/L) was 28.5 g
COD/L.day, where there was no considerable washout of sludge. When the OLR was increased
to 29.2 g COD/L.day, the settling ability of the sludge was severely reduced as the cheese-
Page 40
20
whey ingredients extensively included into the structure of sludge blanket, resulting in stoppage
of operation (Kalyuzhnyi et al. 1997).
It was highlighted that in UASB systems, OLRs ranging from 4 - 6 kg COD/ m3.day are adopted
when treating wastewater with COD contents higher than 2000 mg/L with an insoluble fraction
ranging between 30% and 60% (Núñez and Martínez 1999; Torkian et al. 2003). Andalib et al.
(2012) reported that a maximum OLR of 16 COD/m3.day was achievable at UASB treating
pulp and paper wastewater with influent COD of 5500 – 6600 mg/L and influent TSS (volatile)
of 50 mg/L. On the other hand, it was recommended to operate UASB at a maximum COD
load up to 11 kg COD/m3.day at 30°C and 7 kg COD/m3.day at 20°C for treatment of
wastewaters with high amounts of suspended solids such as slaughterhouse waste, where 40%
- 50% of the pollutants are present as insoluble and slowly biodegradable coarse suspended
matter (Sayed et al. 1987).
Therefore, for practical applications, the applied OLR depends on the amounts of suspended
solids in the wastewater and the temperature. It is appropriate to operate at lower OLR when
treating wastewaters containing high amounts of insoluble solids at lower temperatures.
Moreover, although successful removal of more than 60% COD by UASB is reported from
most types of wastewater (Chan et al. 2009), UASB treated effluents usually do not meet most
discharge standards, and the produced effluent is poor in terms of TSS (Visvanathan and
Abeynayaka 2012).
Mahmoud (2008) investigated the treatment of high-strength sewage (~1000 - 1700 mg/L with
up to 70 % fraction of suspended COD) in a one-stage UASB reactor and a UASB-digester
system. The performance of the one-stage UASB reactor, which was operated for a period of
one year at HRT of 10 hours, was affected by temperature fluctuations between winter and
summer (15 – 25°C). The one-stage UASB reactor achieved removal efficiencies for total,
Page 41
21
suspended, colloidal, dissolved and volatile fatty acids (VFA) COD of 54, 71, 34, 23%, and -
7%, respectively during the first warm six months of the year, and achieved only 32% removal
efficiency for total COD over the following cold six months of the year. The one-stage UASB
reactor was modified to a UASB-digester system by incorporating a digester operated at 35°C.
The removal efficiency of the UASB-digester system showed tremendous improvement for
total, suspended, colloidal, dissolved, and VFA COD of 72, 74, 74, 62 and 70%, respectively.
This improvement, as highlighted by (Zeeman and Lettinga 1999), is attributed to the
hydrolysis of suspended COD in the first reactor, while the second stage is a methanogenic
reactor where mainly dissolved COD is converted to methane gas.
The effect of low temperature on UASB performance was highlighted in the literature, where
the performance of UASB reactors is adversely affected at low temperature as the hydrolysis
of the entrapped COD becomes limited, resulting in accumulation of solids in the sludge bed,
especially when dealing with high organic loadings (Mahmoud 2008). The solids accumulation
will necessitate frequent sludge discharge leading to a low solids retention time (SRT), which
will negatively affect the methanogenic activity, resulting in poor COD removal and
deterioration in the digestion process unless long HRTs are applied (Mahmoud 2008; Zeeman
and Lettinga 1999). Low temperature, high loading rate and high TSS result in shorter SRT,
and thus decrease the biogas production and COD removal efficiency (Zhao 2011). Thus, these
two-step systems are especially appropriate for the treatment of wastewater with a high
concentration of suspended solids at low temperatures, offering a reduction in HRT when
compared to a single stage UASB.
However, the characteristics of wastewater to be treated, the required treatment level, and
discharge requirements need to be evaluated prior to considering a second phase UASB reactor.
It has been indicated that a second stage UASB did not provide significant enhancement in the
Page 42
22
removal efficiency for tannery wastewater (influent mean COD concentration of 7255 mg/L;
influent average BOD5 value of 4329 mg/L, and influent TSS mean value of 3065 mg/L), where
COD removal efficiencies of 78.2% and 21.8% were attained for first and second stage UASB,
respectively (El-Sheikh et al. 2011).
Furthermore, it is worth mentioning that in UASB reactors, only a change in the chemical forms
of nitrogen and phosphorous takes place and nutrient removal is not complete (Zeeman and
Lettinga 1999; Zhao 2011). Moreover, the produced effluent is poor in terms of suspended
solids (Visvanathan and Abeynayaka 2012). It has been acknowledged that a downstream
polishing step is needed (Acharya et al. 2006; Chan et al. 2009). Hence, UASB can only serve
as anaerobic pretreatment of high-strength wastewater requiring further treatment for organics
and nutrients removal. In general, anaerobic treatment suffers from low growth rate of the
microorganisms, high sensitivity to toxic loadings and fluctuations in environmental
conditions, a low settling rate of biomass, and the need for post treatment of the noxious
anaerobic effluent which often contains ammonium ion (NH4+) and hydrogen sulfide (HS−)
(Chan et al. 2012; Grady et al. 1999; Leitão et al. 2006; Rajeshwari et al. 2000). Moreover,
complete stabilization of high-strength organic matter cannot be achieved anaerobically, and
this results in effluent quality that usually fails to comply with the standards (Ahammad et al.
2013).
2.4 Hybrid treatment systems
2.4.1 Membrane bioreactors.
A membrane bioreactor (MBR) integrates a physical barrier (membrane) in a conventional
biological treatment system, offering the opportunity to treat wastewater in a single system
(Chang et al. 2002; Tay et al. 2007). Generally, an MBR is a hybrid of biological treatment and
membrane filtration. MBRs have been successfully used for the treatment of both municipal
Page 43
23
and industrial wastewaters (Chu et al. 2006; van Dijk and Roncken 1997; Friha et al. 2014; Le-
Clech et al. 2006; Tauseef et al. 2013), providing physical separation of suspended solids and
biomass, and uncoupling HRT and SRT (Chang 2014).
The introduction of membrane filtration in the biological system eliminates the need for
secondary clarifiers. The elimination of secondary clarifiers and operation of MBR at a shorter
HRT results in significantly reduced footprint. An MBR also offers the following advantages
over CAS: high-quality effluent, higher volumetric loading rates, shorter reactor HRTs, longer
SRTs, less sludge production, and potential for simultaneous nitrification/denitrification in
long SRTs (Khan et al. 2011; Metcalf & Eddy Inc. 2014; Vargas et al. 2008; WEF 2011).
High-strength wastewater has been successfully treated using the MBR technology. Badani et
al (2005) investigated the treatment of textile industrial wastewater in a pilot-scale external
MBR with a reactor volume of 500 L. They reported 70%, 97% and 70% removal of color,
COD and NH4+-N respectively at mixed liquor suspended solids (MLSS) concentration of
15,000 mg/L and HRT of 2 days. In another study, Brik et al. (2006) investigated the
performance of MBR in the treatment and reclamation of textile wastewater using a lab-scale
MBR unit. Their study, which operated under OLRs ranging from 0.35 g/L.day to 3.6 g/L.day,
reported a COD removal of 60 - 95% with lower OLRs achieving less COD removal efficiency.
Nutrient addition in this study only slightly enhanced performance. The removal of color was
about 87%, which implies complete reclamation would require a further polishing step.
Spagni et al. (2012) investigated the treatment of synthetic textile wastewater containing azo
dyes under anaerobic conditions as a way of enhancing color removal. Findings from their
study showed 99% color removal in azo dye concentration of up to 3200 mg/L. The high
efficiency eliminates the need for a downstream polishing step. This indicates a strong potential
for the application of MBR in the treatment and reclamation of textile wastewater.
Page 44
24
In the food-processing industry, Acharya et al. (2006) highlighted the capability of two-stage
activated sludge - MBR in treating high-strength pet food wastewater as opposed to an existing
anaerobic digester which achieved only 30% COD reduction at HRT of 30 days. The
wastewater in their study contained O & G concentrations in the range 50,000 - 82,000 mg/L,
total COD and BOD5 of 100,000 mg/L and 80,000 mg/L respectively. The two-stage process
allowed for the removal of organic pollutants in the first stage and ammonia removal in the
second stage. The system achieved removal efficiency in terms of COD, BOD5, TSS, and
NH4+-N of 95.2%, 99.9%, 100%, and 99.7 % respectively at an overall HRT of 6.3 days. It is
worth mentioning, however, that the removal efficiency was much higher in the first stage,
where at an OLR of 7 kg COD/m3.day and at HRT of 2.8 days, 99.9% BOD5 and 96.99% COD
removal was achieved, while a rise in poorly biodegradable COD was observed across the
second stage. In addition, nitrite accumulation in the second-stage MBR was observed, even at
dissolved oxygen concentrations of more than 2.5 mg/L. Constant nitrite accumulation
inhibited the activity of Nitrosomonas, and high alkalinity (above 1000 mg/L) was crucial to
buffer the pH to keep formation of nitrous acid from inhibiting nitrifiers. The COD and
phosphorous removal efficiencies increased across membranes by 5 to 37% and 7 to 27%,
respectively, in both stages, because of retention of the particles coarser than the membrane
pore size (0.045 µm).
The treatability of other high-strength wastewaters using MBRs has also been extensively
studied. Tauseef et al. (2013) investigated the treatment of brewery wastewater using
membranes coupled with anaerobic reactors. Their study reported a COD removal efficiency
of 97% and methane yield of 0.28 L/g COD at OLR of 28.5 kg COD/m3.day. In another study,
Jensen et al. (2015) reported a consistent COD removal in excess of 95% and conversion of all
degradable COD to biogas from a study on slaughterhouse wastewater. The study, which was
Page 45
25
conducted in a 200 L anaerobic MBR pilot plant, was based on a stable OLR of 3 - 3.5 kg
COD/ m3.day at HRT of 2 days.
As a modification to enhance nutrient removal, Khan et al. (2011) introduced sponge suspended
carriers into a lab-scale MBR (15% reactor volume). The treatability of synthetic high-strength
wastewater with COD concentration of 1000 mg/L and COD:N:P ratio of 100:5:2 was
investigated in terms of COD, total nitrogen (TN) and total phosphorus (TP) removal at 8 hours
HRT and 30 days SRT. Findings from their study indicated that the modified MBR achieved
98%, 89% and 58% removals of COD, TN and TP respectively compared to 98%, 74% and
38% removals of COD, TN and TP respectively in suspended growth MBR (Khan et al. 2011).
Nutrients removal due to assimilation into biomass can be considered the same for both
reactors. The enhancement in nutrient removal in the modified MBR is attributable to the
development of dissolved oxygen gradient within the sponge carrier, where oxic zone is
maintained at the periphery while anoxic/anaerobic zone is in the deeper zones of the sponge.
Simultaneous nitrification and denitrification occurs where heterotrophs and nitrifiers were
developed at the outer zone, while denitrifers developed at the deeper zone. Phosphorus
removal in the modified MBR may be attributed to phosphorus accumulating organisms
(PAOs) which may have developed within anoxic/anaerobic zones of the sponge media.
However, membrane fouling is the main drawback of MBRs (Tu et al. 2010; WEF 2011), as it
significantly reduces membrane performances and membrane life leading to an increase in
maintenance and operating costs (Chang et al. 2002; Wei et al. 2011). Fouling has been reported
for both aerobic and anaerobic MBRs, even when operating below the critical flux (Hufnagel
2014; Jeison et al. 2008).
Page 46
26
2.4.2 Combined anaerobic-aerobic treatment systems.
Recent research interests have been in combining anaerobic and aerobic systems to achieve
complete stabilization of high-strength wastewater. It has been hypothesized that the effluent
of anaerobic treatment contains solubilized organic matter suitable for subsequent aerobic
treatment because of its reduced organic strength and enhanced amounts of nitrogen and
phosphorus (Chan et al. 2009, 2012). Combined anaerobic-aerobic treatment can reduce
operating cost by a factor of eight when compared with aerobic treatment alone due to reduction
in energy consumption (Ahammad et al. 2013; Chan et al. 2009). In terms of sludge production,
for most wastewaters, the net sludge yield from aerobic activated sludge treatment is of the
order of 0.5 kg of volatile suspended solid (VSS) per kg COD removed as opposed to less than
0.1 kg VSS/kg COD removed sludge yield from anaerobic treatment (Tauseef et al. 2013). If
the two systems are combined, anaerobic and aerobic processes can generate lesser amounts of
sludge and the overall cost of waste treatment can be considerably reduced.
Combined systems offer the capability of coupling the benefits of anaerobic digestion (i.e.
biogas production) with the benefit of aerobic treatment (i.e. better removal of organics), while
overcoming the disadvantages of the separate individual systems such as the long start-up and
low stability due to fast growth rate (Ergüder and Demirer 2005; Zinatizadeh et al. 2006). The
combined system can provide nutrients removal through sequential nitrogen removal with
aerobic nitrification and anaerobic denitrification. Phosphorus removal is accomplished in
sequential anaerobic-aerobic conditions (Metcalf & Eddy Inc. 2014). In addition, such
combination has been found to be able to biodegrade recalcitrant organics such as chlorinated
aromatic hydrocarbons and phenols as well as heavy metals (Chan et al. 2009; Tauseef et al.
2013).
Page 47
27
El-Kamah et al. (2010) investigated the treatment of fruit industry wastewater (COD ~ 2280 -
10,913 mg /L) using batch activated sludge (AS), two-stage upflow anaerobic sponge reactors
(UASRs), and two-stage UASR followed by AS. Findings from their study proved that the AS
system can provide effluent quality that can meet the Egyptian standards for reuse in irrigation
(COD: 80 mg/L; BOD5: 60 mg/L; TSS: 50 mg/L) at HRT of 30 h. However, the two-stage
UASR operated at a total HRT of 13 h (removal efficiency of 61% and 70% in terms of COD
and BOD5, respectively) did not provide effluent to meet the standards. It has been indicated
that the combination of the two-stage upflow anaerobic sponge reactors (UASRs) and activated
sludge (AS) system, operated at a total of 23 h (UASRs: 13 h and AS: 10h), represents a very
promising option for the treatment of high-strength wastewater (juice industry) and reuse of
effluent for agricultural purposes. The combined system achieved removal efficiency of 97.5%,
99.2%, 94.5%, and 98.9% for COD, BOD5, TSS, and O & G, respectively. The effluent quality
of AS, two-stage UASR and combined two-stage UASR and AS is presented in Table 2.1.
Combined anaerobic-aerobic systems provided superior effluent quality in terms of COD, BOD
and TSS, when compared to the AS effluent, at less HRT. It also offers the opportunity to
remove total Kjeldahl nitrogen (TKN) and TP. Moreover, the combined system eliminates the
possibility of volatilization in the aerobic treatment when volatile organics are present in the
wastewater as the volatile compounds are degraded in the anaerobic treatment (Chan et al.
2009; Tauseef et al. 2013).
Page 48
28
Table 2.1. Effluent quality for AS, two-stage UASR and two-stage UASR and AS in
treating high-strength fruit industry wastewater*
Parameter Fruit industry AS Effluent 2-stage UASR 2-stage UASR +AS
HRT (h) NA 28 30 48 13 13 +10 13+ 12 13+ 14
COD (mg/L) 2280 -19,913 175 30 30 2033 65 50 21
BOD5 (mg/L) 1650 - 6900 38 8 8 910 16 10 10
TSS (mg/L) 118 -1534 82 36 5 69 15 5 3
TKN (mg/L) 38 - 252 - 9.1 1 1 <1
TP (mg/L) 4.6 - 20.8 - 28.4 6 5.5 5
*Data adopted from El-Kamah et al. (2010)
The benefits of the anaerobic-aerobic process have been highlighted by Chan et al. (2009)
and Tauseef et al. (2013) as follows:
➢ Great potential of resource recovery; the organic pollutants are removed in the
anaerobic pretreatment and converted into a renewable energy source, biogas.
➢ High overall treatment efficiency; aerobic post-treatment “polishes” the anaerobic
effluent and results in excellent overall treatment efficiency.
➢ Less disposal of sludge; when excessive aerobic sludge is digested anaerobically, a
minimum total sludge is produced reducing the sludge disposal cost.
➢ Low energy consumption; anaerobic pretreatment serves as an influent equalization
tank, reducing diurnal variations of the oxygen demand and resulting in a further
reduction of the required aeration capacity.
Page 49
29
➢ Minimum volatilization in the aerobic treatment; when volatile organics are present in
the wastewater, the volatile compound is degraded in the anaerobic treatment, removing
the possibility of volatilization in the aerobic treatment.
From the foregoing, it is operationally and economically advantageous to employ coupled
anaerobic-aerobic processes in the treatment of high-strength industrial wastewaters. However,
to meet the strict constraints with respect to space, odor, view, and bio-solids production,
integrated bioreactors combining the anaerobic and aerobic processes in a single reactor
appears as a viable alternative.
2.4.3 Integrated anaerobic-aerobic treatment systems.
Recently, attempts have been made to integrate anaerobic and aerobic system in a single reactor
to provide a compact technology. A study conducted by (Moosavi et al. 2005) investigated the
feasibility of developing an integrated anaerobic-aerobic fixed bed combined bioreactor
(UA/AFB) to treat high-strength wastewaters employing a bench scale upflow fixed bed
reactor, filled with PVC rings as media. The reactor consisted of a lower anaerobic part and an
upper aerobic part. Synthetic wastewater was used with variable COD ranging from 365 to
3500 mg/L at the same total HRT of 9 h (5 h as anaerobic and 4 h as aerobic), corresponding
to OLR range of 0.8 to 7.6 kg COD/m3.day. The results indicated that COD removal efficiency
in the anaerobic section dropped from 67% to 27% at OLR of 0.8 and 7.6 kg COD/m3.day,
respectively. Yet this decrease was compensated with a drastic increase in the efficiency of the
aerobic zone from 37% to 85% yielding a total increase in efficiency from 95% to 98 % at OLR
of 0.8 kg COD/m3.day and 7.6 COD/m3.day, respectively. It has been shown that although
COD removal efficiency in the anaerobic part of reactor can be decreased with the increase in
OLR, the aerobic part can adjust this decrease resulting in an improvement in the total removal
efficiency up to secondary effluent standard limit with OLRs as high as 7.6 kg COD/m3.day.
Page 50
30
Another study was conducted by Chan et al. (2012) using integrated anaerobic-aerobic
bioreactor (IAAB), for palm oil mill effluent (POME) treatment (COD ~70,000 mg/L). The
reactor configuration employed three compartments; anaerobic, aerobic and settling. The first
incorporates the technology of UASFF, a hybrid anaerobic reactor of UASB portion and a fixed
film bioreactor with a gas-liquid-solid separator (GLSS). Aerobic biodegradation of the
anaerobically digested POME takes place in the second compartment of the IAAB employing
activated sludge process. The seed sludge was anaerobic sludge from anaerobic pond treating
POME and acclimatized activated sludge from SBR treating anaerobically digested POME.
The start-up and steady state condition of IAAB was accomplished in 45 days (30 days
anaerobic treatment with COD removal efficiency of at least 85%, and 15 days of aerobic
treatment). The overall removal efficiencies in steady state condition in terms of COD, BOD
and total suspended solids (TSS) were more than 99% at OLR of 10.5 g COD/L.day with biogas
production containing 64% of methane and methane yield of 0.24 L CH4/g COD removed. The
effluent quality remained stable (BOD < 70 mg/L) and complied with the discharge limit (BOD
< 100 mg/L).
Research attempts of integrating anaerobic and aerobic system in a single reactor employing
granular sludge provide a promising technology. Granular sludge characteristics provide a
compact structure and efficient design. Ergüder and Demirer (2005) investigated the possibility
of granule development from a mixture of suspended anaerobic and aerobic cultures under
alternating cyclic anaerobic-aerobic (in turn their transient micro-aerobic) conditions (via
continual 2-day schedule). The substrate used was ethanol at OLR of 500 mg/L.day. The
experimental results showed that granules (size = 0.4 - 0.58 mm) started to develop on the 16th
day of the schedule and at the 68th day, granule median diameter was 1.28 and 1.86 mm, at
oxygen doses of 60% and 120% of total COD, respectively. The granules sizes are comparable
to a typical stable size range of 1 to 2 mm (Metcalf & Eddy Inc. 2014; Show et al. 2012b).
Page 51
31
As highlighted by Ergüder and Demirer (2005), the developed granules were composed of both
anaerobic and aerobic cultures, indicated by oxygen uptake and methane production activities.
With respect to physiological characteristics, the aerobic cultures were located at the more
oxidized outer parts, while the anaerobes in the oxygen-free inner parts (shielding effect) as a
survival mechanism. It has been indicated that the coupled granules displayed superior results,
compared to those of anaerobic and aerobic granules, combining the advantages of granular
cultures along with the advantages of both anaerobic and aerobic systems. They produce
methane and at the same time use less oxygen (in total, due to the alternating conditions) which
means energy saving and lower initial and operating costs. Besides, they overcome the
drawbacks of anaerobic (need for long start-up) and aerobic (low stability due to fast growth
rates) granules. However, further investigations on the effects of substrate dose (> 500 mg
COD/L.day) on the coupled granules and on the achievement of alternating conditions need to
be performed.
Although integrated reactors show superior results compared to conventional anaerobic and
aerobic treatment methods in terms of high overall removal efficiency of COD and TSS, higher
OLR, shorter HRT, as well as minimal operational problems, little is known about their
mechanisms. The evaluation of their maximum loading capacity and scale up analysis need
further studying. Moreover, suspended and attached growth cultures have exposed their
limitations in treating high-strength wastewater. However, the design and operation of the
integrated bioreactors employing bio-granulation, especially handling high-strength organic
waste, are still in the development phase with limited data in continuous flow regime and large-
scale operation.
Since integrated anaerobic-aerobic granular systems are considered one of the most promising
wastewater treatment technologies, aerobic granulation which employs aerobic upflow sludge
Page 52
32
bioreactor has been given more attention during the recent years due to its unique advantage of
the ability to be developed in a much shorter time, compared to 2 - 8 months for anaerobic
granules (Liu and Tay 2008). However, unlike anaerobic granulation which seems
spontaneous, aerobic granules are cultivated with controlled loading and operating strategy in
a process influenced by a variety of factors, as highlighted by Show et al. (2012b) including
reactor start-up and operating conditions such as seed sludge, substrate composition, organic
loading rate, feeding strategy, reactor design and hydrodynamics, settling time, and aeration
intensity. These factors are highlighted below.
2.4.3.1 Biomass characteristics and seed cultures
The structure of the microorganisms responsible for biodegradation plays an important role in
the treatment process. Biogranules are formed by self-immobilization of microorganisms
without any medium (Beun et al. 1999; Liu and Tay 2004). These granules are dense microbial
communities containing millions of organisms per gram biomass, which individually are not
capable of completely degrading wastewaters, but complex interactions among the resident
species can achieve rapid treatment of wastewater in a smaller footprint (Liu and Tay 2002,
2004). Moreover, it has been indicated that transforming floccular sludge into dense granules
can overcome the problem of poor separation between biomass and treated effluent (Gobi et
al. 2011).
Unlike anaerobic granules, the spatial structure of aerobic granules is considered a key element
for the co-existence of aerobic and anaerobic populations(Adav et al. 2007; Ivanov et al. 2006;
Lv et al. 2014; Show et al. 2012b; Tay et al. 2002a, 2003b, 2002c). It was suggested that oxygen
consumption by aerobic bacteria predominant in the peripheral leads to a steep oxygen gradient
across the biofilm and that anaerobic bacteria in the granular sludge can survive in the core of
the granule. It is assumed that the facultative bacteria on the periphery drastically limit the
Page 53
33
diffusive penetration of O2 to prevent the O2 toxicity to the O2-sensitive methanogens located
in the inner layer of the granule (Shen and Guiot 1996).
Tartakovsky et al. (2005) reported that three bacterial populations can coexist: anaerobic
bacteria, aerobic heterotrophic bacteria, and aerobic methanotrophic. Miguez et al. (1999)
indicated that methane-oxidizing bacteria (methanotrophs) live in close association with
methane-producing microorganisms (methanogens) in aerobic-anaerobic bioreactors, where
the oxygen concentrations may not exceed 1 ppm. In addition, Muda et al. (2013) reported that
there was no inhibition on the activity of aerobic microorganisms by the long accumulation of
the byproducts produced from anaerobic degradation. It is worth mentioning that a pure
granular system is not possible. Liu et al. (2010a) suggested the concept of the sludge volume
percentage with size below 200 µm (SVP-SB200) to judge the granule-dominant reactor. When
SVP-SB200 is below 50%, the reactor is considered a granular (Liu et al. 2010b, 2011).
It has been reported that selecting slow-growing bacteria in aerobic granulations improves the
stability of the granules. Ergüder and Demirer (2005) suggested that both anaerobic and aerobic
seed should be used to develop stable, dense and compact granules in optimum period. The
aerobic cultures trigger and speed up the granulation process while the anaerobic culture seed
increase the stability of the “coupled” granules due to their slow growth. Therefore, the co-
existence of the two types of culture in granular form benefits the process.
Owing to the structure of aerobic granules that supports both aerobic and anaerobic cultures,
cultivating aerobic granules and culturing these granules in integrated anaerobic-aerobic
systems can provide a promising alternative. In most studies of aerobic granulation, granules
were cultivated with activated sludge as seed cultures (Adav et al. 2008b; Beun et al. 2002;
Chen et al. 2015; Jiang et al. 2002; Juang et al. 2010; Liu et al. 2010b; Lv et al. 2013; Mishima
and Nakamura 1991; Tay et al. 2002c; Yu et al. 2014; Zhuang et al. 2005). It has been indicated
Page 54
34
that the bacterial communities in activated sludge are most likely to be hydrophobic as the
hydrophilic bacteria would be less likely to attach to sludge (Wilén et al. 2018). The greater
the number of hydrophobic bacteria in the seed sludge the faster the aerobic granulation with
excellent settling ability (Adav et al. 2008a).
Bioagumentation was also reported in the literature, where Ivanov et al. (2006) tested the use
of bacterial cultures of Klebsiella pneumoniae strain B and Pseudomonas veronii strain F, with
self-aggregation indexes of 65 and 51%, respectively, and a coaggregation index of 58% mixed
with activated sludge as an inoculum. However, it was indicated that K. pneumoniae strain B
was not suitable for biosafety issues. In addition, the survival and the stable activity of the
introduced need to be assessed for every specific process as these strains cannot be considered
as universal strains for all cases. The nitrification, organics degradation, phosphate
accumulation and other activities of the introduced strains also need to be studied.
Drying of granules has also been investigated as the drying technique would allow convenient
storage and handling of granules for use as inoculums for rapid start-up, and as granule
supplement to enhance treatment of bioreactor systems (Show et al. 2012b). Lv et al. (2013)
indicated that the dried granules experienced volume and weight losses by over 80% with
minimum loss in structural integrity, thus further research is needed to study the impact of
drying on the properties of granules.
2.4.3.2 Reactor configuration
A column type reactor is used in developing granular systems, thus offering a compact design.
Space is often a serious concern when designing new or upgrading wastewater treatment
facilities in urban centers. Columnar reactor is anticipated to have a very small spatial footprint
(20 - 30% of conventional plant) (Arrojo 2007; de Kreuk n.d.). An important aspect of the
Page 55
35
column type upflow reactor is the height to diameter (H/D) ratio, which influences the flow
pattern of the liquid, mass transfer behavior and the microbial aggregates (Adav et al. 2008a;
Gobi et al. 2011; Liu and Tay 2004; Ni and Yu 2012). A reasonably high H/D ratio can ensure
a longer circular flow trajectory which would provide high shear force and maximize the
biological functions of granules and the mass transfer of various constituents. However, at very
high H/D ratio, the granules at the top of the reactor will face low shear stress and lose their
granular structure (Liu and Tay 2004; Ni and Yu 2012).
A wide range of H/D ratios have been used starting at around 7 - 8 (Moosavi et al. 2005;
Rastegar et al. 2011; Show et al. 2012b) up to 17 - 20 (Liu and Tay 2008; Zinatizadeh et al.
2006). The time required to transform floccular sludge to granular appears to be related to H/D
ratio as well. Abdullah et al. (2013) reported mature granules after 30 days using a reactor of
H/D ratio of 17, while Gobi et al. (2011) adopted H/D ratio of 6.67 reporting granule
appearance after 110 days. Whereas, Schwarzenbeck et al. (2004) reported the appearance of
granules after 21 weeks using a H/D ratio of 1.9.
2.4.3.3 Mode of operation
Continuous flow reactors have always been preferred as they provide lower installation costs,
easy operation, maintenance and control when compared to SBRs. However, it is worth
mentioning that aerobic granules were successfully cultivated only in SBR (Adav et al. 2008a).
Steady state continuous flow experimental results revealed that granules in a continuous-flow
reactor lose stability faster than in an SBR (Juang et al. 2011). Cultivating granules in SBR and
feeding a continuously operated aerobic reactor offers a potential to overcome this challenge
(Juang et al. 2010).
Page 56
36
2.4.3.4 Superficial air velocity
In aerobic granulation, most studies indicate that the development of granular sludge is related
to the rate of aeration applied (Chen et al. 2015, 2007; Gobi et al. 2011; Tay et al. 2001a).
Typical upflow air superficial velocity in reactor is much higher than 1.2 cm/s as it has been
shown that granules cultivated under high shear forces of 2.4 and 3.2 cm/s stabilized with clear
morphology, dense and compact structure (Ni and Yu 2012). Hydrodynamic shear force
provides a selective pressure that allows the physical selection of granular sludge with ability
to settle in short time. More compact, stable and denser granules form at relatively higher
hydrodynamic shear force. Hydrodynamic shear force can be manipulated, as a control
parameter, to enhance microbial granulation process (Beun et al. 1999; Liu and Tay 2002;
Muda et al. 2013). However, high aeration rate requires high energy consumption.
2.4.3.5 Extracellular polymeric substances (EPS)
Extracellular polymeric substances (EPS) play an important role in the build-up of the matrix
structure and the stability of granules. EPS, being sticky materials generated by bacteria, help
to initiate aerobic granulation process by bridging the bacterial cells and other particulate
matter into an aggregate (Lee et al. 2010; Liu et al. 2004). According to their physicochemical
properties, EPS can be classified into bound EPS and soluble EPS.
Wang et al. (2005) indicated that the β-linked EPS in the outer layer of granules are highly
hydrophobic and are not biodegradable. While soluble EPS are found in the core of the granule,
are five times less hydrophobic than that in the shell and could be biodegradable under
starvation or nutrient deficiency conditions. Non-soluble β-polysaccharides form the outer
shell of aerobic granules provide the strength needed under shear. On the other hand, the non-
cellular protein core in aerobic granules provided the mechanical stability of granules (Adav et
Page 57
37
al. 2008a; Show et al. 2012b). High polysaccharide content was noted to facilitate cell-to-cell
adhesion and strengthen the microbial structure through a polymeric matrix (Liu et al. 2004).
Adav et al. (2008b) found that selective enzymatic hydrolysis of proteins, lipids, and α -
polysaccharides had a minimal effect on the three-dimensional structural integrity of the
granules. Conversely, hydrolysis of β-polysaccharides caused disintegration (Adav et al.
2008b; Wang et al. 2005). The granule structure was stabilized by a network principally
composed of β-polysaccharides in the outer layer as the backbone for embedded proteins,
lipids, α-polysaccharides, and cells. Hence, enrichment of certain EPS can enhance microbial
granulation and granule stability. It has been reported that high shear force could induce
granules to secrete more cell polysaccharides leading to a balanced structure of granules under
given hydrodynamic conditions (Liu and Tay 2004; Qin et al. 2004b).
2.4.3.6 Organic loading rate (OLR)
Organic loading rate (OLR) is an important parameter in the design and operation of
wastewater treatment systems. The degree of starvation of microorganisms in biological
systems is dependent on the OLR. At a high OLR, microorganisms are subjected to fast
microbial growth, whereas at a low OLR, microorganism starvation takes place (Liu and Tay
2004).
In a granular system, the ability of granules to retain biomass makes them able to withstand
high OLRs (Adav et al. 2009a). OLRs in anaerobic processes range from 1 - 50 kg
COD/m3.day, whereas typical OLRs used for aerobic processes vary from 0.5 - 3.2 kg
COD/m3.day (Metcalf & Eddy Inc. 2014). However, aerobic granules can form across a wide
range of OLRs from 0.4 - 15 kg COD/m3.day (Ni and Yu 2012). Successful developments of
granules at OLR up to 15 kg COD/m3.day have been reported (Chen et al. 2008a; Moy et al.
Page 58
38
2002). Low OLRs, on the contrary, do not provide favorable conditions for granule
development. Abdullah et al. (2013) reported that at OLR of 1.5 kg COD/m3.day, floccular
sludge remained dominant in the reactor. Therefore, sufficiently high OLR is needed to develop
granular sludge. The selection of reasonably high OLR is critical for rapid start-up.
Tay et al. (2003a) proposed that the growth and maintenance of aerobic granules follow the
shear force balance theory, where under a superficial air velocity of 0.041 m/s and OLR of 4
kg COD/m3⋅day, a balance was reached between the aeration shear force and organic loading
rate. However, when an OLR of 8 kg COD/m3⋅day was applied, the growth rate of biomass
was high, and the aerobic granules coexisted with fluffy flocs and contained a relatively smaller
amount of EPS and its strength was rather weaker. On the other hand, the long starvation period
under an OLR of 1 triggered the production and accumulation of biomass EPS. The relatively
high EPS amount made it display a high-strength value, i.e. high capacity to resist external
shear. However, high shear force alone, such as that provided by mechanical mixing, cannot
lead to sludge granulation as high shear force compacts granule structure and erodes excess
cells and attached materials from an already formed granule (Lee et al. 2010).
2.4.3.7 Temperature
Regarding temperature, most studies on aerobic granular sludge have been conducted at room
temperature (20 - 25°C) (Ni and Yu 2012). In integrated anaerobic-aerobic reactors, successful
operation has been achieved at room temperature of 25°C (Tartakovsky et al. 2005) and at 28°C
(Chan et al. 2012).
2.4.3.8 Feed composition (substrate)
Although granulation is independent of substrate type, the type of substrate dictates the
diversity and dominance of the bacterial species, the granule surface and structure (Ni and Yu
Page 59
39
2012; Show et al. 2012b). Aerobic granulation studies have been done using synthetic
substrates like glucose, acetate, phenol, ethanol, molasses, sucrose, etc (Liu and Tay 2008;
Moosavi et al. 2005; Show et al. 2012b). It has been indicated that the acetate-grown granules
showed a very compact non-filamentous structure of rod like species dominating, as opposed
to glucose-grown granules which exhibit a filamentous structure (Ni and Yu 2012). Limited
data is available in the literature on granulation using actual wastewater. Only a few studies
have reported the use of granulation using actual wastewater (Arrojo et al. 2004; Cassidy and
Belia 2005; Liu et al. 2010b; Schwarzenbeck et al. 2004; Su and Yu 2005). It has been indicated
that, for successful biological treatment, BOD5/COD ratio should be 0.5 or greater (Chan et al.
2009). In addition, aerobic treatment requires BOD: N: P ratio of at least 100:5:1 (Chan et al.
2012).
Moreover, the presence of divalent metal ions such as calcium and magnesium in the feed is
recognized as having an important role in the self-immobilization of microbial biomass. Jiang
et al. (2003) reported that augmentation with 100 mg Ca2+/L significantly decreased the time
to cultivate aerobic granules from 32 day to 16 day and produced denser and more compact
granules with better settling and strength characteristics as well as higher polysaccharide
contents. It was suggested that calcium could contribute to the initiation and development of
aerobic granules (Qin et al. 2004a). Similarly, Li et al. (2009) found that augmentation with 10
mg/L of Mg2+ significantly decreased the sludge granulation time from 32 days to 18 days, in
SBR reactor and the produced granules had a mean diameter of 2.9 mm as opposed to 1.8mm
in granules not supplied with Mg2+. It was also indicated that Mg2+-fed granules were denser
and more compact, showed better settling and had higher polysaccharide contents, but it did
not result in a difference in microbial morphology.
Page 60
40
As excellent as biogranulation appears to be, maintaining granules of adequate structural
stability in long-term operation poses a major challenge for large-scale operations. To-date,
there has been no successful pilot- and full-scale applications documented for long-term
operations. Therefore, further research on granule stability and removal efficiency for practical
applications using high-strength wastewater is needed. The merits and demerits of biological
technologies used for high-strength wastewater treatment are presented in Table 2.2.
Page 61
41
Table 2.2. Advantages and disadvantages of biological technologies for high-strength wastewater treatment
Technology Advantages Disadvantages
Anaerobic filter Permits an adequate SRT for the methane producing
bacteria;
Biogas production;
Resistant to organic and hydraulic shock loadings;
Low operating costs;
Simplicity of construction;
Long service life;
Low sludge production;
Compact system
Filter bed clogging;
Hydraulic headloss;
Low reduction of nutrients;
Effluent and sludge require further treatment and/or
appropriate discharge;
Removing and cleaning the clogged filter media is
cumbersome;
Long start-up time
Page 62
42
Technology Advantages Disadvantages
Anaerobic fluidized
bed reactor
Very compact and require very little space;
High sludge activity;
High treatment efficiency;
No clogging of reactors;
No problems of sludge retention;
Least chance for organic shock loads and gas hold up
Long start-up time for biolayer formation on the carrier;
Difficulties due to control of biolayer thickness;
High‐energy consumption due to very high liquid
recirculation ratio
Upflow anaerobic
sludge blanket
(UASB)
Granular sludge;
Compact design;
Biogas production;
Less capital and operational costs
Limited removal of nutrients;
Does not provide complete removal of organics;
Usually requires downstream treatment for polishing to
meet effluent criteria
Membrane
bioreactor (MBR)
Compact design;
Excellent effluent quality;
Low sludge production;
Potential for simultaneous nitrification and denitrification;
Potential for energy production (anaerobic MBRs)
High operational and maintenance costs;
Need to control membrane fouling;
Limited data on membrane life
Page 63
43
Technology Advantages Disadvantages
Combined
anaerobic-aerobic
reactors
High effluent quality;
Energy production;
Less sludge production;
Potential for nutrients removal;
Less operational costs
High capital cost;
Large space requirement
Integrated
Anaerobic-aerobic
granular system
High effluent quality;
Compact design;
Less sludge production;
Biogas production;
Less capital and operational costs;
Potential for complete nutrients removal
Granule disintegration in long-term system operation;
Limited data in large-scale operation
Page 64
44
2.5 Summary
Treatment of high-strength wastewater presents a new challenge that researchers are seeking
to address. Conventional aerobic treatment systems are not suitable for treatment of high-
strength wastewaters due to the excessive demand on energy for aeration and the generation of
huge amounts of sludge that needs to be stabilized and disposed of. High rate anaerobic
digesters including provide attractive cost-effective and efficient technologies for treating high-
strength wastewater. The formation of immobilized granular sludge without any media for
attachment in UASB is considered a breakthrough eliminating the need for biocarriers, thus
overcoming filter clogging as in AF, and providing a compact design and less capital and
energy requirement compared to AFBR. However, process instabilities, long time required for
treatment, and failure to comply with stringent environmental effluent standards remain its
major limitations.
Hybrid biological systems have evolved with a strong potential for high-strength wastewater
treatment. These systems include: MBRs and combined/integrated anaerobic-aerobic systems.
MBRs provide excellent effluent quality with reduced footprint, but the major drawback of
MBR is membrane fouling which increases maintenance and operating costs. Combined
anaerobic-aerobic systems provide a cost effective and efficient treatment alternative for high-
strength wastewaters. Therefore, it is proposed that combined systems can be used for the
complete mineralization of many recalcitrant pollutants requiring sequential anaerobic, aerobic
or anoxic treatment such as persistent herbicides. Combined reactors might have possible
advantages of both anaerobic and aerobic systems such as less energy requirement for
operation, less biosolids production, lower effluent BOD values, lower initial investment cost
and quick recovery from organic shock loads.
Page 65
45
Employing granular biomass in the integrated anaerobic-aerobic system can offer a unique
advantage of compact and strong microbial population with good settling ability and high
biomass retention. Column type reactors of high H/D ratio are favored for longer circular flow
trajectory providing high shear force. High hydrodynamic shear force acts as selective pressure
ensuring that fast settling granular sludge are only maintained in the reactor and enhances mass
transfer promoting increased degradation of substrate. High shear force induces the secretion
of cell polysaccharides which play a major role in the build-up of stable granular matrix.
Although integrated anaerobic-aerobic granular systems provide a promising treatment option
for high-strength wastewaters, the design and operation of the integrated granular bioreactors
are still in the development phase with limited data in continuous flow regime and large-scale
operation. Other obstacles such as granular stability and long start-up have been highlighted.
Further research is needed on overcoming these aspects.
Page 66
46
Materials and Methods
3.1 Reactors configuration and experimental set-up
Most of the aerobic and anaerobic granules were produced in column type air or liquid upflow
reactors. According to process hydrodynamics, the air or liquid upflow pattern in column
reactors, as opposed to complete mixed tank reactors (CMTR), can create a relatively
homogenous circular flow along the reactor height, allowing microbial communities (or
aggregates) to be constantly subjected to such circular hydraulic shear. This shear force would
force the microbial aggregates to be shaped as regular granular sludge that have minimum free
surface energy. A column reactor of high ratio of reactor height to diameter (H/D) can ensure
longer circular flow trajectory, and thus creating more effective hydraulic shear forces to
microbial aggregates and enhancing the biological functions of granules and the mass transfer
of various constituents (Luo et al. 2014; Ni and Yu 2012). From a practical prospective, space
is often a serious concern when designing new or upgrading wastewater treatment facilities in
urban centers. A columnar reactor is anticipated to have a very small spatial footprint, 20 - 30%
of conventional plant (Arrojo 2007).
3.1.1 Upflow Aerobic granular sludge bioreactor.
The optimization of reactor configuration was examined to develop a semi-pilot-scale upflow
aerobic granular sludge bioreactor (UAGSBR). By controlling reactor configuration and
operation strategies, the desirable interactive pattern between flow and granules can be
achieved. Therefore, a cylindrical acrylic reactor with an internal diameter of 150 mm and a
working volume of 18 L was used as the SBR for this work. Sampling ports, each of 2.5 cm,
along the height of the reactor at 15 cm intervals for measurement of granules characteristics.
For the purpose of providing high enough shear force, aeration was provided via fine air bubble
diffusers located at the bottom of the reactor with an air flow rate of 22 - 28 L/min, which
Page 67
47
resulted in a superficial upflow air velocity of 2.4 - 2.8 cm/s. Influent was introduced at the
bottom of the reactor while effluent was discharged through an outlet port placed at
intermediate height of the reactor. The reactor cycle was operated sequentially: influent filling
(8 min.), aeration (180 - 222 min), settling (8 - 20 min), and effluent withdrawal (2 min.).
Schematic diagram of the experimental set-up is shown in Fig. 3.1. The experiments were
conducted in a room ambient temperature of 18±2 oC.
3.1.2 Upflow anaerobic granular sludge reactor.
For the anaerobic reactor, the uplow anaerobic sludge blanket (UASB) was adopted. One
cylindrical acrylic column of inner diameter of 85 mm and working volume of 5.5 L was used
in a continuous upflow regime. Sampling ports, each of 1.25 cm, are to be built along the height
of the reactor at 25 cm intervals for measurement of granules characteristics. In order to
maintain a large anaerobic sludge mass in the reactor, a gas-liquid-solid (GLS) separator was
employed to separate the three phases present in the UASB reactor, i.e., the biogas (G), the
liquid (L), and the suspended solids (S). The GLS is essentially an inverted cone attached at
the top of the reactor. The slope of the settler bottom of GLS was 45ᵒ. A gas sampling port was
provided for determination of biogas composition by using gas analyzer. The GLS separator
was connected to a water displacement system to measure the volume of the produced biogas.
Schematic diagram of the reactor design and experimental set-up is shown in Fig. 3.2.
Page 68
48
(b)
?
?
?
?
?
?
?
?
?
?1 23 4 16
7
8
9
10
11
12
13
14
1- Influent tank2- feed pump 3- control valve 4-Check valve5- Reactor6- Air compressor7-15 - Sampling ports16- Effluent
15
5
6
150 mm
??
??
??
??
?
15
00 m
m
?
150 mm
150 mm
150 mm
150 mm
150 mm
150 mm
150 mm
150 mm
150 mm
Fig. 3.1. Schematic diagram of: (a) UAGSBR dimensions; and (b) system setup
(a)
Page 69
49
?
?
?
?
?1 23 4
7
8
9
1- Influent tank2- feed pump 3- control valve 4-Check valve5- Reactor6- GLS system7 - 9- Sampling ports10- Effluent11- Gas displacement 12- Gas analyzer
5
10
11
6
12
10
00 m
m
??
??
250 mm
250 mm
250 mm
250 mm?
Fig. 3.2. Schematic diagram of: (a) UASB dimensions; and (b) system setup
(a) (b)
Page 70
50
3.2 Seed cultures
3.2.1 Aerobic reactor.
Return Activated Sludge (RAS) from Pine Creek Wastewater Treatment Plant in Calgary was
used as inoculum to start up the system and re-inoculation for augmenting the biomass with
the diversified community. The seed sludge collected throughout the operational period was
tested for seasonal variations. It was greyish brown in color and had an average suspended
solids (SS) concentration of 7.2 ± 0.8 g/L (80% volatile), sludge volume index (SVI) of 136 ±
18 mL/g, and a mean particle size of 118.6 ± 4.5 µm.
3.2.2 Anaerobic reactor.
The seed sludge for starting up the UASB was obtained from UASB reactor at Fleischmann's
Yeast, Calgary. The reactor was inoculated with 70% seed sludge having TSS concentration
of 13.9 g/L (88.8% volatile).
3.3 Media
Unlike municipal wastewater, high-strength organics wastewater is highly variable with COD
concentrations ranging from 1000 to 200,000 mg/L. Moreover, the contaminants and the
particulate matter vary significant from one industry to another because of the different
chemicals used during the main processes. The organic strength (as mg COD/L) of some
industrial wastewaters is as follows: pharmaceutical effluents 5000 - 15,000, breweries 1500 -
5000, tannery 200 - 4000, pulp 800 - 10,000 (Munter 2000; Shi 2009). In addition, the TSS
varies from 142 - 4,375 mg/L, and oil and grease (O & G) from 50 - 14,958 mg/L (Heger n.d.).
Readily biodegradable wastewaters such as dairy industry wastewaters with COD value of
2000 mg/L are deemed as low strength level (Ganesh et al. 2007), while petrochemical effluent
Page 71
51
of 1000 mg/L COD is considered high-strength level (Mutamim et al. 2012, 2013). With less
than 30% biodegradable content in pharmaceutical effluent (Shi 2009), biological treatment is
deemed challenging. Therefore, in general, the description provided by Chan et al. (2009) that
high-strength wastewater is any wastewater containing COD concentration above 4000 mg/L
was adopted (Hamza et al. 2016a; b, 2018a; b, 2019).
For the purpose of testing the impact of influential parameters such as OLR, F/M ratio, and
organics to nutrients ratio, synthetic wastewater was chosen to minimize the number of
variables in order to establish a better and clear conclusion regarding the significance of each
of these factors statistically.
3.3.1 Aerobic reactor.
The synthetic wastewater consisted of sodium acetate anhydrous (NaAc) as sole carbon source.
Nitrogen (NH4Cl) and phosphorus (K2HPO4, KH2PO4) were supplemented. The composition
of wastewater was as follows: NaAc anhydrous, 2930 mg/L; NH4Cl, 350 mg/L; K2HPO4, 30
mg/L; KH2PO4, 25 mg/L, and other necessary elements were similar to that detailed elsewhere
(Tay et al. 2002b). Other necessary elements such as CaCl2·2H2O, 15 mg/L; MgSO4·7H2O,
12.5 mg/L; and FeSO4·7H2O, 10 mg/L are to be added. A microelements solution of 1 mL/L
containing (in g/L): H3BO3, 0.05; ZnCl2, 0.05; CuCl2, 0.03; MnSO4.H2O(NH4)6, 0.05;
Mo7O24.4H2O, 0.05; AlCl3, 0.05; CoCl2.6H2O, 0.05 and NiCl2, 0.05, was used (Liu et al. 2010a;
Tay et al. 2002b). The influent wastewater was stored in storage tank at room temperature (18
± 2°C). The required COD concentration was adjusted for each stage of the experiment by
proportionally adjusting the concentration of NaAc. Nitrogen and phosphorus were
supplemented to attain the required COD:N:P ratio to meet the minimal growth requirements
and were adjusted based on the experimental design at each stage of the project.
Page 72
52
3.3.2 Anaerobic reactor.
The synthetic wastewater consisted of sodium acetate anhydrous (NaAc) and sodium
propionate (NaPr) for providing carbon sources. A stock solution was prepared according to
Table 3.1. A microelements solution, similar to that in aerobic SBR, was used. The influent
wastewater was stored in storage tank at room temperature (18 ± 2°C). The required COD
concentration was adjusted for each stage of the experiment by proportionally adjusting the
added volume of stock solution. COD:N:P ratio of 250:5:1 was maintained throughout the
UASB operation.
Table 3.1. Synthetic substrate composition of 1L stock solution of COD of 100,000 mg/L
Component Concentration (mg/L)
Sodium acetate 200
Sodium propionate 700
NH4Cl 70
KH2PO4 20
CaCl2.2H2O 15
MgCl2. 2H2O 12
FeSO4.7H2O 10
Microelements solution 2 ml
Page 73
53
3.4 Analytical methods
3.4.1 Biomass and wastewater characteristics.
The parameters and analytical methods used in this study are listed in Table 3.2. All effluent
samples were filtered using either 0.45 µm polytetrafluoroethylene (PTFE) filters from SCP
Science (Montreal, QC, Canada).
3.4.2 Granule structure and morphology observation.
Granules were taken out of the reactors during the settling phase. The granules were fixed with
2.5% glutaraldehyde in 0.1M phosphate buffer solution (pH = 7.0) and kept overnight at 4°C.
Afterwards, the granules were washed with phosphate buffered solution (PBS) three times, and
immobilized with 1% osmium tetroxide (OsO4) in distilled water for 45 min. Then OsO4 was
discarded, and the granules were washed three times with PBS. Next, the granules were
dehydrated by immersing them in ethanol solution of consecutively higher concentrations
(10%, 25%, 40%, 55%, 70%, 80%, 90% and 100%) for 45 min each, and the last step of 100%
concentration was repeated three times. Samples were then dried in a critical point dryer with
liquid CO2 (SeeVac Inc., Florida), coated with gold, and analyzed with the scanning electron
microscope (SEM) (FEI/Philips XL-30). Other pictures of granules were taken with digital
camera (iPhone 6s, Apple Inc.).
Page 74
54
Table 3.2. Analytical methods
Parameter Analytical method Sample tested
pH pH probe (YSI MultiLab 4010-3) Liquid influent and effluent
DO DO meter (YSI EcoSense ODO 200) Mixed liquor in reactor
sCOD HACH COD USEPA reactor digestion method 8000 (HR and HR
plus)
Liquid influent and effluent
Ammonia nitrogen (NH4+-N)
HACH, the salicylate method TNT Plus 830 (ULR), 831 (LR), 832
(HR), and 833 (UHR).
Liquid influent and effluent
TN, TKN, NO2 - + NO3
2- HACH TKN TNT 880. Liquid influent and effluent
PO43- , NO2
-, NO3-
Metrohm Compact IC Flex. Liquid influent and effluent
PO4 3- HACH phosphorus molybdovanadate method 8114: phosphorus
(reactive TNT reagent set, HR); phosphorus (total and reactive,
TNT 845(UHR); phosphorus (reactive, TNT 846)
Liquid influent and effluent
Page 75
55
Parameter Analytical method Sample tested
Mixed liquor suspended solids (MLSS),
mixed liquor volatile suspended solids
(MLVSS)
Standard methods 2540 D, 2540 E (APHA/WEF/AWWA 2012) Mixed liquor
Sludge volume index (SVI30), SVI5 Standard methods 2710 D; 5 min settling time was used instead of
the 30 min as described in Liu et al. (2010b)
Mixed liquor
Specific oxygen utilization rate (SOUR) Standard methods 2710 B Mixed liquor
Mean particle size and size distribution A laser particle size analysis system with a measuring range from
0 to 2000 µm (Malvern MasterSizer Series 2000, Malvern
Instruments Ltd.).
Mixed liquor
Page 76
56
3.4.3 Extracellular polymeric substances (EPS) extraction and analysis.
The protocol described by Liang et al. (2010) was adopted for the extraction of EPS. About 10
mL of the sample was centrifuged at 4 °C and 2000g for 15 min. The supernatant liquor was
collected and filtered as soluble EPS. The bottom sediments were re-suspended to 10 mL using
milliQ water, and 0.06 mL of 37% formamide was added to the suspension which was then
put in an orbital incubator (20–30 rpm) at 4 °C for 1 h. The suspension was then centrifuged
at 4 °C and 5,000g for 15 min; and, the supernatant (loosely bound EPS) was collected and
filtered. The sediments were re-suspended again to 10 mL using an extraction buffer (2 mM
Na2HPO4·12H2O, 4 mM NaH2PO4·H2O, 1 mM KCl, 9 mM NaCl, pH 7). 1M NaOH was used
to adjust the pH of the suspension to about 11 after which the suspension was then put in an
orbital incubator (20 - 30 rpm) at 4 °C for 3 h. The suspension was centrifuged at 4 °C and
10,000g for 15 min and the supernatant was collected and filtered tightly bound-EPS.
The extracted soluble EPS, loosely bound EPS, and tightly bound EPS were analyzed for
polysaccharides (PS) and proteins (PN) since they are the major components of EPS (Iorhemen
et al. 2016; Sheng et al. 2010). The phenol-sulfuric acid method with glucose as the standard
was employed to determine the PS content (Dubois et al. 1956). The modified Lowry Method
(Peterson’s Modification) was adopted for PN quantification (Peterson 1977).
3.4.4 Microbial community analysis.
Genomic DNA was extracted using a DNeasy PowerSoil Kit from QIAGEN, Inc. (MD, USA).
Paired-end sequencing based on the 16S rRNA gene was performed using the Illumina MiSeq
platform with primers 357wF (5′-CCTACGGGNGGCWGCAG-3′) and 785R (5′-
GACTACHVGGGTATCTAATCC-3′), which covered V3–V4 hypervariable regions
(Klindworth et al. 2013). Sequencing data was analyzed using R packages. Sequence trimming,
Page 77
57
quality filtering and merging were done using the DADA2 Pipeline (Callahan et al. 2016), as
well as subsequent OUT tabulation, chimera removal and taxonomy assignment with the latest
Silva taxonomic database (Silva version 132) (Callahan 2018). The Phyloseq package was used
to tabulate relative abundance at various taxonomic levels (McMurdie and Holmes 2013).
Page 78
58
Formation and Characterization of Aerobic Granules
4.1 Introduction
With the continuous industrial developments, massive quantities of high-strength organic
wastewater are produced, which could cause a major threat to human and environmental
health. The definition of high-strength organic wastewater is not clear cut and it is widely
accepted that high-strength organic wastewaters were identified as those of COD
(chemical oxygen demand) concentration greater than 4000 mg/L (Chan et al. 2009; Grady
et al. 1999; Hamza et al. 2016a). The treatment of high-strength organic wastewaters
proves challenging due to the presence of excessive amounts of organics. Moreover, high-
strength organic wastewater typically requires nutrients adjustment, and higher removal
efficiency processes to meet the constantly rising environmental standards on treated
effluents.
For many years, high-strength organic wastewaters were preferably treated in an anaerobic
reactor producing low surplus sludge, and at the same time utilizing the elevated level of
organic content for energy generation (Chan et al. 2009; Metcalf & Eddy Inc. 2014).
However, in practical applications, anaerobic treatment suffers from low growth rate of
the microorganisms, high sensitivity to toxic loadings, low temperatures, pH changes and
fluctuations in environmental conditions, a low settling rate of biomass, and the need for
post treatment of the noxious anaerobic effluent which often contains ammonium ion
(NH4+) and hydrogen sulfide (HS−) (Chan et al. 2009; Grady et al. 1999; Leitão et al. 2006;
Rajeshwari et al. 2000). Moreover, complete stabilization of high-strength organic matter
cannot be achieved anaerobically; and, this results in effluent quality that usually fails to
comply with the standards (Ahammad et al. 2013). An aerobic post-treatment is usually
Page 79
59
required to bring the water quality within regulations, depending on the desired end use
(López-Palau et al. 2012).
During the last 25 years, aerobic granulation has evolved and proved to be one of the most
efficient biological wastewater treatment technologies. Such granules are spherical
aggregates of microorganisms, without any media for attachment, offering dense and
strong microbial structure, good settling ability, high biomass retention, tolerance to
toxicity and resistance to shock loading, and can achieve rapid treatment of wastewater in
a smaller footprint, when compared to floccular sludge cultures (Abdullah et al. 2013;
Adav et al. 2008a, 2010; Beun et al. 2002; Dangcong et al. 1999; El-Kamah et al. 2010;
Etterer and Wilderer 2001; Liu et al. 2015; Liu and Tay 2004; Maszenan et al. 2011;
Mishima and Nakamura 1991; Morgenroth et al. 1997; Sarma and Tay 2018; Shin et al.
1992; Show et al. 2012b; Tay et al. 2009, 2001; Zheng et al. 2006).
Aerobic granulation offers the unique advantage of the ability to be developed in a much
shorter time, compared to 2 - 8 months for anaerobic granules (Liu and Tay 2008), and the
potential for simultaneous organics and nutrients removal (Adav et al. 2009b; Liu and Tay
2004; Show et al. 2012b; Yang et al. 2004). This was attributed to the spatial structure of
aerobic granule allowing for the co-existence of aerobic and anaerobic populations (Ivanov
et al. 2006; Lv et al. 2014; Show et al. 2012b; Tay et al. 2002a; c).
Aerobic granulation has been reported to withstand OLR up to 15 kg COD/m3.d in
sequencing batch reactors (SBRs) (Kocaturk and Erguder 2016; Moy et al. 2002; Show et
al. 2012b). With the utilization of support material such as shell carriers, granules could
withstand OLR up to 15 kg COD/m3.d (Thanh et al. 2009). In a 330-day study using
aerobic granular sludge in treating effluent from a seafood industry at OLR of 2 - 13 kg
COD/m3.d, it was reported that aerobic granules could withstand OLR only up to 4.4 kg
Page 80
60
sCOD/m3.d without disintegration (Val Del Río et al. 2013). Adav et al. (2010) reported
that aerobic granules disintegrated at OLR of 21.3 kg sCOD/m3. Long et al. (2015b)
reported that aerobic granules lost stability at OLR of 18 kg/m3.d due to the increase of
the granule size, which resulted in the formation of massive dead cells inside the core of
the granules, causing disintegration of the granular structures.
Despite the report that the formation of aerobic granules is independent of the substrate
concentration, the size of aerobic granules slightly increased with an increase in substrate
concentration, while granule strength decreased with substrate concentration (Liu et al.
2003). It was indicated that aerobic granules can withstand 5000 mg COD/L; however,
high aeration rate of 3.2 cm/s is required at OLR 15 kg/m3.d while aeration rate of 2.4
cm/s can provide stable granules up to 9 kg/m3.d OLR (Chen et al. 2008). Adav et al.
(2010) reported that the critical COD values for granule disintegration was 3,000 - 4,000
mg/L and that the tested isolates did not grow in the medium at COD > 3000 mg/L.
The long time required for granule formation and maturation, and granule disintegration
remain unresolved problems of the aerobic granulation technology (Sarma et al. 2017;
Sarma and Tay 2018). Moreover, the present available information with respect to the
favorable operational conditions is not sufficient for predictable start-up and operation of
aerobic granular sludge reactor for treatment of high-strength organic wastewater.
Therefore, this work aimed at examining aerobic granule cultivation, characteristics, and
performance for the treatment of high-strength organic wastewater, particularly nutrient-
deficient substrate. This chapter is designed to achieve the following three objectives: (1)
to evaluate the performance in terms of treatment efficiency as well as granules physical
properties and stability under high OLRs; (2) to investigate the effect of COD/N ratio on
Page 81
61
reactor performance; and (3) to examine the effect of pulse feeding and starvation
conditions on granule stability under high OLRs.
4.2 Experimental set-up and seed sludge
One cylindrical acrylic reactor, described in chapter 3, was used as the SBR to cultivate aerobic
granules. Aeration was set at an air flow rate of 28 L/min, which resulted in a superficial upflow
air velocity of 2.8 cm/s. Influent was introduced through a port located at the bottom of the
reactor while effluent was discharged through an outlet port placed at intermediate height of
the reactor resulting in a volumetric exchange ratio of 56%. The reactor was initially operated
at 4 h per cycle sequentially: influent filling (8 min.), aeration, settling, and effluent withdrawal
(2 min.). The settling time was decreased from 20 min. to 8 min. in cultivation stage (first week
of operation) with the remaining being aeration stage (210 – 222 min.). Return activated sludge
(RAS) from Pine Creek Wastewater Treatment Plant in Calgary was used as inoculum to start
up the system.
4.3 Media
The synthetic wastewater consisted of sodium acetate as sole carbon source, and the
composition of wastewater was as described in chapter 3, resulting in an initial COD
concentration of 2600 ± 450 mg/L and an OLR of 10.2 ± 2.1 kg COD/m3.d for the reactor.
After 41 days from start-up, the COD concentration was increased to 7500 ± 600 mg/L by
proportionally adjusting the concentration of NaAc to attain higher OLRs of 27.0 ± 3.5 kg
COD/m3.d. Nitrogen and phosphorus concentrations were kept constant until 60 days of
operation. From 60 days to the end of the experiment, nitrogen and phosphorus were
supplemented at a COD:N:P ratio of 100:2.5:0.3 to meet the minimal growth requirements.
Page 82
62
4.4 Formation and characteristics of granules
4.4.1 Settling property.
The granulation process from cultivation to maturation is shown in Fig. 4.1. The
settleability of sludge is indicated by the sludge volume index (SVI). In general, flocculent
sludge exhibits SVI values >120 mL/g, while granular biomass offers considerably reduced
SVI values (<50 mL/g) (Beun et al. 2002; Toh et al. 2003). The profile of SVI showed a
declining trend during the operation as shown in Fig. 4.2. After 10 days of operation,
granules started to be observed in the reactor. However, the biomass settleability fluctuated
during the first three weeks of operation. After four weeks from start-up, stable and mature
granules dominated, improving the settleability of sludge. SVI dropped to below 40
mL/gSS, and the SVI5 started approaching SVI30 (i.e., no compression settling) confirming
stable granulation in the reactor. The settling of granules in a 1L graduated cylinder (SVI
test) is shown in Fig. 4.3. It was highlighted that a granular system is practically identified
when the difference between SVI5 and SVI30 is within 10% (Liu and Tay 2008).
4.4.2 Biomass concentration.
The MLSS maintained a rising overall profile during the operation as can been seen in Fig.
4.4. The biomass concentration in the reactor fluctuated between 3,000 to 5,000 mg TSS/L
in the first 25 days of operation. It increased rapidly after the 26th day and reached a
maximum value of 25,000 mg TSS/L on the 65th day. After 70 days of operation, the
biomass concentration dropped due to the formation of flocculent sludge as a response to
the rapid biomass growth resulting from the high COD concentration. However, the strong
selection pressure imposed by the short settling time resulted in the biomass with slower
settling properties being washed out of the system. The biomass concentration stabilized
after 78 days at around 12,000 mg TSS/L until the end of the 100 days experiment.
Page 83
63
Fig. 4.1. Granulation process from cultivation to maturation at: (a) Day 0; (b) Day 9; (c) Day 20; (d) Day 27; (e) Day 32; (f) Day 44; and
(g) Day 75
(a) (b) (c) (d) (e) (f) (g)
Page 84
64
Fig. 4.2. Profiles of SVI30 and SVI30/SVI5 of the reactor
0.00
0.20
0.40
0.60
0.80
1.00
0
40
80
120
160
200
240
280
0 20 40 60 80 100
Days of Operation
SVI3
0 /
SVI5
SVI (
mL/
g SS
)
SVI SVI30/SVI5
Page 85
65
Fig. 4.3. Settling test at: (a) Day 20; (b) Day 22; (c) Day 25; (d) Day 27; and (e) Day 41
(a) (b) (c) (d) (e)
Page 86
66
Fig. 4.4. Profiles of MLSS and MLVSS/MLVSS of the reactor
0.00
0.20
0.40
0.60
0.80
1.00
0
5000
10000
15000
20000
25000
30000
0 20 40 60 80 100
Days of Operation
MLV
SS/M
LSS
MLS
S (m
g/L)
MLSS MLVSS/MLSS
Page 87
67
4.4.3 Granule size distribution.
The granule size and the particle size distribution with time is shown in Fig. 4.5. Digital camera
images of granule development are shown in Fig. 4.6. A transition from floccular sludge to
dense sludge was observed starting from the third day of operation. At day 6, granules started
to form; and, the reactor became predominantly granular after 13 days (i.e. mean size of
granules > 200 μm) with a clear and spherical outline.
At steady state, the compact granules had an average diameter in the range of ~ 952 – 1330 μm
when particle size was analysed using the MasterSizer. When the granule size increased to
more than 2000 μm, their digital camera images were analyzed for granule size using ImageJ,
an image processing program. The average diameter of granules from the ImageJ analyses was
1.9 ± 0.2 mm from 50 days until the end of the 100-day experiment.
The granulation percent can be determined following the equation 100 × (SVI30/SVI5)
(Kocaturk and Erguder 2016). After 28 days of the reactor start-up the granulation percentage
was 95 ± 2.7%. However, after 80 days of operation, the granulation percentage decreased to
about 55%. This can be attributed to the high COD concentration which stimulated rapid
bacterial growth that out-competed the aggregation process of biomass, resulting in the
coexistence of granules and dense flocs. Nevertheless, SVI5 and SVI30 were consistently below
60 and 35 mL/g, respectively from day 80 until the end of the experiment.
Page 88
68
Fig. 4.5. Profiles of granules average particle size and granulation percentage
0
20
40
60
80
100
0
0.5
1
1.5
2
2.5
0 20 40 60 80 100
Gra
nu
lati
on
(%
)
Ave
rage
par
ticl
e s
ize
(m
m)
Days of Operation
Average particle size Granulation percentage
Page 89
69
Fig. 4.6. Digital camera images of (a) seed sludge; granules at: (b) 7 days; (c) 14 days;
(d) 28 days; (e) 35 days weeks; (f) 45 days; and (g) sludge bed on the 37th day of
operation
4.4.4 Reactor performance and removal efficiencies.
The SBR was operated for 100 days where experiment was divided into two main periods
according to the applied OLR. In the first period, the applied OLR had a value of 10.2 ± 2.1 kg
COD/m3.d, which was implemented from the beginning of the experimental period until day
(c) (d)
(e) (f)
(g) (b) (a)
Page 90
70
41. In the second period (from day 42 until the end of the operational period), the applied OLR
was 27.0 ±3.5 kg COD/m3.d.
The profile of COD removal performance of the SBR throughout the entire period of operation
is depicted in Fig. 4.7. During the first 45 days of operation, the COD removal efficiency was
98.4 ±1.1%. However, after increasing the OLR, doubled at the beginning of second period,
the COD removal efficiency decreased drastically to 64.4 ± 13.7% from days 46 to 64.
Thereafter, the reactor recovered from the shock load and the removal efficiency increased to
96± 2.7% until the end of the 100 days.
The effect of COD/N ratio was investigated in this study to evaluate the feasibility of treating
high-strength organic and nitrogen-deficient wastewater using aerobic granulation. During the
cultivation phase and the first period of the study (from the beginning until day 41), nitrogen
was supplemented to ensure that there was no limitation in heterotrophic growth at a COD/N
ratio of 25 - 30. After granulation, the NH4-N removal was consistently above 92%, as shown
in Fig. 4.8. When the COD concentration increased in the second period of the experiment, the
COD/N ratio increased to over 100 (COD/N range of 70 -113), no NH4-N was detected (<
0.015 mg NH3-N/L) in the effluent while COD removal was detrimentally affected. This
indicated that under these severe nitrogen-deficient conditions, the heterotrophic growth was
limited.
Moreover, at an average OLR of 27 kg COD/m3.d combined with high COD/N ratios of 40 -
70, the granules started disintegrating into fluffy and viscous flocs. Yet no/low filamentous
organisms were detected under the microscope. When nitrogen was supplemented after day 60
to maintain a COD/N ratio of 30 - 40, the biomass showed rapid recovery in terms of COD
removal efficiency (exceeding 96%) while maintaining undetectable NH4-N levels in the
effluent until the end of the 100 days of the experiment.
Page 91
71
Fig. 4.7. Profile of COD removal
0
20
40
60
80
100
0
2000
4000
6000
8000
10000
0 20 40 60 80 100
Rem
ova
l Eff
icie
ncy
(%
)
sCO
D (
mg/
L)
Operation Days (d)
Influent COD Effluent COD Removal efficiency
Page 92
72
Fig. 4.8. Profile of ammonia removal
0
20
40
60
80
100
0
40
80
120
160
200
240
0 20 40 60 80 100
Rem
ova
l Eff
icie
ncy
(%
)
NH
3-N
(m
g/L)
Operation Days (d)
Influent NH3-N Effluent NH3-N Removal efficiency
Page 93
73
Comparable results were found by Kocaturk and Erguder (2016), where a high and stable COD
removal efficiency of 94 ± 1% and 93 ± 3% were obtained at COD/N ratios of 20 and 30,
respectively. It was demonstrated that high OLR (4 - 12 kg COD/m3.d), COD/TAN (total
ammonia nitrogen) ratios (10 - 30) and influent COD concentrations (2000 - 6000 mg/L)
favored heterotrophic bacteria growth and that the dominancy of heterotrophic bacteria
increased the biomass content in the reactor and provided resistance to ammonia inhibition. On
the other hand, it was highlighted that while the COD removal efficiency was not affected, the
structural integrity of the granules deteriorated, and the reactor had fluffy and sticky flocs at
COD/TAN ratio of 30 (Kocaturk and Erguder 2016).
The profile of phosphate removal (Fig. 4.9) showed a very similar trend to that of COD, with
phosphate being completely removed throughout the 100 days of operation, except for days 47
to 60 when OLR exceeded 30 kg COD/m3.d. As mentioned earlier, phosphorus was
supplemented to meet the need for heterotrophic growth of microorganisms. During the start-
up, COD:P ratio was 100:0.5, and after 40 days it increased to 100:0.3. Since the presence of
cations was believed to play a major role in phosphorus precipitation inside the granules during
reactor start-up, the molar ratio of cations to phosphorus at start-up was 0.57, 0.45, and 0.2 for
Ca, Mg, and Fe, respectively. These ratios are comparable to those reported by Stubbé (2016)
in full-scale reactors.
Page 94
74
Fig. 4.9. Profile of phosphate removal
0
20
40
60
80
100
0
20
40
60
80
100
120
140
0 20 40 60 80 100
Rem
ova
l Eff
icie
ncy
(%
)
PO
4-P
(m
g/L)
Operation Days (d)
Influent PO4-P Effluent PO4-P Removal efficiency
Page 95
75
4.4.5 Pollutants degradation in SBR cycle.
Reactor performance and degradation profiles of COD, NH3-N, NO3 -N, and NO2-N during an
SBR cycle was also investigated on the 40th day of operation to determine the substrate
depletion behavior. During the cycle analysis, the dissolved oxygen (DO) concentration within
the bulk was measured to identify the feast and famine phases. The test was conducted at an
influent COD concentration of 4500 mg/L, corresponding to an OLR of 13 kg COD/m3.d,
dosed under anaerobic fast feeding (8 min) strategy. From Fig. 4.10, a rapid decrease in COD
concentration was experienced following an approximate zero-order consumption rate for
external substrate. After 90 min, the COD concentration decreased by about 97% and remained
almost constant until the end of the cycle, indicating the occurrence of a famine phase.
Controversial results have been broadly reported in the literature regarding the influence of
feeding strategy and implementation of a periodic starvation time. In many granulation studies,
anaerobic feeding was adopted to ensure the consumption of easily biodegradable substrate
such as acetate by PAO (phosphate accumulating organisms) or GAO (glycogen accumulating
organisms) bacteria and its conversion to storage polymers to be used during the aerobic phase
and thus maintain a relatively low growth rate favoring the granule stability (de Kreuk and van
Loosdrecht 2004; Pronk et al. 2015a).
However, in many instances, high-strength organic wastewaters are deficient in nutrients and
require supplementing nitrogen and phosphorus to avoid limitation in heterotrophic bacterial
growth. Pulse feeding of substrate was reported in early granulation studies to be preferred over
continuous feeding as it ensures the penetration of substrate into the granule depth as opposed
to continuous feeding where substrate penetration is minimal and thus limiting the cell growth
(Beun et al. 2002).
Page 96
76
Fig. 4.10 COD and SOUR profiles during SBR cycle
0
5
10
15
20
25
30
0
400
800
1200
1600
2000
2400
0 30 60 90 120 150 180 210 240
SOU
R (
mg
O2/g
VSS
.h)
CO
D (
mg/
L)
Time (min)
COD SOUR
Page 97
77
In the absence of anaerobic feeding, alternating feast and famine conditions is believed to play
a key role in granule stability. During the feast period, the organic matter is oxidized and stored
inside bacterial cells as poly-hydroxyalkanoates (PHAs), while during the famine period, the
bacteria grow on the stored compounds. This periodic starvation has a strong effect on cell
hydrophobicity, which is a key factor on the formation of aggregates (Beun et al. 2002; López-
Palau et al. 2012; Tay et al. 2001).
From the perspective of quorum sensing, extended starvation periods stimulate the production
of EPS with large molecular weight. Short starvation period could accelerate granulation while
long starvation period was favorable to granule stability. Therefore, a combination of different
starvation periods was proposed to achieve aerobic granulation effectively, where short
starvation period could be adopted at the beginning of aerobic granulation to accelerate
formation of granules, while starvation period can be prolonged to enhance granule stability
(Liu et al. 2016a).
Di Bella and Torregrossa (2013) reported successful simultaneous organics and nitrogen
removal in a controlled feast/famine SBR operation, where a relatively large granule size (>
1.5 mm) remained stable for over 100 days of operation. Tay et al. (2001) reported a starvation
period of around 75% of the aeration period at an OLR of 6 kg/ m3.d. López-Palau et al. (2012)
stated that the optimal conditions are accomplished when the famine period lasts twice longer
than feast period. In this study, the feast condition lasted only for 37% of the duration of the
SBR cycle (starvation time of 60% of the whole aeration period).
4.4.6 Biomass activity.
The microbial activity in terms of specific oxygen uptake rate (SOUR) was determined in batch
cultures incubated at the same substrate as the feed wastewater by measuring the DO at time
Page 98
78
intervals of 5 min over a 4-hour period and calculated by dividing the oxygen consumption rate
by VSS concentration. From Fig. 4.10, the SOUR range for the SBR cycle ranged from 11 -
24 mg O2/g VSS.h. The relatively low SOUR and high DO also confirm the depletion of
substrate after 90 min of the SBR cycle.
It was illustrated that the transition from feast to famine was directly related to an increase in
the DO concentration (Beun et al. 2002; López-Palau et al. 2012). In fact, during the feast
period, the DO in the reactor was low (<75% air saturation) due to the oxygen consumption for
acetate degradation. After 90 min, when nearly all external substrate was consumed (COD
dropped from 2100 to 88 mg/L), the DO immediately increased to almost 100% air saturation
(Fig. 4.11) and the SOUR dropped to below 15 mg O2/g VSS.h (Fig. 4.10). Likewise, Chen et
al. (2008) found that at an OLR of 12 kg COD/m3.d, the maximum SOUR was around 23 mg
O2/g VSS.h, while it dropped to below 5 mg O2/g VSS.h at the end of the 240 min cycle. The
decreased bioactivity at the end of the cycle was believed to be due to the famine conditions
and that the stored substrate in the form of polymers in the feast conditions are consumed during
the famine conditions for endogenous processes only. The pH increased drastically due to the
oxidation of sodium acetate, where the pH increased from 7.0 in the influent wastewater to 8.9
at the start of aeration and reached 9.1 at the end of the cycle as shown in Fig. 4.11.
The variation of COD, ammonia nitrogen, nitrite and nitrate during an SBR cycle of an influent
COD concentration of 4500 mg/L, corresponding to an OLR of 13 kg COD/m3 and COD:N:P
ratio of 100:2.8:1 is shown in Fig. 4.12. It indicates ammonia nitrogen deficit was before COD
deficit. This indicates that nitrogen deficiency may have limited COD degradation. Moreover,
neither nitrates nor nitrites were detected, which indicates that no nitrifiers were present, and
that the ammonia nitrogen removal was due to heterotrophic assimilation. Moreover, partial
ammonia removal can be attributed to ammonia stripping due to the high pH.
Page 99
79
Fig. 4.11. DO and pH profile during SBR cycle
8.5
8.7
8.9
9.1
9.3
0
1
2
3
4
5
6
7
8
9
0 30 60 90 120 150 180 210 240
pH
DO
(m
g/L)
Time (min)
DO pH
Page 100
80
Fig. 4.12. Variation of COD, ammonia, nitrate and nitrite during SBR cycle
0
10
20
30
40
50
60
0
400
800
1200
1600
2000
2400
0 40 80 120 160 200 240
Am
mo
nia
, nit
rate
an
d n
itri
te c
on
cen
trat
ion
s (m
g/L)
CO
D c
on
cen
trat
ion
(m
g/L)
Time (min)
COD NH3-N Nitrate Nitrite
Page 101
81
4.5 Summary
This chapter discussed the formation of aerobic granules for treatment of high-strength organic
wastewater at organic loading rate (OLR) up to 30 kg/m3.d in an aerobic granular sludge
sequencing batch reactor. The reactor was operated for 100 days, divided into two main periods
according to the applied OLR. In the first period, aerobic granules were cultivated and allowed
to stabilize at an OLR of 10.2 ± 2.1 kg COD/m3.d (from the reactor start-up until day 41). In
the second period (from day 42 to day 100), the applied OLR was 27.0 ± 3.5 kg COD/m3.d.
Stressed substrate loading accelerated the formation of aerobic granules and the reactor was
granule-dominated after 2 weeks from start-up. Stable aerobic granules of average diameter of
1 - 2 mm dominated the reactor after 30 days, improving the settleability of the biomass, where
SVI decreased to below 50 mL/g and the COD removal efficiency was consistently over 98%
for over 40 days. When the applied OLR was increased to 27.0 ±3.5 kg COD/m3, the COD
removal efficiency decreased to 64.4 ± 13.7% from days 46 to 64. Thereafter, the reactor
recovered from the shock load and the removal efficiency increased to 96 ± 2.7% until the end
of the 100 days experiment, while floccular sludge started to dominate the reactor.
Findings from this study show that COD/N ratio of 25 - 30 should be attained to ensure that
there is no limitation in heterotrophic growth. Moreover, pulse feeding could be used without
affecting the stability of granules when the influent wastewater is deficient in nutrients. Under
favorable cultivation and operational conditions, aerobic granulation can provide a promising
high-strength organic wastewater treatment technology. Furthermore, it might be advantageous
in the treatment of high-strength organics to allow for the presence of dense floccular sludge
and small size granules to avoid mass transfer limitation inside the large size granule to enhance
the degradation capability and removal efficiency of the biomass. Combined strong hydraulic
selection pressure such as short cycle time and short settling time with high OLR can be
Page 102
82
considered the fastest and the simplest granulation strategy, as the washout of flocculent
biomass led to an immediate exponential growth of biomass aggregates. After successful
formation, periodic starvation can enhance granule stability and control granules size and
integrity. Further research is needed to optimize the operating conditions to achieve long-term
stable aerobic granular system with high treatment efficiency for high-strength organic
wastewaters.
Page 103
83
Granule Stability
5.1 Introduction
Recent developments have favored aerobic granular sludge (AGS) over conventional activated
sludge processes (CAS) due to the reactor compact design, outstanding settleability, the ability
of aerobic granules to withstand high organic loading rates, and the potential for simultaneous
organics and nutrients removal (Adav et al. 2008a). While many full-scale AGS applications
have been implemented for the treatment of municipal wastewater, it remains less competitive
for industrial full-scale applications, especially for high-strength organic wastewaters, when
compared to high rate anaerobic reactors such as the upflow anaerobic sludge blanket (UASB)
mainly due to the operational costs required for AGS and the mass transfer limitations at OLRs
> 5 - 7 kg/m3.day (Gao et al. 2011). However, during the last 25 years, aerobic granulation has
evolved and has proven to be one of the most efficient and well-suited biological wastewater
treatment technologies for high-strength organic wastewater.
Aerobic granualr sludge overcomes the drawbacks of anaerobic treatment processes such as
low growth rates of microorganisms, the high sensitivity to toxic loadings, low temperatures,
pH changes, fluctuations in environmental conditions, the low settling rate of biomass, and the
need for post treatment of the noxious anaerobic effluent which often contains ammonium ion
(NH4+) and hydrogen sulfide (HS−) (Chan et al. 2009; Grady et al. 1999; Leitão et al. 2006;
Rajeshwari et al. 2000). Moreover, the effluent quality in AGS can meet the discharge limits
(Ahammad et al. 2013; López-Palau et al. 2012). The rapid formation of aerobic granules
(compared to months in anaerobic granules), the good settling ability, high biomass retention,
tolerance to toxicity and resistance to shock loading, and the smaller footprint, when compared
to CAS sets AGS as a very promising technology for industrial applications for treatment high-
strength organic wastewater (Abdullah et al. 2013; Adav et al. 2010; Ivanov et al. 2006;
Page 104
84
Kocaturk and Erguder 2016; Liu et al. 2015; Long et al. 2015b; Lv et al. 2014; Moy et al. 2002;
Show et al. 2012b; Tay et al. 2002b). However, granule disintegration remains an unresolved
problem of the AGS technology (Sarma et al. 2017)
Several theories have been put forward for the formation of AGS, including: the essential role
of hydrodynamic shear force (Liu and Tay 2002), short settling time (Adav et al. 2009c; Liu
and Tay 2004), and intermittent feast-famine conditions or periodic starvation and its effect on
cell hydrophobicity (Beun et al. 2002; López-Palau et al. 2012; Tay et al. 2001). Selection for
slow growing organisms, such as phosphate or glycogen accumulating bacteria, was proposed
for maintaining granule stability (de Kreuk and van Loosdrecht 2004). Reasons behind granule
instability and disintegration were also studied and attributed to many factors such as:
proliferation of filamentous bacteria at high substrate loading rates (Liu and Liu 2006; Liu et
al. 2007; Liu and Tay 2012; Moy et al. 2002), anaerobic fermentation of dead and lysed cells
in large sized granules (Ivanov et al. 2005; Lv et al. 2014; Tay et al. 2002a; c), and destruction
in the structure of extracellular polymeric substances (EPS), with proteins (PN) playing an
essential role in granule stability (Long et al. 2015a; b)
Unlike conventional activated sludge, the absence of decisive operating parameters for a stable
and reliable operation of aerobic granular sludge reactor remains the key challenges impeding
the full-scale industrial application of granular sludge reactors. The majority of research on
AGS was conducted for a short operational period. In addition, although various theories have
been proposed for reactor instability, little emphasis was given to process optimization and the
link between the engineering aspects and the underlying fundamental microbiology.
Current knowledge of the different operating strategies focused on organic loading rate as a
critical operating parameter, where aerobic granulation has been reported to withstand OLR up
to 15 kg COD/m3.day in SBRs (Kocaturk and Erguder 2016; Moy et al. 2002; Show et al.
Page 105
85
2012b), and disintegration was reported at OLR of 21.3 kg sCOD/m3.day, at a critical COD
values for granule disintegration of 3,000 - 4,000 mg/L due to the decrease in protein
productivity by isolates under high OLR (Adav et al. 2010). Long et al. (2015b) attributed the
loss of stability of aerobic granules at OLR of 18 kg/m3.day to the increase of the granule size,
which resulted in the formation of massive dead cells inside the core of the granules, causing
disintegration of the granular structures.
Anaerobic feeding was adopted to control the size of the granules by favouring the relatively
low growth rate of the PAOs (phosphate accumulating organisms) or GAOs (glycogen
accumulating organisms) bacteria through the conversion of easily biodegradable substrate to
storage polymers to be used during the aerobic phase and thus maintain a relatively low growth
rate favoring the granule stability (de Kreuk and van Loosdrecht 2004; Pronk et al. 2015a; b).
In the absence of anaerobic feeding, alternating feast and famine conditions was believed to
play a key role in granule stability. During the feast period, the organic matter is oxidized and
stored inside bacterial cells as poly-hydroxyalkanoates (PHAs), while during the famine period,
the bacteria grow on the stored compounds. Periodic starvation with famine period lasting
twice longer than feast period was found to have a strong effect on cell hydrophobicity (López-
Palau et al. 2012) and can enhance granule stability (Liu et al. 2016a). Recent studies
highlighted the impact of F/M ratio on granule stability and established a ratio of 0.4 - 0.5
gCOD/gSS.day for achieving stable granules with good settleability, high pollutant removal
efficiency, and microbial diversity Wu et al. (2018).
Food-to-microorganisms (F/M) ratio is a key practical parameter that has been studied in CAS
processes (Jenkins et al. 2003). F/M ratio is defined as the load of substrate applied per day per
unit biomass in the reactor. F/M is usually in the range of 0.25 - 0.5 kg BOD/kg MLVSS.day
for CAS and UASB, and 0.07 - 0.15 kg BOD/kg MLVSS.day in extended aeration (Metcalf &
Page 106
86
Eddy Inc. 2014; von Sperling 2007). At high F/M ratios, the floc-forming bacteria dominate
over filamentous bacteria due to their ability to assimilate high load of substrate compared to
the filamentous bacteria (von Sperling 2007). However, high F/M ratio can result in surplus
substrate in the effluent as the biodegradable organic matter exceeds the consumption capacity
of the biomass in the system. High solids retention times (SRTs) are associated with low F/M
values, and vice versa, where an optimum SRT for good bioflocculation and low effluent
chemical oxygen demand (COD) was found to be in the range of 2 to 8 days (Rittmann et al.
1987). The procedure to control F/M ratio in CAS is by adjusting the solids concentration
through manipulating either the return activated sludge (RAS) or waste sludge, or both, in
accordance with the influent substrate load.
Most current AGS applications are in a sequential batch reactor (SBR) mode, where the
clarifier is eliminated, and a settling phase is included in the reactor operation schedule. Thus,
a RAS line is not applicable, and the reactor operation relies on the amount of biomass retained
in the reactor after decanting. Such selection mechanism determines the biomass concentration
as well as microbial species in the reactor, and thus controls the F/M ratio. Theoretically, an
infinite SRT (sludge age) can be attained. However, the washout dynamics of the biomass at
the decant level plays a decisive role on both the microbial population retained in the reactor
as well as the SRT as demonstrated by Liu et al. (2016b), where the selection pressure created
by HRT (and SRT) on aerobic granulation was negligible when compared to the selection
pressure from short settling time. Moreover, it was highlighted that the microbial population
shift was observed mainly during reactor start-up (first 6 days) due to the washed-out sludge,
which led to difference of microbial community in the reactor and effluent. While as the
experiment progressed, no apparent difference was shown between the microorganisms
retained in the reactor and those in the effluent (Liu et al. 2016b).
Page 107
87
In studying the effect of F/M ratio on AGS in SBR, it is challenging to avoid the interference
with the hydraulic selection pressure (mainly the settling velocity determined by the settling
time). Li et al. (2008b) found that, in contrast to CAS, AGS in SBR is unlikely dependent on
SRT, and that granulation was not attained at all the studied SRTs (3 - 40 days) in the absence
of a strong hydraulic selection pressure. However, the long-term system performance was not
investigated.
Furthermore, in most studies on AGS, the reactors were operated at F/M ratios comparable to
that of CAS: 0.13 to 0.29 gCOD/gSS.d (Janga et al. 2007), 0.33 gCOD/gSS.d (Tay et al. 2004),
0.2 to 0.4 gCOD/gSS.d (Jafari Kang and Yuan 2017). Li et al. (2008a) found that after
maturation, granules cultivated under different F/M ratios (0.3 - 1.0, 4.2, and 6.0 gCOD/gSS)
all stabilized at sludge loading rates of 0. 5 g COD/g SS d. Li et al. (2011) adopted a higher
F/M ratio of 1.1 gCOD/gSS.d in the early stage to stimulate rapid formation and reduced the
F/M ratio to 0.3 gCOD/gSS.d in the later stage to sustain small and healthy granules. Wu et al.
(2018) revealed that stable granules with good settleability, high pollutant removal efficiency,
and microbial diversity were achieved when F/M ratio was controlled, through quantitative
sludge discharge, at 0.4 – 0.5 gCOD/gSS.d (0.4 ± 0.02 gCOD/gSS.d). However, the stability
boundaries of F/M ratio in AGS are still not clear. The long-term impact of F/M on the
dynamics of the microbial population in an AGS reactor and process performance is yet to be
investigated. Studies on the microbial community composition and dynamics in AGS under
different operational conditions and wastewater compositions do not give clear conclusions on
the role of the different microbial groups on granule stability and process performance (Wilén
et al. 2018).
This chapter aimed at determining the impact of F/M ratio on the long-term stability of aerobic
granules under different operational conditions in order to establish clear stability boundaries
Page 108
88
of F/M ratio in AGS reactor treating high-strength organics wastewater. In addition,
information currently available in the literature with respect to the favorable operational
conditions, the dynamics of the microbial population in an AGS reactor and process
performance are not sufficient for predictable start-up and operation of AGS reactor for
treatment of high-strength organics wastewater. The study looked at the long-term impact of
F/M on the dynamics of the microbial population and the role of the different microbial groups
on granule stability and process performance. Four main objectives were studied in this work:
(1) determination of the impact (and the statistical significance) of F/M ratio on the settleability
of AGS, (2) investigation of the effect (and the statistical significance) of F/M ratio on the
wash-out dynamics, microbial selection and population shifts, and the relative abundance and
function of the microbial community in the reactor, (3) determination of the threshold of F/M
ratio for long-term stable operation of AGS for the treatment of high-strength organics
wastewater, (4) evaluation of the reactor performance in terms of effluent quality parameters.
5.2 Experimental set-up and seed sludge
One cylindrical acrylic reactor, described in chapter 3, was used as the SBR for the experiment.
Aeration was set at an air flow rate of 28 L/min, which resulted in a superficial upflow air
velocity of 2.8 cm/s. The reactor cycle was operated sequentially: influent filling (8 min.),
aeration (180 – 222 min), settling (8 – 20 min), and effluent withdrawal (2 min.). The influent
fill and effluent withdrawal times were kept constant throughout the experimental period. The
settling time was decreased from 20 min to 8 min in the cultivation stage (first week of
operation) with the remaining being aeration stage where changes in the cycle time during
periods II and III was due to extending the aeration period. RAS from Pine Creek Wastewater
Treatment Plant in Calgary was used as inoculum to start up the system and re-inoculation for
augmenting the biomass with the diversified community.
Page 109
89
5.3 Media and experimental campaign
The synthetic wastewater consisted of sodium acetate anhydrous as sole carbon source.
Nitrogen (NH4Cl) and phosphorus (K2HPO4, KH2PO4) were supplemented, and other
necessary elements as detailed in chapter 3. The experimental campaign followed five main
operational periods as follows:
• Period I (days 1 - 30): reactor start-up, granules cultivation and maturation were achieved.
• Period II (days 34 - 105): influent COD concentration was increased up to ~ 7500 mg/L,
with adjustments in HRT and COD/N ratios based on residual COD, and NH3-N
concentrations.
• Period III (days 106 - 217): applied COD concentration (and OLR) was reduced, and
COD:N:P ratio was adjusted based on results from period II.
• Period IV (days 225 - 247): influent COD concentration was further reduced to medium-
strength organics wastewater conditions (~ 2000 mg/L) for preparation for Period V.
• Period V (days 248 - 316): reactor was operated under alternate loading conditions at
different COD:N:P ratios, where variable influent COD concentration followed a daily
schedule of 2 cycles at ~ 5000 mg/L; 2 cycles at ~ 3750 mg/L, and 2 cycles at ~ 2500
mg/L.
Adjustments to influent nitrogen and phosphorus concentrations were implemented throughout
the experimental campaign to ensure that nutrients were supplemented to meet the minimal
growth requirements. HRT was elongated during period II (from 6 hours to 6.7 hours) and III
(further to 8 hours) to ensure complete degradation of COD concentration, and the achievement
of periodic starvation (Hamza et al. 2018a). Detailed operational parameters of the reactor are
shown in Table 5.1.
Page 110
90
Table 5.1. Summary of reactor operational parameters
Period Operational days Influent COD concentration (g/L) OLR (g/L.d) HRT (h) COD: N: P
I Days 1 - 30 2.42 ± 0.19 9.2 ± 1.2 6.0 100: 4: 0.3
II
Days 34 - 41 3.43 ± 0.17 13.6 ± 0.7 6.0 100: 2: 0.3
Days 43 - 58
7.43 ± 0.62 27.0 ± 3.5
6.0 100: 1: 0.3
Days 60 - 105 6.7 100: 2: 0.3
III
Days 106 - 165
4.50 ± 0.25 13.6 ± 0.8 8.0
100: 3: 0.4
Days 168 - 217 100: 4: 0.4
IV Days 225 - 247 2.12 ± 0.31 6.4 ± 0.9 8.0 100: 4: 0.3
V
Days 248 - 273
5.10 ± 0.70 11.1 ± 1.5 8.0
100: 3: 0.5
Days 274 - 283 100: 4: 0.5
Days 284 - 316 100: 5: 0.7
Page 111
91
F/M was controlled by regulating OLR. MLSS concentration was dependent on the applied
OLR and the biomass retained in the reactor (i.e. no sludge discharge was implemented).
Sludge settling properties was chosen as the control parameter, where the duration of each
experimental phase was determined based on biomass settling properties, as expressed in both
SVI30 and granulation percent, expressed as SVI30/SVI5. During period I – cultivation and
maturation, the goal was to achieve SVI30 < 50 mL/g and granulation percent SVI30/SVI5 >
90% to ensure excellent granule properties for the experiment. During the next phases of the
experiment, each experiment phase was ended when SVI30 increased above 100 mL/g or
SVI30/SVI5 dropped below 80%.
5.4 Effects of F/M ratio on the settleability of aerobic granules
The profiles of F/M ratio (based on sCOD) and SVI are shown in Fig. 5.1. A strong correlation
was found between F/M ratio and sludge settleability (represented in SVI) as highlighted in
Hamza et al. (2018b). During start-up (at influent COD concentration 2.42 ± 0.19 g/L) and
until day 10 of operation, the SVI showed a fluctuating trend. Afterwards, stable granules
dominated the reactor improving the sludge settleability.
After 30 days (Period I), the SVI dropped to below 50 mL/gSS. The biomass continued to
show good settling, sustaining an SVI below 40 mL/g until day 90. Subsequently, the reactor
experienced a sharp increase in F/M ratio to above 2.3 gCOD/gSS.d due to granules
disintegration coupled with washout of fluffy flocs under short settling time of 8 min (end of
Period II). On day 106, the COD concentration was decreased to around 4500 mg/L (Period
III), and the reactor biomass was augmented with seed sludge (20% v/v) to restore diversity.
Page 112
92
Fig. 5.1. F/M ratio and SVI during the operational period
0
50
100
150
200
250
300
350
0.0
1.0
2.0
3.0
4.0
5.0
0 40 80 120 160 200 240 280 320
SVI (
mL/
g)
F/M
rat
io
Days of Operation (d)
F/M ratio SVI30 SVI5
Cultivation
&
Maturation
Increasing
COD
Stressed
OLR
Moderate
COD
Alternate
loading
Page 113
93
Despite the improvement in sludge settleability along with the decrease in the F/M ratio, the
granular sludge stability was not maintained. On day 165, severe bulking was observed. The
wastewater composition was modified to maintain a COD/N ratio of 100/4 to ensure the
presence of sufficient nitrogen, and seed sludge (20% v/v) was added. However, the sludge
settleability showed fluctuations, followed by washout of biomass (MLSS dropped to around
4300 mg/L on day 217; end of Period III).
In Period IV (from days 225 - 247, the influent COD concentration was reduced to 2.12 ± 0.31
g/L, to adjust the F/M ratio and hence, improve sludge settling. In Period V, from day 248 -
316, the reactor was operated under alternating feed loading conditions, where the influent
COD concentration daily schedule was: 2 cycles at ~5000 mg/L, 2 cycles at ~3750 mg/L, and
2 cycles at ~2500 mg/L, with an average OLR of 11.1 ± 1.5 kg/m3.day. The reactor showed
stable operation at F/M ratio around 1.5 gCOD/gSS.d and SVI below 60 mL/g for the 68 days
of operation under these conditions.
A strong statistical correlation was shown between F/M ratio and the sludge settleability, where
at a two-tail test (α =0.001), the correlation is statistically significant, with Pearson’s correlation
coefficient of 0.585, and 0.526 for SVI5, and SVI30, respectively. According to the statistical
analysis conducted using SPSS (IBM Corp.) shown in Table 5.2, there was a significant main
effect for F/M ratio on the settleability of granules (SVI30) after controlling for the effect of
COD/N and COD/P, F(50, 32) = 30.021, p = 5.1E-17 (Hamza et al. 2018b).
Curve estimation and regression model showed that an exponential relationship exists between
F/M ratio and biomass settleability represented in SVI. The model equation can be written as:
𝑆𝑉𝐼 = 23.259 𝑒0.5221 𝐹/𝑀
where, SVI is in mL/g and F/M is in gCOD/gSS.d.
Page 114
94
The goodness-of-the fit assessed by R-squared and the standard error of the regression (S) was
0.5 and 0.4, respectively. The regression analysis showed the significance of the model and the
coefficients at α < 0.001.
Table 5.2. Tests of between-subjects effects
Source Type III Sum of Squares df Mean Square F Sig.
Corrected Model* 145355.826a 52 2795.304 31.687 2.0E-017
Intercept 23515.945 1 23515.945 266.576 4.5E-017
COD/N 1441.991 1 1441.991 16.346 3.1E-004
COD/P 48.581 1 48.581 0.551 4.6E-001
F/M 132414.071 50 2648.281 30.021 5.1E-017
Error 2822.874 32 88.215
Total 550493.580 85
Corrected Total 148178.700 84
* Dependent Variable: SVI30
a. R Squared = 0.981 (Adjusted R Squared = 0.95)
It is worth mentioning, however, that capability of the model for prediction is diminished as
F/M ratio increases above 2, as shown in Fig. 5.2. This can be attributed to the fact that at
higher F/M ratios, the biomass is characterized by the co-existence of flocculent as well as
granular biomass due to the rapid biomass growth. Such growth over competed the ability of
biomass to aggregate (Hamza et al. 2018a). Adav et al. (2010) indicated that at a COD medium
> 3000 mg/L, most functional strains lost capability for auto-aggregation and PN or PS
productivity. Therefore, the abundance of floccular biomass over granular biomass at high F/M
shifts the settleability of the biomass towards that of suspended cultures.
Page 115
95
Fig. 5.2. Estimated curve for relationship between SVI and F/M ratio
y = 23.259e0.5221x
R² = 0.5074
0
50
100
150
200
250
0 0.5 1 1.5 2 2.5 3 3.5 4
SVI3
0 (
mL/
g)
F/M ratio (gCOD/gSS. d)
Page 116
96
From these results, it can be concluded that F/M ratio (gCOD/gSS.d) plays an important role
in the stability of AGS treating high-strength organic wastewater. To provide a flexible range
of operation, four groups of F/M ratio, based on the corresponding (actual) SVI values, were
identified:
As shown in Fig. 5.3, at F/M ratios between 0.5 and 1.0 gCOD/gSS.d, the mean SVI value was
34.8 ± 8.3 mL/g; from 1.1 - 1.4 gCOD/gSS.d, the SVI increased to 46.9 ± 17.3 mL/g, from 1.5
- 2.2 gCOD/gSS.d, the SVI further increased to 74.2 ± 23.1mL/g. At F/M >2.2 gCOD/gSS.d,
SVI showed mean value of 119.8 ± 52.8 mL/g, and the sludge settleability was affected
negatively and it was difficult to retain the biomass in the reactor.
It is worth mentioning that high variability in the SVI values, as indicated by the standard
deviation within each group, was observed with the increasing F/M ratios. At F/M ratios
between 1.5 and 2.2, the variability was over 30%, and such deviation increased to over 40%
at F/M ratios above 2.2 gCOD/gSS.d. Such variation reflects the instability in granule
settleability when subjected to this range of high sludge loading rates. Moreover, the
aggregation ability of biomass to form granules becomes diminished. Reactor failure follows
the increase of F/M ratio above 2.2 gCOD/gSS.d.
Page 117
97
Fig. 5.3. Estimated marginal means of SVI30 at different F/M ratios
*Covariates appearing in the model are evaluated at the following values:
COD/N = 31.5, COD/P = 274.8
0
20
40
60
80
100
120
140
160
Esti
mat
ed m
ean
of
SVI3
0*
(mL/
g)
0.5 - 1
1.1 - 1.4
1.5 - 2.2
>2.2
Page 118
98
5.5 Reactor performance
5.5.1 Characteristics of aerobic granules.
The biomass concentration and the percentage of volatile biomass are shown in Fig. 5.4. As
expected, the biomass growth trend followed the changes in the substrate concentration, such
that during start-up (Period I), the MLSS concentration continued to increase until 12000 mg/L,
followed by a sharp increase to about 25000 mg/L (during Period II) at day 65 (influent COD
~ 7800 mg/L). However, the granules lost their aggregation potential afterwards and the
biomass became fluffy, resulting in gradual sludge washout and decline in the MLSS
concentration to ~ 6000 mg/L on day 105 of operation (end of Period II).
During Period III, the reactor was operated at an influent COD concentration of 4500 mg/L,
(and augmented with 10% v/v with seed sludge), the MLSS concentration started to increase,
reaching 17000 mg/L on day 117. Nevertheless, it gradually declined to around 4000 mg/L on
day 165 due to severe bulking which resulted in sludge washout. From day 168 - day 225, the
MLSS concentration fluctuated between 4500 and 10,000 mg/L.
A transitioning phase (Period IV) was applied to allow the reactor to recover at a moderate
influent COD concentration of ~2000 mg/L, where the biomass concentration increased to
above 10000 mg/L on day 243. During the final phase of operation (Period V), where an
alternate feed loading was applied, the MLSS concentration stabilized around 9000 mg/L from
day 248 to the end of the operational period (day 316).
Page 119
99
Fig. 5.4. Biomass concentration during the operational period
0%
20%
40%
60%
80%
100%
0
5000
10000
15000
20000
25000
30000
0 40 80 120 160 200 240 280 320
% V
ola
tile
MLS
S (m
g/L)
Days of Operation (d)
MLSS % Volatile
Cultivation &
Maturation
Increasing COD
Stressed OLR
Moderate COD
Alternate loading
Page 120
100
The average granule size ranged between 0.2 mm and 1mm throughout the entire period of
operation, as shown in Fig. 5.5. The size of the granule and the granulation percentage
(SVI30/SVI5) followed a similar pattern in terms of stability to that of the biomass
concentration, where during Period I (i.e., the first 30 days), the granule size increased to over
0.9 mm, along with the granulation percentage of 95 ± 2.7%.
With the increase in the influent COD concentration afterwards (Period II), granulation
percentage dropped gradually until it reached 55% on day 98 due to the over growth of
microorganisms which led to the dominance of flocculent sludge. Disintegrated granules and
flocculent sludge over weighed the presence of large granules, and the average granule size
started to decline. It is worth mentioning, however, that as shown in the digital camera images
(Fig. 5.6), the large sized-granules coexisted with smaller granules that were disintegrating
during this phase.
In Period III (from days 106 to 217), the granules size showed fluctuating trend as observed in
the biomass concentration, with granulation percentage ranging from 50 - 90%. During the
transition phase (Period IV; days 225 - 247), an average granule size of ~ 1mm along with a
granulation percentage of over 70% was achieved. Period V (the alternate loading phase; days
248 - 316) experienced a severe decline at the beginning, followed by an increase in the size
of the granules to stabilize around 0.8 mm and granulation percentage of 80 - 90%.
Page 121
101
Fig. 5.5 Average diameter of granules and granulation percentage during operational period
0%
20%
40%
60%
80%
100%
0.00
0.20
0.40
0.60
0.80
1.00
1.20
0 40 80 120 160 200 240 280 320
Gra
nu
lati
on
%
Ave
rgae
par
ticl
e s
ize
(m
m)
Days of Operation (d)
Average particle size Granulation %
Cultivation
&
Maturation
Increasing
CODStressed
OLR
Moderate
COD
Alternate
loading
Page 122
102
Fig. 5.6. Digital camera images of (a) seed sludge; granules at: (b) 14 days; (c) 33 days;
(d) 45 days; (e) 55days; (f) 90 days; (g) 132 days; (h) 190 days; (i) 243days; (j) 280 days;
and (k) 312 days
Page 123
103
5.5.2 Morphology and structure of aerobic granules.
SEM images (Fig. 5.7) showed smooth, compact, and dense granules were obtained after
cultivation. Examining the granule surface showed that rod shaped bacteria covered the surface
of granules. No/little filaments were found on the surface of the granules throughout the period
of operation. However, granules on Days 80 - 102 showed some broken and disintegrated
structure, with irregularities, ravines, and peaks on the surfaces.
(a) (b)
(c) (d)
(e) (f)
Page 124
104
(g) (h)
(i) (j)
(k) (l)
(m) (n)
(o) (p)
Page 125
105
Fig. 5.7. SEM images of granules at: (a) day 33; (c) 55; (e) 80; (g) 102; (i) 132;
(k)179; (m)190; (o) 243; (q) 288; (s) 312; surface of granule at: b) day 33; (d) 55; (f) 80;
(h) 102; (j) 132; (l)179; (n)190; (p) 243; (r) 288; and (t) 312
5.5.3 Pollutants removal efficiencies.
The COD removal profile during the experiment are shown in Fig. 5.8. The COD removal
efficiency was more than 95%, except when the OLR was over 25 kg/m3.d (from day 46 to day
64), where the removal efficiency dropped to around 60%. This can be due to the substrate
diffusion limitation of the large-sized granules. The overgrowth of floccular sludge under such
high organic loading conditions out competed the ability of sludge to aggregate which slowly
led to the dominance of flocculent sludge in the reactor. The ability of the substrate to diffuse
into the small-sized and disintegrated granules enhanced the COD removal efficiency.
(q) (r)
(s) (t)
Page 126
106
Fig. 5.8. Profile of COD removal
0%
20%
40%
60%
80%
100%
0
2000
4000
6000
8000
10000
0 40 80 120 160 200 240 280 320
Re
mo
val E
ffic
ien
cy (
%)
CO
D C
on
cen
trat
ion
(m
g/L)
Days of Operation (d)
Influent COD Effluent COD Removal Efficiency
Cultivation
&
Maturation
Increasing
COD
Stressed
OLRAlternate
loading
Moderate
COD
Page 127
107
Ammonia- nitrogen was below detectable limits (0.1 mg/L) until day 165 (COD/N ratio of
100/3) as shown in Fig. 5.9. When the COD/N ratio increased to 100/4, ammonia-nitrogen
started to appear in the effluent with fluctuating amounts between 0.1 and 35 mg/L. Neither
nitrate nor nitrite was detected. These results indicate that the conventional organics to nitrogen
ratio (BOD/N; COD/N, in case of biodegradable waste) of 100/5 available in the literature
need further investigation when dealing with high-strength organics wastewater.
Similarly, phosphorus was below detectable limits at COD/P ratio up to 100/0.4. At a COD/P
ratio of 100/0.5, phosphorus started to show in the effluent (Fig. 5.10). This indicates that the
amount of phosphorus required for growth is very low compared to that agreed upon (100/1).
Further research is needed for optimizing the amount of nutrients needed for growth in the
treatment of high-strength organics wastewater, where nutrients are supplemented adding a
cost burden.
Page 128
108
Fig. 5.9. Profile of ammonia removal
0%
20%
40%
60%
80%
100%
0
50
100
150
200
250
300
0 40 80 120 160 200 240 280 320
Re
mo
val E
ffic
ien
cy (
%)
NH
3-N
Co
nce
ntr
atio
n (
mg/
L)
Days of Operation (d)
Influent NH3-N Effluent NH3-N Removal Efficiency
Cultivation
&
Maturation
Increasing
CODStressed
OLR
Moderate
COD
Alternate
loading
Page 129
109
Fig. 5.10. Profile of phosphorus removal
0%
20%
40%
60%
80%
100%
0
5
10
15
20
25
30
35
40
45
0 40 80 120 160 200 240 280 320
Re
mo
val E
ffic
ien
cy (
%)
PO
4-P
Co
nce
ntr
atio
n (
mg/
L)
Days of Operation (d)
Influent PO4-P Effluent PO4-P Removal Efficiency
Cultivation
&
Maturation
Increasing
COD
Stressed
OLR
Moderate
CODAlternate
loading
Page 130
110
5.6 Analysis of microbial community
5.6.1 Characterization of the main population shifts.
The microbial community composition of granules was analyzed and compared to that of the
seed sludge as shown in Fig. 5.11. The family Rhodocyclaceae, belonging to the
Betaproteobacteria class, showed a relative abundance in the seed sludge (9.1%). The results
after maturation of granules (day 30) showed that Rhodocyclaceae increased to 29.7%. Lv et
al. (2014) found that the family Rhodocyclaceae was enriched at granule core of sliced mature
granules, suggesting that granule formation is a deterministic process rather than a random
aggregation and disintegration mechanism.
At ~7500 mg/L COD (Day 47 - 102), the trend in Rhodocyclaceae showed a sudden decline to
7.3% on day 53, followed by a sharp increase to 58.3% on day 64, decrease to 20.5% on day
71, and further decrease to 9.1% on day 90. In addition, the decline in the relative abundance
of Rhodocyclaceae after 90 days was followed by reactor instability (granules breakdown),
coexistence of large-sized granules and flocculent biomass, rising sludge, with a general
decrease in the biomass concentration (see Fig. 5.4 and Fig. 5.5). Furthermore, it was a
precursor for reactor failure on day 102. Moreover, with the increase in COD concentration,
the granule size increased as shown in Fig. 5.6, with the development of anaerobic core and
hollow core in some of the sliced granules.
Archaea (Euryarchate) was detected at 0.02%, 0.09%, 0.4%, and 0.02% on days 53, 64, 71,
and 90, respectively. Eukayaota (Parabasalia) was also detected at 0.02% on day 90. These
Methanogens may have contributed to granule disintegration. Obligate anaerobic Bacteroides
spp. were previously detected at granule depth of 800 - 900 µm from the surface of the granule
(Tay et al. 2002a). The spatial structure of large-size granules allowed oxygen consumption by
Page 131
111
aerobic bacteria predominant in the peripheral and led to a steep oxygen gradient across the
biofilm, and thus anaerobic bacteria can survive in the core of the granule. On the other hand,
the overabundance of Rhodocyclaceae on days 175 and 183 (82% and 87%, respectively), was
associated with biomass bulking in the reactor, which resulted in washout under the operation
of short settling time. In general, the relative abundance of Rhodocyclaceae initially increased
(up to 50 - 60%) with granule formation or during reactor recovery periods followed by a
stabilization around 30 - 40% after mature and stable granules were dominating the reactor
(Fig. 5.11).
Along with Rhodocyclaceae, the family Rhodobacteraceae (26.5%) dominated the aerobic
granules on day 30, as opposed to less than 0.01% in the seed sludge. Interestingly,
Rhodobacteraceae abundance was also reported in biofilm formations in various locations in
the Mediterranean region, and the Atlantic and Pacific Oceans. The relative abundance of
Rhodobacteraceae in natural waters appears to be associated with biofilm formations,
suggesting a selection for certain types of bacteria to settle and form a biofilm (Elifantz et al.
2013). The relative abundance of Rhodobacteraceae ranged from 5% to 26% throughout the
operational period, with the most on day 30.
Flavobacteriaceae was also identified in all samples, with variable relative abundance. The
seed sludge showed the lowest percentage of 1.4%, followed by the granule samples on days
102 and 183 (4.1% and 3.8%, respectively), where major reactor washouts were observed.
Flavobacteriaceae relative abundance was from 9 - 14 % for all other samples. These results
agree with the findings by Lv et al. (2014), where in their work monitoring granule formation,
the flocculated biomass was first transited to young granules with increased abundances of
Flavobacteriaceae, Xanthomonadaceae, Rhodobacteraceae and Microbacteriaceae, then the
abundances of anaerobic strains were increased owing to the formation of anaerobic core.
Page 132
112
Fig. 5.11. Microbial community relative abundance at family level
It was reported that Rhodobacteraceae and Rhodocyclaceae play an important role in organic
matter degradation, with Rhodobacteraceae being the dominant microbes in the one-step
anaerobic process, having the ability to accumulate phosphorus during denitrification (Zheng
0
10
20
30
40
50
60
70
80
90
100
30 53 64 71 90 175 183 240 268 273 278 281 288 302 305 312
Cultivation Increasing Stressed Moderate Alternate
Maturation COD OLR COD loading
Re
lati
ve a
bu
nd
ance
of
bac
teri
a an
d a
rch
aea
fam
ilie
s (%
)
Time (days)
KD1-131 Streptococcaceae Cryomorphaceae SynergistaceaeSaccharimonadaceae Puniceicoccaceae Cloacimonadaceae Family_XIIIBarnesiellaceae Sulfurospirillaceae Marinilabiliaceae ML635J-40_aquatic_groupAcidaminococcaceae Acholeplasmataceae Victivallaceae AlteromonadaceaeCorynebacteriaceae Lachnospiraceae Rikenellaceae SpirochaetaceaeFamily_XI Prolixibacteraceae Tannerellaceae AcetobacteraceaeAeromonadaceae Microbacteriaceae Ruminococcaceae DevosiaceaeMethanocorpusculaceae Verrucomicrobiaceae Dysgonomonadaceae A0839Rhizobiaceae Weeksellaceae Bacteriovoracaceae Family_XIIChitinophagaceae Clostridiaceae_1 Arcobacteraceae PaludibacteraceaeCrocinitomicaceae Veillonellaceae SM2D12 PseudomonadaceaeMoraxellaceae NS9_marine_group A4b CaulobacteraceaeRhodanobacteraceae Erysipelotrichaceae Sphingomonadaceae CyclobacteriaceaeHyphomonadaceae Xanthomonadaceae Saprospiraceae SphingobacteriaceaeSpirosomaceae NS11-12_marine_group Bdellovibrionaceae RhodobacteraceaeFlavobacteriaceae Burkholderiaceae Rhodocyclaceae Trichomonadea_faMethanosarcinaceae
Page 133
113
et al. 2016). Rhodocyclaceae (e.g. Thauera sp.), Flavobacteriaceae (e.g. Flavobacterium sp.)
are well known denitrifiers; and, some have been reported to be capable of heterotrophic
nitrification (García 2017). Flavobacterium, located in the core of the granule, was suggested
to be an important component of mature granules by supporting granulation through the
production of EPS, performing denitrification and accumulating phosphorus (Świątczak and
Cydzik-Kwiatkowska 2018).
Bacteriovoracaceae (genus Bacteriovorax) was identified in granule samples on days 288, 302,
and 312 at 17.7%, 15.7, and 15.5, respectively. It was not detected in any other samples
including the seed sludge. Bacteriovorax is a Gram-negative, aerobic, and obligate predator of
Gram-negative bacteria (Davidov and Jurkevitch 2004). Bacterivorous ciliates reduce
dispersed bacteria and enhance flocculation in activated sludge (Madoni 2011; Pajdak-Stós et
al. 2017), yet predation organisms contribute to granule formation differently as granulation
progresses. Weber et al. (2007) indicated that during biofilm development, starting from an
activated sludge floc up to a mature granule, stalked ciliated protozoa settle on activated sludge
flocs and build tree-like colonies, which are colonized by bacteria. Subsequently, these ciliates
become completely overgrown by bacteria and die. Cell remnants of ciliates serve as a
backbone for granule formation. After maturation, compact granules become new substratum
for unstalked ciliate swarmers settling on granule surfaces. Similarly, Guimarães et al. (2017)
observed bacterial colonies growing in the EPS matrix supported by ciliate stalks.
It is interesting that the granule sample on day 288 also showed a relative abundance of the
family Arcobacteraceae (Arcobacter 14.7 %). The genera Arcobacter is fastidious gram-
negative organisms, which are characterized as the most common human enteric pathogens
causing acute bacterial diarrhoea worldwide (Moreno et al. 2003). Burkholderiaceae was also
identified in granule samples from days 243 - 288, contributing 12.7% to the total population
Page 134
114
on day 288. These taxa were recognized as the main degraders of aromatic hydrocarbons such
as Toluene in the constructed wetlands (Lünsmann et al. 2016), and was identified, along with
Rhodobacteraceae, in ecological wastewater treatment plants targeting the removal of
micropollutants (Balcom et al. 2016).
5.6.2 The role of Thauera in granule formation and stability.
The role of Thauera was investigated in this study. The genus Thauera (belonging to the family
Rhodocyclaceae; Betaproteobacteria class) is anaerobic and facultative denitrifying bacteria,
with the capability to degrade aromatic compounds anaerobically as well as perform
denitrification in anoxic environment (Shinoda et al. 2004).
The excessive production of EPS by Thauera was identified as a main cause of viscous bulking
and poor sludge dewaterability (García 2017; Jiang 2011). In this experiment, after maturation
(30 days), the genera Thauera dominated with 23.4%, as opposed to less than 0.1% in the seed.
The F/M ratio during days 30 to 40 was stable around 1.0 gCOD/gSS.d. Granule disintegration
occurred after a sharp decline in Thauera to 9.1% on day 90. Thauera sp. was found to be PS
producers for binding together the growing cells (Wan et al. 2013). Cydzik-Kwiatkowska
(2015) reported that Thauera sp. was particularly high (34.69% of OTUs) playing a crucial role
in granule formation. However, the role of PS in granule stability was minimal (Adav et al.
2010). In our experiment, under stressed influent COD concentration of ~ 4500 mg/L (during
period III; days 106 - 217), granulation was restored rapidly in the reactor with an average
granule size of 0.9 mm on day 132. However, jelly-like sludge started to appear in the reactor.
Viscous bulking was associated with Thauera dominating the reactor with 82.3%, and 87.6%
on days 175 and 183, respectively.
Page 135
115
The overabundance of Thauera was recognized as a critical point preceding changes in F/M
ratio. F/M ratio increased to 2.3 gCOD/gSS.d on day 193 after the domination of Thauera.
When the influent COD concentration was decreased to around 2000 mg/L (Period IV; from
day 225 - 247), the reactor recovered bulking, and stable granules (average size 0.8 mm)
dominated the reactor, the relative abundance of Thauera dropped to 24%.
Stable reactor was observed in a stable F/M ratio of 1.0 - 1.4 gCOD/gSS.d during that period.
Under alternate loading operation (day 248 - 316), the relative abundance of Thauera followed
an interesting trend, increasing from 26.3% on day 273, to 44.9% and 57.1% on days 278 and
281, respectively, and dropping to 23.6% on day 288. Thauera stabilized at 38 and 37.3% on
days 302, and 312, respectively. The F/M ratio ranged from 1.0 - 1.4 gCOD/gSS.d during this
stage, and stable granules of average size 0.7 - 0.8 mm dominated the reactor from days 285
until the end of the experiment on day 316. These results indicate that Thauera plays a critical
role in both granule formation and stability.
The trend in Thauera relative abundance is highly associated with EPS production in the
reactor in a similar way as chemical coagulant performs, where an optimum dose is required
for successful aggregation (flocculation) of particles. It seems that relative abundance of genera
Thauera of 25 - 35% of the total microbial population may characterize the ideal conditions
for stable granules.
5.6.3 Identification of denitrifiers, and heterotrophic nitrifiers.
Several key microbial communities with denitrifying as well as heterotrophic nitrification
abilities showed relative abundance. For example, Paracoccus was identified as the most
abundant genera in family Rhodobacteraceae on day 30, representing 25.4% of the total
microbial population. The genera Paracoccus are denifitiers with the ability to use both oxygen
Page 136
116
and nitrogenous oxides; and, they can therefore, survive in ecosystems with fluctuating aerobic
or anaerobic conditions. During aerobic conditions, the preferred electron acceptor is molecular
oxygen, and in the absence of free oxygen, the electron transfer components required for
denitrification must be induced (Baumann et al. 1996).
Corynebacterium was also identified in granule samples at 7.4%, 3.2%, 11.2%, 19.5%, and
35.3% on days 30, 53, 64, 71, and 90, respectively. García (2017) reported that enhanced
nitrogen removal was attained when the Actinobacteria Corynebacterium sp. dominated the
reactor as these genera can perform denitrification, heterotrophic nitrification and might use
nitrate as an electron acceptor for phosphate accumulation.
Acinetobacter, belonging to the family Moraxellaceae, was also identified at 14.9%, 4.4%, 3%,
and 7.9% relative abundance on days 53, 243, 288, and 312, respectively. It was shown that
Acinetobacter is responsible for heterotrophic nitrification-aerobic denitrification using
ammonia, nitrite and nitrate as substrates under low nutrient conditions (Su et al. 2015).
Moreover, it was found that Chryseobacterium sp. and Acinetobacter sp. aggregate and then
secrete PN to strengthen their aggregation, with capability to tolerate COD up to 2964 mg/L
(Adav et al. 2010).
These results indicate that the presence of heterotrophic nitrifying-aerobic denitrifying
microorganisms such as Acinetobacter, Paracoccus, and Corynebacterium could potentially
be responsible for heterotrophic nitrification in our experiment, since no nitrate or nitrite were
detected in any stages of the experiment. Such fast growing heterotrophic bacteria could be of
great interest as they can provide the advantage of simultaneous nitrification and denitrification
under aerobic conditions. In addition, it can potentially replace the conventional two-step
nitrification and denitrification under autotrophic aerobic and heterotrophic anaerobic
Page 137
117
conditions, respectively. However, the dominance of these bacteria was also associated with
bulking sludge issues (days 55 - 102).
5.6.4 The role of microbial diversity in stability.
Research on natural and engineered ecosystems indicated that maintaining diverse
communities may be essential to engineering stable ecosystems using microorganisms (Beyter
et al. 2016). Community evenness is an indicator of perturbation and stability; such that the
greater evenness, the more functionally stable microbial communities. Moreover, many
parallel metabolic and syntrophic pathways are performed by heterogeneous community rather
than by a specific population (Werner et al. 2014). Therefore, understanding the variations can
assist us in recognising critical time points for community stability and resilience, which may
be potentially modulated in synthetic microbial communities (Ehsani et al. 2018).
The seed sludge showed a highly diversified microbial community. As shown in Table 5.3, the
evenness ratio of seed sludge was 0.75, due to the high diversity. After granule cultivation,
diversity reduced as some strains disappeared due to the feed composition used which was rich
in organics and deficient in nutrients. Such conditions resulted in the dominance of
heterotrophs capable of degrading acetate-based wastewater, while other strains, typically
found in the complex municipal wastewater, vanished. Reduction of diversity with granulation
was also reported in the literature (Yang et al. 2014).
Bulking issues were also associated with the loss of diversity indicated by low evenness ratios
of 0.23, and 0.19, on days 175 and 183 under stressed influent COD concentrations (~4500
mg/L, respectively). It is worth mentioning, however, that a relatively high diversity might not
indicate a stable granular system, where disintegrated granules on days 53 - 90, showed
evenness of 0.4 - 0.69. The absence or the overabundance of key microbial populations such
Page 138
118
as Thauera needs to be considered. Such EPS secreting organisms remain crucial for building
the granular matrix.
Table 5.3. Dynamics of the reactor microbial community indexes
Sample Richness (s) Shannon's diversity index (H) Evenness Tail statistics
Seed 97 3.41 0.75 19.6
Day 30 55 2.14 0.53 6.14
Day 53 59 2.8 0.69 8.5
Day 64 63 1.6 0.40 5.8
Day 71 63 2.46 0.59 8.0
Day 90 55 2.4 0.60 7.3
Day 175 37 0.82 0.23 2.56
Day 183 21 0.57 0.19 1.52
Day 243 64 2.09 0.5 6.16
Day 268 55 2.08 0.52 5.56
Day 273 49 2.15 0.55 5.05
Day 278 56 1.67 0.41 4.45
Day 281 57 1.42 0.35 4.95
Day 288 45 2.19 0.57 4.53
Day 302 50 1.92 0.49 4.06
Day 312 43 1.94 0.52 3.85
Page 139
119
5.7 Mechanisms and perspectives
A strong correlation exists between F/M ratio and sludge settleability (Fig. 5.3). Changes in
F/M ratio, under non-controlled condition, resulted in major population shifts, which led to the
dominance of certain microbial populations contributing different functions in granule
stability. Thauera sp. was observed to play a key role in the early stages of granule formation
by acting like a coagulant bridging the bacteria. However, the overabundance of such EPS
producing bacteria, particularly PS, did not contribute to the long-term granule structural
stability. In fact, Thauera sp. showed an increase in the relative abundance during the early
formation stages (as well as reaggregation during reactor recovery periods), followed by a
decrease after maturation.
Previous research on AGS showed that EPS composition can be used as indication to granule
maturation and stability, with PN/PS ratio rather than the content of PN and PS showing a clear
correlation to stability (Lashkarizadeh 2015; Yang et al. 2014). Moreover, a strong correlation
was reported between secreted PN quantity and auto-aggregation indices of individual isolates,
while no such correlation was noted between PS quantity and auto-aggregation. The decrease
in PN productivity by isolates under high OLR indicates that the EPS structure of granules was
weak, thereby leading to granule breakdown (Adav et al. 2010).
In this regard, the PS and PN contents were examined during the last phase of the experiment
(day 248 - 316 when F/M ratio was 1.0 - 1.4). From earlier stages in the experiment, this F/M
range was the most favourable for stable operation and maintenance of microbial diversity. The
PS content was 24.7 mg/g VSS for bound EPS on day 263, with soluble PS of 13.8 mg/L, and
PN content of 11.2 mg/g VSS (PN/PS ratio of 0.4). The relative abundance of Thauera sp. was
37.7%. Mean granule size of 320.2 ± 62.7 µm (with granulation percentage ranging from 52 -
68%) was observed during days 248 - 265. The tightly bound PN content increased to 231.5
Page 140
120
mg/L at 31.8 mg/g VSS, with a PN/PS ratio of 2.3 on day 268, and a decline of Thauera sp. to
26.3%.
As granules dominated the reactor, the tightly bound PN content increased to 255.3 mg/g VSS
on day 288, with PN/PS of 13.8. Thauera sp. relative abundance declined to 23.6%. Stable
reactor performance was observed from day 288 to the end of the experiment (day 316),
characterized by an increase in the PN/PS ratio to 14.9 and 20.0 on days 302 and 312,
respectively. Thauera sp. relative abundance was 38.3% and 37.1% on days 302 and 312,
respectively. Granulation percentage stabilized around 85 - 90%, with average particle size of
786.6 ± 58.8 µm, during days 290 - 316.
It is worth mentioning that a decline in soluble PS was also observed from 13.8 to 1.6 mg/L on
day 263 to day 312, respectively. This result agrees with Yang et al. (2014) who reported that
PN/PS ratio increased from 5 to 10 as granulation increased. The three-dimensional excitation
and emission matrix (3D-EEM) fluorescence spectra of TB-EPS on day 288 (Fig. 5.12) showed
peeks with very strong intensities at regions IV (associated with soluble microbial products,
tryptophan PN like materials, and other aromatic PN) and V (humic acid-like material),
according to EEM boundaries defined in (Chen et al. 2003).
Unlike what was reported in Adav et al. (2010) regarding the limited ability of Acinetobacter
sp. to tolerate COD > 3000 mg/L, Acinetobacter sp. was also identified at 14.9%, 4.4%, 3.0%,
and 7.9% relative abundance on days 53, 243, 288, and 312, respectively, at influent COD
concentrations up to 7500 mg/L. These bacteria could have potentially contributed to granule
aggregation. However, stable granules were observed in samples with very low relative
abundance of Acinetobacter sp. (day 30, 0.4%). Moreover, the highest relative abundance of
Acinetobacter sp. appearing on day 53 (14.9%) was not sufficient to yield stable granules, as
the presence of methanogens in the granule core may have higher impact on granule
Page 141
121
disintegration.
Based on our experiments, F/M ratio was identified as a decisive parameter in granule
settleability and microbial dynamics in the reactor. We argue that a combination of various
microbial communities, with microbial diversity, and relative abundance of key microbial
populations responsible for EPS production (i.e Thauera) and are crucial to granule formation
and stability.
Fig. 5.12. 3D-EEM fluorescence spectra of aerobic granules on day 288
(1) region IV (Ex/Em = 270 - 300/310 - 380 nm, tryptophan protein like materials; soluble
microbial by-products materials)
(2) region V (Ex/Em =350 - 380/420 - 480), humic acid-like materials)
Region IV
Region V
Page 142
122
5.8 Summary
This chapter investigated the long-term stability of aerobic granular sludge treating high-
strength organic wastewater in a semi-pilot-scale sequential batch reactor (SBR). The reactor
was operated for 316 days under different operational conditions. It was found that the F/M
ratio appears to be an important parameter affecting granules formation and stability. Three
selection mechanisms were investigated: (1) cultivation and maturation at moderately high
influent COD concentration (2500 mg/L) followed by increase in influent COD concentration
to 7500 mg/L; (2) stressed cultivation and operation at high influent COD concentration of
4500 mg/L; and (3) alternate feed loading strategy (variable influent COD concentration across
the daily schedule of cycles at 50%, 75%, and 100% of the peak concentration of 5000 mg/L).
It was found that the COD concentration at cultivation affected the period required for granule
formation, where higher OLR promoted faster granule formation. However, after
maturation sludge loading rate (F/M ratio) appeared to play a decisive role in granule stability:
• Stable granules with outstanding settleability (SVI < 50 mL/g) were maintained in the
reactor at F/M ratio between 0.5 and 1.4 gCOD/gSS.d. An increase in the F/M ratio above
2.2 gCOD/gSS.d led to fluffy granules, bulking issues, and washouts.
• F/M triggered the microbial selection, community, and diversity. At high F/M
ratios, denitrifiers and heterotrophic nitrifiers dominated the reactor. It is apparent that EPS
secreting organisms (Thauera sp.) play a major role in both granule formation and long-
term granule structural integrity and stability, with an optimum range of 25 - 35% relative
abundance.
• Statistical analysis showed a significant main effect for F/M ratio on granule settleability
(represented in SVI) at α < 0.001.
Page 143
123
• An exponential equation was developed between F/M ratio and SVI, with R-squared and
the standard error of the regression (S) of 0.5 and 0.4, respectively. The regression
analysis showed the significance of the model and the coefficients at α < 0.001.
Findings of this study provide important information on the operational boundaries of F/M
ratio and its impact on granule settleability, microbial community composition, the functional
groups of microorganisms, the proportions between groups at the family and genus levels. This
study presented a practical guide towards the long-term performance and stability of aerobic
granules for the treatment of high-strength organics wastewater.
Page 144
124
Effect of Organics to Nutrients Ratio on Treatment Efficiency
6.1 Introduction
Aerobic granular sludge (AGS) has emerged as a compact and efficient biological wastewater
treatment technology offering the advantage of simultaneous organics and nutrients removal
and the ability to withstand high organic loading rates (OLRs) when compared to aerobic
suspended biomass such as activated sludge (Nancharaiah and Kiran Kumar Reddy 2018;
Show et al. 2012b; Winkler et al. 2018). Stable operation of AGS has been reported for OLR
up to 15 kg COD/m3.d in sequencing batch reactors (SBRs) (Kocaturk and Erguder 2016; Moy
et al. 2002). At OLR of 27 kg COD/m3.d, it was found that flocculent biomass overweighs
granular sludge due to the rapid growth of heterotrophs. Moreover, the amount of nutrients
needed for growth for high-strength organics wastewater (COD> 4000 mg/L) was less than
that of low-strength wastewater (Hamza et al. 2018a).
Conventionally, the COD:N:P ratio for aerobic systems was reported to be 100:5:1 to ensure
the presence of sufficient nutrients requirements for biomass growth (Ammary 2004; Metcalf
& Eddy Inc. 2014). Krishnan et al. (2008) investigated the impact of COD:N:P ratio on the
treatment of dark greywater (COD = 630 mg/L; BOD = 370 mg/L) in an aerobic SBR at
different HRT (6 - 36 h). It was found that the nutrient-deficient grey wastewater (COD:N:P
of 100:1.64:1.28 – 168:0.8:2.4) resulted in residual COD concentration of 64 mg/L at HRT of
36 h, while the nutrient-spiked dark grey water with COD:N:P ratios of 100:2.5:0.5;
100:3.5:0.75; and 100:5:1 resulted in residual COD concentrations of 25, 15, and 12 mg/L,
respectively. These results showed that marginal improvement was attained when the
wastewater was supplemented with nutrients to achieve COD:N:P ratio of 100:5:1.
Hao and Liao (2015) found that in a membrane bioreactor (MBR) treating synthetic wastewater
of glucose as carbon source (COD ~ 2500 mg/L; OLR of 2.5 gCOD/L.d), an increase in the
Page 145
125
COD:N ratio from 100:5 to 100:2.5 and 100:1.8 had a limited impact on COD removal, where
COD removal efficiency was over 98.4% regardless of the nitrogen loading. Moreover, while
a slight reduction in the MLSS concentration was observed with the increase in the COD:N
ratio, significant amount of sludge was still grown, suggesting that different microbial
communities were responsible for the biodegradation process (Hao and Liao 2015).
A recent study has shown that in an AGS reactor operated at COD concentrations of 2000 -
2500 mg/L and COD/N ratio of 25 - 30, COD removal over 98% was achieved (Hamza et al.
2018a). When the COD concentration was increased to 7500 mg/L while maintaining the same
nutrients concentration, COD/N ratio increased to over 100/1 resulting in poor COD removal
(64.4 ± 13.7%) due to deficiency of nitrogen. When nitrogen was supplemented to attain a
COD/N ratio of 30 - 40, COD removal over 96% was achieved. However, the amounts of
nutrients required at different organics concentrations were not studied.
Ammary (2004) highlighted that the nutrients requirements should take into consideration both
the COD removal efficiency and the biomass yield. In extended aeration aerobic treatment for
pulp and paper mill wastewater (average COD of 420 mg/L; BOD5 = 230 mg/L) at COD:N:P
ratio of 170:5:1.5 (100:2.9:0.9), more than 75% COD removal was achieved with observed
biomass yield of 0.31 kg VSS/kg COD degraded, suggesting a formula as follows (Eq. 6.1):
𝑪𝑶𝑫: 𝑵: 𝑷 =𝟎. 𝟒𝟏 × 𝟏𝟎𝟎
𝑬 𝒀𝒐𝒃𝒔∶ 𝟓: 𝟏 Eq. 6.1
where 0.41 is the observed yield coefficient for aerobic systems in kg VSS/kg COD removed,
E is the COD removal efficiency and Yobs is the observed yield. This formula assumed that the
nitrogen content is 12.3% of the biomass and the phosphorus content is 20% that of nitrogen.
However, up to our knowledge, the nutrients requirements for the treatment of high-strength
organics wastewaters in AGS reactor were not studied.
Page 146
126
This chapter aimed at investigating the nutrients requirements for the treatment of high-strength
organics wastewater. The study attempts to optimize the nutrients required for biological
growth and biomass synthesis in order to minimize the addition of nitrogen and phosphorus in
industrial high-strength organics wastewater deficient in nutrients.
6.2 Experimental set-up
6.2.1 Granule cultivation in SBR.
Three identical cylindrical acrylic reactors with an internal diameter of 150 mm and a working
volume of 18 L, as described in chapter 3, were used for granule cultivation in an SBR mode.
Aeration was provided via fine air bubble diffusers located at the bottom of the reactor with an
air flow rate of 28 L/min, which resulted in a superficial upflow air velocity of 2.8 cm/s.
Influent was introduced at the bottom of the reactor while effluent was discharged through an
outlet port placed at intermediate height of the reactor, resulting in a volumetric exchange ratio
(VER) of 45%. The reactors were operated at cycle schedule sequentially: influent filling (8
min.), aeration (220 min), settling (10 min), and effluent withdrawal (2 min.). The reactors
were operated at influent COD concentration of approximately 5000 mg/L at COD:N:P ratios
of 100:2.8:0.4 (R1), 100:4.4:0.5 (R2) and 100:5:0.7 (R3).
6.2.2 Batch optimization experiments.
Six identical one-liter columns were used in batch mode at different COD:N:P ratios. The
design of experiment (DOE) followed a 22 factorial design with addition of a center point
(replicated) to estimate pure error, increase power, and check curvature (Montgomery 2013).
High and low levels were selected to investigate the boundaries widely reported in the literature
with respect to nutrient-deficient industrial wastewaters (Ammary 2004; Hao and Liao 2015;
Krishnan et al. 2008; Slade et al. 2004) and to further test the effect of the lower limits for the
Page 147
127
amounts of nutrients needed for organics degradation compared to those tested in SBR
experiments. Center points were set halfway between low and high levels of the tested
variables: COD/N and COD/P. The experimental runs were conducted as shown in Table 6.1.
Table 6.1. Experimental design for batch reactors
Runs COD:N:P
Experiment variables Coded variables
COD/N ratio COD/P ratio COD/N COD/P
1 100:3:0.7 35 145 -1 -1
2 100:0.7:0.7 145 145 +1 -1
3 100:1.1:0.4 90 250 0 0
4 100:1.1:0.4 90 250 0 0
5 100:3:0.3 35 355 -1 +1
6 100:0.7:0.3 145 355 +1 +1
6.2.3 Seed sludge and Media.
Return activated sludge (RAS) from Pine Creek Wastewater Treatment Plant in Calgary was
used as inoculum to start up the SBR. Properties of seed sludge is described in chapter 3.
Batch experiments were seeded from R3 (COD:N:P ratio of 100:5:0.7) at the end of the
experimental period to avoid bias towards any of the ratios tested in the batch experimental
runs, since granules at R3 were provided with the highest amounts of nutrients. Therefore,
granules in the batch experiments would have equal chance of adapting to the batch conditions.
The batch biomass concentration was adjusted to 2642 ± 30 mg TSS/L with a mean particle
size of 732.18 µm.
The synthetic wastewater for the SBR and batch reactors consisted of sodium acetate anhydrous
Page 148
128
and sodium propionate in a molar ratio of 3:1 as carbon sources to achieve COD concentration
of 5000 mg/L. Nitrogen (NH4Cl) and phosphorus (K2HPO4, KH2PO4) were supplemented to
achieve the required N and P concentrations, and other necessary elements were similar to that
detailed elsewhere (Tay et al. 2002b). The experiment was conducted at room temperature (18
± 2°C). The reactors were operated without pH control.
6.3 Granule formation and characteristics of aerobic granules in SBRs
The detailed experimental conditions for granules cultivation, and removal efficiencies for
COD, NH3-N and PO4-P for R1, R2, and R3 are shown in Table 6.2. All the data of mature
aerobic granules were measured after the reactors had reached steady state, which was assessed
based on the variation in MLSS concentration (less than 10% in three consecutive
measurements at three days measurement interval).
Table 6.2. Detailed experimental conditions, organics and nutrients removal efficiencies
Reactor COD:N:P
Influent COD
conc. (g/L);
Removal Eff. (%)
Influent NH3-N
conc. (mg/L);
Removal Eff. (%)
Influent PO4-P
conc. (mg/L);
Removal Eff. (%)
R1 100: 2.8: 0.4
4.6 ± 0.2;
98.8 ± 0.3
135 ± 9.7;
100.0 ± 0.0
16.6 ± 1.1;
99.3 ± 1.0
R2 100: 4.4: 0.5
4.4 ± 0.2;
98.8 ± 0.6
188 ± 9.6;
91.7 ± 6.6
18.5 ± 2.0;
98.6 ± 1 .3
R3 100: 5: 0.7
4.8 ± 0.5;
98.1 ± 1.5
261 ± 11.7;
91.6 ± 7.2
31.6 ± 2.2;
94.3 ± 5.1
Page 149
129
Aerobic granules appeared in all the three reactors after approximately one week from
inoculation of RAS. The time to reach steady state was approximately 3 weeks in R1 and R2,
while R3 went through fluctuations in biomass concentration and it took approximately 35
days to stabilize. The characteristics of mature aerobic granules are shown in Table 6.3.
Table 6.3. Characteristics of aerobic granules in R1, R2, and R3 at steady state
Reactor MLSS (g/L) Avg. size (mm) SVI30 (mL/g) % Granulation (SVI30/SVI5)
R1 9.5 ± 0.13 0.77 ± 0.10 39 ± 3 71 ± 7
R2 9.4 ± 0.36 0.65 ± 0.08 65 ± 8 75 ± 7
R3 9.2 ± 0.47 0.79 ± 0.07 62 ± 2 86 ± 3
6.4 Organics and nutrients degradation in SBR cycle
The COD, NH3-N, and PO4-P degradation profiles during SBR cycles were analyzed for each
of the three reactors after granule maturation and achievement of steady-state conditions (Fig.
6.1 - Fig. 6.9). The residual COD concentration, NH3-N, and PO4-P in R1 (COD:N:P ratio of
100:2.8:0.4) was 45 mg/L, <0.1 mg/L, and 0.1mg/L (below detection limits), respectively;
whereas, in R2 (COD:N:P ratio of 100:4.4:0.5), no COD was detected in the effluent, 2.5 mg/L
NH3-N, and 0.2 mg/L PO4-P. When the COD:N:P ratio was decreased to 100:5:0.7 (R3),
residual COD, NH3-N, and PO4-P were 172 mg/L, 42 mg/L, and 3.2 mg/L, respectively.
These results indicate that the amount of nutrients needed for biomass growth does not follow
the conventional organics to nutrients ratio (BOD:N:P; COD:N:P, in case of biodegradable
waste) of 100:5:1 when dealing with high-strength organics wastewater. During the operational
period, effluent ammonia-nitrogen was below detectable limits (0.1 mg/L) at COD/N ratio of
100/3). When the COD/N ratio increased to 100/4, ammonia-nitrogen started to appear in the
effluent with fluctuating amounts between 0.1 and 35 mg/L. Nitrate and nitrite remained
Page 150
130
negligible during all the tested cycles. Similarly, phosphorus was below detectable limits at
COD/P ratio up to 100/0.4. At a COD/P ratio of 100/0.5, phosphorus started to show in the
effluent, as shown in Table 6.2, where the average PO4-P removal efficiency dropped from
over 98% in R2 to 94% in R3.
Page 151
131
Fig. 6.1. COD, NH3-N; NO3-N, and NO2-N degradation profiles in SBR cycles in R1
0
10
20
30
40
50
60
0
500
1000
1500
2000
2500
0 40 80 120 160 200
NH
3-N
, NO
3, N
O2
Co
nc.
(m
g/L)
CO
D C
on
c. (
mg/
L)
Time (min)
COD NH3-N Nitrate Nitrites
Page 152
132
Fig. 6.2. COD and PO4-P degradation profiles in SBR cycles in R1
0
2
4
6
8
0
500
1000
1500
2000
2500
0 40 80 120 160 200
PO
4-P
Co
nc.
(m
g/L)
CO
D C
on
c. (
mg/
L)
Time (min)
COD PO4
Page 153
133
Fig. 6.3. COD degradation profile and pH in SBR cycle in R1
7
7.5
8
8.5
9
9.5
0
500
1000
1500
2000
2500
0 40 80 120 160 200 240
pH
CO
D C
on
c. (
mg/
L)
Time (min)
COD pH
Page 154
134
Fig. 6.4. COD, NH3-N; NO3-N, and NO2-N degradation profiles in SBR cycle in R2
0
20
40
60
80
100
0
500
1000
1500
2000
2500
0 40 80 120 160 200 240
NH
3-N
, NO
3, N
O2
Co
nc.
(m
g/L)
CO
D C
on
c. (
mg/
L)
Time (min)
COD NH3-N Nitrate Nitrites
Page 155
135
Fig. 6.5. COD, PO4-P removal profiles in SBR cycle in R2
0
2
4
6
8
10
0
500
1000
1500
2000
2500
0 40 80 120 160 200 240
PO
4-P
Co
nc.
(m
g/L)
CO
D C
on
c. (
mg/
L)
Time (min)
COD PO4-P
Page 156
136
Fig. 6.6. COD degradation profile and pH in SBR cycle in R2
7
7.5
8
8.5
9
9.5
0
500
1000
1500
2000
2500
0 40 80 120 160 200 240
pH
CO
D C
on
c. (
mg/
L)
Time (min)
COD pH
Page 157
137
Fig. 6.7. COD, NH3-N; NO3-N, and NO2-N degradation profiles in SBR cycle in R3
0
20
40
60
80
100
120
140
0
500
1000
1500
2000
2500
0 40 80 120 160 200 240
NH
3-N
, NO
3, N
O2
Co
nc.
(m
g/L)
CO
D C
on
c. (
mg/
L)
Time (min)
COD NH3-N Nitrate Nitrites
Page 158
138
Fig. 6.8. COD, PO4-P removal profiles in SBR cycle in R3
0
2
4
6
8
10
12
14
16
18
20
0
500
1000
1500
2000
2500
0 40 80 120 160 200 240
PO
4-P
Co
nc.
(m
g/L)
CO
D C
on
c. (
mg/
L)
Time (min)
COD PO4-P
Page 159
139
Fig. 6.9. COD degradation profile and pH in SBR cycle in R3
7
7.5
8
8.5
9
9.5
0
500
1000
1500
2000
2500
0 40 80 120 160 200 240
pH
CO
D C
on
c. (
mg/
L)
Time (min)
COD pH
Page 160
140
6.5 Organics and nutrients degradation in batch experiments
As shown in Fig. 6.10, the degradation of COD showed a faster trend with the increase in
COD:N:P ratio. While the ratio of 100:0.7:0.3 yields similar removal efficiency to that of
100:1.1:0.4 after 8 hrs (98%, 99%, and 96% for COD, NH3-N, and PO4-P, respectively) as
shown in Fig. 6.10, Fig. 6.11, and Fig. 6.12. The rate of removal was faster at 100:1.1:0.4,
where after 4 hrs the COD, NH3-N, and PO4-P removal efficiencies were 95%, 99%, and 96%,
respectively as opposed to 83%, 99%, and 95% at COD:N:P of 100:0.7:0.3 (Hamza et al. 2019).
6.6 Effects of COD: nutrients ratio and HRT on the treatment efficiency in batch
experiments
In our experiments (Hamza et al. 2019), at COD:N:P ratio of 100:3:0.7, 48% of phosphorus
was removed after 30 min, with a gradual removal afterwards to reach 87% after 8 hours,
whereas at COD:N:P ratio of 100:0.7:0.7 (same phosphorus concentration), a faster removal
rate for phosphorus was achieved (84% in 30 minutes, followed by a slight release of
phosphorus to stabilize at 83% after 8 hrs). These results indicated that under deficient nitrogen
conditions, a faster precipitation of phosphorous was shown. Such interaction affected the rate
of COD removal as well, where a faster rate was achieved at COD:N: P of 100:0.7:0.7
compared to 100:3:0.7 to achieve 93% and 98% COD removal after 8 hours, respectively. This
may have been due to the bacterial tendency during nitrogen-deficient conditions to quickly
use up the organics to maintain the minimal growth. However, during nitrogen feast conditions,
the biomass may not behave as aggressive in consuming the COD. This was supported by the
increase in pH, which indicated the H+ consumption in accordance with the acetate oxidized,
where at COD:N:P of 100:0.7:0.7, the pH increased rapidly from 7.6 at time zero to 9.1 at 30
mins, whereas, the pH climbed only to 8.2 during the same time period at COD: N: P ratio of
100:3:0.7 as shown in Fig. 6.13.
Page 161
141
Fig. 6.10. COD degradation profile of batch reactors under different COD:N:P ratios
0
1000
2000
3000
4000
5000
6000
0 1 2 3 4 5 6 7 8
CO
D C
on
c. (
mg/
L)
Time (h)
100:3:0.7
100:3:0.3
100:0.7:0.7
100:0.7:0.3
100:1.1:0.4
Page 162
142
Fig. 6.11. NH3-N degradation profile of batch reactors under different COD:N:P ratios
0
20
40
60
80
100
120
140
160
0 1 2 3 4 5 6 7 8
NH
3-N
Co
nc.
(m
g/L)
Time (h)
100:3:0.7
100:3:0.3
100:0.7:0.7
100:0.7:0.3
100:1.1:0.4
Page 163
143
Fig. 6.12. PO4-P concentration profile of batch reactors under different COD:N:P ratios
0
5
10
15
20
25
30
35
40
0 1 2 3 4 5 6 7 8
PO
4-P
Co
nc.
(m
g/L)
Time (h)
100:3:0.7
100:3:0.3
100:0.7:0.7
100:0.7:0.3
100:1.1:0.4
Page 164
144
Fig. 6.13. pH profile of batch reactors under different COD:N:P ratios
7
7.5
8
8.5
9
9.5
10
0 1 2 3 4 5 6 7 8
pH
Time (h)
100:3:0.7
100:3:0.3
100:0.7:0.7
100:0.7:0.3
100:1.1:0.4
Page 165
145
A rapid removal of phosphorus was observed at COD:N:P ratio of 100:3:0.3 when compared
to the ratio of 100:0.7:0.3, where 23% P removal was shown after 30 minutes in the former,
while 74% P removal was attained in the latter after the same time period. Phosphorus
dissociation occurred after 6 hours at COD:N:P ratio of 100:3:0.3, achieving an overall P
removal of 69%. On the other hand, a steady phosphorus uptake was accomplished at COD:N:P
ratio of 100:0.7:0.3 resulting in 96% P removal after 8 hours. COD removal was very similar
at both experiments (> 98% after 8 hours). The fastest removal trend occurred at COD:N:P
ratio of 100:1.1:0.4, where 83 ± 0.02% P removal (replicated experiment) was attained after 30
minutes, achieving an overall phosphorus, nitrogen and COD removal efficiencies of 97 ±
0.02%, 100% ± 0.00%, and 98 ± 0.00%, respectively in 8 hrs.
According to the statistical analysis conducted using SPSS (IBM Corp.) shown in Table 6.4
(data shown in Table 6.5), there was a significant main effect for COD/N ratio, COD/P ratio,
HRT as well as the interaction between COD/N and COD/P as well as COD/N and HRT on
COD removal at α <0.05. On the other hand, the interaction between COD/P and HRT was not
significant. This was attributed to the main removal mechanism of phosphorus being
biologically induced precipitation, as demonstrated in SEM-EDX analysis of sliced granules
which revealed the presence of concentrated calcium clusters and considerable amounts of
phosphorus (Fig. 6.14). this was supported by the rapid removal of phosphorus during the first
30 min of aeration, accompanied by the high pH (> 8.5) suggesting precipitation (Fig. 6.13).
Biologically induced phosphorus precipitation in aerobic granular sludge was previously
reported (Carlsson et al. 1997; Mañas et al. 2011), suggesting the precipitation of phosphorus
as hydroxyl-apatite (Ca5(PO4)3(OH)) in the core of granules.
Page 166
146
Table 6.4.Test of between-subjects effects (dependent variable COD removal)
Source Type III Sum of Squares df Mean Square F Sig.
Corrected Model 22692.200a 24 945.508 945.508 .000
Intercept 136998.404 1 136998.404 136998.404 .000
COD/N 1424.200 2 712.100 712.100 7.E-007
COD/P 39.200 1 39.200 39.200 2.E-003
HRT 19540.139 4 4885.035 4885.035 4.E-009
COD/N * COD/P 64.800 1 64.800 64.800 5.E-004
COD/N * HRT 433.800 8 54.225 54.225 2.E-004
COD/P * HRT 5.300 4 1.325 1.325 0.375
COD/N * COD/P * HRT .700 4 0.175 0.175 0.942
Error 5.000 5 1.000
Total 171382.000 30
Corrected Total 22697.200 29
a. R Squared = 1.000 (Adjusted R Squared = 0.999)
Page 167
147
Table 6.5. Data for tested variable in ANOVA
COD/N COD/P HRT
(h)
COD
Removal (%)
NH3-N
Removal (%)
PO4-P
Removal (%)
35 145 0.5 18 28 48
35 145 2.0 37 31 76
35 145 4.0 59 52 83
35 145 6.0 81 68 86
35 145 8.0 93 76 87
35 355 0.5 23 30 23
35 355 2.0 43 48 66
35 355 4.0 67 55 80
35 355 6.0 88 70 77
35 355 8.0 99 88 69
90 250 0.5 35 27 84
90 250 2.0 59 75 98
90 250 4.0 95 99 96
90 250 6.0 98 100 94
90 250 8.0 98 100 95
90 250 0.5 33 25 81
90 250 2.0 60 80 97
90 250 4.0 93 100 100
90 250 6.0 99 100 97
90 250 8.0 98 100 98
145 145 0.5 32 29 84
145 145 2.0 59 94 88
145 145 4.0 83 99 77
145 145 6.0 98 100 80
145 145 8.0 98 100 83
145 355 0.5 29 33 74
145 355 2.0 58 84 96
145 355 4.0 83 99 95
145 355 6.0 98 100 94
145 355 8.0 98 100 96
Page 168
148
Element At.No. Netto Mass
[%]
Mass
Norm. [%]
Atom
[%]
abs. error
[%]
(1 sigma)
rel. error
[%]
(1 sigma)
Oxygen 8 2359 34.21 34.21 29.08 6.26 18.31
Nitrogen 7 0 0.00 0.00 0.00 0.00 10.00
Phosphorus 15 1808 2.75 2.75 1.21 0.16 5.86
Calcium 20 937 2.14 2.14 0.73 0.13 5.91
Carbon 6 7369 60.91 60.91 68.98 8.95 14.7
Sum 100.00 100.00 100.00
Fig. 6.14. (a) SEM-EDX image scan of a granule slice (b) phosphorus precipitation (c)
calcium precipitation (d) elemental composition map
(a) (b) (c)
(d)
Page 169
149
6.7 Model equations and parameters in batch experiments
As shown in Fig. 6.15, the contours of COD removal, NH3-N and PO4-P at different COD/N
and COD/P ratios appeared to be maximized at COD/N of 90 and COD/P of 250 (i.e. COD:N:P
ratio of 100:1.1:0.4). The model equation for COD degradation follows a first-order
degradation kinetics given by Mines and Lackey (2009), Eq. 6.2:
[𝐶𝑂𝐷]𝑡 = [𝐶𝑂𝐷]𝑜 𝑒−𝑘𝑡 Eq. 6.2
where [COD]t is the COD concentration at any time (t), [C]o is the initial COD concentration,
and k is the degradation rate constant. The degradation rates shown in Table 6.6, where the
highest degradation rate (0.559 mg COD/L/h) was achieved at COD:N:P ratio of 100:1.1:0.4.
Table 6.6. Linearized models Equations and parameters for COD degradation
COD:N:P Degradation rate (mg COD/L/h) R-squared
100:3:0.7 0.298 0.94
100:0.7:0.7 0.503 0.95
100:0.7:0.3 0.513 0.95
100:3:0.3 0.459 0.87
100:1.1:0.4 0.559 0.93
Page 170
150
Fig. 6.15. Contours of removal efficiencies at different COD:N and COD: P ratios after 8 hours for: (a) COD; (b) NH3-N; and (c) PO4-P
COD removal-8h
COD/N
40 60 80 100 120 140
CO
D/P
150
200
250
300
350
98
98
98
98
98
98
96
96
96
96
94
94
94
92
9290
Removal (%)
NH3-N removal -8h
COD/N
40 60 80 100 120 140
CO
D/P
150
200
250
300
350
100
100
100
100
100
88
88
88
88
96
96
96
96
96
92
92
92
92
84
84
84
84
80
80
80
80
76
76
76
72
72
72
68
68
64
64
6056
52
Removal (%)
PO4 -P removal-8h
COD/N
40 60 80 100 120 140
CO
D/P
150
200
250
300
350
94
94
92
92
92
92
92
90
90
90
90
88
88
88
86
86
86
84
84
82
82
80
80
78
78
76
74
72
96
94
94
9494
94
94
92
92
92
90
90
88
88
86
84
96
94
94
Removal (%)
(a) (b) (c)
Page 171
151
6.8 Effect of pH on the performance of aerobic granules
The pH played a major role in phosphorus precipitation. The pH increased from 7.0 - 7.2 in the
influent to 8.7 - 9.3 in the effluents of SBR and batch experiments, due to the oxidation of
sodium acetate during aeration (Fig. 6.3, Fig. 6.6, Fig. 6.9, and Fig. 6.13). The stoichiometry
for the aerobic oxidation of acetate can be as represented in Eq. 6.3 and Eq. 6.4 (Metcalf &
Eddy Inc. 2014), where the oxidation of sodium acetate in the presence of ammonia results in
the formation of bicarbonate and carbon dioxide. However, the amount of carbon dioxide is
small compared to the bicarbonate. For each mole of acetate oxidized, one mole of hydrogen
is consumed, and thus pH is increased.
0.125𝐶𝐻3𝐶𝑂𝑂− + 0.0295𝑁𝐻4+ + 0.103𝑂2
→ 0.0295𝐶5𝐻7𝑂2𝑁 + 0.0955𝐻2𝑂 + 0.0955𝐻𝐶𝑂3−
+ 0.007𝐶𝑂2
Eq. 6.3
𝐶𝐻3𝐶𝑂𝑂− + 𝐻+ + 2𝑂2 → 2𝐶𝑂2 + 2𝐻2𝑂 Eq.6. 4
The pH also controls the speciation of ammonia nitrogen in aqueous solutions, where total
ammonia nitrogen exists as either ammonium ion (NH4+) or free ammonia (NH3), according to
the following equilibrium reaction, Eq. 6.5. The increase in the pH will cause an increase in
the concentration of free ammonia.
𝑁𝐻4+ ↔ 𝑁𝐻3 + 𝐻+ Eq. 6.5
During the cycle analysis, the initial concentration of total ammonia-N at the start of the
aeration phase was 54 mg/L in R1, 84 in R2, and 128 in R3. Based on measured pH values of
8.9, 8.7, and 8.6 in R1, R2, and R3, respectively, approximately 27%, 19%, and 16% total
ammonia-N were present in free form.
Page 172
152
6.9 Nutrient requirements for bacterial growth and biomass yield and EPS production
In this work, if the observed biomass yield for heterotrophs is calculated based on the following
equations – Eq. 6.6 and Eq. 6.7 (Metcalf & Eddy Inc. 2014):
𝑩𝒊𝒐𝒎𝒂𝒔𝒔 𝒔𝒚𝒕𝒉𝒆𝒔𝒊𝒔 𝒚𝒊𝒆𝒍𝒅, 𝒀 = 𝒈 𝒃𝒊𝒐𝒎𝒂𝒔𝒔 𝒑𝒓𝒐𝒅𝒖𝒄𝒆𝒅
𝒈 𝒔𝒖𝒃𝒔𝒕𝒓𝒂𝒕𝒆 𝒄𝒐𝒏𝒔𝒖𝒎𝒆𝒅 Eq. 6.6
𝑻𝒉𝒆 𝒐𝒃𝒔𝒆𝒓𝒗𝒆𝒅 𝒚𝒊𝒆𝒍𝒅, 𝒀𝒐𝒃𝒔 = ∆𝑿𝒓 + 𝑽𝑺𝑺𝒆𝒇𝒇
∆𝑪𝑶𝑫𝒓𝒆𝒎. Eq. 6.7
Where, ∆𝑿𝒓 is the amount of VSS produced and wasted daily, VSSeff is biomass in the effluent,
and ∆𝑪𝑶𝑫𝒓𝒆𝒎. is the COD removed. And If we assume biomass formula of C5H7O2N, and all
the nitrogen are converted to biomass, we have Eq. 6.8:
∆𝑵𝒓𝒆𝒎.
∆𝑿 + 𝑽𝑺𝑺𝒆𝒇𝒇= 𝟎. 𝟏𝟐𝟑𝟗 Eq. 6. 8
Combine Eq. 6.7 and Eq. 6.8, we get:
𝒀𝒐𝒃𝒔 = 𝟖. 𝟎𝟕∆𝑵𝒓𝒆𝒎.
∆𝑪𝑶𝑫𝒓𝒆𝒎. Eq. 6.9
The observed yield for R1, R2, and R3 based on COD (Yobs-COD) was calculated using Eq. 7,
and the observed yield based on nitrogen (Yobs-N) is calculated using Eq. 6.9 (Table 6.7).
Table 6.7. Observed Yield (YObs) and EPS production per unit COD removed
Reactor COD/N YObs-COD (gVSS/gCOD rem.) YObs-N(gVSS/gN rem.) EPS/COD rem.
R1 35 0.103 0.256 0.052
R2 23 0.488 0.339 0.137
R3 20 0.499 0.358 0.168
Page 173
153
As shown in Table 6.7, at higher COD/N ratios, the observed biomass yield based on the
amount of nitrogen removed is considerably higher than that of the observed yield based on
the COD removed. This indicates that part of the nitrogen was not used for assimilation and
nitrification activity may have occurred, suggesting heterotrophic nitrification due to the
absence of autotrophic nitrifiers in the microbial community analysis (Section 6.3.8). On the
contrary, under lower COD/N ratios (R2 and R3) higher biomass yield based on COD removed
than that of nitrogen removed was observed. This indicated that all the nitrogen was used for
biomass synthesis and no nitrification activity was observed under lower COD/N ratios (Hamza
et al. 2019).
The presence of nitrogen in the effluent in R3 (COD/N = 20) indicated that the nitrogen
requirement for heterotrophic assimilation is lower than that widely accepted for cell
composition. In general, about 53% by weight, of the organic fraction is carbon. Nitrogen
constitutes 12.2% of the cell biomass, and when phosphorus is considered 2.3 g per 100 g of
cell biomass is needed. The suggested chemical formula is C60H87O23N12P, where a typical
bacterial C:N:P ratio (atomic) is 50:10:1, which is usually found in exponentially growing
bacteria (Vrede et al. 2002).
Based on the equation provided by Ammary (2004), at COD removal efficiency > 95%, and
observed yield of ~ 0.5, the COD:N:P ratio should be (41/(0.95)(0.5)):5:1 = 86:5:1. However,
based on the results of our experiments, it was shown that such high amounts of nutrients were
not needed for effective degradation of COD using AGS.
Vrede et al. (2002) found that the elemental composition of marine bacterioplankton isolates
grown in batch cultures under nutrient-limited conditions showed variable C:N:P atomic ratios.
In their experiments, C:N ratios varied between 3.6 and 12, and C:P ratios between 35 to 178,
with the lower ratios found in exponentially growing bacteria and the upper range indicated a
Page 174
154
stationary phase.
Changes in the macromolecular composition of native and cultured aquatic bacteria was
attributed to nutrient availability (Fagerbakke et al. 2006). In our experiment using AGS reactor
for treatment of high-strength organics wastewater, it is suggested that N-limited as well as P-
limited cells may have dominated. Therefore, the typical formulation, C5H7NO2 first
discovered in 1952 for biomass treating dairy substrate (Hoover and Porges 1952) remains an
approximation, and there can be significant variations from this formula at different operating
conditions, and with different wastewater sources, microbial species, and growth patterns
(Droste 1997; Metcalf & Eddy Inc. 2014).
The very low observed yield in R1 is also coupled with a low amount of EPS per unit of COD
removed (Table 6.7). The EPS produced in the reactors showed significant changes in terms
of both the content and the amount, where the highest production occurred in R3 (COD/N =
20; almost 1/5 of the organics were used to produce EPS), while the lowest amount (0.052 g
EPS/g COD rem.) was shown in R1 (COD/N = 35). In a study conducted under very low
COD/N ratios (2.3 - 4.5), high YObs values (up to 0.63 gTSS/g COD removed) were obtained.
It was indicated that high nitrogen stimulated the production of EPS using the organic matter
to protect the structure of the biomass against the harmful effects of free ammonia, and thus
the YObs was inflated by the production of EPS in the biomass (Cydzik-Kwiatkowska et al.
2014).
When considering high-strength organics wastewater used in our experiment, the presence of
high amounts of ammonium (ammonium chloride was used as nitrogen source), regardless of
the COD/N ratio, can trigger the EPS synthesis to shield the cell against the effect of free
ammonia. The content of the tightly bound EPS also showed significant changes with the
changes in the COD/N ratios, as shown in Fig. 6.16, where the PN content increased at COD/N
Page 175
155
of ratio of 20 and 23, when compared to that at COD/N ratio of 35. The loosely bound EPS
was negligible in all reactors. Analysis of Variance (ANOVA) showed that the effect of COD/N
on the PN component of the TB-EPS was significant, p = 2.67e-4, while that effect was non-
significant on the PS component of TB-EPS (p > 0.05).
Fig. 6.16. PS and PN concentration for TB-EPS
6.10 Analysis of microbial community
The microbial community in AGS showed the ability to degrade high-strength organics
wastewater in shorter HRT, compared to suspended culture. This can be attributed to the high
biomass retention in the reactor resulting in considerably higher MLSS concentration in AGS
reactor (6000 - 9000 mg/L), as opposed to conventional aerobic systems (less than 2000 mg
TSS/L). Moreover, the immobilization of microbial species within the granule provided a very
good environment for stimulating the growth and the dominance of specific bacteria that targets
specific wastewater composition. The resilience that AGS offers provides acclimated microbial
species with the capability to degrade high amounts of organics with limited nutrients
0
40
80
120
160
200
20 23 35
PS
& P
N c
on
ten
t in
TB
-EP
S (m
g/g
VSS
)
COD/N ratio
PS
PN
Page 176
156
requirements.
6.10.1 Major microbial functional groups.
The microbial community (Fig. 6.17) present in high-strength wastewater treatment exhibited
several key denitrifiers as well as heterotrophic nitrifiers. Unlike nutrients-rich wastewater,
heterotrophs dominated the reactors at all COD:N:P ratios tested. The genus Thauera
(belonging to the family Rhodocyclaceae; Betaproteobacteria class) was identified as the most
abundant genera in all samples, at relative abundance of 23 - 40%. Thauera is anaerobic and
facultative denitrifying bacteria, with the capability to degrade aromatic compounds
anaerobically as well as perform denitrification in anoxic environment (Shinoda et al. 2004).
Paracoccus (belonging to the family Rhodobacteraceae) was identified at 12.24%, 4.57%, and
1.37% of the total microbial population at COD: N ratios of 100:3, 100:4, and 100:5,
respectively. The genera Paracoccus are denitrifiers with the ability to use both oxygen and
nitrogenous oxides; and, they can therefore, survive in ecosystems with fluctuating aerobic or
anaerobic conditions. During aerobic conditions, the preferred electron acceptor is molecular
oxygen, and in the absence of free oxygen, the electron transfer components required for
denitrification must be induced (Baumann et al. 1996). In the batch experiments, Paracoccus
increased from 1.37% in the seed granules from R3 at COD/N ratio of 20 to 2.42%, 2.52%,
and 2.4% in batches of COD/N ratios of 145 (COD:N:P = 100:0.7:0.3), 145 (COD:N:P =
100:0.7:0.7), and 90 (COD:N:P = 100:1.1:0.4), respectively. Whereas, the relative abundance
dropped to 1.45% and 1.5% in COD/N ratios of 35 in samples of COD:N:P = 100:3:0.3 and
(COD:N:P = 100:3:0.7). It seems that the relative abundance Paracoccus increased with the
deficiency in nitrogen.
Page 177
157
Acinetobacter, belonging to the family Moraxellaceae, was also identified at 1.2%, 3.0%, and
8.0% relative abundance in SBRs R1 (COD:N:P = 100:2.8:0.4), R2 (100:4.4: 0.5) and R3 (100:
5.0: 0.7), respectively, compared to 0.6% in the seed sludge (RAS). It was shown that
Acinetobacter is responsible for heterotrophic nitrification-aerobic denitrification using
ammonia, nitrite and nitrate as substrates under low nutrient conditions (Su et al. 2015).
Acinetobacter also plays a significant role in enhanced biological phosphorus removal (EBPR)
(Tarayre et al. 2016). However, the relative abundance of Acinetobacter dropped significantly
(below 1%) in all batch experiments. Unlike Paracoccus, the relative abundance of
Acinetobacter decreased with the decrease in nitrogen content in the wastewater and increased
with the increase of phosphorus concentration in both the SBR and batch experiments. On the
contrary, Candidatus Accumulibacter, a typical bacterial PAO which was detected at 5.4% in
the RAS seed, vanished in all SBR and batch samples.
Diazotrophic bacterial population were identified in all batch experiments with increased
relative abundance compared to that seed granules cultivated at COD:N:P ratio of 100:5:0.7
(R3). Flavobacterium, belongs to family Flavobacteriaceae, increased in relative abundance
from 19.3% in the seed granules cultivated to 26 - 30 % in batch experiments. As reported in
Clark et al. (1997), the high organics removal in aerated stabilization basins for treatment of
pulp mill wastewater operated with no supplemental nitrogen was attributed to the ability of
some bacterial species to fix nitrogen from the atmosphere. However, elevated dissolved
oxygen concentrations may inhibit fixation Interestingly, Flavobacterium was reported to be
located in the core of the granule of mature granules (Świątczak and Cydzik-Kwiatkowska
2018). Other nitrogen-fixing species were detected in the nitrogen-deficient batch samples,
where Azoarcus was detected at 2 - 3 % relative abundance in batch experiments as opposed
to less than 0.2% in the seed granules (COD/N = 20). In Azoarcus, belongs to the
family Rhodocyclaceae and class Betaproteobacteria, N2 fixation occurs only under
Page 178
158
microaerobic and nitrogen-limiting conditions in this strictly respiratory bacterium (Sarkar and
Reinhold-Hurek 2014). However, due to the short duration of batch experiments, drastic
microbial population changes were not observed.
Fig. 6.17. Heatmap of dominant genera and major functional groups for N and P removal
Page 179
159
6.10.2 Microbial selection behaviour.
Experimental results showed that the presence of high amounts of organics provided a
microbial selection towards heterotrophs with high organics degradation capacity and thus the
domination of these species. Such fast growing heterotrophic bacteria could be of great interest
as they can provide the advantage of simultaneous nitrification and denitrification under
aerobic conditions. In addition, it can potentially replace the conventional two-step nitrification
and denitrification under autotrophic aerobic and heterotrophic anaerobic conditions,
respectively. However, the routes of ammonia removal for those heterotrophic nitrifiers are
still not clear. In addition, the cultivation conditions and the amounts of organics and nutrients
in the influent wastewater favored the growth of certain species of PAOs. It was indicated that
the luxury phosphorus uptake is unlikely without alternating anaerobic-aerobic conditions
(Bunce et al. 2018). In the batch experiments, granules had average diameter of 780 µm. The
spatial structure of large-size granules may have contributed to the presence of oxygen-free
inner parts of aerobic granules which provided a shielding effect as a survival mechanism for
bacterial species to behave as anaerobes. Further research is needed to understand the removal
mechanisms of these microbial species and the effect of pH on the survival and selection of
certain species performing the function of EPBR and heterotrophic nitrification.
6.11 Summary
This chapter presented the optimization of nutrients required for biological growth and biomass
synthesis in the treatment of high-strength organics wastewater using aerobic granular sludge
(AGS). Three identical sequencing batch reactors (SBRs) were used to cultivate aerobic
granules at COD concentration of ~5000 mg/L at COD:N:P ratios of 100:2.8:0.4, 100:4.4:0.5,
and 100:5:0.7. Results indicated that the amount of nutrients needed for biomass growth does
not follow the conventional organics to nutrients ratio (COD:N:P) of 100:5:1 when dealing
Page 180
160
with high-strength organics wastewater. The highest removal efficiency was achieved at
COD:N:P ratio of 100:2.8:0.4, where COD, TN, and P removal was 98.8±0.3%, 100.0 ±0.0%,
and 99.3±1.0%, respectively.
The results showed that different growth conditions and differences in the bacterial community
may explain the variability of the previously reported COD:N:P ratios. The presence of high
amounts of organics provided a microbial selection towards heterotrophs with high organics
degradation capacity, with the genus Thauera identified as the most abundant genera (23 -
40%), while autotrophic nitrifiers disappeared. The observed biomass yield at COD:N ratio of
100:2.8 suggested that heterotrophic nitrification may have occurred, while at COD:N ratios of
100:4.4 and 100:5, all the nitrogen was used for biomass synthesis. While the observed biomass
yield of aerobic granules was comparable to that of conventional aerobic systems, aerobic
granules showed high EPS content, and can withstand considerably higher sludge loading rates.
Moreover, at COD:N ratio of 100:5, almost 1/5 of the organics were utilized by the biomass
cells to produce EPS as defensive action against the effects of free ammonia
Batch optimization experiments showed that the fastest rate of removal occurred at COD:N:P
ratio of 100:1.1:0.4. After 4 h, the COD, TN, and P removal efficiencies were 95%, 99%, and
96%, achieving overall removal efficiencies of 98%, 100%, and 97% respectively, at HRT of
8 h. The bacterial behavior in consuming the organics was altered under nutrient-deficient
conditions, where faster degradation rates were observed as the amounts of nutrients decreased,
with higher relative abundance of heterotrophs and diazotrophic bacterial populations.
The statistical analysis revealed that there was a significant main effect for COD/N ratio,
COD/P ratio, HRT as well as interaction effect between COD/N and COD/P as well as COD/N
and HRT on COD removal at α <0.05. On the other hand, the interaction between COD/P and
HRT was not significant, where biologically induced precipitation induced phosphorus
Page 181
161
precipitation appeared to be the main removal mechanism of phosphorus as shown in SEM-
EDX analysis. It is suggested that the spatial structure of large-size granules provided a
shielding effect as a survival mechanism for bacterial species to behave as anaerobes.
AGS provides an attractive biological treatment technology for high-strength organics
wastewater with very limited nutrients requirement, saving on the chemical costs and
secondary pollution by nutrients addition, and overcoming the operational problems
encountered in conventional activated sludge systems due to the increased COD:N: P ratios.
Page 182
162
Combined Anaerobic-Aerobic Granular Systems
7.1 Anaerobic pretreatment
7.1.1 Experimental setup and seed sludge.
An uplow anaerobic sludge blanket (UASB) described in chapter 3 was used for testing
anerobic pretreatment of high-strength wastewater. The reactor (Fig. 7.1) was inoculated with
70% seed sludge obtained from a UASB reactor at Fleischmann's Yeast, Calgary. The synthetic
wastewater consisted of sodium acetate anhydrous (NaAc) and sodium propionate (NaPr) for
providing carbon sources. The required COD concentration was adjusted for each stage of the
experiment.
7.1.2 Reactor performance and removal efficiencies.
The UASB reactor was operated for 80 days under increasing COD Concentrations (up to ~
15,000 mg/L) as shown in Fig. 7.2. The OLR was increased stepwise as follows: days 1 - 20,
4.6 ± 0.5 gCOD/L.d; days 21 - 55, 5.9 ± 0.5 gCOD/L.d; days 56 - 80, 8.8 ± 0.6 gCOD/L.d. The
HRT was set as 35 hours until day 70, achieving COD removal efficiency of over 90% under
mesophilic conditions. The HRT was dropped afterwards to 17 hours, and consequently, only
removal efficiencies of 72 - 77% were achieved from day 70 to 80. These results indicate that
anaerobic pretreatment can bring the organics concentrations to the level where a downstream
aerobic treatment can provide a polished effluent that meets discharge limits.
Page 183
163
Fig. 7.1. (a) Experimental setup; and (b)UASB reactor
(a) (b)
Page 184
164
Fig. 7.2. Profiles of COD in UASB reactor
0%
20%
40%
60%
80%
100%
0
2000
4000
6000
8000
10000
12000
14000
16000
18000
0 10 20 30 40 50 60 70 80
Rem
ova
l Eff
icie
ncy
(%
)
CO
D C
on
cen
trat
ion
(m
g/L)
Operational days
Influent COD Effluent COD Removal efficiency
Page 185
165
7.1.3 Microbial community Analysis.
The microbial community composition of granules was analyzed as shown in Fig. 7.3.
Arcobacter, belonging to the family Arcobacteraceae, was present at a relative abundance of
17.16%. Acrobacter is a facultative anaerobic bacterium that grows under microaerophilic
conditions, reducing nitrate to nitrite. It was reported that ammonia in the wastewater can be
oxidized or retained in the influent and utilized by Arcobacter (Tran et al. 2017).
SEEP-SRB1, belongs to the family Desulfobacteraceae, was identified at 12.66%. SEEP-
SRB1 is a sulphate reducing bacteria, which was found in close syntrophic partnership with
anerobic methanotrophic archaea (Skennerton et al. 2017). Syntrophobacter, which belongs to
the family Syntrophobacteraceae was also identified at 4.54%. Syntrophobacteraceae are
acetotrophic sulfate reducers which compete with methanogens for acetate if sulfate is
available as electron acceptor (Liu et al. 2018).
The genus Mesotoga, belonging to the family Kosmotogaceae, was identified at 10.86%.
Mesotoga is commonly detected in low-temperature anaerobic hydrocarbon-rich
environments. Mesotoga displays lineage-specific phenotypes, such as no or little H2
production, dependence on sulfur-compound reduction and ability to oxidize acetate (Nesbo et
al. 2018).
The abundance of syntrophic bacteria was 9.38%, where the most abundant genera was Syner-
01, belonging to the family Synergistaceae, and phylum Synergistetes. Synergistetes are strictly
anaerobic bacteria, neutrophilic Gram‐negative rods that ferment amino acids (Hugenholtz et
al. 2009). They conduct acetogenesis to produce hydrogen and are in symbiosis with
methanogenic archaea, which consume hydrogen (Lebiocka et al. 2018; Swiatczak et al. 2017).
Page 186
166
Fig. 7.3. Microbial community relative abundance at genus level
Bacteria Epsilonbacteraeota Campylobacteria Campylobacterales Arcobacteraceae Arcobacter
Bacteria Proteobacteria Deltaproteobacteria Desulfobacterales Desulfobacteraceae SEEP-SRB1
Bacteria Thermotogae Thermotogae Kosmotogales Kosmotogaceae Mesotoga
Bacteria Synergistetes Synergistia Synergistales Synergistaceae Syner-01
Bacteria Thermotogae Thermotogae Petrotogales Petrotogaceae SC103
Bacteria Proteobacteria Deltaproteobacteria Syntrophobacterales Syntrophobacteraceae Syntrophobacter
Bacteria Cloacimonetes Cloacimonadia Cloacimonadales Cloacimonadaceae Candidatus_Cloacimonas
Bacteria Proteobacteria Gammaproteobacteria Pseudomonadales Pseudomonadaceae Pseudomonas
Bacteria Firmicutes Clostridia Clostridiales Christensenellaceae Christensenellaceae_R-7_group
Bacteria Synergistetes Synergistia Synergistales Synergistaceae Thermovirga
Bacteria Cloacimonetes Cloacimonadia Cloacimonadales Cloacimonadaceae LNR_A2-18
Bacteria Bacteroidetes Bacteroidia Sphingobacteriales Lentimicrobiaceae Lentimicrobium
Archaea Euryarchaeota Methanomicrobia Methanomicrobiales Methanospirillaceae Methanospirillum
Archaea Euryarchaeota Methanomicrobia Methanosarcinales Methanosaetaceae Methanosaeta
Bacteria Proteobacteria Deltaproteobacteria Syntrophobacterales Syntrophaceae Smithella
Bacteria Proteobacteria Deltaproteobacteria Deltaproteobacteria_Incertae_Sedis SyntrophorhabdaceaeSyntrophorhabdusBacteria Proteobacteria Deltaproteobacteria Desulfuromonadales Geobacteraceae Geobacter
Bacteria Proteobacteria Deltaproteobacteria Syntrophobacterales Syntrophaceae Syntrophus
Bacteria Proteobacteria Gammaproteobacteria Betaproteobacteriales Burkholderiaceae Comamonas
Bacteria Actinobacteria Coriobacteriia Coriobacteriales Atopobiaceae Atopobium
Bacteria Firmicutes Clostridia Clostridiales Eubacteriaceae Anaerofustis
Page 187
167
Thermovirga, 2.23%, belonging to the family Synergistaceae, are anaerobic bacteria with a
fermentative metabolism (Dahle and Birkeland 2006). The common features shared by
members of the phylum Synergistetes are anaerobic growth, rod-shaped cells, negative Gram-
staining with the ability to degrade amino acids (Honda et al. 2013).
Other obligate anaerobic bacteria were identified such as Petrotogaceae,5.34%, which belongs
to the phylum Thermotogae (Kanoksilapatham et al. 2016). Candidatus Cloacimonas (4.20%),
belongs to the family Cloacimonadaceae are known to be anaerobic mesophilic acetogens (Lee
et al. 2018). Christensenellaceae, which are strictly anaerobic acetogenic gut-associated
saccharide fermenters, were detected at 3.29% relative abundance (FitzGerald et al. 2015;
Morotomi et al. 2012).
Pseudomonas, 3.8%, are facultative anaerobic bacteria with a complex enzyme system that
uses one enzyme for free molecular oxygen and alternative enzyme system for another
molecule for degradation of substrate. They are known denitrifiers, and in some cases behave
like opportunistic pathogens causing human meningitis (Patra et al. 2010).
Two main methogenic archea were detected: Methanospirillum (2.17%), belonging to the
family Methanospirillaceae, and Methanosaeta (2.04%), belonging to the family
Methanosaetaceae. Methanospirillum is hydrogenotrophic methanogenic, while Methanosaeta
is an acetoclastic methanogenic (Sousa et al. 2013). Hydrogenotrophic methanogenesis is a
chemoautotrophic process in which H2 is the source of both energy and electrons, and CO2 is
often both an electron sink/acceptor and the source of cellular carbon. Some
hydrogenotrophic methanogens require an additional organic carbon. On the other hand,
Acetoclastic methanogenesis rely on acetate fermentation and are restricted to just two genera,
the Methanosarcina and Methanosaeta, which comprise ∼10% of methanogenic species.
The Methanosarcina use a wide variety of substrates and have high potential growth rates, but
Page 188
168
their affinity for acetate is low, while the Methanosaeta specialize in using acetate and have a
high affinity for the substrate, but their potential growth rate is low (Megonigal et al. 2003).
7.2 Combined anaerobic-aerobic batch experiments
7.2.1 Experimental setup and seed granules.
Batch experiments consisting of 5 L jars were used to determine treatment efficiency at COD
> 4000 mg/L in aerobic, anaerobic and sequential anaerobic-aerobic processes. Aerobic,
anaerobic, and sequential anaerobic-aerobic conditions were tested. Mechanical mixers were
employed to provide gentle mixing of the wastewater. Air was supplied into the aerated batch
through fine-pore ceramic diffusers. The jars were covered to minimize losses by evaporation.
A schematic diagram of the aerobic and the anaerobic system is shown in Fig. 7.4.
Dried granules, proprietary engineered granular microorganisms (EGMs) provided by Acti-
Zyme (Hycura) (Fig. 7.5), were used as inoculum. Acti-Zyme EGMs are bio-augmentation
products that include over six billion microbes and enzyme per gram and are typically used in
enhancing biodegradation in lagoon systems. Energy Dispersive Spectroscopy (EDS) analysis
showed that EGMs are composed of 60 - 65% (wt.) carbon, traces of sodium, silica, calcium,
magnesium, aluminum, potassium and iron oxides. Solutions were inoculated with a dose of
0.4 g/L dried granules divided into two equal doses: at the beginning of the experiment and on
the 7th day. The treatment processes were monitored for two weeks. The experiment was
conducted at room temperature (21 ± 2C). The reactors were operated without pH control.
Synthetic wastewater, using sodium acetate as carbon source, was used in the experiments.
Nitrogen (NH4Cl) and phosphorus (buffer solution of KH2PO4, K2HPO4) were supplemented
to provide a COD:N:P ratio in the desired range.
Page 189
169
Fig. 7.4. Schematic diagram of the anaerobic and the aerobic jars
Fig. 7.5. Scanning Electron microscope (SEM) image of EGMs
In the literature, it has been indicated that a COD:N:P ratio of 100:5:1 is required for aerobic
treatment and 700:5:1 to 250:5:1 for anaerobic treatment (Chan et al. 2009; Droste 1997;
Metcalf & Eddy Inc. 2014). However, the variations in the removal efficiencies and the
observed biomass yield are important factors that determine the appropriate COD:N:P ratio for
each type of wastewater. Ammary (2004) found that a ratio of 900:5:1.7 for anaerobic treatment
of olive mills wastewater was able to achieve 80% COD removal and that a ratio of 170:5:1.5
in an aerobic treatment for pulp and paper wastewater achieved a COD removal of 75%.
3
1- Batch solution 2-Mixer 3-Air pump 4- Fine air diffuser
1
2
4
Aerobic
1
2
Anaerobic
Page 190
170
Generally, based on the universally accepted biomass chemical formula (C5H7NO2P0.074), the
phosphorus requirement is approximately one-fifth that of nitrogen on a weight basis. Based
on this, in the present study, various COD:N:P ratios were investigated, considering nutrient-
abundant conditions as well as nutrients-scarce conditions. Initial COD concentrations,
COD:N:P ratios, pH, dissolved oxygen (DO), operational conditions and hydraulic retention
time (HRT) for the batch experiments are detailed in Table 7.1. Samples were withdrawn on a
daily basis and were analyzed for residual soluble COD (sCOD), PO43-, TN, TKN, NH3 using
HACH kits, as detailed in chapter 3. The pH and the dissolved oxygen (DO) were monitored
throughout the duration of the experiments.
Table 7.1. Initial COD concentrations, environmental conditions and HRT
Batch ID B1 B2 B3 B4 B5 B6
Initial COD
(mg/L) 5800 5660 5655 5575 5495 5650
condition Oa A/Ob Oa A/Ob Oc A/Ob
COD: N: P 100:4:1 100:4:1 200:4:1 200:4:1 300:4:1 300:4:1
Initial pH 7.1 6.7 7.2 7.0 7.0 7.3
DO conc.
(mg/L)
7 - 8
0.2 - 0.4d
7 - 8e
7 - 8
0.2 - 0.4d
7 - 8e
7 - 8
0.2 - 0.4d
7 - 8e
HRT (days) 14 e 12 d + 2 e 14 e 12 d + 2 e 14 e 12 d + 2 e
a. O: oxic or aerobic (gentle mechanical mixing and one aerator)
b. A/O: sequential anaerobic-aerobic
c. O: oxic (two aerators, no mechanical mixing)
d. During anaerobic operation
e. During aerated operation
Page 191
171
7.2.2 The pH and dissolved oxygen (DO) concentration.
The pH in all the batches increased from a starting value of 6.7 - 7.3 to 8.3 - 8.4 and to 9.4 -
9.5 in non-aerated and aerated batches, respectively. The pH increase was higher in the batches
with higher COD removal rates. The pH increase has been reported in previous research. Uzal
et al. (2003) observed an increase in pH when the substrate was consumed by the
microorganisms in anaerobic digestion, with effluent reaching pH 9.4. The stoichiometry for
the aerobic oxidation of acetate can be as represented in Eq. 7.1 (Metcalf & Eddy Inc. 2014).
Eq. 7.1
The oxidation of sodium acetate in the presence of ammonia results in the formation of
bicarbonate and carbon dioxide. However, the amount of carbon dioxide is small compared to
the bicarbonate. Thus, complete neutralization was not achieved and an increase in pH was
observed. Therefore, under aerobic conditions, the theoretical oxidation of acetate can be
presented as shown in Eq. 7.2:
Eq. 7.2
As shown in Eq. 7.2, for each mole of acetate oxidized, one mole of hydrogen is consumed,
and thus pH is increased. In anaerobic conditions, carbon dioxide functions as hydrogen
acceptor and the increase in pH is inevitable. The decomposition of acetate can be expressed
by the following reactions, Eq. 7.3 and Eq. 7.4 (Show et al. 2012a).
𝐶𝐻3𝐶𝑂𝑂𝐻 → 𝐶𝐻4 + 𝐶𝑂2 Eq. 7.3
Page 192
172
𝐶𝑂2 + 8𝐻+ + 8e− → 𝐶𝐻4 + 2𝐻2𝑂 Eq. 7.4
The pH (over 8.5) may adversely affect biochemical activity of microorganisms. However, it
seems that high pH did not adversely affect the heterotrophic growth at aerobic conditions, as
sCOD removal was not impacted in all aerated batches. Therefore, it can be inferred that
granular biomass are capable of withstanding alkaline conditions. However, further research
needs to be conducted to study the effect of pH on treatment efficiency of EGMs for higher
COD ranges (COD > 10,000 mg/L).
The DO concentration was fixed throughout the experiments to maintain either aerobic or
anaerobic conditions. Non-aerated batches exhibited a DO concentration of less than 0.4 mg/L,
while aerated batches showed DO concentration of 7 - 8 mg/L.
7.2.3 The effect of COD:N ratio.
The effect of COD:N ratios, as shown in Table 7.1 was tested in both aerobic and anaerobic
conditions. The aerated batch with COD:N ratio of 100:4 showed removal efficiency of 94%
in terms of sCOD, while nitrogen was limited only to 60%. On the other hand, at COD:N ratio
of 200:4, only 70% sCOD removal was achieved with over 95% nitrogen removal. Ammonium
–N removal can be the result of the microbial growth requirement for the nitrogen source since
neither nitrate nor nitrite were produced (Hamza et al. 2016b). Similar results were obtained at
COD:N ratio of 100:5 where all ammonia removal was the result of nitrogen requirement for
bacterial growth (Yang et al. 2005).
In anaerobic conditions, however, the effect of COD:N ratio was significant. Anaerobic
digestion is characterized by low nutrient requirements (Chan et al. 2009) with high
susceptibility to ammonia inhibition. Despite ammonium ion being an essential nutrient source
by means of nitrogen for anaerobic bacteria, free ammonia has inhibitory effect since it is freely
Page 193
173
membrane permeable (Yuzer et al. 2012). The pH controls the speciation of ammonia nitrogen
in aqueous solutions, where total ammonia nitrogen exists as either ammonium ion (NH4+) or
free ammonia (NH3), according to the following equilibrium reaction, Eq. 7.5. The increase in
the pH will cause an increase in the concentration of free ammonia.
𝑁𝐻4+ ↔ 𝑁𝐻3 + 𝐻+ Eq. 7.5
It was reported that free ammonia concentration of 80 mg/L causes initial inhibition regardless
of the pH (de Baere et al. 1984). In the anaerobic batch with COD:N ratio of 100:4, the pH
increased drastically during the anaerobic digestion from a starting value of 6.6 to 8.1 after one
day and continued to increase reaching 9.0 on day 14. Considering the initial concentration of
total ammonia-N of 250 mg/L in reactor B2 (COD:N:P = 100:4:1), over 75 mg/L
(approximately 30% of total ammonia-N) may be present in free form, suggesting that an
inhibition took place. Yüzer et al. (2012) pointed out that free ammonia inhibition in anaerobic
treatment at mesophilic conditions has been reported in the range of 50–150 mg/L. This is
reflected in the low consumption of ammonia at COD:N = 100:4 (ammonium nitrogen
concentration of 250 mg N/L) in anaerobic conditions, where only 38 % ammonia-N was
removed, with residual concentration of 173 mg/L (as NH3) of total ammonia on the 14th day.
It is worth mentioning, however, that the presence of sufficient nutrients during the aerobic
operation is a key factor for successful treatment. The highest removal efficiency of sCOD was
96% observed at COD:N:P ratio of 200:4:1 in the anaerobic-aerobic batch of 12 days and 2
days, respectively. It seems the optimum condition for organics removal in sequential treatment
lies at COD:N ratio of 50:1. At higher ratio of 75:1 (as in B6), only 46% removal was achieved.
This was due to the drop of nitrogen concentrations in the anaerobic batch B6, raising the
COD:N ratio to 500:5 on the 12th day of anaerobic. Therefore, no sufficient nutrients were
available for the aerobic process. On the other hand, the overabundance of nutrients hindered
Page 194
174
the treatment processes. At COD: N ratio of 100:4 in the anaerobic batch, ammonia inhibition
took place and the subsequent aerobic treatment resulted only in slight enhancement in removal
efficiency (from 20% to 28% sCOD removal in sequential anaerobic-aerobic process of 12
days and 2 days, respectively). It has been indicated that a COD:N ratio of 100:5 is preferred
for aerobic treatment, and that anaerobic degradation can be successful at a ratio of 100:2.4
(Frigon et al. 2009). These results confirm that a COD:N ratio of 100:2 can provide suitable
conditions for biological treatment of high-strength wastewater in sequential anaerobic-aerobic
treatment.
7.2.4 Soluble COD removal.
The sCOD removal and the corresponding pH values with time in all the batches are shown in
Fig. 7.6. During the first week of treatment, low removal rates were observed in all batches.
After inoculating the batches with a second dose of 0.2 g/L (total of 0.4 g/L) of EGMs, residual
sCOD concentrations started to decrease significantly and continued to drop until the end of
the experiment. This contributed to the increase of HRT in the batch. The aerated batch at
COD:N ratio of 100:4 showed sCOD removal efficiency of 94%, while in aerated batches of
COD:N ratio of 200:4 and 300:4 removal efficiencies of 70% and 83%, respectively were
achieved (Hamza et al. 2016b).
Minimal removals were achieved in the non-aerated batches (17 - 25% removal) for 12 days
of anaerobic operation. However, when aeration was introduced, significant removal rates were
observed. The highest removal efficiency was achieved in sequential anaerobic-aerobic
treatment at 12 days, and 2 days of 20% and 95%, respectively at COD:N:P ratio of 200:4:1
resulting in an overall removal efficiency of 96%. Thus, sequential anaerobic-aerobic treatment
with short aerobic duration can provide better organics removal compared to aerobic treatment
alone for the same total HRT (Hamza et al. 2016b).
Page 195
175
B1, initial COD = 5800 mg/L B2, initial COD = 5660 mg/L
B3, initial COD = 5655 mg/L B4, initial COD = 5575 mg/L
B5, initial COD= 5495 mg/L B6, initial COD =5650 mg/L
Fig. 7.6. COD removal efficiency vs. time at granule dose of 0.4 g/L
These results indicate higher removal rates in shorter aerobic operation compared to previous
results. It has been indicated that batch aerobic reactors operation for 15 days, following
6.0
6.5
7.0
7.5
8.0
8.5
9.0
9.5
10.0
-20
0
20
40
60
80
100
0 2 4 6 8 10 12 14
pH
CO
D r
emoval
eff
icie
ncy
(%
)
HRT (days)
COD pH
6.0
6.5
7.0
7.5
8.0
8.5
9.0
9.5
10.0
-20
0
20
40
60
80
100
0 2 4 6 8 10 12 14
pH
CO
D r
emoval
eff
icie
ncy
(%
)
HRT (days)
COD pH
6.0
6.5
7.0
7.5
8.0
8.5
9.0
9.5
10.0
0
20
40
60
80
100
0 2 4 6 8 10 12 14
pH
CO
D r
emoval
eff
icie
ncy
(%
)
HRT (days)
COD pH
6.0
6.5
7.0
7.5
8.0
8.5
9.0
9.5
-20
0
20
40
60
80
100
0 2 4 6 8 10 12 14
pH
CO
D r
emoval
eff
icie
ncy
(%
)
HRT (days)
COD pH
6.0
6.5
7.0
7.5
8.0
8.5
9.0
9.5
10.0
0
20
40
60
80
100
0 2 4 6 8 10 12 14
pH
CO
D r
emoval
eff
icie
ncy
(%
)
HRT (days)COD pH
6.0
6.5
7.0
7.5
8.0
8.5
9.0
9.5
-20
0
20
40
60
80
100
0 2 4 6 8 10 12 14
pH
CO
D r
emoval
eff
icie
ncy
(%
)
HRT (days)
COD pH
Page 196
176
anaerobic digestion of 25.8 h, reduced COD concentration from 1476 to 649 mg/L (56%
removal only) (Uzal et al. 2003). It has been suggested that prolonged anaerobic HRT and
reduced aerobic reaction time is considered the best condition for COD removal (Muda et al.
2013). Furthermore, it has been emphasized that aerobic reaction can compensate for low COD
removal rates in anaerobic reaction achieving drastic increase in overall treatment efficiency
(Moosavi et al. 2005).
While the effect of inoculation dose of granules was not studied in this work, it seems that the
granular inoculation dose is critical in the treatment of high-strength wastewater and that it is
directly proportional to the strength of wastewater. In previous work (not shown), a dose of 0.2
g/L was sufficient for COD removal at initial COD concentrations below 4000 mg/L and only
6 days were required for treatment achieving sCOD removals above 95%. However, at COD
concentrations > 5000 mg/L, a dose of 0.2 g/L provided removals less than 25% at HRT of 7
days in all batches. When a second dose of 0.2g/L was introduced, a drastic increase in COD
removal efficiency was observed in all samples, except at the anaerobic batch B2 (COD:N of
100:4), where ammonia inhibition might have taken place. Therefore, the in this work, the
overall HRT of the batches was extended to 2 weeks to allow for one week of treatment after
the second application of the dried granules. However, further tests are required to investigate
whether one-time inoculation dose of 0.4g/L or two-step inoculation of 0.2 g/L would provide
better removal efficiencies.
7.3 Summary
This chapter determined the treatability of high-strength wastewater using anaerobic granular
pretreatment reactors. Continuous flow Upflow aerobic sludge blanket (UASB) was tested as
a pretreatment alternative. The UASB was operated for 80 days under increasing COD
Concentrations (up to ~ 15,000 mg/L). Experimental results showed that UASB provided can
Page 197
177
provide COD removal efficiency of over 70% under mesophilic conditions at HRT of l7 h.
These results indicate that anaerobic pretreatment can bring the organics concentrations to the
level where a downstream aerobic treatment can provide a polished effluent that meets
discharge limits.
Batch experiments were used to investigate the process performance of combined anaerobic
aerobic granular sludge systems at initial COD concentrations ~ 5500 - 6000 mg/L, where
aerated and non-aerated batch processes were inoculated with dried granular microorganisms
at a dose of 0.4 g/L. In the anaerobic batch, a removal efficiency of 25% was not attained until
the 12th day. It took 14 days of aerobic operation to achieve sCOD removal efficiency of 94%
at COD:N:P of 100:4:1. The best removal efficiency of sCOD (96%) was achieved in the
sequential anaerobic-aerobic batch of 12 days and 2 days, respectively at COD:N:P ratio of
200:4:1. Sequential anaerobic-aerobic treatment provided promising results for the
achievement of efficient and cost effective treatment for high-strength wastewater.
Page 198
178
Conclusions
Treatment of high-strength organics wastewater presents a new challenge as conventional
aerobic treatment systems are not suitable for treatment of high-strength wastewaters due to
the excessive demand on energy for aeration and the generation of huge amounts of sludge that
needs to be stabilized and disposed of. High rate anaerobic digesters including provide
attractive cost-effective and efficient technologies for treating high-strength wastewater.
However, process instabilities, long time required for treatment, and failure to comply with
stringent environmental effluent standards remain its major limitations.
Combined anaerobic-aerobic systems provide a cost effective and efficient treatment
alternative for high-strength wastewaters. Employing granular biomass in the integrated
anaerobic-aerobic system can offer a unique advantage of compact and strong microbial
population with good settling ability and high biomass retention.
Although anaerobic-aerobic granular systems provide a promising treatment option for high-
strength wastewaters, the design and operation of granular bioreactors are still in the
development phase with limited data in large-scale operation. Granules stability and reactor
long start-up periods remain the main obstacles.
In this work, aerobic granules formation and stability were investigated. Optimization of
reactor operational conditions and nutrients addition were examined. In addition, preliminary
testing on anaerobic-aerobic systems and the use of UASB as a pretreatment was conducted.
The key concluding points are as follows:
Page 199
179
8.1 Aerobic granule formation
• Aerobic granules were successfully developed in SBR under different influent COD
concentrations (2000 - 7500 mg/L).
• Aerobic granules were cultivated at an OLR of 10.2 ± 2.1 kg COD/m3.d, where stressed
substrate loading accelerated the formation of aerobic granules and the reactor was granule-
dominated after 2 weeks from start-up.
• After granulation, the biomass properties and system performance improved significantly,
where SVI decreased to below 50 mL/g and the COD removal efficiency was consistently
over 98% for over 40 days.
• When the applied OLR was increased to 27.0 ± 3.5 kg COD/m3 (7430 ± 620 mg COD/L),
the COD removal efficiency decreased to 64.4 ± 13.7%.
• Pulse feeding could be used without affecting the stability of granules when the influent
wastewater is deficient in nutrients.
• It might be advantageous in the treatment of high-strength organics to allow for the
presence of dense floccular sludge and small size granules to avoid mass transfer limitation
inside the large size granule to enhance the degradation capability and removal efficiency
of the biomass.
• Combined strong hydraulic selection pressure such as short cycle time and short settling
time with high OLR can be considered the fastest and the simplest granulation strategy, as
the washout of flocculent biomass led to an immediate exponential growth of biomass
aggregates. After successful formation, periodic starvation can enhance granule stability
and control granules size and integrity.
Page 200
180
8.2 Granule long-term stability
• The COD concentration at cultivation affected the period required for granule formation,
where higher OLR promoted faster granule formation. However, after
maturation sludge loading rate (F/M ratio) appeared to play a decisive role in granule
stability.
• Stable granules with outstanding settleability (SVI < 50 mL/g) were maintained in the
reactor at F/M ratio between 0.5 and 1.4 gCOD/gSS.d. An increase in the F/M ratio above
2.2 gCOD/gSS.d led to fluffy granules, bulking issues, and washouts.
• F/M triggered the microbial selection, community, and diversity. At high F/M
ratios, denitrifiers and heterotrophic nitrifiers dominated the reactor. It is apparent that EPS
secreting organisms (Thauera sp.) play a major role in both granule formation and long-
term granule structural integrity and stability, with an optimum range of 25 - 35% relative
abundance.
• Statistical analysis showed a significant main effect for F/M ratio on granule settleability
(represented in SVI) at α < 0.001.
• An exponential equation was developed between F/M ratio and SVI, with R-squared and
the standard error of the regression (S) of 0.5 and 0.4, respectively. The regression
analysis showed the significance of the model and the coefficients at α < 0.001.
8.3 Optimization of nutrients addition
• The nutrients requirements for biological treatment of high-strength wastewater using AGS
was found to be less than that reported in the literature for conventional aerobic systems
treating low- and medium-strength wastewaters.
• COD:N:P ratio of 100:1.1:0.4 was sufficient to achieve over 98% removal efficiency for
COD concentration of ~ 5000 mg/L at HRT of 8 h.
Page 201
181
• Different growth conditions and differences in the bacterial community may explain the
variability of the previously reported COD:N:P ratios.
• The presence of high amounts of organics provided a microbial selection towards
heterotrophs with high organics degradation capacity, with the genus Thauera identified as
the most abundant genera (23 - 40%).
• While the observed biomass yield of aerobic granules was comparable to that of
conventional aerobic systems, aerobic granules showed high EPS content, and can
withstand considerably higher sludge loading rates.
• The statistical analysis revealed that there was a significant main effect for COD/N ratio,
COD/P ratio, HRT as well as interaction effect between COD/N and COD/P as well as
COD/N and HRT on COD removal at α <0.05. On the other hand, the interaction between
COD/P and HRT was not significant. Biologically induced phosphorus precipitation
appeared to be the main removal mechanism of phosphorus.
• It is suggested that the spatial structure of large-size granules provided a shielding effect as
a survival mechanism for bacterial species to behave as anaerobes.
• AGS provides an attractive biological treatment technology for high-strength organics
wastewater with very limited nutrients requirement, saving on the chemical costs and
secondary pollution by nutrients addition, and overcoming the operational problems
encountered in conventional activated sludge systems due to the increased COD:N: P ratios.
8.4 Investigation of anaerobic pretreatment and combined anaerobic-aerobic treatment
• Continuous flow Upflow aerobic sludge blanket (UASB) was tested as a pretreatment
alternative. The UASB was operated for 80 days under increasing COD Concentrations (up
to ~ 15,000 mg/L). Experimental results showed that UASB provided can provide COD
removal efficiency of over 70% under mesophilic conditions at HRT of l7 h.
Page 202
182
• These results indicate that anaerobic pretreatment can bring the organics concentrations to
the level where a downstream aerobic treatment can provide a polished effluent that meets
discharge limits.
• Batch experiments were instigated for the treatment of high-strength synthetic wastewater
(COD ~ 5500 - 6000 mg/L) using proprietary EGMs.
• Removal efficiency of 94 % was achieved for COD concentration > 5000 mg/L at 14 days
of aerobic operation at COD:N:P ratio of 100:4:1.
• Sequential anaerobic-aerobic treatment in 12 days and 2 days, respectively provided better
overall sCOD removal of 96% at COD:N:P ratio of 200:4:1.
• These findings indicate that combined anaerobic-aerobic treatment can save on energy and
nutrient requirements and provide better removal efficiency for high-strength wastewater.
Further investigations are needed to study:
1. Treatment of real wastewater, including particulate matter, using aerobic granular sludge
2. Long-term operation of sequential anerobic-aerobic granular sludge system
3. Optimization of UASB operational conditions to maximize biogas production and organics
removal
4. The design and operation of the integrated granular bioreactors
5. The design and operation of integrated systems in continuous flow regime and large-scale
operation.
Page 203
183
References
Abdullah, N., Yuzir, A., Curtis, T. P., Yahya, A., and Ujang, Z. (2013). “Characterization of
aerobic granular sludge treating high strength agro-based wastewater at different
volumetric loadings.” Bioresource Technology, Elsevier Ltd, 127, 181–187.
Acharya, C., Nakhla, G., Bassi, A., and Kurian, R. (2006). “Treatment of high-strength pet
food wastewater using two-stage membrane bioreactors.” Water Environ Res, 78(7),
661–670.
Adav, S. S., Lee, D. J., and Lai, J. Y. (2009a). “Functional consortium from aerobic granules
under high organic loading rates.” Bioresource Technology, Elsevier Ltd, 100(14),
3465–3470.
Adav, S. S., Lee, D. J., and Lai, J. Y. (2009b). “Treating chemical industries influent using
aerobic granular sludge: Recent development.” Journal of the Taiwan Institute of
Chemical Engineers, 40(3), 333–336.
Adav, S. S., Lee, D. J., and Lai, J. Y. (2009c). “Aerobic granulation in sequencing batch
reactors at different settling times.” Bioresource Technology, Elsevier Ltd, 100(21),
5359–5361.
Adav, S. S., Lee, D. J., and Lai, J. Y. (2010). “Potential cause of aerobic granular sludge
breakdown at high organic loading rates.” Applied Microbiology and Biotechnology,
85(5), 1601–1610.
Adav, S. S., Lee, D. J., Show, K. Y., and Tay, J. H. (2008a). “Aerobic granular sludge:
Recent advances.” Biotechnology Advances, 26(5), 411–423.
Adav, S. S., Lee, D. J., and Tay, J. H. (2007). “Activity and structure of stored aerobic
granules.” Environmental Technology, 28(11), 1227–1235.
Page 204
184
Adav, S. S., Lee, D. J., and Tay, J. H. (2008b). “Extracellular polymeric substances and
structural stability of aerobic granule.” Water Research, 42(6–7), 1644–1650.
Ahammad, S. Z., Bereslawski, J. L., Dolfing, J., Mota, C., and Graham, D. W. (2013).
“Anaerobic-aerobic sequencing bioreactors improve energy efficiency for treatment of
personal care product industry wastes.” Bioresource Technology, Elsevier Ltd, 139, 73–
79.
Ahmad, A. L., Ismail, S., and Bhatia, S. (2003). “Water recycling from palm oil mill effluent
(POME) using membrane technology.” Desalination, 157(1–3), 87–95.
Ammary, B. Y. (2004). “Nutrients requirements in biological industrial wastewater
treatment.” African Journal of Biotechnology, 3(4), 236–238.
Andalib, M., Nakhla, G., and Zhu, J. (2012). “High rate biological nutrient removal from
high strength wastewater using anaerobic-circulating fluidized bed bioreactor (A-
CFBBR).” Bioresource Technology, Elsevier Ltd, 118, 526–535.
APHA/WEF/AWWA. (2012). Standar methods for the examination of water and wastewater.
American Public Health association, (L. S. C. E.W. Rice, R.B. Baird, A.D. Eaton, ed.),
American Public Health Association, American Water Works Association, Water
Environment Federatio.
Arbeli, Z., Brenner, A., and Abeliovich, A. (2006). “Treatment of high-strength dairy
wastewater in an anaerobic deep reservoir: Analysis of the methanogenic fermentation
pathway and the rate-limiting step.” Water Research, 40(19), 3653–3659.
Arrojo, B. (2007). “Advanced Systems for Biological Treatment of High Nitrogen-loaded
Wastewater.” 2.3-2.12.
Arrojo, B., Mosquera-Corral, A., Garrido, J. M., and Méndez, R. (2004). “Aerobic
granulation with industrial wastewater in sequencing batch reactors.” Water Research,
Page 205
185
38(14–15), 3389–3399.
Badani, Z., Ait-Amar, H., Si-Salah, A., Brik, M., and Fuchs, W. (2005). “Treatment of textile
waste water by membrane bioreactor and reuse.” Desalination, 185(1–3), 411–417.
de Baere, L. A., Devocht, M., Van Assche, P., and Verstraete, W. (1984). “Influence of high
NaCl and NH4Cl salt levels on methanogenic associations.” Water Research, 18(5),
543–548.
Baêta, B. E. L., Lima, D. R. S., Silva, S. Q., and Aquino, S. F. (2015). “Evaluation of soluble
microbial products and aromatic amines accumulation during a combined
anaerobic/aerobic treatment of a model azo dye.” Chemical Engineering Journal, 259,
936–944.
Balcom, I. N., Driscoll, H., Vincent, J., and Leduc, M. (2016). “Metagenomic analysis of an
ecological wastewater treatment plant’s microbial communities and their potential to
metabolize pharmaceuticals.” F1000Research, 5(0), 1881.
Baumann, B., Snozzi, M., Zehnder, A. J. B., and Van Meer, J. R. Der. (1996). “Dynamics of
denitrification activity of Paracoccus denitrificans in continuous culture during aerobic-
anaerobic changes.” Journal of Bacteriology, 178(15), 4367–4374.
Di Bella, G., and Torregrossa, M. (2013). “Simultaneous nitrogen and organic carbon
removal in aerobic granular sludge reactors operated with high dissolved oxygen
concentration.” Bioresource Technology, Elsevier Ltd, 142, 706–713.
Beun, J. J., Hendriks, A., van Loosdrecht, M. C. M., Morgenroth, A., Wilderer, P. A., and
Heijnena, J. . (1999). “Aerobic granulation in a sequencing batch reactor.” 33(10),
2283–2290.
Beun, J. J., van Loosdrecht, M. C. M., and Heijnen, J. J. (2002). “Aerobic granulation in a
sequencing batch airlift reactor.” Water Research, 36(3), 7012–712.
Page 206
186
Beyter, D., Tang, P., Becker, S., Hoang, T., Bilgin, D., Lim, W., Peterson, T. C., Mayfield,
S., Haerizadeh, F., Shurin, J. B., and Bafna, V. (2016). “Ecosystem.” 82(8), 2494–2505.
Brik, M., Schoeberl, P., Chamam, B., Braun, R., and Fuchs, W. (2006). “Advanced treatment
of textile wastewater towards reuse using a membrane bioreactor.” Process
Biochemistry, 41(8), 1751–1757.
Bull, M. A., Sterritt, R. M., and Lestert, J. N. (1984). “An evaluation of single‐and separated‐
phase anaerobic industrial wastewater treatment in fluidized bed reactors.”
Biotechnology and Bioengineering, 26, 1054–1065.
Bunce, J. T., Ndam, E., Ofiteru, I. D., Moore, A., and Graham, D. W. (2018). “A Review of
Phosphorus Removal Technologies and Their Applicability to Small-Scale Domestic
Wastewater Treatment Systems.” Frontiers in Environmental Science, 6(February), 1–
15.
Callahan, B. (2018). “Silva taxonomic training data formatted for DADA2 (Silva version
132).” Zendo, Zenodo.
Callahan, B. J., McMurdie, P. J., Rosen, M. J., Han, A. W., Johnson, A. J., and Holmes, S. P.
(2016). “DADA2: High-resolution sample inference from Illumina amplicon data.” Nat
Methods, 13(7), 1–6.
Carlsson, H., Aspegren, H., Lee, N., and Hilmer, A. (1997). “Calcium phosphate precipitation
in biological phosphorus removal systems.” Water Research, 31(5), 1047–1055.
Cassidy, D. P., and Belia, E. (2005). “Nitrogen and phosphorus removal from an abattoir
wastewater in a SBR with aerobic granular sludge.” Water Research, 39(19), 4817–
4823.
Chan, Y. J., Chong, M. F., and Law, C. L. (2012). “An integrated anaerobic-aerobic
bioreactor (IAAB) for the treatment of palm oil mill effluent (POME): Start-up and
Page 207
187
steady state performance.” Process Biochemistry, Elsevier Ltd, 47(3), 485–495.
Chan, Y. J., Chong, M. F., Law, C. L., and Hassell, D. G. (2009). “A review on anaerobic-
aerobic treatment of industrial and municipal wastewater.” Chemical Engineering
Journal, 155(1–2), 1–18.
Chang, I.-S., Le Clech, P., Jefferson, B., and Judd, S. (2002). “Membrane Fouling in
Membrane Bioreactors for Wastewater Treatment.” Journal of Environmental
Engineering, 128(11), 1018–1029.
Chang, S. (2014). “Anaerobic Membrane Bioreactors (AnMBR) for Wastewater Treatment.”
Advances in Chemical Engineering and Science, 04(01), 56–61.
Chen, W., Westerhoff, P., Leenheer, J. A., and Booksh, K. (2003). “Fluorescence Excitation-
Emission Matrix Regional Integration to Quantify Spectra for Dissolved Organic
Matter.” Environmental Science and Technology, 37(24), 5701–5710.
Chen, X., Yuan, L., Lu, W., Li, Y., Liu, P., and Nie, K. (2015). “Cultivation of aerobic
granular sludge in a conventional, continuous flow, completely mixed activated sludge
system.” Frontiers of Environmental Science and Engineering, 9(2), 324–333.
Chen, Y., Jiang, W., Liang, D. T., and Tay, J. H. (2007). “Structure and stability of aerobic
granules cultivated under different shear force in sequencing batch reactors.” Applied
Microbiology and Biotechnology, 76(5), 1199–1208.
Chen, Y., Jiang, W., Liang, D. T., and Tay, J. H. (2008). “Aerobic granulation under the
combined hydraulic and loading selection pressures.” Bioresource Technology, 99(16),
7444–7449.
Chernicharo, C. A. deAnaerobic R. L. (2007). “Anaerobic reactors.” Biological Wastewater
Treatment series, IWA Publishing.
Chowdhury, P., Viraraghavan, T., and Srinivasan, A. (2010). “Biological treatment processes
Page 208
188
for fish processing wastewater - A review.” Bioresource Technology, Elsevier Ltd,
101(2), 439–449.
Chu, L., Zhang, X., Yang, F., and Li, X. (2006). “Treatment of domestic wastewater by using
a microaerobic membrane bioreactor.” Desalination, 189(1–3 SPEC. ISS.), 181–192.
Cillie, G. G., Henzen, M. R., Stander, G. J., Baillie, R. D., and Africa, S. (1969). “Review
Paper a N a E R O B I C Digestion--Iv . the Application of the Process in Waste
Purification.” 3.
Clark, T. A., Dare, P. H., Bruce, M. E., Clark, A., Dare, H., and Bruce, E. (1997). “Terms and
Conditions Nitrogen fixation basin kraft in an aerated stabilization bleached treating mill
wastewater.” Water Environment Research, 69(5), 1039–1046.
Cydzik-Kwiatkowska, A. (2015). “Bacterial structure of aerobic granules is determined by
aeration mode and nitrogen load in the reactor cycle.” Bioresource Technology, Elsevier
Ltd, 181, 312–320.
Cydzik-Kwiatkowska, A., Bernat, K., Zielińska, M., and Wojnowska-Baryła, I. (2014).
“Cycle length and COD/N ratio determine properties of aerobic granules treating high-
nitrogen wastewater.” Bioprocess and Biosystems Engineering, 37(7), 1305–1313.
Dahle, H., and Birkeland, N. K. (2006). “Thermovirga lienii gen. nov., sp. nov., a novel
moderately thermophilic, anaerobic, amino-acid-degrading bacterium isolated from a
North Sea oil well.” International Journal of Systematic and Evolutionary Microbiology,
56(7), 1539–1545.
Daigger, G. T., and Boltz, J. P. (2011). “Trickling Filter and Trickling Filter‐Suspended
Growth Process Design and Operation: A State-of-the-Art Review.” Water Environment
Research, 83(5), 388–404.
Dangcong, P., Bernet, N., Delgenes, J.-P., and Moletta, R. (1999). “Aerobic granular
Page 209
189
sludge—a case report.” Water Research, 33(3), 890–893.
Davidov, Y., and Jurkevitch, E. (2004). “Diversity and evolution of Bdellovibrio-and-like
organisms (BALOs), reclassification of Bacteriovorax starrii as Peredibacter starrii gen.
nov., comb. nov., and description of the Bacteriovorax-Peredibacter clade as
Bacteriovoracaceae fam. nov.” International Journal of Systematic and Evolutionary
Microbiology, 54(5), 1439–1452.
Davies, P. S. (2005). The biological basis of wastewater treatment. Strathkelvin Instruments
Ltd.
van Dijk, L., and Roncken, G. C. G. (1997). “Membrane bioreactors for wastewater treatment
The state of the art and new developments.” Water Science and Technology, 35(10), 35–
41.
Droste, R. L. (1997). “Theory and Practice of Water and Treatment.” John Wiley & Sons,
New York.
Dubois, M., Gilles, K. A., Hamilton, J. K., Rebers, P. A., and Smith, F. (1956). “Colorimetric
Method for Determination of Sugars and Related Substances.” Analytical Chemistry,
28(3), 350–356.
Ehsani, E., Hernandez-Sanabria, E., Kerckhof, F. M., Props, R., Vilchez-Vargas, R., Vital,
M., Pieper, D. H., and Boon, N. (2018). “Initial evenness determines diversity and cell
density dynamics in synthetic microbial ecosystems.” Scientific Reports, Springer US,
8(1), 1–9.
El-Kamah, H., Tawfik, A., Mahmoud, M., and Abdel-Halim, H. (2010). “Treatment of high
strength wastewater from fruit juice industry using integrated anaerobic/aerobic system.”
Desalination, 253(1–3), 158–163.
El-Sheikh, M. A., Saleh, H. I., Flora, J. R., and AbdEl-Ghany, M. R. (2011). “Biological
Page 210
190
tannery wastewater treatment using two stage UASB reactors.” Desalination, Elsevier
B.V., 276(1–3), 253–259.
Elifantz, H., Horn, G., Ayon, M., Cohen, Y., and Minz, D. (2013). “Rhodobacteraceae are the
key members of the microbial community of the initial biofilm formed in Eastern
Mediterranean coastal seawater.” FEMS Microbiology Ecology, 85(2), 348–357.
Ergüder, T. H., and Demirer, G. N. (2005). “Investigation of granulation of a mixture of
suspended anaerobic and aerobic cultures under alternating
anaerobic/microaerobic/aerobic conditions.” Process Biochemistry, 40(12), 3732–3741.
Etterer, T., and Wilderer, P. A. (2001). “Generation and properties of aerobic granular
sludge.” Water Science and Technology, 43(3), 19–26.
Fagerbakke, K. M., Heldal, M., and Norland, S. (2006). “Fagerbakke1996AME.” (Egli), 1–
13.
Farhan, M. H., Chin-Hong, P. H., Keenan, J. D., and Shieh, W. K. (1997). “Performance of
anaerobic reactors during pseudo-steady-state operation.” Journal of Chemical
Technology and Biotechnology, 69(1), 45–57.
FitzGerald, J. A., Allen, E., Wall, D. M., Jackson, S. A., Murphy, J. D., and Dobson, A. D.
W. (2015). “Methanosarcina play an important role in anaerobic co-digestion of the
seaweed ulva lactuca: Taxonomy and predicted metabolism of functional microbial
communities.” PLoS ONE, 10(11).
Frigon, J. C., Breton, J., Bruneau, T., Moletta, R., and Guiot, S. R. (2009). “The treatment of
cheese whey wastewater by sequential anaerobic and aerobic steps in a single digester at
pilot scale.” Bioresource Technology, Elsevier Ltd, 100(18), 4156–4163.
Friha, I., Karray, F., Feki, F., Jlaiel, L., and Sayadi, S. (2014). “Treatment of cosmetic
industry wastewater by submerged membrane bioreactor with consideration of microbial
Page 211
191
community dynamics.” International Biodeterioration and Biodegradation, Elsevier
Ltd, 88, 125–133.
Ganesh, P. S., Ramasamy, E. V., Gajalakshmi, S., Sanjeevi, R., and Abbasi, S. A. (2007).
“Studies on treatment of low-strength effluents by UASB reactor and its application to
dairy industry wash waters.” Indian Journal of Biotechnology, 6(2), 234–238.
Gao, D., Liu, L., Liang, H., and Wu, W. M. (2011). “Aerobic granular sludge:
Characterization, mechanism of granulation and application to wastewater treatment.”
Critical Reviews in Biotechnology, 31(2), 137–152.
García, R. L. (2017). “Microbial Community Assembly during Aerobic Granulation.”
Gobi, K., Mashitah, M. D., and Vadivelu, V. M. (2011). “Development and utilization of
aerobic granules for the palm oil mill (POM) wastewater treatment.” Chemical
Engineering Journal, Elsevier B.V., 174(1), 213–220.
Gómez, R. R. (2011). “Upflow Anaerobic Sludge Blanket Reactor Modelling.” Royal
Institute of Technology, Stockholm, Sweden.
Grady, C. P. L. J., Daigger, G. T., Love, N. G., and Filipe, C. D. M. (1999). Biological
wastewater treatment. Marcel Dekker, New York.
Guimarães, L. B., Mezzari, M. P., Daudt, G. C., and da Costa, R. H. R. (2017). “Microbial
pathways of nitrogen removal in aerobic granular sludge treating domestic wastewater.”
Journal of Chemical Technology and Biotechnology, 92(7), 1756–1765.
Hai, F. I. (2014). BIOLOGICAL.
Hamza, R. A., Iorhemen, O. T., and Tay, J. H. (2016a). “Journal of Water Process
Engineering Advances in biological systems for the treatment of high-strength
wastewater.” Journal of Water Process Engineering, Elsevier Ltd, 10, 128–142.
Page 212
192
Hamza, R. A., Iorhemen, O. T., and Tay, J. H. (2016b). “Anaerobic - aerobic granular system
for high - strength wastewater treatment in lagoons.” 5(3), 169–178.
Hamza, R. A., Iorhemen, O. T., Zaghloul, M. S., and Tay, J. H. (2018a). “Rapid formation
and characterization of aerobic granules in pilot-scale sequential batch reactor for high-
strength organic wastewater treatment.” Journal of Water Process Engineering,
Elsevier, 22(January), 27–33.
Hamza, R. A., Sheng, Z., Iorhemen, O. T., and Zaghloul, M. S. (2018b). “Impact of food-to-
microorganisms ratio on the stability of aerobic granular sludge treating high-strength
organic wastewater.” Water Research, Elsevier Ltd, 147, 287–298.
Hamza, R. A., Zaghloul, M. S., Iorhemen, O. T., Sheng, Z., and Tay, J. H. (2019). “Science
of the Total Environment Optimization of organics to nutrients ( COD : N : P ) ratio for
aerobic granular sludge treating high-strength organic wastewater.” Science of the Total
Environment, Elsevier B.V., 650, 3168–3179.
Han, H. G., and Qiao, J. F. (2012). “Prediction of activated sludge bulking based on a self-
organizing RBF neural network.” Journal of Process Control, Elsevier Ltd, 22(6),
1103–1112.
Hao, L., and Liao, B. Q. (2015). “Effect of organic matter to nitrogen ratio on membrane
bioreactor performance.” Environmental Technology (United Kingdom), 36(20), 2674–
2680.
Haroun, M., and Idris, A. (2009). “Treatment of textile wastewater with an anaerobic
fluidized bed reactor.” Desalination, Elsevier B.V., 237(1–3), 357–366.
Heger, S. F. (n.d.). “HIGH STRENGTH WASTEWATER LITERATURE REVIEW Sara F.
Heger.”
<https://pdfs.semanticscholar.org/6ace/d56474a602d13994e24bef165bb0a16f11de.pdf>
Page 213
193
(Jun. 25, 2015).
Heijnen, J. J., Mulder, A., Enger, W., and Hoeks, F. (1989). “Review on the application of
anaerobic fluidized bed reactors in waste-water treatment.” The Chemical Engineering
Journal, 41(3), 37–50.
Henry, J. G., Prasad, D., and Young, H. (1987). “Removal of organics from leachates by
anaerobic filter.” Water Research, 21(11), 1395–1399.
Honda, T., Fujita, T., and Tonouchi, A. (2013). “Aminivibrio pyruvatiphilus gen. nov., sp.
nov., an anaerobic, amino-acid-degrading bacterium from soil of a Japanese rice field.”
International Journal of Systematic and Evolutionary Microbiology, 63(PART10),
3679–3686.
Hoover, S. R., and Porges, N. (1952). “Assimilation of Dairy Wastes by Activated Sludge : II
. The Equation of Synthesis and Rate of Oxygen Utilization.” Sewage and Industrial
Wastes, 24(3), 306–312.
Hufnagel, D. A. (2014). “Anaerobic Membrane Bioreactor for High-Strength Wastewater
Treatment.” 132.
Hugenholtz, P., Hooper, S. D., and Kyrpides, N. C. (2009). “Focus: Synergistetes: Genomics
update.” Environmental Microbiology, 11(6), 1327–1329.
Iorhemen, O. T., Hamza, R. A., and Tay, J. H. (2016). “Membrane bioreactor (Mbr)
technology for wastewater treatment and reclamation: Membrane fouling.” Membranes,
6(2), 13–16.
Iritani, E., Nishikawa, M., Katagiri, N., and Kawasaki, K. (2015). “Synergy effect of
ultrasonication and salt addition on settling behaviors of activated sludge.” Separation
and Purification Technology, Elsevier B.V., 144, 177–185.
Ivanov, V., Tay, S. T. L., Liu, Q. S., Wang, X. H., Wang, Z. W., and Tay, J. H. (2005).
Page 214
194
“Formation and structure of granulated microbial aggregates used in aerobic wastewater
treatment.” Water Science and Technology, 52(7), 13–19.
Ivanov, V., Wang, X. H., Tay, S. T. L., and Tay, J. H. (2006). “Bioaugmentation and
enhanced formation of microbial granules used in aerobic wastewater treatment.”
Applied Microbiology and Biotechnology, 70(3), 374–381.
Jafari Kang, A., and Yuan, Q. (2017). “Long-term stability and nutrient removal efficiency of
aerobic granules at low organic loads.” Bioresource Technology, Elsevier Ltd, 234, 336–
342.
Janga, N., Ren, X., Kim, G., Ahn, C., Cho, J., and Kim, I. S. (2007). “Characteristics of
soluble microbial products and extracellular polymeric substances in the membrane
bioreactor for water reuse.” Desalination, 202(1–3), 90–98.
Jeison, D., Días, I., and van Lier, J. B. (2008). “Anaerobic membrane bioreactors: Are
membranes really necessary?” Electronic Journal of Biotechnology, 11(4), 0–0.
Jenkins, D., Richard, M. G., and Daigger, G. T. (2003). Manual on the Causes and Control of
Activated Sludge Bulking, Foaming, and Other Solids Seperation Problems, 3rd Edition.
IWA publishing and CRC Press.
Jensen, P. D., Yap, S. D., Boyle-Gotla, A., Janoschka, J., Carney, C., Pidou, M., and
Batstone, D. J. (2015). “Anaerobic membrane bioreactors enable high rate treatment of
slaughterhouse wastewater.” Biochemical Engineering Journal, Elsevier B.V., 97, 132–
141.
Jiang, H. L., Tay, J. H., Liu, Y., and Tay, S. T. L. (2003). “Ca2+ augmentation for
enhancement of aerobically grown microbial granules in sludge blanket reactors.”
Biotechnology Letters, 25(2), 95–99.
Jiang, H. L., Tay, J. H., and Tay, S. T. L. (2002). “Aggregation of immobilized activated
Page 215
195
sludge cells into aerobically grown microbial granules for the aerobic biodegradation of
phenol.” Letters in Applied Microbiology, 35(5), 439–445.
Jiang, K. (2011). “Genomic and Molecular Analysis of the Exopolysaccharide Production in
the Bacterium Thauera aminoaromatica MZ1T.” Ph.D. Disseration.
Juang, Y. C., Adav, S. S., Lee, D. J., and Tay, J. H. (2010). “Stable aerobic granules for
continuous-flow reactors: Precipitating calcium and iron salts in granular interiors.”
Bioresource Technology, Elsevier Ltd, 101(21), 8051–8057.
Juang, Y. C., Su, A., Fang, L. H., Lee, D. J., and Lai, J. Y. (2011). “Fouling with aerobic
granule membrane bioreactor.” Water Science and Technology, 64(9), 1870–1875.
Kalyuzhnyi, S. V., Perez Martinez, E., and Rodriguez Martinez, J. (1997). “Anaerobic
treatment of high-strength cheese-whey wastewaters in laboratory and pilot UASB-
reactors.” Bioresource Technology, 60(1), 59–65.
Kanoksilapatham, W., Pasomsup, P., Keawram, P., Cuecas, A., Portillo, M. C., and
Gonzalez, J. M. (2016). “Fervidobacterium thailandense sp. Nov., an extremely
thermophilic bacterium isolated from a hot spring.” International Journal of Systematic
and Evolutionary Microbiology, 66(12), 5023–5027.
Khan, S. J., Ilyas, S., Javid, S., Visvanathan, C., and Jegatheesan, V. (2011). “Performance of
suspended and attached growth MBR systems in treating high strength synthetic
wastewater.” Bioresource Technology, Elsevier Ltd, 102(9), 5331–5336.
Klindworth, A., Pruesse, E., Schweer, T., Peplies, J., Quast, C., Horn, M., and Glöckner, F.
O. (2013). “Evaluation of general 16S ribosomal RNA gene PCR primers for classical
and next-generation sequencing-based diversity studies.” Nucleic Acids Research, 41(1),
1–11.
Kocaturk, I., and Erguder, T. H. (2016). “Influent COD/TAN ratio affects the carbon and
Page 216
196
nitrogen removal efficiency and stability of aerobic granules.” Ecological Engineering,
Elsevier B.V., 90, 12–24.
Kornaros, M., and Lyberatos, G. (2006). “Biological treatment of wastewaters from a dye
manufacturing company using a trickling filter.” Journal of Hazardous Materials, 136(1
SPEC. ISS.), 95–102.
de Kreuk, M. (n.d.). “Aerobic Granular Sludge Technology Status: Pilot plant research at
several municipal WWTP The Netherlands, Portugal and South-Africa Demonstration
projects for industrial wastewater treatment in The Netherlands.”
de Kreuk, M. K., and van Loosdrecht, M. C. M. (2004). “Selection of slow growing
organisms as a means for improving aerobic granular sludge stability.” Water Science
and Technology, 49(11–12), 9–17.
Krhutková, O., Ruzicková, I., and Wanner, J. (2002). “Microbial evaluation of activated
sludge and filamentous population at eight Czech nutrient removal activated sludge
plants during year 2000.” Water Science and Technology, 46(1–2), 471–478.
Krishnan, V., Ahmad, D., and Jeru, J. B. (2008). “Influence of COD:N:P ratio on dark
greywater treatment using a sequencing batch reactor.” Journal of Chemical Technology
and Biotechnology, 83(5), 756–762.
Lashkarizadeh, M. (2015). “Operatig pH and feed composition as factors affecting stability of
aerobic granular sludge.”
Le-Clech, P., Chen, V., and Fane, T. A. G. (2006). “Fouling in membrane bioreactors used in
wastewater treatment.” Journal of Membrane Science, 284(1–2), 17–53.
Lebiocka, M., Montusiewicz, A., and Cydzik-Kwiatkowska, A. (2018). “Effect of
bioaugmentation on biogas yields and kinetics in anaerobic digestion of sewage sludge.”
International Journal of Environmental Research and Public Health, 15(8).
Page 217
197
Lee, D. J., Chen, Y. Y., Show, K. Y., Whiteley, C. G., and Tay, J. H. (2010). “Advances in
aerobic granule formation and granule stability in the course of storage and reactor
operation.” Biotechnology Advances, Elsevier Inc., 28(6), 919–934.
Lee, J., Kim, E., Han, G., Tongco, J. V., Shin, S. G., and Hwang, S. (2018). “Microbial
communities underpinning mesophilic anaerobic digesters treating food wastewater or
sewage sludge: A full-scale study.” Bioresource Technology, Elsevier, 259(January),
388–397.
Leitão, R. C., Van Haandel, A. C., Zeeman, G., and Lettinga, G. (2006). “The effects of
operational and environmental variations on anaerobic wastewater treatment systems: A
review.” Bioresource Technology, 97(9), 1105–1118.
Lettinga, G., van Velsen, A. F. M., Hobma, S. W., de Zeeuw, W., and Klapwijk, A. (1980).
“Use of the upflow sludge blanket (USB) reactor concept for biological wastewater
treatment, especially for anaerobic treatment.” Biotechnology and Bioengineering,
22(4), 699–734.
Li, A. J., Li, X. Y., and Yu, H. Q. (2011). “Effect of the food-to-microorganism (F/M) ratio
on the formation and size of aerobic sludge granules.” Process Biochemistry, Elsevier
Ltd, 46(12), 2269–2276.
Li, A. J., Yang, S. F., Li, X. Y., and Gu, J. D. (2008a). “Microbial population dynamics
during aerobic sludge granulation at different organic loading rates.” Water Research,
42(13), 3552–3560.
Li, X. M., Liu, Q. Q., Yang, Q., Guo, L., Zeng, G. M., Hu, J. M., and Zheng, W. (2009).
“Enhanced aerobic sludge granulation in sequencing batch reactor by Mg2+
augmentation.” Bioresource Technology, 100(1), 64–67.
Li, Y., Liu, Y., and Xu, H. (2008b). “Is sludge retention time a decisive factor for aerobic
Page 218
198
granulation in SBR?” Bioresource Technology, 99(16), 7672–7677.
Liang, Z., Li, W., Yang, S., and Du, P. (2010). “Extraction and structural characteristics of
extracellular polymeric substances (EPS), pellets in autotrophic nitrifying biofilm and
activated sludge.” Chemosphere, Elsevier Ltd, 81(5), 626–632.
Liao, B. Q., Allen, D. G., Droppo, I. G., Leppard, G. G., and Liss, S. N. (2001). “Surface
properties of sludge and their role in bioflocculation and settleability.” Water Research,
35(2), 339–350.
Liu, P., Pommerenke, B., and Conrad, R. (2018). “Identification of Syntrophobacteraceae as
major acetate-degrading sulfate reducing bacteria in Italian paddy soil.” Environmental
Microbiology, 20(1), 337–354.
Liu, Q. S., Tay, J. H., and Liu, Y. (2003). “Substrate concentration-independent aerobic
granulation in sequential aerobic sludge blanket reactor.” Environmental Technology
(United Kingdom), 24(10), 1235–1242.
Liu, X., Chen, Y., Zhang, X., Jiang, X., Wu, S., Shen, J., Sun, X., Li, J., Lu, L., and Wang, L.
(2015). “Aerobic granulation strategy for bioaugmentation of a sequencing batch reactor
(SBR) treating high strength pyridine wastewater.” Journal of Hazardous Materials,
Elsevier B.V., 295, 153–160.
Liu, X., Sun, S., Ma, B., Zhang, C., Wan, C., and Lee, D. J. (2016a). “Understanding of
aerobic granulation enhanced by starvation in the perspective of quorum sensing.”
Applied Microbiology and Biotechnology, 100(8), 3747–3755.
Liu, Y., and Liu, Q. S. (2006). “Causes and control of filamentous growth in aerobic granular
sludge sequencing batch reactors.” Biotechnology Advances, 24(1), 115–127.
Liu, Y. Q., Kong, Y. H., Zhang, R., Zhang, X., Wong, F. S., Tay, J. H., Zhu, J. R., Jiang, W.
J., and Liu, W. T. (2010a). “Microbial population dynamics of granular aerobic
Page 219
199
sequencing batch reactors during start-up and steady state periods.” Water Science and
Technology, 62(6), 1281–1287.
Liu, Y. Q., Kong, Y., Tay, J. H., and Zhu, J. (2011). “Enhancement of start-up of pilot-scale
granular SBR fed with real wastewater.” Separation and Purification Technology,
Elsevier B.V., 82(1), 190–196.
Liu, Y. Q., Liu, Y., and Tay, J. H. (2004). “The effects of extracellular polymeric substances
on the formation and stability of biogranules.” Applied Microbiology and Biotechnology,
65(2), 143–148.
Liu, Y. Q., Moy, B., Kong, Y. H., and Tay, J. H. (2010b). “Formation, physical
characteristics and microbial community structure of aerobic granules in a pilot-scale
sequencing batch reactor for real wastewater treatment.” Enzyme and Microbial
Technology, Elsevier Inc., 46(6), 520–525.
Liu, Y. Q., and Tay, J. H. (2008). “Influence of starvation time on formation and stability of
aerobic granules in sequencing batch reactors.” Bioresource Technology, 99(5), 980–
985.
Liu, Y. Q., and Tay, J. H. (2012). “The competition between flocculent sludge and aerobic
granules during the long-term operation period of granular sludge sequencing batch
reactor.” Environmental Technology (United Kingdom), 33(23), 2619–2626.
Liu, Y. Q., Wu, W. W., Tay, J. H., and Wang, J. L. (2007). “Starvation is not a prerequisite
for the formation of aerobic granules.” Applied Microbiology and Biotechnology, 76(1),
211–216.
Liu, Y. Q., Zhang, X., Zhang, R., Liu, W. T., and Tay, J. H. (2016b). “Effects of hydraulic
retention time on aerobic granulation and granule growth kinetics at steady state with a
fast start-up strategy.” Applied Microbiology and Biotechnology, 100(1), 469–477.
Page 220
200
Liu, Y., and Tay, J.-H. (2002). “The essential role of hydrodynamic shear force in the
formation of biofilm and granular sludge.” Water Research, 36(7), 1653–1665.
Liu, Y., and Tay, J. H. (2004). “State of the art of biogranulation technology for wastewater
treatment.” Biotechnology Advances, 22(7), 533–563.
Long, B., Yang, C. Z., Pu, W. H., Yang, J. K., Liu, F. B., Zhang, L., and Cheng, K. (2015a).
“Rapid cultivation of aerobic granular sludge in a continuous flow reactor.” Journal of
Environmental Chemical Engineering, Elsevier B.V., 3(4), 2966–2973.
Long, B., Yang, C. Z., Pu, W. H., Yang, J. K., Liu, F. B., Zhang, L., Zhang, J., and Cheng, K.
(2015b). “Tolerance to organic loading rate by aerobic granular sludge in a cyclic
aerobic granular reactor.” Bioresource Technology, Elsevier Ltd, 182, 314–322.
López-Palau, S., Pinto, A., Basset, N., Dosta, J., and Mata-Álvarez, J. (2012). “ORP slope
and feast-famine strategy as the basis of the control of a granular sequencing batch
reactor treating winery wastewater.” Biochemical Engineering Journal, Elsevier B.V.,
68, 190–198.
de los Reyes III, F. L., and Raskin, L. (2002). “Role of filamentous microorganisms in
activated sludge foaming: relationship of mycolata levels to foaming initiation and
stability.” Water Research, 36(2), 445–459.
Lünsmann, V., Kappelmeyer, U., Benndorf, R., Martinez-Lavanchy, P. M., Taubert, A.,
Adrian, L., Duarte, M., Pieper, D. H., von Bergen, M., Müller, J. A., Heipieper, H. J.,
and Jehmlich, N. (2016). “In situprotein-SIP highlights Burkholderiaceae as key players
degrading toluene by para ring hydroxylation in a constructed wetland model.”
Environmental Microbiology, 18(4), 1176–1186.
Luo, J., Hao, T., Wei, L., Mackey, H. R., Lin, Z., and Chen, G. H. (2014). “Impact of influent
COD/N ratio on disintegration of aerobic granular sludge.” Water Research, Elsevier
Page 221
201
Ltd, 62, 127–135.
Lv, Y., Wan, C., Lee, D. J., Liu, X., and Tay, J. H. (2014). “Microbial communities of
aerobic granules: Granulation mechanisms.” Bioresource Technology, 169, 344–351.
Lv, Y., Wan, C., Liu, X., Zhang, Y., Lee, D. J., and Tay, J. H. (2013). “Drying and re-
cultivation of aerobic granules.” Bioresource Technology, 129, 700–703.
Madoni, P. (2011). “Protozoa in wastewater treatment processes: A minireview.” Italian
Journal of Zoology, 78(1), 3–11.
Mahmoud, N. (2008). “High strength sewage treatment in a UASB reactor and an integrated
UASB-digester system.” Bioresource Technology, 99(16), 7531–7538.
Mañas, A., Biscans, B., and Spérandio, M. (2011). “Biologically induced phosphorus
precipitation in aerobic granular sludge process.” Water Research, 45(12), 3776–3786.
Mara. (2003). “Waste Stabilization Ponds: Time for agressive marketing.” Seminario
Internacional sobre Métodos Naturales para el Tratamiento de Aguas Residuales,
(June), 65–67.
Mara, D. (1997). Design Manual for Waste Stabilization Ponds in India. Lagoon Technology
International, Leeds.
Mara, D. (2004). Domestic wastewater treatment in developing countries. Earthscan
Publications, UK and USA.
Martins, A. M. P., Pagilla, K., Heijnen, J. J., and Van Loosdrecht, M. C. M. (2004).
“Filamentous bulking sludge - A critical review.” Water Research, 38(4), 793–817.
Massé, D. I., and Masse, L. (2000). “Characterization of wastewater from hog
slaughterhouses in Eastern Canada and evaluation of their in-plant wastewater treatment
systems.” Canadian Biosystems Engineering / Le Genie des biosystems au Canada,
Page 222
202
42(3), 139–146.
Maszenan, A. M., Liu, Y., and Ng, W. J. (2011). “Bioremediation of wastewaters with
recalcitrant organic compounds and metals by aerobic granules.” Biotechnology
Advances, Elsevier Inc., 29(1), 111–123.
McMurdie, P. J., and Holmes, S. (2013). “Phyloseq: An R Package for Reproducible
Interactive Analysis and Graphics of Microbiome Census Data.” PLoS ONE, 8(4).
Megonigal, J. P., Hines, M. E., and Visscher, P. T. (2003). “Anaerobic Metabolism :
Linkages to Trace Gases and Aerobic Processes.” Treatise on Geochemistry, W. H.
Schlesinger, ed., 317–424.
Metcalf & Eddy Inc. (2014). Metcalf & Eddy (2014) Wastewater Engineering Treatment and
Resource Recovery. McGraw-Hill Education, New York.
Miguez, C. B., Shen, C. F., Bourque, D., Guiot, S. R., and Groleau, D. (1999). “Monitoring
methanotrophic bacteria in hybrid anaerobic-aerobic reactors with PCR and a catabolic
gene probe.” Applied and Environmental Microbiology, 65(2), 381–388.
Mines, R. O., and Lackey, L. W. (2009). Introduction to environmental engineering. Prentice
Hall. Pearson Education.
Mishima, K., and Nakamura, M. (1991). “Self-immobilization of aerobic activated sludge - A
pilot study of the Aerobic Upflow Sludge Blanket Process in municipal sewage
treatment.” Water Science and Technology, 23(4–6), 981–990.
Mittal, A. (2011). “Biology Wastewater Treatment.” Water Today, 2–9.
Montgomery, D. C. (2013). Design and Analysis of Experiments. John Wiley & Sons.
Moosavi, G. R., Mesdaghinia, A. R., Naddafi, K., Mahvi, A. H., and Nouri, J. (2005).
“Feasibility of Development and Application of an Up-flow Anaerobic/Aerobic Fixed
Page 223
203
Bed Combined Reactor to Treat High Strength Wastewaters.” Journal of Applied
Sciences, 5(1), 169–171.
Moreno, Y., Botella, S., Alonso, J. L., Ferrus, M. A., Hernandez, M., and Hernandez, J.
(2003). “Specific Detection of Arcobacter and Campylobacter Strains in Water and
Sewage by PCR and Fluorescent In Situ Hybridization.” Applied and Environmental
Microbiology, 69(2), 1181–1186.
Morgenroth, E., Sherden, T., Van Loosdrecht, M. C. M., Heijnen, J. J., and Wilderer, P. A.
(1997). “Aerobic granular sludge in a sequencing batch reactor.” Water Research,
31(12), 3191–3194.
Morotomi, M., Nagai, F., and Watanabe, Y. (2012). “Description of Christensenella minuta
gen. nov., sp. nov., isolated from human faeces, which forms a distinct branch in the
order Clostridiales, and proposal of Christensenellaceae fam. nov.” International
Journal of Systematic and Evolutionary Microbiology, 62(1), 144–149.
Moy, B. Y. P., Tay, J. H., Toh, S. K., Liu, Y., and Tay, S. T. L. (2002). “High organic
loading influences the physical characteristics of aerobic sludge granules.” Letters in
Applied Microbiology, 34(6), 407–412.
Muda, K., Aris, A., Razman, M., and Ibrahim, Z. (2013). “Sequential Anaerobic-Aerobic
Phase Strategy Using Microbial Granular Sludge for Textile Wastewater Treatment.”
Biomass Now - Sustainable Growth and Use.
Munter, R. (2000). “Industrial wastewater characteristics.” Water Use and Management, (1),
195–210.
Mutamim, N. S. A., Noor, Z. Z., Hassan, M. A. A., and Olsson, G. (2012). “Application of
membrane bioreactor technology in treating high strength industrial wastewater: A
performance review.” Desalination, 305, 1–11.
Page 224
204
Mutamim, N. S. A., Noor, Z. Z., Hassan, M. A. A., Yuniarto, A., and Olsson, G. (2013).
“Membrane bioreactor: Applications and limitations in treating high strength industrial
wastewater.” Chemical Engineering Journal, Elsevier B.V., 225, 109–119.
Nancharaiah, Y. V., and Kiran Kumar Reddy, G. (2018). “Aerobic granular sludge
technology: Mechanisms of granulation and biotechnological applications.” Bioresource
Technology, Elsevier, 247(September 2017), 1128–1143.
Nesbo, C. L., Charchuk, R., Pollo, S. M. J., Budwill, K., Kublanov, I., Haverkamp, T. H. A.,
and Foght, J. (2018). “Genomic insights into metabolism and phylogeography of the
mesophilic Thermotogae genus Mesotoga.” bioRxiv, 00, 322537.
NESC. (2003). “High-strength flows – not your average wastewater.” Pipeline, West Virginia
University, Morgantown, US, 14(3).
Ni, B.-J., and Yu, H.-Q. (2012). “Paul, Etienne, and Liu, Yu-tung, eds. Biological Sludge
Minimization and Biomaterials/Bioenergy Recovery Technologies. Hoboken, NJ, USA:
John Wiley & Sons, 2012. ProQuest ebrary. Web. 29 October 2014. Copyright © 2012.
John Wiley & Sons. All rights reserv.” Biological Sludge Minimization and
Biomaterials/Bioenergy Recovery Technologie, John Wiley & Sons Inc., Hoboken, NJ,
USA, (October), 429–463.
NSF. (2009). NSF/ANSI 40 - Residential Wastewater Treatment Systems. Michigan, USA.
Núñez, L. A., and Martínez, B. (1999). “Anaerobic treatment of slaughterhouse wastewater in
an Expanded Granular Sludge Bed (EGSB) reactor.” Water Science and Technology,
40(8), 99–106.
Omil, F., Garrido, J. M., Arrojo, B., and Méndez, R. (2003). “Anaerobic filter reactor
performance for the treatment of complex dairy wastewater at industrial scale.” Water
Research, 37(17), 4099–4108.
Page 225
205
Orupõld, K., Tenno, T., and Henrysson, T. (2000). “Biological lagooning of phenols-
containing oil shale ash heaps leachate.” Water Research, 34(18), 4389–4396.
Pajdak-Stós, A., Sobczyk, M., Fiałkowska, E., Kocerba-Soroka, W., and Fyda, J. (2017).
“The effect of three different predatory ciliate species on activated sludge microfauna.”
European Journal of Protistology, Elsevier GmbH, 58, 87–93.
Park, E., Enander, R., Barnett, S. M., and Lee, C. (2001). “Pollution prevention and
biochemical oxygen demand reduction in a squid processing facility.” Journal of
Cleaner Production, 9(4), 341–349.
Patra, S., Das, T. K., Ghosh, S. C., Sarkar, D., and Jana, B. B. (2010). “Cadmium tolerance
and antibiotic resistance of pseudomonas sp. isolated from water, sludge and fish raised
in wastewater-fed tropical ponds.” Indian Journal of Experimental Biology, 48(4), 383–
393.
Patziger, M., Kainz, H., Hunze, M., and Józsa, J. (2012). “Influence of secondary settling
tank performance on suspended solids mass balance in activated sludge systems.” Water
Research, 46(7), 2415–2424.
Peterson, G. L. (1977). “A simplification of the protein assay method of Lowry et al. which is
more generally applicable.” Analytical Biochemistry, 83(2), 346–356.
Pronk, M., Abbas, B., Al-zuhairy, S. H. K., Kraan, R., Kleerebezem, R., and van Loosdrecht,
M. C. M. (2015a). “Effect and behaviour of different substrates in relation to the
formation of aerobic granular sludge.” Applied Microbiology and Biotechnology, 99(12),
5257–5268.
Pronk, M., de Kreuk, M. K., de Bruin, B., Kamminga, P., Kleerebezem, R., and van
Loosdrecht, M. C. M. (2015b). “Full scale performance of the aerobic granular sludge
process for sewage treatment.” Water Research, Elsevier Ltd, 84, 207–217.
Page 226
206
Qin, L., Liu, Y., and Tay, J. H. (2004a). “Effect of settling time on aerobic granulation in
sequencing batch reactor.” Biochemical Engineering Journal, 21(1), 47–52.
Qin, L., Tay, J. H., and Liu, Y. (2004b). “Selection pressure is a driving force of aerobic
granulation in sequencing batch reactors.” Process Biochemistry, 39(5), 579–584.
Rajbhandari, B. K., and Annachhatre, A. P. (2004). “Anaerobic ponds treatment of starch
wastewater: Case study in Thailand.” Bioresource Technology, 95(2), 135–143.
Rajeshwari, K. V., Balakrishnan, M., Kansal, A., Lata, K., and Kishore, V. V. N. (2000).
“State-of-the-art of anaerobic digestion technology for industrial wastewater treatment.”
Renewable & sustainable energy reviews, 4(2), 135–156.
Rakkoed, A., Danteravanich, S., and Puetpaiboon, U. (1999). “Nitrogen removal in attached
growth waste stabilization ponds of wastewater from a rubber factory.” Water Science
and Technology, 40(1), 45–52.
Rastegar, S. O., Mousavi, S. M., Shojaosadati, S. A., and Sheibani, S. (2011). “Optimization
of petroleum refinery effluent treatment in a UASB reactor using response surface
methodology.” Journal of Hazardous Materials, Elsevier B.V., 197, 26–32.
Rittmann, B. E., Bae, W., Namkung, E., and Lu, C. J. (1987). “A critical evaluation of
microbial product formation in biological processes.” Water Science and Technology,
19(3–4), 517–528.
Rudd, T., Lester, J. N., and Hicks, S. J. (1985). “Comparison of the treatment of a synthetic
meat waste by mesophilic and thermophilic anaerobic fluidized bed reactors.”
Environmental Technology Letters, 6(1–11), 209–224.
Saleh, M. M. A., and Mahmood, U. F. (2003). “UASB / EGSB Applications for Industrial
Wastewater Treatment.” Seventh International Water Technology Conference Egypt 1-3
April 2003, (April), 335–344.
Page 227
207
Sarkar, A., and Reinhold-Hurek, B. (2014). “Transcriptional profiling of nitrogen fixation
and the role of NifA in the diazotrophic endophyte Azoarcus sp. strain BH72.” PLoS
ONE, 9(2).
Sarma, S. J., and Tay, J. H. (2018). “Aerobic granulation for future wastewater treatment
technology: Challenges ahead.” Environmental Science: Water Research and
Technology, Royal Society of Chemistry, 4(1), 9–15.
Sarma, S. J., Tay, J. H., and Chu, A. (2017). “Finding Knowledge Gaps in Aerobic
Granulation Technology.” Trends in Biotechnology, Elsevier Ltd, 35(1), 66–78.
Sayed, S., van Campen, L., and Lettinga, G. (1987). “Anaerobic treatment of slaughterhouse
waste using a granular sludge UASB reactor.” Biological Wastes, 21(1), 11–28.
Schwarzenbeck, N., Erley, R., Mc Swain, B. S., Wilderer, P. A., and Irvine, R. L. (2004).
“Treatment of malting wastewater in a granular sludge sequencing batch reactor (SBR).”
Acta Hydrochimica et Hydrobiologica, 32(1), 16–24.
Şen, S., and Demirer, G. N. (2003). “Anaerobic treatment of real textile wastewater with a
fluidized bed reactor.” Water Research, 37(8), 1868–1878.
Shen, C. F., and Guiot, S. R. (1996). “Long-term impact of dissolved O2 on the activity of
anaerobic granules.” Biotechnology and Bioengineering, 49(6), 611–620.
Sheng, G. P., Yu, H. Q., and Li, X. Y. (2010). “Extracellular polymeric substances (EPS) of
microbial aggregates in biological wastewater treatment systems: A review.”
Biotechnology Advances, Elsevier Inc., 28(6), 882–894.
Shi, H. (2009). “Shi 2009.” Point sources of pollution: local effects and their control,
Encyclopedia of life support system (EOLSS)/UNESCO.
Shin, H. S., Lim, K. H., and Park, H. S. (1992). “Effect of shear stress on granulation in
oxygen aerobic upflow sludge bed reactors.” Water Science and Technology, 26(3–4),
Page 228
208
601–605.
Shinoda, Y., Sakai, Y., Uenishi, H., Uchihashi, Y., Hiraishi, A., Yukawa, H., Yurimoto, H.,
and Kato, N. (2004). “Aerobic and Anaerobic Toluene Degradation by a Newly
Isolated.” Applied and Environmental Microbiology, 70(3), 1385–1392.
Show, K.-Y., Lee, D.-J., and Tay, J.-H. (2012a). “Biological Sludge Minimization and
Biomaterials/Bioenergy Recovery Technologies.” Biological sludge minimization and
biomaterialsbioenergy recovery technologies, Y. Paul Etienne and Liu, ed., John Wiley
& Sons, Hoboken, NJ, USA, 319–347.
Show, K. Y., Lee, D. J., and Tay, J. H. (2012b). “Aerobic granulation: advances and
challenges.” Applied Biochemistry and Biotechnology, 167(6), 1622–1640.
Shpiner, R., Vathi, S., and Stuckey, D. C. (2009). “Treatment of oil well ‘produced water’ by
waste stabilization ponds: Removal of heavy metals.” Water Research, Elsevier Ltd,
43(17), 4258–4268.
Skennerton, C. T., Chourey, K., Iyer, R., Hettich, R. L., Tyson, G. W., and Orphan, V. J.
(2017). “Methane-fueled syntrophy through extracellular electron transfer: Uncovering
the genomic traits conserved within diverse bacterial partners of anaerobic
methanotrophic archaea.” mBio, 8(4), 4–5.
Slade, A. H., Ellis, R. J., vanden Heuvel, M., and Stuthridge, T. R. (2004). “Nutrient
minimisation in the pulp and paper industry: an overview.” Water Science and
Technology, 50(3), 111–122.
Sousa, D. Z., Salvador, A. F., Ramos, J., Guedes, A. P., Barbosa, S., Stams, A. J. M., Alves,
M. M., and Pereira, M. A. (2013). “Activity and viability of methanogens in anaerobic
digestion of unsaturated and saturated long-chain fatty acids.” Applied and
Environmental Microbiology, 79(14), 4239–4245.
Page 229
209
Sowmeyan, R., and Swaminathan, G. (2008). “Evaluation of inverse anaerobic fluidized bed
reactor for treating high strength organic wastewater.” Bioresource Technology, 99(9),
3877–3880.
Spagni, A., Casu, S., and Grilli, S. (2012). “Decolourisation of textile wastewater in a
submerged anaerobic membrane bioreactor.” Bioresource Technology, Elsevier Ltd,
117, 180–185.
von Sperling, M. (2007). Activated Sludge and Aerobic Biofilm Reactors. Biological
Wastewater Treatment Series, IWA Publishing, London.
Stubbé, S. M. L. (2016). “The Fate of Phosphate in Full-scale Aerobic Granular Sludge
Systems.” Delft University of Technology MSc. Thesis, 46.
Su, J. F., Zhang, K., Huang, T. L., Wen, G., Guo, L., and Yang, S. F. (2015). “Heterotrophic
nitrification and aerobic denitrification at low nutrient conditions by a newly isolated
bacterium, Acinetobacter sp. SYF26.” Microbiology (United Kingdom), 161(4), 829–
837.
Su, K. Z., and Yu, H. Q. (2005). “Formation and characterization of aerobic granules in a
sequencing batch reactor treating soybean-processing wastewater.” Environmental
Science and Technology, 39(8), 2818–2827.
Świątczak, P., and Cydzik-Kwiatkowska, A. (2018). “Performance and microbial
characteristics of biomass in a full-scale aerobic granular sludge wastewater treatment
plant.” Environmental Science and Pollution Research, 25(2), 1655–1669.
Swiatczak, P., Cydzik-Kwiatkowska, A., and Rusanowska, P. (2017). “Microbiota of
anaerobic digesters in a full-scale wastewater treatment plant.” Archives of
Environmental Protection, 43(3), 53–60.
Switzenbaum, M. S. (1983). “A comparison of the anaerobic filter and the anaerobic
Page 230
210
expanded/fluidized bed processes.” Water Science and Technology, 15(8–9), 345–358.
Tarayre, C., Nguyen, H. T., Brognaux, A., Delepierre, A., De Clercq, L., Charlier, R.,
Michels, E., Meers, E., and Delvigne, F. (2016). “Characterisation of phosphate
accumulatingorganisms and techniques for polyphosphatedetection: A review.” Sensors
(Switzerland), 16(6).
Tartakovsky, B., Manuel, M. F., and Guiot, S. R. (2005). “Degradation of trichloroethylene in
a coupled anaerobic-aerobic bioreactor: Modeling and experiment.” Biochemical
Engineering Journal, 26(1), 72–81.
Tauseef, S. M., Abbasi, T., and Abbasi, S. A. (2013). “Energy recovery from wastewaters
with high-rate anaerobic digesters.” Renewable and Sustainable Energy Reviews,
Elsevier, 19, 704–741.
Tay, J.-H., Liu, Y., Tay, S. T.-L., and Hung, Y.-T. (2009). “Aerobic Granulation technology.”
Handbook of Environmental Engineering: Advanced Biological Treatment Processes, L.
K. Wang, N. K. Shammas, and Y.-T. Hung, eds., Humana Press, 109–128.
Tay, J.-H., Pan, S., He, Y., and Tay, S. T. L. (2004). “Effect of Organic Loading Rate on
Aerobic Granulation. I: Reactor Performance.” Journal of Environmental Engineering,
130(10), 1094–1101.
Tay, J.-H., Show, K.-Y., Lee, D.-J., and Zhang, Z.-P. (2010). “Tay (2010).Anaerobic
Granulation and Granular Sludge Reactor Systems.pdf.” Environmental Anaerobic
Technology Applications and New Developments, H. H. P. Fang, ed., Imperial College
Press, Singapore, 113–131.
Tay, J. H., Ivanov, V., Pan, S., and Tay, S. T. L. (2002a). “Specific layers in aerobically
grown microbial granules.” Letters in Applied Microbiology, 34(4), 254–257.
Tay, J. H., Liu, Q. S., and Liu, Y. (2001). “Microscopic observation of aerobic granulation in
Page 231
211
sequential aerobic sludge blanket reactor.” Journal of Applied Microbiology, 91(1),
168–175.
Tay, J. H., Liu, Q. S., and Liu, Y. (2002b). “Aerobic granulation in sequential sludge blanket
reactor.” Water Science and Technology, 46)(4), 13–18.
Tay, J. H., Pan, S., Tay, S. T. L., Ivanov, V., and Liu, Y. (2003a). “The effect of organic
loading rate on the aerobic granulation: The development of shear force theory.” Water
Science and Technology, 47(11), 235–240.
Tay, J. H., Tay, S. T. L., Ivanov, V., Pan, S., Jiang, H. L., and Liu, Q. S. (2003b). “Biomass
and porosity profiles in microbial granules used for aerobic wastewater treatment.”
Letters in Applied Microbiology, 36(5), 297–301.
Tay, J. H., Yang, P., Zhuang, W. Q., Tay, S. T. L., and Pan, Z. H. (2007). “Reactor
performance and membrane filtration in aerobic granular sludge membrane bioreactor.”
Journal of Membrane Science, 304(1–2), 24–32.
Tay, S. T. L., Ivanov, V., Yi, S., Zhuang, W. Q., and Tay, J. H. (2002c). “Presence of
anaerobic Bacteroides in aerobically grown microbial granules.” Microbial Ecology,
44(3), 278–285.
Thanh, B. X., Visvanathan, C., and Aim, R. Ben. (2009). “Characterization of aerobic
granular sludge at various organic loading rates.” Process Biochemistry, 44(2), 242–245.
Theobald, D. (2017). “Aerated activated sludge basics _ Water Technology.”
Tilley, E., Ulrich, L., Lüthi, C., Morel, A., Zurbrügg, C., and Schertenleib, R. (2014).
“Compendium of Sanitation Systems and Technologies.” International Year of
Sanitation, 180.
Toh, S. K., Tay, J. H., Moy, B. Y. P., Ivanov, V., and Tay, S. T. L. (2003). “Size-effect on the
physical characteristics of the aerobic granule in a SBR.” Applied Microbiology and
Page 232
212
Biotechnology, 60(6), 687–695.
Torkian, A., Eqbali, A., and Hashemian, S. J. (2003). “The effect of organic loading rate on
the performance of UASB reactor treating slaughterhouse effluent.” Resources,
Conservation and Recycling, 40(1), 1–11.
Tran, P. T., Watari, T., Hirakata, Y., Nguyen, T. T., Hatamoto, M., Tanikawa, D., Syutsubo,
K., Nguyen, M. T., Fukuda, M., Nguyen, L. H., and Yamaguchi, T. (2017). “Anaerobic
Baffled Reactor in Treatment of Natural Rubber Processing Wastewater: Reactor
Performance and Analysis of Microbial Community.” Journal of Water and
Environment Technology, 15(6), 241–251.
Tu, X., Zhang, S., Xu, L., Zhang, M., and Zhu, J. (2010). “Performance and fouling
characteristics in a membrane sequence batch reactor (MSBR) system coupled with
aerobic granular sludge.” Desalination, Elsevier B.V., 261(1–2), 191–196.
Turkdogan-Aydinol, F. I., Yetilmezsoy, K., Comez, S., and Bayhan, H. (2011). “Performance
evaluation and kinetic modeling of the start-up of a UASB reactor treating municipal
wastewater at low temperature.” Bioprocess and Biosystems Engineering, 34(2), 153–
162.
Urbain, V., Block, J. C., and Manem, J. (1992). “BIOFLOCCULATION IN ACTIVATED
SLUDGE : AN ANALYTIC APPROACH Bacten ’ a.” Water Science and Technology,
25(4–5), 441–443.
Urbain, V., Block, J. C., and Manem, J. (1993). “BIOFLOCCULATION IN ACTIVATED
SLUDGE : AN ANALYTIC APPROACH Bacten ’ a.” Water Research, 27(5), 829–
838.
USEPA. (2000). “Wastewater Technology Fact Anaerobic Lagoons.” Environmental
Protection Agency, 1–7.
Page 233
213
Uzal, N., Gökçay, C. F., and Demirer, G. N. (2003). “Sequential (anaerobic/aerobic)
biological treatment of malt whisky wastewater.” Process Biochemistry, 39(3), 279–286.
Val Del Río, A., Figueroa, M., Mosquera-Corral, A., Campos, J. L., and Méndez, R. (2013).
“Stability of aerobic granular biomass treating the effluent from a seafood industry.”
International Journal of Environmental Research, 7(2), 265–276.
Vargas, A., Moreno-Andrade, I., and Buitrón, G. (2008). “Controlled backwashing in a
membrane sequencing batch reactor used for toxic wastewater treatment.” Journal of
Membrane Science, 320(1–2), 185–190.
Visvanathan, C., and Abeynayaka, A. (2012). “Developments and future potentials of
anaerobic membrane bioreactors (AnMBRs).” Membrane Water Treatment, 3(1), 1–23.
Vrede, K., Heldal, M., Norland, S., and Bratbak, G. (2002). “Elemental Composition (C , N ,
P) and Cell Volume of Exponentially Growing and.” Applied and Environmental
Microbiology, 68(6), 2965–2971.
Wan, C., Zhang, P., Lee, D. J., Yang, X., Liu, X., Sun, S., and Pan, X. (2013).
“Disintegration of aerobic granules: Role of second messenger cyclic di-GMP.”
Bioresource Technology, Elsevier Ltd, 146, 330–335.
Wang, Z. W., Liu, Y., and Tay, J. H. (2005). “Distribution of EPS and cell surface
hydrophobicity in aerobic granules.” Applied Microbiology and Biotechnology, 69(4),
469–473.
Weber, S. D., Ludwig, W., Schleifer, K. H., and Fried, J. (2007). “Microbial composition and
structure of aerobic granular sewage biofilms.” Applied and Environmental
Microbiology, 73(19), 6233–6240.
WEF. (2011). Water Environment Federation(WEF) Manual of Practice No. 36 Membrane
Bioreactors. (K, ed.), McGraw-Hill., New York:
Page 234
214
Wei, Y., Li, G., and Wang, B. (2011). “Application of granular sludge membrane bioreactor
in the treatment of wastewater.” Procedia Environmental Sciences, 10(PART A), 108–
111.
Werner, J. J., Garcia, M. L., Perkins, S. D., Yarasheski, K. E., Smith, S. R., Muegge, B. D.,
Stadermann, F. J., Derito, C. M., Floss, C., Madsen, E. L., Gordon, J. I., and Angenent,
L. T. (2014). “Microbial community dynamics and stability during an ammonia-induced
shift to syntrophic acetate oxidation.” Applied and Environmental Microbiology, 80(11),
3375–3383.
Wilén, B. M., Liébana, R., Persson, F., Modin, O., and Hermansson, M. (2018). “The
mechanisms of granulation of activated sludge in wastewater treatment, its optimization,
and impact on effluent quality.” Applied Microbiology and Biotechnology, Applied
Microbiology and Biotechnology, 102(12), 5005–5020.
Winkler, M. K. H., Meunier, C., Henriet, O., Mahillon, J., Suárez-Ojeda, M. E., Del Moro,
G., De Sanctis, M., Di Iaconi, C., and Weissbrodt, D. G. (2018). “An integrative review
of granular sludge for the biological removal of nutrients and recalcitrant organic matter
from wastewater.” Chemical Engineering Journal, Elsevier, 336(July 2017), 489–502.
Wu, D., Zhang, Z., Yu, Z., and Zhu, L. (2018). “Optimization of F/M ratio for stability of
aerobic granular process via quantitative sludge discharge.” Bioresource Technology,
252(866), 150–156.
Yang, S.-F., Tay, J.-H., and Liu, Y. (2005). “Effect of Substrate Nitrogen/Chemical Oxygen
Demand Ratio on the Formation of Aerobic Granules.” Journal of Environmental
Engineering, 131(1), 86–92.
Yang, S. F., Tay, J. H., and Liu, Y. (2004). “Inhibition of free ammonia to the formation of
aerobic granules.” Biochemical Engineering Journal, 17(1), 41–48.
Page 235
215
Yang, Y. C., Liu, X., Wan, C., Sun, S., and Lee, D. J. (2014). “Accelerated aerobic
granulation using alternating feed loadings: Alginate-like exopolysaccharides.”
Bioresource Technology, Elsevier Ltd, 171, 360–366.
Young, J. C., and McCarty, P. L. (1969). “The anaerobic filter for waste treatment.” Journal -
Water Pollution Control Federation, 41(519), Suppl:R160+.
Yu, X., Wan, C., Lei, Z., Liu, X., Zhang, Y., Tay, J. H., and Lee, D. J. (2014). “Use of
aerobic granules for treating synthetic high-strength ammonium wastewaters.”
Environmental Technology (United Kingdom), 35(14), 1785–1790.
Yuzer, B., Akgul, D., and Mertoglu, B. (2012). “Effect of High Ammonia Concentration on
UASB Reactor Treating Sanitary Landfill Leachate.” Fen Bilimleri Dergisi, 24(2), 59–
67.
Zeeman, G., and Lettinga, G. (1999). “The role of anaerobic digestion of domestic sewage in
closing the water and nutrient cycle at community level.” Water Science and
Technology, 39(5), 187–194.
Zhao, C. (2011). “Effect of temperature on biogas production in anaerobic treatment of
domestic wastewater UASB system in Hammarby Sjöstadsverk.” (August), 28.
Zheng, D., Sun, Y., Li, H., Lu, S., Shan, M., and Xu, S. (2016). “Multistage A-O Activated
Sludge Process for Paraformaldehyde Wastewater Treatment and Microbial Community
Structure Analysis.” Journal of Chemistry, 2016.
Zheng, Y. M., Yu, H. Q., Liu, S. J., and Liu, X. Z. (2006). “Formation and instability of
aerobic granules under high organic loading conditions.” Chemosphere, 63(10), 1791–
1800.
Zhuang, W. Q., Tay, J. H., Yi, S., and Tay, S. T. L. (2005). “Microbial adaptation to
biodegradation of tert-butyl alcohol in a sequencing batch reactor.” Journal of
Page 236
216
Biotechnology, 118(1), 45–53.
Zinatizadeh, A. A. L., Mohamed, A. R., Abdullah, A. Z., Mashitah, M. D., Hasnain Isa, M.,
and Najafpour, G. D. (2006). “Process modeling and analysis of palm oil mill effluent
treatment in an up-flow anaerobic sludge fixed film bioreactor using response surface
methodology (RSM).” Water Research, 40(17), 3193–3208.


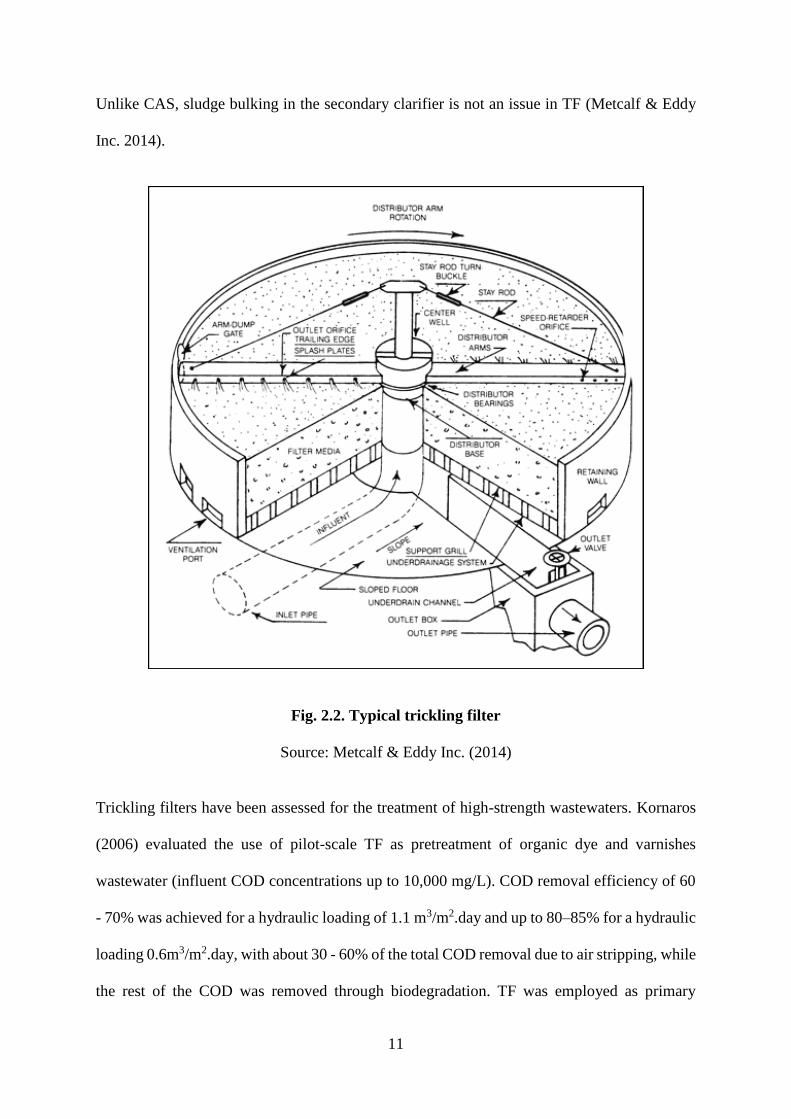


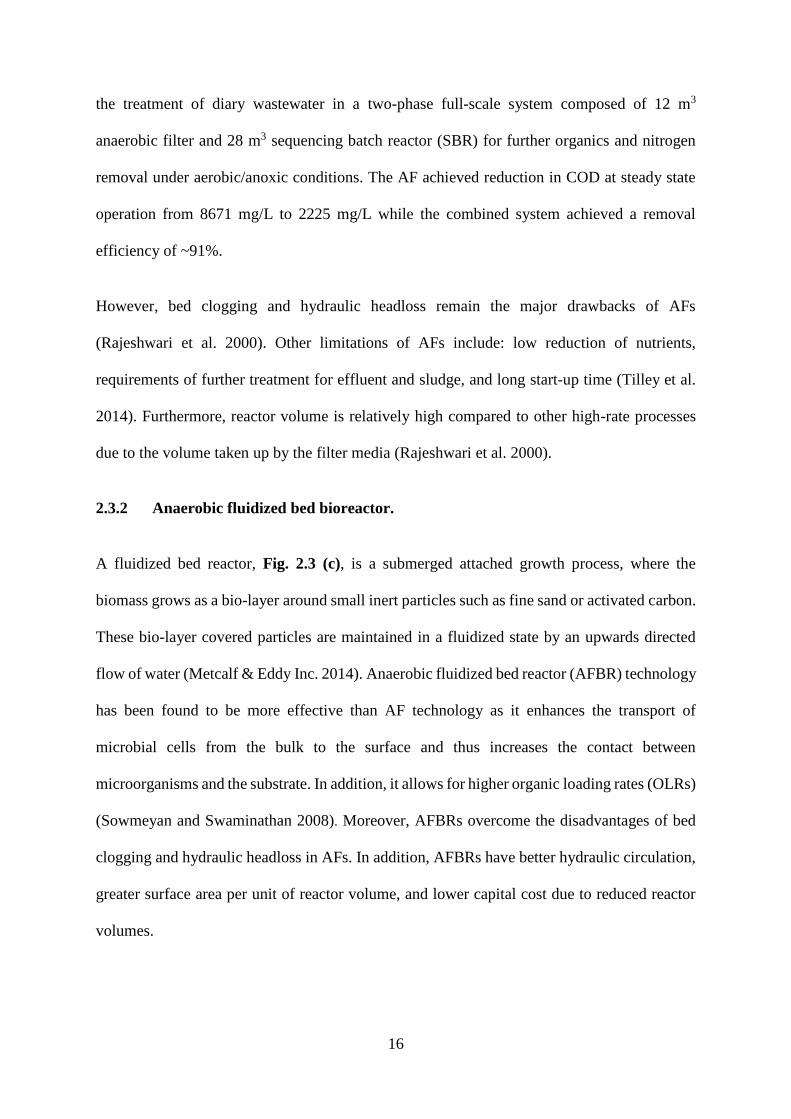


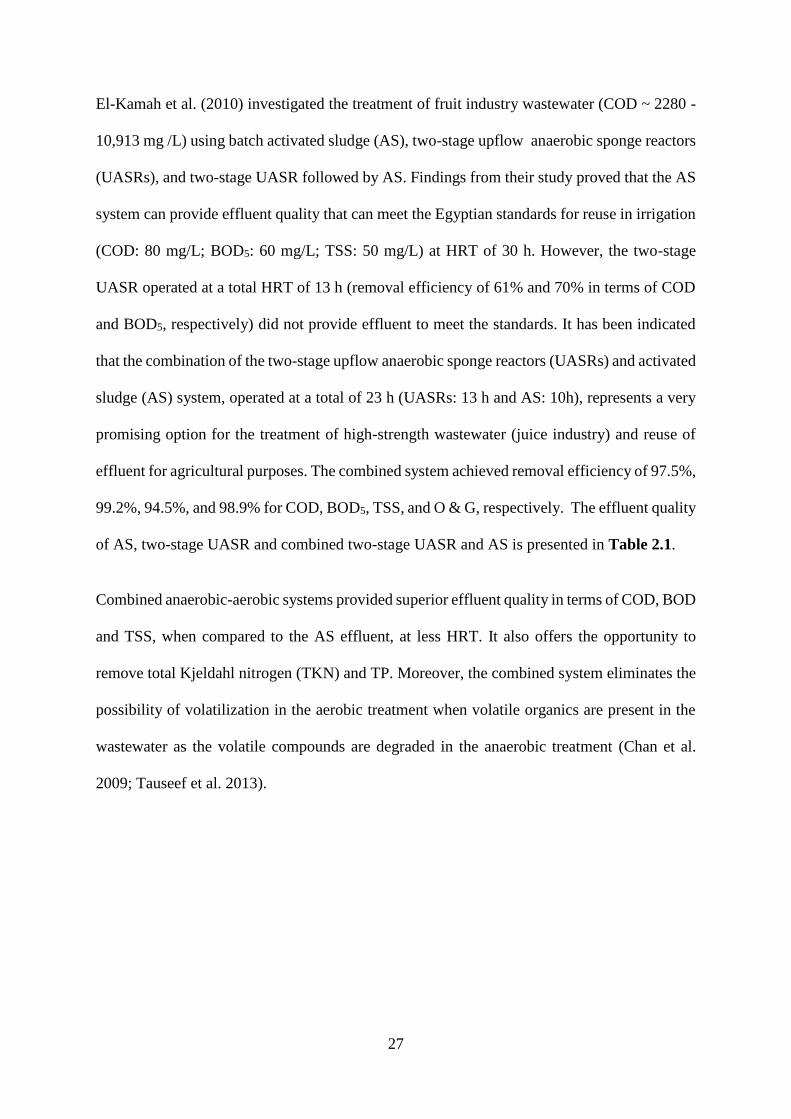


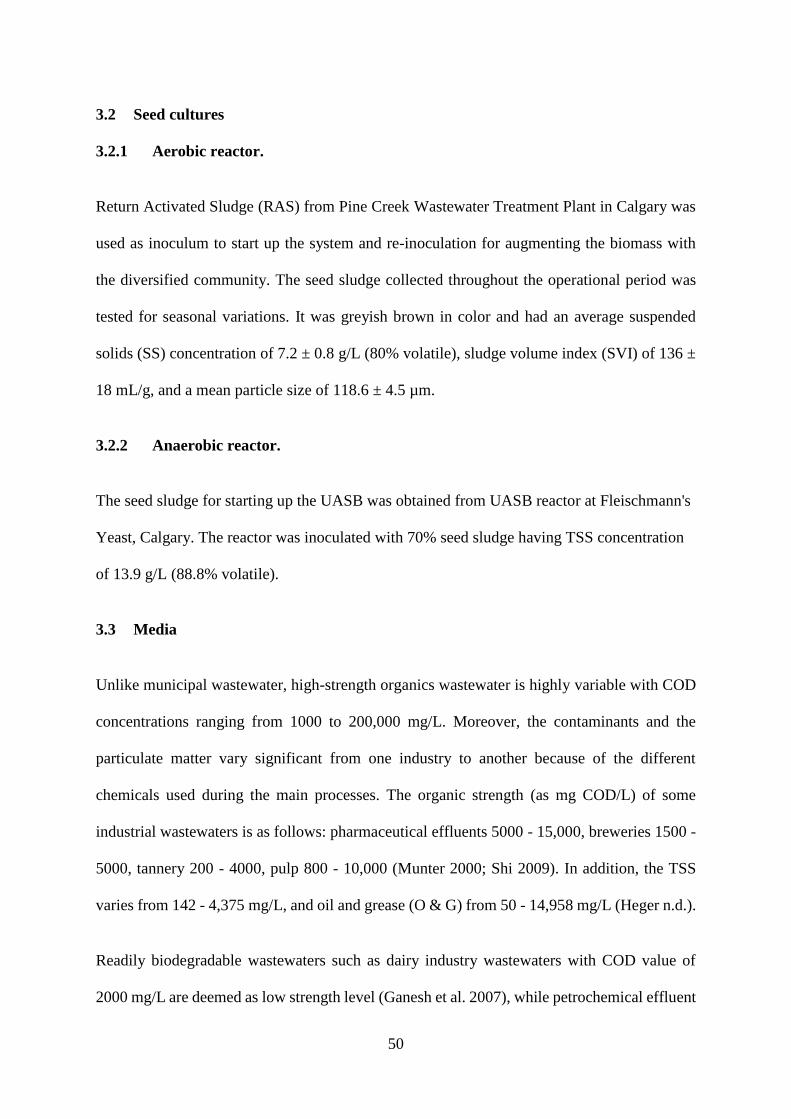

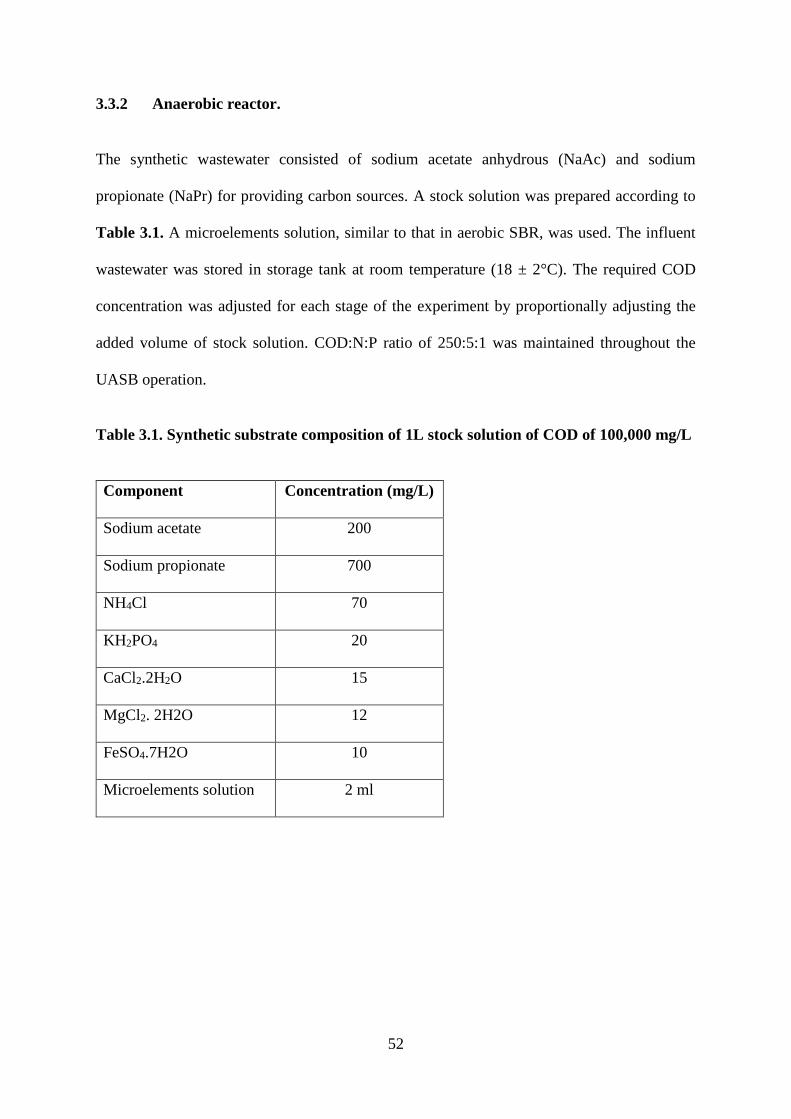


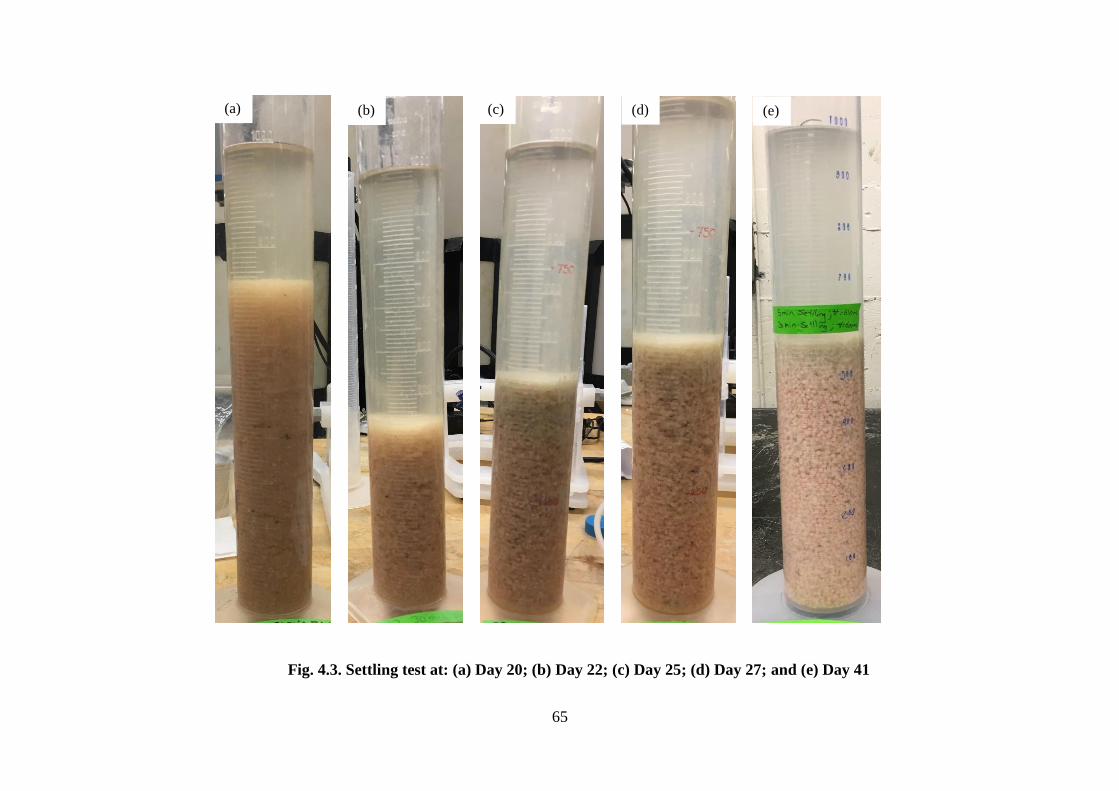

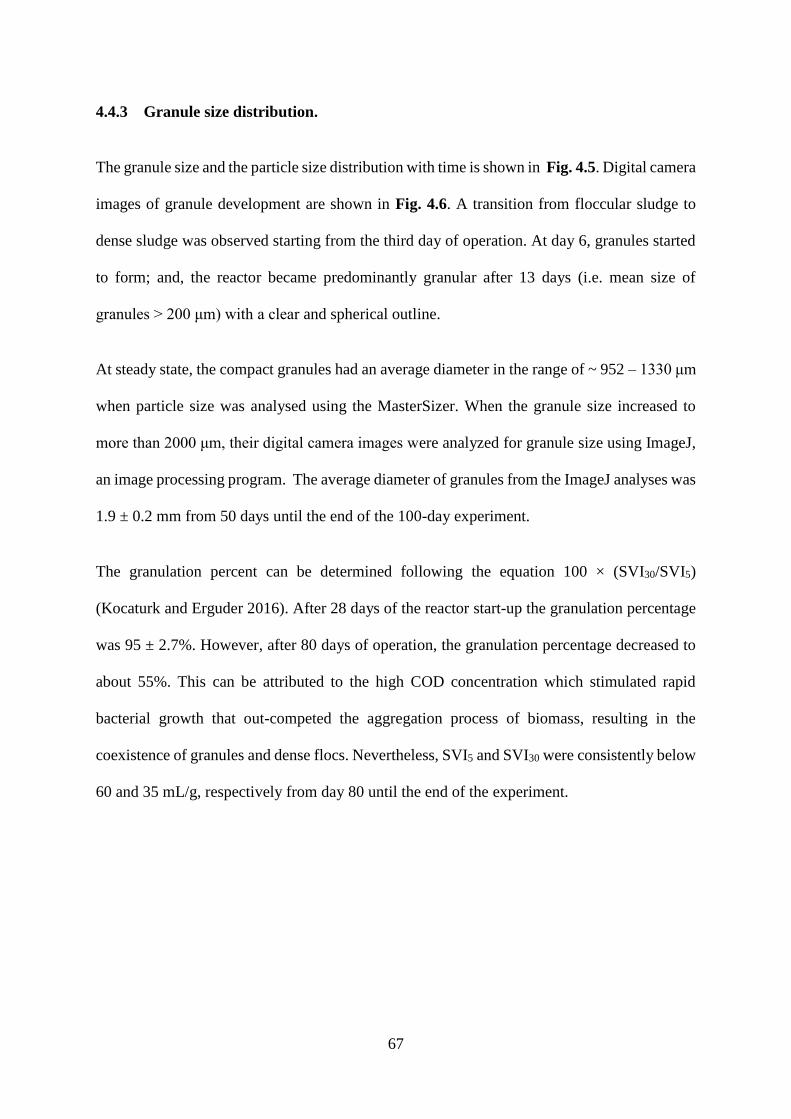
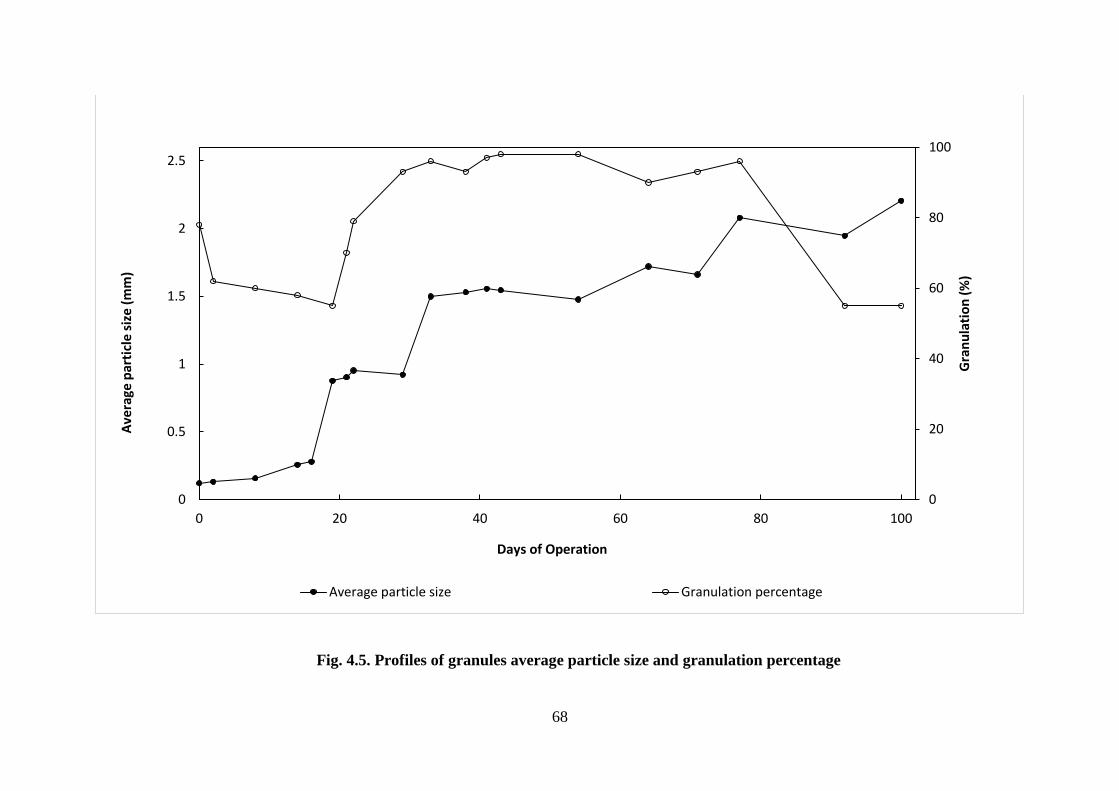


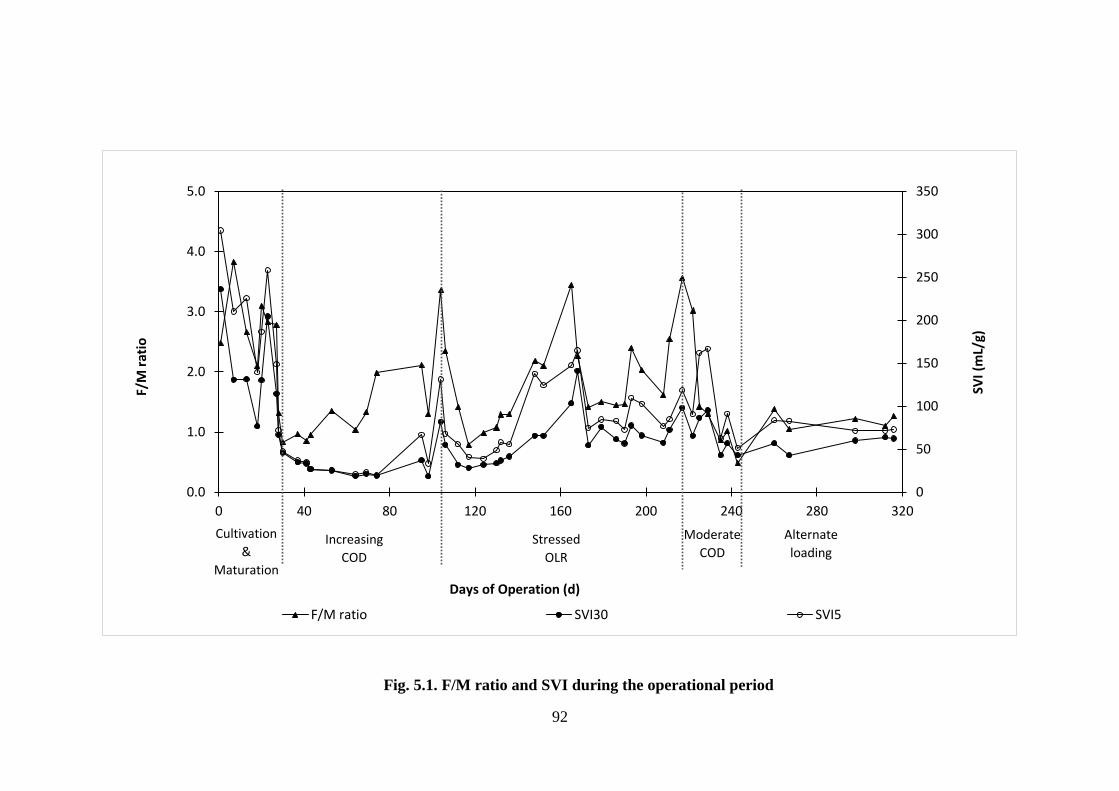


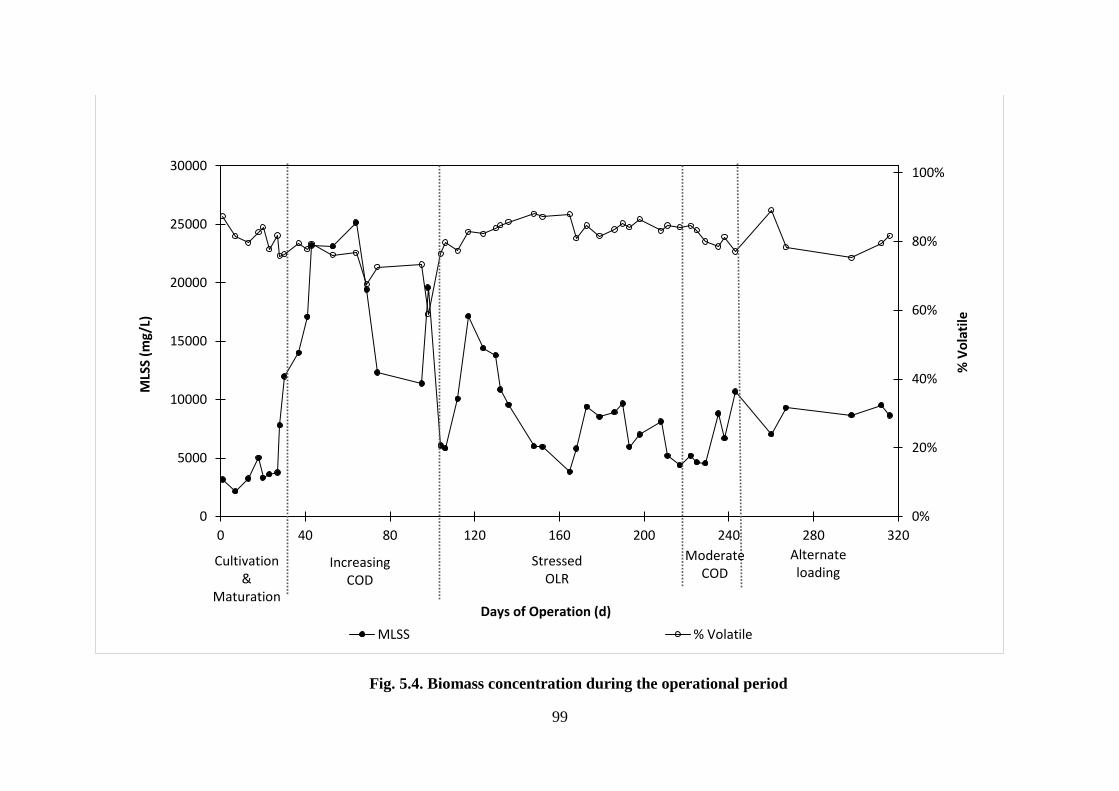


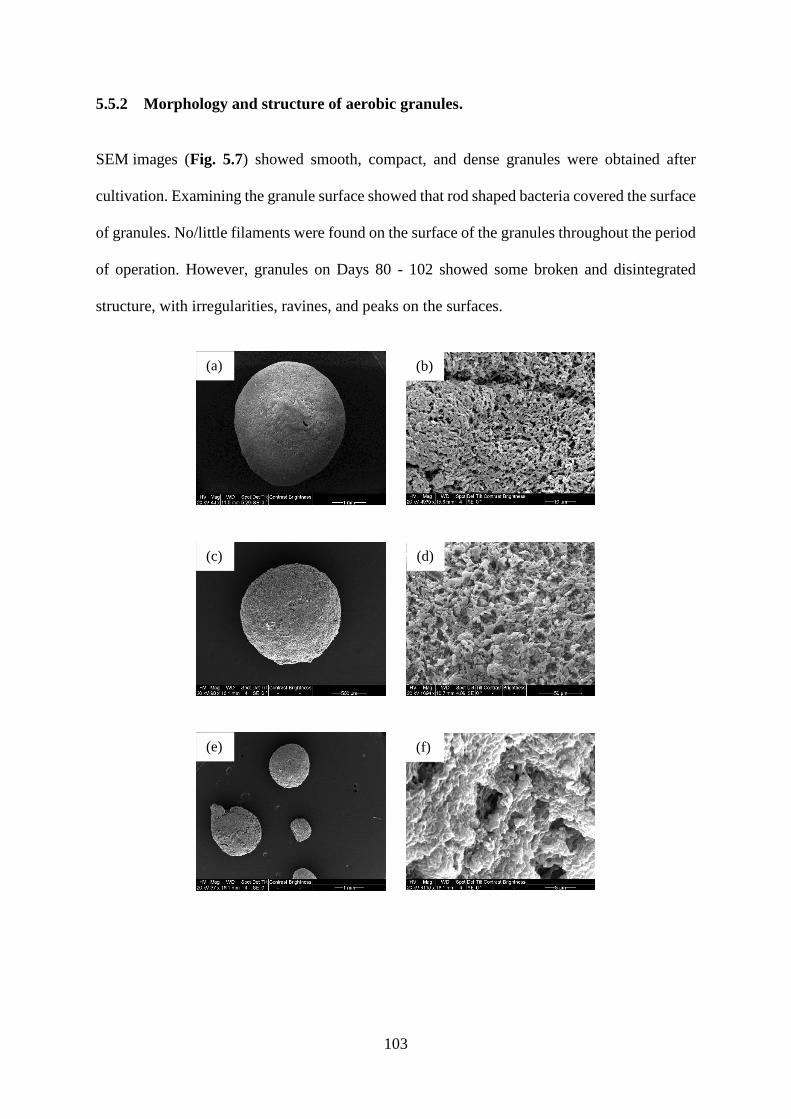
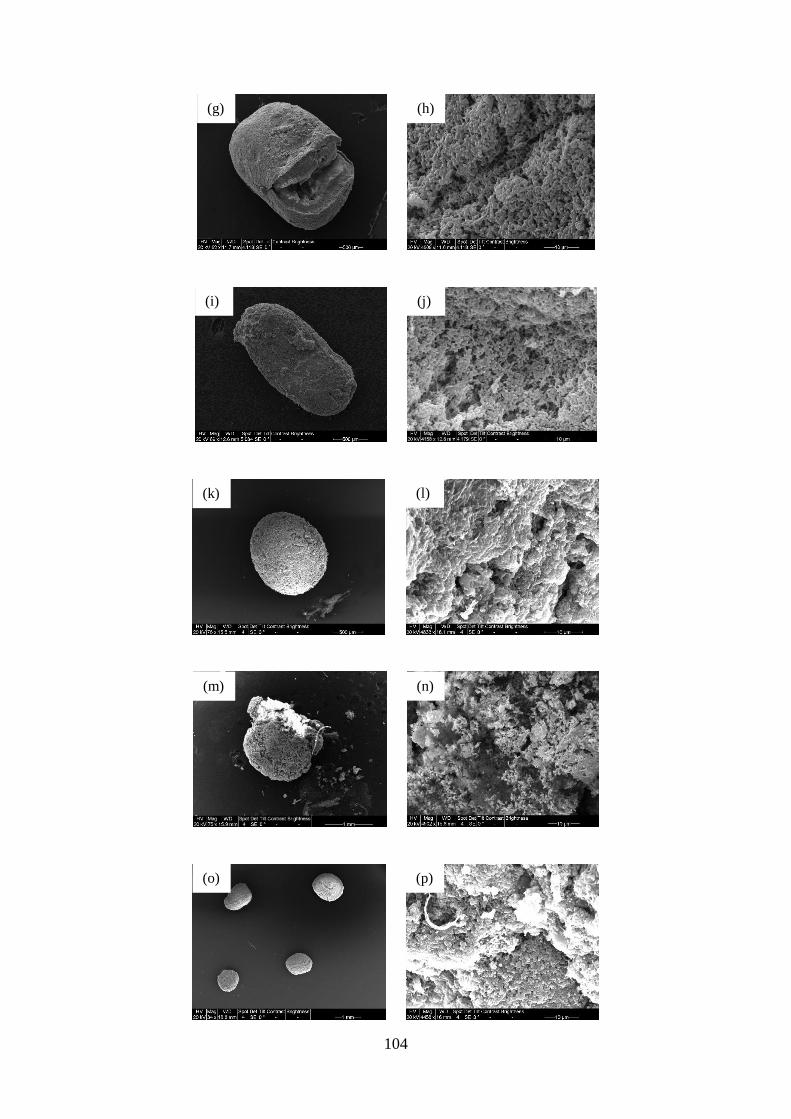
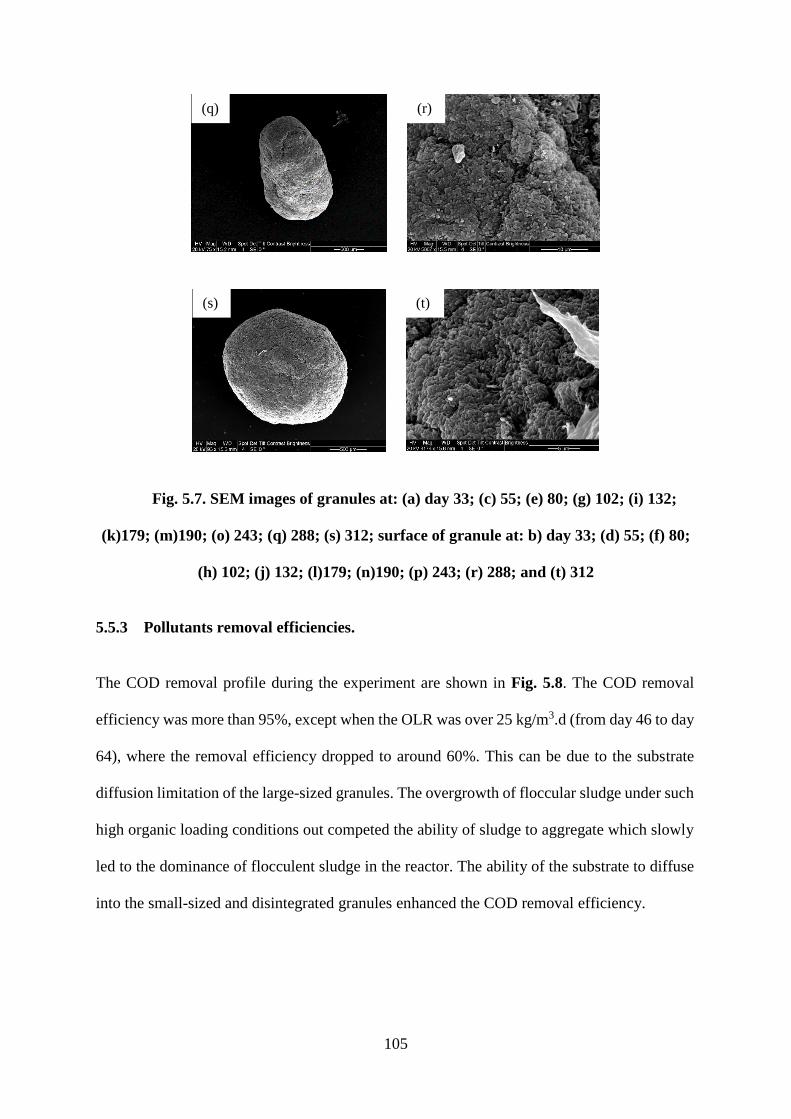


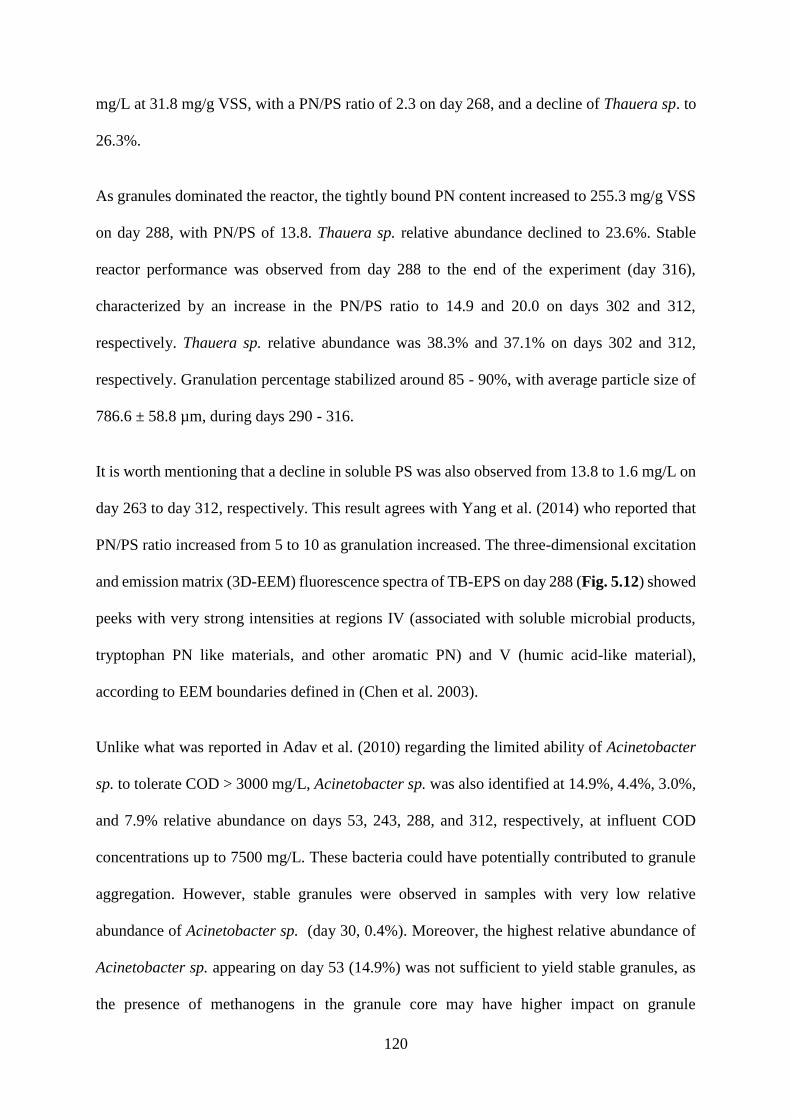


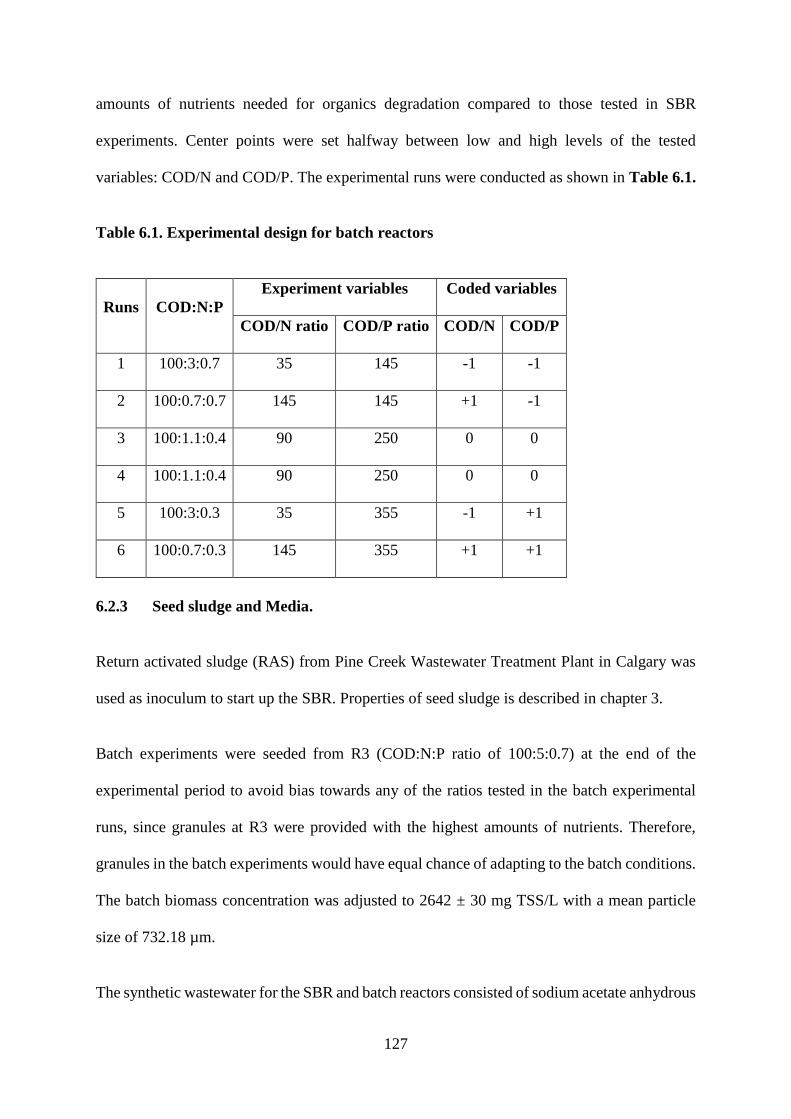


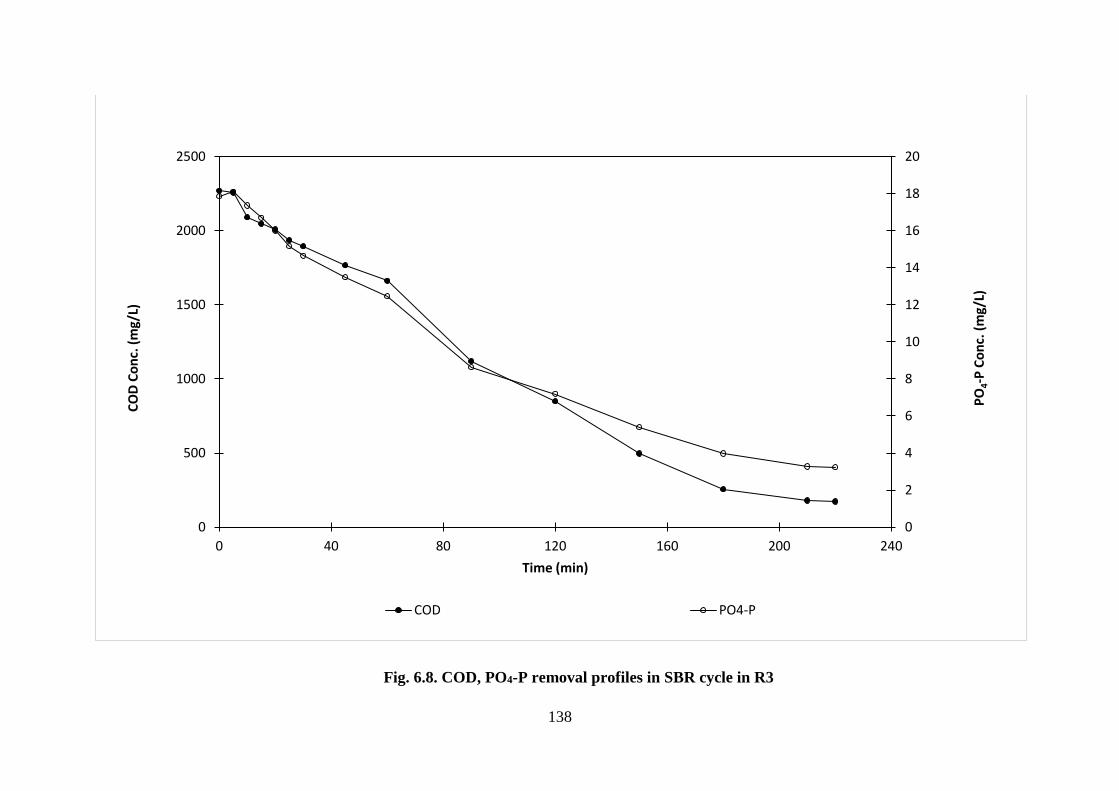


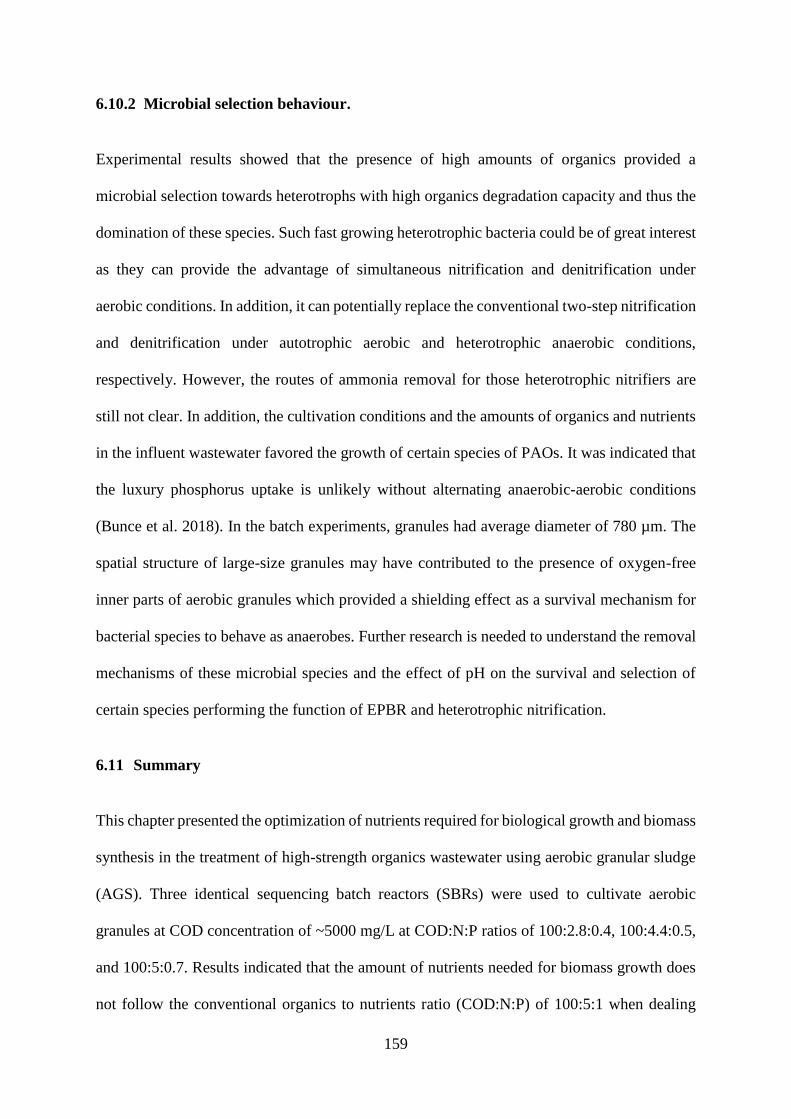


![Index [ftp.feq.ufu.br]ftp.feq.ufu.br/Luis_Claudio/Books/E-Books... · Aeration-agitation 20, 46 Aeration-agitation bioreactor 58, 62 Aerobic fermentation 3, 18 1 Aerobic metabolic](https://static.documents.pub/doc/80x56/5ecd4084c5979741945851bb/index-ftpfequfubrftpfequfubrluisclaudiobookse-books-aeration-agitation.jpg)


![[-]GDG UPFLOW GAS FURNACE Form 92-21650-34-04...Title [-]GDG UPFLOW GAS FURNACE Form 92-21650-34-04 Subject: GAS FURNACE UPFLOW Keywords: GDG, GAS, UPFLOW, FURNACE, [-]GDG, 92-21650-34-04](https://static.documents.pub/doc/80x56/60adbca1a05ef2753c1c4a21/-gdg-upflow-gas-furnace-form-92-21650-34-04-title-gdg-upflow-gas-furnace.jpg)


