DG MediaMind Mobile Benchmarks Every day, consumers depend more on mobile technology for their media, day-to-day communications and connections to the world. The proportion of time spent on mobile versus other devices is rising fast. These trends — along with the unique opportunities offered by location-based technologies — have made mobile marketing a crucial priority for advertisers and a vital part of the marketing mix. As a result, marketers are looking for deeper understanding of what works in mobile — what features, formats and strategies get the best results with the mobile consumer. MediaMind recently analyzed more than two billion impressions across more than one thousand mobile campaigns delivered in 2013 in order to quantify the relative performance of mobile ads. In particular, this benchmark study focuses on the performance of mobile formats and features within key verticals, with the goal of providing insight into the most effective mobile advertising strategies for brand advertisers. OVERVIEW
Transcript
DG MediaMind Mobile Benchmarks
Every day, consumers depend more on mobile technology for their media, day-to-day communications and connections to the world. The proportion of time spent on mobile versus other devices is rising fast.
These trends — along with the unique opportunities offered by location-based technologies — have made mobile marketing a crucial priority for advertisers and a vital part of the marketing mix. As a result, marketers are looking for deeper understanding of what works in mobile — what features, formats and strategies get the best results with the mobile consumer.
MediaMind recently analyzed more than two billion impressions across more than one thousand mobile campaigns delivered in 2013 in order to quantify the relative performance of mobile ads. In particular, this benchmark study focuses on the performance of mobile formats and features within key verticals, with the goal of providing insight into the most effective mobile advertising strategies for brand advertisers.
o v e r v i e w
Retail 0.52%
Entertainment 0.40%
CPG 0.31%
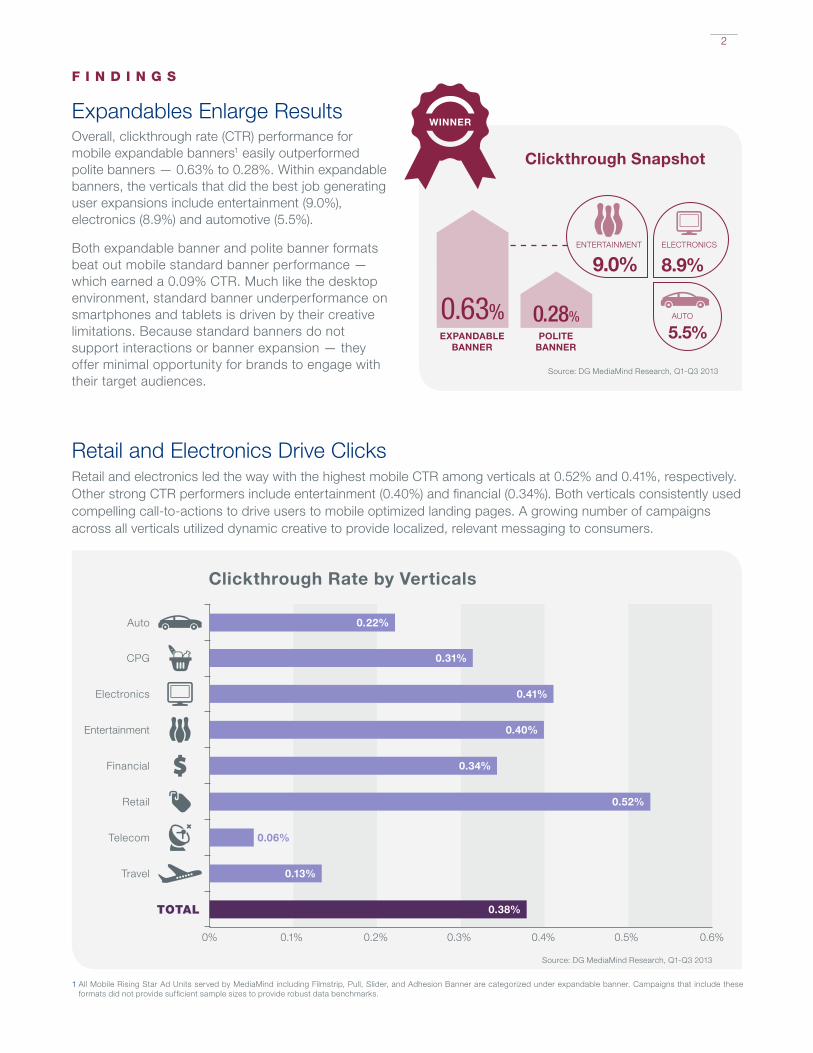
Expandables Enlarge ResultsOverall, clickthrough rate (CTR) performance for mobile expandable banners1 easily outperformed polite banners — 0.63% to 0.28%. Within expandable banners, the verticals that did the best job generating user expansions include entertainment (9.0%), electronics (8.9%) and automotive (5.5%).
Both expandable banner and polite banner formats beat out mobile standard banner performance — which earned a 0.09% CTR. Much like the desktop environment, standard banner underperformance on smartphones and tablets is driven by their creative limitations. Because standard banners do not support interactions or banner expansion — they offer minimal opportunity for brands to engage with their target audiences.
Retail and Electronics Drive ClicksRetail and electronics led the way with the highest mobile CTR among verticals at 0.52% and 0.41%, respectively. Other strong CTR performers include entertainment (0.40%) and financial (0.34%). Both verticals consistently used compelling call-to-actions to drive users to mobile optimized landing pages. A growing number of campaigns across all verticals utilized dynamic creative to provide localized, relevant messaging to consumers.
2
Clickthrough Rate by Verticals
0.4%0.2% 0.6%0.1%0% 0.5%0.3%
F i n d i n g s
WINNER
0.28% 0.63% PolItE
BaNNERExPaNdaBlE
BaNNER
EnTERTAInMEnT ElECTROnICs
AuTO
9.0% 8.9%
5.5%
Clickthrough Snapshot
source: DG MediaMind Research, Q1-Q3 2013
source: DG MediaMind Research, Q1-Q3 2013
1 All Mobile Rising star Ad units served by MediaMind including Filmstrip, Pull, slider, and Adhesion Banner are categorized under expandable banner. Campaigns that include these formats did not provide sufficient sample sizes to provide robust data benchmarks.
Electronics 0.41%
Auto 0.22%
Financial 0.34%
Telecom 0.06%
Travel 0.13%
TOTAL 0.38%
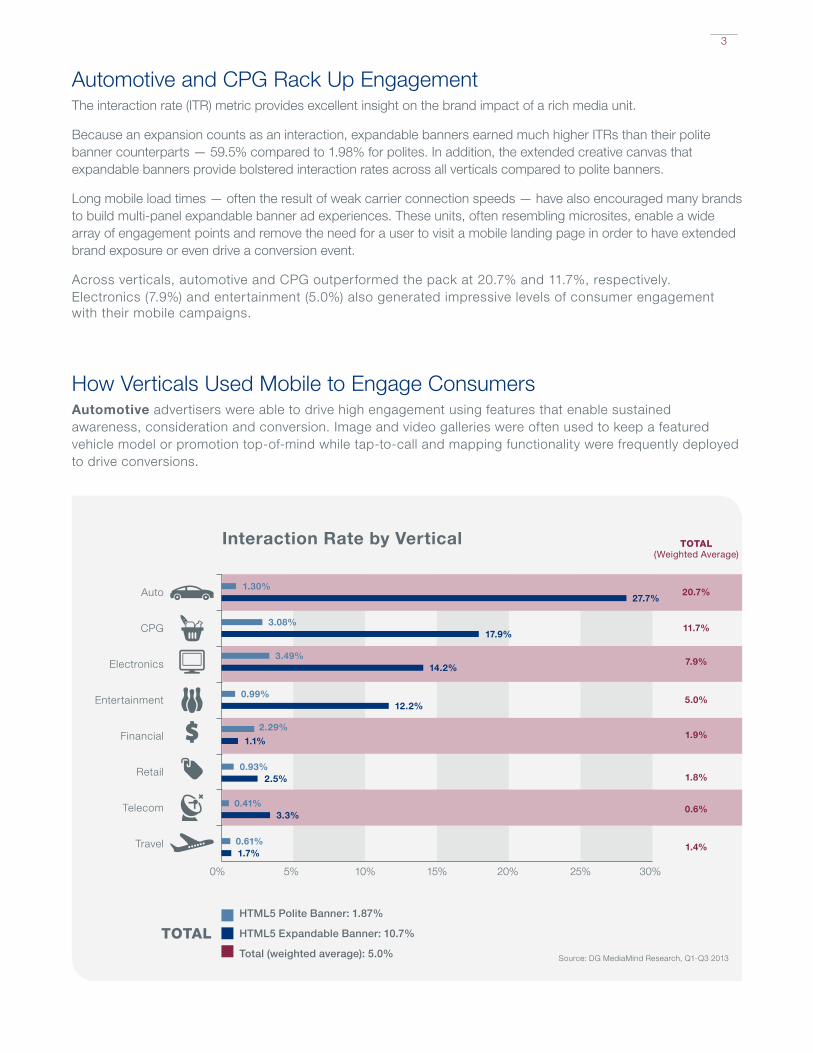
Automotive and CPG Rack up Engagement The interaction rate (ITR) metric provides excellent insight on the brand impact of a rich media unit.
Because an expansion counts as an interaction, expandable banners earned much higher ITRs than their polite banner counterparts — 59.5% compared to 1.98% for polites. In addition, the extended creative canvas that expandable banners provide bolstered interaction rates across all verticals compared to polite banners.
long mobile load times — often the result of weak carrier connection speeds — have also encouraged many brands to build multi-panel expandable banner ad experiences. These units, often resembling microsites, enable a wide array of engagement points and remove the need for a user to visit a mobile landing page in order to have extended brand exposure or even drive a conversion event.
Across verticals, automotive and CPG outperformed the pack at 20.7% and 11.7%, respectively. Electronics (7.9%) and entertainment (5.0%) also generated impressive levels of consumer engagement with their mobile campaigns.
How Verticals used Mobile to Engage Consumersautomotive advertisers were able to drive high engagement using features that enable sustained awareness, consideration and conversion. Image and video galleries were often used to keep a featured vehicle model or promotion top-of-mind while tap-to-call and mapping functionality were frequently deployed to drive conversions.
Interaction Rate by Vertical
ToTAL
source: DG MediaMind Research, Q1-Q3 2013
3
HTML5 Polite Banner: 1.87%
HTML5 Expandable Banner: 10.7%
Total (weighted average): 5.0%
20%10% 30%5% 25%15%0%
ToTAL(Weighted Average)
20.7%Auto1.30%
27.7%
11.7%CPG3.08%
17.9%
7.9%Electronics3.49%
14.2%
5.0%Entertainment0.99%
12.2%
1.9%2.29%
Financial 1.1%
1.8%2.5%Retail 0.93%
0.6%3.3%
Telecom 0.41%
1.4%Travel 0.61%1.7%
4
CPG brand campaign objectives were regularly aimed at awareness and consideration. Image galleries, video players and social sharing functionality propelled meaningful engagement rates and time spent withinin ad units. Coupon download functionality was also frequently used across the vertical. CPG advertisers most consistently combined multiple rich media features within a single unit — which translated into a higher interaction rate compared to most other analyzed verticals.
Electronics advertisers employed mobile to drive both awareness of new products and push traffic to brick-and-mortar locations for offline purchase conversion. In addition to galleries that highlight new launches and product features — mapping functionality was regularly deployed to spur in-store visits. Electronic brands often used device accelerometer functionality allowing user gestures to trigger actions within games, 360-degree product showcases and other engaging features.
Promoting sustained in-market presence was the primary campaign objective for entertainment advertisers. Videos and social sharing were successfully used to increase brand awareness. A secondary goal for entertainment vertical brand was promotion of a product launch or release. Mapping functionality and app download were commonly used actions to drive these objectives.
The most important performance indicator for retail advertisers was to drive in-store traffic. location/mapping, weather and download app were the features most often leveraged across the vertical to propel consumers to brick-and-mortar locations. App download and clickthrough actions to mobile optimized sites were the preferred tactics used by retail advertisers to increase site traffic. Dynamic creative was consistently deployed across retail campaigns to provide customized messaging to specific audience segments.
Increasing brand affinity and branded application usage was the principle campaign objectives observed for financial advertisers. App download functionality was commonly used to drive acquisition of banking application users. Among other tactics, rich media animation was commonly deployed to create impactful messaging to raise a consumer’s brand awareness.
Driving traffic to mobile websites and branded applications — predominantly for trip searches — was the primary campaign objective observed in the travel vertical. App download functionality and mobile site clickthroughs were successfully used to drive increased trip search volumes through acquisition of app users and compelling clickthrough call-to-actions (CTAs). Dynamic creative was often used to deliver targeted, relevant messaging to localized audiences.
The most commonly observed objective for telecom advertisers was sustained in-market awareness for new model releases and lead generation for remarketing efforts. Image and video galleries were regularly deployed for product showcases. Forms were regularly featured for list building and to support remarketing objectives. location/mapping was the preferred tactic to drive in-store traffic; a secondary objective observed across the vertical.
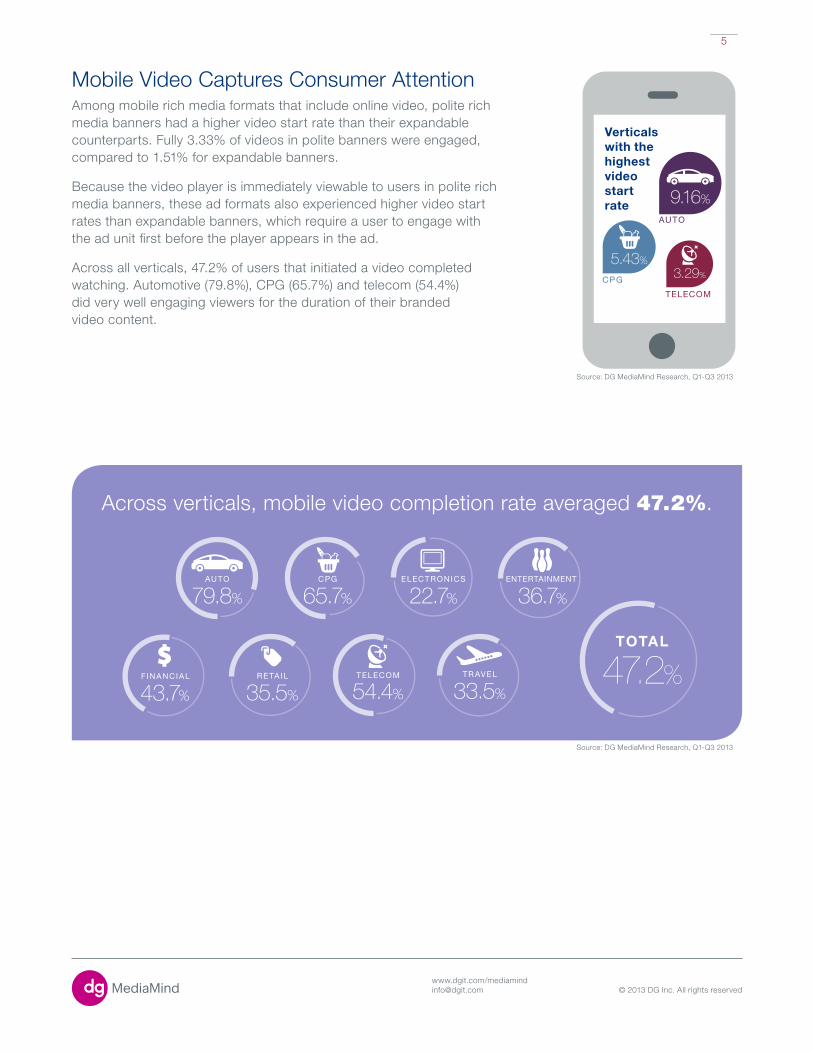
Mobile Video Captures Consumer Attention Among mobile rich media formats that include online video, polite rich media banners had a higher video start rate than their expandable counterparts. Fully 3.33% of videos in polite banners were engaged, compared to 1.51% for expandable banners.
Because the video player is immediately viewable to users in polite rich media banners, these ad formats also experienced higher video start rates than expandable banners, which require a user to engage with the ad unit first before the player appears in the ad.
Across all verticals, 47.2% of users that initiated a video completed watching. Automotive (79.8%), CPG (65.7%) and telecom (54.4%) did very well engaging viewers for the duration of their branded video content.
Verticals with the highest videostart rate
5.43%CPG
9.16%
3.29%
source: DG MediaMind Research, Q1-Q3 2013
Auto
teleCom
Across verticals, mobile video completion rate averaged 47.2%.