©CSIRO 2016 ©CSIRO 2015 Environ. Chem. 2016, 13, 590–601
doi:10.1071/EN15129_AC
Page 1 of 13
Supplementary material
Dialkylsulfate formation in sulfuric acid-seeded secondary organic aerosol produced using
an outdoor chamber under natural sunlight
Jiaying Li,A Myoseon Jang
A,B and Ross L. Beardsley
A
ADepartment of Environmental Engineering Sciences, University of Florida, PO Box 116450, Gainesville,
FL 32611, USA.
BCorresponding author. Email: [email protected]
Calibration of the C-RUV method for measuring [H+] in aerosol
In the present study, aerosol acidity was measured using colorimetry integrated with a reflectance UV-
visible spectrometer (C-RUV),[1,2]
which is an optical technique and directly measures the proton
concentration ([H+], mol L
–1) of the NH4
+–H
+–SO4
2––H2O aerosol collected on the filter without heating
or solvent extraction. Aerosols were collected on a 13-mm-diameter sampling filter (Gelman Science
Palflex, TX40H120-WW) that was dyed with an indicator (0.02 % aqueous solution of metanil yellow
(Sigma–Aldrich)) before aerosol collection. The UV-visible spectrum of metanil yellow in the presence of
acidic aerosol was monitored by reflectance UV-visible spectroscopy (Lambda 35 UV WinLab V5.2,
PerkinElmer) coupled with an integrating sphere attachment (50-mm integrating Sphere Lambda 2–40).
The RH was varied from 20 to 90 % with the aerosol filter sample exposed to the air in a small flow
chamber inside of the UV-visible spectrometer. The proton concentration within the aerosol can be
measured in terms of the colour change of the indicator on the filter.
(S1)
where is the UV absorbance of protonated metanil yellow, which peaks at 545 nm, α is the
coefficient of proportionality between the amount of the dye that interacts with acidic aerosols and the
mass of inorganic aerosol (Minorg) collected on the filter, m is the unknown constant characteristic of the
dye (metanil yellow) in the sulfuric acid system, and is the negative base-ten logarithm of the acid
dissociation constant of the dye.
To calibrate the C-RUV technique, different amounts of NH4H3(SO4)2 aerosol and (NH4)7H13(SO4)10
aerosol were collected on the filter dyed with metanil yellow. The of the aerosol under various RHs
was monitored using the C-RUV method. The effect of humidity on the aerosol mass, which is due to the
aerosol water content equilibrating with the ambient moisture, was estimated using E-AIM Model II. The
proton concentrations of the aerosols used in the calibration were directly predicted using E-AIM Model
©CSIRO 2016 ©CSIRO 2015 Environ. Chem. 2016
doi:10.1071/EN15129_AC
Page 2 of 13
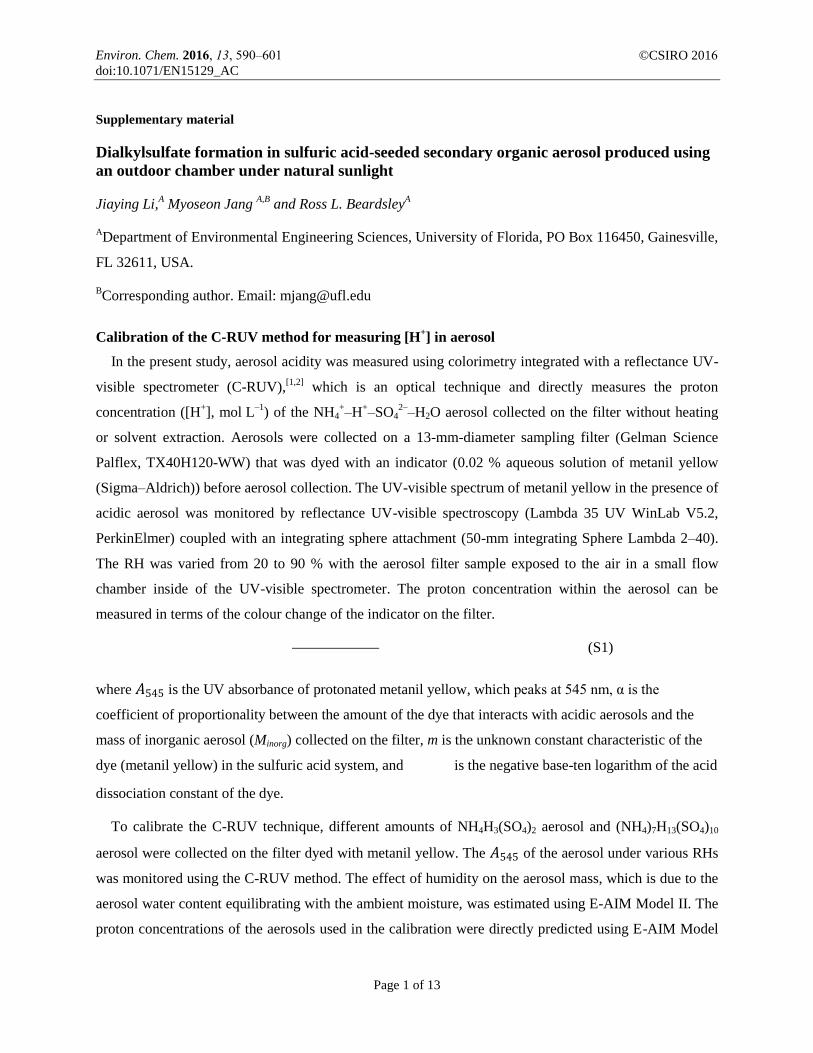
II for a given aerosol chemical composition and RH. To obtain the calibration curve with Eqn S1, three
parameters (α, m and ) were optimised to 28 data points using a solver. The resulting α was 0.105,
m was 0.149 and was –1.542. The proton concentration predicted using E-AIM Model II was
plotted v. the calculated proton concentration from Eqn S1 using the C-RUV method in Fig. S1. A good
linear fit (R2 = 0.83) was observed between the E-AIM Model II prediction and the C-RUV method.
Fig. S1. The correlation of proton concentrations predicted by E-AIM Model II v. that measured using the C-RUV
technique.
FTIR setup for aerosol analysis
To experimentally determine the SOA product composition, a Fourier-transform infrared (FTIR)
spectrometer (Nicolet Magma 560) equipped with a small flow chamber (0030–104, Thermo Spectra-
Tech) that holds an optical window for aerosols collected by impaction (Fig. S2) was used to characterise
functional groups of organic compounds in the SOA.[3,4]
The number of FTIR scans is 32 and the
wavelength ranged from 400 to 4000 cm–1
. The FTIR window was weighed using an analytical balance
(MX5 Mettler-Toledo Ltd) before and after particle impaction to measure the mass of the particle sample.
The RH inside the flow chamber was controlled by combining humid air from a water bubbler and dry air
from an air tank (breathing air, Airgas) with a total air flow rate of 0.6–1.2 L min–1
. The RH and
temperature of the chamber air were measured with a hygrometer (Dwyer series 485).
y = 0.9896x R² = 0.8301
0
2
4
6
8
10
12
0 2 4 6 8 10 12
[H+] (mol L–1) ˗
[H+] (m
ol L
–1) ˗
C-R
UV
©CSIRO 2016 ©CSIRO 2015 Environ. Chem. 2016
doi:10.1071/EN15129_AC
Page 3 of 13
Fig. S2. The experimental set-up for the FTIR studies using a flow chamber.
Analysis of thermodynamically preferred neutral structures in the internally mixed sucrose–
NH4HSO4 (1 : 3 molar ratio) particle using the FTIR spectrometer
The FTIR spectra of sucrose and diethylsulfate were also recorded to provide references for the FTIR
peak assignments (Table S1).
Fig. S3. FTIR spectrum of sucrose on the silicon disc. The number of FTIR scans is 32 and the FTIR wavelength
ranged from 400 to 4000 cm–1
.
0
0.3
0.6
0.9
1.2
700 1200 1700 2200 2700 3200 3700
Wavenumer (cm-1)
Ab
so
rban
ce
v(O-H)
v(C-H)
v(C-O)
v(H2O)
©CSIRO 2016 ©CSIRO 2015 Environ. Chem. 2016
doi:10.1071/EN15129_AC
Page 4 of 13
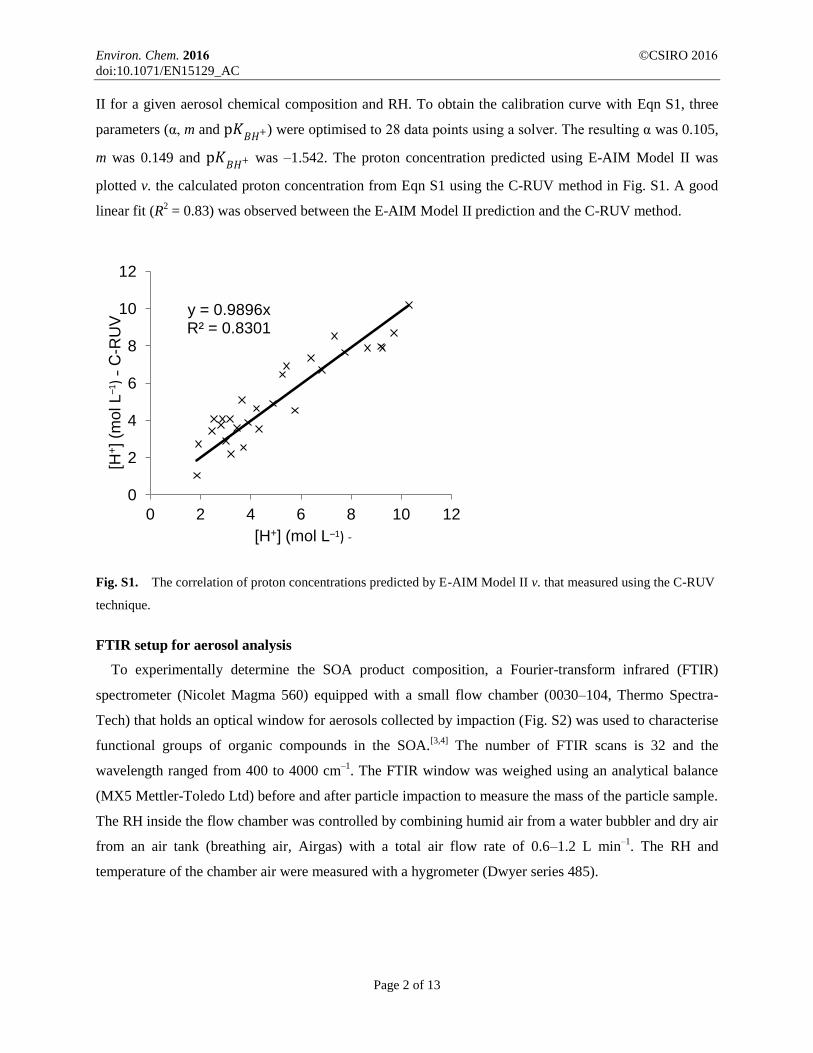
Fig. S4. FTIR spectrum of diethylsulfate on the silicon disc. The number of FTIR scans is 32 and the FTIR
wavelength ranged from 400 to 4000 cm–1
.
Table S1. FTIR peak assignments of functional groups (underlined) in the internally mixed
sucrose–NH4HSO4 aerosol
Functional group FTIR absorbance (cm–1
) Reference compound
R–C–O–S(O2)–O–R′ 1190, 1000, 827 Diethyl sulfate (Fig. S4), dimethyl
sulfate[5]
R–O–S(O2)–O– 1290, 1250, 1080, 1020, 770 Methyl sulfate sodium salt
[6] –C–O– 1120, 1040, 922 Sucrose (Fig. S3) NH4HSO4 3220, 3096, 1420 NH4HSO4
[7] NH4HSO4 1168, 1037, 858 NH4HSO4
[7]
(NH4)2SO4 3220, 3096, 1420 (NH4)2SO4[8]
(NH4)2SO4 1083 (NH4)2SO4[5]
©CSIRO 2016 ©CSIRO 2015 Environ. Chem. 2016
doi:10.1071/EN15129_AC
Page 5 of 13
Fig. S5. FTIR spectra of the internally mixed sucrose–NH4HSO4 (1 : 3 in mole ratio) aerosol as a function of
reaction time.
As shown in Fig S5, the FTIR absorbance spectra of the internally mixed sucrose–NH4HSO4 (1:3 mole
ratio) aerosol changed over the course of the reaction of sucrose and NH4HSO4. The characteristic
bisulfate peaks (1168 and 1037 cm–1
) decreased with time, while characteristic peaks associated with the
formation of (NH4)2SO4 (sulfate at 1083 cm–1
) and dialkylsulfates (orgnaosulfate peaks at 1190, 1000 and
827 cm–1
) increased. FTIR data suggest that in the ammonium-rich sulfate system, the formation of the
mixture of dialkylsulfates and ammonium sulfate is preferred to the formation of ammonium alkylsulfate
(NH4SO3OR, IR peaks at 1290, 1250 and 770 cm–1
). Although FTIR can measure the fractional change in
aerosol composition (Fig. S5), FTIR is not an effective method for quantifying the organosulfates. The
FTIR peaks of organosulfates overlap with those of inorganic sulfates (Table S1) and other organic
compounds at less than 1200 cm–1
(Fig. S3).
©CSIRO 2016 ©CSIRO 2015 Environ. Chem. 2016
doi:10.1071/EN15129_AC
Page 6 of 13
Mechanisms for organosulfate formation in aerosol
Eqns S2–S11 below describe the reaction mechanisms of the formation of dialkylsulfates by the
reactions of acidic sulfate (H2SO4 or NH4HSO4) with alcohols.
H2SO4 H+
+ HSO4– (S2)
RCH2OH + H+ RCH2OH2
+ (S3)
HSO4–+ RCH2OH2
+ RCH2OSO3H + H2O (S4)
RCH2OSO3H H+
+ RCH2OSO3 – (S5)
RCH2OH + H+ RCH2OH2
+ (S6)
RCH2OSO3– +RCH2OH2
+ RCH2OSO2OCH2R + H2O (S7)
2NH4HSO4 2NH4+
+ 2HSO4– (S8)
HSO4– H
+ + SO4
2– (S9)
SO42–
+ 2NH4+ (NH4)2SO4 (S10)
For the reaction mechanisms Eqns S3 to S10, the net reaction is written as:
2NH4HSO4+ 2ROH (NH4)2SO4 + ROSO2OR + 2H2O (S11)
SOA functional group characterisation using FTIR
To experimentally determine SOA product composition, α-pinene SOA and toluene SOA were
collected on the silicon disc and analysed using FTIR (Fig. S2). The FTIR spectra of the SOA samples
were decoupled with a curve-fitting method assuming a Gaussian peak. The FTIR peaks used to
determine the functional groups are summarised in Table S2.
©CSIRO 2016 ©CSIRO 2015 Environ. Chem. 2016
doi:10.1071/EN15129_AC
Page 7 of 13
Table S2. Model organic compounds used for the analysis of the functional group distribution of
SOA products using FTIR
The FTIR peak assignments of major functional groups of model compounds are also listed
Compound Functional group and absorbance wavelength used for FTIR calibration
2-methylprop-1-ene –C–H (2800–3100 cm–1
, 1350–1480 cm–1
)
n-Pentane –C–H (2800–3100 cm–1
, 1350–1480 cm–1
)
2-Methyl-1-butene –C–H (2800–3100 cm–1
, 1350–1480 cm–1
)
n-Hexane –C–H (2800–3100 cm–1
, 1350–1480 cm–1
)
Propanoic acid –C–H (2800–3100 cm–1
, 1350–1480 cm–1
), –COOH (2400–3400 cm–1
,
1680–1720 cm–1
, 1060–1220 cm–1
)
Butanoic acid –C–H (2800–3100 cm–1
, 1350–1480 cm–1
), –COOH (2400–3400 cm–1
,
1680–1720 cm–1
, 1060–1220 cm–1
)
Hexanoic acid –C–H (2800–3100 cm–1
, 1350–1480 cm–1
), –COOH (2400–3400 cm–1
,
1680–1720 cm–1
, 1060–1220 cm–1
)
Formic acid –C–H (2800–3100 cm–1
, 1350–1480 cm–1
), –COOH (2400–3400 cm–1
,
1680–1720 cm–1
, 1060–1220 cm–1
)
cis-Pinonic acid –C–H (2800–3100 cm–1
, 1350–1480 cm–1
), –COOH (2400–3400 cm–1
,
1680–1720 cm–1
, 1060–1220 cm–1
)
Octanoic acid –C–H (2800–3100 cm–1
, 1350–1480 cm–1
), –COOH (2400–3400 cm–1
,
1680–1720 cm–1
, 1060–1220 cm–1
)
2-Butanone –C–H (2800–3100 cm–1
, 1350–1480 cm–1
), –C=O (1680–1720 cm–1
,
1060–1220 cm–1
)
Methylvinylketone –C–H (2800–3100 cm–1
, 1350–1480 cm–1
), –C=O (1680–1720 cm–1
,
1060–1220 cm–1
)
4-Ethylcyclohexanone –C–H (2800–3100 cm–1
, 1350–1480 cm–1
), –C=O (1680–1720 cm–1
,
1060–1220 cm–1
)
4-Hydroxy-2-butanone –C–H (2800–3100 cm–1
, 1350–1480 cm–1
), –C=O (1680–1720 cm–1
,
1060–1220 cm–1
)
2-Hydroxyl-3-pinanone –C–H (2800–3100 cm–1
, 1350–1480 cm–1
), –C=O (1680–1720 cm–1
,
1060–1220 cm–1
)
2,5-Hexanedione –C–H (2800–3100 cm–1
, 1350–1480 cm–1
), –C=O (1680–1720 cm–1
,
1060–1220 cm–1
)
2,5-Dimethylhexanal –C–H (2800–3100 cm–1
, 1350–1480 cm–1
), –C=O (1680–1720 cm–1
,
1060–1220 cm–1
)
Benzaldehyde –C–H (2800–3100 cm–1
, 1350–1480 cm–1
), –C=O (1680–1720 cm–1
,
1060–1220 cm–1
)
n-Butanal –C–H (2800–3100 cm–1
, 1350–1480 cm–1
), –C=O (1680–1720 cm–1
,
1060–1220 cm–1
)
Octylaldehyde –C–H (2800–3100 cm–1
, 1350–1480 cm–1
), –C=O (1680–1720 cm–1
,
1060–1220 cm–1
)
3-Methylbenzyl-alcohol –C–H (2800–3100 cm–1
, 1350–1480 cm–1
), –C–OH (3000–3600 cm–1
,
1060–1220 cm–1
)
1-Butanol –C–H (2800–3100 cm–1
, 1350–1480 cm–1
), –C–OH (3000–3600 cm–1
,
1060–1220 cm–1
)
4-Hydroxyl-2-butanone –C–H (2800–3100 cm–1
, 1350–1480 cm–1
), –C–OH (3000–3600 cm–1
,
1060–1220 cm–1
)
2-Hydroxyl-3-pinanone –C–H (2800–3100 cm–1
, 1350–1480 cm–1
), –C–OH (3000–3600 cm–1
,
1060–1220 cm–1
)
©CSIRO 2016 ©CSIRO 2015 Environ. Chem. 2016
doi:10.1071/EN15129_AC
Page 8 of 13
Compound Functional group and absorbance wavelength used for FTIR calibration
1-Octanol –C–H (2800–3100 cm–1
, 1350–1480 cm–1
), –C–OH (3000–3600 cm–1
,
1060–1220 cm–1
)
Sucrose –C–H (2800–3100 cm–1
, 1350–1480 cm–1
), –C–O (1060–1220 cm–1
)
Acetic acid butyl ester –C–H (2800–3100 cm–1
, 1350–1480 cm–1
), –C–O (1060–1220 cm–1
)
Ethyl acetate –C–H (2800–3100 cm–1
, 1350–1480 cm–1
), –C–O (1060–1220 cm–1
)
Ethyl benzoate –C–H (2800–3100 cm–1
, 1350–1480 cm–1
), –C–O (1060–1220 cm–1
)
Ammonium sulfate –N–H (1350–1480 cm–1
, 3000–3600 cm–1
), –HSO4 (1250–1080 cm–1
),
H2O (3200–3800 cm–1
, 1550–1800 cm–1
)
Ammonium nitrate –N–H (1350–1480 cm–1
, 3000–3600 cm–1
), H2O (3200–3800 cm–1
,
1550–1800 cm–1
)
Sodium chloride H2O (3200–3800 cm–1
, 1550–1800 cm–1
)
The number of moles of each functional group (n) in the aerosol sample was estimated using the
integrated peak area (A) of the decoupled peak of the aerosol sample and that of standard compounds (As).
The compounds used in the FTIR calibration are listed in Table S2. An aliphatic –C–H stretching band
was quantified using the peak at 2800–3100 cm–1
.
n(–C–H) = (S12)
Ammonium was quantified using the N–H absorbance at 1426 cm–1
.
n(–N–H) = (S13)
Then carboxylic acids and alcohols can be quantified.
n(–COOH) = (S14)
n(–C–OH) = (S15)
Distinction between aldehydes and ketones was not possible because the weak C–H absorbance of
aldehydes (2720–2820 cm–1
) could not be observed in any of the SOA spectra. Thus, aldehydes and
ketones were quantified as a group (–C=O).
n(–C=O) –
(S16)
The feasibility of the FTIR method was tested for pinic acid, pinonaldehyde and phenol. A good
agreement was found between the estimated functional group distribution and the molecular structures of
model compounds (Table S3).
©CSIRO 2016 ©CSIRO 2015 Environ. Chem. 2016
doi:10.1071/EN15129_AC
Page 9 of 13
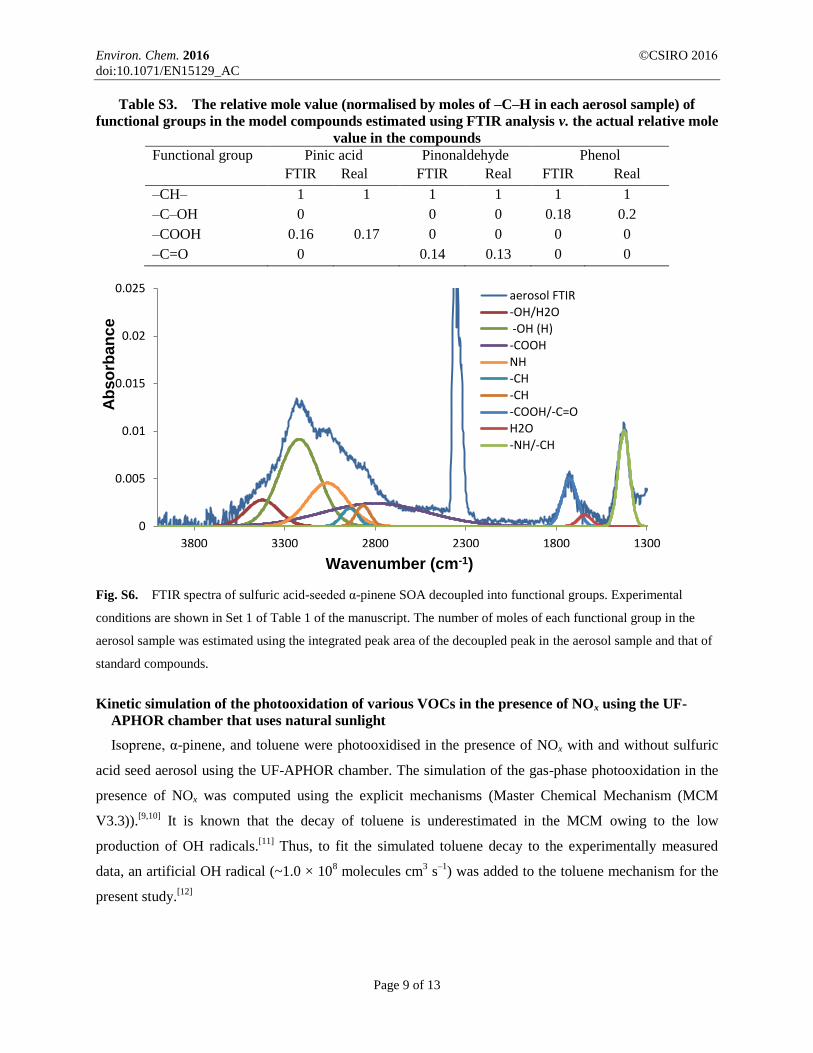
Table S3. The relative mole value (normalised by moles of –C–H in each aerosol sample) of
functional groups in the model compounds estimated using FTIR analysis v. the actual relative mole
value in the compounds
Functional group Pinic acid Pinonaldehyde Phenol
FTIR Real FTIR Real FTIR Real
–CH– 1 1 1 1 1 1
–C–OH 0 0 0 0.18 0.2
–COOH 0.16 0.17 0 0 0 0
–C=O 0 0.14 0.13 0 0
Fig. S6. FTIR spectra of sulfuric acid-seeded α-pinene SOA decoupled into functional groups. Experimental
conditions are shown in Set 1 of Table 1 of the manuscript. The number of moles of each functional group in the
aerosol sample was estimated using the integrated peak area of the decoupled peak in the aerosol sample and that of
standard compounds.
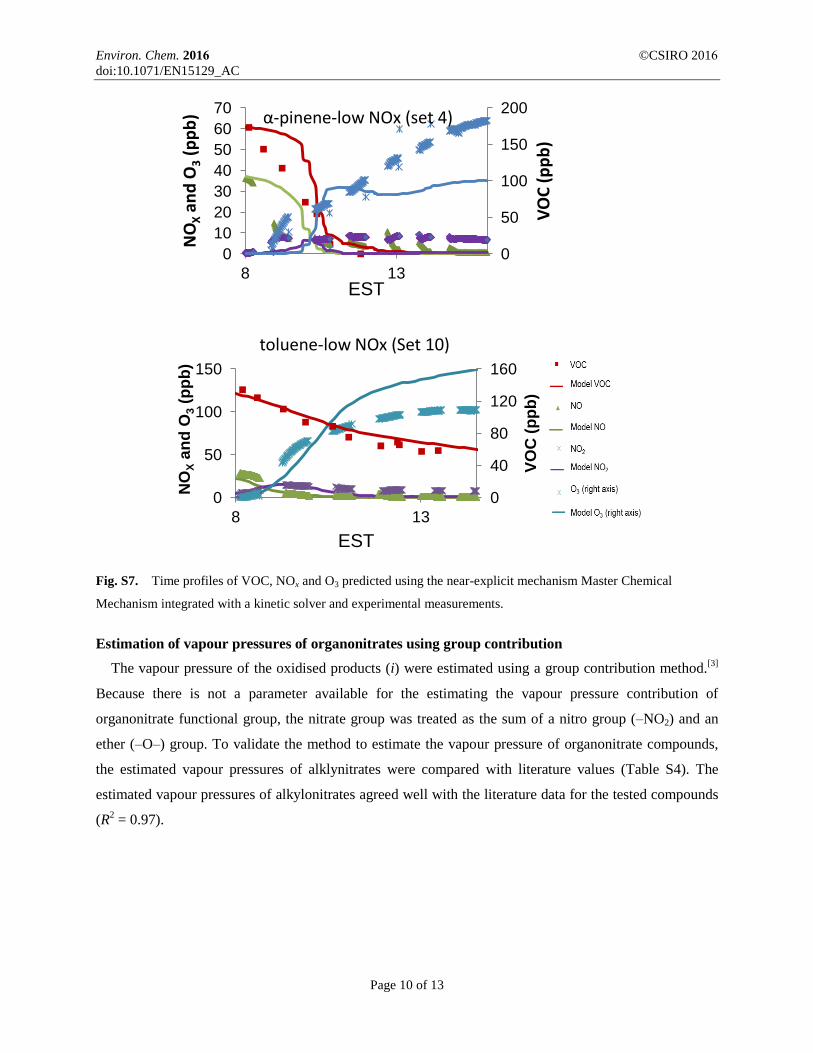
Kinetic simulation of the photooxidation of various VOCs in the presence of NOx using the UF-
APHOR chamber that uses natural sunlight
Isoprene, α-pinene, and toluene were photooxidised in the presence of NOx with and without sulfuric
acid seed aerosol using the UF-APHOR chamber. The simulation of the gas-phase photooxidation in the
presence of NOx was computed using the explicit mechanisms (Master Chemical Mechanism (MCM
V3.3)).[9,10]
It is known that the decay of toluene is underestimated in the MCM owing to the low
production of OH radicals.[11]
Thus, to fit the simulated toluene decay to the experimentally measured
data, an artificial OH radical (~1.0 × 10⁸ molecules cm
3 s
–1) was added to the toluene mechanism for the
present study.[12]
0
0.005
0.01
0.015
0.02
0.025
1300 1800 2300 2800 3300 3800
aerosol FTIR
-OH/H2O
-OH (H)
-COOH
NH
-CH
-CH
-COOH/-C=O
H2O
-NH/-CH
Ab
so
rban
ce
Wavenumber (cm-1)
©CSIRO 2016 ©CSIRO 2015 Environ. Chem. 2016
doi:10.1071/EN15129_AC
Page 10 of 13
Fig. S7. Time profiles of VOC, NOx and O3 predicted using the near-explicit mechanism Master Chemical
Mechanism integrated with a kinetic solver and experimental measurements.
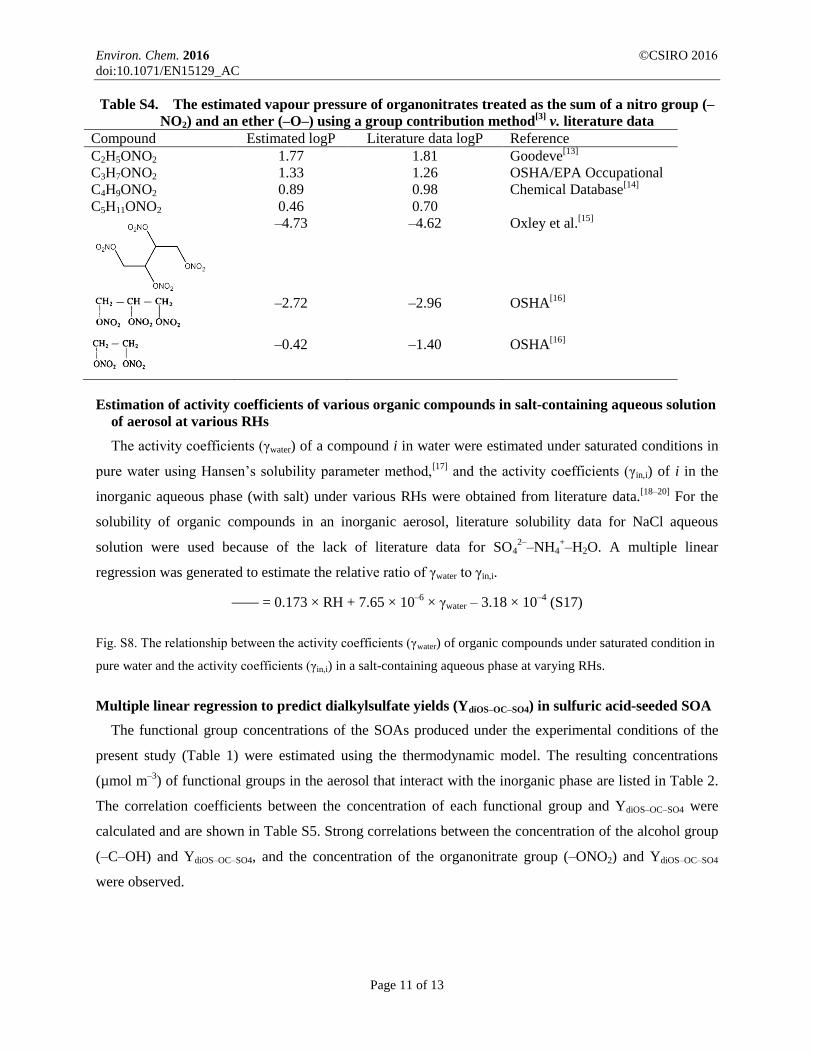
Estimation of vapour pressures of organonitrates using group contribution
The vapour pressure of the oxidised products (i) were estimated using a group contribution method.[3]
Because there is not a parameter available for the estimating the vapour pressure contribution of
organonitrate functional group, the nitrate group was treated as the sum of a nitro group (–NO2) and an
ether (–O–) group. To validate the method to estimate the vapour pressure of organonitrate compounds,
the estimated vapour pressures of alklynitrates were compared with literature values (Table S4). The
estimated vapour pressures of alkylonitrates agreed well with the literature data for the tested compounds
(R2 = 0.97).
0
50
100
150
200
0
10
20
30
40
50
60
70
8 13
VO
C (
pp
b)
NO
X a
nd
O3 (
pp
b)
EST
α-pinene-low NOx (set 4)
0
40
80
120
160
0
50
100
150
8 13 V
OC
(p
pb
)
NO
X a
nd
O3 (
pp
b)
EST
toluene-low NOx (Set 10)
©CSIRO 2016 ©CSIRO 2015 Environ. Chem. 2016
doi:10.1071/EN15129_AC
Page 11 of 13
Table S4. The estimated vapour pressure of organonitrates treated as the sum of a nitro group (–
NO2) and an ether (–O–) using a group contribution method[3]
v. literature data
Compound Estimated logP Literature data logP Reference C2H5ONO2 1.77 1.81 Goodeve
[13]
C3H7ONO2 1.33 1.26 OSHA/EPA Occupational
Chemical Database[14]
C4H9ONO2 0.89 0.98 C5H11ONO2 0.46 0.70
–4.73 –4.62 Oxley et al.[15]
–2.72 –2.96 OSHA[16]
–0.42 –1.40 OSHA[16]
Estimation of activity coefficients of various organic compounds in salt-containing aqueous solution
of aerosol at various RHs
The activity coefficients (γwater) of a compound i in water were estimated under saturated conditions in
pure water using Hansen’s solubility parameter method,[17]
and the activity coefficients (γin,i) of i in the
inorganic aqueous phase (with salt) under various RHs were obtained from literature data.[18–20]
For the
solubility of organic compounds in an inorganic aerosol, literature solubility data for NaCl aqueous
solution were used because of the lack of literature data for SO42–
–NH4+–H2O. A multiple linear
regression was generated to estimate the relative ratio of γwater to γin,i.
= 0.173 × RH + 7.65 × 10⁻⁶
× γwater – 3.18 × 10⁻⁴
(S17)
Fig. S8. The relationship between the activity coefficients (γwater) of organic compounds under saturated condition in
pure water and the activity coefficients (γin,i) in a salt-containing aqueous phase at varying RHs.
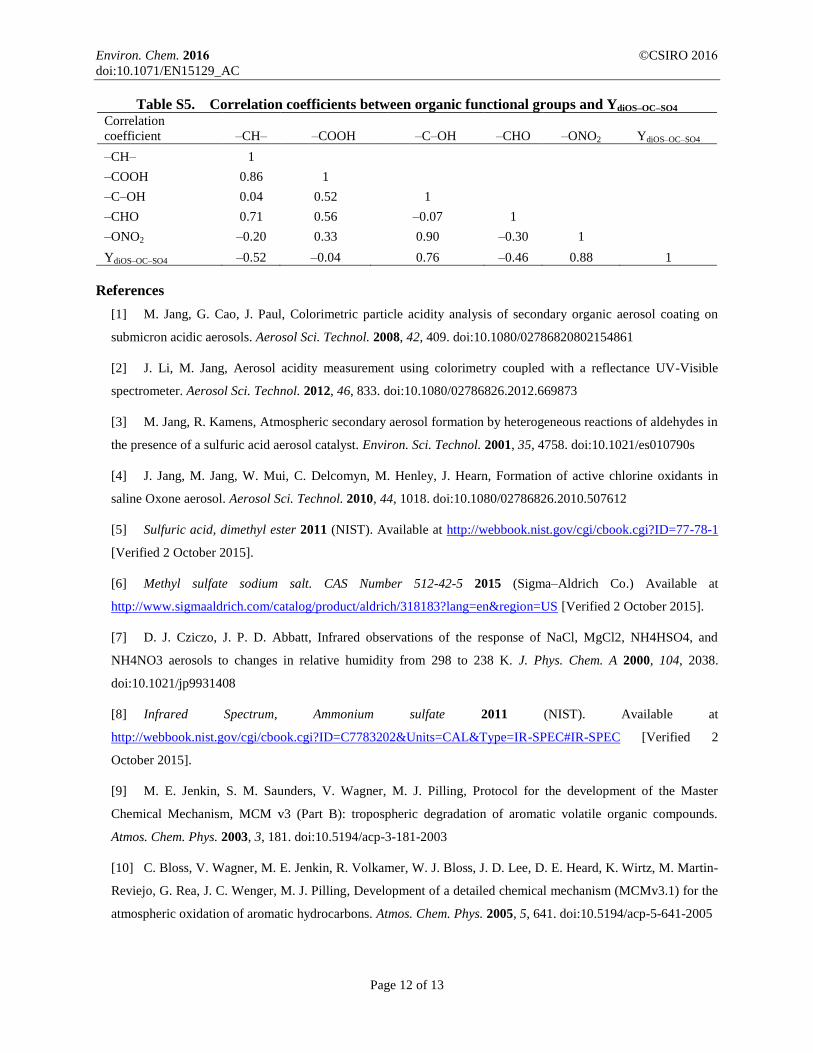
Multiple linear regression to predict dialkylsulfate yields (YdiOS–OC–SO4) in sulfuric acid-seeded SOA
The functional group concentrations of the SOAs produced under the experimental conditions of the
present study (Table 1) were estimated using the thermodynamic model. The resulting concentrations
(µmol m–3
) of functional groups in the aerosol that interact with the inorganic phase are listed in Table 2.
The correlation coefficients between the concentration of each functional group and YdiOS–OC–SO4 were
calculated and are shown in Table S5. Strong correlations between the concentration of the alcohol group
(–C–OH) and YdiOS–OC–SO4, and the concentration of the organonitrate group (–ONO2) and YdiOS–OC–SO4
were observed.
©CSIRO 2016 ©CSIRO 2015 Environ. Chem. 2016
doi:10.1071/EN15129_AC
Page 12 of 13
Table S5. Correlation coefficients between organic functional groups and YdiOS–OC–SO4 Correlation
coefficient –CH– –COOH –C–OH –CHO –ONO2 YdiOS–OC–SO4
–CH– 1
–COOH 0.86 1
–C–OH 0.04 0.52 1
–CHO 0.71 0.56 –0.07 1
–ONO2 –0.20 0.33 0.90 –0.30 1
YdiOS–OC–SO4 –0.52 –0.04 0.76 –0.46 0.88 1
References
[1] M. Jang, G. Cao, J. Paul, Colorimetric particle acidity analysis of secondary organic aerosol coating on
submicron acidic aerosols. Aerosol Sci. Technol. 2008, 42, 409. doi:10.1080/02786820802154861
[2] J. Li, M. Jang, Aerosol acidity measurement using colorimetry coupled with a reflectance UV-Visible
spectrometer. Aerosol Sci. Technol. 2012, 46, 833. doi:10.1080/02786826.2012.669873
[3] M. Jang, R. Kamens, Atmospheric secondary aerosol formation by heterogeneous reactions of aldehydes in
the presence of a sulfuric acid aerosol catalyst. Environ. Sci. Technol. 2001, 35, 4758. doi:10.1021/es010790s
[4] J. Jang, M. Jang, W. Mui, C. Delcomyn, M. Henley, J. Hearn, Formation of active chlorine oxidants in
saline Oxone aerosol. Aerosol Sci. Technol. 2010, 44, 1018. doi:10.1080/02786826.2010.507612
[5] Sulfuric acid, dimethyl ester 2011 (NIST). Available at http://webbook.nist.gov/cgi/cbook.cgi?ID=77-78-1
[Verified 2 October 2015].
[6] Methyl sulfate sodium salt. CAS Number 512-42-5 2015 (Sigma–Aldrich Co.) Available at
http://www.sigmaaldrich.com/catalog/product/aldrich/318183?lang=en®ion=US [Verified 2 October 2015].
[7] D. J. Cziczo, J. P. D. Abbatt, Infrared observations of the response of NaCl, MgCl2, NH4HSO4, and
NH4NO3 aerosols to changes in relative humidity from 298 to 238 K. J. Phys. Chem. A 2000, 104, 2038.
doi:10.1021/jp9931408
[8] Infrared Spectrum, Ammonium sulfate 2011 (NIST). Available at
http://webbook.nist.gov/cgi/cbook.cgi?ID=C7783202&Units=CAL&Type=IR-SPEC#IR-SPEC [Verified 2
October 2015].
[9] M. E. Jenkin, S. M. Saunders, V. Wagner, M. J. Pilling, Protocol for the development of the Master
Chemical Mechanism, MCM v3 (Part B): tropospheric degradation of aromatic volatile organic compounds.
Atmos. Chem. Phys. 2003, 3, 181. doi:10.5194/acp-3-181-2003
[10] C. Bloss, V. Wagner, M. E. Jenkin, R. Volkamer, W. J. Bloss, J. D. Lee, D. E. Heard, K. Wirtz, M. Martin-
Reviejo, G. Rea, J. C. Wenger, M. J. Pilling, Development of a detailed chemical mechanism (MCMv3.1) for the
atmospheric oxidation of aromatic hydrocarbons. Atmos. Chem. Phys. 2005, 5, 641. doi:10.5194/acp-5-641-2005
©CSIRO 2016 ©CSIRO 2015 Environ. Chem. 2016
doi:10.1071/EN15129_AC
Page 13 of 13
[11] V. Wagner, M. E. Jenkin, S. M. Saunders, J. Stanton, K. Wirtz, M. J. Pilling, Modelling of the
photooxidation of toluene: conceptual ideas for validating detailed mechanisms. Atmos. Chem. Phys. 2003, 3, 89.
doi:10.5194/acp-3-89-2003
[12] Y. Im, M. Jang, R. L. Beardsley, Simulation of aromatic SOA formation using the lumping model
integrated with explicit gas-phase kinetic mechanisms and aerosol-phase reactions. Atmos. Chem. Phys. Discuss.
2013, 13, 5843. doi:10.5194/acpd-13-5843-2013
[13] J. W. Goodeve, The vapour pressures of ethyl nitrate, ethyl nitrite, and nitroethane. Trans. Faraday Soc.
1934, 30, 501. doi:10.1039/tf9343000501
[14] NIOSH Pocket Guide to Chemical Hazards 2015 (Centers for Disease Control and Prevention). Available
at http://www.cdc.gov/niosh/npg/npgd0539.html [Verified 5 November 2015].
[15] J. C. Oxley, J. L. Smith, J. E. Brady, A. C. Brown, Erratum: Characterization and analysis of tetranitrate
esters. Propellants Explos. Pyrotech. 2012, 37, 735. doi:10.1002/prep.201280641
[16] Ethylene Glycol Dinitrate (EGDN)/Nitroglycerin (NG) 2015 (US Department of Labor). Available at
https://www.osha.gov/dts/sltc/methods/organic/org043/org043.html [Verified 2 October 2015].
[17] A. F. M. Barton, Handbook of Solubility Parameters and Other Cohesion Parameters 1991 (CRC Press:
Boston, MA).
[18] A. Noubigh, A. Mgaidi, M. Abderrabba, E. Provost, W. Fürst, Effect of salts on the solubility of phenolic
compounds: experimental measurements and modelling. J. Sci. Food Agric. 2007, 87, 783. doi:10.1002/jsfa.2762
[19] C. Bretti, R. M. Cigala, F. Crea, C. Foti, S. Sammartano, Solubility and activity coefficients of acidic and
basic non-electrolytes in aqueous salt solutions: 3. Solubility and activity coefficients of adipic and pimelic acids
in NaCl(aq), (CH3)4NCl(aq) and (C2H5)4NI(aq) at different ionic strengths and at T = 25 °C. C. Fluid Phase
Equilibria 2008, 263, 43. doi:10.1016/j.fluid.2007.09.018
[20] N. Šegatin, C. Klofutar, Salting-out of some alkyl acetates in aqueous sodium chloride solutions. Monatsh.
Chem. 2000, 131, 0131. doi:10.1007/s007060050014