Diamond Detector: Measuring Beam Intensity Erik Torres, University of Illinois at Urbana-Champaign, Champaign, IL, 61820 Fermi National Accelerator Laboratory, Batavia, IL 60510 FNAL SIST Program, August 17 th , 2016 Supervisors: Dr. Carol Johnstone & Adam Watts Abstract There are several ways of measuring beam intensity. One of those ways is through the use of an instrumentation device called a diamond detector. Diamond technology has the capability to measure beam intensity, count particles and measure the energy spectrum of the beam. With a purpose of looking to replace the current method in measuring beam intensity for the Switchyard beamline, which involves using Secondary Emissions Monitors (SEMs), the diamond detector may offer a less expensive and more effective way of measuring beam intensity. Introduction To begin with, an important aspect that came with learning about this piece of instrumentation was to start from the beginning, and that dealt with learning about the actual piece of gem diamond that made the particle detector work. Specifically, I researched a company called Element Six, which is a company that specializes in making diamonds for the specifications of using them in applications for particle detectors and other precise instruments. Element Six makes the diamond technology through a chemical vapor deposition (CVD) process, which makes the diamond to be synthetic. The diamond is formed and created in a
Transcript
Diamond Detector: Measuring Beam Intensity
Erik Torres, University of Illinois at Urbana-Champaign, Champaign, IL, 61820
Fermi National Accelerator Laboratory, Batavia, IL 60510
FNAL SIST Program, August 17th, 2016
Supervisors: Dr. Carol Johnstone & Adam Watts
Abstract
There are several ways of measuring beam intensity. One of those ways is through the
use of an instrumentation device called a diamond detector. Diamond technology has the
capability to measure beam intensity, count particles and measure the energy spectrum of the
beam. With a purpose of looking to replace the current method in measuring beam intensity for
the Switchyard beamline, which involves using Secondary Emissions Monitors (SEMs), the
diamond detector may offer a less expensive and more effective way of measuring beam
intensity.
Introduction
To begin with, an important aspect that came with learning about this piece of
instrumentation was to start from the beginning, and that dealt with learning about the actual
piece of gem diamond that made the particle detector work. Specifically, I researched a company
called Element Six, which is a company that specializes in making diamonds for the
specifications of using them in applications for particle detectors and other precise instruments.
Element Six makes the diamond technology through a chemical vapor deposition (CVD)
process, which makes the diamond to be synthetic. The diamond is formed and created in a
tightly controlled growth environment where the diamond is subject to strict conditions and
quality control over the specifications for what the diamond material should be grown to. CVD
diamonds are usually produced in a vacuum where carbon atoms are supplied from gases like
methane so the company has the ability to control the gas purity, which is essential to create pure
diamonds in use of applications in particle detectors and other precise instruments. In addition to
already selling several diamonds for the purpose to use in particle detectors, the specifications of
the diamond can also be taken from the customer to Element Six, so then Element Six will grow
the diamond to the exact dimensions that the customer asked for. This is useful in some cases
when a diamond detector is placed in a beamline of protons where the scattering angle and the
power loss of the beam need to be considered for safety reasons or preference of beam position.
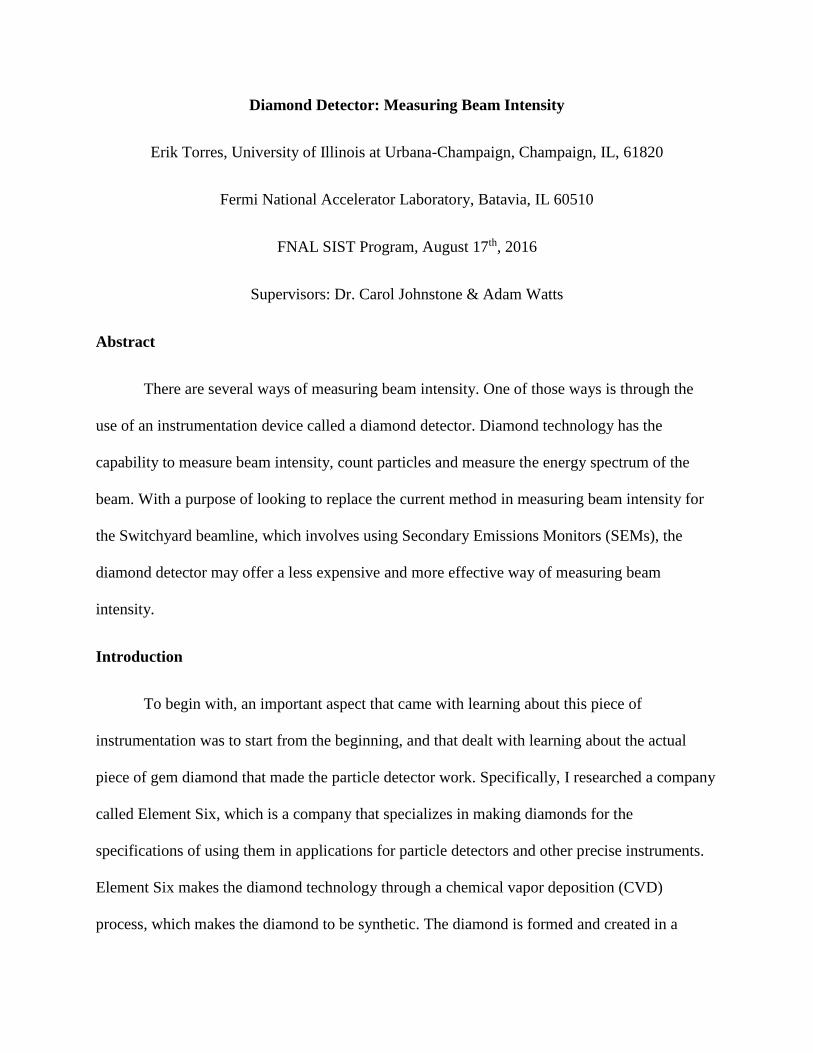
For reference, the specific diamond detector that I had to test and get familiar with had diamond
material that was 1 x 1 cm2 and 500 micrometers thick.
The diamond detector is a charged-particle detector. In detail, the diamond detector
works by a bias voltage that is applied across the diamond material. A thumb of rule is that for
each 100 micrometers of the diamond material, there will have to be around 100 volts applied
Figure 1: This is the diamond detector that
I tested over the summer. It is covered by
electrical tape to protect the diamond
material from light. It has to be light-tight
in order for the diamond detector to
function properly.
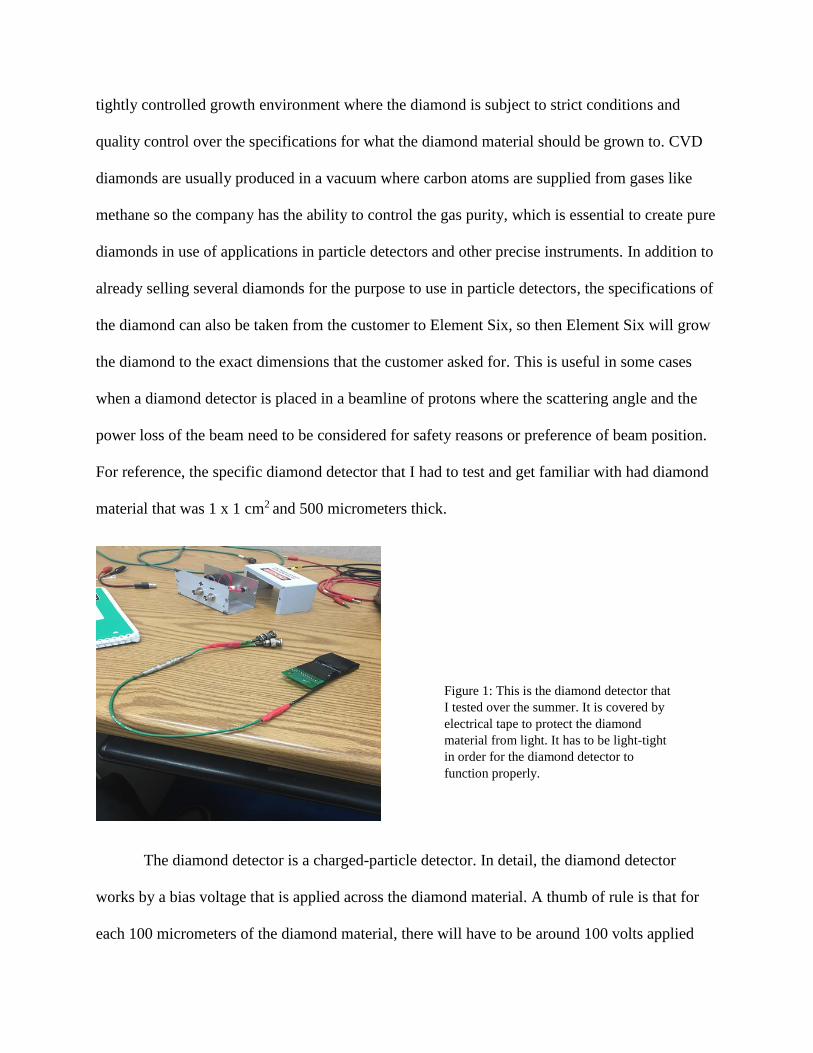
across the diamond for the diamond detector to function properly. As charged particles hit the
surface of the diamond material, the diamond material is then ionized and there is a creation of
free charge carriers, which in essence are electron-hole pairs. After these free charge carriers are
created from the collision of the charged particles on to the diamond, the drift of these charges
between the electrodes, which are a part of the diamond detector, creates a signal of current that
can be measured. In some cases, with precise instrumentation and readout hardware, the current
signal from the diamond detector is relatively small (picoamp range), so a low noise current
amplifier would be used in combination with the diamond detector so that when charged
particles hit the diamond, the current signal will be amplified in order to measure the low
intensity from the current signal. However, in our case, since we are dealing with a proton beam
of high intensity (120 GeV), it should not be a problem in reading out a current signal from the
diamond detector since the beam is producing protons and running at such high intensity.
Another aspect that is important for making the diamond detector a viable beam intensity
monitor is the need for a high signal to noise ratio. For diamond detector instrumentation, it has
to have the ability to be able to produce a signal to noise ratio in which the current signal from
the diamond detector is clearly read. The instrumentation that has to deal with producing a high
signal to noise ratio involves creating a very good Faraday cage. A Faraday cage is used to block
Figure 2: Here is a diagram of how the diamond
detector looks in part of a circuit diagram. The
diamond material is connected to two electrodes,
a cathode and an anode, which allow the drift of
the charges that are made when a charged particle
ionizes the diamond, which produces a current
signal. In order for the diamond detector to
operate, a bias voltage has to be applied, as
shown as “HV” (high voltage) in the diagram.
electric fields and is formed by conductive material. A lot of detail has to be taken into account
for producing a high signal to noise ratio. For example, the types of cables and how the cables
are wired to readout the current signal matter a lot in having an effective Faraday cage. Another
key aspect to know about the diamond material is the difference between the two types of
diamond materials that can be used. The two different types are single crystal diamond and
polycrystalline diamond. Single crystal diamond is more expensive to produce where all the
symmetry properties of the diamond material structure is present. A polycrystalline diamond
consists of several single crystals that are randomly distributed for the diamond material
structure. A single crystal diamond is preferable in that it offers a more uniform current signal to
readout from the diamond detector. However, the single crystal diamonds are more expensive
than the polycrystalline diamonds.
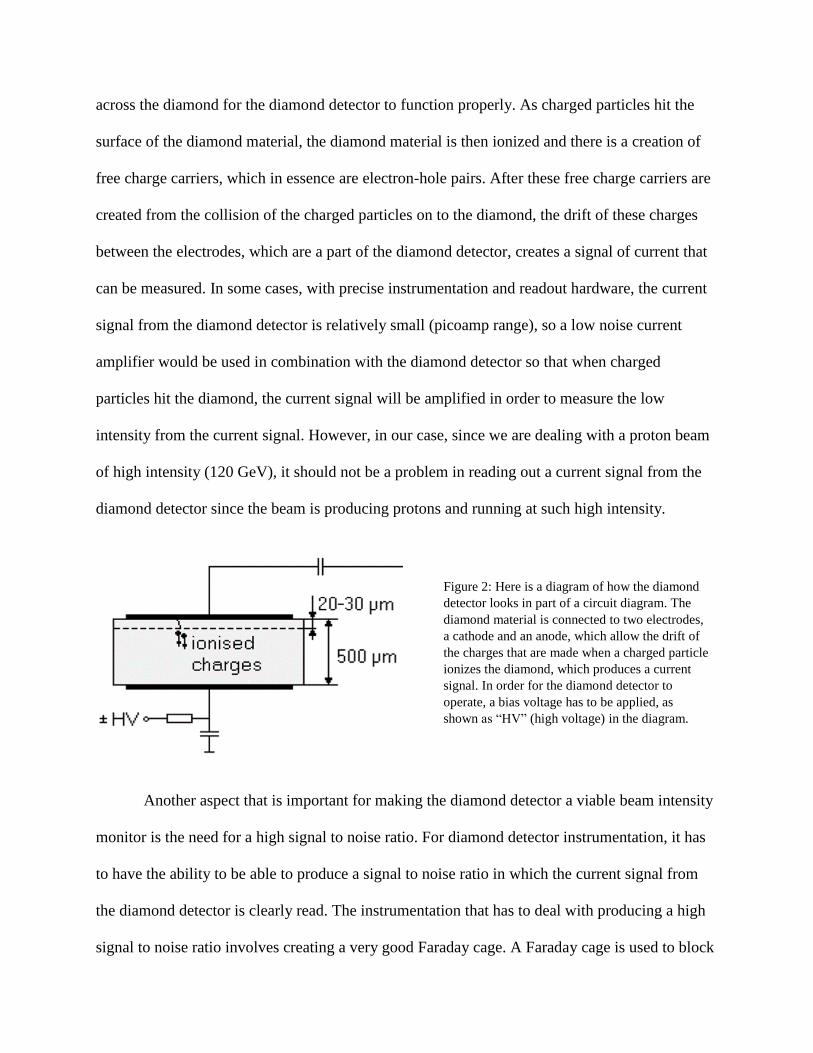
With the overall purpose for the replacement of SEMs, we looked into some of the
reasons why the current method for measuring beam intensity should be changed. The way
SEMs work in measuring the beam intensity is with beam interaction on the Titanium foils
located in the SEMs. The beam interaction with the foils liberates surfaces electrons from the
Titanium atoms. The signal from SEMs is then taken to a current digitizer via a coaxial cable.
Figure 3: Here is an image of Element
Six single crystal synthetic diamonds.
The current digitizer then converts the positive electrical charge left on the foil to a number of
pulses proportional to the amount of charge; this is proportional to the beam intensity. However,
there are downsides to using the SEMs. One of the downsides that comes with using the SEMs is
the calibration. For example, if the beam hits the Titanium foils in the same spot for a long time,
the secondary electron yield will get lower and lower as time goes on because surface electrons
are being liberated from the same Titanium atoms, leading to an inaccurate measurement of
beam intensity. With an inaccurate measurement of the beam intensity from the SEMs, this leads
to a recalibration of the instrument. Also, in addition to this calibration problem, the beam
position also plays a role in determining the beam intensity. For example, if the beam were to be
tuned by an operator, the beam would interact with a different spot on the Titanium foil, which
will give a different amount of positive charge detected on the Titanium foil due to a higher
secondary electron yield in that area. The problem with this is the different beam intensities that
are being measured by the SEMs due to calibration issues. Last but not least, the SEMs also
contain large material. SEMs contain around 10 Titanium foils, with a thickness of about 5
millimeters thick. Compared to the diamond detector, more beam is lost and scattered with the
use of SEMs instead of a diamond detector.
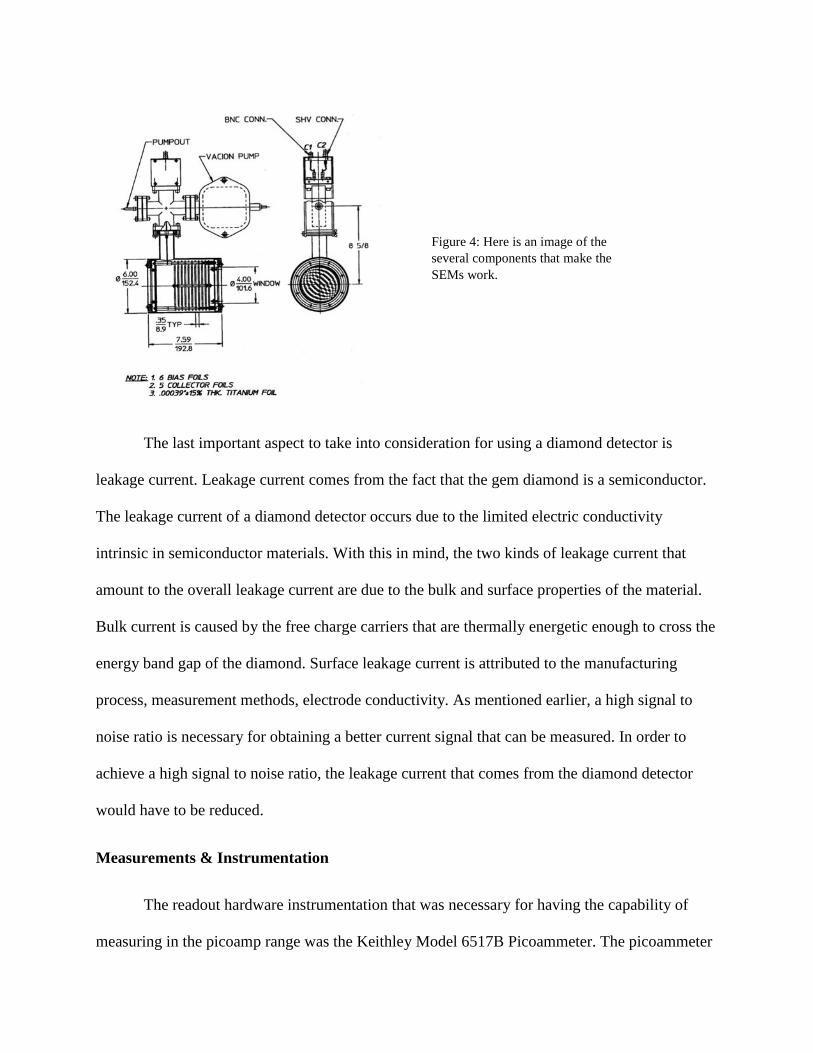
The last important aspect to take into consideration for using a diamond detector is
leakage current. Leakage current comes from the fact that the gem diamond is a semiconductor.
The leakage current of a diamond detector occurs due to the limited electric conductivity
intrinsic in semiconductor materials. With this in mind, the two kinds of leakage current that
amount to the overall leakage current are due to the bulk and surface properties of the material.
Bulk current is caused by the free charge carriers that are thermally energetic enough to cross the
energy band gap of the diamond. Surface leakage current is attributed to the manufacturing
process, measurement methods, electrode conductivity. As mentioned earlier, a high signal to
noise ratio is necessary for obtaining a better current signal that can be measured. In order to
achieve a high signal to noise ratio, the leakage current that comes from the diamond detector
would have to be reduced.
Measurements & Instrumentation
The readout hardware instrumentation that was necessary for having the capability of
measuring in the picoamp range was the Keithley Model 6517B Picoammeter. The picoammeter
Figure 4: Here is an image of the
several components that make the
SEMs work.
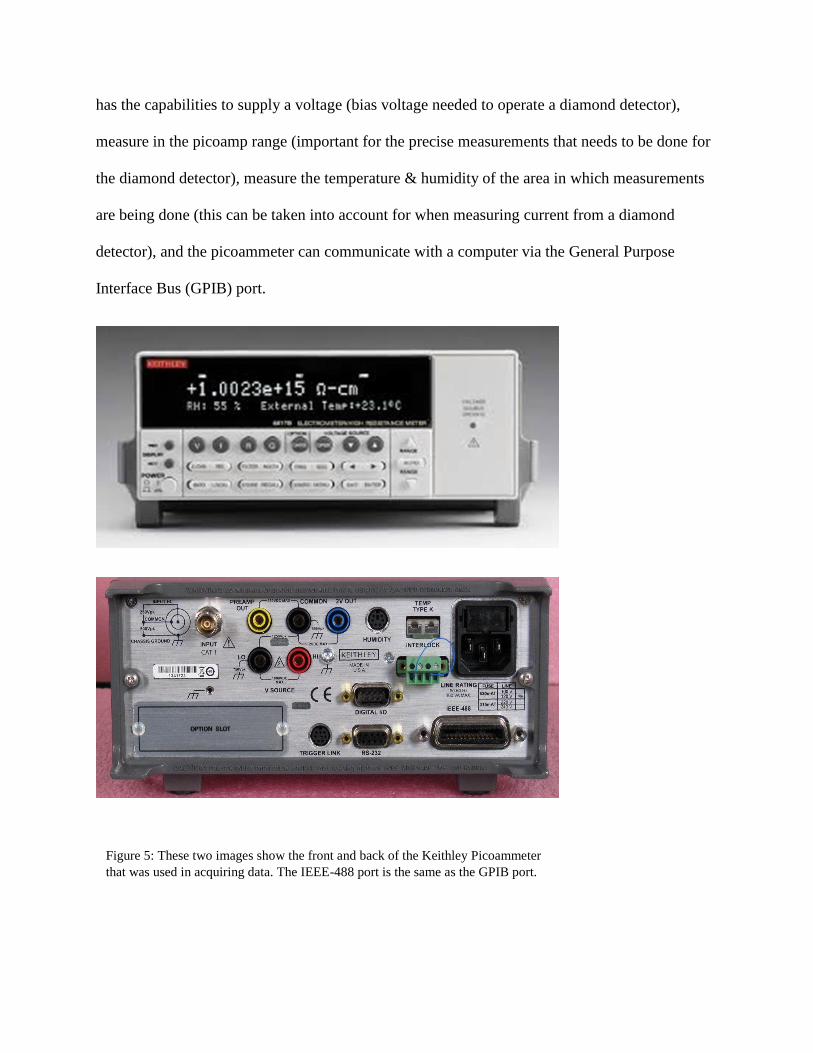
has the capabilities to supply a voltage (bias voltage needed to operate a diamond detector),
measure in the picoamp range (important for the precise measurements that needs to be done for
the diamond detector), measure the temperature & humidity of the area in which measurements
are being done (this can be taken into account for when measuring current from a diamond
detector), and the picoammeter can communicate with a computer via the General Purpose
Interface Bus (GPIB) port.
Figure 5: These two images show the front and back of the Keithley Picoammeter
that was used in acquiring data. The IEEE-488 port is the same as the GPIB port.
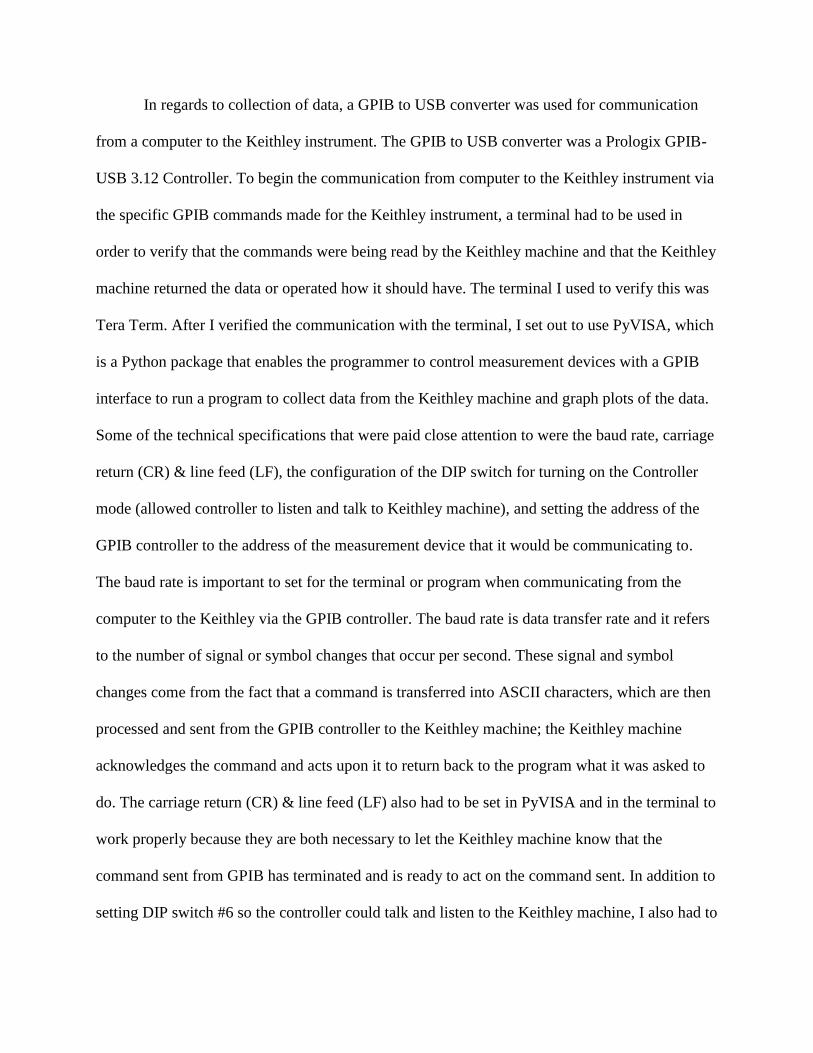
In regards to collection of data, a GPIB to USB converter was used for communication
from a computer to the Keithley instrument. The GPIB to USB converter was a Prologix GPIB-
USB 3.12 Controller. To begin the communication from computer to the Keithley instrument via
the specific GPIB commands made for the Keithley instrument, a terminal had to be used in
order to verify that the commands were being read by the Keithley machine and that the Keithley
machine returned the data or operated how it should have. The terminal I used to verify this was
Tera Term. After I verified the communication with the terminal, I set out to use PyVISA, which
is a Python package that enables the programmer to control measurement devices with a GPIB
interface to run a program to collect data from the Keithley machine and graph plots of the data.
Some of the technical specifications that were paid close attention to were the baud rate, carriage
return (CR) & line feed (LF), the configuration of the DIP switch for turning on the Controller
mode (allowed controller to listen and talk to Keithley machine), and setting the address of the
GPIB controller to the address of the measurement device that it would be communicating to.
The baud rate is important to set for the terminal or program when communicating from the
computer to the Keithley via the GPIB controller. The baud rate is data transfer rate and it refers
to the number of signal or symbol changes that occur per second. These signal and symbol
changes come from the fact that a command is transferred into ASCII characters, which are then
processed and sent from the GPIB controller to the Keithley machine; the Keithley machine
acknowledges the command and acts upon it to return back to the program what it was asked to
do. The carriage return (CR) & line feed (LF) also had to be set in PyVISA and in the terminal to
work properly because they are both necessary to let the Keithley machine know that the
command sent from GPIB has terminated and is ready to act on the command sent. In addition to
setting DIP switch #6 so the controller could talk and listen to the Keithley machine, I also had to
make sure to tell the controller the address that the Keithley machine was set to, which was at
address 27, so that the GPIB port could properly transfer data from the computer, to the
controller, to the Keithley machine.
Strontium-90 Radioactive Source
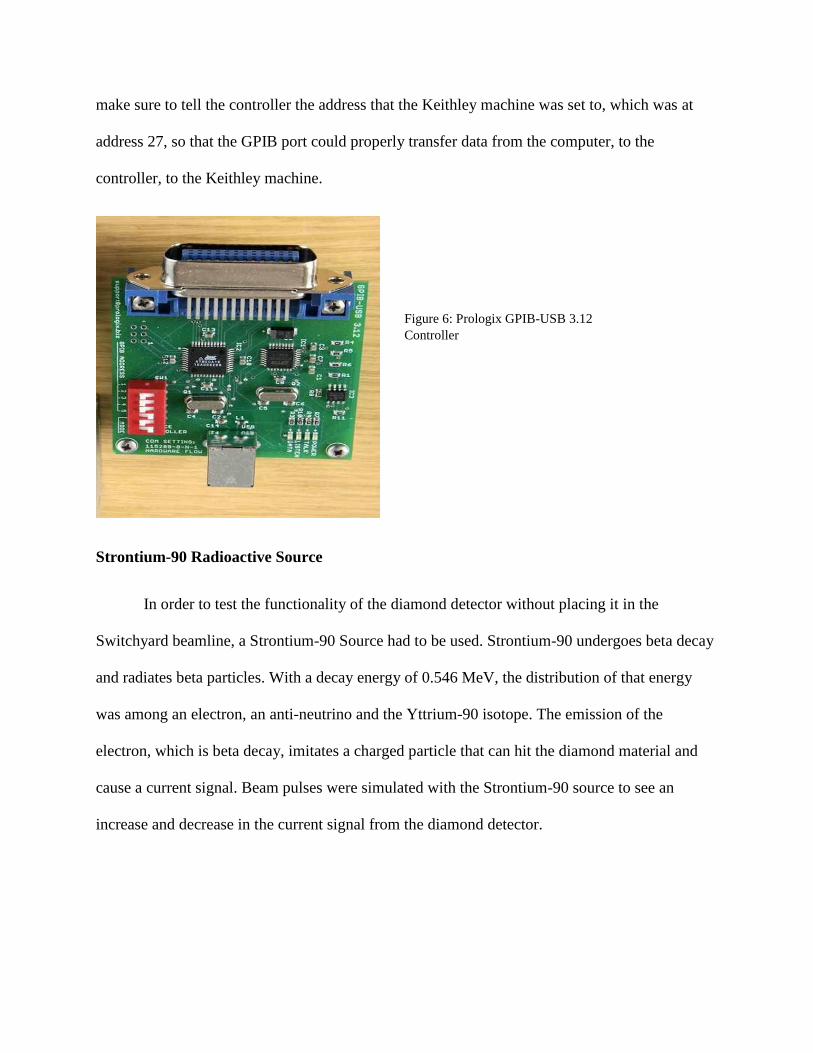
In order to test the functionality of the diamond detector without placing it in the
Switchyard beamline, a Strontium-90 Source had to be used. Strontium-90 undergoes beta decay
and radiates beta particles. With a decay energy of 0.546 MeV, the distribution of that energy
was among an electron, an anti-neutrino and the Yttrium-90 isotope. The emission of the
electron, which is beta decay, imitates a charged particle that can hit the diamond material and
cause a current signal. Beam pulses were simulated with the Strontium-90 source to see an
increase and decrease in the current signal from the diamond detector.
Figure 6: Prologix GPIB-USB 3.12
Controller
Current Signal from Diamond Detector
Figure 7: Strontium-90 Source
used to test the diamond detector
for a current signal.
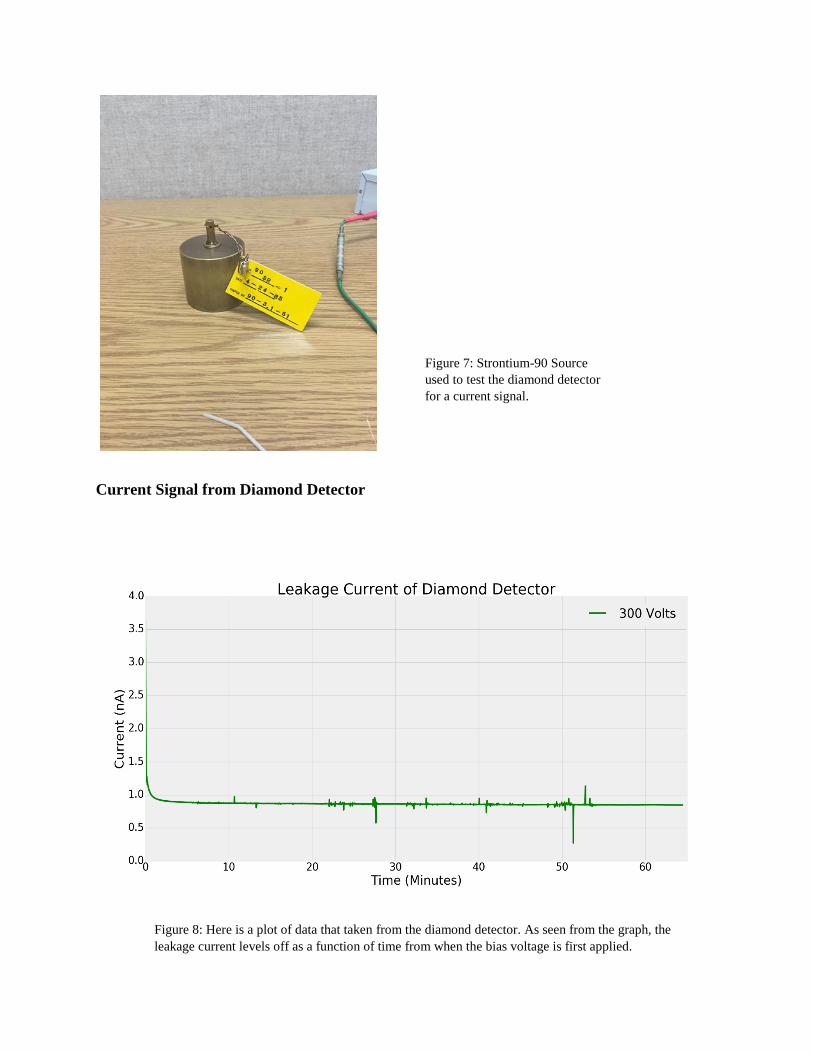
Figure 8: Here is a plot of data that taken from the diamond detector. As seen from the graph, the
leakage current levels off as a function of time from when the bias voltage is first applied.
Fermilab Test Beam Facility & Calculations
We tested the diamond detector at the Fermilab Test Beam Facility (FTBF), where there
is open access to test beam for particle detectors. Through our experience we learned a very
valuable piece of information that assisted us in achieving a very high signal to noise to ratio.
Before placing the diamond detector in the beamline after obtaining successful data
through applying the Strontium-90 source, an operational readiness clearances (ORC) review had
to be made by ES&H to ensure that the process for placing the diamond detector in the beamline
was safe. We had to explain the purpose for placing the diamond detector in the beamline, its
impact on the radiation environment and address electrical and safety hazards.
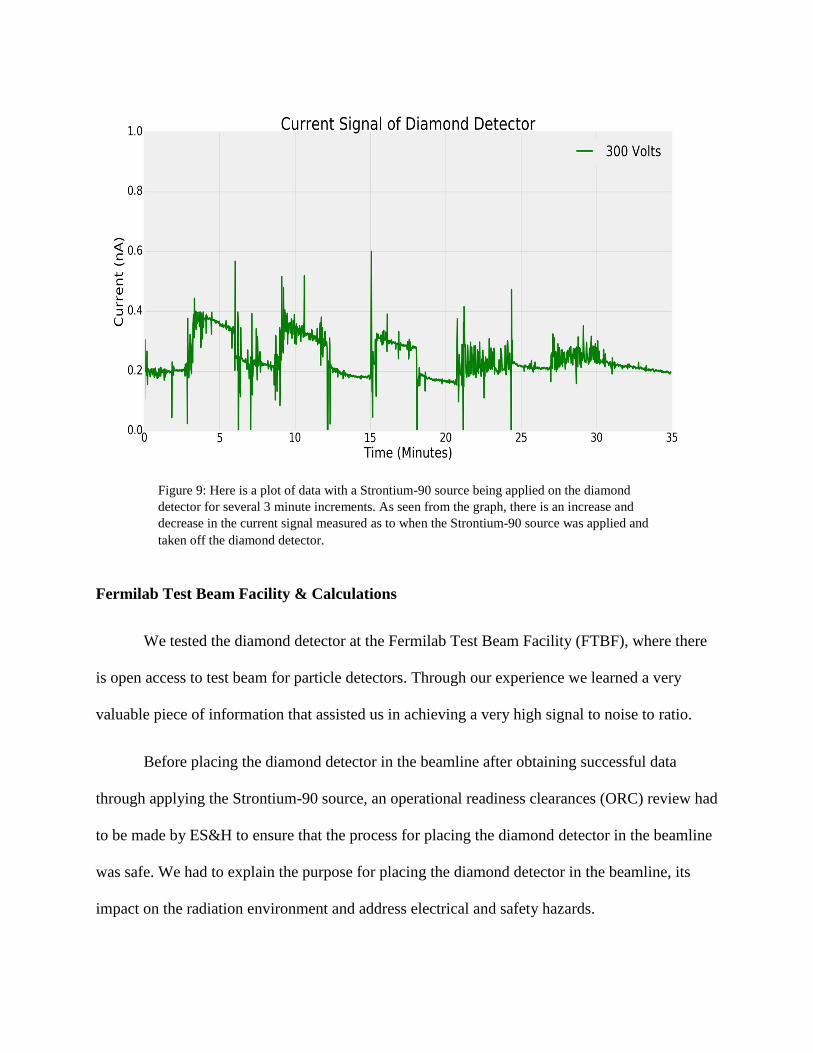
Figure 9: Here is a plot of data with a Strontium-90 source being applied on the diamond
detector for several 3 minute increments. As seen from the graph, there is an increase and
decrease in the current signal measured as to when the Strontium-90 source was applied and
taken off the diamond detector.
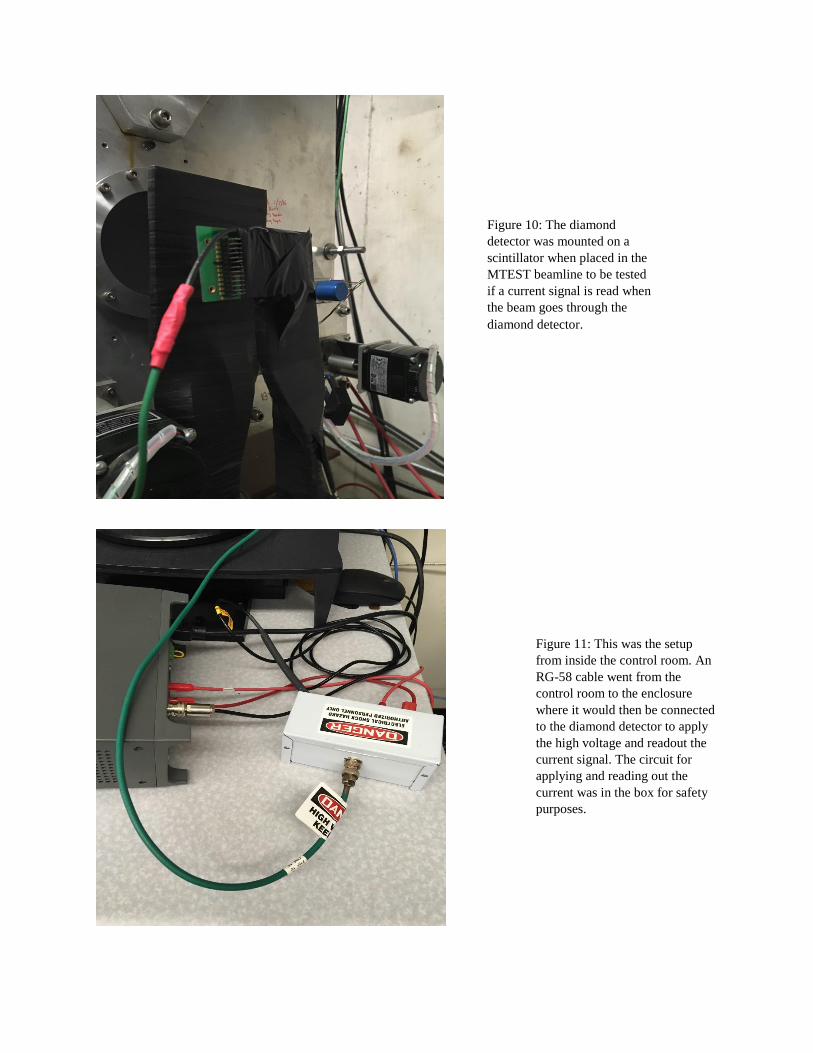
Figure 10: The diamond
detector was mounted on a
scintillator when placed in the
MTEST beamline to be tested
if a current signal is read when
the beam goes through the
diamond detector.
Figure 11: This was the setup
from inside the control room. An
RG-58 cable went from the
control room to the enclosure
where it would then be connected
to the diamond detector to apply
the high voltage and readout the
current signal. The circuit for
applying and reading out the
current was in the box for safety
purposes.
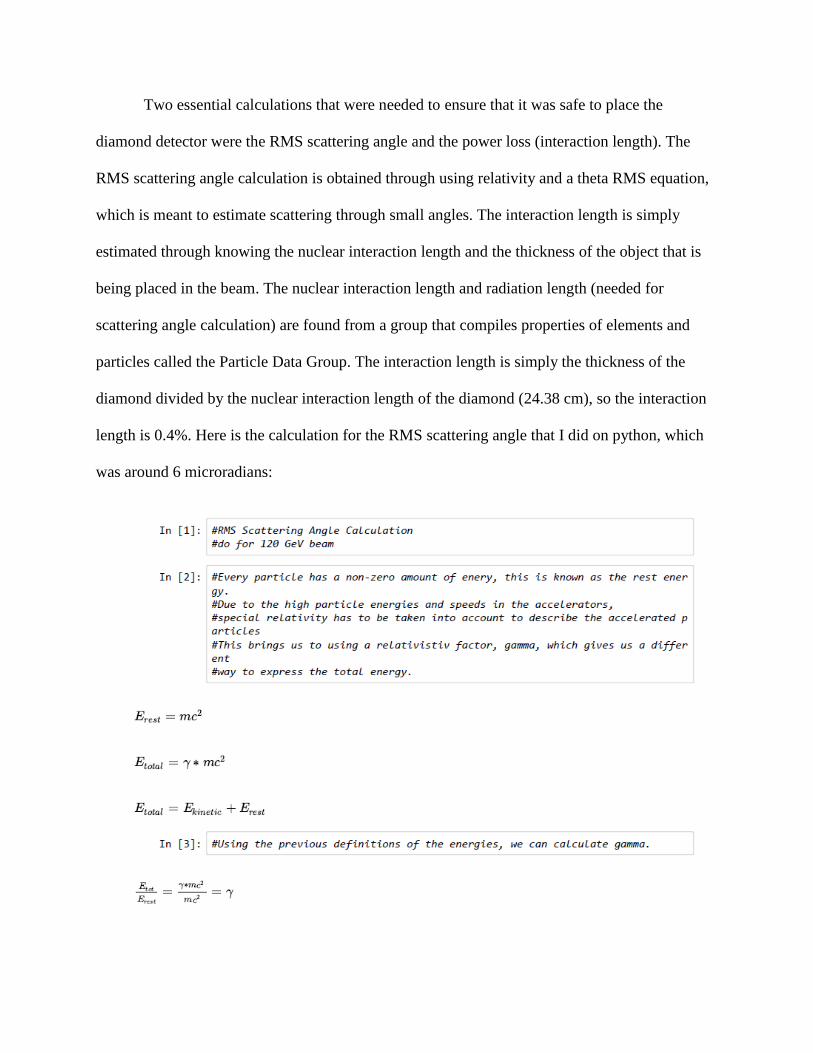
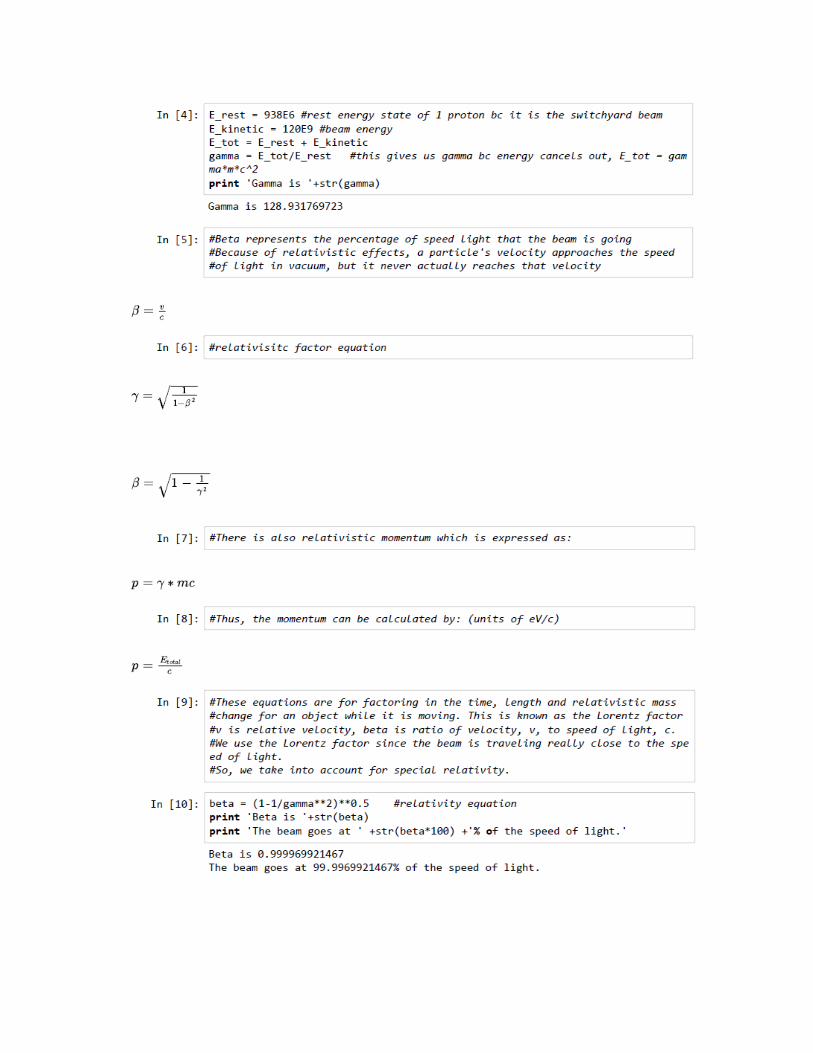
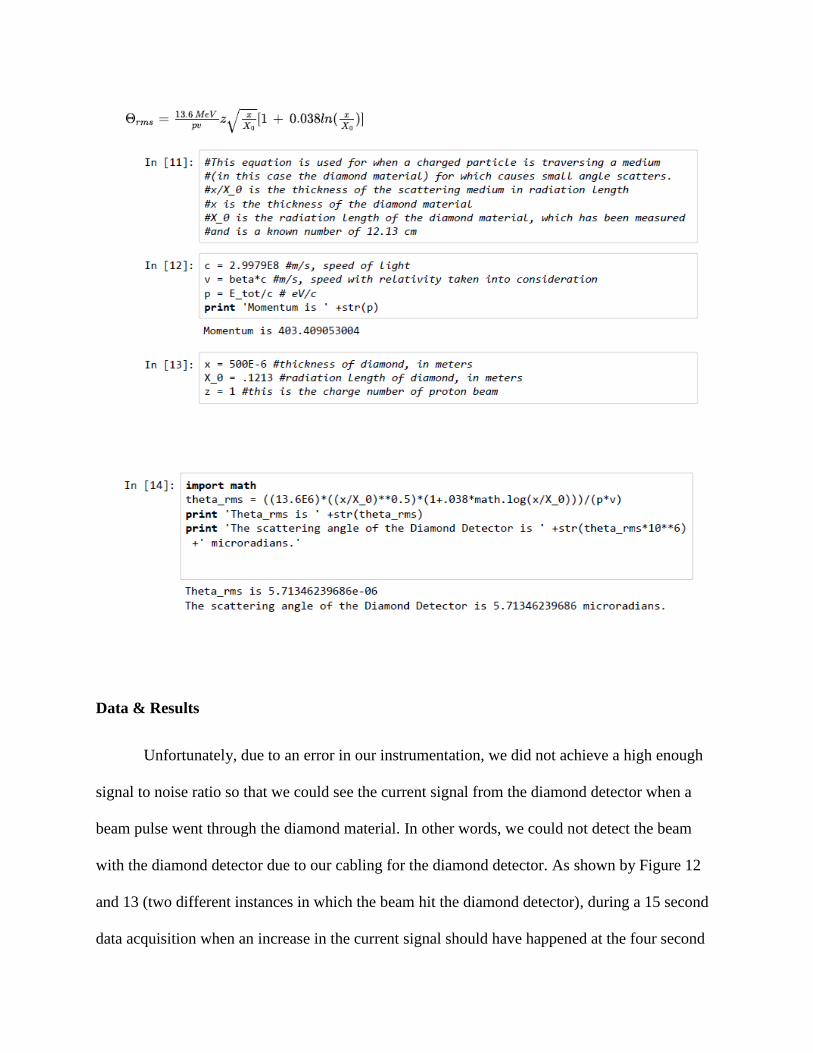
Two essential calculations that were needed to ensure that it was safe to place the
diamond detector were the RMS scattering angle and the power loss (interaction length). The
RMS scattering angle calculation is obtained through using relativity and a theta RMS equation,
which is meant to estimate scattering through small angles. The interaction length is simply
estimated through knowing the nuclear interaction length and the thickness of the object that is
being placed in the beam. The nuclear interaction length and radiation length (needed for
scattering angle calculation) are found from a group that compiles properties of elements and
particles called the Particle Data Group. The interaction length is simply the thickness of the
diamond divided by the nuclear interaction length of the diamond (24.38 cm), so the interaction
length is 0.4%. Here is the calculation for the RMS scattering angle that I did on python, which
was around 6 microradians:
Data & Results
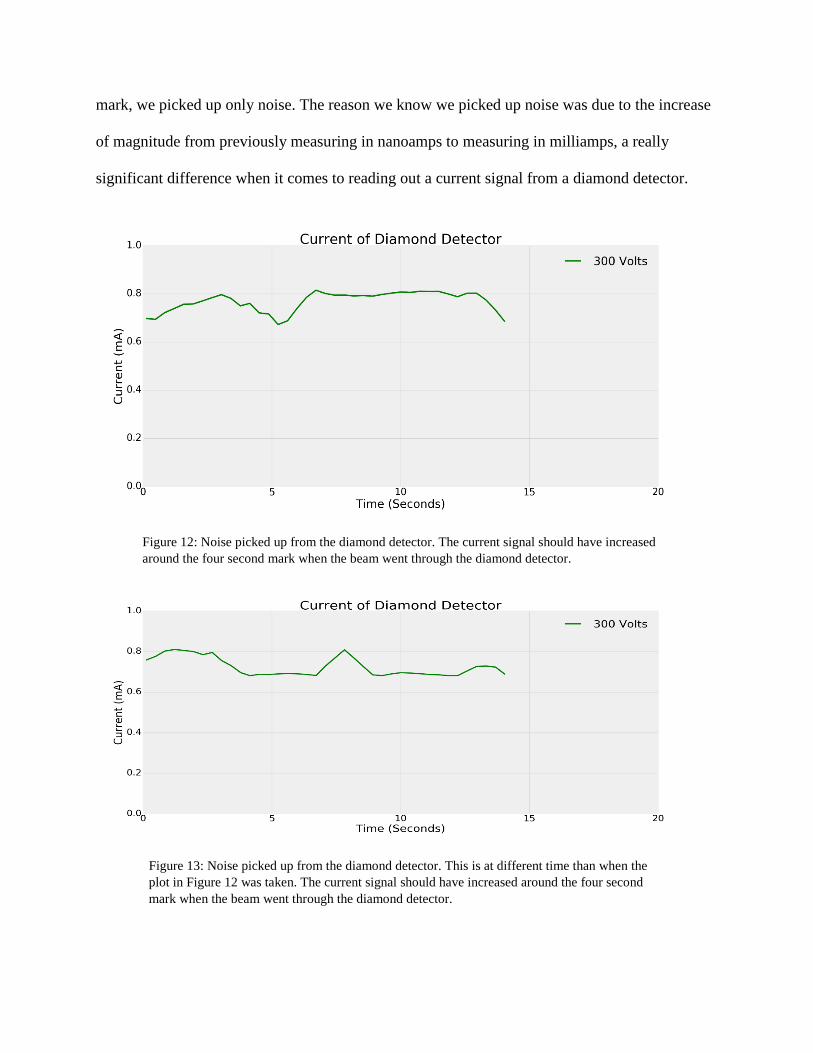
Unfortunately, due to an error in our instrumentation, we did not achieve a high enough
signal to noise ratio so that we could see the current signal from the diamond detector when a
beam pulse went through the diamond material. In other words, we could not detect the beam
with the diamond detector due to our cabling for the diamond detector. As shown by Figure 12
and 13 (two different instances in which the beam hit the diamond detector), during a 15 second
data acquisition when an increase in the current signal should have happened at the four second
mark, we picked up only noise. The reason we know we picked up noise was due to the increase
of magnitude from previously measuring in nanoamps to measuring in milliamps, a really
significant difference when it comes to reading out a current signal from a diamond detector.
Figure 12: Noise picked up from the diamond detector. The current signal should have increased
around the four second mark when the beam went through the diamond detector.
Figure 13: Noise picked up from the diamond detector. This is at different time than when the
plot in Figure 12 was taken. The current signal should have increased around the four second
mark when the beam went through the diamond detector.
Improvements
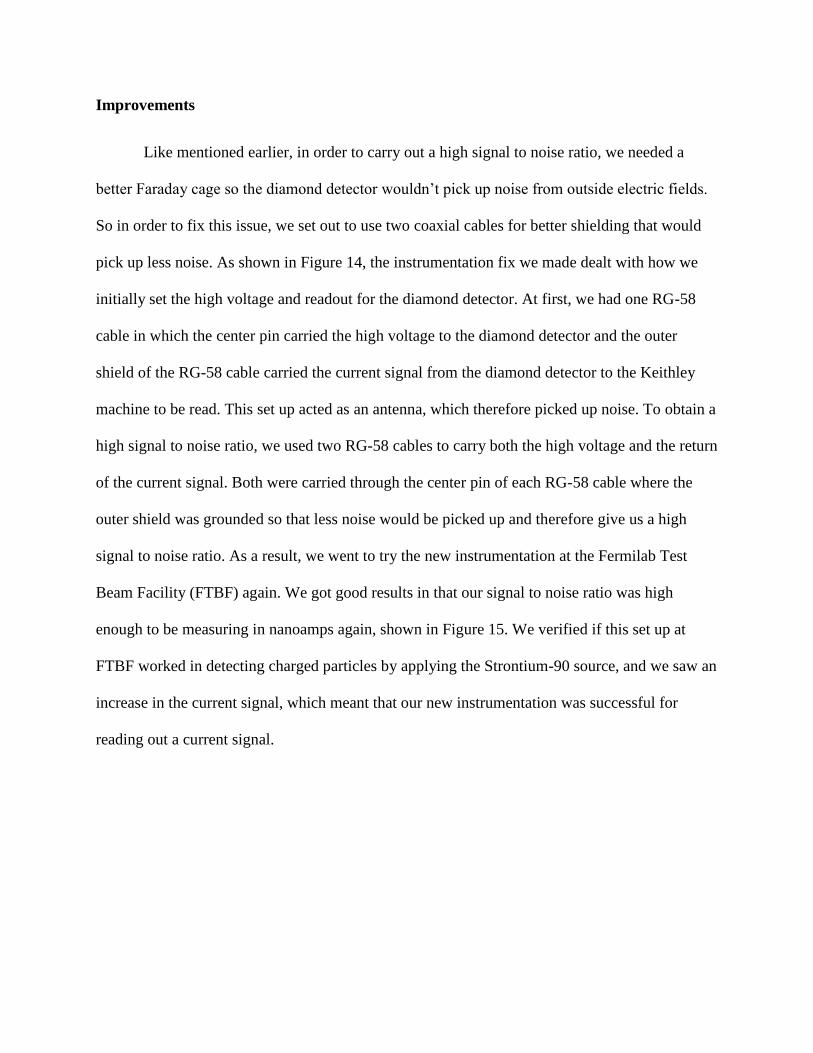
Like mentioned earlier, in order to carry out a high signal to noise ratio, we needed a
better Faraday cage so the diamond detector wouldn’t pick up noise from outside electric fields.
So in order to fix this issue, we set out to use two coaxial cables for better shielding that would
pick up less noise. As shown in Figure 14, the instrumentation fix we made dealt with how we
initially set the high voltage and readout for the diamond detector. At first, we had one RG-58
cable in which the center pin carried the high voltage to the diamond detector and the outer
shield of the RG-58 cable carried the current signal from the diamond detector to the Keithley
machine to be read. This set up acted as an antenna, which therefore picked up noise. To obtain a
high signal to noise ratio, we used two RG-58 cables to carry both the high voltage and the return
of the current signal. Both were carried through the center pin of each RG-58 cable where the
outer shield was grounded so that less noise would be picked up and therefore give us a high
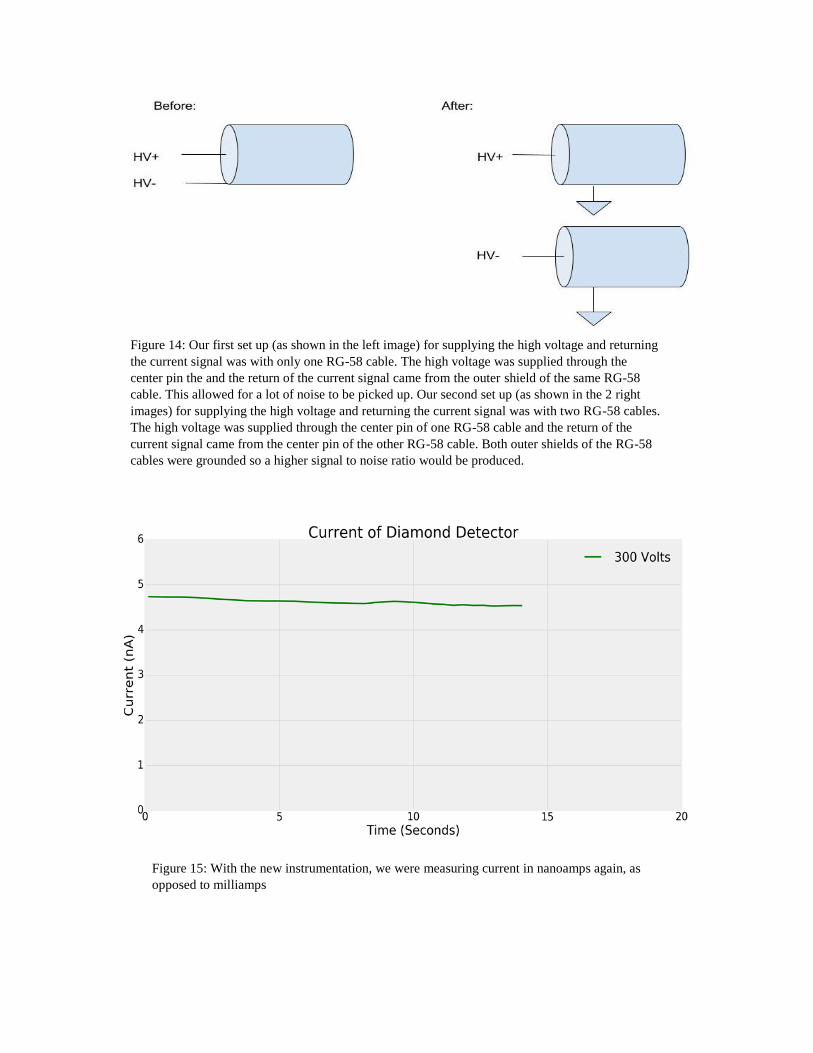
signal to noise ratio. As a result, we went to try the new instrumentation at the Fermilab Test
Beam Facility (FTBF) again. We got good results in that our signal to noise ratio was high
enough to be measuring in nanoamps again, shown in Figure 15. We verified if this set up at
FTBF worked in detecting charged particles by applying the Strontium-90 source, and we saw an
increase in the current signal, which meant that our new instrumentation was successful for
reading out a current signal.
Figure 14: Our first set up (as shown in the left image) for supplying the high voltage and returning
the current signal was with only one RG-58 cable. The high voltage was supplied through the
center pin the and the return of the current signal came from the outer shield of the same RG-58
cable. This allowed for a lot of noise to be picked up. Our second set up (as shown in the 2 right
images) for supplying the high voltage and returning the current signal was with two RG-58 cables.
The high voltage was supplied through the center pin of one RG-58 cable and the return of the
current signal came from the center pin of the other RG-58 cable. Both outer shields of the RG-58
cables were grounded so a higher signal to noise ratio would be produced.
Figure 15: With the new instrumentation, we were measuring current in nanoamps again, as
opposed to milliamps
Conclusion & Future Directions
In conclusion, we are still looking to discover whether the diamond detector can measure
the micro-bunch structure of the beam. The readout hardware and instrumentation has to be very
fast and precise in how it’s made to readout the current signal. This leads to a rise in costs for the
diamond detector as getting the proper instrumentation and engineers to design a better Faraday
cage and readout hardware will amount in the setup of the diamond detector being more
expensive. We are also looking to discover the dynamic range of the diamond detector. For
example, can it read the intensity from a few hundred particles up to 1013 particles? Since the
current signal should increase or decrease linearly, depending on the intensity that is applied to
the diamond material, we predict that the diamond detector should have a large dynamic range.
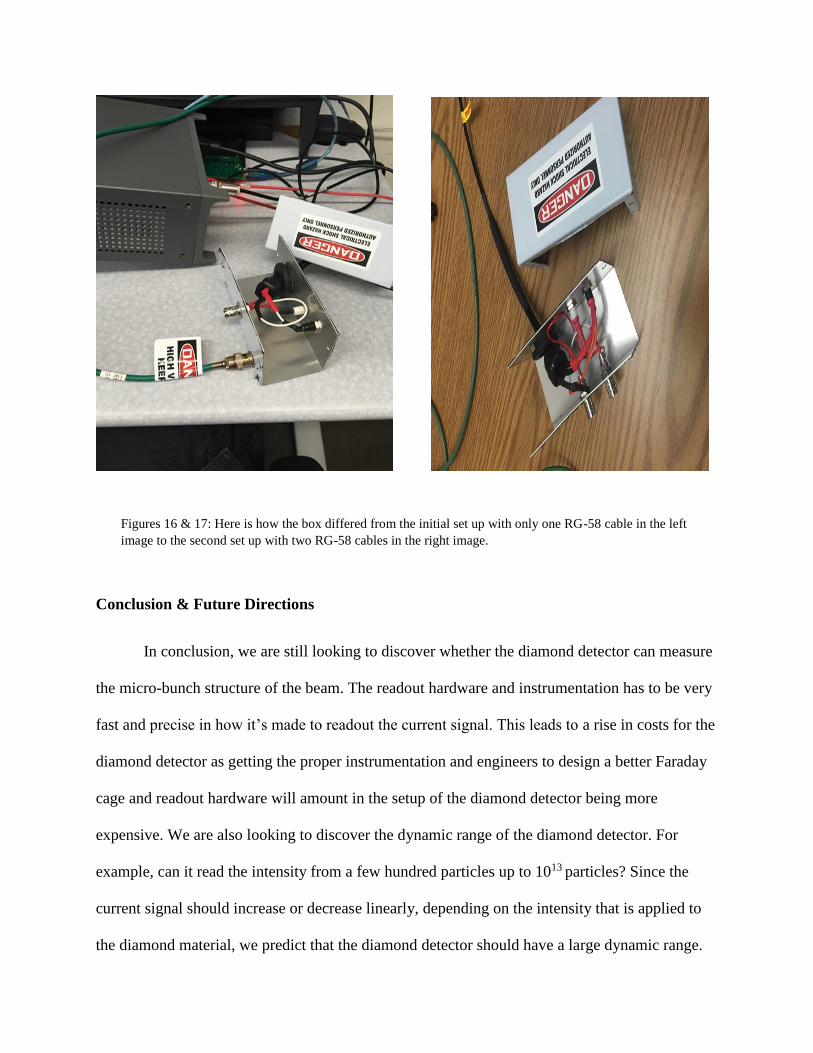
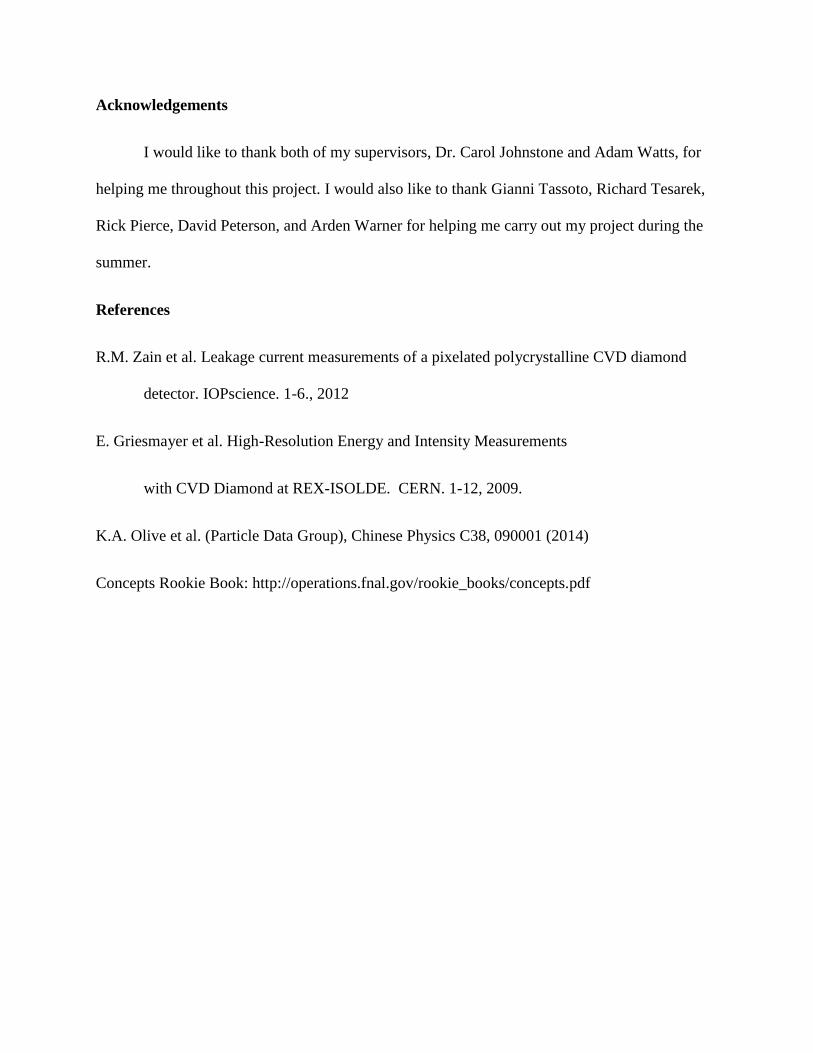
Figures 16 & 17: Here is how the box differed from the initial set up with only one RG-58 cable in the left
image to the second set up with two RG-58 cables in the right image.
Acknowledgements
I would like to thank both of my supervisors, Dr. Carol Johnstone and Adam Watts, for
helping me throughout this project. I would also like to thank Gianni Tassoto, Richard Tesarek,
Rick Pierce, David Peterson, and Arden Warner for helping me carry out my project during the
summer.
References
R.M. Zain et al. Leakage current measurements of a pixelated polycrystalline CVD diamond
detector. IOPscience. 1-6., 2012
E. Griesmayer et al. High-Resolution Energy and Intensity Measurements
with CVD Diamond at REX-ISOLDE. CERN. 1-12, 2009.
K.A. Olive et al. (Particle Data Group), Chinese Physics C38, 090001 (2014)