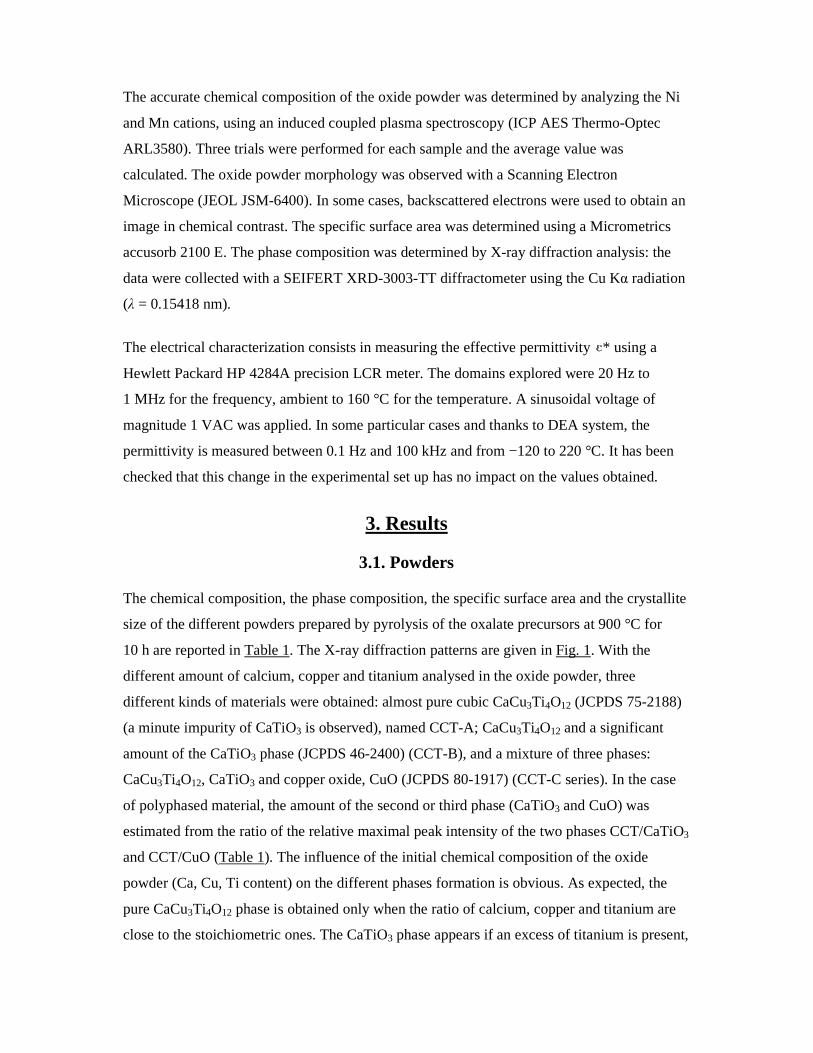
Dielectric properties of CaCu 3 Ti 4 O 12 based multiphased ceramics S. Guillemet-Fritsch, T. Lebey, M. Boulos and B. Durand Centre InterUniversitaire de Recherche et d’Ingénierie des Matériaux (CIRIMAT/LCMIE), Université Paul Sabatier, Bât. 2R1, 118, Route de Narbonne, 31062 Toulouse Cedex 04, France Laboratoire de Génie Electrique de Toulouse (LGET), Université Paul Sabatier, Bât. 3R3, 118, Route de Narbonne, 31062 Toulouse Cedex 04, France Abstract A “soft chemistry” method, the coprecipitation, has been used to synthesize the perovskite CaCu 3 Ti 4 O 12 (CCT). Three main types of materials were obtained for both powders and sintered ceramics: a monophased consisting of the pure CCT phase, a biphased (CCT + CaTiO 3 ), and a three-phased (CCT + CaTiO 3 + copper oxide (CuO or Cu 2 O)). These ceramics, sintered at low temperature, 1050 °C, present original dielectric properties. The relative permittivity determined in the temperature range (-150 < T < 250 °C) is significantly higher than the one reported in the literature. Internal barrier layer capacitor is the probable mechanism to explain the particular behaviour. Moreover, the presence of a copper oxide phase beside the perovksite CCT plays an important role for enhancing the dielectric properties. Keywords: Powders-chemical preparation; Sintering; Dielectric properties; CaCu 3 Ti 4 O 12 ; Capacitors 1. Introduction 2. Experimental
Transcript
Dielectric properties of CaCu3Ti4O12 based multiphased
ceramics
S. Guillemet-Fritsch, T. Lebey, M. Boulos and B. Durand
Centre InterUniversitaire de Recherche et d’Ingénierie des Matériaux (CIRIMAT/LCMIE),
Université Paul Sabatier, Bât. 2R1, 118, Route de Narbonne, 31062 Toulouse Cedex 04,
France
Laboratoire de Génie Electrique de Toulouse (LGET), Université Paul Sabatier, Bât. 3R3,
118, Route de Narbonne, 31062 Toulouse Cedex 04, France
Abstract
A “soft chemistry” method, the coprecipitation, has been used to synthesize the perovskite
CaCu3Ti4O12 (CCT). Three main types of materials were obtained for both powders and
sintered ceramics: a monophased consisting of the pure CCT phase, a biphased
(CCT + CaTiO3), and a three-phased (CCT + CaTiO3 + copper oxide (CuO or Cu2O)). These
ceramics, sintered at low temperature, 1050 °C, present original dielectric properties. The
relative permittivity determined in the temperature range (−150 < T < 250 °C) is significantly
higher than the one reported in the literature. Internal barrier layer capacitor is the probable
mechanism to explain the particular behaviour. Moreover, the presence of a copper oxide
phase beside the perovksite CCT plays an important role for enhancing the dielectric
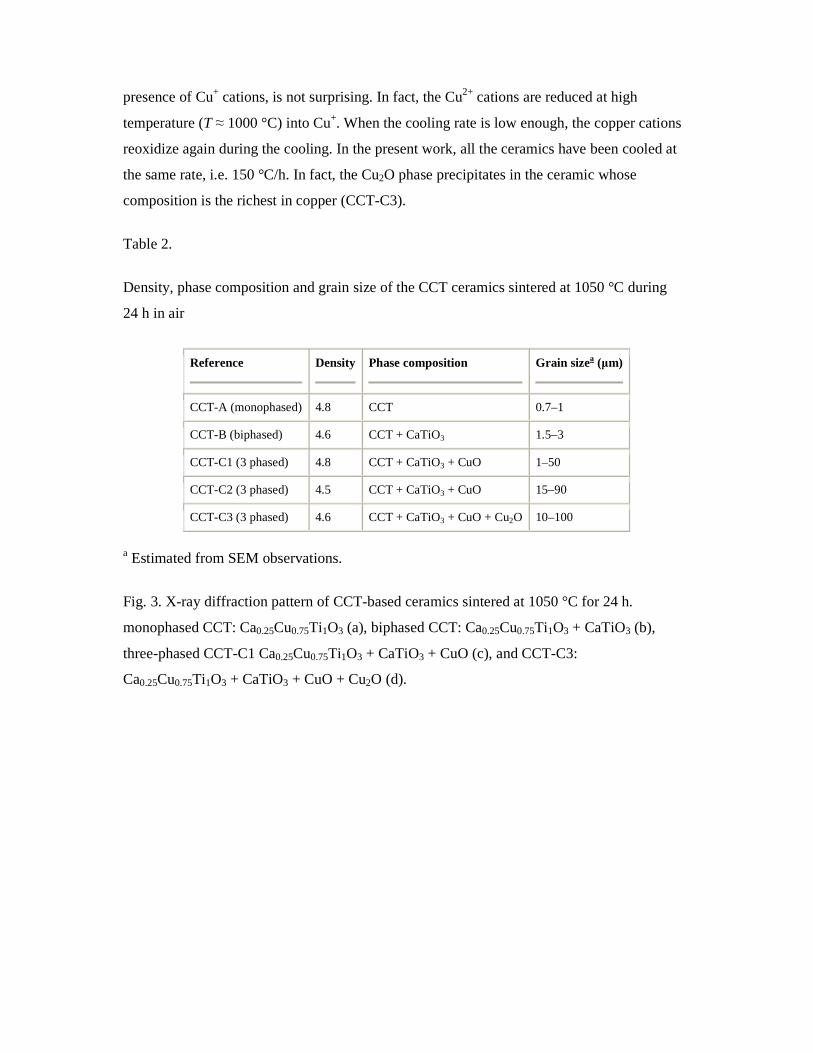
three-phased CCT-C1 Ca0.25Cu0.75Ti1O3 + CaTiO3 + CuO (c), and CCT-C3:
Ca0.25Cu0.75Ti1O3 + CaTiO3 + CuO + Cu2O (d).
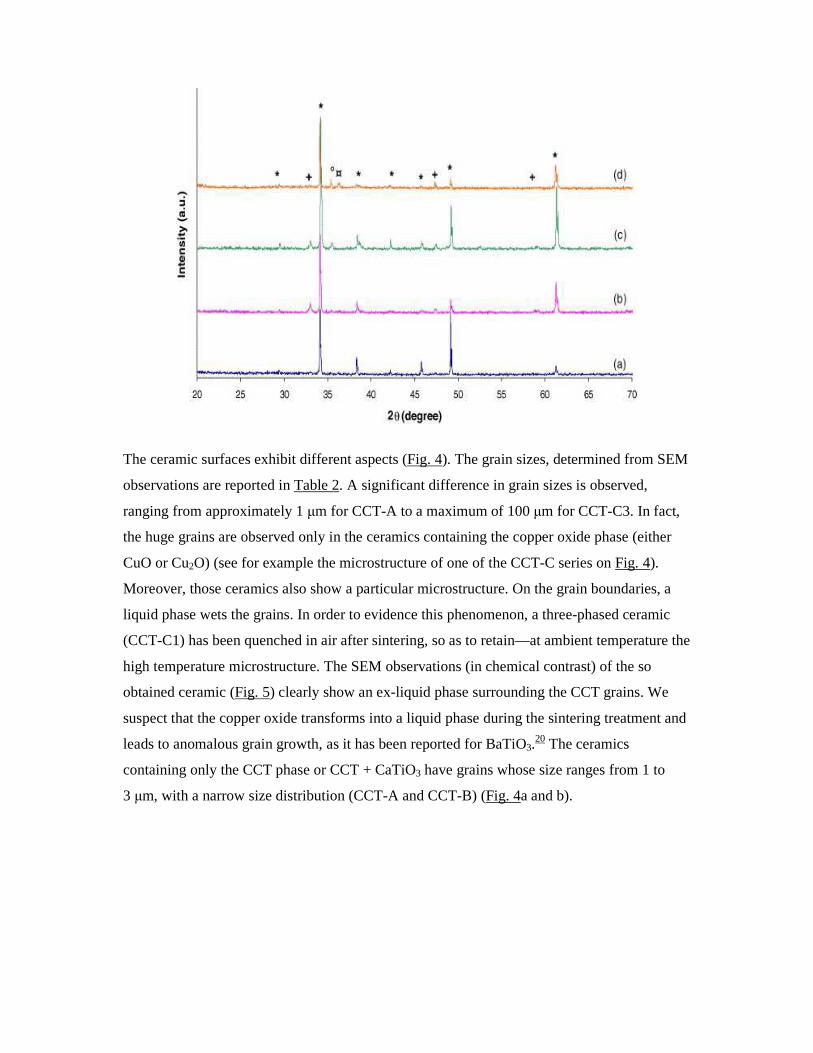
The ceramic surfaces exhibit different aspects (Fig. 4). The grain sizes, determined from SEM
observations are reported in Table 2. A significant difference in grain sizes is observed,
ranging from approximately 1 µm for CCT-A to a maximum of 100 µm for CCT-C3. In fact,
the huge grains are observed only in the ceramics containing the copper oxide phase (either
CuO or Cu2O) (see for example the microstructure of one of the CCT-C series on Fig. 4).
Moreover, those ceramics also show a particular microstructure. On the grain boundaries, a
liquid phase wets the grains. In order to evidence this phenomenon, a three-phased ceramic
(CCT-C1) has been quenched in air after sintering, so as to retain—at ambient temperature the
high temperature microstructure. The SEM observations (in chemical contrast) of the so
obtained ceramic (Fig. 5) clearly show an ex-liquid phase surrounding the CCT grains. We
suspect that the copper oxide transforms into a liquid phase during the sintering treatment and
leads to anomalous grain growth, as it has been reported for BaTiO3.20 The ceramics
containing only the CCT phase or CCT + CaTiO3 have grains whose size ranges from 1 to
3 µm, with a narrow size distribution (CCT-A and CCT-B) (Fig. 4a and b).
Fig. 4. SEM micrographs of the surface of sintered CCT-based ceramics sintered at 1050 °C
for 24 h. CCT-A (monophased) (a), CCT-B (biphased) (b), three-phased CCT (C1 and C2) (c)
and CCT-C3 (containing Cu2O) (d).
Fig. 5. SEM micrograph (chemical contrast) of the surface of a sintered CCT-based ceramics
(CCT-C1) sintered at 1050 °C for 24 h and quenched in air.
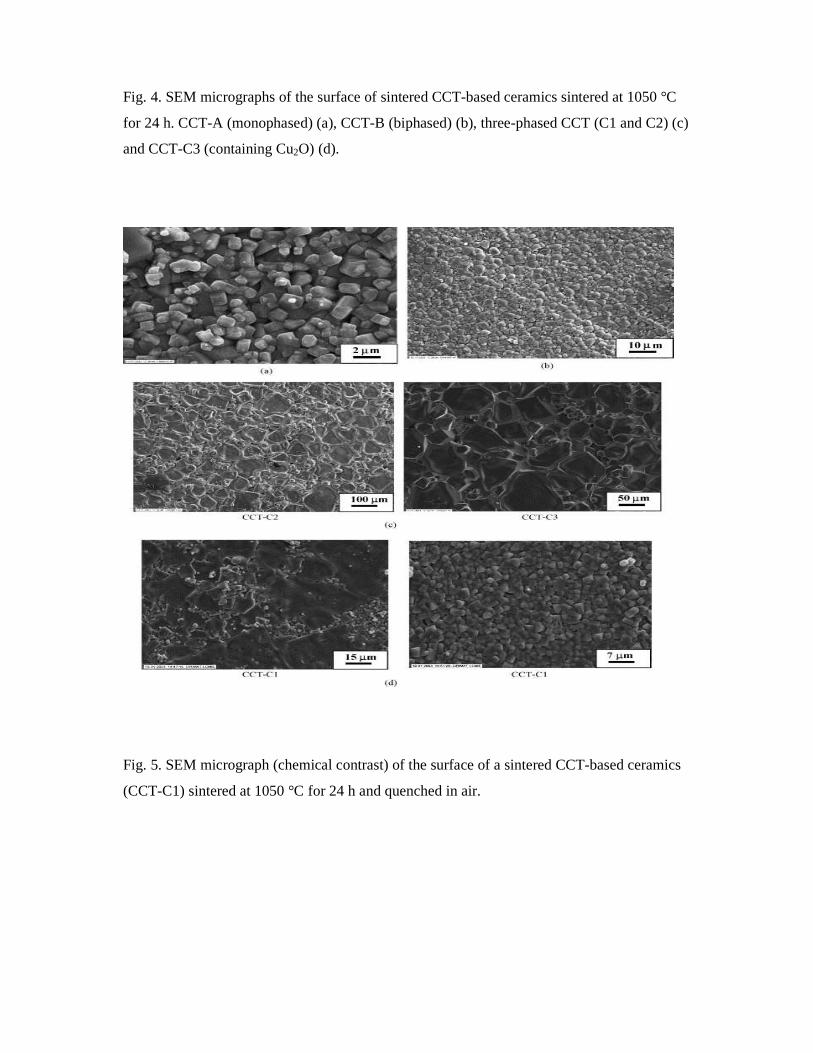
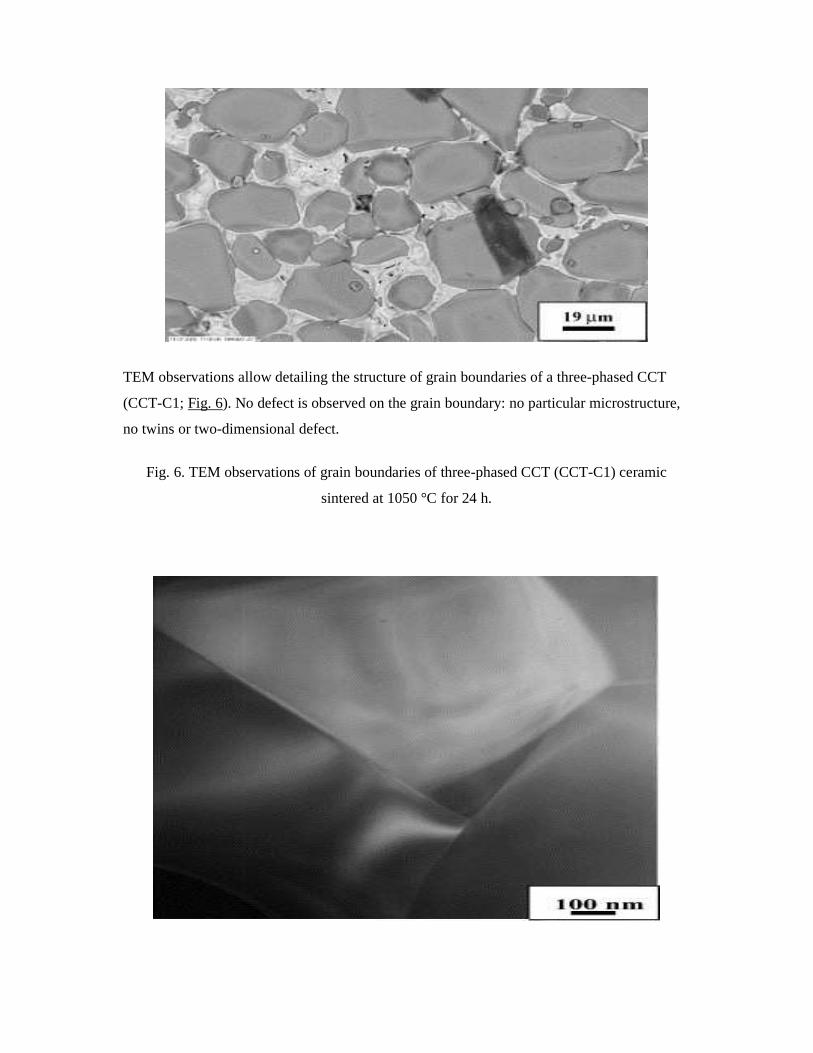
TEM observations allow detailing the structure of grain boundaries of a three-phased CCT
(CCT-C1; Fig. 6). No defect is observed on the grain boundary: no particular microstructure,
no twins or two-dimensional defect.
Fig. 6. TEM observations of grain boundaries of three-phased CCT (CCT-C1) ceramic
sintered at 1050 °C for 24 h.
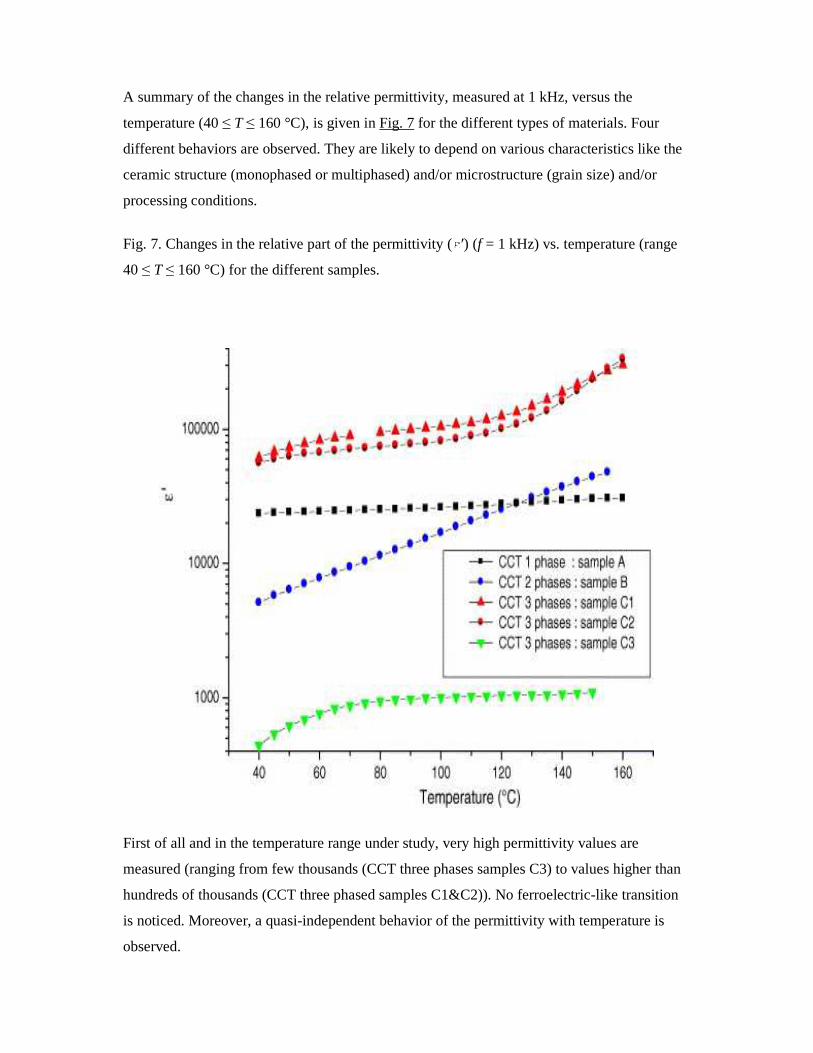
A summary of the changes in the relative permittivity, measured at 1 kHz, versus the
temperature (40 ≤ T ≤ 160 °C), is given in Fig. 7 for the different types of materials. Four
different behaviors are observed. They are likely to depend on various characteristics like the
ceramic structure (monophased or multiphased) and/or microstructure (grain size) and/or
processing conditions.
Fig. 7. Changes in the relative part of the permittivity ( ′) (f = 1 kHz) vs. temperature (range
40 ≤ T ≤ 160 °C) for the different samples.
First of all and in the temperature range under study, very high permittivity values are
measured (ranging from few thousands (CCT three phases samples C3) to values higher than
hundreds of thousands (CCT three phased samples C1&C2)). No ferroelectric-like transition
is noticed. Moreover, a quasi-independent behavior of the permittivity with temperature is
observed.
As expected the monophased CCT ceramics present the behavior already reported in the
literature.1, 2, 9 and 13 In this case, the permittivity is slightly higher than 20,000 and does not
depend on the temperature. Biphased CCT ceramics present a linear increase of the
permittivity which reaches a value of 20,000 at 120 °C. For temperature higher than 120 °C
the permittivity is larger than the value obtained for monophased CCT. Last, two different
behaviors are observed for the three-phased CCT materials. For the first type, permittivity
values greater than 105 are observed. This value is one order of magnitude larger than the
value of a monophased CCT material. This result is reproducible as it is shown for samples
C1 and C2. The changes in the permittivity values of these materials are slightly temperature
dependent. For the second type of materials (sample C3) the permittivity value is lower or
equal to 103, with a slight increase in the temperature range 40–60 °C. It is one order of
magnitude lower than the value of a monophased CCT material.
The frequency and the temperature range of the measurement have been extended for the
monophased and the three-phased materials.
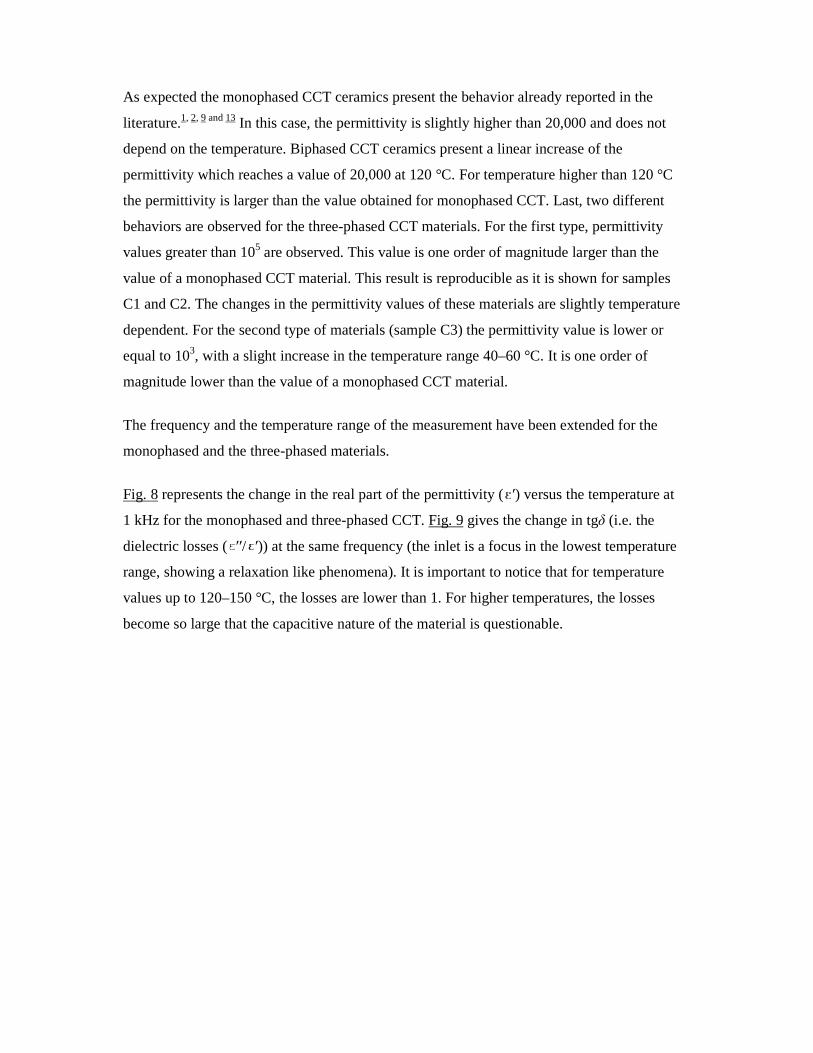
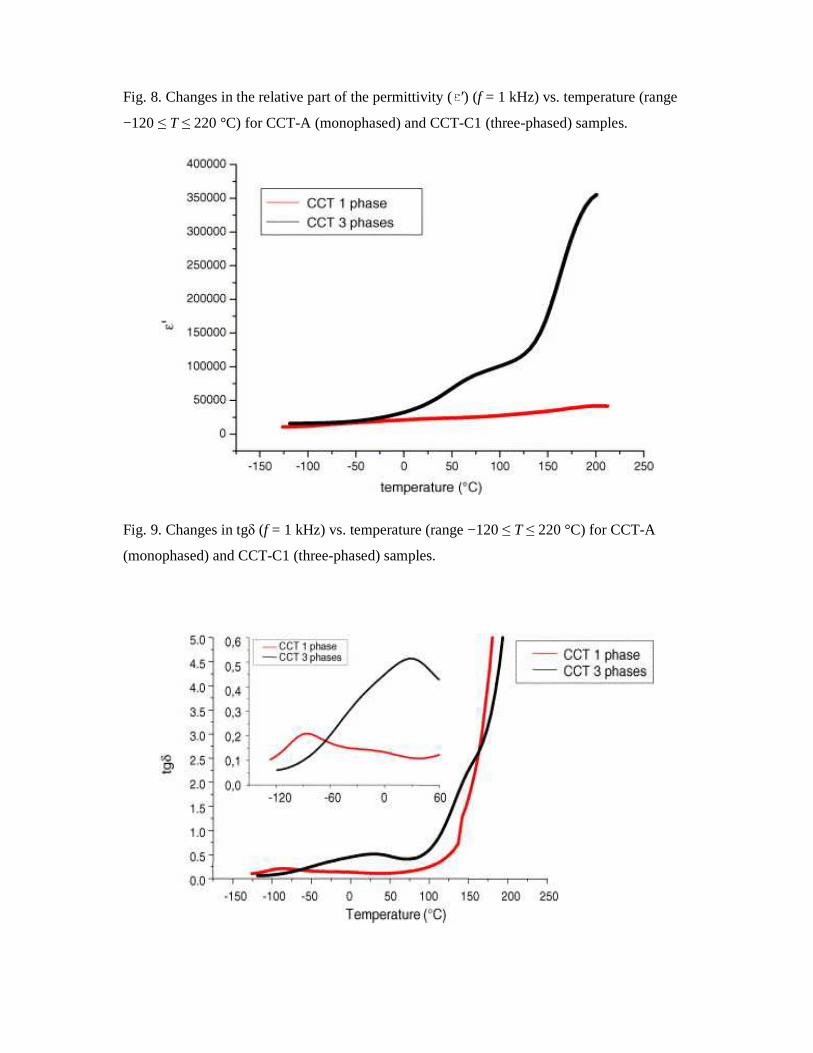
Fig. 8 represents the change in the real part of the permittivity ( ′) versus the temperature at
1 kHz for the monophased and three-phased CCT. Fig. 9 gives the change in tgδ (i.e. the
dielectric losses (′′/ ′)) at the same frequency (the inlet is a focus in the lowest temperature
range, showing a relaxation like phenomena). It is important to notice that for temperature
values up to 120–150 °C, the losses are lower than 1. For higher temperatures, the losses
become so large that the capacitive nature of the material is questionable.
Fig. 8. Changes in the relative part of the permittivity ( ′) (f = 1 kHz) vs. temperature (range
−120 ≤ T ≤ 220 °C) for CCT-A (monophased) and CCT-C1 (three-phased) samples.
Fig. 9. Changes in tgδ (f = 1 kHz) vs. temperature (range −120 ≤ T ≤ 220 °C) for CCT-A
(monophased) and CCT-C1 (three-phased) samples.
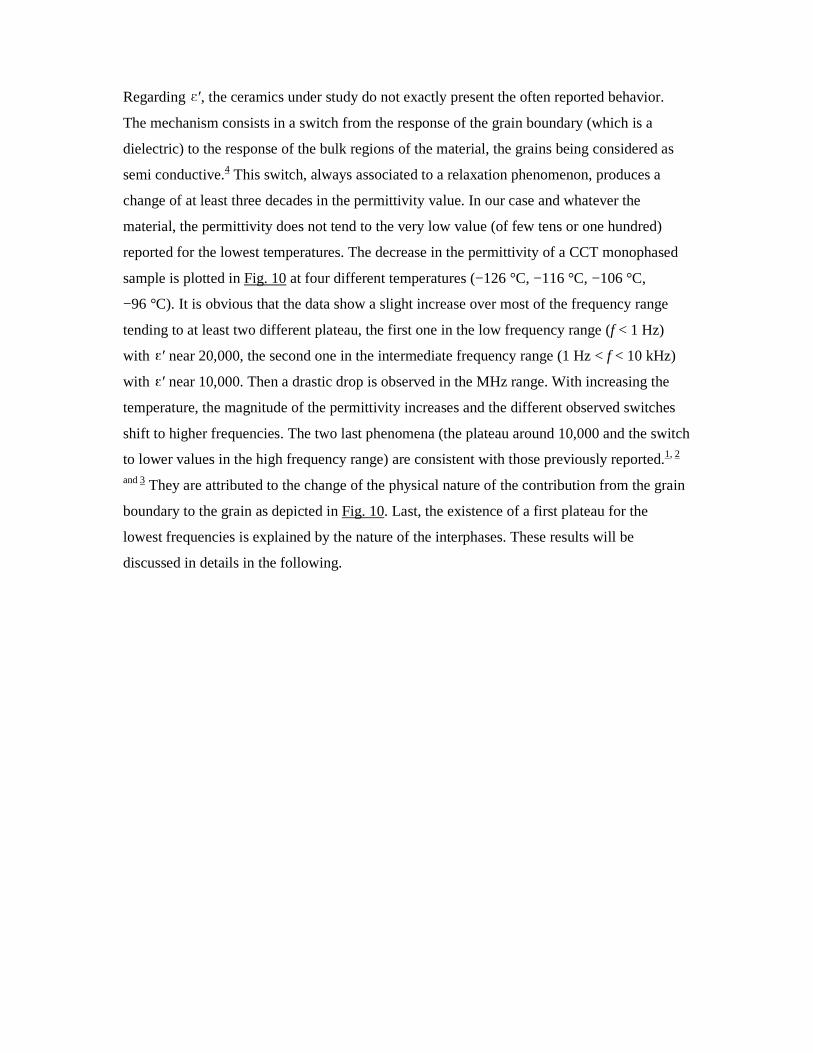
Regarding ′, the ceramics under study do not exactly present the often reported behavior.
The mechanism consists in a switch from the response of the grain boundary (which is a
dielectric) to the response of the bulk regions of the material, the grains being considered as
semi conductive.4 This switch, always associated to a relaxation phenomenon, produces a
change of at least three decades in the permittivity value. In our case and whatever the
material, the permittivity does not tend to the very low value (of few tens or one hundred)
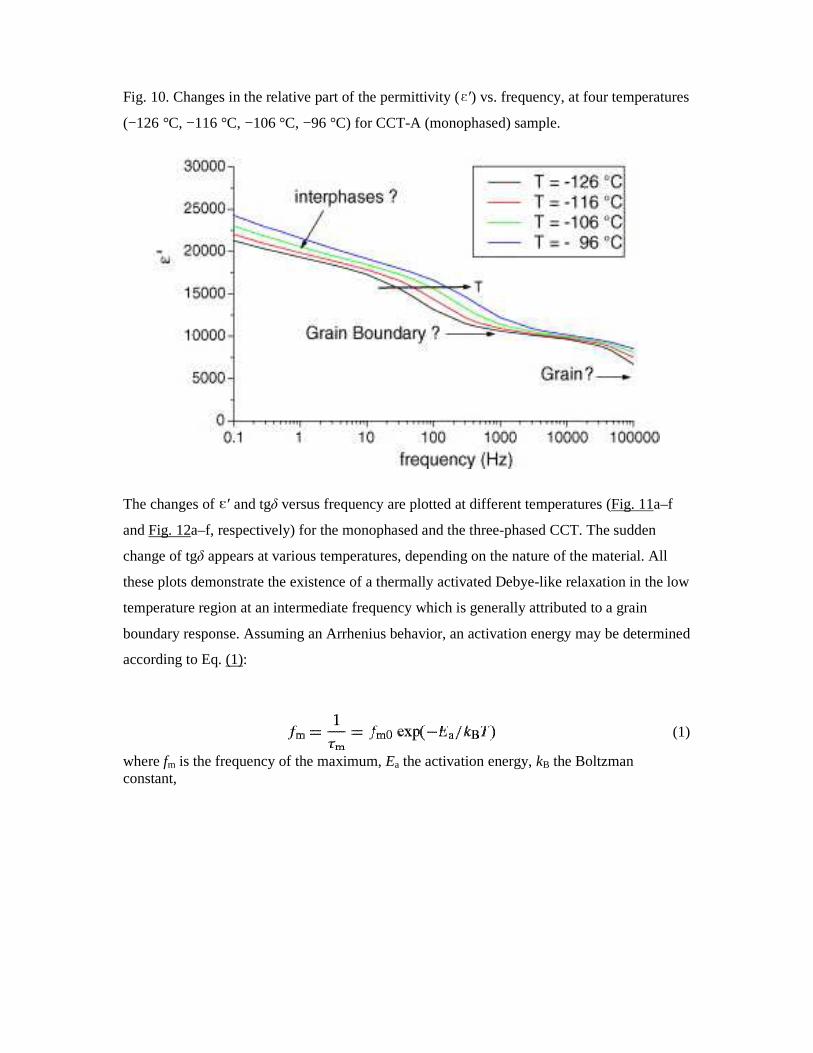
reported for the lowest temperatures. The decrease in the permittivity of a CCT monophased
sample is plotted in Fig. 10 at four different temperatures (−126 °C, −116 °C, −106 °C,
−96 °C). It is obvious that the data show a slight increase over most of the frequency range
tending to at least two different plateau, the first one in the low frequency range (f < 1 Hz)
with ′ near 20,000, the second one in the intermediate frequency range (1 Hz < f < 10 kHz)
with ′ near 10,000. Then a drastic drop is observed in the MHz range. With increasing the
temperature, the magnitude of the permittivity increases and the different observed switches
shift to higher frequencies. The two last phenomena (the plateau around 10,000 and the switch
to lower values in the high frequency range) are consistent with those previously reported.1, 2
and 3 They are attributed to the change of the physical nature of the contribution from the grain
boundary to the grain as depicted in Fig. 10. Last, the existence of a first plateau for the
lowest frequencies is explained by the nature of the interphases. These results will be
discussed in details in the following.
Fig. 10. Changes in the relative part of the permittivity ( ′) vs. frequency, at four temperatures
(−126 °C, −116 °C, −106 °C, −96 °C) for CCT-A (monophased) sample.
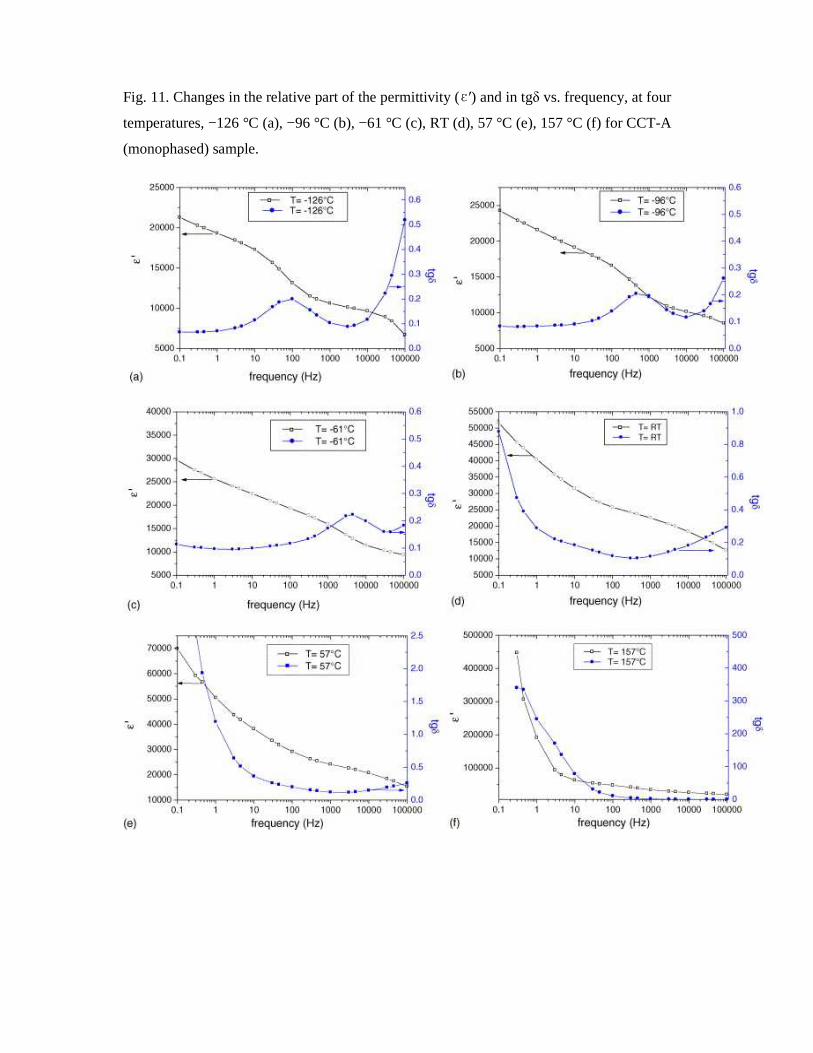
The changes of ′ and tgδ versus frequency are plotted at different temperatures (Fig. 11a–f
and Fig. 12a–f, respectively) for the monophased and the three-phased CCT. The sudden
change of tgδ appears at various temperatures, depending on the nature of the material. All
these plots demonstrate the existence of a thermally activated Debye-like relaxation in the low
temperature region at an intermediate frequency which is generally attributed to a grain
boundary response. Assuming an Arrhenius behavior, an activation energy may be determined
according to Eq. (1):
(1)
where fm is the frequency of the maximum, Ea the activation energy, kB the Boltzman constant,
Fig. 11. Changes in the relative part of the permittivity ( ′) and in tgδ vs. frequency, at four
temperatures, −126 °C (a), −96 °C (b), −61 °C (c), RT (d), 57 °C (e), 157 °C (f) for CCT-A
(monophased) sample.
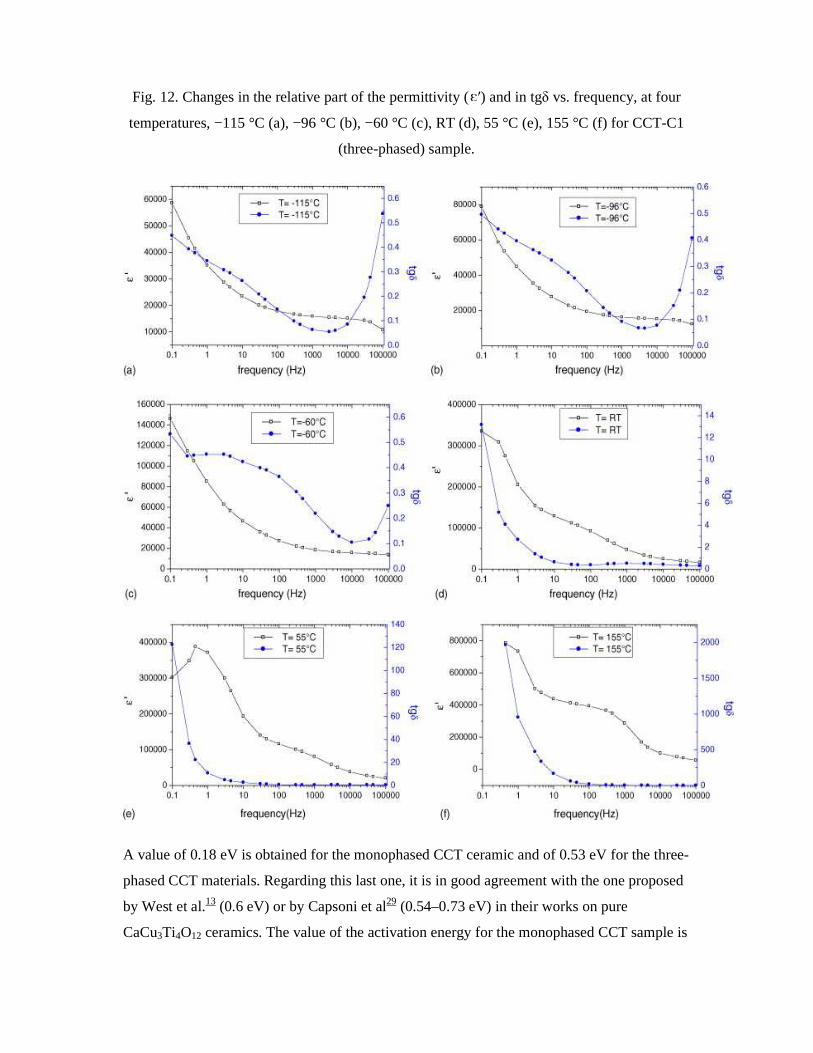
Fig. 12. Changes in the relative part of the permittivity ( ′) and in tgδ vs. frequency, at four
temperatures, −115 °C (a), −96 °C (b), −60 °C (c), RT (d), 55 °C (e), 155 °C (f) for CCT-C1
(three-phased) sample.
A value of 0.18 eV is obtained for the monophased CCT ceramic and of 0.53 eV for the three-
phased CCT materials. Regarding this last one, it is in good agreement with the one proposed
by West et al.13 (0.6 eV) or by Capsoni et al29 (0.54–0.73 eV) in their works on pure
CaCu3Ti4O12 ceramics. The value of the activation energy for the monophased CCT sample is
quite different, ranging between the grain barrier one (near 0.6 eV) and the bulk one
(0.09 eV), according to the values determined by these authors.
In summary and, whatever the material under study, (mono, bi or three-phased CCT):
– The global “classical” behavior of CCT samples is observed,
– The lowest value of the permittivity measured is at least one order of magnitude larger than
the value reported in the literature. However, as illustrated in Fig. 10, another drop (associated
to a relaxation phenomena) is probably occurring in a frequency range higher than 1 MHz at
the lowest measurement temperature (−126 °C in this case). This drop probably leads to
another plateau in the permittivity value which could be measured at very low temperature (in
the 10–100 K range). This temperature range is unfortunately not available in our laboratory.
– A very high value (near 400,000) is obtained for the three phases CCT at 200 °C. At this
temperature, the capacitive nature of the material is questionable since the dielectric losses are
very high. However, if we still consider it as a dielectric ceramic, the temperature at which
this value is obtained is much lower than the one reported by Subramanian1 (400 °C) to reach
the same order of magnitude. Note that in1 no indication of the losses is given.
Therefore, the materials under study have properties which seem to depend on their structure
(nature of the different phases). These results and their most likelihood origins are discussed
in the following.
4. Discussion
It is obvious that, whatever the material considered (CCT-A, B or C), its electrical behavior is
in marked contrast with the ferroelectric one resulting from structural distortion since no
structural phase transition is detected. Therefore, this cannot be invoked to explain the
electrical properties.
The three kinds of materials essentially differ from the overall chemical composition (Table
1), leading both to different grain sizes (Table 2), and particularly to different structures
(monophased CCT or multiphased materials). The copper oxide phase plays an important role
in these multiphased ceramics, both from the microstructural properties (grain size) and from
the electrical properties. As a matter of fact, CuO has been used as an additive to lower the
sintering temperature, for example in (Ba0.8Sr0.2)(Ti0.9Zr0.1)O321 material which is used as a
surface barrier layer capacitor. Its melting during the sintering enhances the grain growth. In
these materials, a bimodal grain size distribution with fine grained matrix containing grains
exhibiting an exaggerated growth was observed. On the other hand, the amount of CuO in the
ceramic seems to play an important role. Hence, for BSTZ materials, 0.5 wt.% is insufficient
to improve the dielectric characteristics while more than 1 wt.% is deleterious.21 In our case,
an amount of more than 1 or 2 wt.% of CuO is present in the ceramics. Moreover, the huge
grains observed for the ceramics containing the copper oxide (CCT three-phased series) are
also probably related to the appearance of a liquid phase that “wets” the grains during the
sintering.
Therefore, the role played by the grain size (strongly related to the previous discussion) has to
be emphasized too. The largest the grain size (three-phased CCT) the highest the permittivity
value. Hence, the monophased CCT sample presenting a sharp size distribution of small
grains has the lowest permittivity. The biphased CCT sample (CCT-B) has an “in between”
behavior since its permittivity value increases linearly with temperature. The permittivity is
lower than the one of monophased CCT for T < 120 °C and then becomes higher as the
temperature increases. Last, the largest permittivity values are obtained for the three-phased
ceramics (CCT-C1, and C2), i.e. the ones presenting the largest grain size. Such a behavior
has already been reported in La1.5Sr0.5NiO4 phase22 or in CCT23 and 24. It leads to the same
conclusions, i.e. an increase in the grain size involves an increase in permittivity.
Finally, the particular high frequency behavior (i.e. the drop and the plateau to the low
permittivity value) usually mentionned in the literature for “pure” CCT samples, is not
observed in our monophased samples, even at the lowest temperature investigated. The low
value of the permittivity observed once the drop has occurred is associated to the bulk (i.e. the
grain itself). It is consistent with the behavior observed in other semiconducting perovskite.
On the other hand, it is well known that the relaxation frequency depends on the size of the
relaxing species. Our results tend to prove that the grain size of monophased CCT materials
synthesized using coprecipitation is probably lower than any other CCT material reported in
the literature. Another hypothesis to explain the difference observed is that the internal
structure of the grain itself may be different in our case. However, the sole grain size variation
cannot account for the permittivity value nor for its dependence on the number of phases
present in the material.
The most plausible explanation, even if the discussion is still open, is an extrinsic origin. It is
not the intrinsic structure of the material itself which confers the properties (except for the
ones which could be measured at very high frequency or at very low temperature, that are
related to the grain itself).
The extrinsic explanation rests on the consideration of the interfaces. Two types of interfaces
have to be considered:
– the grain boundaries leading to an internal barrier layer capacitance effect13,
– the electrode interfaces leading to electrode polarization effects.25
This last point is associated to thin depletion layers which may exist at the electrodes/bulk
interfaces, due to the formation of Schottky diodes. Such behavior has been observed in
CaCu3Ti4O12 or Cu2Ta4O12. The grains being conductors or at least semi-conductors, these
depletion layers lead to the “apparent” colossal value of the permittivity. For the samples
under study, the results obtained on CCT-C1 and CCT-C2, whose general characteristics
(grain size, chemical composition, …) and metallization do not differ from sample CCT-C3,
tend to demonstrate that, at least in our case, the electrode polarization effect is not the
relevant mechanism.
The high “apparent” permittivity is therefore probably associated with an internal barrier layer
capacitor: the bulk of the grains would behave like other semiconducting perovskites while
the grain boundaries and/or the shell would be insulating layers. Hence, for the same sample
thickness, the grain size and the nature of the grain boundary are likely to have an impact on
the final electrical properties. Decreasing the number of grain boundaries (by increasing the
grain size) and keeping the other parameters constant, would produce an increase in the
apparent permittivity, according to relation 2:
(2)
where d is the grain size, t the boundary layer thickness and b the permittivity of the insulating layer.25 and 26
For the biphased CCT samples, the existence of CaTiO3 (a low loss dielectric ceramic of
permittivity 17027 and 28) could be considered as responsible at the same time of an increase in
the value of the insulating layer permittivity and of a modification of the conductivity of the
grains. Such an assumption could explain both the linear behavior observed and the changes
in the tgδ versus frequency. The theoretical expression of the losses (tgδ) is reminded:
(3)
where ε″r corresponds to the part of the losses associated to the relaxation phenomena and σ/ω 0 the part due to a pure conduction mechanism, with σ the conductivity, ω the pulsation and 0 the vacuum permittivity.
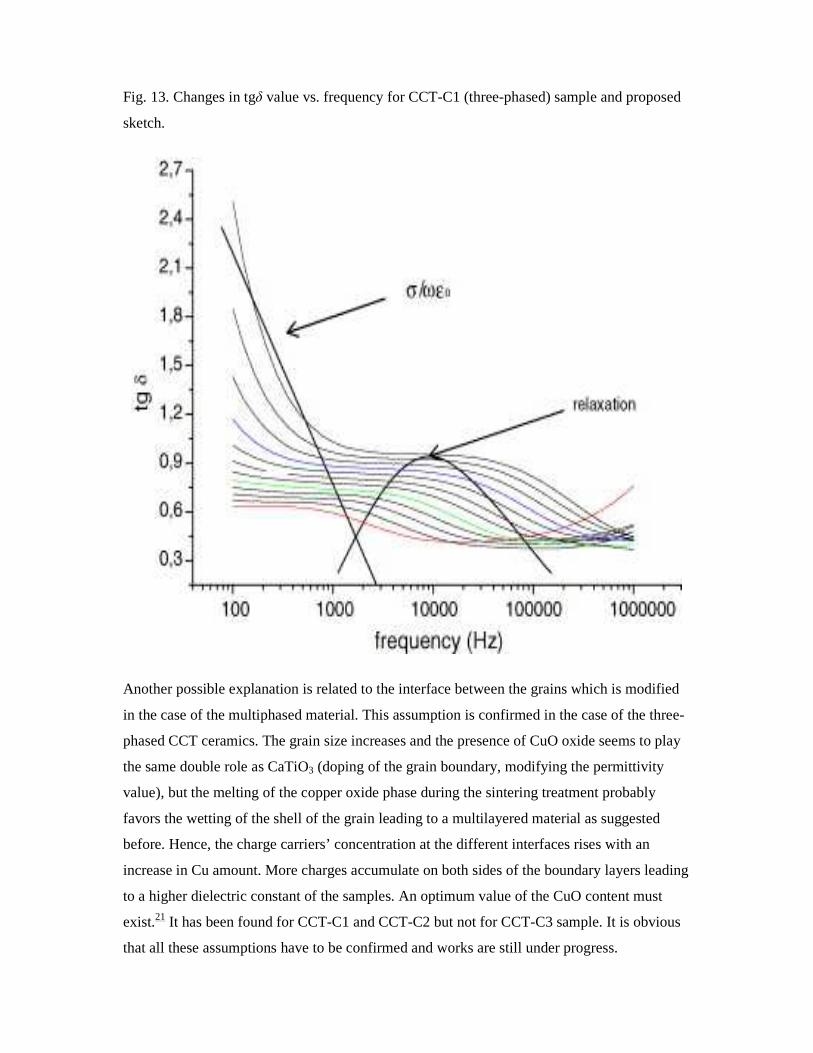
In Fig. 13, the plot of tgδ versus the frequency for different temperatures and the associated
sketch makes clearly appear the possible existence of the sum of these two mechanisms.
Fig. 13. Changes in tgδ value vs. frequency for CCT-C1 (three-phased) sample and proposed
sketch.
Another possible explanation is related to the interface between the grains which is modified
in the case of the multiphased material. This assumption is confirmed in the case of the three-
phased CCT ceramics. The grain size increases and the presence of CuO oxide seems to play
the same double role as CaTiO3 (doping of the grain boundary, modifying the permittivity
value), but the melting of the copper oxide phase during the sintering treatment probably
favors the wetting of the shell of the grain leading to a multilayered material as suggested
before. Hence, the charge carriers’ concentration at the different interfaces rises with an
increase in Cu amount. More charges accumulate on both sides of the boundary layers leading
to a higher dielectric constant of the samples. An optimum value of the CuO content must
exist.21 It has been found for CCT-C1 and CCT-C2 but not for CCT-C3 sample. It is obvious
that all these assumptions have to be confirmed and works are still under progress.
5. Conclusion
Different powders containing several phases, CaCu3Ti4O12 (major phase), CaTiO3 and CuO
have been obtained via the calcination at 900 °C of the oxalate precursors, synthesized by
coprecipitation. The corresponding ceramics present huge relative permittivity values and
relatively low losses. The presence of additional phases (CaTiO3 and copper oxides, CuO
or/and Cu2O) gives these ceramics a behavior different from the one observed in pure CCT
materials. The relative permittivity is significantly higher than the one reported up to now
(both at low temperature and at 160 °C).
These CCT ceramics, presenting a real part of the permittivity higher than 250,000, are
considered for internal barrier layer capacitor (IBLC) applications. It is even more remarkable
that these high values can be obtained from a single step-processing route, in air, at relatively
low temperature. It implies that reproducible and fine tuning of the dielectric properties of this
material is possible.
Acknowledgements
The authors thank Ch. Calmet for performing the SEM pictures and J.J. Demai for the TEM
observations.
References
M.A. Subramanian, D. Li, N. Duan, B.A. Reisner and A.W. Sleight, High dielectric constant in ACu3Ti4O12 and ACu3Ti3FeO12, J. Solid State Chem. 151 (2000), pp. 323–325.
A.P. Ramirez, M.A. Subramanian, M. Gardel, G. Blumberg, D. Li, T. Vogt and S.M. Shapiro,
Giant dielectric constant response in a copper-titanate, Solid State Commun. 115 (2000), pp.
217–220.
C.C. Homes, T. Vogt, S.M. Shapiro, S. Wakimoto and A.P. Ramirez, Optical response of high
dielectric constant perovskite related oxide, Science 293 (2001), pp. 673–676.