Page 1
DIETARY ALOE AND GARLIC CRUDE POLYSACCHARIDES: EFFECTS ON
GROWTH PERFORMANCE, HAEMATOLOGICAL, AND BODY COMPOSITION
PARAMETERS OF CLARIAS GARIEPINUS
A DISSERTATION SUBMITTED IN FULFILLMENT
OF THE REQUIREMENTS FOR THE DEGREE OF
DOCTOR OF PHILOSOPHY (FISHERIES AND AQUATIC SCIENCES)
OF
THE UNIVERSITY OF NAMIBIA
BY
NDAKALIMWE NAFTAL GABRIEL
(200516566)
April 2021
MAIN SUPERVISOR: Dr. M.R Wilhelm (Department of Fisheries and Aquatic Sciences)
CO-SUPERVISORS: Prof. P. M. Chimwamurombe (Department of Natural and Applied
Sciences, NUST)
Dr. H-M Habte-Tsion (Kentucky State University, USA)
Page 3
i
ABSTRACT Fish health management in aquaculture is one of the main challenges across the globe
(including Namibia), worsened especially by the wide adoption of intensive farming
systems. Nowadays, attention is focused on the use of medicinal herbs as alternative to
unsustainable pharmaceutical drugs in aquaculture. This study aimed to develop and
introduce phytogenic diets made up of aloe vera (Aloe vera), and garlic (Allium sativum)
crude polysaccharide extracts (separately and in mixture), which would promote growth,
feed utilization, health, meat quality, and increase resistance against stress in African
catfish, Clarias gariepinus reared in intensive aquaculture systems.
First, this study evaluated the effects of dietary A. vera crude polysaccharides on growth
performance, feed utilization, haemato-biochemical parameters, and resistance against
low water pH in African catfish fingerlings. Fish were divided into five triplicate groups
before being fed feeds supplemented with control 0%, 0.5%, 1.0%, 2.0% and 4.0% A.
vera for 60 d. Fish fed a 1.0% A. vera supplemented diet showed a significant increase
in all growth parameters compared to the control (P < 0.05). The protein efficiency ratio
(PER) was significantly higher in fish fed 1.0% A. vera supplemented diet (1.31 0.22)
compared to unsupplemented fish (0.85 0.10) and those fed 4.0% A. vera
supplemented diet (0.85 0.14) (P < 0.05). The optimal dietary A. vera polysaccharide
crude extract requirement was estimated to be 1.77% (y = - 0.043x2 + 0.152x + 0.593, P
= 0.045) and 1.79 % A. vera (y = -2.778x2 + 9.95x + 29.29, P = 0.037), for growth and
feed utilization respectively. Overall, A. vera extracts improved haemato-biochemical
indices in A. vera supplemented fish when compared to unsupplemented ones, but
decreased some of the indices at the 4.0% A. vera level. After blood sampling, fish were
subjected to a low water pH (5.2 - 5.5) challenge and survival probability was measured.
Fish fed diets supplemented with 1.0%, and 2.0% A. vera showed higher survival
probability (above 70%) throughout the challenge period compared to the control (below
70%) and those fed the 4% A. vera supplemented diet (below 60%).
Page 4
ii
Finally, this study evaluated the effects of a dietary mixture of A. vera and A. sativum
polysaccharides (control 0%, 0.5%, 1.0%, 2.0% and 4.0%; 1:1 ratio) on growth
performance, feed utilization, haematological parameters, whole body composition, and
resistance against low water pH of African catfish juveniles. Fish fed a 1.0% and 0.5%
A. vera-A. sativum mixture supplemented diet presented a significant increase in all
growth parameters compared to all others (P < 0.05). Similarly, feed utilization indices
significantly improved in fish fed diet supplemented with 1.0% A. vera-A. sativum
mixture when compared to unsupplemented ones, and those fed 2.0% and 4.0% A. vera-
A. sativum mixture (P < 0.05). The optimum dietary A. vera-A. sativum mixture
inclusion level was estimated to be 0.70% and 0.66% for growth and feed utilization
respectively. A. vera-A. sativum mixture extracts improved haematological indices when
compared to unsupplemented fish, but a significant increase was only observed in red
blood cells (RBC) of fish fed 1.0% (1.92 0.01) and in platelets (PLT) of fish fed 2.0%
A. vera-A. sativum mixture supplemented diet (38.17 4.13) when compared to
unsupplemented ones (RBC = 1.40 0.15; PLT = 20.66 3.75) (P < 0.05). When
subjected to a low water pH (5.2 - 5.5) challenge after blood sampling, fish fed 1.0% A.
Second, this study evaluated the effects of dietary garlic crude polysaccharide (GPE)
(control 0%, 0.5%, 1.0%, 2.0%, and 4.0%) on growth, feed utilization, haematological
parameters, and resistance against low water pH in African catfish juveniles. Fish fed
GPE supplemented diets showed a significant improvement in all growth parameters and
all feed utilization indices compared to the control (P < 0.05). A significant increase was
only observed in the red blood cells (RBC 1012/L) for those fed 0.5% (2.01 0.07),
1.0% (1.96 0.22), and 2.0% (1.88 0.12) and in mean corpuscular haemoglobin
concentration (MCHC g/L) for those fed 0.5% (553.83 6.21), and 1.0% (554.83
7.82) compared to all others (P < 0.05). After blood sampling, fish were subjected to a
low water pH (5.2 - 5.5) challenge. No significant difference was observed in the
cumulative survival between GPE supplemented groups and a control (P > 0.05). The
same was observed for whole body composition and organo-somatic indices. A dietary
inclusion level of 1.77% (y = -11.89x2 + 41.688 + 167, P = 0.001) and 1.69% of garlic
(y = - 0.056x2 + 0.189x + 0.807, P = 0.031) was estimated as optimum for growth and
feed utilization in C. gariepinus juvenile culture, respectively.
Page 5
iii
vera-A. sativum mixture showed the highest survival probability (above 80%)
throughout the challenge period among groups. Fish fed dietary A. vera-A. sativum
mixture of 2.0% (6.69 0.36%), followed by those fed 4.0% (7.18 0.24%) and 1.0%
(7.44 0.29) demonstrated a significantly lower lipid content compared to those fed a
control diet (9.31 0.71%) (P < 0.05).
The significance of this study is that it introduces A. vera, A. sativum crude
polysaccharides extracts and their mixtures as good growth promoters, feed utilization
enhancers, and good health promoters in C. gariepinus culture. The findings of this
study encourage further studies on these herbs as potential fish growth and health
management agents in the Namibian aquaculture and beyond, to ensure the application
of effective products that have no harmful effects to man, animals and the environment.
In addition, the study expands the existing work and knowledge on A. vera and A.
sativum as medicinal herbs in aquaculture. The study recommends future studies to
investigate the effects of several factors (i.e. temperature, extracts combination ratios),
that could influence the performance of herbal extracts in fish for better optimization of
A. vera, A. sativum crude polysaccharide extracts, and their mixture as dietary
supplement in aquaculture.
Keywords: Aquaculture, Clarias gariepinus, Herbs, Immunostimulants, Stress
resistance.
Page 6
iv
LIST OF PUBLICATIONS/ CONFERENCES 1) Gabriel NN, Wilhelm MR, Habte-Tsion HM, Chimwamurombe P, Omoregie E,
Iipinge LN, Shimooshili K. 2019. Effect of dietary Aloe vera polysaccharides
supplementation on growth performance, feed utilization, hemato-biochemical
parameters, and survival at low pH in African catfish (Clarias gariepinus)
fingerlings. International Aquatic Research 11: 57-72.
2) Gabriel NN. 2019. Review on the progress in the role of herbal extracts in tilapia
culture. Cogent Food & Agriculture 5: 1619651.
3) Gabriel NN, Wilhelm MR, Habte-Tsion HM, Chimwamurombe P, Omoregie E.
2019. Dietary garlic (Allium sativum) crude polysaccharides supplementation on
growth, haematological parameters, whole body composition and survival at low
water pH challenge in African catfish (Clarias gariepinus) juveniles. Scientific
African. https://doi.org/10.1016/j.sciaf.2019.e00128.
4) Gabriel NN, Wilhelm MR, Habte-Tsion HM, Chimwamurombe P, Omoregie E.
2021. The effects of dietary garlic (Allium sativum) and Aloe vera crude extract
mixtures supplementation on growth performance, feed utilization,
haematological parameters, whole body composition and survival at low water
pH challenge in African catfish (Clarias gariepinus) juveniles. Scientific African.
https://doi.org/10.1016/j.sciaf.2020e00671.
5) Gabriel NN. 2019. Aloe vera polysaccharides crude extracts: potential growth
promoters and immunostimulants in aquaculture. Oral presentation at SADC
Academia-Industry-Society workshop (20-22 May 2019), Botswana Institute for
Technology Research and Innovation (BITRI), Botswana.
Page 7
v
TABLE OF CONTENTS
ABSTRACT .................................................................................................................. i
LIST OF PUBLICATIONS/ CONFERENCES ......................................................... iv
TABLE OF CONTENTS ............................................................................................. v
LIST OF FIGURES .................................................................................................... ix
LIST OF TABLES .................................................................................................... xiii
ACKNOWLEDGEMENTS ...................................................................................... xix
DEDICATION .......................................................................................................... xxi
DECLARATION ..................................................................................................... xxii
CHAPTER ONE: INTRODUCTION ......................................................................... 1
1.1 General introduction .......................................................................................... 1
1.2 Statement of the problem ................................................................................... 2
1.3 Objectives of the study ....................................................................................... 3
1.3.1 Specific objectives ......................................................................................... 4
1.4 Hypotheses of the study ..................................................................................... 6
1.4.1 Aloe vera polysaccharides ............................................................................. 6
1.4.2 Allium sativum polysaccharides ..................................................................... 7
1.4.3 The combination of A. vera and A. sativum crude polysaccharides extracts .... 8
1.5 References........................................................................................................... 9
CHAPTER TWO: LITERATURE REVIEW .......................................................... 15
2.1 Introduction...................................................................................................... 15
2.2 The medicinal use of garlic, Allium sativum .................................................... 18
2.3 Previous studies on garlic extracts in aquaculture ......................................... 22
2.3.1 Garlic effects on growth and feed utilization of fish ..................................... 23
2.3.2 Garlic effects on haemato-biochemical indices of fish ................................. 28
2.4 The medicinal use of Aloe vera ......................................................................... 35
2.5 Previous studies on Aloe vera extracts in aquaculture .................................... 38
2.5.1 Aloe vera effects on fish growth and feed utilization parameters .................. 38
Page 8
vi
2.5.2 Aloe vera effects on fish haemato-biochemical indices (Table 2.6) .............. 42
2.6 Gaps in the existing knowledge and the way forward .................................... 47
2.7 References......................................................................................................... 49
CHAPTER THREE: EFFECT OF DIETARY ALOE VERA CRUDE
POLYSACCHARIDES SUPPLEMENTATION ON GROWTH PERFORMANCE,
FEED UTILIZATION, HAEMATO-BIOCHEMICAL PARAMETERS, AND
SURVIVAL AT LOW PH IN AFRICAN CATFISH (CLARIAS GARIEPINUS)
FINGERLINGS ......................................................................................................... 74
Abstract .................................................................................................................. 74
3.1 Introduction...................................................................................................... 76
3.2 Materials and methods ..................................................................................... 78
3.2.1 Experimental fish and management ............................................................. 78
3.2.2 Experimental diets and growth trial ............................................................. 79
3.2.3 Evaluation of growth and feed utilization parameters ................................... 81
3.2.4 Haematological-biochemical parameters ..................................................... 83
3.2.5 Proximate body composition analysis. ......................................................... 84
3.2.6 In situ low pH challenge experiment ............................................................ 84
3.2.7 Statistical analyses....................................................................................... 85
3.3 Results .............................................................................................................. 86
3.3.1 Growth performance and feed utilization parameters ................................... 86
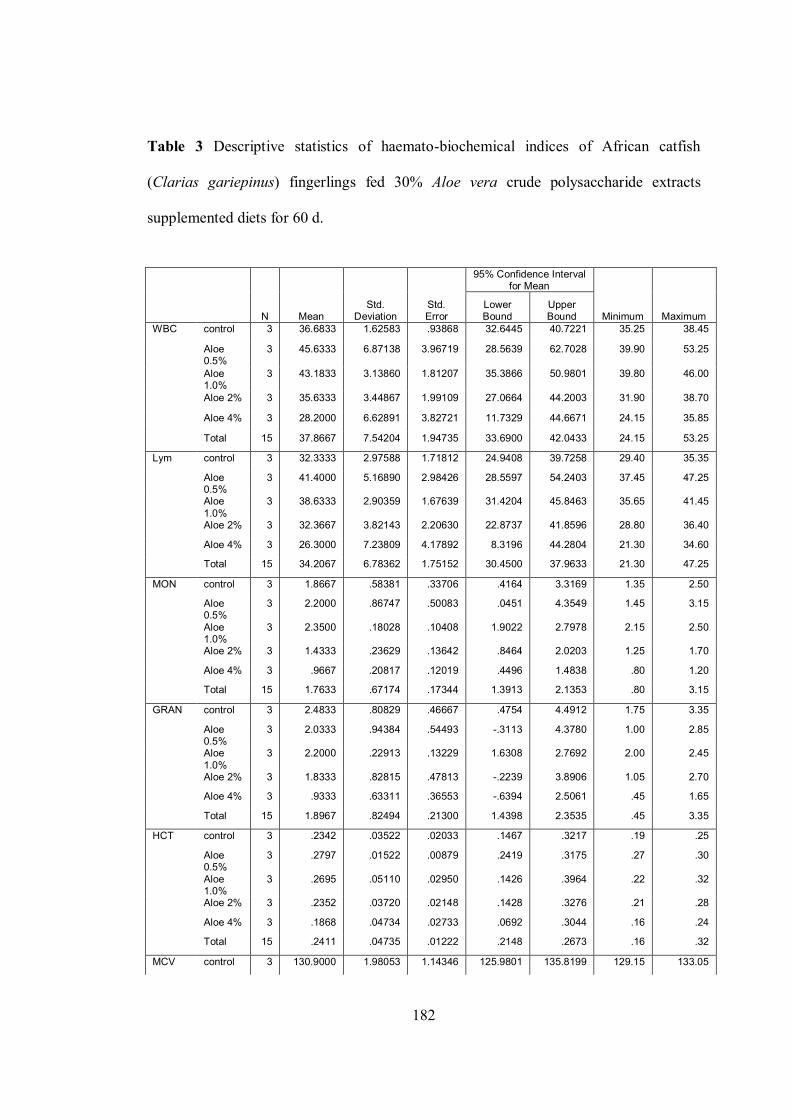
3.3.2 Haemato-biochemical parameters ................................................................ 90
3.3.3 Proximate body composition ....................................................................... 96
3.3.4 Low pH challenge experiment ..................................................................... 96
3.4 Discussion ......................................................................................................... 97
CHAPTER FOUR: DIETARY GARLIC (ALLIUM SATIVUM)
SUPPLEMENTATION EFFECT ON GROWTH, HAEMATOLOGICAL
PARAMETERS, WHOLE BODY COMPOSITION AND SURVIVAL AT LOW
PH IN AFRICAN CATFISH (CLARIAS GARIEPINUS) JUVENILES ................ 116
Abstract ................................................................................................................ 116
4.2 Materials and methods ................................................................................... 119
4.2.1 Fish ........................................................................................................... 119
Page 9
vii
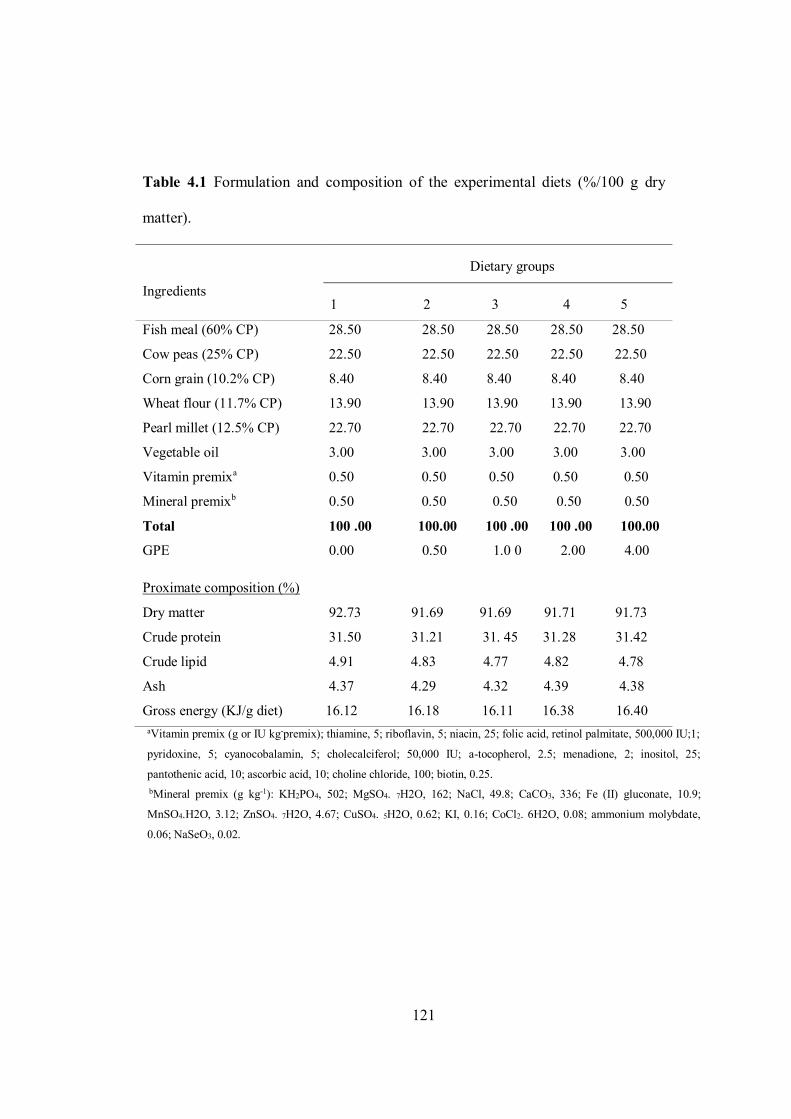
4.2.2 Feeding regimes ........................................................................................ 119
4.2.3 Growth and feed utilization parameters...................................................... 122
4.2.4 Haematological parameters........................................................................ 122
4.2.5 Proximate body composition analysis ........................................................ 122
4.2.6 Low pH stress challenge experiment.......................................................... 122
4.2.7 Statistical analyses..................................................................................... 123
4.3 Results ............................................................................................................ 124
4.3.1 Fish growth and feed utilization ................................................................. 124
4.3.2 Haematological indices.............................................................................. 127
4.3.3 Proximate body composition ..................................................................... 131
4.3.4 Low pH challenge ..................................................................................... 131
4.4 Discussion ....................................................................................................... 132
4.5 Reference ........................................................................................................ 136
CHAPTER FIVE: THE EFFECTS OF DIETARY GARLIC (ALLIUM SATIVUM)
AND ALOE VERA POLYSACCHARIDES (1:1 MIXTURES)
SUPPLEMENTATION ON GROWTH, HAEMATOLOGICAL PARAMETERS,
WHOLE BODY COMPOSITION, AND SURVIVAL AT LOW PH IN AFRICAN
CATFISH (CLARIAS GARIEPINUS) JUVENILES .............................................. 142
Abstract ................................................................................................................ 142
5.1 Introduction.................................................................................................... 144
5.2 Materials and methods ................................................................................... 146
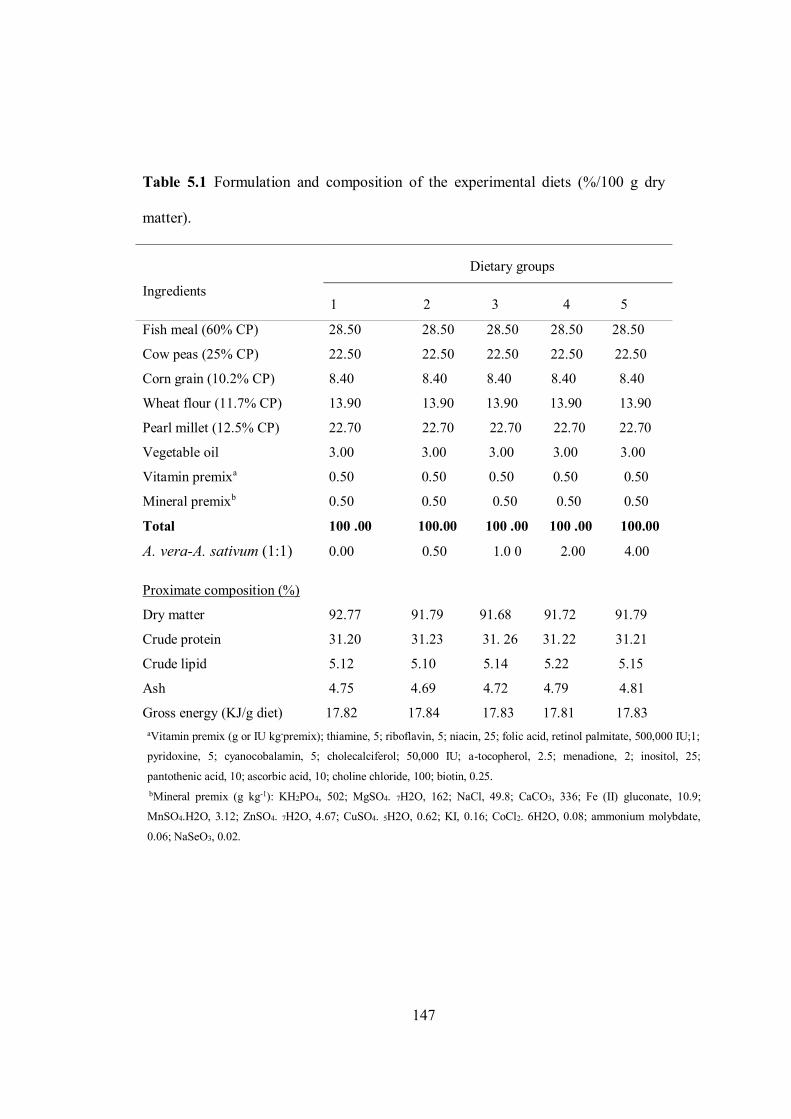
5.2.1 Preparation of experimental diets ............................................................... 146
5.2.2 Fish and experimental design..................................................................... 148
5.2.3 Growth and feed utilization parameters...................................................... 148
5.2.4 Haematological parameters........................................................................ 149
5.2.5 Proximate composition analysis ................................................................. 149
5.2.6 Low pH stress challenge experiment.......................................................... 149
5.2.7 Statistical analysis ..................................................................................... 149
5.3.1 Growth and feed utilization parameters...................................................... 150
5.3.2 Haematological parameters........................................................................ 154
5.3.3 Low pH stress challenge experiment.......................................................... 158
Page 10
viii
5.3.4 Proximate body composition ..................................................................... 159
5.4 Discussion ....................................................................................................... 160
CHAPTER 6: CONCLUSIONS AND RECOMMENDATIONS .......................... 174
6.1 Conclusions ..................................................................................................... 174
6.2 Recommendations .......................................................................................... 178
APPENDICES.......................................................................................................... 180
Appendix A .......................................................................................................... 180
Appendix B ........................................................................................................... 193
Appendix C .......................................................................................................... 207
Appendix D .......................................................................................................... 220
Page 11
ix
LIST OF FIGURES
Figure 2.1 Number of published articles about the use of plants, algae, or natural
products in aquaculture (Google Scholar data). -------------------------------------- 17
Figure 2.2 Herbal extracts roles and main action mechanisms when
supplemented in fish (adapted from Pu et al. 2017). -------------------------------- 17
Figure 2.3 Chemical structures of the most bioactive compounds (alliin, allicin,
ajoene, allyl sulfide, and 1,2 vinyldthiin from Allium sativum (adapted from
Martin et al. 2016). ---------------------------------------------------------------------- 20
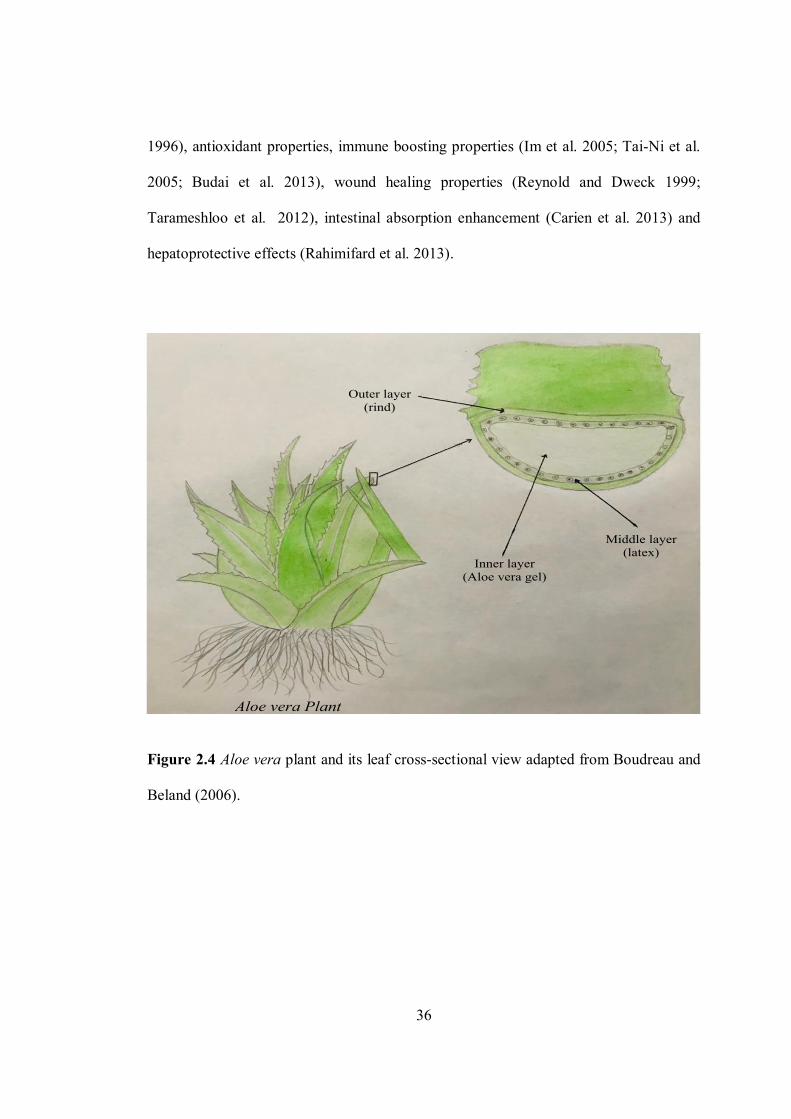
Figure 2.4 Aloe vera plant and its leaf cross-sectional view adapted from
Boudreau and Beland (2006). ---------------------------------------------------------- 36
Figure 3.1 Final weight (FW) (A), weight gain (WG) (B), specific growth rate
(SGR) (C), and absolute growth rate (AGR) (D) of African catfish, C.
gariepinus fingerlings fed four A. vera crude polysaccharide extracts
supplemented diets and an unsupplemented diet (control) for 60 d. --------------- 88
Figure 3.2 Feed intake (FI) (A), feed conversion ratio (FCR) (B), feed efficiency
ratio (FER) (C), and protein efficiency ratio (PER) (D) of the African catfish,
C. gariepinus fingerlings fed four A. vera crude polysaccharide extracts
supplemented diets and an unsupplemented diet (control) for 60 days. ----------- 90
Figure 3.3 Red blood cell counts (RBC) (A), hematocrit levels (B), Hemoglobin
concentration (C), and platelet counts (PLT) (D) of African catfish, C.
gariepinus fingerlings fed four A. vera crude polysaccharide extracts
supplemented diets and unsupplemented diet (control) for 60 d. ------------------ 91
Figure 3.4 Mean corpuscular volume (MCV) (A), mean corpuscular hemoglobin
(MCH) (B), mean corpuscular hemoglobin concentration (MCHC) (C), and
red blood cell distribution width (RDWa) (D) of African catfish, C.
gariepinus fingerlings fed four A. vera crude polysaccharide extracts
supplemented diets and an unsupplemented diet (control) for 60 d. --------------- 93
Figure 3.5 White blood cell counts (WBC) (A), lymphocyte counts (B),
monocyte counts (C), granulocyte counts (D) of African catfish, C.
gariepinus fed four A. vera crude polysaccharide extracts supplemented diets
and an unsupplemented diet (control) for 60 d. -------------------------------------- 94
Page 12
x
Figure 3.6 Serum alanine aminotransferase enzyme concentration (ALT) (A),
aspartate aminotransferase concentration (AST) (B), glucose level (C), total
cholesterol (TCHO) (D), and triglycerol level (TG) (E) of African catfish, C.
gariepinus fingerlings fed four A. vera 30% polysaccharide crude extracts
supplemented diets and an unsupplemented diet (control) for 60 d. --------------- 95
Figure 3.7 Kaplan-Meier: low pH challenge survival probability (after every 24
h for 72 h) of African catfish, C. gariepinus fingerlings fed four A. vera 30%
polysaccharide crude extracts supplemented diets and an unsupplemented
diet (control) for 60 d. ------------------------------------------------------------------ 97
Figure 4.1 Final weight (FW) (A), specific growth rate (SGR) (B), weight gain
(WG) (C), and absolute growth rate (AGR) (D), of African catfish, C.
gariepinus juveniles fed four garlic (Allium sativum) polysaccharide extracts
(GPE) supplemented diets and an unsupplemented diet (control) for 60 d. ----- 125
Figure 4.2 Feed intake (FI) (A), feed conversion ratio (FCR) (B), feed efficiency
ratio (FER) (C), and protein efficiency ratio (PER) (D), of the African
catfish, C. gariepinus juveniles fed four garlic (Allium sativum)
polysaccharides extracts (GPE) supplemented diets and an un-supplemented
diet (control) for 60 d. ----------------------------------------------------------------- 127
Figure 4.3 Red blood cell counts (RBC) (A), haematocrit levels (B),
haemoglobin concentration (C), and platelet counts (PLT) (D) of African
catfish, C. gariepinus fingerlings fed four garlic (Allium sativum)
polysaccharides extracts (GPE) supplemented diets and an unsupplemented
diet (control) for 60 d. ----------------------------------------------------------------- 128
Figure 4.4 Mean corpuscular volume (MCV) (A), mean corpuscular
haemoglobin level (MCH) (B), mean corpuscular haemoglobin concentration
(MCHC) (C), and Red blood cell distribution width (RDWa) (D) of African
catfish, C. gariepinus juveniles fed four garlic (Allium sativum)
polysaccharides extracts supplemented diets and an unsupplemented diet
(control) for 60 d. ----------------------------------------------------------------------- 129
Figure 4.5 White blood cell counts (WBC) (A), lymphocyte counts (B),
monocyte counts (C), and granulocytes (D) of African catfish, C. gariepinus
Page 13
xi
juveniles fed four garlic (Allium sativum) polysaccharides extracts (GPE)
supplemented diets and an unsupplemented diet (control) for 60 d. -------------- 130
Figure 4.6 Kaplan-Meier: low pH challenge survival probability of African
catfish, C. gariepinus juveniles fed four garlic (Allium sativum)
polysaccharides extracts (GPE) supplemented diets and an unsupplemented
diet (control) for 60 d. ----------------------------------------------------------------- 132
Figure 5.1 Final weight (FW) (A), weight gain (WG) (B), Specific growth rate
(SGR) (C), and absolute growth rate (AGR) (D) of African catfish, C.
gariepinus juveniles fed four A. vera-A. sativum polysaccharide mixture (1:1)
supplemented diets and an unsupplemented diet (control) for 60 d. -------------- 151
Figure 5.3 Feed intake (FI) (A), feed conversion ratio (FCR) (B), feed efficiency
ratio (FER) (C), and protein efficiency ratio (PER) (D) of the African catfish,
C. gariepinus juveniles fed four A. vera-A. sativum polysaccharide mixture
(1:1) supplemented diets and an unsupplemented diet (control) for 60 d. ------- 154
Figure 5.3 Red blood cell counts (RBC) (A), hematocrits volume (B),
hemoglobin concentration (C), and platelet counts (PLT) (D) of African
catfish, C. gariepinus juveniles fed four A. vera-A. sativum polysaccharide
mixture (1:1) supplemented diets and an unsupplemented diet (control) for 60
d.------------------------------------------------------------------------------------------ 156
Figure 5.4 Mean corpuscular volume (MCV) (A), mean corpuscular hemoglobin
level (MCH) (B), mean corpuscular hemoglobin concentration (MCHC) (C),
and red blood cell distribution width (RDWa) (D) of African catfish, C.
gariepinus fingerlings fed four A. vera-A. sativum polysaccharide mixture
(1:1) supplemented diets and an unsupplemented diet (control) for 60 d. ------- 157
Figure 5.5 White blood cell (WBC) (A), lymphocyte (B), monocyte (C), and
granulocyte (D) counts of African catfish, C. gariepinus fed four A. vera-A.
sativum polysaccharide mixture (1:1) supplemented diets and an
unsupplemented diet (control) for 60 d. --------------------------------------------- 158
Figure 5.6 Kaplan-Meier: low pH challenge survival probability of African
catfish, C. gariepinus fingerlings fed four A. vera-A. sativum polysaccharide
Page 14
xii
mixture (1:1) supplemented diets and an unsupplemented diet (control) for 60
d.------------------------------------------------------------------------------------------ 159
Page 15
xiii
LIST OF TABLES
Table 2.1 Some of the biological functions of abundant bioactive compounds
found in garlic reported in organisms. ................................................................ 21
Table 2.2 Studies testing on the effects of orally administered garlic extracts on
growth performance and feed utilization indices in aquaculture. ........................ 26
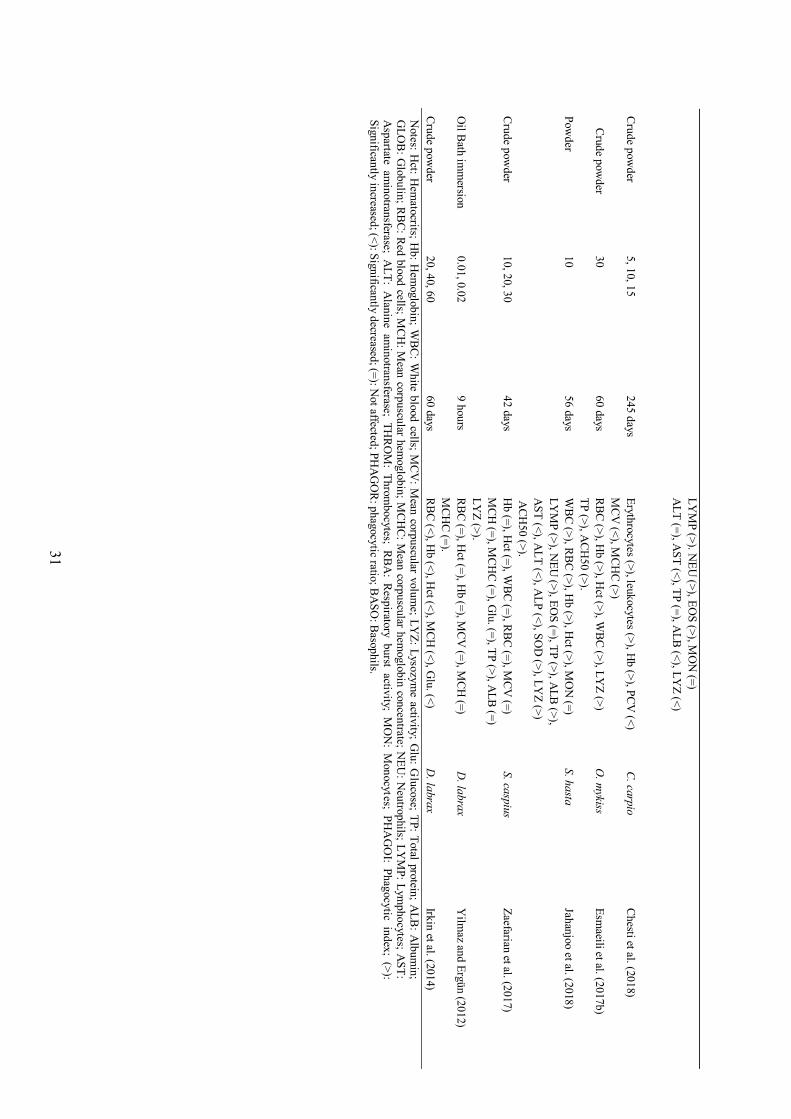
Table 2.3 Tested effects of orally administered garlic extracts on haemato-
biochemical indices on farmed fish species. ....................................................... 30
Table 2.4 Bioactive ingredients in the Aloe vera leaf gel and latex, adapted from
Gupta and Malhotra (2012)................................................................................ 37
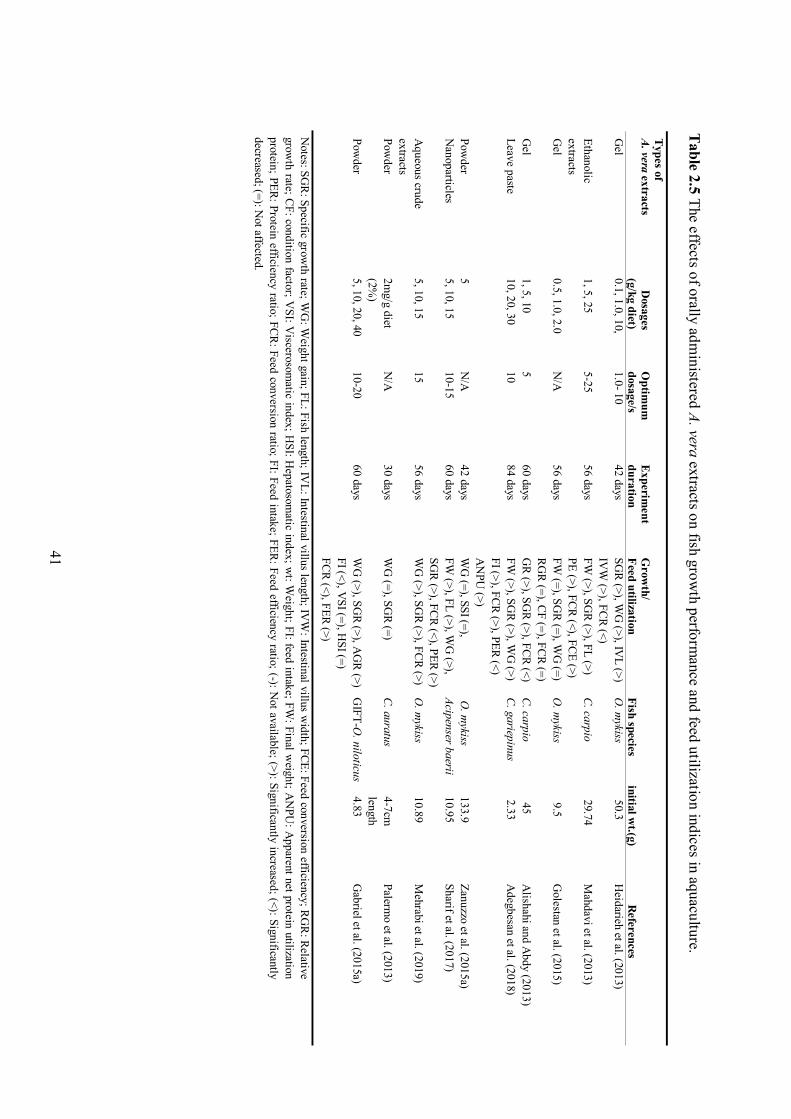
Table 2.5 The effects of orally administered A. vera extracts on fish growth
performance and feed utilization indices in aquaculture. .................................... 41
Table 2.6 Effects of A. vera extracts on haemato-biochemical indices of some of
the farmed fish species. ..................................................................................... 45
Table 3.1 Formulation and composition of the experimental diets (%/100 g dry
matter). .............................................................................................................. 80
Table 3.2 Organo-somatic indices, condition factor, and survival (%) of the
African catfish, C. gariepinus fingerlings fed four A. vera crude
polysaccharide extracts supplemented diets and a control for 60 d. .................... 89
Table 3.3 Whole body composition parameters of African catfish, C. gariepinus
fingerlings fed four A. vera 30% polysaccharide extracts supplemented diets
and un-supplemented diet for 60 d. .................................................................... 96
Table 4.1 Formulation and composition of the experimental diets (%/100 g dry
matter). ............................................................................................................ 121
Table 4.2 Organo-somatic indices, condition factor, and survival (%) of the
African catfish, C. gariepinus fingerlings fed four garlic (Allium sativum)
crude polysaccharide extracts supplemented diets and a control diet for 60 d. .. 126
Table 4.3 Selected whole body composition parameters of African catfish, C.
gariepinus juveniles fed four garlic (Allium sativum) polysaccharides
extracts (GPE) supplemented diets and un-supplemented diet for 60 d. ............ 131
Page 16
xiv
Table 5.1 Formulation and composition of the experimental diets (%/100 g dry
matter). ............................................................................................................ 147
Table 5.2 Organo-somatic indices, condition factor, and survival (%) of the
African catfish, C. gariepinus fingerlings fed four A. vera-A. sativum
polysaccharide mixture (1:1) supplemented diets and a control for 60 d. .......... 153
Table 5.3 Selected whole body composition parameters of African catfish, C.
gariepinus juveniles fed four A. vera-A. sativum polysaccharide mixture (1:1)
and an un-supplemented diet (control) for 60 d. ............................................... 160
Page 17
xv
LIST OF ABBREVIATIONS
ACH50 Serum alternative complement activity
ADG Average daily gain
AGR Absolute growth rate
ALB Albumin
ANOVA Analysis of variance
ANPU Apparent net protein utilization
BASO Basophils.
BWG Body weight gain
BWI Body weight increasing
CARBOX Carboxylesterase
CAT Catalase
CC3 Complement C3
CDR Complete randomized design
CF Condition factor
CHOL Cholesterol
CL Chemiluminescent response
CORT Cortisol
CP Crude protein
CSA Complement system activity
DMRT Duncan’s Multiple Range Test
DO Dissolved oxygen
EDTA Ethylenediaminetetraacetic acid
Page 18
xvi
EU Energy utilization
FCE Feed conversion efficiency
FCR Feed conversion ratio
FE Feed efficiency
FER Feed efficiency ratio
FI Feed intake
FL Fish length
FRA Ferric reducing ability
FW Final weight
GIFT Genetically improved farmed tilapia
GLOB Globulin
Glu Glucose
GPE Garlic polysaccharide extract
GRAN Granulocytes
GSH-Px Glutathione peroxidase
Hb Haemoglobin
HCl Hydrochloric acid
Hct Haematocrits
HDL High-density lipoprotein
HETRO Heterophil
HIS Hepatosomatic index
IgM Immunoglobulin M
IVL Intestinal villus length
IVW Intestinal villus width
Page 19
xvii
LDL Low-density lipoproteins
LYM Lymphocytes
LYZ Lysozyme activity
M Mean
MCH Mean corpuscular haemoglobin
MCHC Mean corpuscular haemoglobin concentration
MCV Mean corpuscular volume
MDA Malondialdehyde
MO2 Oxygen consumption
MON Monocytes
MR Metabolic rate
MS-222 Tricaine methanesulfonate
N Normality
N/A Not available
NaOH Sodium hydroxide
NBT Nitroblue tetrazolium
NEU Neutrophils
NH3-N Ammonia-Nitrogen
OAC Onavivi Aquaculture Center
PCV Packed cell volume
PE Protein efficiency
PER Protein efficiency ratio
PEROX Peroxidase
PHAGO Phagocytic activity
Page 20
xviii
PHAGOI Phagocytic index
PHAGOR Phagocytic ratio
ALP Phosphatase
PLT Platelets
PPV Protein productive value
RBA Respiratory burst activity
RBC Red blood cell count
RDWa Red blood cell distribution width
RGR Relative growth rate
ROS Reactive oxygen species
SBA Serum bactericidal
SE Standard error
SGR Specific growth rate
SOD Superoxide dismutase
SSI Spleen somatic index
TCHO Total cholesterol
TG Triglycerides
THROM Thrombocytes
TP Total protein
VSI Viscerosomatic index
WBC White blood cell count
WG Weight gain
Wt. Weight
Page 21
xix
ACKNOWLEDGEMENTS
I would like to extend my heartfelt thanks to Prof. Edosa Omoregie and Prof. Percy
Chimwamurombe who were the first people to see the value of this project at the time it
was just a concept; hence they did not think twice but agreed to supervise this project. I
would like to thank Dr. Margit Wilhelm who did not hesitate to be the main supervisor
of the project from the Department of Fisheries and Aquatic Sciences (DFAS) after Prof.
Omoregie’s contract ended in 2017. Dr. Habte-Michael Habte-Tsion, your invaluable
contribution to the project as an expert in aquaculture nutrition is highly appreciated.
Thank you, all my supervisors and mentors, for allowing me an opportunity to tap from
your expertise and follow your footsteps; I shall forever remain grateful.
I would like to express my sincere gratitude to my beautiful wife (Rebekka Shikesho-
Gabriel), not just for being a wife, a friend and a companion, but also for being a
technical person I depended on for fish blood sample collection. Thank you for being
part of my life, and my source of motivation. I therefore pray to God to further
strengthen and give you hope as we toil to achieve our family dream.
I would also like to sincerely thank the Sam Nujoma Campus students, especially Linda
Iipinge (my MSc student) for being my other eye on my experiments and for assisting in
the following activities: feed manufacturing, fish feeding in my absence, pond cleaning
and fish sampling. May God bless you even more in your future career.
Page 22
xx
Furthermore, I would like to express my sincere thanks to the following institutions for
their invaluable support toward this project:
1) Namibian Student Financial Assistance Fund (NSFAF) for funding my tuition fees
2) UNAM (Sam Nujoma Campus) for funding my research needs through the
SANUMARC Trust.
3) Ministry of Fisheries and Marine Resources (MFMR), Onavivi Aquaculture Center
(OAC) for providing the experimental animals (Catfish fingerlings).
4) Swakop Vet Clinic for assisting with blood sample analysis (haematological
parameters and serum parameters).
To all the institutions, I will forever be grateful for your assistance and may your
services benefit others too.
Page 23
xxi
DEDICATION
This dissertation is dedicated to my family (wife, Rebekka Shikesho-Gabriel; kids,
Tangi and Tuapewa), to be an inspiration for hard work, patience, teamwork,
perseverance and tolerance. It is also dedicated to my parents (Gabriel Wilhelm, and
Anna Alpheus) who did not come this far in terms of education, yet they believe that
education is the great equalizer.
Page 24
xxii
DECLARATION
I, Ndakalimwe Naftal Gabriel, declare hereby that this study is a true reflection of my
own research, and that this work, or part thereof has not been submitted for a degree in
any other institution of higher education.
No part of this thesis/dissertation may be reproduced, stored in any retrieval system, or
transmitted in any form, or by means (e.g. electronic, mechanical, photocopying,
recording or otherwise) without the prior permission of the author, or the University of
Namibia in that behalf.
I, Ndakalimwe Naftal Gabriel, grant the University of Namibia the right to reproduce
this thesis in whole or in part, in any manner or format, which the University of Namibia
may deem fit, for any purpose or institution requiring it for study and research;
providing that the University of Namibia shall waive this right if the whole thesis has
been or is being published in a manner satisfactory to the University.
.... ......................................... Date......................................
Ndakalimwe Naftal Gabriel
Page 25
1
CHAPTER ONE: INTRODUCTION
1.1 General introduction
Aquaculture is one of the fastest growing food producing sectors in the world, and in
2016, it contributed about 47% to the global seafood production (FAO 2018).
Aquaculture contribution to global seafood is uneven among countries, and Asian
countries have been the main contributors for many years (FAO 2014, 2016, 2018). The
global success of aquaculture could be attributed to the wide adoption of intensive
production systems, which are associated with higher yield as a result of higher stocking
densities (Kumar and Engle 2016). However, high stocking densities could be stressful
to the fish, and this could subsequently lead to several conditions such as poor growth
(Gabriel and Akinrotimi 2011), poor health (Montero et al. 1999), increased
susceptibility to diseases (Kibenge 2019), and in extreme cases lead to mortality
(Mckenzie et al. 2012; Amal et al. 2018). Hence, good fish health management is
important in intensive aquaculture systems.
In aquaculture-advanced nations, good health of farmed fish and maximization of
aquaculture production is achieved by using synthetic pharmaceutical drugs such as
antibiotics (Mohamed et al. 2000; Tonguthai 2000; Yulin 2000). However, the use of
these drugs is considered merely production oriented and unsustainable as they are noted
to cause resistance in pathogenic bacteria, environmental pollution and public health
concerns (Hites et al. 2004; Cabello 2006; Gullberg et al. 2011; Liu et al. 2017). Hence,
the application of synthetic drugs in aquaculture is discouraged.
Page 26
2
Medicinal herbs possess the potential to replace synthetic pharmaceutical drugs in
aquaculture. Herbs contain several biologically active metabolites with various benefits
such as immune modulating (Zanuzzo et al. 2015; Yilmaz 2019), growth promoting,
digestive enhancing, appetite stimulating, antioxidant enhancing, antidepressant (Zhang
et al. 2010; Mahdavi et al. 2013; Reverter et al. 2014; Pu et al. 2017), and
hepatoprotective effects in fish (Yilmaz et al. 2014; Gurkan et al. 2015). Other benefits
associated with herbal extracts in fish include: increased resistance against pathogens
(Reverter et al. 2014; Yilmaz 2019), and the sudden change in water quality parameters
such as low pH (Lin and Chen 2008; Liu et al. 2016; Khan et al. 2018), high salinity
(Ghehdarijani et al. 2016), and high temperature (Fazlolahzadeh et al. 2011).
The use of herbs in aquaculture could be more sustainable compared to synthetic drugs
as they are locally available in most parts of the world, diverse in nature, inexpensive,
and they are believed to be more biodegradable in nature (Olusola et al. 2013; Reverter
et al. 2014). Therefore, medicinal herbs could be the appropriate remedies in
aquaculture, if explored properly.
1.2 Statement of the problem
In Namibia, aquaculture (marine and freshwater) remains one of the top priorities on the
national development agenda, with most of the fish farmers (private and government)
adopting the semi-intensive to intensive production systems. This sector is predominated
by freshwater species (African catfsh, Clarias gariepinus, and tilapia species), and since
its inception in Namibia, it has been challenged to reap the benefits associated with
Page 27
3
intensive aquaculture systems (Hilundwa and Teweldemedhin 2016; FAO 2019). One of
the main drawbacks faced by the Namibian aquaculture freshwater fish farmers, is poor
fish health management, water quality issues (including fluctuating pH), and a lack of
quality fish feed fortified with essential nutrients (Rana and Abban 2012). This has
partly led to poor growth performance, high fish mortality, and insignificant production
outputs in intensive farming systems (i.e. Hardap, Fonteintjie, Leonardville, Uis, and
Epalela aquaculture farms). Natural herbs have been recognized to possess several
medicinal properties and could be appropriate remedies to maintain fish health and
promote growth in intensive aquaculture systems. Namibia is endowed with a wide
range of medicinal herbs (native and exotics), and although there has been an increase in
the research interest in medicinal herbs in aquaculture, there is still limited information
on their application in the Namibian aquaculture sector. Thus, the way forward, is to do
more research contributing to the standardization of the important aspects on the
application of medicinal herbs in aquaculture and to introduce this application in
Namibia, and this forms the basis of the current study. The results of this study could
provide insights into the benefits associated with medicinal herbs in fish to the Namibian
aquaculture industry and could assist in the formulation of long-term policies that ensure
a sustainable aquaculture development in Namibia and beyond.
1.3 Objectives of the study
This study aimed to develop and introduce phytogenic diets made up of aloe vera (Aloe
vera), and garlic (Allium sativum) crude polysaccharide extracts (separately and in
mixture), which would promote growth, feed utilization, health, meat quality, and
Page 28
4
increase resistance against stress in African catfish, Clarias gariepinus reared in
intensive aquaculture systems.
1.3.1 Specific objectives
To determine the effects of dietary A. vera crude polysaccharide extracts on:
Growth performance parameters i.e. weight gain (WG), specific growth rate
(SGR), absolute growth rate (AGR), and organo-somatic indices in C. gariepinus
fingerlings after sixty days of feeding.
(2) Feed utilization parameters indices (i.e. feed intake, food conversion ratio,
protein efficiency ratio, and feed efficiency ratio) in C. gariepinus fingerlings
after sixty days of feeding.
(3) Haematological parameters of C. gariepinus fingerlings after sixty days of
feeding.
(4) Serum biochemical indices i.e. alanine aminotransferase (AST) and aspartate
aminotransferase (ALT), glucose (Glu), total cholesterol (TC), and triglycerol
(TG) of C. gariepinus fingerlings after sixty days of feeding.
(5) Whole body proximate composition of C. gariepinus fingerlings after sixty days
of feeding.
(6) Survival of C. gariepinus fingerlings at low pH after sixty days of feeding.
(7) To estimate the optimum dietary A. vera crude polysaccharide extracts inclusion
level in C. gariepinus culture.
To determine the effects of dietary A. sativum crude polysaccharide extracts on:
Growth performance parameters i.e. weight gain (WG), specific growth rate
Page 29
5
(SGR), absolute growth rate, and organo-somatic indices in C. gariepinus
juveniles after sixty days of feeding.
(2) Feed utilization parameters indices (i.e. feed intake, food conversion ratio,
protein efficiency ratio, and feed efficiency ratio) in C. gariepinus juveniles after
sixty days of feeding.
(3) Haematological parameters of C. gariepinus fingerlings after sixty days of
feeding.
(4) Whole body proximate composition of C. gariepinus juveniles after sixty days of
feeding.
(5) Survival of C. gariepinus juveniles at low pH after sixty days of feeding.
(6) To estimate the optimum dietary A. sativum crude polysaccharide extracts
inclusion level in C. gariepinus juveniles’ culture.
To determine the effects of dietary A. vera and A. sativum crude polysaccharide extracts
mixture on:
Growth performance parameters i.e. weight gain (WG), specific growth rate
(SGR), absolute growth rate, and organo-somatic indices in C. gariepinus
juveniles after sixty days of feeding.
(2) Feed utilization parameters indices (i.e. feed intake, food conversion ratio,
protein efficiency ratio, and feed efficiency ratio) in C. gariepinus juveniles after
sixty days of feeding.
(3) Haematological parameters of C. gariepinus juveniles after sixty days of feeding.
Page 30
6
(4) Whole body proximate composition of C. gariepinus juveniles after sixty days of
feeding.
(5) Survival of C. gariepinus juveniles at low pH after sixty days of feeding.
1.4 Hypotheses of the study
1.4.1 Aloe vera polysaccharides
(1) H0: Dietary A. vera crude polysaccharide extracts have no effects on the growth
performance parameters i.e. weight gain (WG), specific growth rate (SGR),
absolute growth rate (AGR), and organo-somatic indices in C. gariepinus
fingerlings after sixty days of feeding.
(2) H0: Dietary A. vera crude polysaccharide extracts have no effects on the feed
utilization parameters indices (i.e. feed intake, food conversion ratio, protein
efficiency ratio, and feed efficiency ratio) in C. gariepinus fingerlings after sixty
days of feeding.
(3) H0: Dietary A. vera crude polysaccharide extracts have no effects on the
haematological parameters of C. gariepinus fingerlings after sixty days of
feeding.
(4) H0: Dietary A. vera crude polysaccharide extracts have no effects on the serum
biochemical indices i.e. alanine aminotransferase (AST) and aspartate
aminotransferase (ALT), glucose (Glu), total cholesterol (TC), and triglycerol
(TG) of C. gariepinus fingerlings after sixty days of feeding.
(5) H0: Dietary A. vera crude polysaccharide extracts have no effects on the whole-
body proximate composition of C. gariepinus fingerlings after sixty days of
feeding.
Page 31
7
(6) H0: Dietary A. vera crude polysaccharide extracts have no effects on the
survival of C. gariepinus fingerlings at low pH after sixty days of feeding.
1.4.2 Allium sativum polysaccharides
(1) H0: Dietary A. sativum crude polysaccharide extracts have no effects on the
growth performance parameters i.e. weight gain (WG), specific growth rate
(SGR), absolute growth rate (AGR), and organo-somatic indices in C.
gariepinus juveniles after sixty days of feeding.
(2) H0: Dietary A. sativum crude polysaccharide extracts have no effects on the feed
utilization parameters indices (i.e. feed intake, food conversion ratio, protein
efficiency ratio, and feed efficiency ratio) in C. gariepinus juveniles after sixty
days of feeding.
(3) H0: Dietary A. sativum crude polysaccharide extracts have no effects on the
haematological parameters of C. gariepinus juveniles after sixty days of
feeding.
(4) H0: Dietary A. sativum crude polysaccharide extracts have no effects on the
whole-body proximate composition of C. gariepinus juveniles after sixty days
of feeding.
(5) H0: Dietary A. sativum crude polysaccharide extracts have no effects on the
survival of C. gariepinus juveniles at low pH after sixty days of feeding.
Page 32
8
1.4.3 The combination of A. vera and A. sativum crude polysaccharides extracts
(1) H0: Dietary A. vera and A. sativum crude polysaccharide extracts mixture has no
effects on the growth performance parameters i.e. weight gain (WG), specific
growth rate (SGR), absolute growth rate (AGR), and organo-somatic indices in
C. gariepinus juveniles after sixty days of feeding.
(2) H0: Dietary A. vera and A. sativum crude polysaccharide extracts mixture has no
effects on the feed utilization parameters indices (i.e. feed intake, food
conversion ratio, protein efficiency ratio, and feed efficiency ratio) in C.
gariepinus juveniles after sixty days of feeding.
(3) H0: Dietary A. vera and A. sativum crude polysaccharide extracts mixture has no
effects on the haematological parameters of C. gariepinus juveniles after sixty
days of feeding.
(4) H0: Dietary A. vera and A. sativum crude polysaccharide extracts mixture has no
effects on the whole-body proximate composition of C. gariepinus juveniles
after sixty days of feeding.
(5) H0: Dietary A. vera and A. sativum crude polysaccharide extracts mixture has no
effects on the survival of C. gariepinus juveniles at low pH after sixty days of
feeding.
Page 33
9
1.5 References
Amal MNA, Koh CB, Nurliyana M, Suhaiba M, Nor-Amalina Z, Santha S, Zamri-Saad
M. 2018. A case of natural co-infection of Tilapia Lake Virus and Aeromonas
veronii in a Malaysian red hybrid tilapia (Oreochromis niloticus × O. mossambicus)
farm experiencing high mortality. Aquaculture 485: 12-16.
Cabello FC. 2006. Heavy use of prophylactic antibiotics in aquaculture: a growing
problem for human and animal health and for the environment. Environmental
Microbiology 8: 1137-1144.
FAO (Food and Agriculture Organisation). 2014. The state of world fisheries and
aquaculture, opportinities and challenges. Rome: FAO Fisheries and Aquaculture
Department.
FAO (Food and Agriculture Organisation). 2016. The state of world fisheries and
aquaculture, contributing to food security and nutrition for all. Rome: FAO
Fisheries and Aquaculture Department.
FAO (Food and Agriculture Organisation). 2018. The state of world fisheries and
aquaculture, meeting the sustainable development goals. Rome: FAO Fisheries and
Aquaculture Department.
FAO (Food and Agriculture Organisation). 2019. Scaling up aquaculture development
through triangular cooperation between Namibia, Spain, Viet Nam and FAO. FAO
CA3632EN/1/03.19.
Page 34
10
Fazlolahzadeh F, Keramati K, Nazifi S, Shirian S, Seifi S. 2011. Effect of garlic (Allium
sativum) on hematological parameters and plasma activities of ALT and AST of
Rainbow trout in temperature stress. Australian Journal of Basic & Applied Sciences
5: 84-90.
Gabriel UU, Akinrotimi OA. 2011. Management of stress in fish for sustainable
aquaculture development. Researcher 3: 28-38.
Ghehdarijani MS, Hajimoradloo A, Ghorbani R, Roohi Z. 2016. The effects of garlic-
supplemented diets on skin mucosal immune responses, stress resistance and growth
performance of the Caspian roach (Rutilus rutilus) fry. Fish & Shellfish Immunology
49: 79-83.
Gullberg E, Cao S, Berg OG, Ilbäck C, Sandegren L, Hughes D, Andersson DI. 2011.
Selection of resistant bacteria at very low antibiotic concentrations. PLoS Pathogens
7: e1002158.
Gurkan M, Yilmaz S, Kaya H, Ergun S, Alkan S. 2015. Influence of three spice powders
on the survival and histopathology of Oreochromis mossambicus before and after
Streptococcus iniae infection. Marine Science Technology Bulletin 4: 1-5.
Hites RA, Foran JA, Carpenter DO, Hamilton MC, Knuth BA, Schwager SJ. 2004.
Global assessment of organic contaminants in farmed salmon. Science 303: 226-29.
Hilundwa KT, Teweldemedhin MY. 2016. Assessing the financial viability for small
scale fish farmers in Namibia. African Journal of Agricultural Research 11: 3046-
3055.
Page 35
11
Khan MIR, Saha RK, Saha H. 2018. Muli bamboo (Melocanna baccifera) leaves
ethanolic extracts a non-toxic phyto-prophylactic against low pH stress and
saprolegniasis in Labeo rohita fingerlings. Fish & Shellfish Immunology 74: 609-
619.
Kibenge FS. 2019. Emerging viruses in aquaculture. Current Opinion in Virology 34:
97-103.
Kumar G, Engle CR. 2016. Technological advances that led to growth of shrimp,
salmon, and tilapia farming. Reviews in Fisheries Science & Aquaculture 24: 136-
152.
Li CC, Chen JC. 2008. The immune response of white shrimp Litopenaeus vannamei
and its susceptibility to Vibrio alginolyticus under low and high pH stress. Fish &
Shellfish Immunology 25: 701-709.
Liu B, Wana J, Gea X, Xie J, Zhou Q, Miao, L, Ren M, Panb L. 2016. Effects of dietary
Vitamin C on the physiological responses and disease resistance to pH stress and
Aeromonas hydrophila infection of Megalobrama amblycephala. Turkish Journal of
Fisheries & Aquatic Sciences 16: 421-433.
Liu X, Steele JC, Meng XZ. 2017. Usage, residue, and human health risk of antibiotics
in Chinese aquaculture: a review. Environmental Pollution 223:161-169.
Mahdavi M, Hajimoradloo A, Ghorbani R. 2013. Effect of Aloe vera extract on growth
parameters of common carp (Cyprinus carpio). World Journal of Medical
Sciences, 9: 55-60.
McKenzie DJ, Höglund E, Dupont-Prinet A, Larsen BK, Skov PV, Pedersen PB,
Page 36
12
Jokumsen A. 2012. Effects of stocking density and sustained aerobic exercise on
growth, energetics and welfare of rainbow trout. Aquaculture 338: 216-222.
Mohamed S, Nagaraj G, Chua FHC, Wang YG. 2000. The use of chemicals in
aquaculture in Malaysia and Singapore. In: Arthur JR, Lavilla-Pitogo CR, &
Subasinghe RP (eds), Proceedings of the Meeting on the Use of Chemicals in
Aquaculture in Asia, 20-22 May 1996, Tigbauan, Iloilo. Philippines: Aquaculture
Department, Southeast Asian Fisheries Development Center. pp 127-140.
Montero D, Izquierdo MS, Tort L, Robaina L, Vergara JM. 1999. High stocking density
produces crowding stress altering some physiological and biochemical parameters in
gilthead seabream, Sparus aurata, juveniles. Fish Physiology & Biochemistry 20:
53-60.
Olusola SE, Emikpe BO, Olaifa FE. 2013. The potentials of medicinal plant extracts as
bio-antimicrobials in aquaculture. International Journal Medicinal Aromatics Plants
3: 404-412.
Pu H, Li X, Du Q, Cui H, Xu Y. 2017. Research progress in the application of Chinese
herbal medicines in aquaculture: A Review. Engineering 3: 731-737.
Rana K, Abban K. 2012. Section 2: situation analysis and challenges for developing the
potential of freshwater aquaculture in 12 regions of Namibia. National Aquaculture
Master Plan for Namibia Part 2: Freshwater Aquaculture. South Africa: AquaStel
(pty) Ltd.
Page 37
13
Reverter M, Bontemps N, Lecchini D, Banaigs B, Sasal P. 2014. Use of plant extracts in
fi sh aquaculture as an alternative to chemotherapy : Current status and future
perspectives. Aquaculture 433: 50-61.
Tonguthai K. 2000. The use of chemicals in aquaculture in Thailand. In: Arthur JR,
Lavilla-Pitogo CR, & Subasinghe RP (eds), Proceedings of the Meeting on the Use
of Chemicals in Aquaculture in Asia, 20-22 May 1996, Tigbauan, Iloilo. Philippines:
Aquaculture Department, Southeast Asian Fisheries Development Center. pp 207-
220.
Yilmaz S, Ergün S, Kaya H, Gürkan M. 2014. Influence of Tribulus terrestris extract on
the survival and histopathology of Oreochromis mossambicus (Peters, 1852) fry
before and after Streptococcus iniae infection. Journal of Applied Ichthyology 30:
994-1000.
Yilmaz S. 2019. Effects of dietary blackberry syrup supplement on growth performance,
antioxidant, and immunological responses, and resistance of Nile tilapia,
Oreochromis niloticus to Plesiomonas shigelloides. Fish & Shellfish Immunology
84: 1125-1133.
Yulin J. 2000. The use of chemicals in aquaculture in the People's Republic of China. In:
Arthur JR, Lavilla-Pitogo CR, & Subasinghe RP (eds), Proceedings of the Meeting
on the Use of Chemicals in Aquaculture in Asia, 20-22 May 1996, Tigbauan, Iloilo.
Philippines: Aquaculture Department, Southeast Asian Fisheries Development
Center. pp 141-153.
Page 38
14
Zanuzzo FS, Urbinati EC, Rise ML, Hall JR, Nash GW, Gamperl AK. 2015. Aeromonas
salmonicida induced immune gene expression in Aloe vera fed steelhead trout ,
Oncorhynchus mykiss (Walbaum). Aquaculture 435: 1-9.
Zhang P, Zhang X, Li J, Gao T. 2010. Effect of refeeding on the growth and digestive
enzyme activities of Fenneropenaeus chinensis juveniles exposed to different
periods of food deprivation. Aquaculture International 18: 1191-1203.
Page 39
15
CHAPTER TWO: LITERATURE REVIEW
2.1 Introduction
Globally, aquaculture had an annual growth rate of 5.3% between 2001 and 2016, and is
expected to increase by 37% in 2030 (FAO 2018). One of the reasons for the current
success and continual growth of aquaculture sector is a wide adoption of intensive
production systems, which are associated with high yield as a result of high stocking
densities (Kumar and Engle 2016). However, intensive aquaculture system issues such
as fish handling, fluctuation of water quality parameters, transportation and harvesting
may be stressful to fish. These stress factors lead to a number of conditions including
poor metabolism capacity (Herrera et al. 2015), poor meat quality (Jittinandana et al.
2003), increased susceptibility to diseases (Lara-Flore 2011; Fečkaninová et al. 2017 ),
and in extreme cases to deaths (Mckenzie et al. 2012). All these constraints have made it
hard for fish farmers to convert the benefits of higher production yields associated with
intensive production systems into economical gains. Therefore, aquaculture is still to
reach its full potential.
In an effort for fish farmers to economically benefit from intensive farming systems,
they started using synthetic pharmaceutical drugs to maintain good health of farmed fish.
The adoption of these drugs in aquaculture was later shown to be unsustainable, as they
cause fish pathogen drug resistance, immunosuppression, environmental pollution, and
accumulation of chemical residues, which is potentially hazardous to public health
(Thorne 2006; Heuer et al. 2009; Bulfon et al. 2013). For this reason, many nations such
Page 40
16
as the United States, countries in the European Union (Bulfon et al. 2013), and Asian
countries (Ji et al. 2007) have a strict demand for aquatic products free from synthetic
pharmaceutical drugs. Consequently, the need to replace pharmaceutical drugs with
dietary supplements or ingredients or additives (immuno-stimulants) that are capable of
strengthening fish health, and enhancing their growth, feed utilization ability, and
ultimately ensuring safe and good quality of aquatic products from aquaculture, has
become increasingly imperative.
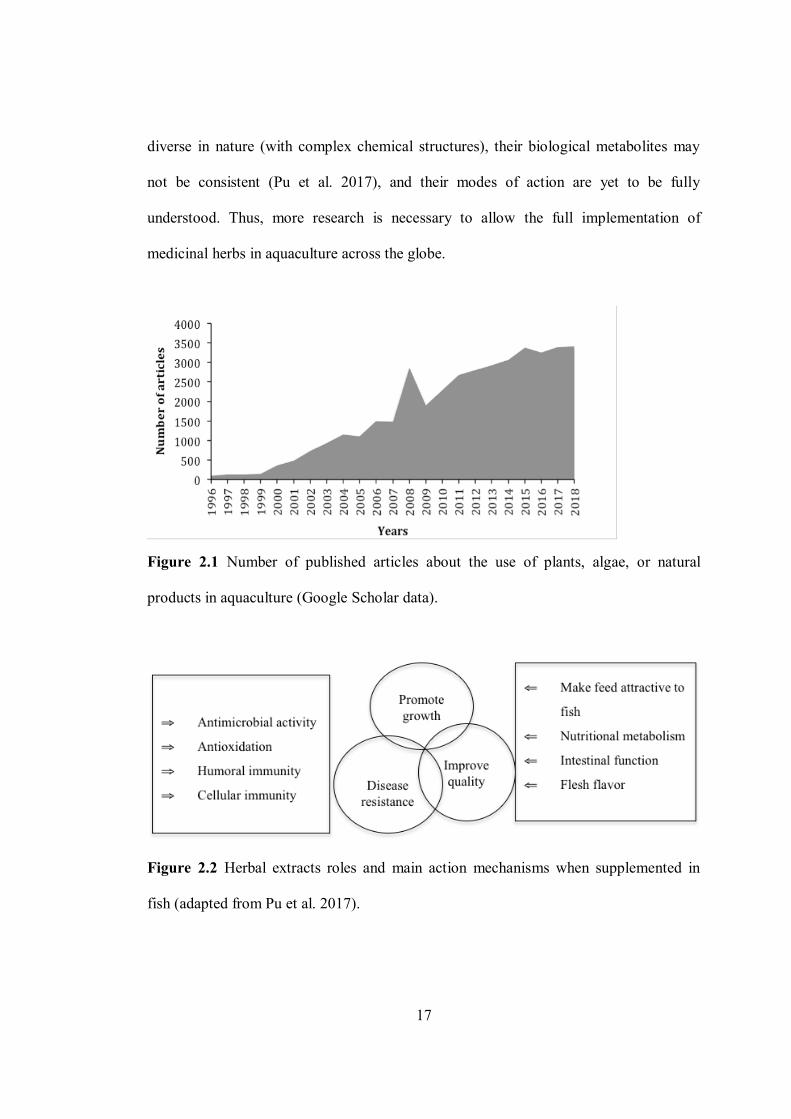
Based on results of searching for papers using keywords of “herbal extracts and
aquaculture” using Google Scholar search engine (www.scholar.google.com), the
number of publications on herbal extracts in aquaculture have increased by 30-fold over
the past two decades (Figure 2.1). From this it can be inferred that indeed these extracts
have the potential to eradicate the use of synthetic pharmaceutical drugs in fish farming.
Herbs provide a wide range of useful biologically active metabolites such as
polysaccharides, alkaloids, flavonoids, volatile oils, organic acids, tannins, and nutrients
(amino acids, carbohydrates, minerals and vitamins) (Pu et al. 2017). If properly
administered, these metabolites have the ability to increase growth and feed intake
(Zhang et al. 2010; Mahdavi et al. 2013; Gabriel et al. 2015), enhance antioxidants,
antidepressants and modulate immunity in fish (Zanuzzo et al. 2015a), and enhance meat
quality (Ma et al. 2015) (Figure 2.2). Some of the benefits of using herbs in aquaculture
include the following: they are available to small-scale rural fish farmers, they are
inexpensive, and they are more biodegradable in nature compared to pharmaceutical
drugs (Olusola et al. 2013; Reverter et al. 2014). Nevertheless, the current challenges in
using herbs in aquaculture may include: difficulties to standardize them as they are
Page 41
17
diverse in nature (with complex chemical structures), their biological metabolites may
not be consistent (Pu et al. 2017), and their modes of action are yet to be fully
understood. Thus, more research is necessary to allow the full implementation of
medicinal herbs in aquaculture across the globe.
Figure 2.1 Number of published articles about the use of plants, algae, or natural
products in aquaculture (Google Scholar data).
Figure 2.2 Herbal extracts roles and main action mechanisms when supplemented in
fish (adapted from Pu et al. 2017).
Page 42
18
Herbs could be used as a whole plant or parts (i.e. leaves, flowers, roots, seeds, or bark)
in a crude form or as extracts / compounds from the whole plant or parts of the plant. For
instance, crude extracts in the form of powder from Mespilus germanica (Hoseinifar et
al. 2017), Garcinia kola (Dada et al. 2011) and Camellia sinesis (Abdel-Tawwab et al.
2010) were incorporated in fish feeds to investigate their effects on growth and health
parameters in Cyprinus carpio, Clarias gariepinus, and Oreochromis niloticus,
respectively. These herbal extracts were able to increase growth and improve health
status of the studied fish compared to a control in all three cases. The same was reported
in fish fed feed supplemented with Garcinia mangostana methanolic extracts (Soosean
et al. 2010), Stragalus polysaccharides (Ardo et al. 2008), Pontogammarus maeoticus
aqueous extracts (Rufchaei et al. 2017), and Mentha piperita ethanolic extracts (Adel et
al. 2015), respectively.
The current study focused on the effects of garlic (Allium sativum) and aloe vera (Aloe
vera) crude polysaccharide extracts in African catfish, C. gariepinus. A literature review
on these extracts as feed additives and remedies in aquaculture and gaps in the existing
knowledge is therefore provided in this chapter.
2.2 The medicinal use of garlic, Allium sativum
Garlic (A. sativum) is a perennial herb, belonging to the Liliaceae family, and is grown
in temperate to subtropical regions of the world (Fritsch and Friesen 2002). It has long,
green flat grass-like leaves rising from a squamous, white, and round bulb (composed of
many densely packed elongated bulbs), which are the main organs consumed by
Page 43
19
humans. This herb has been used since ancient times as a spice and a medicinal remedy
for a variety of illnessess (Mirelman et al. 1987; Ebrahimi et al. 2015). It has been
proven effective as a hypolipidemic (Asdag 2015), antimicrobial (Reiter et al. 2017),
antihypertensive (Nandhini et al. 2018), insecticidal (El-Beih et al. 2017),
hepatoprotective (Ahmed 2018), anti-inflammatory, immunomodulatory, antioxidant
drug (Alam et al. 2018), and growth-promoting agent (Alagawany et al. 2016) in
humans and animals. Increased growth and improved health status were reported in fish
after being supplemented with garlic extracts (Al-Salahy 2002; Shalaby et al. 2006;
Farahi et al. 2010; Shakya and Labh et al. 2014; Zaefarian et al. 2017). These beneficial
effects of garlic in animals have been attributed to its various biological compounds
including organosulfur compounds (Gabreyohannes and Gabreyohannes 2013), oil
(Mousa et al. 2013), polysaccharides (Pan 2014; Chen and Huang 2019) or nutritional
constituents (Josling 2005) as discussed below.
Garlic contains about 65% of water, 28% carbohydrates (fructans), 2.3% organosulfur
compounds (alliin, allicin, ajoene, diallyl disulfide, diallyl trisulfide, allyl
methanethiosulfinate, and S-allylcysteine), 2% protein (allinase), 1.2% free amino acids
(arginine) and 1.5% fibre (Santhosha et al. 2013; Table 2.1). It also contains minerals
such as calcium (24.33 mg/100g), iron (3.93 mg/100g), potassium (50.66 mg/100g),
magnesium (2.63 mg/100g), and vitamins (A, B1, and C) (Josling 2005; Joo et al. 2013;
Khalid et al. 2014) and about 35% polysaccharides (Pan and Wu 2014). Of the
constituents of garlic, the organosulphur compounds are the most bioactive compounds,
responsible for the typical pungent smell and for its medicinal properties (Macpherson et
al. 2005; Bhandari 2012; Kumar et al. 2013; Lanzotti et al. 2014). These compounds
Page 44
20
may enhance the biosynthesis of glutathionine (which has antioxidant functions), and
other volatile compounds with strong bioactive properties such as ajoenes (Block et al.
1993), alliin, allicin (alliin is converted to allicin by allinases, when the garlic is cut or
crushed), allyl sulfide, and 1,2 vinyldithiin (Bhandari 2012; Martin et al. 2016) (Figure
2.3). In addition, medicinal properties of garlic are also attributed to its phytonutrients
such as vitamins, minerals, oil, and other anti-nutritional factors such as flavonoids,
saponins, phenol compounds (Lanzotti et al. 2014) and polysaccharides (Pan and Wu
2014).
Figure 2.3 Chemical structures of the most bioactive compounds (alliin, allicin, ajoene,
allyl sulfide, and 1,2 vinyldthiin from Allium sativum (adapted from Martin et al. 2016).
OH CH2 S
o NH2
O(a) Alliin
CH2sO
S
CH2
(b) Allicin
CH2S
O
S
sCH2
(c) (E) Ajoene
CH2 SCH2
(d) Allyl sulfide
CH2S
SS
CH2
(e) (Z) Ajoene SS
(f) 1,2 Vinyldthiin
Page 45
21
Table 2.1 Some of the biological functions of abundant bioactive compounds found in
garlic reported in organisms.
Compounds Biological effects References Alliin Antidiabetic Anwar and Younus (2017) Antioxidant Immunomodulatory Salman et al. (1999) Antimicrobial Rahman (2007) Allicin Antioxidant Nya et al. (2010) Antimicrobial Immunomodulatory Essential oil Hepato-protective Liu and Xu (2007) Antioxidant Abdel-Daim et al. (2015) Antifungal Chung et al. (2007) Preservative Gomez-Estaca et al. (2010) Growth promoting Hassaan and Soltan (2016) Ajoene Antimicrobial Rahman (2007) Antioxidant Capasso (2013) Cardio-protective 1,2 –Vinyldithiin Anti-microbial Higuchi et al. (2003) Anti-oxidant Anti-thrombotic Polysaccharides Antioxidant Pan and Wu (2014) Kallel et al. (2015) Immunomodulatory Li et al. (2017) Growth promoting Yan-hua et al. (2010) Preservative Kallel et al. (2015) Saponins Antifungal, Cholesterol lowering Matsuura (2001) Growth promoting Ng’ambi et al. (2016)
Page 46
22
2.3 Previous studies on garlic extracts in aquaculture
Garlic is one of the medicinal herbs that are broadly studied in both freshwater (Kumar
et al. 2009; Nya et al. 2010; Thanikachalam et al. 2010; Millet et al. 2011; Hyun Kim et
al. 2019; Onumu 2019) and marine aquaculture (Guo et al. 2012; Javadzadeh et al. 2012;
Militz et al. 2014; Irkin et al. 2014; Huang et al. 2018). The effects of this herb have
been investigated when used either as a 100% crude powder (Thanikachalam et al. 2010;
Talpur and Ikhwanuddin 2012; Naeiji et al. 2013; Saleh et al. 2015), as solvent extracts
(semi-purified) (Guo et al. 2012; Dash et al. 2014; Militz et al. 2014; Saha and
Bandyopadhyay 2017; Büyükdeveci et al. 2018) or as purified extracts (Nya et al. 2010;
Hassaan and Soltan 2016; Huang et al. 2018; Hyun Kim et al. 2019), with crude garlic
powder being the most commonly researched form (Table 2.2). A number of the studies
concisely support the beneficial effects of garlic in fish (i.e. immunomodulation, growth
promotion, appetites stimulation, digestion stimulation, antioxidation, antimicrobial,
antiparasitic, and appetite, hepatoprotective), and recommended further efforts to be
directed at investigating purified garlic extracts for easy standardizations, and to advance
in parameters of assessments to understand the mechanisms of the actions of garlic (Nya
and Austin 2009, 2011; Talpur and Ikhwanuddin 2012; Zaefarian et al. 2017).
In aquaculture, garlic is typically incorporated into fish feed and administered orally,
which is a common administration method of herbal extracts reported in fish studies
(Reverter et al. 2014; Dawood et al. 2016). As demonstrated by Militz et al. (2013), and
Hyun Kim et al. (2018) garlic extracts may also be delivered through immersion. The
selection of the delivery method is mainly dictated by the purpose of garlic
administration, the size of the fish and type of species, the types of extracts, and the type
Page 47
23
of farming system (Reverter et al. 2014; Dawood et al. 2016). For instance, garlic
extracts administered orally were reported to have improved growth, feed utilization,
and disease resistance in Nile tilapia, Oreochromis niloticus (Abu-Elala et al. 2016),
redbelly tilapia (Ajiboye et al. 2016), and rainbow trout, Oncorhynchus mykiss (Nya and
Austin 2009). Immersion administration of garlic has also been reported to treat fish
parasites effectively (Militz et al. 2013, 2014; Fredman et al. 2014; Hyun Kim et al.
2018).
2.3.1 Garlic effects on growth and feed utilization of fish
The benefits of garlic extract on growth and feed utilization have been reported in
different fish species in aquaculture (Table 2.2). Büyükdeveci et al. (2018) reported that
O. mykiss fingerlings significantly increased in weight gain (WG), specific growth rate
(SGR), and significantly decreased in feed conversion ratio (FCR) after being fed garlic-
supplemented diets (20 g/kg) for two weeks compared to a control. Similarly, garlic
supplemented diets had improved growth and feed utilization indices in O. niloticus (40
g/kg, 70 days) (Mabrouk et al. 2011), orange-spotted grouper, Epinephelus coioides (13
g/kg, 14 days) (Guo et al. 2012), sterlet sturgeon, Acipenser ruthenus (20-30 g/kg, 84
days) (Lee et al. 2014), European seabass, Dicentrarcus labrax (30 g/kg, 49 days) (Saleh
et al. 2015), Caspian trout, Salmo caspius (20 g/kg, 6 weeks) (Zaefarian et al. 2017), O.
mykiss (30 g/kg, 56 days) (Esmaeili et al. 2017a), Oscar, Astronotus ocellatus (10 g/kg,
56 days) (Saghaei et al. 2015) and sobaity seabream, Sparidentex hasta (10 g/kg, 56
days) (Jahanjo et al. 2018) compared to a control. Most of these studies linked the
growth-enhancing and feed utilization enhancing effects of garlic to its organosulfur
compounds such as allicin. Allicin has a strong stimulatory effect on olfaction and as a
Page 48
24
result increases appetite in fish (Lee and Gao 2012). Khali et al. (2001) indicated that
allicin could promote growth in fish by its ability to enhance the performance of the
intestinal flora, which then improves their energy utilization capacity. Another way that
allicin could improve growth in fish is by inhibiting or killing of various pathogenic
bacteria, improving gastrointestinal motility, and regulating the secretion of different
enzymes to improve digestion and nutrient absorption (Lee and Gao 2012). Büyükdeveci
et al. (2018) supported this by reporting the improved growth performance and change
in the intestinal microbiota of O. mykiss juveniles after being fed with diets
supplemented with garlic powder for 120 days.
Some studies reported dietary garlic supplementation to have no influence on growth
performance and feed utilization of neither finfish nor shellfish (Table 2.2). For instance,
dietary garlic peel extracts supplemented at 5, 10, and 15 g/kg failed to significantly
improve WG, SGR, and FCR of C. gariepinus fingerlings after 20 days administration
(Thanikachalam et al. 2010). Eirna et al. 2016 reported the same in C. gariepinus after
being fed diets supplemented with garlic peel or clove extracts at 10, 20, or 30g for 84
days. Similarly, dietary garlic had no significant effects on growth and feed utilization
indices in other fish species such as O. mykiss (Nya and Austin 2011), barramundi, Lates
calcarifer (Talpur and Ikwanuddin 2012), Huso huso (Kanani et al. 2014), cachama,
Colossoma macropomum (Inoue et al. 2016), whiteleg shrimp, Litopenaeus vannamei
(Labrador et al. 2016; Huang et al. 2018) compared to a control, respectively. It thus
seems that growth improvement in fish following garlic supplementation is not obvious.
Lee and Gao (2012) in their review on garlic in aquaculture highlighted that, duration of
the experiment might be a factor contributing to poor growth and feed utilization
Page 49
25
performance. This was demonstrated by Aly and Mohamed (2010) who reported that
garlic supplemented diets had no significant effect on growth of O. niloticus after 30 or
60 days of feeding but a significant increase in growth was observed after 240 days.
They stated that short feeding periods seemed to be unsuitable for garlic extracts to
manifest their growth promoting potential in fish. However, inconsistent results exist to
support this observation, as shown by Nya and Austin (2009), and Guo et al. (2012).
Other factors that could influence the effects of garlic supplementation in fish include
the type of fish species, fish size, developmental stage, and garlic inclusion levels (Yang
et al. 2010; Lee and Gao 2012). For example, Talpur and Ikhwanuddin (2012) reported
no significant improvement in the growth and feed utilization indices of L. calcarifer
after being fed with garlic-supplemented diets for 14 days. Guo et al. (2012) reported the
opposite in E. coioides fed garlic-supplemented diets for the same duration.
Administering the allicin compound was reported to increase and reduce growth with
increasing dosages in silberner pacu, Colossoma barchypomum (Xiang and Liu 2002)
and allicin at 800 mg/kg caused mortality in swamp eel, Monopterus albus (Huang et al.
2001). Lee and Gao (2012) explained that when too much alkyl sulfide reaches the
intestines of the fish, the sulfides interfere with the metabolism and suppress mitotic cell
division, resulting in slow growth and even deaths. Therefore, there is still a need for
adequate research to define the optimal dosage of garlic as a feed supplement for each
fish species and each culture stage in different types of aquaculture production systems.
Page 50
26
Type of D
osage O
ptimum
Experiment
Grow
th/
extracts
(g/kg diet) dosage duration Feed utilization
Scientific name
Com
mon nam
e Initial wt.(g)
References
Dry pow
der 10, 15, 20
20 120 days FW
(>), WG
(>), SGR (>) O
. mykiss
Rainbow trout
6.83-8.19 Büyükdeveci et al. (2018)
FCR (<)
Dry pow
der 30
N
/A
60 days FW
(>), SGR (>), FCR (<) O
. mykiss
8.26 Esm
aeili et al. (2017a)
PE (>) Pow
der
5, 10
N/A
14, 21, 28 days SG
R (=), WG
(=), gutted wt. O
. mykiss
14
Nya and A
ustin (2009)
Dry pow
der 10
N
/A
56 days W
G (>), SG
R (>), FCR (<) S. hasta Sobaity seabream
3.08 Jahanjoo et al. (2018)
D
ry powder
10, 20, 30 20
42 days FW
(>), SGR (>), BW
I (>) S. caspius Caspian trout
19.94 Zaefarian et al. (2017)
FER (=), V
SI (>), HSI (>)
W
et powder
15, 30, 45 N
/A
45 days FW
(=), WG
(=), FL (=) C. m
acroponum Cacham
a 112.4
Inoue et al. (2015)
FCR (=) Peels or clove
10, 20, 30 N
/A
84 days FW
(=), WG
(=), SGR (=)
C. gariepinus A
frican catfish 8.0
Eirna-Liza et al. (2016)
Powder
FCR (=)
Peels powder
5, 10, 15 N
/A
20 days FW
(=), WG
(=), SGR (=)
C. gariepinus
8.7-8.88
Thanikachalam et al. (2010)
FCR (=)
Powder
5, 10, 20, 30
10 56 days
WG
(>), FW (>), SG
R (>) A. ocellatus O
scar
12.43 Saghaei et al. (2015)
FCR (<)
Powder
10, 20, 30
30 49 days
FW (>), W
G (>), SG
R (>) D. labrax
European seabass 0.4
Saleh et al. (2015)
FI (<), FCR (<), PER (>)
PPV (>)
Powder
5, 10, 15
N/A
14 days
WG
(=), SGR (=), FCR (=) L. calcarifer
Barramundi
20
Talpur and Ikhwanuddin (2012)
Powder
13, 40
13 14 days
WG
(>), FE (>)
E. coioides O
range-spotted grouper N/A
G
uo et al. (2012) Pow
der
5, 10, 30 20-30 84 days
WG
(>), FW (=), SG
R (>) A. ruthenus
Sterlet sturgeon) 5.5
Lee et al. (2014)
PER (>), H
SI (<) Pow
der
40
N/A
84 days
AD
G (>), SG
R (>), FCR (<) O. niloticus
Nile tilapia
3.12 M
abrouk et al. (2011)
PPV (>), EU
(>) Pow
der
30
N/A
Summ
er season SG
R (>), BWG
(>) O
. niloticus
0.8
Aly and M
ohamed (2010)
W
inter season SG
R (=), BWG
(=) Pow
der
10, 20, 30 30 60 days
W
G (>), A
DG
(>), RGR (>) Tilapia zillii
Redbelly tilapia 0.09
Ajiboye et al. (2016)
Table 2.2 Studies testing on the effects of orally administered garlic extracts on grow
th performance and feed utilization indices in
aquaculture.
Page 51
27
Powder
5
N
/A
N/A
FW
(>), WG
(>), SGR (>)
O
. niloticus
41.4
Abu-Elala et al. (2016)
FCR (<), PER (>) Pow
der
10, 20, 30, 40 30
90 days FW
(>), WG
(>), SGR (>)
O
. niloticus
7.0
Shalaby et al. (2006)
FI (>), FCR (<), FER (>)
PER (>) Pow
der
5, 10, 15 10
56 days W
G (>), SG
R (>)
R. rutilus Roach
1.0
Ghehdarijani et al. (2016)
Allicin
0.5, 1.0
N
/A
21 days W
G (=)
L. vannamei
Whiteleg shrim
p N
/A
Huang et al. (2018)
Powder
20, 40, 60
60 60 days
FW (=), W
G (=), FCR (<)
L. vannam
ei
2.29
Labrador et al. (2016) Pow
der
10
N/A
60 days
DG
R (=), BWG
(=), SGR (=)
H. huso
European sturgeon 30
Kanani et al. (2014)
FCR (=) O
il
1ml
N
/A
84 days W
G (>), SG
R (>), FI (>)
O. niloticus
1.88 H
assaan & Soltan (2016)
FCR (>), PER (>) Pow
der
1, 5, 10
N/A
60 days
SGR (=), FCR (=)
L. rohita
Rohu
10 Sahu et al. (2007)
Powder
0.05, 0.1, 0.5, 1.0
1.0 14 days
WG
(>), SGR (>), FCR (<)
O. m
ykiss
15
Nya and A
ustin (2009)
PER (>)
Notes: SG
R: Specific grow
th rate; WG
: Weight gain; FL: Fish length; BW
I: Body w
eight increasing; PE: Protein efficiency; AD
G: A
verage daily gain; PPV: Protein productive value; BW
G:
Body weight gain; RG
R: Relative growth rate; V
SI: Viscerosom
atic index; HSI: H
epatosomatic index; w
t.: Weight; FI: Feed intake; FW
: Final weight; PPV
: Protein productive value; PER:
Protein efficiency ratio; EU: Energy utilization, FCR: Feed conversion ratio; FI: Feed intake; FE
R: Feed efficiency ratio; FE: Feed efficiency; N/A
: Not available; (>): Significantly increased;
(<): Significantly decreased; (=): Not affected.
Page 52
28
2.3.2 Garlic effects on haemato-biochemical indices of fish
Blood is the most frequently examined tissue to assess the health or physiological status
of vertebrates in response to various factors such as drugs, diets, environmental changes
and stress (Shalaby et al. 2006). The health status index such as oxygen carrying
capacity has been directly determined by reference to primary hematological indices
such as red blood cell (RBC), haemoglobin concentration (Hb), percentage of blood
volume consisting of red blood cells, and haematocrits (Hct) (Houston 1997). Secondary
indices, sometimes called Wintrobe indices (Urrechaga et al. 2014) can be derived from
primary indices for the classification of anaemia condition such as Mean Corpuscular
Volume (MCV) = (Hct x 10 /RBC), Mean Corpuscular Haemoglobin (MCH) = (Hb x 10
/RBC), and Mean Corpuscular Haemoglobin Concentration (MCHC) = (Hb x 100/ Hct)
as demonstrated in Gabriel et al. (2015a). Other haematological indices such as white
blood cell (WBC), and a number of their differential counts (i.e. leucocyte counts such
as lymphocytes, neutrophils, eosinophils, monocytes, and basophils) have been assessed
to measure the innate immune status of animals, especially during stressful conditions
(Harikrishnan et al. 2010; Van Rijn and Reina 2010).
Positive and no effects of garlic on haematological parameters in different fish species
have been reported (Table 2.3). For example, Nya and Austin (2009, 2011) observed that
garlic extracts significantly stimulated erythropoiesis and leucopoiesis (i.e. increased
RBC, WBC, Hct, Hb, MCV, MCH, MCHC, and differential leucocytes counts) in O.
mykiss, which resulted in an improvement of fish health status and increased resistance
against a pathogenic bacterium, Aeromonas hydrophila. Similarly, dietary garlic
significantly increased haematological parameters of L. rohita (Sahu et al. 2007), C.
Page 53
29
gariepinus (Thanikachalam et al. 2010), D. labrax (Saleh et al. 2015), L. calcarifer
(Talpur and Ikhwanuddin 2012), H. huso (Kanani et al. 2014), common carp, Cyprinus
carpio (Chesti et al. 2018), O. mykiss (Esmaeili et al. 2017b), and S. hasta (Jahanjoo et
al. 2018). Garlic powder was also reported to have no effects on haematological
parameters of Salmo caspius (Zaefarian et al. 2017), D. labrax (Yilmaz and Ergün
2012), and O. niloticus (Hassaan and Soltan 2016).
In addition to haematological parameters, blood serum contains numerous elements that
can be used to monitor the health status of fish. For example, serum total protein
(product of WBC) (Misra et al. 2006), and globulin levels (source of immunoglobulins
or antibodies) (Goda 2008) in the blood reflect immune system activation (Siwicki et
al. 1994). The presence of lysozymes, antimicrobial peptides and phagocytes in the
blood indicates pathogens inhibiting activity (Uribe et al. 2011). Furthermore, several
endogenous antioxidant enzymes such as catalase (CAT), superoxide dismutase (SOD),
and glutathione peroxide GSH-Px have been used to indicate cell damage from reactive
oxygen species (ROS) in fish (Wu et al. 2006). Hepatoprotective activity is mainly
determined by aspartate aminotransferase (AST), and alanine aminotransferase (ALT)
(Cui et al. 2014), while stress can be reflected by glucose and cortisol blood content (He
et al. 2015).
Page 54
30
Table 2.3 Tested effects of orally administered garlic extracts on haem
ato-biochemical indices on farm
ed fish species.
Garlic products
D
uration of H
aemato-biochem
ical
Dosages (g/kg diet) exposure
indices
Fish species
R
eferences
Crude powder
0.5, 1.0
14 days
RBC (>), W
BC (>), MO
N (>)
O
. mykiss
N
ya and Austin (2011)
Lym
p. (>), NEU
. (<), THRO
M. (=)
TP (=), RBA (>), LY
Z. (>). Crude pow
der
0.05, 1.0, 0.5
14 days
RBC (>), WBC (>), H
ct (>), Hb (=)
MCV
(>), MCH
C (>), MCH
(>)
O. m
ykiss
Nya and A
ustin (2009)
Lym
p. (>), MO
N (>), N
EU (>)
THRO
M (=), TP (>), A
LB (=), GLO
B (>)
PH
AG
OR (>), PH
AG
OI (=)
LYZ (>).
Crude powder
1, 5, 10
after every 20 days RBC (>), W
BC (>), Hb (>), G
lu (<) L. rohita
Sahu et al. (2007)
for 70 days
TP (>), A
LB (>), GLO
B (>). Crude pow
der
10, 20, 30
49 days RBC (=), H
b (>), PCV (=), M
CV (>)
D
. labrax
Saleh et al. (2015)
M
CH (>), M
CHC (=), W
BC (>) Crude pow
der
5, 10, 15, 20
14 days
RBC (>), WBC (>), H
ct (>), Hb (>)
LY
MP. (>), M
ON
(>), NEU
(>)
L. calcarifer
Talpur and Ikhw
anuddin (2012)
TH
ROM
. (>), EOS (>), BA
SO (>)
Glu. (<), TP (>), A
LB (>), GLO
B (>)
RBA
(>), PHG
R (>). O
il
1.0 m
l
84 days
H
ct (=), Hb (=), RBC (=), A
ST (=)
O
. niloticus
Hassan and Soltan (2016)
TP (>), ALB (=), G
LOB (>).
Paste
15, 30, 45
45 days
TP (=), G
lu. (=), RBC (=), Hb (=), H
ct (=)
Clossoma m
acropomum
Inoue et al. (2016)
MCV
(=), MCH
C (=), THRO
M. (=), M
ON
(=)
EO
S (=). Juice
2mg/kg body w
eight 5 days
G
lu. (<), AST (<), A
LT (<).
Clarias lazera
A
l-Shalahy 2002 Peels
5, 10, 15
20 days TP (>), A
LB (>), GLO
B (>), RBC (>), WBC (>)
C. gariepinus
Thanikachalam et al. (2010)
Crude powder
10, 20, 30, 40
90 days
erythrocytes (>), H
b (>), Hct ( <), M
CV (=)
O
. niloticus
Shalaby et al. (2006)
M
CH (=), M
CHC (>), G
lu. (<), TP (>)
A
ST (<), ALT (<).
Crude powder
10
60 days
RBC (=), Hb (=), H
ct (=), MCH
C (>), MCH
(=) H
. huso
K
anani et al. (2014)
Page 55
31
Notes: H
ct: Hem
atocrits; Hb: H
emoglobin; W
BC: White blood cells; M
CV: M
ean corpuscular volume; LY
Z: Lysozyme activity; G
lu: Glucose; TP: Total protein; A
LB: A
lbumin;
GLO
B: G
lobulin; RBC: Red blood cells; MCH
: Mean corpuscular hem
oglobin; MCH
C: Mean corpuscular hem
oglobin concentrate; NEU
: Neutrophils; LY
MP: Lym
phocytes; AST:
Aspartate am
inotransferase; ALT: A
lanine aminotransferase; TH
ROM
: Thrombocytes; RBA
: Respiratory burst activity; MO
N: M
onocytes; PHA
GO
I: Phagocytic index; (>): Significantly increased; (<): Significantly decreased; (=): N
ot affected; PHA
GO
R: phagocytic ratio; BA
SO: Basophils.
LYM
P (>). NEU
(>), EOS (>), M
ON
(=)
A
LT (=), AST (<), TP (=), A
LB (<), LYZ (<)
Crude pow
der
5, 10, 15
245 days Erythrocytes (>), leukocytes (>), H
b (>), PCV (<)
C. carpio
Chesti et al. (2018)
M
CV (<), M
CHC (>)
Crude powder
30
60 days
RBC (>), Hb (>), H
ct (>), WBC (>), LY
Z (>)
O. m
ykiss
Esmaeili et al. (2017b)
TP (>), ACH
50 (>). Pow
der
10
56 days
WBC (>), RBC (>), H
b (>), Hct (>), M
ON
(=) S. hasta
Jahanjoo et al. (2018)
LY
MP (>), N
EU (>), EO
S (=), TP (>), ALB (>),
AST (<), A
LT (<), ALP (<), SO
D (>), LY
Z (>)
A
CH50 (>).
Crude powder
10, 20, 30
42 days
H
b (=), Hct (=), W
BC (=), RBC (=), MCV
(=) S. caspius
Zaefarian et al. (2017)
MCH
(=), MCH
C (=), Glu. (=), TP (>), A
LB (=)
LY
Z (>). O
il Bath imm
ersion 0.01, 0.02
9 hours
RBC (=), H
ct (=), Hb (=), M
CV (=), M
CH (=)
D. labrax
Y
ilmaz and Ergün (2012)
MCH
C (=). Crude pow
der
20, 40, 60
60 days
RBC (<), Hb (<), H
ct (<), MCH
(<), Glu. (<)
D
. labrax
Irkin et al. (2014)
Page 56
32
The effects of garlic extract on blood biochemical parameters in fish have also been
documented in aquaculture. For instance, dietary garlic crude powder supplementation
was reported to have enhanced serum total protein, globulin, phagocytic ratio, and
lysozyme activity in O. mykiss (Nya and Austin 2009). The same type of extract was
reported to have significantly increased serum total protein, albumin, and globulin
content in L. rohita (Sahu et al. 2007). Similar results were reported in L. calcarifer
(Talpur and Ikhwanuddin 2012), C. gariepinus (Thanikachalam et al. 2010), O. mykiss
(Esmaeili et al. 2017b), S. hasta (Jahanjoo et al. 2018), and S. caspius (Zaefarian et al.
2017) after being fed diets supplemented with garlic crude powder. Similarly, dietary
garlic oil extracts were reported to have significantly increased serum total protein, and
globulin content in O. niloticus after 84 days administration (Hassan and Soltan 2016).
Contradicting findings were also reported. For example, dietary garlic crude powder
supplementation significantly decreased albumin and lysozyme activity and had no
effect on the serum total protein in H. huso (Kanani et al. 2014). This was supported by
Inoue et al. (2016) after feeding C. macroponum fingerlings with diets supplemented
with garlic paste for 45 days.
The improvement of the health status of fish following garlic administration is mainly
attributed to allicin (Khalil et al. 2001). Although there is no clear explanation on the
mode of action of these compounds, the assumption is that they improve the overall
health of the animal by promoting the performance of the intestinal flora, which then
translates into improved feed digestion, nutrient absorption, energy utilization and
growth (Diab et al. 2008; Büyükdeveci et al. 2018). In addition, since garlic contains
other valuable compounds ranging from nutritional compounds (free amino acids,
Page 57
33
minerals, oil, vitamins) (Joo et al. 2013; Santhosha et al. 2013) to anti-nutritional factors
(polysaccharides, flavonoids, saponins) (Lanzotti et al. 2014; Pan and Wu 2014), more
studies are required to establish the effects of different compounds of garlic on the
health of different fish species.
In aquaculture research, fitness and quality of animals supplemented with medicinal
herbs is tested by subjecting them to stressors such as manipulated water quality
parameters, because fish can be sensivitive to a sudden change in water quality (Lin and
Chen 2008; Ndubuisi et al. 2015). For instance, a change in the water pH (low or high)
may interfere with the osmoregulation and respiration in the fish, which may be stressful
and deadly to the fish (Laurent et al. 2000). Khan et al. (2018) reported that L. rohita
fingerlings that were fed a diet supplemented with muli bamboo (Melocanna baccifera)
leave extracts had a higher resistance against low pH compared to the unsupplemented
fish. The same phenomenon was reported in O. mykiss (Fazlolahzadeh et al. 2011), and
R. rutilus (Ghehdarijani et al. 2016) after being fed with A. sativum supplemented diets,
and subjected to high temperature and salinity, respectively. Therefore, these findings
encourage for more studies to investigate the resistance effects of herbal extracts in fish
against poor water quality parameters, especially in the Namibian aquaculture where
water quality is one of the main causes of fish mortality.
Fish have also been exposed to pathogenic bacteria (Manaf et al. 2016; Zanuzzo et al.
2017), transport stress (Zanuzzo et al. 2012), overcrowding (Xie et al. 2008), and
parasites (Fridman et al. 2014; Hyun et al. 2019). Herbal extracts supplemented fish
have been presented to show high resistance against physiological stress when compared
Page 58
34
to unsupplemented ones. Studies on resistance of fish against stress include measuring of
the stress and immune parameters, and survival rate during pre and post-challenge. For
example, Sahu et al. (2007) reported that garlic extracts enhanced immune response
(increased WBC, serum total protein, albumin and globulin), reduced stress (lower
glucose level), and increased survivability of L. rohita after A. hydrophila challenge
(Table 2.3). Similarly, introducing the A. hydrophila had no adverse effects in O. mykiss
(Nya and Austin 2009, 2011), O. niloticus (Aly and Mohamed 2009), and C. gariepinus
(Thanikachalam et al. 2010) supplemented with garlic. Garlic extracts in the diet were
reported to reduce mortality and enhance immune response in L. calcarifer (Talpur and
Ikhwanuddin 2012), and in L. vannamei (Huang et al. 2018) when challenged with a
pathogenic bacterium, Vibrio harveyi. Meanwhile, hepatoprotective effects (lower AST
and ALT) of garlic were reported in Clarias lazera (Al-Shalahy 2002), H. huso (Kanani
et al. 2014), and S. hasta (Jahanjoo et al. 2018).
Garlic has also been reported to treat a number of parasitic infections in aquaculture.
Lower infestation of Cyptocaryon irritans parasite was reported in Poecilia reticulata
after garlic administration (Hyun et al. 2019). Similarly, garlic reduced infestation of
Anacanthorus spathulatus parasite in C. macropomum (Inoue et al. 2016). Garlic
extracts also reportedly reduced infestation of Gyrodactylus turnbulli, Dactylogyrus sp.
in P. reticulata (Schelkle et al. 2013; Fridman et al. 2014), and Neobenedenia sp.
parasite infestation in L. calcarifer (Militz et al. 2013). Thus, it appears that garlic (A.
sativum) has the ability to increase resistance in fish against several stressors associated
with culture systems.
Page 59
35
2.4 The medicinal use of Aloe vera
Aloe vera synonym Aloe barbadensis Miller is a stemless, drought-resistant cactus-like
herb, which is one of the > 400 species in the genus Aloe belonging to the Liliaceae
family that is indigenous to South Africa, but now is found widely distributed in hot and
dry climate regions of the world (Reynold and Dweck 1999). Among Aloe species, A.
vera is the most researched, commercially important Aloe species, and used as a
traditional medicine of many nations across the globe (Foster and Samman 2011; Maan
et al. 2018).
Aloe vera is mainly characterized by its high water content (99 - 99.5%) (Hamman
2008), while the remaining 0.5 - 1.0% content contains about 70 biologically active
compounds such as water-soluble and fat-soluble vitamins, minerals, enzymes,
simple/complex polysaccharides, phenol compounds, and organic acids (Gupta and
Malhotra 2012; Radha and Laxmipriya 2015). These bioactive compounds are found
either in the gel (inner transparent mucilaginous jelly like tissues), latex (middle layer)
and/or rind (outer thick layer) part of the A. vera leaf (Figure 2.4). Active ingredients in
A. vera are found in the gel such as the polysaccharides (glucomannans, xylose,
rhamnose, galactose and arabinose) vitamins (A, C, E, B1, B2, B12, niacin, choline and
folic acid), minerals (Potassium, chloride, sodium, calcium, magnesium, copper, zinc,
chromium and iron), enzymes (catalase, amylase, oxidase, cellulase, lipase and
carboxypeptidase), amino acids, and anthraquinones (aloin A and aloin B) (Ahlawat and
Khatkar 2011; Radha and Laxmipriya 2015). Anthraquinones can be found in the latex
part of the leaf (Hamman 2008). A. vera’s rich composition justifies its widely
acclaimed pharmacological properties such as anti-inflammatory properties (Hutter et al.
Page 60
36
1996), antioxidant properties, immune boosting properties (Im et al. 2005; Tai-Ni et al.
2005; Budai et al. 2013), wound healing properties (Reynold and Dweck 1999;
Tarameshloo et al. 2012), intestinal absorption enhancement (Carien et al. 2013) and
hepatoprotective effects (Rahimifard et al. 2013).
Figure 2.4 Aloe vera plant and its leaf cross-sectional view adapted from Boudreau and
Beland (2006).
Inner layer(Aloe vera gel)
Middle layer(latex)
Outer layer (rind)
Aloe vera Plant
Page 61
37
Class Compounds Vitamins B1, B2, B6, C, A ( -carotene), choline, folic acid, -tocopherol
Enzymes Alkaline phosphatase, amylase, carboxypeptidase, catalase, bradikinase,
cyclooxidase, peroxidase, carboxy-peptidase, cyclooxygenase, lipase, oxidase,
phosphoenolpyruvate carboxylase, superoxide dismutase.
Anthraquiones / Aloe-emodin, aloetic-acid, anthranol, aloin A and B (together known as barbaloin),
Anthrones isobarbaloin, emodin, ester of cinnamic acid.
Inorganic compounds Calcium, chlorine, chromium, copper, iron, magnesium, manganese, selenium,
zinc, potassium, phosphorus, and sodium.
Carbohydrates Pure mannan, acetylated mannan, acetylated glucomannan (acemannan), galactan,
Glucogalactomannan, galactogalacturan, galactoglucoarabinomannan,
arabinogalactan, pectic substance, xylan, cellulose.
Saccharides Mannose, glucose, L-rhamnose, aldopentose.
Organic compounds Arachidonic acid, -linolenic acid, steroids (campestrol, cholesterol, -sitosterol),
and lipids triterpenoid, triglicerides, gibberllin, lignins, potassium sorbate, salicylic acid, uric
acid.
Chromones 8-C-glucosyl-(2’-O-cinnamoyl)-7-O-methylaloediol A, 8-C-glucosyl-(S)-aloesol),
8-C-glucosyl-noreugenin, isoaloeresin D, isorabaichromone.
Non-essential amino acids Alanine, arginine, aspartic acid, glutamic acid, glycine, histidine, hydroxyproline,
isoleucine, leucine.
Essential amino acids Lysine, methionine, phenylalanine, proline, threonine, and valine.
Table 2.4 Bioactive ingredients in the Aloe vera leaf gel and latex, adapted from Gupta and Malhotra
(2012).
Page 62
38
2.5 Previous studies on Aloe vera extracts in aquaculture
In humans, A. vera research has already moved from the experimental level to the
application level (i.e. A. vera is used in cosmetics, immunostimulants and food
additives). In agriculture, including aquaculture, A. vera research has not yet fully
transcended into the applications. In fact, a study by Kim et al. (1999) on the nonspecific
immune response and disease resistance effects of A. vera in rockfish (Sebastes
schlegeli) is the first in testing the effects of A. vera in aquaculture. Research interest on
A. vera in aquaculture only increased in the late 2000s. Several studies have investigated
different A. vera extracts such as crude extracts powder (Zanuzzo et al. 2012, 2015a,
2015b; Gabriel et al. 2015a, 2015b), gel (Golestan et al. 2015; Soltanizadeh and
Mousavinejad 2015; Mehrabi et al. 2019), solvent extracts (Mahdavi et al. 2013),
nanoparticles (Sharif et al. 2017), and aloin (Srivastava et al. 2018) in fish for different
purposes. All these studies concluded that A. vera used as a medicinal herb has the
potential to promote growth, immunity, disease resistance, anti-oxidation and anti-stress
in fish, and can be used as a preservative and as a sex reversal agent in aquaculture.
However, there is still little information regarding the application of A. vera as a
medicinal herb in aquaculture, for C. gariepinus culture, and no herbal feed additives
tested in aquaculture in Namibia has been reported.
2.5.1 Aloe vera effects on fish growth and feed utilization parameters
Several studies have reported the beneficial effects of different A. vera extracts on
growth and feed utilization efficiency in various fish species (see Table 2.5). A. vera leaf
paste (10 g/kg diet) significantly improved growth performance parameters i.e. FW,
WG, SGR as well as feed utilization indices (FCR, PER, and apparent net protein
Page 63
39
utilization, ANPU) in C. gariepinus fingerling after 84 days of administration
(Adegbesan et al. 2018). A significant improvement in the same parameters was
reported in C. carpio juveniles after being fed a diet supplemented with ethanolic
extracts of A. vera (25 g/kg diet) for a period of 56 days (Mahdavi et al. 2013). Alishahi
and Abdy (2013) reported a significant improvement in growth and feed utilization
parameters after feeding C. carpio juveniles with a diet supplemented with A. vera gel (5
g/kg). A. vera gel (1.0 to 10 g/kg diet) also increased growth and feed utilization indices
in O. mykiss juveniles after 42 days of administration (Heidarieh et al. 2013). Diets
supplemented with A. vera (10 to 20 g/kg diet) also reported to have significantly
improved growth and feed utilization efficiency in Genetically Improved Farmed Tilapia
(GIFT), O. niloticus (Gabriel et al. 2015a). This indicates that A. vera extracts could be
utilized to enhance growth and production in farmed fish.
Dietary A. vera extracts were also been reported to exert no influence on the growth in
fish. For example, Zanuzzo et al. (2015a) reported that A. vera crude powder
supplemented diets (5 g/kg basal diet) failed to significantly increase the WG and SSI
(spleen somatic index) of O. mykiss after 42 days of feeding. Similarly, 2 mg A. vera
powder/kg diet had no influence on WG and SGR of goldfish (Carassius aurata) after
30 days administration (Palermo et al. 2013). However, these studies only used a single
A. vera inclusion level, despite the observations that A. vera extracts affect the growth of
fish in a dose-dependent fashion (Gabriel et al. 2015a; Sharif et al. 2017; Mehrabi et al.
2019). The duration of the experiment, 30 days as designed by Palermo et al. (2013)
could be another shortfall because the minimum duration of rearing fish with the aim to
understand the growth performance effects of a feed ingredient is about 60 days (Jobling
Page 64
40
2012). Thus, adequate rearing periods, and multiple dietary inclusion levels are some of
the factors to be considered in optimizing herbal extracts as growth promoters in
aquaculture.
Improved growth in fish following A. vera supplementation could be a result of several
factors, including the compounds present in the leaves of the plant such as the complex
polysaccharides and the phenolic compounds (anti-nutritional) (Hamman 2008; Radha
and Laxmipriya 2015). Growth-promoting effects of medicinal herbal extracts in fish
have been mainly attributed to their polysaccharides (Chen et al. 2003; Tremaroli and
Backed 2012; Zahran et al. 2014). Polysaccharides possess the ability to sustain the
homeostasis of the fish gut microbial community as well as their health (Tremaroli and
Backed 2012), either by reducing the bacterial and viral infection (Chen et al. 2003) or
by directly affecting pathogenic gut microflora (Sohn et al. 2000; Citarasu 2010; Yu et
al. 2018). This subsequently improves feed digestibility and availability of nutrients
from feedstuffs, and shortens the feed transit time, which might have a beneficial
influence on digestive enzymes (Patel and Srinivasan 2004) and also minimizes the
amount of feed substrate available for proliferation of pathogenic bacteria (Citarasu
2010). In support of this premise, Gabriel et al. (2017) showed that 100% A. vera
extracts significantly increased amylase, trypsin and lipase activities in GIFT-tilapia. To
strengthen the conclusion that the growth promoting effects of A. vera are attributed to
their polysaccharides, there is a need to further study these type of A. vera extracts in
farmed fish, similar to the reported Astragulus polysaccharides growth effects in O.
niloticus (Ardo et al. 2008; Zahran et al. 2014). This also formed the basis of the present
study.
Page 65
41
Types of
A. vera extracts
D
osages O
ptimum
Experim
ent G
rowth/
(g/kg diet)
dosage/s duration
Feed utilization
Fish species initial wt.(g)
References
Gel
0.1, 1.0, 10, 1.0- 10
42 days
SG
R (>), WG
(>), IVL (>)
O. m
ykiss 50.3
H
eidarieh et al. (2013)
IVW
(>), FCR (<) Ethanolic
1, 5, 25
5-25
56 days
FW (>), SG
R (>), FL (>) C. carpio
29.74
Mahdavi et al. (2013)
extracts
PE (>), FCR (<), FCE (>)
G
el
0.5, 1.0, 2.0
N/A
56 days
FW (=), SG
R (=), WG
(=) O
. mykiss
9.5
Golestan et al. (2015)
RG
R (=), CF (=), FCR (=)
Gel
1, 5, 10
5
60 days
GR (>), SG
R (>), FCR (<) C. carpio
45
Alishahi and A
bdy (2013) Leave paste
10, 20, 30
10
84 days
FW (>), SG
R (>), WG
(>) C. gariepinus
2.33
Adegbesan et al. (2018)
FI (>), FCR (>), PER (<)
A
NPU
(>)
Powder
5
N/A
42 days
WG
(=), SSI (=),
O. m
ykiss 133.9
Zanuzzo et al. (2015a)
Nanoparticles
5, 10, 15
10-15
60 days
FW (>), FL (>), W
G (>),
Acipenser baerii 10.95
Sharif et al. (2017)
SG
R (>), FCR (<), PER (>)
Aqueous crude
5, 10, 15
15
56 days W
G (>), SG
R (>), FCR (>) O
. mykiss
10.89
Mehrabi et al. (2019)
extracts
Powder
2mg/g diet
N/A
30 days
WG
(=), SGR (=)
C. auratus
4-7cm
Palerm
o et al. (2013)
(2%
)
length
Pow
der
5, 10, 20, 40
10-20
60 days
WG
(>), SGR (>), A
GR (>) G
IFT-O. niloticus
4.83
Gabriel et al. (2015a)
FI (<), V
SI (=), HSI (=)
FCR (<), FER (>)
Notes: SG
R: Specific grow
th rate; WG
: Weight gain; FL: Fish length; IV
L: Intestinal villus length; IVW
: Intestinal villus width; FCE: Feed conversion efficiency; RG
R: Relative
growth rate; CF: condition factor; V
SI: Viscerosom
atic index; HSI: H
epatosomatic index; w
t: Weight; FI: feed intake; FW
: Final weight; A
NPU
: Apparent net protein utilization
protein; PER: Protein efficiency ratio; FCR
: Feed conversion ratio; FI: Feed intake; FER: Feed efficiency ratio; (-): N
ot available; (>): Significantly increased; (<): Significantly decreased; (=): N
ot affected. Table 2.5 The effects of orally adm
inistered A. vera extracts on fish growth perform
ance and feed utilization indices in aquaculture.
Page 66
42
2.5.2 Aloe vera effects on fish haemato-biochemical indices (Table 2.6)
In addition to promoting growth, different A. vera extracts were reported to significantly
improve immune indices and to a certain extent improve specific immune responses in
fish (Table 2.6). Mehrabi et al. (2019) reported that dietary A. vera extracts were able to
significantly increase haematological parameters (RBC, WBC, Hct, and Hb) as well as
some blood serum elements (the total protein, albumin, globulin, respiratory burst
activity, and lysozymes), and complement system activity in O. mykiss fingerlings after
being fed these extracts for 56 days. Aloin (A. vera extract) was reported to significantly
improve innate immune response (increased lysozyme activity), and antioxidant activity
(increased catalase activity) in L. rohita seven days after a 1 mg aloin/kg fish body
weight injection. A. vera extracts such as emodin in L. rohita (Devi et al. 2019), aqueous
extracts in C. carpio (Alishahi et al. 2010), and pacu (Piaractus mesopotamus) (Zanuzzo
et al. 2017), crude powder in O. mykiss (Zanuzzo et al. 2015a, 2015b), C. auratus
(Palermo et al. 2013) and GIFT-O. niloticus (Gabriel et al. 2015a, 2015b) were also
reported to significantly improve the overall health status of each species, respectively.
Thus, A. vera extracts have the potential to be used as immuno-stimulants in
aquaculture.
The enhancement of haematological indices in fish following supplementation of A. vera
extracts in previous studies signifies the ability of A. vera to stimulate erythropoiesis
(generation of mature red blood cells), hence increase the oxygen carrying capacity and
strengthen the body to better tolerate physiological stress. The erythropoietin effects of
A. vera extracts in haematopoietic cells of bone marrow have been reported by Iji et al.
(2010). The assumption is that these effects could be due to vitamins (beta carotene, C,
Page 67
43
E, B12, riboflavin, thiamine, and folic acid), minerals (calcium, chromium, copper,
selenium, manganese, potassium, sodium, and zinc), essential and non-essential amino
acids present in A. vera that are essential for the synthesis of haemoglobin as
demonstrated by Kayode (2017). Erythropoiesis and leukopoiesis (formation of white
blood cells in bone marrow) has also been attributed to polysaccharides present in A.
vera leaves by Ni et al. (2004), Chow et al. (2005), Im et al. (2005), and Hamman
(2008). Some immuno-modulating effects were linked to lectins, which are
glycoproteins found in A. vera gel (Reynold and Dweck 1999). In addition to the innate
immune responses, A. vera extracts have been also reported to evoke specific immune
responses in fish. For instance, Alishahi et al. (2010) reported that 0.5% dietary A. vera
increased serum bactericidal activity and immunoglobulin M (IgM) antibody levels in C.
carpio infected with A. hydrophila. All of these studies are indicators that dietary
supplementation of A. vera extracts can improve the health status of fish, and as a result,
produce animals with high resistance against physiological stresses.
Aloe vera has been reported to increase the resistance of fish against different physical
and biological stressors. For instance, A. vera (0.2 mg/L of water) was reported to
significantly increase the innate immune response (respiratory burst activity) post
transport stress in B. amazonicus (Zanuzzo et al. 2012). Gabriel et al. (2015a) reported
that GIFT O. niloticus juveniles fed a diet supplemented with A. vera powder presented
a significantly lower glucose level, cortisol level and neutrophil/lymphocyte ratio than
unsupplemented fish during a pathogenic bacterium (Streptococcus inae) challenge. The
same was reported when A. vera supplemented Oreochromis sp. (Manaf et al. 2016), and
P. mesopotamicus (Zanuzzo et al. 2017) were subjected to pathogenic bacteria, S.
Page 68
44
agalactiae, and A. hydrophila, respectively. Dietary A. vera supplementation also
increased the survival probability in C. carpio (Abdy et al. 2017), and O. mykiss
(Heidarieh et al. 2013; Mehrabi et al. 2019), post A. hydrophila, S. agalactiae, and
Saprolegnia parasitica (parasite) exposure. Indeed, this is an indication that A. vera has
the ability to prevent disease outbreaks and prevent negative responses of fish to other
types of stresses in aquaculture.
On the other hand, medicinal herbs have been reported to be harmful to fish and even
deadly at high dosages (Palanisamy et al. 2011). Anaemia and tissue necrosis are some
of the negative effects of A. vera so far reported in fish following dietary
supplementation by Gabriel et al. (2015a) and Taiwo et al. (2005), respectively.
Spermatogenic dysfunction, decreased central nervous system activity, and a reduced
red blood cell count was observed in mice supplemented with A. vera extracts
(Boudreau et al. 2013). The side effects of herbal extracts such as anaemia in animals
was assumed to be a result of their ability to disrupt erythropoiesis, haemosynthesis and
osmoregulation by Cope (2005). A. vera adverse effects such as haematuria (presence of
red blood cells in the urine), metabolic acidosis (acid-base imbalance in the blood),
malabsorption (inability to absorb nutrients and fluids), and electrolyte disturbance
(mineral imbalance) in animals have also been reported (Mulle-Lissner 1993; Beuers
1991). These negative effects may explain the poor haemato-biochemical parameters
and decrease in growth as observed in some of the previous studies (Boudreau et al.
2013; Gabriel et al. 2015a; Zanuzzo et al. 2015a; Adegbesan et al. 2018) (Table 2.5,
2.6). Hence, an upper limit in dosage of A. vera supplementation is crucial in enhancing
immune responses as well as resistance against physiological stressors.
Page 69
45
Table 2.6 Effects of A. vera extracts on haemato-biochem
ical indices of some of the farm
ed fish species.
Aloe products
D
uration of H
aemato-biochem
ical
D
elivery D
osages (g/kg diet) exposure
indices
Fish species
References
G
el
oral
0.5, 1.0, 2.0
56 days
FRA (>), M
DA
(<)
O
. mykiss
Golestan et al. (2015)
Crude powder
imm
ersion 0.02, 0.2, 2.0 m
g/L 9hrs
G
lu. (=), RBA (>),
B. amazonicus
Zanuzzo et al. (2012)
Gel
oral
1.0, 5.0, 10.0
60 days
SBA
(<), NBT (>), CSA
, TP (>)
C. carpio A
lishahi and Abdy (2013)
IgM
(>), PCV (>), H
b (>), MCV
(=)
MCH
C (=), MCH
(=), RBC (>), HETR (=)
LY
MP (=), M
ON
(=), EOS (=), LY
Z (>) Leave paste
oral
10.0, 20.0, 30.0
84 days
PCV (>), H
b (>), RBC (>), MCH
(=)
C. gariepinus A
degbesan et al. (2018)
MCV
(=), MCH
C (=), WBC (>)
N
EU (<), LY
MP. (>), EO
S (<)
MO
N (=), BA
SO (>).
Gel
injection
100ul added 5ml TSB
42 days
ACH
50 (>), LYZ (>), BCID
AL (<)
C. carpio
Aby et al. (2017)
0.1ml injected into a fish
G
el
oral
5.0
56 days
CL (>), PH
AG
O (>)
Paralichthys olivaceus Kim
et al. (2002) Pow
der
oral
5.0
42 days
RBA (=), LY
Z (=), CSA (=)
O
. mykiss
Zanuzzo et al. (2015a)
4.0
28 days
MR (=), M
O2 (8%
lower), CO
RT (=)
Zanuzzo et al. (2015b) A
loin
injection 1m
g/body wt.
7 days
LY
Z (>), Protease (>), CARBO
X. (>)
L. rohita
Srivastava et al. (2018)
ALP (>) A
P (>)
CAT (>), PERO
X (>)
Aqueous
oral
0.5, 1.0, 2.0
10 days
RBA (>), G
lu. (<), NBT (>), LY
Z (>)
P. mesopotam
icus Zanuzzo et al. (2017)
Extracts
(w/w
)
CSA
(>) A
queous oral
5.0
42 days W
BC (>), IgM (>), LY
Z (>), BCIDA
L (>) C. carpio
Alishahi et al. (2010)
Extracts
RBC (=), PV
C (=), CSA (=)
Aloe-em
odin oral
0.001, 0.005, 0.01,
days interval A
LB (>), GLO
B (>), PHA
GO
(>), RBA (>)
L. rohita D
evi et al. (2019)
(m
g/kg diet)
(14, 28, 42, 56) CC3 (>), Lzy. A
ct. (>)
Aqueous
oral
5,10, 15
56 days
RBC (=), WBC (>), H
ct (>), Hb (>)
O
. mykiss
Mehrabi et al. (2019)
Extracts
TP (>), A
LB (>), GLO
B (>), RBA (>)
LY
Z (>). CSA (>).
Crude powder
oral
2mg/g diet
30 days
CH
OL (<), LD
L (=), HD
L (=), TG (=)
C. auratus Palerm
o et al. (2013) Crude pow
der oral
5, 10, 20, 40
60 days
W
BC (>), RBC (>), Hb (>), H
ct (>),
O. niloticus
Gabriel et al. (2015a)
M
ON
(=), LYM
P (<), NEU
(>), EOS (>).
Page 70
46
Notes: FR
A: Ferric reducing ability; C
AT: Catalase; M
DA
: Malondialdehyde; SBA
: Serum bactericidal; CL: Chem
iluminescent response; CO
RT: Cortisol; TG: Triglycerides; TC
HO
: Total cholesterol; CH
OL: Cholesterol; N
BT: Nitroblue tetrazolium
; CSA: Com
plement system
activity; Hct: H
ematocrits; H
b: Hem
oglobin; WBC
: White blood cells; M
CV: M
ean corpuscular volum
e; SOD
: Superoxide dismutase; LY
Z: Lysozyme activity; G
SH-Px: G
lutathione peroxidase; Glu: G
lucose; MR
: Metabolic rate; M
O2 : O
xygen consumption; H
DL: H
igh-density lipoprotein; LD
L = Low-density lipoproteins; PERO
X = Peroxidase; CA
RBOX
= Carboxylesterase; ALP = A
lkaline phosphatase; AP =A
cid phosphatase; IgM = Im
munoglobulin
M; PCV
: Packed cell volume; H
ETR: H
eterophil; ACH
50: Serum alternative com
plement activity; TP: Total protein; CC3: Com
plement C3; A
LB: A
lbumin; G
LOB
: Globulin; RBC
: Red blood cells; M
CH: M
ean corpuscular hemoglobin; M
CHC
: Mean corpuscular hem
oglobin concentrate; NEU
: Neutrophils; LY
MP: Lym
phocytes; AST: A
spartate aminotransferase; A
LT: A
lanine aminotransferase; PH
AG
O: Phagocytic activity; RBA
: Respiratory burst activity; MO
N: M
onocytes; (>): Significantly increased; (<): Significantly decreased; (=): Not affected;
BASO
: Basophils.
Crude powder
oral
5, 10, 20, 40
60 days
TCHO
(<), TG (<), LD
L (=), HD
L (>) O
. niloticus
Gabriel et al. (2015b)
CA
T (>), GSH
-Px (>), SOD
(=),
Page 71
47
2.6 Gaps in the existing knowledge and the way forward
This review has provided substantial evidence that garlic (A. sativum) and A. vera
possess the ability to promote growth, feed utilization, overall health and resistance
against different types of stressors in farmed fish. However, A. sativum and A. vera were
only studied in some fish species, and sometimes inadequate doses or time periods were
tested. Studies on the effects of these herbs on African catfish, C. gariepinus are rarely
reported. For example, this is the first study to report the resistance response of C.
gariepinus against low water pH following A. vera and A. sativum extracts dietary
supplementation (separately and in mixture).
These herbs contain several beneficial nutrients, and it is therefore important to isolate
(purify), characterize, and quantify the effective compounds for easy optimization as
recommended by Bulfon et al. (2013). There is a lack of knowledge on the toxicological
reports, stability of the herbal extracts in the aquatic environment, digestibility in fish
and product quality, which would also assist in determining the optimum inclusion
levels of the herbs in question. Furthermore, the explanation of the true mechanisms of
the activity of herbal extracts in aquatic animals is lacking, because fish have different
mechanisms for the metabolism and immunization of these compounds (Kong et al.
2007). Thus more studies including nutrigenomic and metabolomic studies (in vivo and
in vitro) are required to optimize and safely apply herbal products (A. sativum and A.
vera) in fish farming.
From this review, crude extracts of A. vera or A. sativum were the most studied types of
extracts used as supplement for fish, but little has been reported for African catfish, C.
Page 72
48
gariepinus (Thanikachalam et al. 2010; Eina-Liza et al. 2016; Adegbesan et al. 2018). It
is for this reason that the current study was designed to investigate the effects of dietary
Aloe vera and garlic (A. sativum) crude polysaccharide extracts on the growth
performance, feed utilization, whole body composition, haematological parameters and
the resistance against low water pH in African catfish, C. gariepinus.
Page 73
49
2.7 References
Abdel-Daim MM, Farouk SM, Madkour FF, Azab SS. 2015. Anti-inflammatory and
immunomodulatory effects of oxidative Spirulina platensis in comparison to
Dunaliella salina in acetic acid-induced rat experimental colitis.
Immunopharmacology & Immunotoxicology 37: 126-139.
Abdel-Tawwab M, Ahmad M, ESeden M, Sakr SF. 2010. Use of green tea, Camellia
sinensis L., in practical diet for growth and protection Nile tilapia, Oreochromis
niloticus (L.), against Aeromons hydrophila infection. Journal of the World
Aquaculture Society 41: 203-2013.
Abdy E, Alishahi M, Tollabi M, Ghorbanpour M, Mohammadian T. 2017. Comparative
effects of Aloe vera gel and Freund’s adjuvant in vaccination of common carp
(Cyprinus carpio L.) against Aeromonas hydrophila. Aquaculture International 25:
727-742.
Abu-Elala NM, Galal MK, Abd-Elsalam RM, Mohey-Elsaeed O, Ragaa NM. 2016.
Effects of dietary supplementation of Spirulina platensis and Garlic on the growth
performance and expression levels of immune related genes in Nile tilapia
(Oreochromis niloticus). Journal of Aquaculture Research & Development 7: 433.
Adegbesan SI, Obasa SO, Abdulraheem I. 2018. Growth performance, haematology and
histopathology of African catfish (Clarias gariepinus) fed varying levels of Aloe
barbadensis leaves. Journal of Fisheries 6: 553-562.
Adel M, Amiri AA, Zorriehzahra J, Nematolahi A, Esteban MÁ. 2015. Effects of dietary
peppermint (Mentha piperita) on growth performance, chemical body composition
and haematological and immune parameters of fry Caspian white fish (Rutilus frisii
kutum). Fish & Shellfish Immunology 45: 841-847.
Page 74
50
Ahlawat KS, Khatkar BS. 2011. Processing, food applications and safety of Aloe vera
products: a review. Journal of Food Science &Technology 48: 525-533.
Ahmed RA. 2018. Hepatoprotective and antiapoptotic role of aged black garlic against
hepatotoxicity induced by cyclophosphamide. The Journal of Basic & Applied
Zoology 79: 8.
Ajiboye OO, Yakubu AF, Simpa JO, Balogun SA. 2016. Effect of garlic-supplemented
diets on growth response, survival, nutrient utilization and body composition of
monosex Tilapia zillii. World 8: 115-122.
Al-Salahy MB. 2002. Some physiological studies on the effect of onion and garlic juices
on the fish, Clarias lazera. Fish Physiology & Biochemistry 27: 129-142.
Alagawany M, Ashour EA, Reda FM. 2016. Effect of dietary supplementation of garlic
(Allium Sativum) and turmeric (Curcuma Longa) on growth performance, carcass
traits, blood profile and oxidative status in growing rabbits. Annals of Animal
Science 16: 489-505.
Alam R, Fawzi EM, Alkhalf MI, Alansari WS, Aleya L, Abdel-Daim MM. 2018. Anti-
inflammatory, immunomodulatory, and antioxidant activities of allicin, norfloxacin,
or their combination against Pasteurella multocida infection in male New Zealand
rabbits. Oxidative Medicine & cellular Longevity 2018: 1-10.
Alishahi M, Ranjbar MM, Ghorbanpour M, Peyghan R, Mesbah M, RAZI JM. 2010.
Effects of dietary Aloe vera on some specific and nonspecific immunity in the
common carp (Cyprinus carpio). International Journal of Veterinary Research. 4:
189-195.
Page 75
51
Alishahi M, Abdy E. 2013. Effects of different levels of Aloe vera L. extract on growth
performance, hemato-immunological indices of Cyprinus carpio L. Iranian Journal
of Veterinary Science & Technology 5: 33-44.
Aly SA, Mohamed MF. 2010. Echinacea purpurea and Allium sativum as
immunostimulants in fish culture using Nile tilapia (Oreochromis niloticus). Journal
of Animal Physiology & Animal Nutrition 94: e31-e39.
Anwar S, Younus H. 2017. Inhibitory effect of alliin from Allium sativum on the
glycation of superoxide dismutase. International Journal of Bbiological
Macromolecules 103: 182-193.
Ardó L, Yin G, Xu P, Váradi L, Szigeti G, Jeney Z, Jeney G. 2008. Chinese herbs
(Astragalus membranaceus and Lonicera japonica) and boron enhance the non-
specific immune response of Nile tilapia (Oreochromis niloticus) and resistance
against Aeromonas hydrophila. Aquaculture 275: 26-33.
Asdaq SMB. 2015. Antioxidant and hypolipidemic potential of aged garlic extract and
its constituent, s-allyl cysteine, in rats. Evidence-Based Complementary &
Alternative Medicine 2015: 1-7.
Beuers U, Spengler U, Pape G. 1991. Hepatitis after chronic abuse of senna. The Lancet
337: 372-373.
Bhandari PR. 2012. Garlic (Allium sativum L.): A review of potential therapeutic
applications. International Journal of Green Pharmacy (IJGP) 6.
Block E, Naganathan S, Putman D, Zhao SH. 1993. Organo-sulfur chemistry of garlic
and onion: Recent results. Pure & Applied Chemistry 65: 625-632.
Boudreau MD, Beland FA, Nichols JA, Pogribna M. 2013. Toxicology and
carcinogenesis studies of a nondecolorized whole leaf extract of Aloe barbadensis
Page 76
52
Miller (Aloe vera) in F344/N rats and B6C3F1 mice (drinking water study). National
Toxicology Program Technical Report Series 577: 1-266.
Budai MM, Varga A, Milesz S, Tőzsér J, Benkő S. 2013. Aloe vera downregulates LPS-
induced inflammatory cytokine production and expression of NLRP3 inflammasome
in human macrophages. Molecular Immunology 56: 471-479.
Bulfon C, Volpatti D, Galeotti M. 2015. Current research on the use of plant‐derived
products in farmed fish. Aquaculture Research 46: 513-551.
Büyükdeveci ME, Balcázar JL, Demirkale İ, Dikel S. 2018. Effects of garlic-
supplemented diet on growth performance and intestinal microbiota of rainbow trout
(Oncorhynchus mykiss). Aquaculture 486: 170-174.
Capasso A. 2013. Antioxidant action and therapeutic efficacy of Allium sativum L.
Molecules 18: 690-700.
Carien B, Alvaro V, Josias H. 2013. Modulation of drug efflux by aloe materials: an in
vitro investigation across rat intestinal tissue. Pharmacognosy Magazine 9: 44-48.
Chen HL, Li DF, Chang BY, Gong LM, Dai JG, Yi GF. 2003. Effects of Chinese herbal
polysaccharides on the immunity and growth performance of young broilers. Poultry
Science 82: 364-370.
Chen L, Huang G. 2019. The antioxidant activity of derivatized cushaw
polysaccharides. International Journal of Biological Macromolecules 128: 1-4.
Chesti A, Chauhan RS, Khati A. 2018. Study on haematological parameters of
fingerlings of Amur carp (Cyprinus carpio Haematopterus) fed with garlic (Allium
sativum) incorporated diets. Journal of Pharmacognosy & Phytochemistry 7: 1407-
1410.
Page 77
53
Chow JTN, Williamson DA, Yates KM, Goux WJ. 2005. Chemical characterization of
the immunomodulating polysaccharide of Aloe vera L. Carbohydrate Research 340:
1131-1142.
Chung I, Kwon SH, Shim ST. 2007. Synergistic anti yeast activity of garlic oil and allyl
alcohol derived from alliin in garlic. Journal of Food Science 72: M437-M440.
Citarasu T. 2010. Herbal biomedicines: a new opportunity for aquaculture
industry. Aquaculture International 18: 403-414.
Cope RB. 2005. Allium species poisoning in dogs and cats. Veterinary Medicine-Bonner
Springs Then Edwardsville 100: 562.
Cui Y, Ye Q, Wang H, Li Y, Yao W, Qian H. 2014. Hepatoprotective potential of Aloe
vera polysaccharides against chronic alcohol-induced hepatotoxicity in mice.
Journal of the Science of Food & Agriculture 94: 1764-1771.
Dada AA, Oviawe NE. 2011. The use of bitter kola Garcinia kola dry seed powder as a
natural growth-promoting agent for African sharptooth catfish Clarias gariepinus
fingerlings. African Journal of Aquatic Science 36: 97-100.
Dash P, Yadav S, Sahoo PK. 2014. Immunoadjuvant effect of garlic (Allium sativum) –
mineral oil suspension on immunity and resistance to Aeromonas hydrophila
infection in rohu, Labeo rohita. International Aquatic Research 6: 167-173.
Dawood MA, Koshio S. 2016. Recent advances in the role of probiotics and prebiotics
in carp aquaculture: a review. Aquaculture 454: 243-251.
Devi G, Harikrishnan R, Paray BA, Al-Sadoon MK, Hoseinifar SH, Balasundaram C.
2019. Effects of aloe-emodin on innate immunity, antioxidant and immune cytokines
mechanisms in the head kidney leucocytes of Labeo rohita against Aphanomyces
invadans. Fish & Shellfish Immunology 87: 669-678.
Page 78
54
Diab AS, Aly SM, John G, Abde-Hadi Y, Mohammed MF. 2008. Effect of garlic, black
seed and Biogen as immunostimulants on the growth and survival of Nile tilapia,
Oreochromis niloticus (Teleostei: Cichlidae), and their response to artificial
infection with Pseudomonas fluorescens. African Journal of Aquatic Science 33: 63-
68.
Ebrahimi T, Behdad B, Abbasi MA, Rabati RG, Fayyaz AF, Behnod V, Asgari A. 2015.
High doses of garlic extract significantly attenuated the ratio of serum LDL to HDL
level in rat-fed with hypercholesterolemia diet. Diagnostic Pathology 10: 74.
Eirna-Liza N, Saad CR, Hassim HA, Karim M. 2016. The effects of dietary inclusion of
garlic on growth performance and disease resistance of African catfish (Clarias
gariepinus) fingerlings against Aeromonas hydrophila infection. Journal of
Environmental Biology 37: 817-824.
El-Beih NM, Ramadan G, Khorshed MA, Ahmed RS. 2017. Biochemical alterations in
insecticides-treated male albino rats: potential modulatory effects of a standardized
aged garlic extract. Indian Journal of Traditional Knowledge 181-188.
Esmaeili M, Abedian Kenari A, Rombenso AN. 2017a. Effects of fish meal replacement
with meat and bone meal using garlic (Allium sativum) powder on growth, feeding,
digestive enzymes and apparent digestibility of nutrients and fatty acids in juvenile
rainbow trout (Oncorhynchus mykiss Walbaum, 1792). Aquaculture Nutrition 23:
1225-1234.
Esmaeili M, Kenari AA, Rombenso A. 2017b. Immunohematological status under acute
ammonia stress of juvenile rainbow trout (Oncorhynchus mykiss Walbaum, 1792)
fed garlic (Allium sativum) powder-supplemented meat and bone meal-based
feeds. Comparative Clinical Pathology 26: 853-866.
Page 79
55
FAO (Food and Agriculture Organisation). 2018. The state of world fisheries and
aquaculture, meeting the sustainable development goals. Rome: FAO Fisheries and
Aquaculture Department.
Farahi A, Kasiri M, Sudagar M, Iraei MS, Shahkolaei MD. 2010. Effect of garlic
(Allium sativum) on growth factors, some haematological parameters and body
compositions in rainbow trout (Oncorhynchus mykiss). Aquaculture, Aquarium,
Conservation & Legislation 3: 317-323.
Fazlolahzadeh F, Keramati K, Nazifi S, Shirian S, Seifi S. 2011. Effect of garlic (Allium
sativum) on haematological parameters and plasma activities of ALT and AST of
Rainbow trout in temperature stress. Australian Journal of Basic Applied Sciences 5:
84-90.
Fečkaninová A, Koščová J, Mudroňová D, Popelka P, Toropilova J. 2017. The use of
probiotic bacteria against Aeromonas infections in salmonid
aquaculture. Aquaculture 469: 1-8.
Foster M, Hunter D, Samman S. 2011. Evaluation of the nutritional and metabolic
effects of Aloe vera. In: Benzie IFF, Wachtel-Galor S (eds), herbal medicine:
biomolecular and clinical aspects (2nd edn). Boca Raton: CRC press/ Taylor &
Francis.
Fridman S, Sinai T, Zilberg D. 2014. Efficacy of garlic based treatments against
monogenean parasites infecting the guppy (Poecilia reticulata (Peters). Veterinary
Parasitology 203: 51-58.
Fritsch RM, Friesen N. 2002. Evolution, domestication and taxonomy. In: Rabinowitch
HD, Currah L (eds), Allium crop science: recent advances. New York: CABI
Publishing. pp 5-30.
Page 80
56
Gabriel NN, Qiang J, He J, Ma XY, Kpundeh MD, Xu P. 2015a. Dietary Aloe vera
supplementation on growth performance, some haemato-biochemical parameters and
disease resistance against Streptococcus iniae in tilapia (GIFT). Fish & Shellfish
Immunology 44: 504-514.
Gabriel NN, Qiang J, Ma XY, He J, Xu P, Liu K. 2015b. Dietary Aloe vera improves
plasma lipid profile, antioxidant, and hepatoprotective enzyme activities in GIFT-
tilapia (Oreochromis niloticus) after Streptococcus iniae challenge. Fish Physiology
& Biochemistry 41: 1321-1332.
Gebreyohannes G, Gebreyohannes M. 2013. Medicinal values of garlic: A
review. International Journal of Medicine & Medical Sciences 5: 401-408.
Ghehdarijani MS, Hajimoradloo A, Ghorbani R, Roohi Z. 2016. The effects of garlic-
supplemented diets on skin mucosal immune responses, stress resistance and growth
performance of the Caspian roach (Rutilus rutilus) fry. Fish & Shellfish Immunology
49: 79-83.
Goda AMS. 2008. Effect of dietary Ginseng herb (Ginsana® G115) supplementation on
growth, feed utilization, and hematological indices of Nile tilapia, Oreochromis
niloticus (L.), fingerlings. Journal of the World Aquaculture Society 39: 205-214.
Golestan G, Salati AP, Keyvanshokooh S, Zakeri M, Moradian H. 2015. Effect of
dietary aloe vera on growth and lipid peroxidation indices in rainbow trout
(Oncorhynchus mykiss). Veterinary Research Forum 6: 63.
Gómez-Estaca J, De Lacey AL, López-Caballero ME, Gómez-Guillén MC, Montero P.
2010. Biodegradable gelatin–chitosan films incorporated with essential oils as
antimicrobial agents for fish preservation. Food Microbiology 27: 889-896.
Page 81
57
Guo JJ, Kuo CM, Hong JW, Chou RL, Lee YH, Chen TI. 2015. The effects of garlic-
supplemented diets on antibacterial activities against Photobacterium damselae
subsp. piscicida and Streptococcus iniae and on growth in Cobia, Rachycentron
canadum. Aquaculture 435: 111-115.
Gupta KV, Malhotra S. 2012. Pharmacological attribute of Aloe vera: revalidation
through experimental and clinical studies. An International Quarterly Journal of
Research in Ayurveda 33: 193-195.
Hamman JH. 2008. Composition and applications of Aloe vera leaf gel. Molecules.
13:1599-1616.
Harikrishnan R, Balasundaram C, Heo MS. 2010. Herbal supplementation diets on
haematology and innate immunity in goldfish against Aeromonas hydrophila. Fish &
Shellfish Immunology 28: 354-361.
Hassaan MS, Soltan MA. 2016. Evaluation of essential oil of fennel and garlic
separately or combined with Bacillus licheniformis on the growth, feeding
behaviour, hemato-biochemical indices of Oreochromis niloticus (L.) fry. Journal of
Aquaculture Research Development 7: 422-429.
He J, Qiang J, Gabriel NN, Xu P, Yang R. 2015. Effect of feeding-intensity stress on
biochemical and hematological indices of gift tilapia (Oreochromis
niloticus). Turkish Journal of Fisheries & Aquatic Sciences 15: 303-310.
Heidarieh M, Mirvaghefi AR, Sepahi A, Sheikhzadeh N, Shahbazfar AA, Akbari M.
2013. Effects of dietary Aloe vera on growth performance, skin and gastrointestine
morphology in rainbow trout (Oncorhynchus mykiss). Turkish Journal of Fisheries
& Aquatic Sciences 13: 367-373.
Page 82
58
Herrera M, Ruiz‐Jarabo I, Vargas‐Chacoff L, de la Roca E, Mancera JM. 2015.
Metabolic enzyme activities in relation to crowding stress in the wedge sole
(Dicologoglossa cuneata). Aquaculture Research 46: 2808-2818.
Heuer OE, Kruse H, Grave K, Collignon P, Karunasagar I, Angulo FJ. 2009. Human
health consequences of use of antimicrobial agents in aquaculture. Clinical
Infectious Diseases 49: 1248-1253.
Higuchi O, Tateshita K, Nishimura H. 2003. Antioxidative activity of sulfur- containing
compounds in Allium species for human low-density lipoprotein (LDL) oxidation in
vitro. Journal of Agricultural & Food Chemistry 51: 7208-7214.
Hoseinifar, S. H., Zou, H. K., Miandare, H. K., Van Doan, H., Romano, N., & Dadar, M.
(2017). Enrichment of Common Carp (Cyprinus carpio) diet with medlar (Mespilus
germanica) leaf extract: effects on skin mucosal immunity and growth
performance. Fish & Shellfish Immunology 67: 346-352.
Houston AH. 1997. Are the classical hematological variables acceptable indicators of
fish health? Transactions of the American Fisheries Society 126: 879-894.
Huang H, Pan L, Pan S, Song M. 2018. Effects of dietary herbal formulae combined by
Astragalus polysaccharides, chlorogenic acid and allicin in different combinations
and proportions on growth performance, non‐specific immunity, antioxidant status,
vibriosis resistance and damage indexes of Litopenaeus vannamei. Aquaculture
Research 49: 701-716.
Huang XG, He JH, Zuo JJ. 2001. Primary research on the application effects of allicin
on aquaculture of rice field eel Monopterus albus. Inland Fisheries 9: 27.
Page 83
59
Hutter J, Salman M. 1996. Anti-inflammatory C-glucosyl chromone from Aloe
barbadensis. Journal Natural Products. 59: 541-543.
Hyun Kim J, Fridman S, Borochov‐Neori H, Sinai T, Zilberg D. 2019. Evaluating the
use of garlic (Allium sativum) for the remedy of Cryptocaryon irritans in guppies
(Poecilia reticulata). Aquaculture Research 50: 431-438.
Iji OT, Oyagbemi AA, Azeez OI. 2010. Assessment of chronic administration of Aloe
vera gel on haematology, plasma biochemistry, lipid profiles and erythrocyte
osmotic resistance in Wistar rats. Nigerian Journal of Physiological Sciences 25:
107-113.
Im SA, Oh ST, Song S, Kim MR, Kim DS, Woo SS, Lee CK. 2005. Identification of
optimal molecular size of modified Aloe polysaccharides with maximum
immunomodulatory activity. International Immunopharmacology 5: 271-279.
Inoue LAKA, Oliveira Maciel P, Gusmão Affonso E, de Lima Boijink C, Tavares‐Dias
M. 2016. Growth, parasitic infection and hematology in Colossoma macropomum
Cuvier, 1818 fed diets containing Allium sativum. Journal of Applied Ichthyology 32:
901-905.
Irkin CL, Yigit M, Yilmaz S, Maita M. 2014. Toxicological evaluation of dietary garlic
(Allium sativum) powder in European sea bass Dicentrarchuslabrax juveniles. Food
and Nutrition Sciences 5: 989-996.
Jahanjoo V, Yahyavi M, Akrami R, Bahri AH. 2018. Influence of adding garlic (Allium
sativum), ginger (Zingiber officinale), thyme (Thymus vulgaris) and their
combination on the growth performance, haemato immunological parameters and
Page 84
60
disease resistance to Photobacterium damselae in sobaity sea bream (Sparidentex
hasta) Fry. Turkish Journal of Fisheries & Aquatic Sciences 18: 633-645.
Javadzadeh M, Salarzadeh AR, Yahyavi M, Hafezieh M, Darvishpour H. 2012. Effect of
garlic extract on growth and survival rate in Litopenaeus vannami post
larvae. Iranian Scientific Fisheries Journal 21: 39-46.
Ji SC, Jeong GS, Gwang-Soon IM, Lee SW, Yoo JH, Takii K. 2007. Dietary medicinal
herbs improve growth performance, fatty acid utilization, and stress recovery of
Japanese flounder. Fisheries Science 73: 70-76.
Jittinandana S, Kenney PB, Slider SD, Mazik P, Bebak‐Williams J, Hankins JA. 2003.
Effect of fish attributes and handling stress on quality of smoked arctic char
fillets. Journal of food science 68: 57-63.
Jobling M. 2012. National Research Council (NRC): Nutrient requirements of fish and
shrimp. Aquaculture International 20: 601-602.
Joo H, Kim CT, Kim IH, Kim Y. 2013. Anti-obesity effects of hot water extract and
high hydrostatic pressure extract of garlic in rats fed a high-fat diet. Food &
Chemical Toxicology 55: 100-105.
Josling PA. 2005. The heart of garlic Nature's aid to healing the human body. Chicago
Illinois: HEC Publishing.
Kallel F, Driss D, Bouaziz F, Belghith L, Zouari-Ellouzi S, Haddar A, Ghorbel R. 2015.
Polysaccharide from garlic straw: extraction, structural data, biological properties
and application to beef meat preservation. RSC Advances 5: 6728-6741.
Kanani HG, Nobahar Z, Kakoolaki S, Jafarian H. 2014. Effect of ginger-and garlic-
supplemented diet on growth performance, some hematological parameters and
Page 85
61
immune responses in juvenile Huso huso. Fish Physiology & Biochemistry 40: 481-
490.
Khalid N, Ahmed I, Latif MSZ, Rafique T, Fawad SA. 2014. Comparison of
antimicrobial activity, phytochemical profile and minerals composition of garlic
Allium sativum and Allium tuberosum. Journal of the Korean Society for Applied
Biological Chemistry 57: 311-317.
Khalil RH, Nadia BM, Soliman MK. 2001. Effects of Biogen and Levamisol Hcl on the
immune response of cultured Oreochromis niloticus to Aeromonas hydrophila
vaccine. Beni-Suef Veterinary Medicine Journal XI2: 381-392.
Khan MIR, Saha RK, Saha H. 2018. Muli bamboo (Melocanna baccifera) leaves
ethanolic extracts a non-toxic phyto-prophylactic against low pH stress and
saprolegniasis in Labeo rohita fingerlings. Fish & Shellfish Immunology 74: 609-
619.
Kim KH, Hwang YJ, Bai SC. 1999. Resistance to Vibrio alginolyticus in juvenile
rockfish (Sebastes schlegeli) fed diets containing different doses of aloe.
Aquaculture 180: 13-21.
Kong XF, Wu GY, Liao YP, Hou ZP, Liu HJ, Yin FG, Xie MY. 2007. Dietary
supplementation with Chinese herbal ultra‐fine powder enhances cellular and
humoral immunity in early‐weaned piglets. Livestock Science 108: 94-98.
Kumar G, Engle CR. 2016. Technological advances that led to growth of shrimp,
salmon, and tilapia farming. Reviews in Fisheries Science & Aquaculture 24: 136-
152.
Page 86
62
Kumar R, Chhatwal S, Arora S, Sharma S, Singh J, Singh N, Khurana A. 2013.
Antihyperglycemic, antihyperlipidemic, anti-inflammatory and adenosine
deaminase-lowering effects of garlic in patients with type 2 diabetes mellitus with
obesity. Diabetes, Metabolic Syndrome and Obesity: Targets & Therapy 6: 49-56.
Labrador JRP, Guiñares RC, Hontiveros GJS. 2016. Effect of garlic powder-
supplemented diets on the growth and survival of Pacific white leg shrimp
(Litopenaeus vannamei). Cogent Food & Agriculture 2: 1210066.
Lanzotti V, Scala F, Bonanomi G. 2014. Compounds from Allium species with cytotoxic
and antimicrobial activity. Photochemistry Reviews 13: 769-791.
Lara-Flores M. 2011. The use of probiotic in aquaculture: an overview. International
Journal of Microbiology 2: 471-478.
Laurent P, Wilkie MP, Chevalier C, Wood CM. 2000. The effect of highly alkaline
water (pH 9.5) on the morphology and morphometry of chloride cells and pavement
cells in the gills of the freshwater rainbow trout: relationship to ionic transport and
ammonia excretion. Canadian journal of zoology 78: 307-319.
Lee DH, Lim SR, Han JJ, Lee SW, Ra CS, Kim JD. 2014. Effects of dietary garlic
powder on growth feed utilization and whole body composition changes in fingerling
sterlet sturgeon, Acipenser ruthenus. Asian-Australasian Journal of Animal Sciences
27: 1303.
Lee JY, Gao Y. 2012. Review of the application of garlic, Allium sativum, in
aquaculture. Journal of the World Aquaculture Society 43: 447-458.
Li CC, Chen JC. 2008. The immune response of white shrimp Litopenaeus vannamei
and its susceptibility to Vibrio alginolyticus under low and high pH stress. Fish &
Shellfish Immunology 25: 701-709.
Page 87
63
Li M, Yan YX, Yu QT, Deng Y, Wu DT, Wang Y, Zhao J. 2017. Comparison of
immunomodulatory effects of fresh garlic and black garlic polysaccharides on RAW
264.7 Macrophages. Journal of Food Science 82: 765-771.
Liu HG, Xu LH. 2007. Garlic oil prevents tributylin-induced oxidative damage in vivo
and in vitro. Journal of Food Protection 70: 716-721.
Ma L, Peng X, Li D. 2015. Effect of dietary medicinal herb compound additives on
nutrition composition and texture profile of Amur sturgeon (Acipenser schrenckii).
Journal of Huazhong Agricultural University 34(3): 111-6.
Maan AA, Nazir A, Khan MK I, Ahmad T, Zia R, Murid M, Abrar M. 2018. The
therapeutic properties and applications of aloe vera: a review. Journal of Herbal
Medicine 12: 1-10.
Mabrouk HA. 2011. Response of Nile tilapia (Oreochromis niloticus) fingerlings to
different replacement levels of fishmeal with soybean meal using garlic and onion.
Available at http://en.engormix.com/MAaquaculture/articles/garliconion-on-growth-
oftilapia-t2108/p0. htm. [Accessed 20 March 2017].
Macpherson LJ, Geierstanger BH, Viswanath V, Bandell M, Eid SR, Hwang S,
Patapoutian A. 2005. The pungency of garlic: activation of TRPA1 and TRPV1 in
response to allicin. Current Biology 15: 929-934.
Mahdavi M, Hajimoradloo A, Ghorbani R. 2013. Effect of Aloe vera extract on growth
parameters of common carp (Cyprinus carpio). World Journal of Medical Sciences
9: 55-60.
Manaf SR, Daud HM, Alimon AR, Mustapha NM, Hamdan RH, Muniand KG, Hamid
NH. 2016. The effects of Vitex trifolia, Strobilanthes crispus and Aloe vera herbal-
mixed dietary supplementation on growth performance and disease resistance in red
Page 88
64
hybrid tilapia (Oreochromis sp.). Journal of Aquaculture Research & Development
7: 2.
Martins N, Petropoulos S, Ferreira IC. 2016. Chemical composition and bioactive
compounds of garlic (Allium sativum L.) as affected by pre-and post-harvest
conditions: A review. Food Chemistry 211: 41-50.
Matsuura H. 2001. Saponins in garlic as modifiers of the risk of cardiovascular
disease. The Journal of Nutrition 131: 1000S-1005S.
Mckenzie DJ, Höglund E, Dupont-prinet A, Larsen BK, Skov PV, Pedersen PB,
Jokumsen A. 2012. Effects of stocking density and sustained aerobic exercise on
growth , energetics and welfare of rainbow trout. Aquaculture 341: 216-222.
Mehrabi Z, Firouzbakhsh F, Rahimi-Mianji G, Paknejad H. 2019. Immunostimulatory
effect of Aloe vera (Aloe barbadensis) on non-specific immune response, immune
gene expression, and experimental challenge with Saprolegnia parasitica in rainbow
trout (Oncorhynchus mykiss). Aquaculture 503: 330-338.
Militz TA, Southgate PC, Carton AG, Hutson KS. 2013. Dietary supplementation of
garlic (Allium sativum) to prevent monogenean infection in aquaculture. Aquaculture
408: 95-99.
Militz TA, Southgate PC, Carton AG, Hutson KS. 2014. Efficacy of garlic (Allium
sativum) extract applied as a therapeutic immersion treatment for Neobenedenia sp.
management in aquaculture. Journal of Fish Diseases 37: 451-461.
Millet CO, Lloyd D, Williams C, Williams D, Evans G, Saunders RA, Cable J. 2011.
Effect of garlic and allium-derived products on the growth and metabolism of
Spironucleus vortens. Experimental Parasitology 127: 490-499.
Page 89
65
Mirelman D, Monheit D, Varon S. 1987. Inhibition of growth of Entamoeba histolytica
by allicin, the active principle of garlic extract (Allium sativum). Journal of
Infectious Diseases 156: 243-244.
Misra CK, Das BK, Mukherjee SC, Meher PK. 2006. The immunomodulatory effects of
tuftsin on the non-specific immune system of Indian Major carp, Labeo rohita. Fish
& Shellfish Immunology 20: 728-738.
Mousa KM, Khodeir IA, El-Dakhakhni TN, Youssef AE. 2013. Effect of garlic and
eucalyptus oils in comparison to organophosphate insecticides against some
piercing-sucking faba bean insect pests and natural enemies populations. Egyptian
Academic Journal of Biological Sciences 5: 21-27.
Müller-Lissner SA. 1993. Adverse effects of laxatives: fact and fiction. Pharmacology
47: 138-145.
Naeiji N, Shahsavani D, Baghshani H. 2013. Effect of dietary garlic supplementation on
lipid peroxidation and protein oxidation biomarkers of tissues as well as some serum
biochemical parameters in common carp Cyprinus carpio. Fisheries Science 79:
699-705.
Nandhini JS, Preetha S, Devi RG. 2018. Effect of garlic on blood pressure in
hypertensive patients. Drug Invention Today 10: 2267-2269.
Ndubuisi CU, Chimezie JA, Chinedu CU, Chikwem CI, Alexander U. 2015. Effect of
pH on the growth performance and survival rate of Clarias gariepinus
fry. International Journal of Research in Biosciences 4: 14-20.
Ng'ambi JW, Li R, Mu C, Song W, Liu L, Wang C. 2016. Dietary administration of
saponin stimulates growth of the swimming crab Portunus trituberculatus and
Page 90
66
enhances its resistance against Vibrio alginolyticus infection. Fish & Shellfish
Immunology 59: 305-311.
Ni Y, Turner D, Yates KM, Tizard I. 2004. Isolation and characterization of structural
components of Aloe vera L. leaf pulp. International Immunopharmacology 4: 1745-
1755.
Nya EJ, Austin B. 2009. Use of garlic, Allium sativum, to control Aeromonas hydrophila
infection in rainbow trout, Oncorhynchus mykiss (Walbaum). Journal of Fish
Diseases 32: 963-970.
Nya EJ, Austin B. 2011. Development of immunity in rainbow trout (Oncorhynchus
mykiss, Walbaum) to Aeromonas hydrophila after the dietary application of
garlic. Fish & Shellfish Immunology 30: 845-850.
Nya EJ, Dawood Z, Austin B. 2010. The garlic component, allicin, prevents disease
caused by Aeromonas hydrophila in rainbow trout, Oncorhynchus mykiss
(Walbaum). Journal of Fish Diseases 33: 293-300.
Nya EJ, Dawood Z, Austin B. 2010. The garlic component, allicin, prevents disease
caused by Aeromonas hydrophila in rainbow trout, Oncorhynchus mykiss
(Walbaum). Journal of Fish Diseases 33: 293-300.
Olusola SE, Emikpe BO, Olaifa FE. 2013. The potentials of medicinal plant extracts as
bio-antimicrobials in aquaculture. International Journal Medicinal Aromatics Plants
3: 404-412.
Onomu AJ. 2019. Growth and haematological response of Clarias gariepinus to garlic
(Allium sativum) supplemented diet. Sustainable Agriculture Research 8: 67-73.
Page 91
67
Palanisamy P, Sasikala G, Mallikaraj D, Bhuvaneshwari N, Natarajan GM. 2011.
Haematological changes of fresh water food fish, Channa striata on exposure to
Cleistanthus collinus suicidal plant extract. Research Journal of Pharmaceutical,
Biological and Chemical Sciences 2: 812-816.
Palermo FA, Cocci P, Angeletti M, Felici A, Polzonetti-Magni AM, Mosconi G. 2013.
Dietary Aloe vera components’ effects on cholesterol lowering and estrogenic
responses in juvenile goldfish, Carassius auratus. Fish Physiology & Biochemistry
39: 851-861.
Pan S, Wu S. 2014. Cellulase-assisted extraction and antioxidant activity of the
polysaccharides from garlic. Carbohydrate Polymers 111: 606-609.
Platel K, Srinivasan K. 2004. Digestive stimulant action of spices: a myth or
reality? Indian Journal of Medical Research 119: 167.
Pu H, Li X, Du Q, Cui H, Xu Y. 2017. Research progress in the application of Chinese
herbal medicines in aquaculture: a review. Engineering 3: 731-737.
Radha MH, Laxmipriya NP. 2015. Evaluation of biological properties and clinical
effectiveness of Aloe vera: A systematic review. Journal of Tradition and
Complementary Medicine 5: 21-26.
Rahimifard M, Navaei-Nigjeh M, Mahroui N, Mirzaei S, Siahpoosh Z. 2014.
Improvement in the function of isolated rat pancreatic islets through reduction of
oxidative stress using traditional Iranian medicine. Cell Journal (Yakhteh) 16: 147.
Rahman MS. 2007. Allicin and other functional active components in garlic: Health
benefits and bioavailability. International Journal of Food Properties 10: 245 –268.
Reiter J, Levina N, van der Linden M, Gruhlke M, Martin C, Slusarenko A. 2017.
Diallylthiosulfinate (allicin), a volatile antimicrobial from garlic (Allium sativum),
Page 92
68
kills human lung pathogenic bacteria, including MDR strains, as a
vapor. Molecules 22: 1711.
Reverter M, Bontemps N, Lecchini D, Banaigs B, Sasal P. 2014. Use of plant extracts in
fi sh aquaculture as an alternative to chemotherapy : Current status and future
perspectives. Aquaculture 433: 50-61.
Reynolds T, Dweck AC. 1999. Aloe vera leaf gel: a review update. Journal of
Ethnopharmacology 68: 3-37.
Rufchaei R, Hoseinifar SH, Mirzajani A, Van Doan H. 2017. Dietary administration of
Pontogammarus maeoticus extract affects immune responses, stress resistance, feed
intake and growth performance of caspian roach (Rutilus caspicus) fingerlings. Fish
& Shellfish Immunology 63: 196-200.
Saghaei A, Ghotbeddin N, Ghatrami ER. 2015. Evaluation of growth performance and
body composition of Oscar fish (Astronotus ocellatus) in response to the
consumption of dietary intake of garlic (Allium sativum). Aquaculture, Aquarium,
Conservation & Legislation 8: 485-490.
Saha M, Bandyopadhyay PK. 2017. Phytochemical screening for identification of
bioactive compound and antiprotozoan activity of fresh garlic bulb over trichodinid
ciliates affecting ornamental goldfish. Aquaculture 473: 181-190.
Sahu S, Das BK, Mishra BK, Pradhan J, Sarangi N. 2007. Effect of Allium sativum on
the immunity and survival of Labeo rohita infected with Aeromonas
hydrophila. Journal of Applied Ichthyology 23: 80-86.
Saleh NE, Michael FR, Toutou MM. 2015. Evaluation of garlic and onion powder as
phyto-additives in the diet of sea bass (Dicentrarcus labrax). The Egyptian Journal
of Aquatic Research 41: 211-217.
Page 93
69
Salman H, Bergman M, Bessler H, Punsky I, Djaldetti M. 1999. Effect of a garlic
derivative (alliin) on peripheral blood cell immune responses. International Journal
Immunopharmacology 21: 589-597.
Santhosha SG, Jamuna P, Prabhavathi SN. 2013. Bioactive components of garlic and
their physiological role in health maintenance: A review. Food Bioscience 3: 59-74.
Schelkle B, Snellgrove D, Cable J. 2013. In vitro and in vivo efficacy of garlic
compounds against Gyrodactylus turnbulli infecting the guppy (Poecilia reticulata).
Veterinary Parasitology 198: 96-101.
Shakya SR, Labh SN. 2014. Medicinal uses of garlic (Allium sativum) improves fish
health and acts as an immunostimulants in aquaculture. European Journal of
Biotechnology & Bioscience 2: 44-47.
Shalaby AM, Khattab YA, Abdel Rahman AM. 2006. Effects of garlic (Allium sativum)
and chloramphenicol on growth performance, physiological parameters and survival
of Nile tilapia (Oreochromis niloticus). Journal of Venomous Animals and Toxins
including Tropical Diseases 12: 172-201.
Sharif RM, Haghighi M, Bazari MS. 2017. Study on nanoparticles of Aloe vera extract
on growth performance, survival rate and body composition in Siberian sturgeon
(Acipenser baerii). Iranian Journal of Fisheries Sciences 16: 457-468.
Siwicki AK, Anderson DP, Rumsey GL. 1994. Dietary intake of immunostimulants by
rainbow trout affects non-specific immunity and protection against
furunculosis. Veterinary Immunology & Immunopathology 41: 125-139.
Sohn KS, Kim MK, Kim JD, Han IK. 2000. The role of immunostimulants in
monogastric animal and fish-review. Asian-Australasian Journal of Animal Sciences 13:
1178-1187.
Page 94
70
Soltanizadeh N, Mousavinejad MS. 2015. The effects of Aloe vera (Aloe barbadensis)
coating on the quality of shrimp during cold storage. Journal of Food Science &
Technology 52: 6647-6654.
Soosean C, Marimuthu K, Sudhakaran S, Xavier R. 2010. Effects of mangosteen
(Garcinia mangostana L.) extracts as a feed additive on growth and haematological
parameters of African catfish (Clarias gariepinus) fingerlings. European Review for
Medicinal Pharmacological Sciences 14: 605-611.
Srivastava A, Nigam AK, Mittal S, Mittal AK. 2018. Role of aloin in the modulation of
certain immune parameters in skin mucus of an Indian major carp, Labeo rohita.
Fish & Shellfish Immunology 73: 252-261.
Tai-Nin Chow J, Williamson DA, Yates KM, Goux WJ. 2005. Chemical
characterization of the immunomodulating polysaccharide of Aloe vera L.
Carbohydrate Research 340: 1131-1142.
Taiwo VO, Olukunle OA, Ozor IC, Oyejobi AT. 2005. Consumption of aqueous extract
of raw Aloe vera leaves: histopathological and biochemical studies in rat and
tilapia. African Journal of Biomedical Research 8: 169-178.
Talpur AD, Ikhwanuddin M. 2012. Dietary effects of garlic (Allium sativum) on
haemato-immunological parameters, survival, growth, and disease resistance against
Vibrio harveyi infection in Asian sea bass, Lates calcarifer (Bloch). Aquaculture
364: 6-12.
Tarameshloo M, Norouzian M, Zarein-Dolab S, Dadpay M, Mohsenifar J, Gazor R.
2012. Aloe vera gel and thyroid hormone cream may improve wound healing in
Wistar rats. Anatomy & Cell Biology 45: 170 -177.
Page 95
71
Thanikachalam K, Kasi M, Rathinam X. 2010. Effect of garlic peel on growth,
haematological parameters and disease resistance against Aeromonas hydrophila in
African catfish Clarias gariepinus (Bloch) fingerlings. Asian Pacific Journal of
Tropical Medicine 3: 614-618.
Thorne PS. 2006. Environmental health impacts of concentrated animal feeding
operations: anticipating hazards—searching for solutions. Environmental Health
Perspectives 115: 296-297.
Tremaroli V, Backhed F. 2012. Functional interactions between the gut microbiota and
host metabolism. Nature 489: 242-249.
Uribe C, Folch H, Enríquez R, Moran G. 2011. Innate and adaptive immunity in teleost
fish: a review. Veterinarni Medicina 56: 486-503.
Urrechaga E, Izquierdo S, Escanero JF. 2014. Looking back to our roots: 80 years of
wintrobe’s indices. European Medical Journal, Hematology 1: 133-7.
Van Rijn JA. Reina RD. 2010. Distribution of leukocytes as indicators of stress in the
Australian swellshark, Cephaloscyllium laticeps. Fish & Shellfish Immunology 29:
534-538.
Wu JH, Xu C, Shan CY, Tan RX. 2006. Antioxidant properties and PC12 cell protective
effects of APS-1, a polysaccharide from Aloe vera var. chinensis. Life Sciences 78:
622-630.
Xiang X, Liu CZ. 2002. Effect of allicin on growth of Colossoma barchypomum.
Fisheries Science & Technology Information 29: 222-225.
Xie J, Liu B, Zhou Q, Su Y, He Y, Pan L, Xu P. 2008. Effects of anthraquinone extract
from rhubarb Rheum officinale Bail on the crowding stress response and growth of
common carp Cyprinus carpio var. Jian. Aquaculture 281: 5-11.
Page 96
72
Yang F, Zuo XW, Zhang YH, Liang J, Li KW, Liu JL, Zhang GF. 2010. The effects of
garlic extract on early growth and development of Manila clam Ruditapes
philippinarum. Acta Ecologica Sinica 30: 989-994.
Yılmaz S, Ergün S. 2012. Effects of garlic and ginger oils on hematological and
biochemical variables of sea bass Dicentrarchus labrax. Journal of Aquatic Animal
Health 24: 219-224.
Yu Y, Shen M, Song Q, Xie J. 2018. Biological activities and pharmaceutical
applications of polysaccharide from natural resources: A review. Carbohydrate
Polymer 183: 91-101.
Zaefarian A, Yeganeh S, Adhami B. 2017. Dietary effects of garlic powder (Allium
sativum) on growth, blood indices, carcass composition, and lysozyme activity in
brown trout (Salmo caspius) and resistance against Yersinia ruckeri
infection. Aquaculture International 25: 1987-1996.
Zahran E, Risha E, AbdelHamid F, Mahgoub HA, Ibrahim T. 2014. Effects of dietary
Astragalus polysaccharides (APS) on growth performance, immunological
parameters, digestive enzymes, and intestinal morphology of Nile tilapia
(Oreochromis niloticus). Fish & Shellfish Immunology 38: 149-157.
Zanuzzo FS, Biller-Takahashi JD, Urbinati EC. 2012. Effect of Aloe vera extract on the
improvement of the respiratory activity of leukocytes of matrinxa during the
transport stress. Revista Brasileira de Zootecnia 41: 2299-2302.
Zanuzzo FS, Sabioni RE, Montoya NF, Favero G, Urbinati EC. 2017. Aloe
vera enhances the innate immune response of pacu (Piaractus mesopotamicus) after
transport stress and combined heat killed Aeromonas hydrophila infection. Fish &
Shellfish Immunology 65: 198-205.
Page 97
73
Zanuzzo FS, Urbinati EC, Rise ML, Hall JR, Nash GW, Gamperl AK. 2015a.
Aeromonas salmonicida induced immune gene expression in Aloe vera fed steelhead
trout, Oncorhynchus mykiss (Walbaum). Aquaculture 435: 1-9.
Zanuzzo FS, Urbinati EC, Nash GW, Gamperl AK. 2015b. Steelhead trout
Oncorhynchus mykiss metabolic rate is affected by dietary Aloe vera inclusion but
not by mounting an immune response against formalin‐killed Aeromonas
salmonicida. Journal of Fish Biology 87: 43-53.
Zhang P, Zhang X, Li J, Gao T. 2010. Effect of refeeding on the growth and digestive
enzyme activities of Fenneropenaeus chinensis juveniles exposed to different
periods of food deprivation. Aquaculture Internation 18: 1191-1203.
Page 98
74
CHAPTER THREE: EFFECT OF DIETARY ALOE VERA CRUDE
POLYSACCHARIDES SUPPLEMENTATION ON GROWTH
PERFORMANCE, FEED UTILIZATION, HAEMATO-
BIOCHEMICAL PARAMETERS, AND SURVIVAL AT LOW PH IN
AFRICAN CATFISH (CLARIAS GARIEPINUS) FINGERLINGS
Abstract
This chapter evaluated the effects of dietary Aloe vera crude polysaccharides on growth
performance, feed utilization, haemato-biochemical parameters and resistance against
low water pH in African catfish (Clarias gariepinus) fingerlings. Fish (initial weight, 3.1
0.02 g) were divided into five triplicate groups before being fed feeds supplemented
with 0% (control), 0.5%, 1.0%, 2.0% and 4.0% A. vera for 60 d. Fish fed 1.0% A. vera
had a significant increase in all growth parameters compared to unsupplemented ones (P
< 0.05). Among dietary groups, a significantly lower feed conversion ratio was
presented in fish fed 1.0% (1.34 0.22) compared to those fed 4.0% A. vera
supplemented diet (1.99 0.278) (P < 0.05). The protein efficiency ratio was
significantly higher in fish fed 1.0% A. vera supplemented diet (1.31 0.21) compared
to unsupplemented fish (0.85 0.10) and those fed 4.0% A. vera supplemented diet
(0.85 0.14) (P < 0.05). The optimal dietary A. vera polysaccharide crude extract
requirement was estimated to be 1.79% (y = -2.778x2 + 9.95x + 29.29, P = 0.037), and
1.77% A. vera (y = -0.04x2 +0.15x + 0.593, P = 0.045), for weight gain and feed
efficiency ratio, respectively. Overall, A. vera extracts improved haemato-biochemical
indices when compared to unsupplemented fish, and decreased some of the indices at the
highest dietary inclusion level (4%). Fish fed 1.0%, and 2% A. vera supplemented fish
showed a higher survival probability (above 70%) throughout the low water pH
challenge (5.2 - 5.5) period than the control diet (below 70%), and those fed 4% A. vera
supplemented diet (below 60%). Thus, A. vera polysaccharides are recommended to be
used as feed supplements in C. gariepinus fingerlings culture.
Page 99
75
Keywords: Aquaculture, Claria gariepinus, Herbs, Immunostimulants, Stress
resistance.
Page 100
76
3.1 Introduction
Studies on medicinal herbal extracts studies have become popular, but still novel in
aquaculture and other farming sectors such as livestock and poultry, amongst others. The
main purpose of these studies was usually to reduce and/or eliminate the application of
synthetic chemotherapeutic drugs such as antibiotics that are normally used in intensive
aquaculture production systems to maintain health of farmed fish, as these drugs are
believed to be unsustainable (Reverter et al. 2014; Bulfon et al. 2015; Gabriel et al.
2015a). The application of synthetic chemicals has created substantial problems such as
the development of drug resistance (Seyfried et al. 2010; Gullberg et al. 2011), toxic
effects on fish, environmental pollution, and negative impacts on human health (Cabello
2006; Lim et al. 2013). Thus, their application in aquaculture is not encouraged.
Medicinal herbal extracts are potential alternatives to synthetic drugs in aquaculture as
they provide useful biologically active metabolites with various benefits such as immune
system modulation (Zanuzzo et al. 2015a; Yang et al. 2015), growth promotion,
antioxidation enhancement, antidepressant, digestion enhancement, and appetite
stimulating effects, amongst others (Abdel-Tawwab et al. 2010; Citarasu 2010; Zahra et
al. 2014), when properly administered. Medicinal herbal extracts are also more easily
available, less expensive, and tend to be more biodegradable in nature compared to
synthetic drugs (Olusola et al. 2013; Reverter et al. 2014). In aquaculture, herbs could be
used as a whole or in part (i.e. leaves, flowers, roots, seeds or barks) in a crude form or
as extracts. The wider variety of medicinal herbs may justify their broad-spectrum
medicinal properties that may act against a wide range of pathogens (Harikrishnan et al.
2011). Crude extracts from Camellia sinensis (Abdel-Tawwab et al. 2010) Carum carvi
Page 101
77
(Ahmad and Abdel-Tawwab 2011), Cinnamomum camphora, Euphora hirta,
Azadirachta indica, and Carica papaya (Kareem et al. 2016), Cynodon daetylon, Aegle
marmelos, Withania somnifera and Zingber officinale (Immanuel et al. 2009) improved
growth performance of Oreochromis niloticus juveniles when they were administered
through diets. Similar findings were reported for Clarias gariepinus when they were fed
diets supplemented with Allium sativum peels (Thanikachalam et al. 2010) and or
Agaricus bisporus (Harikrishna et al. 2018), respectively. Thus, medicinal herbal
extracts certainly have the potential to replace synthetic pharmaceutical drugs, which are
used as growth promoters and immunostimulants in aquaculture.
Aloe vera is one of the many Aloe species that has been acclaimed to manage several
health conditions in humans (Abdullah et al. 2003), and in some domesticated animals
such as chickens (Akhtar et al. 2012), dogs (Altug et al. 2010), and cats (Harris et al.
1991). In humans, A. vera has been used directly or as extracts to cure ailments such as
cuts, minor burns, eczema, inflammation (Arunkumar and Muthuselvam 2009),
constipation, gastrointestinal disorders and immune system deficiency (Boudreau and
Beland 2006). Several health benefits associated with A. vera have been attributed to the
polysaccharides contained in the gel of the leaves (Hamman 2008). Other beneficial A.
vera phytoconstituents include glycoprotein, amino acids, anthraquinones, antioxidants
compounds, and vitamins A, E, and B12 (López-Cervantes et al. 2018). Besides
extensive research on A. vera composition and its application in humans, little
information exists regarding its application in aquaculture. The existing information has
indicated that A. vera could be used as a feed supplement in aquaculture for various
reasons. For instance, Mahdavi et al. (2013) reported that adding ethanolic A. vera
Page 102
78
powder at 0.5% /kg dietary inclusion level enhanced the growth performances of the
common carp, Cyprinus carpio. Gabriel et al. (2015a) reported the same in GIFT-tilapia
strain, O. niloticus after being fed A. vera crude extracts. In addition, improved innate
immune response after dietary A. vera supplementation was reported in matrinx, Brycon
amazonicus (Zanuzzo et al. 2015b) and whiteleg shrimp, Litopenaeus vannamei
(Trejaflores et al. 2016), and pacu, Piaractus mesopotumicus (Zanuzzo et al. 2017)
(Tables 2.5, 2.6).
Given the potential benefits of A. vera extracts in aquaculture feeds, this study was
designed to investigate the effects of A. vera polysaccharide crude extracts on the
growth performance, feed utilization, some haemato-biochemical indices and survival at
low pH in African catfish, Clarias gariepinus fingerlings. This fish species was used as
a model in this experiment as it is one of most important aquaculture species in Namibia
and several other African countries.
3.2 Materials and methods
3.2.1 Experimental fish and management
The experiment was conducted at the University of Namibia’s Sam Nujoma Campus,
Sam Nujoma Marine and Coastal Resources Research Centre (SANUMARC) facilities
in a close aerated water system between February and April 2018. Three hundred
healthy African catfish fingerlings (mean body weight of 3.1 0.02 g) were obtained
from the Onavivi Inland Aquaculture Center (OIAC), Outapi, Namibia. The fish were
transported to the laboratory facilities in a fiberglass tank supplied with liquid
Page 103
79
oxygenated freshwater. Upon arrival at the research center, the fish were acclimated in a
rectangular brown plastic tank (740 L) supplied with 500 L of freshwater at a
temperature of 28.9 0.25 ℃ , a pH of 7.4 0.32, and dissolved oxygen (DO)
concentration of 4.92 0.19 mg/L (Eutech instruments, model PCD 650, part of thermo
fisher scientific, Singapore), and a 12 h light/ dark cycle was maintained. The fish were
acclimated to laboratory conditions for one week, and during this period, they were fed
with the control diet (Table 3.1) until apparent satiation thrice daily (09:00; 13:00;
17:00). To maintain good water quality, two-thirds of the water in the fish holding tank
was exchanged with de-chlorinated freshwater of similar temperature once during the
week of acclimation.
3.2.2 Experimental diets and growth trial
Five iso-nitrogenous (30.6% crude protein), iso-energetic (17.36 KJ/g diet), and iso-lipid
(4.39 g/kg) experimental diets were formulated to contain fishmeal (28.5 g/kg), cowpea
(22.5 g/kg), corn grain meal (8.4 g/kg), wheat flour (13.9 g/kg), pearl millet meal
(22.7%), vegetable oil (3.0%), and vitamin-mineral premixes (1.0%) for the control (diet
1, without A. vera polysaccharide extracts) (Table 3.1). This feed formula was adapted
from that of Onavivi aquaculture feed manufacturing plant. For the other groups, A. vera
crude polysaccharides dry powder (30%) was incorporated into the control feed at 0.5%
(diet 2), 1.0% (diet 3), 2.0%, (diet 4), 4.0% (diet 5) (Table 3.1). The A. vera crude
polysaccharides powder used for this experiment was a solvent extracted and lyophilized
commercial product purchased from Ningxia SangNutrition Biotech Inc., China. This
product consisted of acemannan, glucomannan, saponin, glycosides, galactan, mannose,
Page 104
80
aloin and emodin). The dry ingredients were mixed thoroughly with water for 30 min.
The resulting dough was pelleted with two mm die, dried at room temperature for two
days, and then stored in airtight plastic bags until use.
aVitamin premix (g or IU kg-premix); thiamine, 5; riboflavin, 5; niacin, 25; folic acid, retinol palmitate, 500,000 IU;1;
pyridoxine, 5; cyanocobalamin, 5; cholecalciferol; 50,000 IU; a-tocopherol, 2.5; menadione, 2; inositol, 25;
pantothenic acid, 10; ascorbic acid, 10; choline chloride, 100; biotin, 0.25. bMineral premix (g kg-1): KH2PO4, 502; MgSO4. 7H2O, 162; NaCl, 49.8; CaCO3, 336; Fe (II) gluconate, 10.9;
MnSO4.H2O, 3.12; ZnSO4. 7H2O, 4.67; CuSO4. 5H2O, 0.62; KI, 0.16; CoCl2. 6H2O, 0.08; ammonium molybdate,
0.06; NaSeO3, 0.02.
Table 3.1 Formulation and composition of the experimental diets (g/100 g dry
matter).
Ingredients
Dietary groups
1 2 3 4 5
Fish meal (60% CP) 28.50 28.50 28.50 28.50 28.50
Cow peas (25% CP) 22.50 22.50 22.50 22.50 22.50
Corn grain (10.2% CP) 8.40 8.40 8.40 8.40 8.40
Wheat flour (11.7% CP) 13.90 13.90 13.90 13.90 13.90
Pearl millet (12.5% CP) 22.70 22.70 22.70 22.70 22.70
Vegetable oil 3.00 3.00 3.00 3.00 3.00
Vitamin premixa 0.50 0.50 0.50 0.50 0.50
Mineral premixb 0.50 0.50 0.50 0.50 0.50
Total 100 .00 100.00 100 .00 100 .00 100.00
Aloe vera 0.00 0.50 1.0 0 2.00 4.00
Proximate composition (%)
Dry matter 91.67 91.69 91.69 91.71 91.73
Crude protein 30.60 30.41 30. 55 30. 58 30.49
Crude lipid 4.39 4.41 4.37 4.35 4.33
Ash 5.25 5.27 5.27 5.26 5.27
Gross energy (KJ/g diet) 17.36 17.38 17.40 17.39 17.40
Page 105
81
The use of experimental fish in the investigation was in accordance with the scientific
research protocols of University of Namibia (Windhoek, Namibia) and complied with all
relevant local and international animal welfare laws, guidelines and policies (see
Appendix D, for ethical clearance certificate). After acclimation, the experimental fish
(3.16 0.03 g) were randomly distributed into fifteen aquaria in five triplicated groups
at a stocking density of 20 fish /aquarium (0.18 m3, supplied with 150 L of dechlorinated
freshwater). A day after stocking, fish were hand fed with the experimental diets. Fish in
dietary group 1 were fed the control diet (0% A. vera 30% polysaccharide powder), and
others were fed A. vera supplemented diet (diet 2, 3, 4, and 5), three times daily (09:00;
13:00; 17:00) until apparent satiation for 60 d. Dietary A. vera inclusion levels used in
this study were adopted from Gabriel et al. (2015a), which however used a 100% A. vera
crude powder in the genetically improved farmed tilapia (GIFT)-strain O. niloticus.
During the feeding trial, a continuous aeration, a photoperiod of a 12-h light/dark cycle,
and water exchange (60%) twice a week were maintained. Levels of dissolved oxygen
(DO) concentration, and water temperature were recorded once a day, while pH and
ammonia nitrogen were recorded on a weekly basis (Eutech instruments, model PCD
650, Thermo Fisher Scientific, Singapore).
3.2.3 Evaluation of growth and feed utilization parameters
Growth performance indices were assessed in terms of weight gain (WG), final weight
(FW) (fish body weight after 60 d), absolute growth rate (AGR), specific growth rate
(SGR), condition factor (CF), hepatosomatic index (HSI), and viscerosomatic index
(VSI). Meanwhile, feed utilization indices were: feed intake (FI) (feed consumed after
60 d), feed conversion ratio (FCR), feed efficiency ratio (FER), and protein efficiency
Page 106
82
ratio (PER). Survival was expressed as percentage of the number of fish survived after
60 days of the feeding trial. After 60 d of feeding, 24h after the last feeding, body weight
and length of all the fish in each tank were measured. Liver weight and eviscerated
weights of three fish from each replicate were recorded after 60 d. For ethical reasons,
before these fish were sacrificed, they were anaesthetized with 100 mg MS-222, tricane
methane sulfonate, Biodynamic Pty, Ltd, Namibia. In addition to account for feed intake
and survival rate, the amount of feed consumed and the mortality in each replicate were
both recorded throughout the experimental period. Calculations were conducted using
the following formulae (NRC 1993):
(1) 𝑊𝐺 (𝑔) = 𝑊 − 𝑊1
(2) 𝑆𝐺𝑅 (% 𝑑𝑎𝑦−1) = (𝑊 )− (𝑊 ) x 100
(3) 𝐴𝐺𝑅 (𝑔𝑑𝑎𝑦−1) = 𝑊 −𝑊
(4) 𝐶𝐹 (𝑔𝑐𝑚− ) = 𝑊 x 100
(5) 𝐻𝑆𝐼 (%) = 𝑙𝑖 𝑒 𝑒𝑖𝑔ℎ𝑊
x 100
(6) 𝑉𝑆𝐼 (%) = 𝑖 𝑐𝑒 𝑎𝑙 𝑒𝑖𝑔ℎ𝑊
x 100
(7) 𝐹𝐶𝑅 = 𝐹𝐼𝑊𝐺
(8) 𝐹𝐸𝑅 = 𝑊𝐺𝐹𝐼
Page 107
83
(9) 𝑃𝐸𝑅 = 𝑊𝐺𝑐 𝑑𝑒 𝑒𝑖 𝑖 𝑎 𝑒 (𝑔)
(10) 𝑆𝑢𝑟𝑣𝑖𝑣𝑎𝑙 (%) = 𝑁 𝑚𝑏𝑒 𝑓 𝑖 𝑒𝑑 𝑓𝑖 ℎ 𝐼 𝑖 𝑖𝑎𝑙 𝑚𝑏𝑒 𝑓 𝑓𝑖 ℎ
x 100
Where, W2 = final body weight (g), W1= initial body weight (g), t = trial period (d), W =
body weight (g), WG = weight gain (g), and L= total body length (cm), FI = feed intake
(g).
3.2.4 Haematological-biochemical parameters
At the end of the experiment, 24 h after the last feeding, blood was collected from the
caudal vein of three anaesthetized (with 100 mg of tricaine methanesulfonate, MS-222)
randomly selected fish per aquarium with a 2.5 ml sterile hypodermic syringe and
carefully transferred into sterile EDTA heparinized 1.5 ml tubes at room temperature.
One part of each blood sample was investigated for red blood cell count per L (RBC),
white blood cell count per L (WBC), haematocrits volume (HCT) (L/L), red blood cell
distribution width (RDW) (fl/cell), mean platelet count (PLT) per L, lymphocytes per
litre (LYM), monocytes per litre (MON), mean corpuscular volume (L/cell) (MCV) and
granulocytes per litre (GRAN). All these were determined by Coulter principle using an
automatic blood cell analyzer (HESKA veterinary hematology analyzer, New Zealand).
Haemoglobin (HGB), mean corpuscular haemoglobin (fmol/cell) (MCH), and mean
corpuscular haemoglobin concentration (g/L) (MCHC) were assessed according to
Bouguer-Lambert-Beer law using the HESKA blood cell analyzer (He et al. 2015). The
samples were analysed immediately after collection. A part of each blood sample was
Page 108
84
centrifuged at 5000 rpm, 4 ℃ for 10 min and the collected serum was stored at -20℃ for
further biochemical analysis. Aspartate Aminotransferase (AST) (U/L), Alanine
Aminotransferase enzyme (ALT) (U/L), glucose (mmol/L) (Glu), total cholesterol
(mmol/L) (TCHO), and triglycerol (mmol/L) were quantified by colorimetric method
using Fuji DRI – Chem, auto analyser (FDC NX 5000v v2.3) with kits supplied by
DIAG Import and Export CC, South Africa. All the blood tests were carried out at
Swakopmund veterinary clinic laboratory, Namibia.
3.2.5 Proximate body composition analysis.
Three gutted fish were collected from each replicate and stored at -20 ℃ for proximate
composition analysis (moisture, crude protein, crude lipid, and ash). Moisture content
was determined by oven drying at 105℃, until constant weight and expressed as a
percentage:
(11) 𝑚𝑜𝑖𝑠𝑡𝑢𝑟𝑒 (%) = (𝑤𝑒𝑡 𝑤𝑒𝑖𝑔ℎ𝑡 − 𝑑𝑟𝑦 𝑤𝑒𝑖𝑔ℎ𝑡)/(𝑠𝑎𝑚𝑝𝑙𝑒 𝑤𝑒𝑖𝑔ℎ𝑡) 𝑥 100.
Crude protein (nitrogen x 6.25) determined by the Kjeldahl method (Kjeltec 8200, Foss
Analytic Co., Ltd., China) was expressed as a percentage. Crude lipid (%) was
determined by ether extraction system (Foss, Soxtec, 2043, Foss Scino, Co., Ltd) and
expressed as: % lipid = (weight of residue /weight of the sample taken x 100). Ash (%)
was determined by burning the dry samples at 560℃ for 5h.
3.2.6 In situ low pH challenge experiment
The optimum water pH for C. gariepinus range between 7 - 8, and deviation (low or
high pH) may be deadly to the fish, especially the younger ones (Ndubuisi et al. 2015).
Page 109
85
After the growth trial and blood sampling, the stocking density of each five triplicated
dietary groups was adjusted to 10 fish / aquarium (0.18m3, supplied with 50 L of
dechlorinated freshwater). They were then all exposed to low pH (pH 5.2 -5.5) for three
days (72 h). The water pH was adjusted by adding 4N HCl and 4N NaOH, and was
renewed daily, as demonstrated by Lin and Chen (2008). During this experiment pH,
temperature (28 1.5℃), DO (> 4 mg/L), and NH3-N (> 0.08 mg/L) were monitored
daily. Fish mortality was recorded at three 24 h intervals, to determine the survival (%).
3.2.7 Statistical analyses
Collected data were statistically analyzed statistics in SPSS software (version 21, IMB
Corp, Armonk, NY, USA). Normality and homogeneity of variance were confirmed
using Kolmogorov-Smirnov and Levene’s test, respectively. All recorded variables were
expressed as mean standard error. The mean values were further subjected to one-way
analysis of variance (ANOVA) to study the treatment effects at significant level of 95%
(P = 0.05). The second order polynomial regression model (y = b0 + b1x + b2x2, where, y
= maximum WG or FER, x = optimum inclusion level) (Zeitoun et al. 1976) was used
to estimate the optimum dietary A. vera polysaccharide extracts requirement in C.
gariepinus fingerlings. Significant differences between the group means were further
compared using Duncan’s Multiple Range Test (DMRT). The survival (%) of fish in
each low pH treatment group was estimated using Kaplan–Meier analysis (Jelkić et al.
2014); Breslow (generalized Wilcoxon), Tarone-ware, and log-rank (Mantel-cox) were
used to determine the significant difference in survival (P < 0.05) between groups at
each sampling interval of the pH challenge.
Page 110
86
3.3 Results
3.3.1 Growth performance and feed utilization parameters
Throughout the feeding trials, water temperatures ranged from 26 to 28 ℃, pH values
from 6.9 to 7.3, and DO concentration from 4.7 to 5.4 mg/L, and ammonia nitrogen
concentration was lower than 0.05 mg/L throughout. Among dietary A. vera groups, fish
fed 1.0% had the highest FW (42.48 6.47 g), WG (39.44 6.47 g), and AGR (0.66
0.11 g) compared to unsupplemented ones (FW = 28.57 3.09 g; WG = 25.52 3.09;
AGR = 0.43 0.05 g), and those fed 4.0% (P < 0.05) (Figure 3.1). These parameters
were intermediate in fish fed 0.5% (FW = 40.67 1.69 g; WG = 37.63 1.69 g; AGR =
0.62 0.03 g), and 2.0% A. vera polysaccharide supplemented diet (FW = 37.13 1.34
g; WG = 34.08 + 1.34 g; AGR = 0.57 0.02 g) (P > 0.05). SGR was significantly higher
in fish fed 1.0% (4.35 0.24%) and 0.5% A. vera supplemented feed (4.31 0.07%)
when compared to the control and those fed 4.0% A. vera supplemented diet (3.69
0.23%) (P < 0.05). An intermediate SGR (4.16 0.06%) response was observed in fish
fed 2.0% A. vera supplemented feed. Dietary A. vera polysaccharides did not affect
organo-somatic indices (HSI and VSI) or CF and survival rate (P > 0.05) (Table 3.2).
Dietary A. vera polysaccharides had no significant effect on fish FI when compared to
unsupplemented fish (P > 0.05), however a significantly lower FI was recorded in fish
fed 4.0% A. vera supplemented diet (48.11 0.28 g) compared to those fed 2.0% (53.85
1.85) (P < 0.05) (Figure 3.2A). Among dietary groups, a significantly lower FCR was
presented in fish fed 1.0% (1.34 0.22) compared to those fed 4.0% A. vera
supplemented feed (1.99 0.278) (P < 0.05); and the opposite trend was recorded for
Page 111
87
FER (figure 3.2C). Protein efficiency ratio was significantly higher in fish supplemented
with 1.0% A. vera supplemented feed (1.31 0.21) compared to the control and those
fed 4.0% A. vera supplemented feed (0.85 0.21) (P < 0.05). The optimum dietary A.
vera inclusion level (%) was estimated to be 1.79% (y = -2.78x2 + 9.95x, P = 0.035, R2
= 0.37), and 1.77 % A. vera (y = -0.043x2 + 0.152x, P = 0.045, R2 = 0.253) (Figures 3.1,
3.2).
Page 112
88
Figure 3.1 Final weight (FW) (A), weight gain (WG) (B), specific growth rate (SGR)
(C), and absolute growth rate (AGR) (D) of African catfish, C. gariepinus fingerlings
fed four A. vera crude polysaccharide extracts supplemented diets and an
unsupplemented diet (control) for 60 d. Different lower case letters denote a significant
difference (P < 0.05) among dietary groups; Values were expressed as mean standard
error; WG: y = -2.78x2 + 9.95x, P = 0.035, R2 = 0.37 (second order polynomial
regression model).
0
20
40
60
Dietary A. vera inclusion level (%/kg diet)
FW (g
) a
b
aba
ab
0
1
2
3
4
5
Dietary A. vera inclusion level (%/kg diet)
SGR
(%/d
ay)
ab b
aba
0
10
20
30
40
50
Dietary A. vera inclusion level (%/kg diet)
WG
(g) a
abb
aba
0.5 % Control
1.0%
2.0% 4.0%
0.0
0.2
0.4
0.6
0.8
1.0
Dietary A. vera inclusion level (%/kg diet)
AGR
(g/d
ay)
a
abb
aab
A B
C D
Dietary A. vera inclusion level (%) Dietary A. vera inclusion level (%)
Dietary A. vera inclusion level (%) Dietary A. vera inclusion level (%)
Page 113
89
Dietary A. vera inclusion level (%)
Parameters Control 0.5 1.0 2.0 4.0
VSI 7.46 0.75a 8.68 2.86a 6.57 0.54a 5.64 0.22a 8.33 2.75a
HSI 1.71 0.01a 1.50 0.05a 1.59 0.19a 1.45 0.16a 1.55 0.16a
CF 0.68 0.00a 0.69 0.03a 0.73 0.17a 0.70 0.01a 0.70 0.01a
Survival 88.33 4.41a 90.00 2.89a 90.00 2.89a 93.33 1.67a 85.00 2.87a
Data are expressed as mean ± standard error (M ± SE). Values with different superscript letters in the same row are not significantly different (P > 0.05) from the control. Where VSI = viscerosomatic index, HSI = hepatosomatic index, and CF = condition factor.
Table 3.2 Organo-somatic indices, condition factor, and survival (%) of the African
catfish, C. gariepinus fingerlings fed four A. vera crude polysaccharide extracts
supplemented diets and a control for 60 d.
Page 114
90
Figure 3.2 Feed intake (FI) (A), feed conversion ratio (FCR) (B), feed efficiency ratio
(FER) (C), and protein efficiency ratio (PER) (D) of the African catfish, C. gariepinus
fingerlings fed four A. vera crude polysaccharide extracts supplemented diets and an
unsupplemented diet (control) for 60 d. Different lower case letters denote a significant
difference (P < 0.05) among dietary groups; Values were expressed as mean standard
error; FER: y = -0.043x2 + 0.152x, P = 0.045, R2 = 0.253 (second order polynomial
regression model).
3.3.2 Haemato-biochemical parameters
Dietary A. vera polysaccharides had significant effects on some haematological
parameters of African catfish fingerlings when compared to the unsupplemented ones (P
< 0.05) (Figure 3.3, 3.4, 3.5, and 3.6). No significant differences in RBC counts (1012/L)
0.0
0.5
1.0
1.5
2.0
2.5
Dietary A. vera inclusion level (%/kg diet)
FCR
ab
ab a ab
b Control0.5 % 1.0%
2.0% 4.0%
0.0
0.2
0.4
0.6
0.8
1.0
Dietary A. vera inclusion level (%/kg diet)
FER
0
20
40
60
Dietary A. vera inclusion level (%/kg diet)
FI (g
)ab
abab
ba
0.0
0.5
1.0
1.5
2.0
Dietary A. vera inclusion level (%/kg diet)
PER a
abb
aba
C
B
D
A
Dietary A. vera inclusion level (%) Dietary A. vera inclusion level (%)
Dietary A. vera inclusion level (%) Dietary A. vera inclusion level (%)
Page 115
91
(Figure 3.3A), HCT (L/L) (Figure 3.3B), and HGB levels (g/L) (Figure 3.3C) were
observed between all dietary groups (P > 0.05). Platelet counts (109/L) (Figure 3.4D) in
fish fed 4.0% A. vera supplemented diet (12.17 2.08) decreased significantly among
dietary groups (P < 0.05).
Figure 3.3 Red blood cell counts (RBC) (A), hematocrit levels (B), Hemoglobin
concentration (C), and platelet counts (PLT) (D) of African catfish, C. gariepinus
fingerlings fed four A. vera crude polysaccharide extracts supplemented diets and
unsupplemented diet (control) for 60 d. Different lower case letters denote a significant
0.0
0.5
1.0
1.5
2.0
2.5
Dietary A. vera inclusion level (%/kg diet)
RBC
(1012
/L)
abb b
aba
0
50
100
150
200
Dietary A. vera inclusion level (%/kg diet)
Hem
oglo
bin
(g/L
)
abab b
aba
0.0
0.1
0.2
0.3
0.4
Dietary A. vera inclusion level (%/kg diet)
Hem
atoc
rits
(L/L
)
Control0.5 % 1.0%
2.0% 4.0%
abb b
aba
0
5
10
15
20
25
Dietary A. vera inclusion level (%/kg diet)
PLT
(109 /L
)
abab
ba
c
A B
C D
Dietary A. vera inclusion level (%) Dietary A. vera inclusion level (%)
Dietary A. vera inclusion level (%) Dietary A. vera inclusion level (%)
Page 116
92
difference among dietary groups (P < 0.05); Values were expressed as mean standard
error.
Mean corpuscular volume (L/cell) (Figure 3.4A) and mean corpuscular hemoglobin per
cell (Figure 3.4B) showed no significant differences between feeding groups (P > 0.05)
(Figure 3.4). Mean corpuscular hemoglobin concentration was the same for the control,
0.5%, 1% and 2%, but decreased significantly in fish fed 4.0% A. vera supplemented
diet (121.50 3.46) when compared to those fed the control diet, 0.5% (131.55 1.14)
and 1.0% A. vera supplemented diet (131.08 3.77) (P < 0.05) (Figure 3.4C). Fish fed
4.0% (84.40 1.74) and 2.0% A. vera supplemented diet (85.20 3.99) had
significantly lower red blood cell distribution width compared to the control (97.92
4.44) (P < 0.05) (Figure 3.4D).
White blood cell counts (Figure 3.5A), lymphocyte counts (Figure 3.5B) and monocyte
counts (Figure 3.5C) all showed no significant differences dietary groups (P > 0.05). A
significant decrease in granulocyte counts (109/L) was only observed in fish fed 4.0% A.
vera supplemented diet (0.93 0.37) when compared to the unsupplemented ones (2.48
0.47) (P < 0.05) (Figure 3.5D).
Page 117
93
Figure 3.4 Mean corpuscular volume (MCV) (A), mean corpuscular hemoglobin
(MCH) (B), mean corpuscular hemoglobin concentration (MCHC) (C), and red blood
cell distribution width (RDWa) (D) of African catfish, C. gariepinus fingerlings fed four
A. vera crude polysaccharide extracts supplemented diets and an unsupplemented diet
(control) for 60 d. Different lower case letters denote a significant difference among
dietary groups (P < 0.05); Values were expressed as mean standard error.
0
50
100
150
Dietary A. vera inclusion level (%/kg diet)
MC
V (L
/ cel
l)
0
200
400
600
Dietary A. vera inclusion level (%/kg diet)
MC
HC
(g/L
)
ab a ab bc c
0
20
40
60
80
Dietary A. vera inclusion level (%/kg diet)
MC
H (f
mol
/ cel
l)
Control0.5 % 1.0%
2.0% 4.0%
0
50
100
150
Dietary A. vera inclusion level (%/kg diet)
RD
Wa
(fl/ c
ell) b
ab ab a a
A B
C D
Dietary A. vera inclusion level (%) Dietary A. vera inclusion level (%)
Dietary A. vera inclusion level (%) Dietary A. vera inclusion level (%)
Page 118
94
Figure 3.5 White blood cell counts (WBC) (A), lymphocyte counts (B), monocyte
counts (C), granulocyte counts (D) of African catfish, C. gariepinus fed four A. vera
crude polysaccharide extracts supplemented diets and an unsupplemented diet (control)
for 60 d. Different lower case letters denote a significant difference among dietary
groups (P < 0.05); Values were expressed as mean standard error.
Dietary A. vera polysaccharides had significant effects on biochemical parameters (P <
0.05) (Figure 3.6). AST and ALT concentrations were significantly lower in fish fed
with 0.5% (AST = 140.17 4.09; ALT = 44. 83 5.52) and 1.0% A. vera supplemented
diets (AST = 176.83 23.94; ALT = 51.33 8.29) compared to the control (AST =
483.83 90.81; ALT = 90.00 20.42) and the 4% treatment group AST = 268.50
82.77; ALT = 110.67 16.21) (P < 0.05). No significant differences in glucose levels
Dietary A. vera inclusion level (%) Dietary A. vera inclusion level (%)
Dietary A. vera inclusion level (%) Dietary A. vera inclusion level (%)
Page 119
95
were observed in A. vera supplemented fish compared to the control (P > 0.05).
Similarly, TCHO and TG levels were not significantly different in supplemented fish
when compared to unsupplemented ones (P > 0.05).
Figure 3.6 Serum alanine aminotransferase enzyme concentration (ALT) (A), aspartate
aminotransferase concentration (AST) (B), glucose level (C), total cholesterol (TCHO)
(D), and triglycerol level (TG) (E) of African catfish, C. gariepinus fingerlings fed four
A. vera 30% polysaccharide crude extracts supplemented diets and an unsupplemented
diet (control) for 60 d. Different lower case letters denote a significant difference among
dietary groups (P < 0.05); Values were expressed as mean standard error.
ab
aa
abb
0
100
200
300
400
500
600
700
AST (
U/L)
Dietary A. vera inclusion level (%/ kg diet)
Control
0.50%
1.00%
2.00%
4.00%
A B
a
b
Dietary A. vera inclusion level (%) Dietary A. vera inclusion level (%)
Dietary A. vera inclusion level (%) Dietary A. vera inclusion level (%)
Dietary A. vera inclusion level (%)
Page 120
96
3.3.3 Proximate body composition
There was no significant difference in the protein, ash, and lipid content of fish among
dietary groups (P > 0.05) (Table 3.3).
Dietary A. vera inclusion level (%)
Parameters Control 0.5 1.0 2.0 4.0
Moisture (%) 71.36 0.30a 71.39 0.15a 70.68 0.59a 70.73 0.57a 72.83 0.17a
Protein (%) 73.13 2.59a 74.57 1.90a 74.55 1.45a 76.77 1.59a 74.97 1.210a
Lipid (%) 6.13 0.80a 6.05 0.53a 5.93 0.61a 5.89 0.36a 5.56 0.68a
Ash (%) 9.12 1.12a 8.63 1.23a 8.15 0.98a 9.30 1.10a 9.24 1.12a
Values (Mean ± Standard Error, M±SE) within the same row with the same superscripts letters are not significantly different (P > 0.05).
3.3.4 Low pH challenge experiment
Low water pH had a significant effect on fish survival at 24h, 48h, and 72 h post
challenge, based on Breslow (generalized Wilcoxon), Tarone-ware, and log rank
(Mantel-cox) tests (P < 0.05) (Figure 3.7). Fish fed 4.0% A. vera supplemented diet
(below 60%) followed by those fed a control diet (below 70%) had the lowest survival
probability throughout the challenge period. Meanwhile, 24-h and 48-h post challenge,
the highest survival probability was observed in fish fed 2.0% followed by those fed
1.0% and then those fed a 0.5% A. vera supplemented diet (above 70%). At 72-h post
Table 3.3 Whole body composition parameters of African catfish, C. gariepinus
fingerlings fed four A. vera 30% polysaccharide extracts supplemented diets and un-
supplemented diet for 60 d.
Page 121
97
challenge, a higher survival probability was observed in fish fed 1.0% followed by those
fed 2.0% and then 0.5% A. vera supplemented diet.
Figure 3.7 Kaplan-Meier: low pH challenge survival probability (after every 24 h for
72 h) of African catfish, C. gariepinus fingerlings fed four A. vera 30% polysaccharide
crude extracts supplemented diets and an unsupplemented diet (control) for 60 d.
3.4 Discussion
All growth performance indices (WG, SGR, FW, and AGR) and some feed utilization
parameters (FCR, and PER) of African catfish fingerlings were enhanced in A. vera
polysaccharides 1.0% enriched diets as compared to those fed the control diet, with
optimum inclusion level for fed utilization and growth performance estimated to be
between 1.77 and 1.79% A. vera. Similarly, a recent study reported that dietary A. vera
Page 122
98
leaf paste at 1.0% effectively improved growth performance and nutrient utilization of
cultured C. gariepinus fingerlings (Ibidunni et al. 2018). In addition, dietary A. vera
100% powder at an inclusion level between 0.5% and 2.0% was able to significantly
enhance growth and feed utilization performance in GIFT-O. niloticus strains (Gabriel et
al. 2015a). Similar performances were reported in Cyprinus carpio juveniles when fish
were fed diets supplemented with ethanolic A. vera extracts at 0.5% and 2.5% A. vera
(Mahdavi et al. 2013). Aloe vera gel extracts supplemented diets at an inclusion level as
lower as 0.1% could also effectively enhance growth performance in O. mykiss
(Heidarieh et al. 2013). Differences in dietary A. vera inclusion levels suitable for
growth and feed utilization between all the studies including the present study could be
due to different types of extracts (i.e. crude powder, gel, solvent extracted among
others), different fish species, and different rearing conditions. Hence, more studies with
well-defined constituents are required for standardization and better comparisons.
Dietary A. vera extracts have been reported to have no influence on the growth of some
fish. The inclusion levels of 0.1% and 1.0% A. vera that were concluded to have
increased growth in O. mykiss (Heidarieh et al. 2013), have been reported to have no
effect on growth of the same fish species (Farahi et al. 2012; Golestan et al. 2015). In
the present study, growth and feed utilization promoting effects diminished with
increased dietary A. vera inclusion level, which is consistent with a previous study
where 100% A. vera crude extract was used (Gabriel et al. 2015a), and also in studies
where other herbs such as Zingber officinale (Vahedi et al. 2017) and Foeniculum
vulgare (Sotoudeh and Yeganeh 2017) were used.
Page 123
99
Effects of A. vera extracts on the growth of C. gariepinus fingerlings may be attributed
to several factors; either A. vera nutritional factors present in the leaves or its anti-
nutritional factors such as complex polysaccharides and phenolic compounds (Hamman
2008; Radha and Laxmipriya, 2015). Growth-promoting effects of medicinal herbal
extracts in animals have been mainly attributed to polysaccharides (Chen et al. 2003;
Tremaroli and Backed 2012; Zahran et al. 2014). These compounds are known to act as
prebiotics that have the ability to sustain the homeostasis of the gut microbial
community as well as the host’s health (Tremaroli and Backed 2012), either by reducing
the bacterial and viral infection levels (Chen et al. 2003) or by directly affecting
pathogenic gut microflora (Sohn et al. 2000; Citarasu 2010; Yu et al. 2018). This as a
result improves feed digestibility and availability of nutrients from feed, and shortens the
feed transit time, which might have a beneficial influence on digestive enzymes (Platel
and Srinivasan 2004). It also minimizes the amount of feed substrate available for
proliferation of pathogenic bacteria (Citarasu 2010). Feed digestibility enhancement in
fish following herbal extract administration was supported by a previous study by
Gabriel et al. (2017), which reported that 100% A. vera extracts had significantly
increased amylase, trypsin and lipase activities in GIFT-tilapia. The same herb was also
reported to have improved the gastrointestinal morphology of O. mykiss by increasing
intestinal villi lengths and the intestinal surface area for increased feed digestion and
absorption capacity of the gut (Heidarieh et al. 2013). In the same line, dietary
Astragulus polysaccharides were also reported to increase amylase activity in O.
niloticus and this correlated with its growth promoting effects (Zahran et al. 2014). In
addition, Ji et al. (2009) has explained that, growth in fish fed dietary herbal extracts
could also be as a result of their ability to promote lipid metabolism, which spares
Page 124
100
proteins for growth, and leads to the repression of lipid accumulation. As a result, fish
muscle quality (high protein, and low lipid concentrations) would be improved (Lee and
Gao, 2012), as demonstrated in the current study.
In the present study, haematological parameters (i.e. RBC, HCT, HGB, MCV, MCH,
MCHC, RDW, WBC, lymphocytes and granulocytes) were higher in dietary A. vera
supplemented fish than in the control, and the optimum inclusion levels for
haematological parameters seemed to range between 0.5% and 2.0%. Poor
haematological immune indices were presented in fish fed 4.0% A. vera. This
corresponds with the results obtained by Iidunni et al. (2018), which revealed that
haematological parameters of C. gariepinus fingerlings were enhanced after being fed
1.0%, 2.0%, and 3.0% A. vera leaf paste for 12 weeks (84 days), respectively. One
hunded percent A. vera dietary supplementation was reported to enhance innate immune
parameters in GIFT-tilapia, O. niloticus especially after being stressed with
Streptococcus iniae pathogenic bacterium. Similar to the present study, inclusion levels
between 0.5% and 2.0% appeared to be effective, and fish supplemented with 4.0% A.
vera responded poorly, thus, classified as microcytic anaemic (Gabriel et al. 2015a). In
the study by Abdy et al. (2017), C. carpio were vaccinated with heat killed Aeromonas
hydrophila and in one group A. vera gel was used as adjuvant during this vaccination. In
a challenge experiment thereafter, a higher immune response was observed in fish which
were vaccinated with the A. vera adjuvant compared to the response in groups with no or
a different adjuvant.
Page 125
101
The sign of enhancement of haematological indices in fish following supplementation of
A. vera extracts in this study and in previous related studies may signify the ability of A.
vera to stimulate erythropoiesis, hence increase the oxygen carrying capacity and
strengthen the defense mechanism against physiological stress. The erythropoietin
effects of A. vera extracts in hemopoetic cells of bone marrow have been reported by Iji
et al. (2010). The assumption is that these effects could be due to vitamins such as beta
carotene, C, E, B12, riboflavin, thiamine, and folic acid, minerals (calcium, chromium,
copper, selenium, manganese, potassium, sodium, and zinc), essential and non-essential
amino acids present in A. vera that are essential for the synthesis of haemoglobin as
demonstrated by Kayode (2017). Erythropoiesis has also been attributed to
polysaccharides present in A. vera leaves (Ni et al. 2004).
The increased leukocyte counts presented in A. vera supplemented fish and high
resistance against low pH is an indication that this herb has the ability to stimulate
leucopoiesis (formation of WBC or leukocytes), thus strengthening the body’s ability to
fight against stressors. A number of studies have indicated that A. vera immuno-
modulating activities including stimulation of leukocyte formation could be accredited
to the presence of polysaccharides (Chow et al. 2005; Im et al. 2005), especially
acemannan (Hamman 2008). Some immuno-modulating effects were linked to lectins,
which are glycoproteins found in A. vera gel (Reynold and Dweck 1999). In addition to
innate immune response, A. vera extracts have been also reported to evoke specific
immune response in fish. For instance, Alishahi et al. (2010) reported that 0.5% dietary
A. vera increased serum bactericidal activity and IgM antibody levels in C. carpio
infected A. hydrophila. This is an indication that dietary supplementation of A. vera
Page 126
102
extract may improve the health status of the fish, and as a result, produce animals with
high resistance against stresses associated with culture conditions such as low water pH
as demonstrated in the present study.
Medicinal herbs have been reported to be harmful in fish and even deadly at high
dosages (Palanisamy et al. 2011). So far, anaemia (Gabriel et al. 2015a) and tissue
necrosis (Taiwo et al. 2005) are the only A. vera negative effects reported in fish
following dietary supplementation. However, spermatogenic dysfunction, decreased
central nervous system activity, and also reduced red blood cell counts was observed in
mice supplemented with A. vera extracts (Boudreau et al. 2013). Furthermore, the side
effects of herbal extracts such as anaemia in animals has been assumed to be a result of
their ability to disrupt erythropoiesis, haemosynthesis and osmoregulation functions or
to increase erythrocyte destruction in haematopoietic organs (Cope 2005). A. vera
adverse effects such as hematuria, metabolic acidosis, malabsorption (Mulle-Lissner
1993), and electrolyte disturbance in animals (Beuers 1991) have been reported long
ago. This may partly explain the poor haematological parameters observed in fish fed
4.0% A. vera /kg diet in the present study. Hence, an upper limit is crucial in enhancing
haematological indices as well as resistance against stressors in fish. In this study,
inclusion levels between 0.5% and 1.0% A. vera appeared to be optimal for all
parameters tested.
In addition to haematological indices, A. vera extracts have been reported to enhance a
wide range of enzyme activity in the blood serum in fish (Gabriel et al. 2015a; 2015b;
Zodape 2010), chicken (Ojiezeh and Ophori 2015; Fallah 2014), and mice (Cui et al.
Page 127
103
2014). Enzyme activity such as for AST and ALT aid in the diagnosis of liver disease
(Zopade 2010). One hundred percent A. vera crude powder were reported to protect
GIFT-tilapia, O. niloticus juveniles from liver damage against Streptococcus iniae
pathogenic bacterium and the optimum dosage was estimated to be less than or equal to
2.79% (Gabriel et al. 2015b). In the same line, the present study observed that ALT and
AST levels were lower in 0.5% and 1.0% A. vera supplemented fish compared to
unsupplemented ones. This is an indication that A. vera at a particular dosage can
effectively enhance hepatoprotective activity in fish under culture conditions as also
demonstrated by Zodape (2010) in Lebeo rohita.
Glucose content is one of the parameters that is used in fish studies to assess their stress
status (He et al. 2015). In the present study, dietary A. vera supplementation had no
effect on the fish glucose levels when compared to the unsupplemented ones. Similar
results were reported when A. vera extracts were supplemented in GIFT-tilapia, O.
niloticus diets at inclusion levels of 0.5% and 2.0% (Gabriel et al. 2015a). Furthermore,
the present study also observed lower TG and TCHO levels in A. vera supplemented fish
when compared to those fed a control diet (but not significant). The same was reported
in a previous study by Gabriel et al. (2015b). This signifies antioxidant and
hepatoprotective properties of A. vera, which have been reported to promote lipid
metabolism, efficient protein accumulation and growth in animals (Ji et al. 2007).
The effects of A. vera in fish are reported to have been attributed to its bioactive
compounds (Radha et al. 2015; Rajasekaran et al. 2005). Studies linking bioactive
compounds in A. vera to their effects in fish are limited. However, in rats, isolated
Page 128
104
phytosterols namely lophenol, and cycloarthanol were reported to elicit the ability to
induce regulation of fatty acid oxidation in the liver, which favours the reduction of
intra-abdominal fat and improvement of hyperlipidemia (Misawa et al. 2012) and
glycaemia (Dana et al. 2012). An A. vera polysaccharides namely glycan had showed a
significant free radical scavenging and antioxidant activity in vitro and protective effects
in hydrogen peroxide induced PC12 cells (Wu et al. 2006). The ability for A. vera
polysaccharides to increase the bioavailability of vitamin C and E (Vinson et al. 2005) is
also another way of improving the body’s natural antioxidant system as well as reduce
cellular damage as these vitamins play a role as strong antioxidant agents as explained
by Gabriel et al. (2015b). Hence, these A. vera attributes could be responsible for the
improved lipid profile status and hepatoprotective enzymes of fish fed A. vera
supplements compared to the control presented in this study.
In conclusion, this experiment demonstrated that A. vera polysaccharides crude powder
extracts supplemented feed has growth, feed utilization, hepatoprotective, and low water
pH resistance effects in African catfish, C. gariepinus fingerlings. This extract presents
the potential and option to be used as growth promoters, appetizer, stimulator, feed
digesting enhancer, and anti-stress agents in C. gariepinus culture, and the optimal
inclusion level is considered to be between 1.77% and 1.79% A. vera. To fully optimize
A. vera extracts as dietary supplement in aquaculture, future studies need to adopt
multivariate designs to understand the possible influence of multiples factors (i.e.
include different fish sizes, different duration of exposure, and different temperatures as
factors) on the growth and health effects of A. vera in fish. The effects of dietary A. vera
Page 129
105
on fish gut microbial communities also need to be studied to help understand its
mechanisms of action.
Page 130
106
3.5 References
Abdel-Tawwab M, Ahmad HM, Seden MEA, Sakr SF. 2010. Use of green tea, Camellia
sinensis L., in practical diet for growth and protection Nile tilapia, Oreochromis
niloticus (L.), against Aeromons hydrophila infection. Journal of the World
Aquaculture Society 41: 203-2013.
Abdullah KM, Abdullah A, Johnson ML, Bilski JJ, Petry K, Redmer DA, Reynolds LP,
Grazul-Bilska AT. 2003. Effects of Aloe vera on gap junctional intercellular
communication and proliferation of human diabetic and nondi-abetic skin
fibroblasts. The Journal of Alternative & Complementary Medicine 9: 711-8.
Abdy E, Alishahi M, Tollabi M, Ghorbanpour M, Mohammadian T (2017) Comparative
effects of Aloe vera gel and Freund’s adjuvant in vaccination of common carp
(Cyprinus carpio L.) against Aeromonas hydrophila. Aquaculture International 25:
727-742.
Akhtar M, Hai A, Awais MM, Iqbal Z, Muhammad F, ul Haq A, Anwar MI (2012)
Immunostimulatory and protective effects of Aloe vera against coccidiosis in
industrial broiler chickens. Veterinary Parasitology 186: 170-177.
Alishahi M, Ranjbar MM, Ghorbanpour M, Peyghan R, Mesbah M, Razijalali M. 2010.
Effects of dietary Aloe vera on specific and nonspecific immunity of common carp
(Cyprinus carpio). Iranian Journal of Veterinary Research 4: 85-91.
Altug N, Yuksek N, Agaoglu ZT. 2010. Immunostimulatory effects of aloe vera and b-
glucan on cellular and humoral immune responses following vaccination with
polyvalent vaccines in dogs. Journal of the Faculty of Veterinary Medicine, Kafkas
University 16: 405-412.
Page 131
107
Arunkumar S, Muthuselvam M. 2009. Analysis of phytochemical constituents and
antimicrobial activities of Aloe vera L. against clinical pathogens. World Journal
Agricultural Sciences 5: 572-576.
Beuers U, Spengler U, Pape G. 1991. Hepatitis after chronic abuse of senna. The
Lancet 337: 372-373.
Boudreau MD, Beland FA. 2006. An evaluation of the biological and toxicological
properties of Aloe barbadensis (miller), Aloe vera. Journal of Environmental Science
Health Part C 24: 103-154.
Boudreau MD, Beland FA, Nichols JA, Pogribna M. 2013. Toxicology and
carcinogenesis studies of a noncolorized whole leaf extract of Aloe barbadensis
Miller (Aloe vera) in F344/N rats and B6C3F1 mice (drinking water study). National
Toxicology Program Technical Report Series 1-266.
Bulfon C, Volpatti D, Galeotti M. 2015. Current research on the use of plant-derived
products on farmed fish. Aquaculture Research 46: 513-551.
Cabello FC. 2006. Heavy use of prophylactic antibiotics in aquaculture: a growing
problem for human and animal health and for the environment. Environmental
Microbiology 8: 1137-1144.
Chen H, Li D, Chang BY, Gong L, Dai J, Yi G. 2003. Effects of Chinese herbal
polysaccharides on the immunity and growth performance of young broilers. Poultry
Science 82: 364-370.
Chow JTN, Williamson DA, Yates KM, Goux WJ. 2005. Chemical characterization of
the immunomodulating polysaccharide of Aloe vera L. Carbohydrate Research 340:
1131-1142.
Page 132
108
Citarasu T. 2010. Herbal biomedicines: a new opportunity for aquaculture industry.
Aquaculture International 18: 403-414.
Cope RB. 2005. Allium species poisoning in dogs and cats. Veterinary Medicine-Bonner
Springs Then Edwardsville 100: 562.
Cui Y, Ye Q, Wang H, Li Y, Yao W, Qian H. 2014. Hepatoprotective potential of Aloe
vera polysaccharides against chronic alcohol-induced hepatotoxicity in mice.
Journal of the Science of Food & Agriculture 94: 1764-1771.
Dana N, Javanmard SH, Asgary S, Asnaashari H, Abdian N. 2012. The effect of Aloe
vera leaf gel on fatty streak formation in hypercholesterolemic rabbits. Journal of
Research in Medical Sciences 17: 439.
Fallah R. 2014. Effects of supplementing Aloe vera gel and garlic powder on blood
biochemical parameters and immune response of broiler. Journal of
Medicinal Plants Research 8: 1035-1039.
Farahi A, Kasiri M, Sudagar M, Soleimani M, Iraei M, Zorriehzahra SMJ. 2012. Effect
of dietary supplementation of Melissa officinalis and aloe vera on hematological
traits, lipid oxidation of carcass and performance in rainbow trout (Oncorhynchus
mykiss). Online Journal of Animal & Feed Research 1: 1-5.
Gabriel NN, Qiang J, Ma XY, Xu P, Nakwaya DN. 2017. Effects of dietary Aloe vera
crude extracts on digestive enzyme activities and muscle proximate composition of
GIFT tilapia juveniles. South African Journal of Animal Science 47: 904-913.
Gabriel NN, Qiang J, He J, Ma XY, Kpundeh MD, Xu P. 2015a. Dietary Aloe vera
supplementation on growth performance, some haemato-biochemical parameters and
disease resistance against Streptococcus iniae in tilapia (GIFT). Fish & Shellfish
Immunology 44: 504-514.
Page 133
109
Gabriel NN, Qiang J, Ma XY, He J, Xu P, Liu K. 2015b. Dietary Aloe vera improves
plasma lipid profile, antioxidant, and hepatoprotective enzyme activities in GIFT-
tilapia (Oreochromis niloticus) after Streptococcus iniae challenge. Fish Physiology
& Biochemistry 41: 1321-1332.
Golestan G, Salati AP, Keyvanshokooh S, Zakeri M, Moradian H. 2015. Effect of
dietary aloe vera on growth and lipid peroxidation indices in rainbow trout
(Oncorhynchus mykiss). Veterinary Research Forum 6: 63.
Gullberg E, Cao S, Berg OG, Ilback C, Sandegren L, Hughes D, Andersson DI. 2011
Selection of resistant bacteria at very low antibiotic concentrations. PLoS Pathogens
7: p.e1002158.
Hamman JH (2008) Composition and applications of Aloe vera leaf gel. Molecule. 13:
1599-1616.
Harikrishnan R, Naafar, A Musthafa MS, Ahamed A, Arif IA, Balasundaram C. 2018.
Effect of Agaricus bisporus enriched diet on growth, hematology, and immune
protection in Clarias gariepinus against Flavobacterium columnare. Fish & Shellfish
Immunology 73: 245-251.
Harikrishnan R, Balasundaram C, Heo MS. 2011. Impact of plant products on innate and
adaptive immune system of cultured finfish and shellfish. Aquaculture 317: 1-15.
Harris C, Pierce K, King G, Yates KM, Hall J, Tizard I. 1991. Efficacy of acemannan in
treatment of canine and feline spontaneous neoplasms. Molec Biother 3: 207-213.
He J, Qiang J, Gabriel NN, Xu P, Yang R. 2015. Effect of feeding-intensity stress on
biochemical and hematological indices of gift tilapia (Oreochromis niloticus).
Turkish Journal of Fisheries & Aquatic Sciences 15:303-310.
Page 134
110
Heidarieh M, Mirvaghefi AR, Sepahi A, Sheikhzadeh N, AliShahbazfar A, Akbari M.
2013. Effects of dietary Aloe vera on growth performance, skin and gastrointestine
morphology in rainbow trout (Oncorhynchus mykiss). Turkish Journal of Fisheries
& Aquatic Sciences 13: 367-373.
Ibidunni AS, Olubodun OS, Ikililu A. 2018. Growth performance, haematology and
histopathology of African catfish (Clarias gariepinus) fed varying levels of Aloe
barbadensis leaves. Journal of Fisheries 6: 553-562.
Iji OT, Oyagbemi AA, Azeez OI. 2010. Assessment of chronic administration of Aloe
vera gel on haematology, plasma biochemistry, lipid profiles and erythrocyte
osmotic resistance in Wistar rats. Nigerian Journal of Physiological Sciences 25:
107-113.
Im SA, Oh ST, Song S, Kim MR, Kim DS, Woo SS, Lee CK. 2005. Identification of
optimal molecular size of modified Aloe polysaccharides with maximum
immunomodulatory activity. International Immunopharmacology 5: 271-279.
Immanuel G, Uma RP, Iyapparaj P, Citarasu T Punitha Peter SM, Michael Babu M,
Palavesam A. 2009. Dietary medicinal plant extracts improve growth, immune
activity and survival of tilapia Oreochromis mossambicus. Journal of Fish Biology
74: 1462-1475.
Jelkić D, Opačak A, Horvat D, Safner R. 2014. Common carp fry survival during
salinity stress test: effect of feeding regime-short communication. Veterinarski
arhiv 84: 429-438.
Ji SC, Jeong GS, Gwang-Soon IM, Lee SW, Yoo JH, Takii K. 2007. Dietary medicinal
herbs improve growth performance, fatty acid utilization, and stress recovery of
Japanese flounder. Fisheries Science 73: 70-76.
Page 135
111
Ji SC, Takaoka O, Lee SW, Hwang JH, Kim YS, Ishimaru K, Takii K. 2009. Effect of
dietary medicinal herbs on lipid metabolism and stress recovery in red sea bream
Pagrus major. Fisheries Science 75: 665-672.
Kareem ZH, Abdelhadi YM, Christianus A, Karim M, Romano N. 2016. Effects of some
dietary crude plant extracts on the growth and gonadal maturity of Nile tilapia
(Oreochromis niloticus) and their resistance to Streptococcus agalactiae infection
Fish Physiology & Biochemistry 42: 757-769.
Kayode OA. 2016. Effects of aloe vera gel application on epidermal wound healing in
the domestic rabbit. International Journal Medical Sciences 5: 101-105.
Lee JY, Gao Y. 2012. Review of the application of garlic, Allium sativum, in
aquaculture. Journal of the World Aquaculture Society 43: 447-458.
Lim SJ, Jang E, Lee SH, Yoo BH, Kim SK, Kim TK. 2013. Antibiotic resistance in
bacteria isolated from freshwater aquacultures and prediction of the persistence and
toxicity of antimicrobials in the aquatic environment. Journal of Environmental
Science & Health B 48: 495-504.
López-Cervantes J, Sánchez-Machado DI, Cruz-Flores P, Mariscal-Domínguez MF, de
la Mora-López GS, Campas-Baypoli ON. 2018. Antioxidant capacity, proximate
composition, and lipid constituents of Aloe vera flowers. Journal of Applied
Research Medicinal Aromatic Plants. doi:org/10.1016/j.jarmap.2018.02.004.
Mahdavi M, Hajimoradloo A, Ghorbani R. 2013. Effect of Aloe vera extract on growth
parameters of common carp (Cyprinus carpio). World Journal of Medicinal
Science 9: 55-60.
Misawa E, Tanaka M, Nomaguchi K, Nabeshima K, Yamada M, Toida T, Iwatsuki K.
2012 Oral ingestion of Aloe vera phytosterols alters hepatic gene expression profiles
Page 136
112
and ameliorates obesity-associated metabolic disorders in Zucker diabetic fatty rats.
Journal of Agricultural and Food Chemistry 60: 2799-2806.
Müller-Lissner SA. 1993. Adverse effects of laxatives: fact and fiction. Pharmacology
47: 138-145.
Ndubuisi CU, Chimezie JA, Chinedu CU, Chikwem CI, Alexander U. 2015. Effect of
pH on the growth performance and survival rate of Clarias gariepinus
fry. International Journal of Research in Biosciences 4: 14-20.
Ni Y, Turner D, Yates KM, Tizard I. 2004. Isolation and characterization of structural
components of Aloe vera L. leaf pulp. International Immunopharmacology 4: 1745-
1755.
NRC (National Research Council). 1993. Nutrient requirements of fish. Washington,
D.C: National Academies Press.
Ojiezeh TI, Ophori EA. 2015. Haemogram and serum enzymes activities of Newcastle
disease virus challenged broiler chickens following supplemental treatment with aloe
vera extract. Journal of Clinical & Cell Immunology 6: 282.
Olusola SE, Emikpe BO, Olaifa FE. 2013. The potentials of medicinal plant extracts as
bio-antimicrobials in aquaculture. International Journal of Medicinal & Aromatic
Plants 3: 404–412.
Palanisamy P, Sasikala G, Mallikaraj D, Bhuvaneshwari N, Natarajan GM. 2011.
Haematological changes of freshwater food fish, Channa striata on exposure to
Cleistanthus collinus suicidal plant extract. Research Journal of Pharmaceutical,
Biological & Chemical Sciences 2:812-816.
Platel K, Srinivasan K. 2004. Digestive stimulant action of spices: a myth or reality?
Indian Journal of Medical Research 119: 167-179.
Page 137
113
Radha MH, Laxmipriya NP. 2015. Evaluation of biological properties and clinical
effectiveness of Aloe vera: A systematic review. Journal of Traditional &
Complementary Medicine 5: 21-26.
Rajasekaran S, Sivagnanam K, Subramanian S. 2005. Antioxidant effect of Aloe vera
gel extract in streptozotocin-induced diabetes in rats. Pharmacological Reports 57:
90-6.
Reverter M, Bontemps N, Lecchini D, Banaigs B, Sasal P. 2014. Use of plant extracts in
fish aquaculture as an alternative to chemotherapy: current status and future
perspectives. Aquaculture 433: 50-61.
Reynolds T, Dweck AC. 1999. Aloe vera leaf gel: a review update. Journal
Ethnopharmacology 68: 3-37.
Seyfried EE, Newton RJ, Rubert KF, Pedersen JA, McMahon KD. 2010. Occurrence of
tetracycline resistance genes in aquaculture facilities with varying use of
oxytetracycline. Microbial Ecology 59: 799-807.
Sohn KS, Kim MK, Kim JD, Han IK. 2000. The role of immunostimulants in
monogastric animal and fish-review. Asian-Australas. Journal of Animal Science 13:
1178 -1187.
Sotoudeh A, Yeganeh S. 2017. Effects of supplementary fennel (Foeniculum vulgare)
essential oil in diet on growth and reproductive performance of the ornamental fish,
Convict cichlid (Cichlasoma nigrofasciatum). Aquaculture Research 48: 4284-4291.
Taiwo VO, Olukunle OA, Ozor IC, Oyejobi AT. 2005. Consumption of aqueous extract
of raw Aloe vera leaves: histopathological and biochemical studies in rat and
tilapia. African Journal of Biochemistry Research 8: 169-178.
Page 138
114
Thanikachalam K, Kasi M, Rathinam X. 2010. Effect of garlic peel on growth,
hematological parameters and disease resistance against Aeromonas hydrophila in
African catfish Clarias gariepinus (Bloch) fingerlings. Journal of
Tropical Medicine 3: 614-618.
Trejo-Flores JV, Luna-González A, Álvarez-Ruíz P, Escamilla-Montes R, Peraza-
Gómez V, Diarte-Plata G, Rubio-Castro A. 2016. Protective effect of Aloe vera in
Litopenaeus vannamei challenged with Vibrio parahaemolyticus and white spot
syndrome virus. Aquaculture 465: 60-64.
Tremaroli V, Backhed F. 2012. Functional interactions between the gut microbiota and
host metabolism. Nature 489: 242-249.
Vahedi A, Hasanpour HM, Akrami R, Chitsaz H. 2017. Effect of dietary
supplementation with ginger (Zingiber officinale) extract on growth, biochemical
and hemato-immunological parameters in juvenile beluga (Huso huso). Iranian
Journal of Aquatic Animal Health 3: 26-46.
Vinson JA, Al Kharrat H, Andreoli L. 2005. Effect of Aloe vera preparations on the
human bioavailability of vitamins C and E. Phytomedicine 12: 760-765.
Wu JH, Xu C, Shan CY, Tan RX. 2006. Antioxidant properties and PC12 cell protective
effects of APS-1, a polysaccharide from Aloe vera var. chinensis. Life Sciences 78:
622-630.
Yang X, Guo JL, Ye JY, Zhang YX, Wang W. 2015. The effects of Ficus carica
polysaccharide on immune response and expression of some immunerelated genes in
grass carp, Ctenopharyngodon idella. Fish & Shellfish Immunology 42: 132-137.
Page 139
115
Yu Y, Shen M, Song Q, Xie J. 2018. Biological activities and pharmaceutical
applications of polysaccharide from natural resources: A review. Carbohydrate
Polymer 183: 91-101.
Zahran E, Risha E, AbdelHamid F, Mahgoub HA, Ibrahim T. 2014. Effects of dietary
Astragalus polysaccharides (APS) on growth performance, immunological
parameters, digestive enzymes, and intestinal morphology of Nile tilapia
(Oreochromis niloticus). Fish & Shellfish Immunology 38: 149-157.
Zanuzzo FS, Urbinati EC, Rise ML, Hall J.R, Nash GW, Gamperl AK. 2015a.
Aeromonas salmonicida induced immune gene expression in Aloe vera fed steelhead
trout, Oncorhynchus mykiss (Walbaum). Aquaculture 435: 1-9.
Zanuzzo FS, Sabioni RE, Montoya LNF, Favero G, Urbinati EC. 2017. Aloe vera
enhances the innate immune response of pacu (Piaractus mesopotamicus) after
transport stress and combined heat killed Aeromonas hydrophila infection. Fish &
Shellfish Immunology 65: 198-205.
Zanuzzo FS, Zaiden SF, Senhorini JA, Marzocchi-Machado CM, Urbinati EC. 2015b.
Aloe vera bathing improved physical and humoral protection in breeding stock after
induced spawning in matrinxã (Brycon amazonicus). Fish & Shellfish
Immunology 45: 132-140.
Zeitoun IH, Ullrey DE, Magae DE, Gill JL, Bergen WG. 1976. Quantifying nutrient
requirements of fish. Journal of the Fisheries Research Board Canada 33:167-172.
Zodape GV. 2010. Effect of Aloe vera juice on the toxicity induced by metal
(chromium) in Labeo rohita (Hamilton). Applied Scientific Research 2: 1788-1793.
Page 140
116
CHAPTER FOUR: DIETARY GARLIC (ALLIUM SATIVUM)
SUPPLEMENTATION EFFECT ON GROWTH,
HAEMATOLOGICAL PARAMETERS, WHOLE BODY
COMPOSITION AND SURVIVAL AT LOW PH IN AFRICAN
CATFISH (CLARIAS GARIEPINUS) JUVENILES
Abstract
This chapter reports the potential effects of dietary garlic (Allium sativum) crude
polysaccharide extracts (GPE) (0% (control) 0.5%, 1.0%, 2.0%, and 4.0%) on growth,
haematological parameters, whole body composition, and resistance against low pH in
African catfish, Clarias gariepinus juveniles. Fish (initial weight, 12.28 1.26 g) fed
GPE supplemented diets had a significant increase in growth parameters compared to
those fed a control diet (P < 0.05). Similarly, feed utilization indices were significantly
improved in GPE supplemented fish compared to the control (P < 0.05). For
haematological indices, a significant increase was observed in the red blood cell counts
(RBC) (1012/L) of fish fed 0.5% (2.01 0.07), 1.0% (1.96 0.22), and 2.0% (1.88
0.12), and in mean corpuscular haemoglobin concentration (MCHC) (g/L) for those fed
0.5% (553.83 6.21), and 1.0% (554. 83 7.82) compared to those fed a control diet
(RBC = 1.36 0.11; MCHC = 534.67 1.83) (P < 0.05). No significant difference was
observed in the survival probability among dietary groups following a challenge with
low pH (5.2 – 5.5) (P > 0.05). Similarly, no significant difference between groups was
presented in the whole body composition and organo-somatic indices (P > 0.05). The
optimal dietary inclusion level was estimated at 1.69% (y = -0.056x2 + 0.189x +0.81, R2
= 0.52, P = 0.031) and 1.77% (y = -11.89x2 + 41.69x +167, R2 = 0.767, P = 0.001) of
garlic for feed utilization and growth in C. gariepinus juvenile culture, respetively.
Allium sativum polysaccharides are recommended as feed supplements in C. gariepinus
juveniles’ culture.
Page 141
117
Keywords: Aquaculture, Clarias gariepinus, Immunostimulants, Plant extracts, Stress
resistance.
Page 142
118
4.1 Introduction
In aquaculture, garlic is one of the most researched herbs with most of the research
supporting its ability to stimulate growth (Lee et al. 2012; Büyükdeveci et al. 2018),
enhance feed utilization parameters (i.e. low feed conversion ratio, and high feed
efficiency ratio (Guo et al. 2012; Mehrim et al. 2014), improve non-specific immune
responses (Thanikachalam et al. 2010; Talpur and Ikhwanuddin 2012), increase disease
resistance (Guo et al. 2012; Talpur & Ikhwanuddin 2012), prevent parasite infections
(Militz et al. 2013) and maintain meat quality (Öz 2018) in fish. These studies have
investigated a wide range of garlic extracts in different fish species ranging from 100%
crude powder, solvent extracted semi-purified extracts to purified extracts, with 100%
crude extracts (powder) being the commonly researched form of extracts (Table 2.2).
For instance, 100% garlic extracts were investigated in Oncorhynchus mykiss (Öz 2018),
Dicentrarcus labrax (Saleh et al. 2015; Irkin and Yigit 2016), Clarias gariepinus (Eirna-
Liza et al. 2016) and Oreochromis niloticus (Shalaby et al. 2006). Other garlic extracts
studied in aquaculture include aqueous extracts (Guo et al. 2012; Fridman et al. 2014;
Büyükdeveci et al. 2018), garlic oil (Hassaan and Soltan 2016), ethanolic extracts (Lee
et al. 2012), garlic peels (Thanikachalam et al. 2010; Eirna-Liza et al. 2016), and allicin
aqueous extracts (purified) (Militz et al. 2013).
Garlic has been reported to be rich in polysaccharides (about 77% of its dry weight)
(Koch and Lawson 1996). Polysaccharides are non-digestible feed ingredients that
promote growth of beneficial gastrointestinal microbiota and depress the growth of
pathogenic microbiota (Song et al. 2014). This has been demonstrated by several
researchers in aquaculture. For example, Astragalus sp. polysaccharides reportedly
Page 143
119
enhanced growth performance, immunological parameters, digestive enzyme activity
and intestinal morphology (i.e. increased villi length) in O. niloticus (Zahran et al.
2014). In part, the same was demonstrated in Sparus aurata after being fed
fructooligosaccharides (Guerreiro et al. 2016a), and Channa striata fed -glucan,
galactose-oligosaccharides, and mannaoligosaccharides (Munir et al. 2018), and in
Diplodus sargus fed diets supplemented with xylooligosaccharides, small chain
fructooligosaccharides, and galactoseoligosaccharides (Guerreiro et al. 2016b).
Although garlic is extensively researched in aquaculture, no study has explored the
effects of its crude polysaccharide extracts in fish as a feed additive. This is therefore the
first study to investigate the effect of dietary garlic (Allium sativum) crude
polysaccharide supplementation on growth, haematological parameters, whole body
composition, and resistance against low pH in African catfish, C. gariepinus juveniles.
4.2 Materials and methods
4.2.1 Fish
African catfish, C. gariepinus juveniles (weight 12.28 1.26 g) were obtained from a
government fish farm, Onavivi Aquaculture Center (OAC), Outapi, Namibia. These
animals were managed in the same manner as described in chapter 3, section 3.2.1.
4.2.2 Feeding regimes
To formulate five dietary groups, garlic crude polysaccharide extracts (GPE)
(commercial product from Shaanxi Fuheng Biotechnology, Co. Ltd. China) were
supplemented to a basal diet (with 31.5 crude protein, 16.12 kJ/g diet energy, and 4.91%
Page 144
120
lipid) (Table 4.1) at 0%, 0.5%, 1.0%, 2.0%, and 4.0% inclusion levels. All dry
ingredients were mechanically mixed with oil and then water was added until a dough
was observed. Each diet was then passed through a mincer. The resulting strands were
shadow-dried, broken up, sieved into pellets, and stored in airtight plastic bags until use.
After a week, when no clinical signs of illness were observed, 300 fish were randomly
distributed into five triplicated experimental groups (20 fish / replicate), in a 0.18 m3
tank for each group, supplied with 150L of dechlorinated freshwater) following a
completely randomized design (CRD) (Festing and Altman 2002). During experimental
feeding, fish were fed three times a day (09:00; 13:00; 17:00), six days a week until
apparent satiation for 60 d. Continuous aeration, a natural photoperiod (12-hrs light/12-
hrs dark cycle), and biweekly water exchange (60%) was maintained during the feeding
trial. Dissolved oxygen (DO) concentration (5.65 0.96 mg/l) and water temperature
(27.19 1.26℃) was monitored once daily. Meanwhile, pH (6.7 0.08), and ammonia
(lower than 0.05 mg /L) were monitored on a weekly basis. The experiment was
conducted according to the scientific research protocols of the University of Namibia,
and had complied with all relevant local and international animal welfare laws,
guidelines and policies (see Appendix D).
Page 145
121
aVitamin premix (g or IU kg-premix); thiamine, 5; riboflavin, 5; niacin, 25; folic acid, retinol palmitate, 500,000 IU;1;
pyridoxine, 5; cyanocobalamin, 5; cholecalciferol; 50,000 IU; a-tocopherol, 2.5; menadione, 2; inositol, 25;
pantothenic acid, 10; ascorbic acid, 10; choline chloride, 100; biotin, 0.25. bMineral premix (g kg-1): KH2PO4, 502; MgSO4. 7H2O, 162; NaCl, 49.8; CaCO3, 336; Fe (II) gluconate, 10.9;
MnSO4.H2O, 3.12; ZnSO4. 7H2O, 4.67; CuSO4. 5H2O, 0.62; KI, 0.16; CoCl2. 6H2O, 0.08; ammonium molybdate,
0.06; NaSeO3, 0.02.
Table 4.1 Formulation and composition of the experimental diets (%/100 g dry
matter).
Ingredients
Dietary groups
1 2 3 4 5
Fish meal (60% CP) 28.50 28.50 28.50 28.50 28.50
Cow peas (25% CP) 22.50 22.50 22.50 22.50 22.50
Corn grain (10.2% CP) 8.40 8.40 8.40 8.40 8.40
Wheat flour (11.7% CP) 13.90 13.90 13.90 13.90 13.90
Pearl millet (12.5% CP) 22.70 22.70 22.70 22.70 22.70
Vegetable oil 3.00 3.00 3.00 3.00 3.00
Vitamin premixa 0.50 0.50 0.50 0.50 0.50
Mineral premixb 0.50 0.50 0.50 0.50 0.50
Total 100 .00 100.00 100 .00 100 .00 100.00
GPE 0.00 0.50 1.0 0 2.00 4.00
Proximate composition (%)
Dry matter 92.73 91.69 91.69 91.71 91.73
Crude protein 31.50 31.21 31. 45 31. 28 31.42
Crude lipid 4.91 4.83 4.77 4.82 4.78
Ash 4.37 4.29 4.32 4.39 4.38
Gross energy (KJ/g diet) 16.12 16.18 16.11 16.38 16.40
Page 146
122
4.2.3 Growth and feed utilization parameters
All fish were weighed (together) at the start and the end of the experiment (after 60
days), to calculate weight gain (WG), absolute growth rate (AGR), and specific growth
rate (SGR). To calculate the organo-somatic indices body length, body weight, liver and
gutted weights of three fish from each replicate were recorded. Before these fish were
sacrificed, they were anaesthetized with 100mg MS-222, tricane methane sulfonate
(Biodynamic Pty, Ltd, Namibia). The amount of feed consumed and mortality in each
replicate was recorded throughout the experimental period to account for feed intake
(FI) and survival rate, respectively. Growth performance and feed utilization were
assessed in terms of WG, AGR, SGR, feed intake (FI), feed conversion ratio (FCR), and
feed efficiency ratio (FER). Calculations were conducted as indicated in Chapter 3,
Section 3.2.3, Equations 1 to 9.
4.2.4 Haematological parameters
Blood samples were collected and haematological parameters were analyzed as
described in Chapter 3, Section 3.2.4.
4.2.5 Proximate body composition analysis
Fish whole body proximate composition analyses were carried out as laid out in Chapter
3, Section 3.2.5.
4.2.6 Low pH stress challenge experiment
After the initial sampling, stocking density in each dietary group was adjusted to 10 fish
/ tank. They were then exposed to low pH (pH 5.2 -5.5) for three days (72 h). The water
Page 147
123
pH was adjusted by adding 4N HCl and 4N NaOH, and was renewed daily, as
demonstrated by Lin and Chen (2008). During this experiment pH, temperature (29
1.2℃), DO (> 4 mg/L), and NH3-N concentration (< 0.08 mg/L) were monitored daily.
Fish mortality was recorded at three 24-h intervals to determine the survival:
(12) Survival probability = (𝑁𝑢𝑚𝑏𝑒𝑟 𝑜𝑓 𝑓𝑖𝑠ℎ 𝑠𝑢𝑟𝑣𝑖𝑣𝑒𝑑)/(𝐼𝑛𝑖𝑡𝑖𝑎𝑙 𝑛𝑢𝑚𝑏𝑒𝑟 𝑜𝑓 𝑓𝑖𝑠ℎ)
4.2.7 Statistical analyses
Data were statistically analyzed using descriptive statistics in SPSS (version 21, IMB
Corp, Armonk, NY, USA). Normality and homogeneity of variance were confirmed
using Kolmogorov-Smirnov and Levene’s test, respectively. Treatment effects were
analyzed using one-way analysis of variance (ANOVA). Significant differences between
the group means were further compared using Duncan’s Multiple Range Test (DMRT).
P < 0.05 was considered statistically significant. The second order polynomial
regression model (y = b0 +b1+ b2X2, where, y = maximum WG or FER, x = optimum
inclusion level) (Zeitoun et al. 1976) was used to estimate the optimum dietary GPE
requirement for C. gariepinus juveniles to produce maximum growth and maximum
feed efficiency ratio. The survival (probability) of fish at low pH treatment group was
estimated using Kaplan–Meier analysis (Jelkić et al. 2014). Breslow (generalized
Wilcoxon), Tarone-ware, and log-rank (Mantel-cox) tests were used to determine the
significant difference (P < 0.05) between groups at each sampling interval of the pH
challenge.
Page 148
124
4.3 Results
4.3.1 Fish growth and feed utilization
Throughout the experimental period, the fish appeared healthy and no mortality was
recorded. After 60 d of feeding, fish in all dietary groups increased in wet weight (Figure
4.1). Fish fed GPE supplemented diet at 1.0% (124.05 7.06 g) and 2.0% (126.16
5.21 g) presented significantly higher FW than those fed a control and those fed 4.0% (P
< 0.05). As a result, the WG, SGR, and AGR of fish fed 1.0% (WG = 111.39 8.36 g;
SGR =3.83 0.18 g; AGR =1.86 0.08 g) and 2.0% GPE supplemented diet (WG =
113.51 8.36 g; SGR = 3.89 0.07%; AGR = 1.89 0.08) were significantly higher
than control and 4.0% (P < 0.05), with fish fed 2.0% GPE presenting the highest growth,
followed by those fed 1.0%, 0.5%, while those fed 4.0% (WG = 54.77 1.73; SGR =
2.91 0.05). Fish fed GPE had the lowest growth among dietary groups (P < 0.05).
Furthermore, there were no significant differences observed between groups in the
organo-somatic indices (VSI and HSI) and CF (P > 0.05) (Table 4.2). Generally, the
same response observed in growth parameters was reflected in the feed utilization
parameter (FI) (Figure 4.2) (P < 0.05). Based on the second polynomial regression on
WG against dietary garlic inclusion level (y = -11.809x2 + 41.688x + 167, R2 = 0.765 P
= 0.001), or FER against dietary garlic inclusion level (y = -0.056x2 + 0.189x + 0.807,
R2 = 0.522, P = 0.031), the optimum dietary GPE inclusion level (%) was estimated to
be 1.77% (Y= -11.809x2 + 41.688x + 167, R2 = 0.765 P = 0.001) and 1.69% GPE (y = -
0.056x2 + 0.189x + 0.807, R2 = 0.522, P = 0.031) for growth and feed utilization,
respectively (Figure 4.1, 4.2).
Page 149
125
Figure 4.1 Final weight (FW) (A), specific growth rate (SGR) (B), weight gain (WG)
(C), and absolute growth rate (AGR) (D), of African catfish, C. gariepinus juveniles fed
four garlic (Allium sativum) polysaccharide extracts (GPE) supplemented diets and an
unsupplemented diet (control) for 60 d. Different lower case letters denote a significant
difference among dietary groups (P < 0.05). Values were expressed as mean standard
error; WG: y = -11.809x2 + 41.688x + 167, R2 = 0.765, P = 0.001 (second order
polynomial regression model).
0
50
100
150
Dietary garlic inclusion level (%/kg diet)
FW (
g)
bbc
cd d
a
0
1
2
3
4
5
Dietary garlic inclusion level (%/kg diet)
SG
R (%
/day
)
Control0.5%1.0%2.0%4.0%
b bccd d
a
0
50
100
150
Dietary garlic inclusion level (%/kg diet)
WG
(g) b bc
cd d
a
0.0
0.5
1.0
1.5
2.0
2.5
Dietary garlic inclusion level (%/kg diet)
AG
R (g
/day
)
b bc
cd d
a
A B
C D
Dietary garlic inclusion level (%) Dietary garlic inclusion level (%)
Dietary garlic inclusion level (%) Dietary garlic inclusion level (%)
Page 150
126
Dietary A. vera inclusion level (%)
Parameters Control 0.5 1.0 2.0 4.0
VSI 7.60 0.32a 8.08 0.51a 7.81 0.30a 7.54 0.16a 7.58 0.13a
HSI 3.04 0.16a 3.11 0.13a 3.22 0.16a 3.38 0.28a 2.96 0.09a
CF 0.54 0.01a 0.56 0.20a 0.59 0.13a 0.58 0.01a 0.60 0.05a
Survival 100 0.00 a 100 0.00 a 100 0.00 a 100 0.00 a 100 0.00 a
Data are expressed as mean ± standard error (M ± SE). Values with different superscript letters in the same row are not significantly different (P > 0.05) from the control. Where VSI = viscerosomatic index, HSI = hepatosomatic index, and CF = condition factor.
0
50
100
150
Dietary garlic inclusion level (%/kg diet)
FI (g
)
b b
c c
a
0.0
0.5
1.0
1.5
2.0
Dietary garlic inclusion level (%/kg diet)
FCR
Control0.5%1.0%2.0%4.0%
ab aba a
b
0.0
0.5
1.0
1.5
Dietary garlic inclusion level (%/kg diet)
FER
ab abb b
a
0
1
2
3
4
Dietary garlic inclusion level (%/kg diet)
PE
R
ab ab
b b
a
A B
C D
Table 4.2 Organo-somatic indices, condition factor, and survival (%) of the African
catfish, C. gariepinus fingerlings fed four garlic (Allium sativum) crude polysaccharide
extracts supplemented diets and a control diet for 60 d.
Dietary garlic inclusion level (%) Dietary garlic inclusion level (%)
Dietary garlic inclusion level (%) Dietary garlic inclusion level (%)
Page 151
127
Figure 4.2 Feed intake (FI) (A), feed conversion ratio (FCR) (B), feed efficiency ratio
(FER) (C), and protein efficiency ratio (PER) (D), of the African catfish, C. gariepinus
juveniles fed four garlic (Allium sativum) polysaccharides extracts (GPE) supplemented
diets and an un-supplemented diet (control) for 60 d. Different lower case letters denote
a significant difference among dietary groups (P < 0.05); Values were expressed as
mean standard error; FER: y = -0.056x2 + 0.189x + 0.807, R2 = 0.522, P = 0.031
(second order polynomial regression model).
4.3.2 Haematological indices
There were no significant differences in most of the haematological indices (i.e. WBC,
Hg, Hct, MON, LYM, GRAN, MCV, RDWa, MCH, and PLT) between dietary groups
(Figure 4.3, 4.4, 4.5) (P > 0.05). On the other hand, the significant differences were
observed in RBC counts (Figure 4.3A) and MCHC (Figure 4.4C) between dietary
groups (P < 0.05). The RBC counts were significantly higher in fish supplemented with
0.5% GPE (2.01 0.07), followed by those fed 1.0% (1.96 0.22), and 2.0% GPE (1.88
0.12) when compared to the unsupplemented ones (1.36 0.11) and the 4.0% GPE
(1.29 0.22) (P > 0.05). MCHC levels were significantly higher in fish fed 1.0%
(554.83 7.82), and 0.5% (553.82 6.21) GPE when compared to all other groups (P <
0.05).
Page 152
128
Figure 4.3 Red blood cell counts (RBC) (A), haematocrit levels (B), haemoglobin
concentration (C), and platelet counts (PLT) (D) of African catfish, C. gariepinus
fingerlings fed four garlic (Allium sativum) polysaccharides extracts (GPE)
supplemented diets and an unsupplemented diet (control) for 60 d. Different lower case
letters denote a significant difference among dietary groups (P < 0.05); Values were
expressed as mean standard error.
0.0
0.5
1.0
1.5
2.0
2.5
Dietary garlic inclusion level (%/kg diet)
RB
C (1
012/L
)
a
b bb
a
0.00
0.05
0.10
0.15
0.20
0.25
Dietary garlic inclusion level (%/kg diet)
Hem
atoc
rits
(L/L
)
Control0.5%1.0%2.0%4.0%
0
50
100
150
Dietary garlic inclusion level (%/kg diet)
Hem
oglo
bin
(g/L
)
0
5
10
15
Dietary garlic inclusion level (%/kg diet)
PLT
(109 /L
)
A B
C D
Dietary garlic inclusion level (%) Dietary garlic inclusion level (%)
Dietary garlic inclusion level (%) Dietary garlic inclusion level (%)
Page 153
129
Figure 4.4 Mean corpuscular volume (MCV) (A), mean corpuscular haemoglobin level
(MCH) (B), mean corpuscular haemoglobin concentration (MCHC) (C), and Red blood
cell distribution width (RDWa) (D) of African catfish, C. gariepinus juveniles fed four
garlic (Allium sativum) polysaccharides extracts supplemented diets and an
unsupplemented diet (control) for 60 d. Different lower case letters denote a significant
difference among dietary groups (P < 0.05); Values were expressed as mean standard
error.
0
50
100
150
Dietary garlic inclusion level (%/kg diet)
MC
V (L
/cel
l)
0
20
40
60
80
Dietary garlic inclusion level (%/kg diet)
MC
H (f
mol
/cel
l)
Control0.5%1.0%2.0%4.0%
0
200
400
600
Dietary garlic inclusion level (%/kg diet)
MC
HC
(g/L
)
bab
a a
0
20
40
60
80
100
Dietary garlic inclusion level (%/kg diet)
RD
Wa
(fl/c
ell)
A B
C D
Dietary garlic inclusion level (%) Dietary garlic inclusion level (%)
Dietary garlic inclusion level (%) Dietary garlic inclusion level (%)
Page 154
130
Figure 4.5 White blood cell counts (WBC) (A), lymphocyte counts (B), monocyte
counts (C), and granulocytes (D) of African catfish, C. gariepinus juveniles fed four
garlic (Allium sativum) polysaccharides extracts (GPE) supplemented diets and an
unsupplemented diet (control) for 60 d. Different lower case letters denote a significant
difference among dietary groups (P < 0.05); Values were expressed as mean standard
error.
0
20
40
60
Dietary garlic inclusion level (%/kg diet)
WB
C (1
09 /L)
0
10
20
30
40
50
Dietary garlic inclusion level (%/kg diet)
Lym
phoc
ytes
(109 /L
)
Control0.5%1.0%2.0%4.0%
0
1
2
3
Dietary garlic inclusion level (%/kg diet)
Mon
ocyt
es (1
09 /L)
0
1
2
3
4
Dietary garlic inclusion level (%/kg diet)
Gra
nulo
cyte
s (1
09 /L)
A B
C D
Dietary garlic inclusion level (%) Dietary garlic inclusion level (%)
Dietary garlic inclusion level (%) Dietary garlic inclusion level (%)
Page 155
131
4.3.3 Proximate body composition
There were no significant differences in the whole body composition indices (protein,
moisture, lipid, and ash composition) of fish between dietary groups (P > 0.05) (Table
4.3).
Values (Mean ± Standard Error, M±SE) within the same row with the same superscripts letters are not significantly different (P > 0.05).
4.3.4 Low pH challenge
Based on the Breslow (generalized Wilcoxon, P = 0.25), Tarone-ware (P = 0.16), and
log rank (Mantel-Cox, P = 0.09) tests, garlic supplement had no significant effect on the
survival probability of fish after low water pH exposure (P > 0.05) (Figure 4.6).
Table 4.3 Selected whole body composition parameters of African catfish, C. gariepinus
juveniles fed four garlic (Allium sativum) polysaccharides extracts (GPE) supplemented
diets and un-supplemented diet for 60 d.
Dietary garlic inclusion level (%) Parameters Control 0.5 1.0 2.0 4.0
Moisture (%) 72.30 0.06a 72.79 0.40a 72.04 0.34a 72.04 0.63a 72.77 0.87a
Protein (%) 69.94 1.19a 70.72 0.70a 71.88 1.21a 72.22 0.36a 70.35 0.84a
Lipid (%) 8.89 0.31a 8.99 1.91a 8.57 0.99a 7.83 0.22a 77 0.50a
Ash (%) 6.41 1.43a 6.87 0.51a 6.73 0.32a 6.99 0.06a 7.25 0.31a
Page 156
132
Figure 4.6 Kaplan-Meier: low pH challenge survival probability of African catfish, C.
gariepinus juveniles fed four garlic (Allium sativum) polysaccharides extracts (GPE)
supplemented diets and an unsupplemented diet (control) for 60 d.
4.4 Discussion
In the current study, the significant increase in growth parameters (WG, FW, SGR, and
AGR), and in feed intake observed in fish fed GPE enriched diets compared to other
groups disagree with findings of different dietary garlic extracts supplementation in
African catfish, C. gariepinus. For instance, no significant growth was observed in
African catfish, C. gariepinus fingerlings when fed diets supplemented with garlic peels
(Thanikachalam et al. 2010; Eirna et al. 2016), and garlic clove crude extracts (Eirna et
al. 2016; Onomu 2019). However, dietary garlic extracts supplementation was reported
to significantly improve feed utilization as well as growth in various aquaculture species,
Page 157
133
as demonstrated in the present study. Abu-Elala et al. (2016) reported a significant
increase in FW, WG, and significantly lower FCR in Nile tilapia, O. niloticus after being
fed a diet supplemented with garlic crude powder compared to a control. Similarly,
significant improvement in growth and feed utilization indices were reported in Caspian
roach, Rutilus rutilus (Ghehdarijani et al. 2016), orange-spotted grouper, Epinephelus
coioides (Guo et al. 2012), Asian sea bass, Lates calcarifer (Talpur and Ikhwanuddin
2012), and sterlet sturgeon, Acipenser rutheni (Lee et al. 2014) after being fed garlic
crude powder. Studies that had garlic supplemented at varying inclusion levels indicated
that growth and feed utilization response was dose-dependent. In most cases, the poorest
growth was observed at highest inclusion levels (Guo et al. 2012; Talpur and
Ikhwanuddin 2012; Ghehdarijani et al. 2016), as also demonstrated in the current study.
This could be a result of the pungent smell possessed by garlic, which might act as feed
deterrents, hence lower feed palatability and poor growth in fish (Lee et al. 2014).
It is now common to assess the herbal extract health effects in animals including fish
using haematological indices such as WBC, RBC, Hct, Hb, erythrocyte indices (i.e.
MCV, MCH, and MCHC), and differential leukocyte counts (i.e. lymphocytes,
neutrophils, basophils, eosinophils, and monocytes). The present study observed an
improvement in haematological parameters, and high resistance to low pH stress in fish
fed garlic-supplemented diets. These findings agree with those of Thanikachalam et al.
(2010) who reported that dietary garlic peels significantly enhanced RBC, WBC, and
increased resistance of C. gariepinus against Aeromonas hydrophila. Similarly,
increased haematological indices as well as increased resistance against stressors were
reported in O. mykiss (Nya and Austin 2011), Lates calcarifer (Talpur and Ikhwanuddin
Page 158
134
2012), Huso huso (Kanani et al. 2014), and in Dicentrarcus labrax (Saleh et al. 2015)
following dietary garlic supplementation. This is indeed an indication that garlic has the
ability to enhance the oxygen carrying capacity, non-specific or innate immunity
(Fazlolah-zadeh et al. 2011) in fish, and as a result, producing healthy animals that can
withstand physiological stress under culture conditions (Houston 1997).
Improved growth, feed utilization, health parameters, as well as increased stress
resistance in fish fed diets supplemented with garlic crude polysaccharide extracts in the
present study, could be attributed to many factors. Previous studies have attributed these
effects to allicin (Khalil et al. 2001; Lee and Gao 2012), which is the most bioactive
compound found in garlic (Rahman and Lowe 2006; Yoo et al. 2010). Its mode of action
seems to be well understood. It improves the gastrointestinal motility, and modulates the
secretion of various digestive enzymes to enhance digestion and nutrient absorption
(Diab et al. 2010). It also promotes the performance of intestinal flora, inhibits
deleterious bacteria while intensifying beneficial bacteria such as Lactobacillus and
Bifidus, thus improving the utilization of energy and growth (Diab et al. 2010;
Büyükdeveci et al. 2018). However, allicin at higher dosages is known to be harmful to
fish, resulting in reduced growth and sometimes even death in fish, because of its ability
to interfere with the normal metabolism and mitosis (Yang et al. 2010). Thus
optimization of garlic extracts in aquaculture feed is important.
In addition, herbal polysaccharides (sometimes referred to as prebiotics) are other
ingredients that have been reported to improve growth of fish through nutrient utilization
and health improvement (Merrifield and Ringo 2014; Mohan et al. 2019). Interestingly,
Page 159
135
there seem to be similarities in the mode of action between prebiotics and allicin in
promoting growth in fish. Like allicin, prebiotics enhance growth in fish by improving
feed digestibility, and availability of nutrients from feedstuffs, and shorten the feed
transit time, which enhances digestive enzymes (Patel and Srinivasan 2004), and reduce
the amount of feed substrate available in the gut for proliferation of pathogenic bacteria
(Citarasu 2010). Prebiotics do this through their ability to modulate the interaction
between gut autochthonous morphology and gut microbiota, as highlighted by Denev et
al. (2009) and Carbone and Faggio (2016).
Ji et al. (2009) has explained that, growth in fish fed dietary herbal extracts could also be
enhanced as a result of their ability to promote lipid metabolism, which spare protein for
growth, and lead to the repression of lipid accumulation. As a result, fish muscle quality
(high protein, and low lipid content) would be improved (Lee and Gao 2012), as
demonstrated in the current study.
In conclusion, garlic crude polysaccharide extracts improved growth, feed utilization,
health, meat quality as well as resistance against low water pH in African catfish, C.
gariepinus juveniles. Based on the second order polynomial regression analysis, dietary
inclusion level between 1.69% and 1.77% of garlic crude polysaccharide extracts /kg of
basal diet was estimated optimal to support growth and feed utilization in African catfish
juvenile culture, respectively. Future studies should focus on using purified garlic
extracts to understand their effects on digestive enzymes as well as intestinal bacterial
community in addition to biometric parameters and immunological indices.
Page 160
136
4.5 Reference
Abu-Elala NM, Galal MK, Abd-Elsalam RM, Mohey-Elsaeed O, Ragaa NM. 2016.
Effects of dietary supplementation of spirulina platensis and garlic on the growth
performance and expression levels of immunerelated genes in Nile tilapia
(Oreochromis niloticus). Journal of Aquaculture Research & Development 7: 433.
Büyükdeveci ME, Balcázar JL, Demirkale İ, Dikel S. 2018. Effects of garlic-
supplemented diet on growth performance and intestinal microbiota of rainbow trout
(Oncorhynchus mykiss). Aquaculture 486: 170-174.
Carbone D, Faggio C. 2016. Importance of prebiotics in aquaculture as
immunostimulants. Effects on immune system of Sparus aurata and Dicentrarchus
labrax. Fish & Shellfish Immunology 54: 172-178.
Citarasu T. 2010. Herbal biomedicines: a new opportunity for aquaculture
industry. Aquaculture International 18: 403-414.
Denev S, Staykov Y, Moutafchieva R, Beev G. 2009. Microbial ecology of the
gastrointestinal tract of fish and the potential application of probiotics and prebiotics
in finfish aquaculture. International Aquatic Research 1: 1-29.
Diab AS, Aly SM, John G, Abde-Hadi Y, Mohammed MF. 2008. Effect of garlic, black
seed and bioiogen as immunostimulants on the growth and survival of Nile tilapia,
Oreochromis niloticus (Teleostei: Cichlidae), and their response to artificial
infection with Pseudomonas fluorescens. African Journal of Aquatic Science 33: 63-
68.
Eirna-Liza N, Saad CR, Hassim HA, Karim M. 2016. The effects of dietary inclusion of
garlic on growth performance and disease resistance of African catfish (Clarias
Page 161
137
gariepinus) fingerlings against Aeromonas hydrophila infection. Journal of
Environmental Biology 37: 817-824.
Fridman S, Sinai T, Zilberg D. 2014. Efficacy of garlic based treatments against
monogenean parasites infecting the guppy (Poecilia reticulata (Peters)). Veterinary
Parasitology 203: 51-58.
Guerreiro I, Serra CR, Enes P, Couto A, Salvador A, Costas B, Oliva-Teles A. 2016a.
Effect of short chain fructooligosaccharides (scFOS) on immunological status and
gut microbiota of gilthead sea bream (Sparus aurata) reared at two
temperatures. Fish & Shellfish Immunology 49: 122-131.
Guerreiro I, Couto A, Machado M, Castro C, Pousão-Ferreira P, Oliva-Teles A, Enes, P.
2016b. Prebiotics effect on immune and hepatic oxidative status and gut morphology
of white sea bream (Diplodus sargus). Fish & Shellfish Immunology 50: 168-174.
Guo JJ, Kuo CM, Hong JW, Chou RL, Lee YH, Chen TI. 2015. The effects of garlic-
supplemented diets on antibacterial activities against Photobacterium damselae
subsp. piscicida and Streptococcus iniae and on growth in Cobia, Rachycentron
canadum. Aquaculture 435: 111-115.
Hassaan MS, Soltan MA. 2016. Evaluation of essential oil of fennel and garlic
separately or combined with Bacillus licheniformis on the growth, feeding
behaviour, hemato-biochemical indices of Oreochromis niloticus (L.) fry. Journal of
Aquaculture Research Development 7: 422-429.
He J, Qiang J, Gabriel NN, Xu P, Yang R. 2015. Effect of feeding-intensity stress on
biochemical and hematological indices of gift tilapia (Oreochromis
niloticus). Turkish Journal of Fisheries & Aquatic Sciences 15: 303-310.
Page 162
138
Houston AH. 1997. Are the classical hematological variables acceptable indicators of
fish health? Transactions of the American Fisheries Society 126: 879-894.
İrkin LC, Yiğit M. 2000. The use of garlic (Allium sativum) meal as a natural feed
supplement in diets for European seabass (Dicentrarchus labrax) juveniles. Journal
of Aquaculture Engineering & Fisheries Research 2: 128-141.
Jelkić D, Opačak A, Horvat D, Safner R. 2014. Common carp fry survival during
salinity stress test: effect of feeding regime-short communication. Veterinarski arhiv
84: 429-438.
Ji SC, Takaoka O, Lee SW, Hwang JH, Kim YS, Ishimaru K, Takii K. 2009. Effect of
dietary medicinal herbs on lipid metabolism and stress recovery in red sea bream
Pagrus major. Fisheries Science 75: 665-672.
Kanani HG, Nobahar Z, Kakoolaki S, Jafarian H. 2014. Effect of ginger-and garlic-
supplemented diet on growth performance, some hematological parameters and
immune responses in juvenile Huso huso. Fish Physiology & Biochemistry 40: 481-
490.
Khalil RH, Nadia BM, Soliman MK. 2001. Effects of Biogen and Levamisol Hcl on the
immune response of cultured Oreochromis niloticus to Aeromonas hydrophila
vaccine. Beni-Suef University Journal of Veterinary Medical 2: 381-392.
Koch HP, Lawson LD. 1996. Garlic: The Science and Therapeutic Application of Allium
sativum L. and Related Species (2nd edn). Baltimore: Williams and Wilkins.
Lee JY, Gao Y. 2012. Review of the application of garlic, Allium sativum, in
aquaculture. Journal of the World Aquaculture Society 43: 447-458.
Lee DH, Lim SR, Han JJ, Lee SW, Ra CS, Kim JD. 2014. Effects of dietary garlic
powder on growth, feed utilization and whole-body composition changes in
Page 163
139
fingerling sterlet sturgeon, Acipenser ruthenus. Asian-Australasian journal of animal
sciences 27: 1303.
Mehrim AI, Khalil FF, Refaey MM. 2014. Evaluation of dietary addition of garlic
(Allium sativum l.) lobes on growth performance, feed utilization, and physiological
responses of Oreochromis niloticus, fingerlings. Abbassa International Journal of
Aquaculture 7: 342-361.
Merrifield DL, Ringo E (Eds). 2014. Aquaculture nutrition: gut health, probiotics and
prebiotics. West Sussex: John Wiley & Sons.
Militz TA, Southgate PC, Carton AG, Hutson KS. 2013. Dietary supplementation of
garlic (Allium sativum) to prevent monogenean infection in aquaculture. Aquaculture
408: 95-99.
Mohan K, Ravichandran S, Muralisankar T, Uthayakumar V, Chandirasekar R, Seedevi
P, Rajan DK. 2019. Application of marine-derived polysaccharides as
immunostimulants in aquaculture: A review of current knowledge and further
perspectives. Fish & Shellfish Immunology 86: 177-1193.
Munir MB, Hashim R, Nor SAM, Marsh TL. 2018. Effect of dietary prebiotics and
probiotics on snakehead (Channa striata) health: Haematology and disease
resistance parameters against Aeromonas hydrophila. Fish & Shellfish Immunology
75: 99-108.
Nya EJ, Austin B. 2011. Development of immunity in rainbow trout (Oncorhynchus
mykiss, Walbaum) to Aeromonas hydrophila after the dietary application of garlic.
Fish & Shellfish Immunology 30: 845-850.
Onomu AJ. 2019. Growth and haematological response of Clarias gariepinus to garlic
(Allium sativum) supplemented diet. Sustainable Agriculture Research 8: 67-73.
Page 164
140
Öz M. 2018. Effects of garlic (Allium sativum) supplemented fish diet on sensory,
chemical and microbiological properties of rainbow trout during storage at −18℃.
LWT-Food Science & Technology 92: 155-160.
Platel K, Srinivasan K. 2004. Digestive stimulant action of spices: a myth or reality?
Indian Journal of Medical Research 119: 167.
Rahman K, Lowe GM. 2006. Significance of garlic and its constituents in cancer and
cardiovascular disease. American Society for Nutrition 136: 736S-740S.
Saleh NE, Michael FR, Toutou MM. 2015. Evaluation of garlic and onion powder as
phyto-additives in the diet of sea bass (Dicentrarcus labrax). The Egyptian Journal
of Aquatic Research 41: 211-217.
Shalaby AM, Khattab YA, Abdel Rahman AM. 2006. Effects of Garlic (Allium sativum)
and chloramphenicol on growth performance, physiological parameters and survival
of Nile tilapia (Oreochromis niloticus). Journal of Venomous Animals and Toxins
including Tropical Diseases 12: 172-201.
Song SK, Beck BR, Kim D, Park J, Kim J, Kim HD, Ringø E. 2014. Prebiotics as
immunostimulants in aquaculture: a review. Fish & Shellfish Immunology 40: 40-48.
Talpur AD, Ikhwanuddin M. 2012. Dietary effects of garlic (Allium sativum) on
haemato-immunological parameters, survival, growth, and disease resistance against
Vibrio harveyi infection in Asian sea bass, Lates calcarifer (Bloch). Aquaculture
364: 6-12.
Thanikachalam K, Kasi M, Rathinam X. 2010. Effect of garlic peel on growth,
hematological parameters and disease resistance against Aeromonas hydrophila in
African catfish Clarias gariepinus (Bloch) fingerlings. Asian Pacific Journal of
Tropical Medicine 3: 614-618.
Page 165
141
Yang F, Zuo XW, Zhang YH, Liang J, Li KW, Liu JL, Zhang GF. 2010. The effects of
garlic extract on early growth and development of Manila clam Ruditapes
philippinarum. Acta Ecologica Sinica 30: 989-994.
Yoo M, Lee S, Lee S, Seog H, Shin D. 2010. Validation of high-performance liquid
chromatography methods for determination of bioactive sulfur compounds in garlic
bulbs. Food Science & Biotechnology 19: 1619-1626.
Zeitoun IH, Ullrey DE, Magee WT, Gill JL, Bergen WG. 1976. Quantifying nutrient
requirements of fish. Journal of the Fisheries Board of Canada 33: 167-172.
Page 166
142
CHAPTER FIVE: THE EFFECTS OF DIETARY GARLIC (ALLIUM
SATIVUM) AND ALOE VERA POLYSACCHARIDES (1:1
MIXTURES) SUPPLEMENTATION ON GROWTH,
HAEMATOLOGICAL PARAMETERS, WHOLE BODY
COMPOSITION, AND SURVIVAL AT LOW PH IN AFRICAN
CATFISH (CLARIAS GARIEPINUS) JUVENILES
Abstract
This experiment evaluated the effects of dietary Allium sativum and Aloe vera
polysaccharides 1:1 mixture on growth performance, feed utilization, haematological
parameters, resistance against low water pH, and whole body composition of African
catfish (Clarias gariepinus) juveniles. Fish (intial weight, 12.28 1.26 g) were divided
into five triplicate groups before being fed diets supplemented with 0% (control), 0.5%,
1.0%, 2.0% and 4.0% A. vera and A. sativum polysaccharides mixture (1:1 ratio). Fish
fed 1.0% A. vera-A. sativum mixture supplemented diet had a significant increase in
growth (FW = 90.60 3.98 g, WG = 78.32 3.98 g, SGR = 3.33 0.07 g, and AGR =
1.24 0.08), compared to those fed a control (P < 0.05). Similarly, feed utilization
indices were significantly improved in fish fed the 1.0% A. vera-A. sativum mixture
supplemented diet when compared to all other dietary groups (P < 0.05). The optimum
dietary A. vera-A. sativum mixture inclusion level was estimated to be 0.70%, and
0.66% for growth and feed utilization respectively. Overall, the A. vera-A. sativum
mixture improved haematological indices when compared to unsupplemented fish. Fish
fed 1.0% of A. vera-A. sativum mixture had the highest survival probability (90%, 80%,
70% post 24h, 48h, and 72h, respectively) throughout the low water pH (5.2-5.5)
challenge period. Moreover, significantly lower lipid contents (%) were reported in fish
fed diets supplemented with the 2.0% (6.69 0.36), 4.0% (7.18 0.24), and 1.0% (7.44
0.29) A. vera-A. sativum mixture than those fed a control diet (9. 31 0.71) (P < 0.05).
Page 167
143
In conclusion, A. vera-A. sativum polysaccharides mixture (1:1) is recommended as feed
supplements in C. gariepinus juvenile culture.
Keywords: Aquaculture, Clarias gariepinus, Herbal mixtures, Immunostimulants,
Stress resistance.
Page 168
144
5.1 Introduction
In aquaculture, medicinal herbal extracts could either be studied alone (individual herb
incorporated in the basal fish diet) or in combination (as mixture) with other medicinal
herbs. Although positive benefits for individual herbs have been widely reported in
farmed fish, synergistic/additive benefits were also unveiled when herbs were studied in
combination. For instance, Ji et al. (2007a) reported the highest growth, immune
response, and resistance of Pagrus major against Vibrio anguillarum after being fed a
diet supplemented with a mixture of Messa medicate, Crataegi fructus, Artemisia
capillaries, and Cnidium officinale herbs (combination ratio 2:2:1:1) compared to those
fed a mono-herbal supplemented diet, and control. The same was reported in
Paralichthy olivaceus juveniles (Ji et al. 2007b) supplemented with the same herbs as
demonstrated in (Ji et al. 2007a). Furthermore, a dietary mixture of Astragalus
membranaceus and Lonicera japonica (combined in equal proportions, 1:1 ratio) in
Oreochromis niloticus culture (Ardo et al. 2008), and a dietary mixture of A. radix and
Ganoderma lucidum (1:1) in Cyprinus carpio (Yin et al. 2009) reported to evoke a
significantly higher immune response activity and better protection against Aeromonas
hydrophila pathogenic bacterium than the control. In the same line, a dietary mixture of
the Chinese herbs supplemented at different levels (4, 8, 12, 16, and 20 g /kg diet)
significantly improved growth performance, increased digestive enzyme activity, and
enhanced immune response in Lateolabrax japonicus juveniles compared to the control,
with the optimum dosage estimated between 8 and 12g /kg diet (Wang et al. 2018). The
use of medicinal herbal mixtures seems to be another approach that can maximize the
benefits associated with herbs in aquaculture.
Page 169
145
Currently, no study has attempted to investigate the potential effects of garlic (A.
sativum) and Aloe vera extract mixtures in aquaculture. However, reports on each herb’s
individual mixture with other herbs or natural products exist, and support the
observation that the benefits of herbal extracts in fish could be amplified when
administered as mixtures. A dietary mixture of garlic, ginger, and thyme (in a 1:1:1
ratio, at 1.0%/kg diet) was reported to significantly improve growth, overall health, and
resistance of Sparidentex hasta fry against Photobacterium damselae (Jahanjoo et al.
2018). Positive synergistic effects of different garlic extracts mixed with other herbal
extracts were also reported in O. niloticus (Abu-Elala et al. 2016; Hassan and Soltan
2016), Dicentrarchus labrax (Yılmaz et al. 2012; Yilmaz and Ergün 2012), and
Litopenaeus vannamei (Huang et al. 2018). Similarly, dietary A. vera combined with
Strobilanthes crispus, and Vitex trifolia extracts in a ratio of 1:1:1, at a dosage of 3.5
g/kg diet was reported to significantly enhance growth, health and tolerance against
Streptococcus agalactiae of red hybrid tilapia (Oreochromis sp.) (Manaf et al. 2016). In
the same vein, a mixture of A. vera and a natural product (propolis) was reported to
improve health parameters in O. niloticus (Dotta et al. 2014, 2018). Hence, this present
experiment was designed to evaluate the combined effects of dietary A. vera and A.
sativum crude polysaccharides supplementation (at a 1:1 ratio) on growth, feed
utilization, haematological indices, whole body composition, and survival at low water
pH in African catfish, C. gariepinus juveniles.
Page 170
146
5.2 Materials and methods
5.2.1 Preparation of experimental diets
A basal diet containing 31.20% crude protein, 17.82 KJ/g gross energy, and 5.12% lipid
(Table 5.1) was used as a control diet. Four basal diets were supplemented with a
mixture containing equal amounts (1:1) of A. vera and A. sativum polysaccharides crude
extracts (A. vera-A. sativum mixture) at different inclusion levels (0.5, 1.0, 2.0, and
4.0%). The A. vera polysaccharides crude extract (30%) was a solvent-extracted and
lyophilized commercial product (powder) purchased from Ningxia SangNutrition
Biotech Inc., China, which consisted of acemannan, glucomannan, saponin, glycosides,
galactan, mannose, aloin, and emodin. Garlic was also a solvent-extracted and
lyophilized product (powder), which consisted of galactose, rhamnose, glucoronic acid,
galacturonic acid, allicin, and alliin (commercial product from Shaanxi Fuheng
Biotechnology, Co. Ltd, China). The procedures for manufacturing the experimental
diets were similar to those explained in chapter 3 (section 3.2.1) and in chapter 4
(section 4.2.1).
Page 171
147
aVitamin premix (g or IU kg-premix); thiamine, 5; riboflavin, 5; niacin, 25; folic acid, retinol palmitate, 500,000 IU;1;
pyridoxine, 5; cyanocobalamin, 5; cholecalciferol; 50,000 IU; a-tocopherol, 2.5; menadione, 2; inositol, 25;
pantothenic acid, 10; ascorbic acid, 10; choline chloride, 100; biotin, 0.25. bMineral premix (g kg-1): KH2PO4, 502; MgSO4. 7H2O, 162; NaCl, 49.8; CaCO3, 336; Fe (II) gluconate, 10.9;
MnSO4.H2O, 3.12; ZnSO4. 7H2O, 4.67; CuSO4. 5H2O, 0.62; KI, 0.16; CoCl2. 6H2O, 0.08; ammonium molybdate,
0.06; NaSeO3, 0.02.
Table 5.1 Formulation and composition of the experimental diets (%/100 g dry
matter).
Ingredients
Dietary groups
1 2 3 4 5
Fish meal (60% CP) 28.50 28.50 28.50 28.50 28.50
Cow peas (25% CP) 22.50 22.50 22.50 22.50 22.50
Corn grain (10.2% CP) 8.40 8.40 8.40 8.40 8.40
Wheat flour (11.7% CP) 13.90 13.90 13.90 13.90 13.90
Pearl millet (12.5% CP) 22.70 22.70 22.70 22.70 22.70
Vegetable oil 3.00 3.00 3.00 3.00 3.00
Vitamin premixa 0.50 0.50 0.50 0.50 0.50
Mineral premixb 0.50 0.50 0.50 0.50 0.50
Total 100 .00 100.00 100 .00 100 .00 100.00
A. vera-A. sativum (1:1) 0.00 0.50 1.0 0 2.00 4.00
Proximate composition (%)
Dry matter 92.77 91.79 91.68 91.72 91.79
Crude protein 31.20 31.23 31. 26 31. 22 31.21
Crude lipid 5.12 5.10 5.14 5.22 5.15
Ash 4.75 4.69 4.72 4.79 4.81
Gross energy (KJ/g diet) 17.82 17.84 17.83 17.81 17.83
Page 172
148
5.2.2 Fish and experimental design
African catfish, C. gariepinus (body weight 12.28 1.26 g, the same group of fish used
in Chapter 4) were sourced from Onavivi Aquaculture Center (OAC) (government fish
farm, Namibia). The fish were managed in the same way as described in chapter 3,
section 3.2.1. After seven days, fish were randomly distributed into five groups that were
replicated three times at a stocking density of 20 fish per replicate, in a 0.18m3 tank
each, supplied with 150L of dechlorinated freshwwater. Each triplicate group
represented a feeding group including a control (no herbal mixture), and A. vera and
garlic extracts mixture-supplemented groups (0.5, 1.0, 2.0, and 4.0%). These diets were
administered three times a day (09:00; 13: 00; 17:00), 6 days a week until apparent
satiation for 60 days. Continuous aeration, a natural photoperiod (12-h light/12-h dark
cycles), and biweekly water exchange (2/3) was maintained during the experimental
period. DO (4.90 0.31 mg/L), and water temperature (27.29 0.97℃) was monitored
once daily, whiel pH (6.90 0.07), and ammonia concentration were monitored on a
weekly basis; the later was undetectable. This experiment was conducted according to
the scientific research protocols of the University of Namibia, and had complied with all
relevant local and international animal welfare laws, guidelines and policies (Appendix
D).
5.2.3 Growth and feed utilization parameters
The growth and feed utilization parameters assessed in this experiment were the same as
those studied and explained in Chapter 3, Section 3.2.3 in this thesis.
Page 173
149
5.2.4 Haematological parameters
The haematological parameters were evaluated as described in Chapter 3, Section 3.2.4
in this thesis.
5.2.5 Proximate composition analysis
Proximate composition analysis was carried out as indicated in chapter 3, Section 3.3.4
in this thesis.
5.2.6 Low pH stress challenge experiment
The pH stress challenge was carried out as described in chapter 3, Section 3.2.6, and
Chapter 4, Section 4.2.6. During this experiment pH (5.2 - 5.5), water temperature (29
1.5℃), DO (> 4.60 mg/L), and NH3-N concentration (< 0.05 mg/L) were monitored
daily.
5.2.7 Statistical analysis
Data were statistically analyzed using descriptive statistics in SPSS (version 21, IMB
Corp, Armonk, NY, USA). Normality and homogeneity of variance were confirmed
using Kolmogorov-Smirnov and Levene’s test, respectively. One-way analysis of
variance (ANOVA) was used to study the treatment effects. Significant differences
between the group means were further compared using Duncan’s Multiple Range Test
(DMRT). P < 0.05 was considered statistically significant. The dietary A. vera-A.
sativum mixture optimum requirement for C. gariepinus juveniles was estimated by the
broken-line regression analysis model (y1 = b0 + bx, if x ≤ requirement; y2 = b0 + bx, if
x ≥ requirement) (Robbins et al. 1979). The survival (%) of fish in each treatment group
Page 174
150
for low pH challenge was estimated using Kaplan-Meier analysis (Jelkić et al. 2014).
Breslow (generalized Wilcoxon), Tarone-ware, and log-rank (Mantel-cox) were used to
determine the significant difference between groups at each sampling interval of the pH
challenge (P < 0.05).
5.3 Results
5.3.1 Growth and feed utilization parameters
The dietary A. vera-A. sativum mixture had a significant effect on the growth and feed
utilization parameters of C. gariepinus juveniles post 60 d administration (P < 0.05). FW
(90.60 3.98 g), WG (78.32 3.98 g), SGR (3.33 0.07 g), and AGR (1.24 0.08 g)
were significantly higher in fish fed diets supplemented with 1.0% A. vera-A. sativum
mixture when compared to those fed a control (P < 0.05) (Figure 5.1). Fish fed 0.5%
(2.29 0.17%) and 1.0% (2.04 0.05%) A. vera-A. sativum mixture supplemented diet
registered a significantly higher HSI compared to all other groups (P < 0.05) (Table 5.2).
Viscerosomatic index was significantly higher in fish fed 4.0% (8.71 0.92%) (followed
by those fed) 0.5% (7.45 0.42%), and 2.0% (7.36 0.38%), when compared to those
fed a control diet (P < 0.05) (Table 5.2). Dietary A. vera-A. sativum mixture had no
significant effect on CF and survival of C. gariepinus juveniles during the feeding trial
(P > 0.05) (Table 5.2).
Furthermore, the dietary A. vera-A. sativum mixture significantly improved feed
utilization indices such as FCR (1.26 0.07), FER (0.80 0.04), and PER (1.92 0.01)
at 1.0% inclusion level compared to all other groups (P < 0.05) (Figure 5.2A). The
Page 175
151
optimum dietary A. vera-A. sativum mixture inclusion level was estimated to be 0.70%
and 0.66% /kg diet for growth (WG: y1 =6.72x + 56.27, R2 = 0.36; y2 = -1.28x +61.88,
R2 = 0.12), and feed utilization (FER: y1 = 0.07x + 0.57, R2 = 0.33; y2 = -0.0047x +
0.62, R2 = 0.03), respectively (Figure 5.1, 5.2).
Figure 5.1 Final weight (FW) (A), weight gain (WG) (B), Specific growth rate (SGR)
(C), and absolute growth rate (AGR) (D) of African catfish, C. gariepinus juveniles fed
four A. vera-A. sativum polysaccharide mixture (1:1) supplemented diets and an
0
20
40
60
80
100
Dietary A.vera-A.sativum mixture (%/kg diet)
FW (g
)
abb
c
aa
0
20
40
60
80
100
Dietary A.vera-A.sativum mixture (%/kg diet)
WG
(g)
Control0.5%1.0%2.0%4.0%
abb
c
aa
0
1
2
3
4
Dietary A.vera-A.sativum mixture (%/kg diet)
SGR
(%/d
ay)
ab bc
a a
0.0
0.5
1.0
1.5
Dietary A.vera-A.sativum mixture (%/kg diet)
AG
R (g
/day
)
abbc
c
aa
A
B
CD
Dietary A. vera-A. sativum mixture (%) Dietary A. vera-A. sativum mixture (%)
Dietary A. vera-A. sativum mixture (%) Dietary A. vera-A. sativum mixture (%)
Page 176
152
unsupplemented diet (control) for 60 d. Different lower case letters denote a significant
difference between dietary groups (P < 0.05).Values were expressed as mean standard
error. WG: y1 =6.72x + 56.27, R2 = 0.36; y2 = -1.28x +61.88, R2 = 0.12 (broken-line
regression model).
Page 177
153
Dietary A. vera inclusion level (%)
Parameters Control 0.5 1.0 2.0 4.0
VSI 5.38 0.45a 7.45 0.42bc 6.01 0.30ab 7.36 0.37bc 8.71 0.92c
HSI 1.66 0.11a 2.59 0.17bc 2.59 0.11c 2.04 0.04ab 2.04 0.09a
CF 0.57 0.02ab 0.52 0.01a 0.65 0.03b 0.65 0.02ab 0.59 0.05ab
Survival 100 0.00 a 100 0.00 a 100 0.00 a 100 0.00 a 100 0.00 a
Data are expressed as mean ± standard error (M ± SE). Values with different superscript letters in the same row are not significantly different (P > 0.05) from the control. Where VSI = viscerosomatic index, HSI = hepatosomatic index, and CF = condition factor.
Table 5.2 Organo-somatic indices, condition factor, and survival (%) of the African
catfish, C. gariepinus fingerlings fed four A. vera-A. sativum polysaccharide mixture
(1:1) supplemented diets and a control for 60 d.
Page 178
154
Figure 5.3 Feed intake (FI) (A), feed conversion ratio (FCR) (B), feed efficiency ratio
(FER) (C), and protein efficiency ratio (PER) (D) of the African catfish, C. gariepinus
juveniles fed four A. vera-A. sativum polysaccharide mixture (1:1) supplemented diets
and an unsupplemented diet (control) for 60 d. Values were expressed as mean
standard error. Different lower case letters denote a significant difference between
dietary groups (P < 0.05). FER: y1 = 0.07x + 0.57, R2 = 0.33; y2 = -0.0047x + 0.62, R2 =
0.03 (broken-line regression model).
5.3.2 Haematological parameters
In all haematological parameters (RBC, hematocrits, hemoglobin, PLT, MCV, MCH,
MCHC, RDWa, WBC, lymphocytes, monocytes, and granulocytes) (Figures 5.3, 5.4,
5.5), a significant increase was only presented in RBC and PLT (Figure 5.3) (P < 0.05).
0
50
100
150
Dietary A.vera-A.sativum mixture (%/kg diet)
FI (g
)
0.0
0.5
1.0
1.5
2.0
Dietary A.vera-A.sativum mixture (%/kg diet)
FCR
ab
a
bc cbc
Control0.5%1.0%2.0%4.0%
0.0
0.2
0.4
0.6
0.8
1.0
Dietary A.vera-A.sativum mixture (%/kg diet)
FER
abb
c
ab a
0
1
2
3
Dietary A.vera-A.sativum mixture (%/kg diet)
PE
R
abb
c
ab a
A B
C D
Dietary A. vera-A. sativum mixture (%) Dietary A. vera-A. sativum mixture (%)
Dietary A. vera-A. sativum mixture (%) Dietary A. vera-A. sativum mixture (%)
Page 179
155
Fish fed the 1.0% A. vera-A. sativum mixture supplemented diet presented a
significantly higher RBC (1.92 0.06) when compared to unsupplemented ones (1.40
0.15) (P < 0.05). Platelets significantly increased in fish fed the 2.0% A. vera-A. sativum
mixture supplemented diet (38.17 4.13) when compared to those fed a control diet
(20.67 3.76) (P < 0.05).
Page 180
156
Figure 5.3 Red blood cell counts (RBC) (A), hematocrits volume (B), hemoglobin
concentration (C), and platelet counts (PLT) (D) of African catfish, C. gariepinus
juveniles fed four A. vera-A. sativum polysaccharide mixture (1:1) supplemented diets
and an unsupplemented diet (control) for 60 d. Different lower case letters denote a
significant difference between dietary groups (P < 0.05); Values were expressed as mean
standard error.
0.0
0.5
1.0
1.5
2.0
2.5
Dietary A.vera-A.sativum mixture (%/kg diet)
RBC
(1012
/L) a
ab
b
abab
0.0
0.1
0.2
0.3
Dietary A.vera-A.sativum mixture (%/kg diet)
Hem
atoc
rits
(L/L
)
Control0.5%1.0%2.0%4.0%
aa
aa
a
0
50
100
150
Dietary A.vera-A.sativum mixture (%/kg diet)
Hem
oglo
bin
(g/L
) a a
a
a a
0
10
20
30
40
50
Dietary A.vera-A.sativum mixture (%/kg diet)
PLT
(109 /L
)a
ab
ab
b
ab
A
B
C D
Dietary A. vera-A. sativum mixture (%) Dietary A. vera-A. sativum mixture (%)
Dietary A. vera-A. sativum mixture (%) Dietary A. vera-A. sativum mixture (%)
Page 181
157
Figure 5.4 Mean corpuscular volume (MCV) (A), mean corpuscular hemoglobin level
(MCH) (B), mean corpuscular hemoglobin concentration (MCHC) (C), and red blood
cell distribution width (RDWa) (D) of African catfish, C. gariepinus fingerlings fed four
A. vera-A. sativum polysaccharide mixture (1:1) supplemented diets and an
unsupplemented diet (control) for 60 d. Different lower case letters denote a significant
difference between dietary groups (P < 0.05). Values were expressed as mean standard
error.
0
50
100
150
Dietary A.vera-A.sativum mixture (%/kg diet)
MC
V (L
/cel
l)
0
20
40
60
80
Dietary A.vera-A.sativum mixture (%/kg diet)
MC
H (f
mol
/cel
l)
Control0.5%1.0%2.0%4.0%
ab aba
b b
0
200
400
600
Dietary A.vera-A.sativum mixture (%/kg diet)
MC
HC
(g/L
)
0
50
100
150
Dietary A.vera-A.sativum mixture (%/kg diet)
RD
Wa
(fl/c
ell)
A B
CD
Dietary A. vera-A. sativum mixture (%) Dietary A. vera-A. sativum mixture (%)
Dietary A. vera-A. sativum mixture (%) Dietary A. vera-A. sativum mixture (%)
Page 182
158
Figure 5.5 White blood cell (WBC) (A), lymphocyte (B), monocyte (C), and
granulocyte (D) counts of African catfish, C. gariepinus fed four A. vera-A. sativum
polysaccharide mixture (1:1) supplemented diets and an unsupplemented diet (control)
for 60 d. Different lower case letters denote a significant difference among dietary
groups (P < 0.05). Values were expressed as mean standard error.
5.3.3 Low pH stress challenge experiment
Fish survival was significantly affected by dietary groups (P < 0.05) at 24h, 48h, and
72h post low pH challenge, based on the Breslow (generalized Wilconxon, P = 0.035),
Tarone-ware (P = 0.007), and log-rank (Mantel-cox, P = 0.007) tests (Figure. 5.6). Fish
fed 1.0% A. vera-A. sativum mixture supplemented diet had the highest survival
probability (90%, 80%, 70%, post 24h, 48h, and 72h, respectively) throughout the
0
20
40
60
80
Dietary A.vera-A.sativum mixture (%/kg diet)
WB
C (1
09 /L)
0
10
20
30
40
Dietary A.vera-A.sativum mixture (%/kg diet)
Lym
phoc
ytes
(109 /L
)
Control0.5%1.0%2.0%4.0%
0
1
2
3
Dietary A.vera-A.sativum mixture (%/kg diet)
Mon
ocyt
es (1
09 /L)
0
1
2
3
4
Dietary A.vera-A.sativum mixture (%/kg diet)
Gra
nulo
cyte
s (1
09 /L)
A B
C D
Dietary A. vera-A. sativum mixture (%) Dietary A. vera-A. sativum mixture (%)
Dietary A. vera-A. sativum mixture (%) Dietary A. vera-A. sativum mixture (%)
Page 183
159
challenge period. The lowest survival probabilities were presented in fish fed 4.0% (40%
post 48h, and 15% post 72h) followed by those fed 2.0% (50% post 48h, and 28% post
72h). Survival probability was intermediate in fish fed 0.5% (72% post 48h, and 58%
post 72h) and a control diet (62% post 48h, and 40% post 72h) throughout the challenge
experiment.
Figure 5.6 Kaplan-Meier: low pH challenge survival probability of African catfish, C.
gariepinus fingerlings fed four A. vera-A. sativum polysaccharide mixture (1:1)
supplemented diets and an unsupplemented diet (control) for 60 d.
5.3.4 Proximate body composition
The dietary A. vera-A. sativum mixture had no significant (P > 0.05) effect on moisture,
protein, and ash % of C. gariepinus juveniles (Table 5.3). A significantly lower lipid
Page 184
160
content was observed in fish fed 2.0% (6.69 0.36), 4.0% (7.18 0.24) and 1.0% (7.44
0.29) of the mixture when compared to the control (9.31 0.71) (P < 0.05).
Values (Mean ± Standard Error, M±SE) within the same row with the same superscripts letters are not significantly different (P < 0.05).
5.4 Discussion
In the current study, some growth and feed utilization parameters improved in fish fed A.
vera-A. sativum polysaccharide mixture supplemented diets compared to those fed a
control, and the optimum inclusion level ranged between 0.5% and 1.0%, but was
mostly 1.0%. This is the first study reporting A. vera and A. sativum herbal mixture as a
dietary supplement in fish. The findings are in accordance with previous studies, which
reported A. vera or A. sativum as a single extract or a mixture with other herbs. A. vera
as a single dietary supplement was reported to have increased growth in C. gariepinus
Table 5.3 Selected whole body composition parameters of African catfish, C. gariepinus
juveniles fed four A. vera-A. sativum polysaccharide mixture (1:1) and an un-
supplemented diet (control) for 60 d.
Dietary A. vera-A. sativum mixture inclusion level (%)
Parameters Control 0.5 1.0 2.0 4.0
Moisture (%) 72.30 0.06a 72.79 0.40a 72.04 0.34a 72.06 0.63a 72.77 0.87a
Protein (%) 70.75 0.99a 73.70 1.92a 72.88 0.60a 76.50 3.11a 75.70 2.06a
Lipid (%) 9.31 0.71c 8.27 0.33bc 7.44 0.29ab 6.69 0.36a 7.18 0.24a
Ash (%) 5.68 0.60a 6.99 0.55a 6.33 0.97a 6.98 0.90a 7.29 0.20a
Page 185
161
(Ibidunni et al. 2018), C. carpio (Mahdavi et al. 2013), Oncorhynchus mykiss (Heidarieh
et al. 2013), and GIFT-O. niloticus (Gabriel et al. 2015). Increased growth was also
reported in O. niloticus juveniles after being fed a diet supplemented with a herbal
mixture comprised of A. vera, S. crispus, and V. trifolia powder, combined in equal
proportions (1:1:1 ratio) (Manaf et al. 2016). Furthermore, A. sativum as an individual
dietary growth promoter supplement has been widely reported in fish (Thanikachalam et
al. 2010; Talpur and Ikhwanuddin 2012; Mehrim et al. 2014; Hassaan and Soltan 2016;
Büyükdeveci et al. 2018). In the same vein, a dietary mixture of A. sativum and
Spirulina platensis increased weight gain and specific growth rate, and improved the
feed conversion ratio and the protein efficiency ratio in O. niloticus compared to a
control (Abu-Elala et al. 2016). Moreover, higher growth and better feed utilization
parameters were reported in S. hasta fry after being fed diets supplemented with herbal
mixtures of A. sativum, Zingiber officinale, and Thymus vulgaris for eight weeks
compared to a control (Jahanjoo et al. 2018).
Allium sativum and A. vera have been reported to have had no effect on the growth of
fish after a short feeding duration (Labrador et al. 2016; Huang et al. 2018) or at high
dietary inclusion levels (Mehrim et al. 2014; Gabriel et al. 2015). Accordingly, Liu et al.
(2010) reported poor growth in Macrobrachium rosenbergii after being fed diets
supplemented with anthraquinones extracts for four weeks, but significant growth
improvement was only presented after six weeks when compared to a control.
Gabriel et al. (2015) also reported that 4.0% A. vera supplemented diets had no
significant effect on the growth of GIFT-O. niloticus juveniles. The same inclusion level
Page 186
162
(highest dosage, 4.0%) had no significant effect on the growth performance of C.
gariepinus juveniles compared to the control, in the present study.
The improvement of some haematological parameters in fish fed the A. vera-A. sativum
mixture supplemented diets observed in the present study is supported by several
studies, which have reported them as single supplements or individually mixed with
other herbs. Significantly higher haematological parameters were reported in C.
gariepinus fingerlings after being fed a diet supplemented with A. vera leaves paste for
12 wks (Ibidunni et al. 2018) compared to a control. Improved haematological
parameters were also reported in GIFT-O. niloticus fed diets supplemented with 100%
A. vera powder (Gabriel et al. 2015). A mixture of A. vera, V. trifolia, and S. crispus has
also been reported to significantly increase haematological parameters of red hybrid
tilapia (Oreochromis sp.) post 60 days administration compared to a control (Manaf et
al. 2016). Furthermore, haematological parameters of O. mykiss (Nya and Austin 2011;
Esmaeili et al. 2017), O. niloticus (Shalaby et al. 2006; Aly and Mohamed 2010) Lates
calcarifer (Talpur and Ikhwanuddin 2012), and Labeo rohita (Sahu et al. 2007)
improved after being fed diets supplemented with A. sativum alone compared to a
control.
Combining A. sativum with other herbs has also been reported to greatly improve
haematological parameters in fish compared to a control. For instance, a dietary mixture
of A. sativum, Z. officinale, and T. vulgaris was reported to significantly increase RBC
and WBC in S. hasta fry when compared to a control (Jahanjoo et al. 2018). Yilmaz and
Ergün (2012) observed that D. labrax juveniles supplemented with a dietary mixture of
Page 187
163
garlic and ginger oil had the highest RBC and Hct, Hb, MCV, MCH, and MCHC when
compared to those fed a control and diets separately supplemented with garlic or ginger.
This is an indication that there are benefits in combining herbal extracts in fish feed as
also shown in the present study.
Currently, there are limited studies that have demonstrated the mechanisms of action of
herbal extracts as supplements in animals. Previous studies attributed the improved
growth parameters, health parameters, and increased resistance against stress in fish
following herbal extracts supplementation to their nutritional compositions as well as
their non-nutritional factors (Lee and Gao 2012; Tremaroli and Backhed 2012; Zahran et
al. 2014). Ji et al. (2007a) indicated that mixed herbs happen to evoke better beneficial
synergistic effects in animals as demonstrated in the current study, because they may
complement one another in terms of nutrients and other medicinal properties. Moreover,
polysaccharides (prebiotics) present both in A. vera (Hamman 2008; Gupta and
Malhotra 2012), and A. sativum (Kallel et al. 2015; Li et al. 2017) are some of the non-
nutritional factors that have been reported to possess growth and health promoting
properties in animals (Song et al. 2014; Mohan et al. 2019). Combining polysaccharides
of different nature (acemannan, glucomannan, galactan, and mannose from A. vera, and
galactose, rhamnose, glucoronic acid, and galacturonic acid from A. sativum) in fish diet
as demonstrated in this study, might additively improve gut microbial community as
well as the host’s health (Patel and Srinivasan 2004; Citarasu 2010; Tremaroli and
Backhed 2012) using mechanisms explained by Chen et al. (2003) and Yu et al. (2018).
Page 188
164
In addition to polysaccharides, the improved growth and health of C. gariepinus
juveniles in the present study, could be a result of additive effects of allicin from A.
sativum and emodin from A. vera. Allicin, as indicated in Chapter 4, has the ability to
improve feed utilization in fish by enhancing gastrointestinal motility, and modulating
secretion of various digestive enzymes (Lee and Gao 2012). It also promotes the
performance of intestinal flora, inhibits deleterious bacteria while intensifying beneficial
bacteria, hence improving energy utilization, growth and health of the host (Diab et al.
2008). Similarly, emodin has been reported to enhance innate immune response,
antioxidation, and increase disease resistance in fish (Devi et al. 2019). Moreover,
growth and health of fish fed diets supplemented with herbs could also be attributed to
their ability to promote lipid metabolism via increased bile production (Yilmaz et al.
2012), which spare protein for growth, and lead to the repression of lipid accumulation
(Ji et al. 2009). Thus, fish muscle quality (i.e. low lipid) would be improved, as
demonstrated in the current study.
On the contrary, medicinal herbs including A. vera (Taiwo et al. 2005; Gabriel et al.
2015) and A. sativum (Yang et al. 2010) may be harmful to fish and even deadly, at high
dosages (Palanisamy et al. 2011). The premise was true when C. gariepinus juveniles
were fed a diet supplemented with the highest inclusion level of A. sativum
polysaccharides (4.0% /kg diet) (as demonstrated in Chapter 4 of this thesis). In
agreement, the present study observed that the highest dosage (4% A. vera-A. sativum
mixture) had negative effects on the resistance of C. gariepinus juveniles against low
water pH. Administration of herbal extracts at higher dosage and over a long period of
time may lead to a number of issues such as immune suppression (Sakai 1999), reduced
Page 189
165
effectiveness (Harikrishnan et al. 2011), and overstimulation of the immune systems
which affects the normal metabolic activities (Talpur and Ikhwanuddin 2013). Thus,
resulting in fish that are unable to cope with physiologhical stress as domstrated in the
current study.
In conclusion, this study demonstrated that A. vera and A. sativum polysaccharides can
be used in mixture for synergistic beneficial growth, feed utilization, health, and meat
quality effects in African catfish, C. gariepinus juveniles. The dietary A. vera-A. sativum
mixture inclusion level between 0.70% and 0.66% was estimated optimal to support
growth and feed utilization in C. gariepinus juveniles.
Further studies should focus on using purified A. vera and A. sativum extracts. Extracts
should be combined in different ratios and compared directly with using the extracts
individually. The effects of the extracts on digestive enzymes as well as intestinal the
fish bacterial community in addition to biometric and immunological parameters should
also be tested. The relationship between time of administration and the effectiveness of
the herbal extracts in fish also needs to be established.
Page 190
166
5.5 References
Abu-Elala NM, Galal MK, Abd-Elsalam RM, Mohey-Elsaeed O, Ragaa NM. 2016.
Effects of dietary supplementation of Spirulina platensis and garlic on the growth
performance and expression levels of immune-related genes in Nile tilapia
(Oreochromis niloticus). Journal of Aquaculture Research & Development 7: 2.
Aly SA, Mohamed MF. 2010. Echinacea purpurea and Allium sativum as
immunostimulants in fish culture using Nile tilapia (Oreochromis niloticus). Journal
of Animal Physiology & Animal Nutrition 94: 31-39.
Ardó L, Yin G, Xu P, Váradi L, Szigeti G, Jeney Z, Jeney G. 2008. Chinese herbs
(Astragalus membranaceus and Lonicera japonica) and boron enhance the non-
specific immune response of Nile tilapia (Oreochromis niloticus) and resistance
against Aeromonas hydrophila. Aquaculture 275: 26-33.
Büyükdeveci ME, Balcázar JL, Demirkale İ, Dikel S. 2018. Effects of garlic-
supplemented diet on growth performance and intestinal microbiota of rainbow trout
(Oncorhynchus mykiss). Aquaculture 486: 170-174.
Chen HL, Li DF, Chang BY, Gong LM, Dai JG, Yi GF. 2003. Effects of Chinese herbal
polysaccharides on the immunity and growth performance of young broilers. Poultry
Science 82: 364-370.
Citarasu T. 2010. Herbal biomedicines: a new opportunity for aquaculture
industry. Aquaculture International 18: 403-414.
Devi G, Harikrishnan R, Paray BA, Al-Sadoon MK, Hoseinifar SH, Balasundaram C.
2019. Effects of aloe-emodin on innate immunity, antioxidant and immune cytokines
Page 191
167
mechanisms in the head kidney leucocytes of Labeo rohita against Aphanomyces
invadans. Fish & Shellfish Immunology 87: 669-678.
Diab AS, Aly SM, John G, Abde-Hadi Y, Mohammed MF. 2008. Effect of garlic, black
seed and Biogen as immunostimulants on the growth and survival of Nile tilapia,
Oreochromis niloticus (Teleostei: Cichlidae), and their response to artificial
infection with Pseudomonas fluorescens. African Journal of Aquatic Science 33: 63-
68.
Dotta G, de Andrade JIA, Garcia P, Jesus GFA, Mouriño JLP, Mattos JJ, Martins ML.
2018. Antioxidant enzymes, hematology and histology of spleen in Nile tilapia fed
supplemented diet with natural extracts challenged with Aeromonas hydrophila. Fish
& Shellfish Immunology 79: 175-180.
Dotta G, de Andrade JIA, Gonçalves ELT, Brum A, Mattos JJ, Maraschin M, Martins
ML. 2014. Leukocyte phagocytosis and lysozyme activity in Nile tilapia fed
supplemented diet with natural extracts of propolis and Aloe barbadensis. Fish &
Shellfish Immunology 39: 280-284.
Esmaeili M, Kenari AA, Rombenso A. 2017. Immunohematological status under acute
ammonia stress of juvenile rainbow trout (Oncorhynchus mykiss Walbaum, 1792)
fed garlic (Allium sativum) powder-supplemented meat and bone meal-based
feeds. Comparative Clinical Pathology 26: 853-866.
Gabriel NN, Qiang J, He J, Ma XY, Kpundeh MD, Xu P. 2015. Dietary Aloe vera
supplementation on growth performance, some haemato-biochemical parameters and
disease resistance against Streptococcus iniae in tilapia (GIFT). Fish & Shellfish
Immunology 44: 504-514.
Page 192
168
Gupta VK, and Malhotra S. 2012. Pharmacological attribute of Aloe vera: Revalidation
through experimental and clinical studies. Ayu 33: 193.
Hamman J. 2008. Composition and applications of Aloe vera leaf gel. Molecules 13:
1599-1616.
Harikrishnan R, Balasundaram C, Heo MS. 2011. Impact of plant products on innate and
adaptive immune system of cultured finfish and shellfish. Aquaculture 317: 1-15.
Hassaan MS, and Soltan MA. 2016. Evaluation of essential oil of fennel and garlic
separately or combined with Bacillus licheniformis on the growth, feeding
behaviour, hemato-biochemical indices of Oreochromis niloticus (L.) fry. Journal of
Aquaculture Research & Development 7: 422-429.
Heidarieh M, Mirvaghefi AR, Sepahi A, Sheikhzadeh N, Shahbazfar AA, Akbari M.
2013. Effects of dietary Aloe vera on growth performance, skin and gastrointestine
morphology in rainbow trout (Oncorhynchus mykiss). Turkish Journal of Fisheries
& Aquatic Sciences 13: 367-373.
Huang H, Pan L, Pan S, Song M. 2018. Effects of dietary herbal formulae combined by
Astragalus polysaccharides, chlorogenic acid and allicin in different combinations
and proportions on growth performance, non‐specific immunity, antioxidant status,
vibriosis resistance and damage indexes of Litopenaeus vannamei. Aquaculture
Research 49: 701-716.
Ibidunni AS, Olubodun OS, Ikililu A. 2018. Growth performance, haematology and
histopathology of African catfish (Clarias gariepinus) fed varying levels of Aloe
barbadensis leaves. Journal of Fisheries 6: 553-562.
Page 193
169
Jahanjoo V, Yahyavi M, Akrami R, Bahri AH. 2018. Influence of adding garlic (Allium
sativum), ginger (Zingiber officinale), thyme (Thymus vulgaris) and their
combination on the growth performance, haemato-immunological parameters and
disease resistance to photobacterium damselae in Sobaity Sea Bream (Sparidentex
hasta) Fry. Turkish Journal of Fisheries & Aquatic Sciences 18: 633-645.
Jelkić D, Opačak A, Horvat D, Safner R. 2014. Common carp fry survival during
salinity stress test: effect of feeding regime-short communication. Veterinarski Arhiv
84: 429-438.
Ji SC, Jeong GS, Gwang-Soon IM, Lee SW, Yoo JH, Takii K. 2007b. Dietary medicinal
herbs improve growth performance, fatty acid utilization, and stress recovery of
Japanese flounder. Fisheries Science 73: 70-76.
Ji SC, Takaoka O, Jeong GS, Lee SW, Ishimaru K, Seoka M, Takii K. 2007a. Dietary
medicinal herbs improve growth and some non-specific immunity of red sea bream
Pagrus major. Fisheries Science 73: 63-69.
Ji SC, Takaoka O, Lee SW, Hwang JH, Kim YS, Ishimaru K, Takii K. 2009. Effect of
dietary medicinal herbs on lipid metabolism and stress recovery in red sea bream
Pagrus major. Fisheries Science 75: 665-672.
Kallel F, Driss D, Bouaziz F, Belghith L, Zouari-Ellouzi S, Haddar A, Ghorbel R. 2015.
Polysaccharide from garlic straw: extraction, structural data, biological properties
and application to beef meat preservation. RSC Advances 5: 6728-6741.
Labrador JRP, Guiñares RC, Hontiveros GJS. 2016. Effect of garlic powder-
supplemented diets on the growth and survival of Pacific white leg shrimp
(Litopenaeus vannamei). Cogent Food & Agriculture 2: 1210066.
Page 194
170
Lee JY, Gao Y. 2012. Review of the application of garlic, Allium sativum, in
aquaculture. Journal of the World Aquaculture Society 43: 447-458.
Li M, Yan YX, Yu QT, Deng Y, Wu DT, Wang Y, Zhao J. 2017. Comparison of
immunomodulatory effects of fresh garlic and black garlic polysaccharides on RAW
264.7 Macrophages. Journal of Food Science 82: 765-771.
Liu B, Ge X, He Y, Xie J, Xu P, He Y, Chen R. 2010. Effects of anthraquinones extracted
from Rheum officinale Bail on the growth, non-specific immune response of
Macrobrachium rosenbergii. Aquaculture 310: 13-19.
Mahdavi M, Hajimoradloo A, Ghorbani R. 2013. Effect of Aloe vera extract on growth
parameters of common carp (Cyprinus carpio). World Journal of Medical Sciences 9:
55-60.
Manaf SR, Daud HM, Alimon AR, Mustapha NM, Hamdan RH, Muniand KG, Hamid NH.
2016. The effects of Vitex trifolia, Strobilanthes crispus and Aloe vera herbal-mixed
dietary supplementation on growth performance and disease resistance in red hybrid
tilapia (Oreochromis sp.) Journal of Aquaculture Research & Development 7: 2.
Mehrim AI, Khalil FF, Refaey MM. 2014. Evaluation of dietary addition of garlic (Allium
sativum l.) lobes on growth performance, feed utilization, and physiological responses of
Oreochromis niloticus, fingerlings. Abbassa International Journal of Aquaculture 7:
342-361.
Mohan K, Ravichandran S, Muralisankar T, Uthayakumar V, Chandirasekar R, Seedevi P,
Rajan D.K. 2019. Potential uses of fungal polysaccharides as immunostimulants in fish
and shrimp aquaculture: A review. Aquaculture 500: 250-263.
Page 195
171
Nya EJ, Austin B. 2011. Development of immunity in rainbow trout (Oncorhynchus mykiss,
Walbaum) to Aeromonas hydrophila after the dietary application of garlic. Fish &
Shellfish Immunology 30: 845-850.
Palanisamy P, Sasikala G, Mallikaraj D, Bhuvaneshwari N, Natarajan GM. 2011.
Haematological changes of freshwater food fish, Channa striata on exposure to
Cleistanthus collinus suicidal plant extract. Research Journal of Pharmaceutical,
Biological & Chemical Sciences 2: 812-816.
Platel K, Srinivasan K. 2004. Digestive stimulant action of spices: a myth or reality? Indian
Journal of Medical Research 119: 167.
Sahu S, Das BK, Mishra BK, Pradhan J, Sarangi N. 2007. Effect of Allium sativum on the
immunity and survival of Labeo rohita infected with Aeromonas hydrophila. Journal of
Applied Ichthyology 23: 80-86.
Shalaby AM, Khattab YA, Abdel Rahman AM. 2006. Effects of garlic (Allium sativum) and
chloramphenicol on growth performance, physiological parameters and survival of Nile
tilapia (Oreochromis niloticus). Journal of Venomous Animals & Toxins including
Tropical Diseases 12: 172-201.
Sakai M. 1999. Current research status of fish immunostimulants. Aquaculture 172: 63-92.
Robbins KR, Norton HW, Baker DH. 1979. Estimation of nutrient requirements from
growth data. The Journal of nutrition 109: 1710-1714.
Song SK, Beck BR, Kim D, Park J, Kim J, Kim HD, Ringø E. 2014. Prebiotics as
immunostimulants in aquaculture: a review. Fish & Shellfish Immunology 40: 40-48.
Taiwo VO, Olukunle OA, Ozor IC, Oyejobi AT. 2005. Consumption of aqueous extract of
raw Aloe vera leaves: histopathological and biochemical studies in rat and
tilapia. African Journal of Biomedical Research 8: 169-178.
Page 196
172
Talpur AD, Ikhwanuddin M 2013. Azadirachta indica (neem) leaf dietary effects on the
immunity response and disease resistance of Asian seabass, Lates calcarifer challenged
with Vibrio harveyi. Fish & Shellfish Immunology 34: 254-264.
Talpur AD, Ikhwanuddin M. 2012. Dietary effects of garlic (Allium sativum) on haemato-
immunological parameters, survival, growth, and disease resistance against Vibrio
harveyi infection in Asian sea bass, Lates calcarifer (Bloch). Aquaculture 364: 6-12.
Thanikachalam K, Kasi M, Rathinam X. 2010. Effect of garlic peel on growth,
hematological parameters and disease resistance against Aeromonas hydrophila in
African catfish Clarias gariepinus (Bloch) fingerlings. Asian Pacific Journal of Tropical
Medicine 3: 614-618.
Tremaroli V, Bäckhed F. 2012. Functional interactions between the gut microbiota and host
metabolism. Nature 489: 242.
Wang CY, Li ZB, Sun YZ, Chen Q, Li WJ, Huang YC, Lu J. 2018. Effects of Chinese
herbal medicines mixture on growth performance digestive enzyme activity immune
response of juvenile Japanese seabass, Lateolabrax japonicus. Aquaculture Nutrition 24:
683-693.
Yang F, Zuo XW, Zhang YH, Liang J, Li KW, Liu JL, Zhang GF. 2010. The effects of
garlic extract on early growth and development of Manila clam Ruditapes
philippinarum. Acta Ecologica Sinica 30: 989-994.
Yin G, Ardo L, Thompson KD, Adams A, Jeney Z, Jeney G. 2009. Chinese herbs
(Astragalus radix and Ganoderma lucidum) enhance immune response of carp, Cyprinus
carpio, and protection against Aeromonas hydrophila. Fish & Shellfish Immunology 26:
140-145.
Page 197
173
Yılmaz S, Ergün S. 2012. Effects of garlic and ginger oils on hematological and biochemical
variables of sea bass Dicentrarchus labrax. Journal of Aquatic Animal Health 24: 219-
224.
Yılmaz S, Ergun S, Celik ES. 2012. Effects of herbal supplements on growth performance
of Sea Bass (Dicentrarchus labrax): change in body composition and some blood
parameters. Journal of Bioscience & Biotechnology 1: 217-222.
Yu Y, Shen M, Song Q, Xie J. 2018. Biological activities and pharmaceutical applications
of polysaccharide from natural resources: A review. Carbohydrate Polymers 183: 91-
101.
Zahran E, Risha E, AbdelHamid F, Mahgoub HA, Ibrahim T. 2014. Effects of dietary
Astragalus polysaccharides (APS) on growth performance, immunological parameters,
digestive enzymes, and intestinal morphology of Nile tilapia (Oreochromis
niloticus). Fish & Shellfish Immunology 38: 149-157.
Page 198
174
CHAPTER 6: CONCLUSIONS AND RECOMMENDATIONS
6.1 Conclusions
The poor fish health management in the Nambian aquaculture and elsewhere in the
world is something that can be mitigated. Although not much has been done locally to
improve this situation, previous studies have shown that the use of medicinal herbs in
aquaculture as immuno-stumulants, growth promoters, feed utilization enhancers,
appetizers, and anti-stress enhancers could be a sustainable solution. Hence, the aim of
this study was to develop a phytogenic diet for the Namibian aquaculture sector from
easily grown herbs and indigenous ingredients with the ability to improve fish growth,
feed utilization, general health, and resistance of fish against culture conditions. For this
purpose, the current study was designed to investigate the effects of dietary aloe vera
(Aloe vera), and garlic (Allium sativum) crude polysaccharide extracts on growth
performance, feed utilization, haematological parameters, whole body composition, and
resistance against low water pH in African catfish, C. gariepinus under culture
conditions.
The first part of this study investigated the potential effects of dietary A. vera
polysaccharides (0.5%, 1.0%, 2.0%, and 4.0%) on growth performance, feed utilization,
haemato-biochemical parameters, body composition, and resistance against low water
pH (5.2 – 5.5) in C. gariepinus fingerlings, post 60 d feeding. This experiment showed
the ability of A. vera polysaccharides (0.5% - 2.0%) to promote growth (final weight,
weight gain, sbsolute growth rate, and specific growth rate) improve feed utilization
Page 199
175
(feed conversion ratio, and protein efficiency ratio) health parameters (white blood cells,
red blood cells, alanine aminotransferase, and aspartate aminotransferase enzyme), and
increase resistance of C. gariepinus fingerlings against low water pH after 60 d of
administration. The optimum dietary A. vera inclusion levels suitable for growth and
feed utilization were estimated to be 1.79% and 1.77%, respectively, based on the
second order polynomial regression model. Dietary A. vera had no effects on the
proximate body composition of C. gariepinus fingerlings. Furthermore, the study has
demostrated poor growth performance, feed utilization, health parameters, and low
resistance of fish against low water pH at the highest dietary A. vera inclusion level
(4.0%). Overall, from this experiment, it can thus be concluded that A. vera
polysaccharide extracts have the potential to be used as feed supplements to improve
growth, health, and reduce stress in C. gariepinus fingerlings during culture.
The second part of the study investigated the effects of dietary garlic (Allium sativum)
polysaccharide extracts (GPE) included at 0.5%, 1.0%, 2.0%, and 4.0% on growth
performance, haematological parameters, whole body composition, and resistance
against low water pH in C. gariepinus juveniles. From this study, GPE demonstrated
better growth performance (final weight, weight gain, absolute growth rate, and specific
growth rate), improved feed utilization (feed intake, feed conversion ratio, feed
efficiency ratio, and protein efficiency ratio), and increased haemtological parameters
(red blood cells, and mean corpuscular haemoglobin concentration) in C. gariepinus
juveniles, in a dose dependent fashion. As demostrated in the first experiement, the
highest dietary GPE level (4.0%) had no effects on fish growth performance, feed
Page 200
176
utilization and health parameters. Moreover, GPE had no effects on proximate body
composition, neither on the resistance of fish against low water pH. The optimum
inclusion level for growth and feed utilization was estimated to be 1.69% and 1.77% A.
sativum, respectively. In summary, this experiement presented that A. sativum
polysaccharide extracts qualify to be used as phytogenics to promote growth and general
health in C. gariepinus juveniles, especially in intensive aquaculture systems.
The last component of this study was designed to investigate the hypothesis that feeding
C. gariepinus juveniles with a diet supplemented with A. vera and A. sativum
polysaccharides mixture (1:1) (0.5%, 1.0%, 2.0% and 4.0%) would have effects on their
growth performance, feed utilization, haematological indices, whole body composition,
and survival at low water pH. This experiment has proven that dietary A. vera-A.
sativum mixture (1:1) had the capacity to increase growth (final weight, weight gain,
absolute growth rate, and specific growth rate) and improve feed utilization paramters
(feed conversion ratio, feed efficiency ratio, and protein efficiency ratio) in C.
gariepinus juveniles. The optimum dietary A. vera-A. sativum mixture inclusion levels
were estimated to be 0.70% and 0.66% diet for growth and feed utilization respectively.
Generally, haematological indices were increased in fish supplemented with A. vera-A.
sativum mixture when compared to the control; no negative effects were presented in
supplemented groups when compared to the unsupplemented ones. In terms of
proximate body composition, fish that were supplemented with inclusion levels between
1.0%, and 4.0% A. vera-A. sativum mixture presented lower lipid content compared to
the supplemented ones. Furthermore, fish that were supplemented with A. vera-A.
Page 201
177
sativum mixture showed a stronger resistance against low water pH when compared to
the unsupplemented ones. In conclusion, A. vera amd A. sativum polysaccharides
mixture (1:1) could be recommended as feed additives in aquaculture to promote
growth, feed utilization, health, and increase fish resistance against stress during culture
period.
In summary, A. vera, and A. sativum polysaccharide extracts (separately or mixture)
could be recommended as possible alternative remedies to promote growth, feed
utilization, health, and resistance of African catfish against acidic water in aquaculture
sytems, especially at dietary inclusion levels not higher than 2.0%. This study was the
first to introduce A. vera, and A. sativum polysaccharide extracts and their mixtures as
potential aquaculture feed additives, and the findings could still be of greater
significance to the development of aquaculture in Nambia, and other sub-Sahara African
countries experiencing the same plight of poor fish health management, and insignificant
production return from aquaculture. This is encouraging to the fish farmers, and
aquaculture scientists who could now chose to use cost effective aquaculture natural
remedies, which are easily grown, safe to consumers, and their environment. Since the
adoption of herbal extracts in aquaculture feed industry is lagging behind, this study also
serves to market and promote the implementation of herbal extracts as feed supplements
in the aquaculture feed industry. Furthermore, the study significantly contributes to the
expansion of previous related work and knowledge on A. vera, and A. sativum and other
medicinal herbs tested in aquauculture. Essentially, this study could be used as a review
for understanding underlying theoretical principles of dietary herbal extract effects in
Page 202
178
fish, which would provide scientists a basis for better future work in the field of
aquaculture nutrition, especially in Namibia.
6.2 Recommendations
Before A. vera and A. sativum polysaccharide extracts and their mixtures are adopted in
C. gariepinus culture as feed additives more studies are still required, and the following
recommendations should be considered:
(1) In this study, experimental facilities were a limitation, thus the study could not carry
out parallel experiments to be able to compare the growth and physiological effects
between individual herbs (A. vera and A. sativum) and their mixtures in C. gariepinus,
thus this needs to be further tested. (2) Future studies should consider investigating these
extract mixtures at different ratios to better understand their synergistic effects in fish
and compare them directly with effects of each herb individually. (3) Additional
experiments need to be carried out to determine to what extend the effects of these herbs
(A. vera and A. sativum and their mixture) are influenced by the dosages (from 0.5% to
2%), and duration of exposure (i.e short 30 d and long-term 90 d). (4) Environmental
factors play an important role in fish physiology including metabolism. Future studies
should determine whether the observed A. vera, A. sativum, and their mixture effects in
C. gariepinus are influenced by environmental factors such as temperature and light. (5)
Herbal extracts have been acclaimed to improve growth and health status of fish through
their ability to improve the intestinal microbiota. To confirm this mechanism, future
studies should incorporate evaluating the composition and diversity of bacterial
communities within the fish intestinal ecosystem following herbal extract
administration. (6) In addition, since antimicrobial activity has been reported in A. vera
Page 203
179
and A. sativum, future studies should investigate their preventative and curative effects
in fish against pathogenic bacteria that are a problem in aquaculture. (7) Garlic and aloe
vera are known to possess pugent smell and bitter tastes respectively, hence future
studies should include sensory evaluation to determine the eating quality of fish products
from dietary garlic and/or aloe vera supplemented fish. (8) Future studies should include
a cost-benefit analysis of using herbal extracts in aquaculture. (9) Since the herbal
extracts used in this study were commercial products, effective extraction and screening
methods of the main constituents need to be explored locally, to better understand their
functions. (10) Lastly, to ensure a sustainable aquaculture, mass production of these
herbs in Namibia needs to be explored as their use in aquaculture may double the
pressure already exerted by agricultural sectors and humans.
Page 204
180
APPENDICES Appendix A
Table 1 Descriptive statistics of growth performance indices of African catfish (Clarias
gariepinus) fed 30% Aloe vera crude polysaccharide extracts supplemented diets for 60
d.
N Mean Std. Deviation Std. Error
95% Confidence Interval forMean
Minimum MaximumLowerBound
UpperBound
FW Control 3 28.5658 5.34849 3.08795 15.2794 41.8521 24.84 34.69
Aloe 0.5% 3 40.6750 2.92487 1.68867 33.4092 47.9408 37.41 43.06
Aloe 1.0% 3 42.4873 11.21416 6.47450 14.6298 70.3448 34.34 55.28
Aloe 2% 3 37.1262 2.32638 1.34314 31.3471 42.9052 34.50 38.93
Aloe 4% 3 28.4480 7.30829 4.21944 10.2932 46.6027 23.71 36.86
Total 15 35.4604 8.33087 2.15102 30.8470 40.0739 23.71 55.28
WG Control 3 25.5158 5.34849 3.08795 12.2294 38.8021 21.79 31.64
Aloe 0.5% 3 37.6250 2.92487 1.68867 30.3592 44.8908 34.36 40.01
Aloe 1.0% 3 39.4373 11.21416 6.47450 11.5798 67.2948 31.29 52.23
Aloe 2% 3 34.0762 2.32638 1.34314 28.2971 39.8552 31.45 35.88
Aloe 4% 3 25.3980 7.30829 4.21944 7.2432 43.5527 20.66 33.81
Total 15 32.4104 8.33087 2.15102 27.7970 37.0239 20.66 52.23
AGR
Control0.5% Aloe1.0% Aloe2.0% Aloe4.0% AloeTotal
33333
15
0.42530.62710.65730.56790.42330.5402
0.089140.04875
0.18690.03877
0.12180.13885
0.051470.028140.107910.022390.070320.03585
0.20380.5060.193
0.47160.12070.4633
0.64670.74821.12160.66430.72590.6171
0.360.570.520.520.340.34
0.530.670.87
0.60.560.87
SGR
ControlAloe 0.5%Aloe 1.0%Aloe 2%Aloe 4%Total
33333
15
3.71004.31454.35374.16313.68744.0457
.29969
.12184
.41921
.10610
.40532
.39442
.17303
.07034
.24203
.06126
.23401
.10184
2.96554.01193.31243.89952.68053.8273
4.45444.61725.39514.42674.69434.2642
3.504.184.044.043.423.42
4.054.414.834.244.154.83
HSI
ControlAloe 0.5%Aloe 1.0%Aloe 2%Aloe 4% Total
33333
15
1.70931.50201.59131.45241.55071.5611
.16916
.08861
.33665
.28232
.28419
.22919
.09766
.05116
.19437
.16300
.16408
.05918
1.28911.2819
.7550
.7511
.84471.4342
2.12951.72212.42762.15382.25671.6881
1.511.451.221.221.351.22
1.811.601.871.771.881.88
VSI
ControlAloe 0.5%Aloe 1.0%Aloe 2%Aloe 4%Total
33333
15
7.45508.67926.57425.64488.33867.3383
1.289614.95929
.93910
.380144.412712.83226
.744562.86325
.54219
.219472.54768
.73129
4.2514-3.64044.24134.7005
-2.62325.7699
10.658520.9987
8.90706.5891
19.30038.9068
6.305.555.555.325.705.32
8.8414.40
7.396.06
13.4314.40
CF
controlAloe 0.5%Aloe 1.0%Aloe 2%Aloe 4%Total
33333
15
.6801
.6886
.7289
.6954
.6981
.6982
.00573
.05755
.03029
.01270
.05633
.03713
.00331
.03323
.01749
.00733
.03252
.00959
.6659
.5457
.6536
.6638
.5582
.6777
.6944
.8316
.8041
.7269
.8380
.7188
.68
.62
.71
.69
.63
.62
.69
.72
.76
.71
.74
.76
Page 205
181
Table 2 Descriptive statistics of feed utilization indices and survival rate of African
catfish (Clarias gariepinus) fingerlings fed 30% Aloe vera crude polysaccharide extracts
supplemented diets for 60 d.
FCR Control 3 1.9441 .32460 .18741 1.1377 2.7504 1.59 2.22
Aloe 0.5% 3 1.4141 .12804 .07393 1.0961 1.7322 1.27 1.50
Aloe 1.0% 3 1.3410 .38020 .21951 .3966 2.2855 .93 1.68
Aloe 2% 3 1.5847 .12915 .07456 1.2639 1.9055 1.44 1.67
Aloe 4% 3 1.9862 .48121 .27783 .7908 3.1816 1.44 2.33
Total 15 1.6540 .38669 .09984 1.4399 1.8682 .93 2.33
FI Control 3 48.5467 3.79108 2.18878 39.1291 57.9642 44.22 51.26
Aloe 0.5% 3 53.0100 3.20823 1.85227 45.0403 60.9797 50.71 56.68
Aloe 1.0% 3 50.1000 2.13721 1.23392 44.7909 55.4091 48.54 52.54
Aloe 2% 3 53.8533 3.20988 1.85323 45.8795 61.8271 51.53 57.52
Aloe 4% 3 48.1067 .49715 .28703 46.8717 49.3417 47.59 48.58
Total 15 50.7233 3.38657 .87441 48.8479 52.5988 44.22 57.52
FER Control 3 .5248 .09411 .05433 .2911 .7586 .45 .63
Aloe 0.5% 3 .7112 .06774 .03911 .5430 .8795 .67 .79
Aloe 1.0% 3 .7928 .25152 .14522 .1680 1.4176 .60 1.08
Aloe 2% 3 .6340 .05414 .03126 .4995 .7685 .60 .70
Aloe 4% 3 .5272 .14696 .08485 .1621 .8922 .43 .70
Total 15 .6380 .16164 .04173 .5485 .7275 .43 1.08
PER Control 3 .8505 .17828 .10293 .4076 1.2934 .73 1.05
Aloe 0.5% 3 1.2542 .09750 .05629 1.0120 1.4964 1.15 1.33
Aloe 1.0% 3 1.3146 .37381 .21582 .3860 2.2432 1.04 1.74
Aloe 2% 3 1.1359 .07755 .04477 .9432 1.3285 1.05 1.20
Aloe 4% 3 .8466 .24361 .14065 .2414 1.4518 .69 1.13
Total 15 1.0803 .27770 .07170 .9266 1.2341 .69 1.74
SUR
ControlAloe 0.5%Aloe 1.0%
333
88.333390.000090.0000
7.637635.000005.00000
4.409592.886752.88675
69.360477.579377.5793
107.3062102.4207102.4207
80.0085.0085.00
95.0095.0095.00
Aloe 2% 3 93.3333 2.88675 1.66667 86.1622 100.5044 90.00 95.00Aloe 4% 3 85.0000 5.00000 2.88675 72.5793 97.4207 80.00 90.00Total 15 89.3333 5.30049 1.36858 86.3980 92.2686 80.00 95.00
N MeanStd.
Deviation Std. Error
95% Confidence Interval forMean
Minimum MaximumLowerBound
UpperBound
Page 206
182
Table 3 Descriptive statistics of haemato-biochemical indices of African catfish
(Clarias gariepinus) fingerlings fed 30% Aloe vera crude polysaccharide extracts
supplemented diets for 60 d.
N Mean Std.
Deviation Std. Error
95% Confidence Interval for Mean
Minimum Maximum Lower Bound
Upper Bound
WBC control 3 36.6833 1.62583 .93868 32.6445 40.7221 35.25 38.45
Aloe 0.5%
3 45.6333 6.87138 3.96719 28.5639 62.7028 39.90 53.25
Aloe 1.0%
3 43.1833 3.13860 1.81207 35.3866 50.9801 39.80 46.00
Aloe 2% 3 35.6333 3.44867 1.99109 27.0664 44.2003 31.90 38.70
Aloe 4% 3 28.2000 6.62891 3.82721 11.7329 44.6671 24.15 35.85
Total 15 37.8667 7.54204 1.94735 33.6900 42.0433 24.15 53.25
Lym control 3 32.3333 2.97588 1.71812 24.9408 39.7258 29.40 35.35
Aloe 0.5%
3 41.4000 5.16890 2.98426 28.5597 54.2403 37.45 47.25
Aloe 1.0%
3 38.6333 2.90359 1.67639 31.4204 45.8463 35.65 41.45
Aloe 2% 3 32.3667 3.82143 2.20630 22.8737 41.8596 28.80 36.40
Aloe 4% 3 26.3000 7.23809 4.17892 8.3196 44.2804 21.30 34.60
Total 15 34.2067 6.78362 1.75152 30.4500 37.9633 21.30 47.25
MON control 3 1.8667 .58381 .33706 .4164 3.3169 1.35 2.50
Aloe 0.5%
3 2.2000 .86747 .50083 .0451 4.3549 1.45 3.15
Aloe 1.0%
3 2.3500 .18028 .10408 1.9022 2.7978 2.15 2.50
Aloe 2% 3 1.4333 .23629 .13642 .8464 2.0203 1.25 1.70
Aloe 4% 3 .9667 .20817 .12019 .4496 1.4838 .80 1.20
Total 15 1.7633 .67174 .17344 1.3913 2.1353 .80 3.15
GRAN control 3 2.4833 .80829 .46667 .4754 4.4912 1.75 3.35
Aloe 0.5%
3 2.0333 .94384 .54493 -.3113 4.3780 1.00 2.85
Aloe 1.0%
3 2.2000 .22913 .13229 1.6308 2.7692 2.00 2.45
Aloe 2% 3 1.8333 .82815 .47813 -.2239 3.8906 1.05 2.70
Aloe 4% 3 .9333 .63311 .36553 -.6394 2.5061 .45 1.65
Total 15 1.8967 .82494 .21300 1.4398 2.3535 .45 3.35
HCT control 3 .2342 .03522 .02033 .1467 .3217 .19 .25
Aloe 0.5%
3 .2797 .01522 .00879 .2419 .3175 .27 .30
Aloe 1.0%
3 .2695 .05110 .02950 .1426 .3964 .22 .32
Aloe 2% 3 .2352 .03720 .02148 .1428 .3276 .21 .28
Aloe 4% 3 .1868 .04734 .02733 .0692 .3044 .16 .24
Total 15 .2411 .04735 .01222 .2148 .2673 .16 .32
MCV control 3 130.9000 1.98053 1.14346 125.9801 135.8199 129.15 133.05
Page 207
183
Aloe 0.5%
3 131.5500 1.98053 1.14346 126.6301 136.4699 129.80 133.70
Aloe 1.0%
3 131.0833 6.53153 3.77098 114.8581 147.3085 126.00 138.45
Aloe 2% 3 126.4000 7.83374 4.52281 106.9399 145.8601 120.55 135.30
Aloe 4% 3 121.5000 5.99020 3.45844 106.6195 136.3805 115.15 127.05
Total 15 128.2867 6.09606 1.57400 124.9108 131.6626 115.15 138.45
RDWa control 3 97.9167 7.68315 4.43587 78.8307 117.0027 89.60 104.75
Aloe 0.5%
3 90.1333 1.00540 .58047 87.6358 92.6309 89.30 91.25
Aloe 1.0%
3 91.6500 7.52446 4.34425 72.9582 110.3418 84.50 99.50
Aloe 2% 3 85.2000 6.90489 3.98654 68.0473 102.3527 80.70 93.15
Aloe 4% 3 84.4000 3.01164 1.73877 76.9187 91.8813 81.10 87.00
Total 15 89.8600 7.10111 1.83350 85.9275 93.7925 80.70 104.75
HGB control 3 121.1667 17.14886 9.90090 78.5665 163.7668 101.50 133.00
Aloe 0.5%
3 144.1667 5.34634 3.08671 130.8856 157.4477 139.50 150.00
Aloe 1.0%
3 140.8333 23.67664 13.66972 82.0173 199.6494 119.00 166.00
Aloe 2% 3 128.3333 13.41951 7.74776 94.9974 161.6693 118.00 143.50
Aloe 4% 3 103.1667 23.67664 13.66972 44.3506 161.9827 89.00 130.50
Total 15 127.5333 21.56921 5.56915 115.5887 139.4780 89.00 166.00
MCHC control 3 522.0000 12.01041 6.93421 492.1645 551.8355 508.50 531.50
Aloe 0.5%
3 516.0000 9.36750 5.40833 492.7298 539.2702 505.50 523.50
Aloe 1.0%
3 524.5000 11.82159 6.82520 495.1335 553.8665 511.00 533.00
Aloe 2% 3 551.8333 29.47174 17.01552 478.6215 625.0452 519.00 576.00
Aloe 4% 3 559.6667 16.26602 9.39119 519.2596 600.0737 543.00 575.50
Total 15 534.8000 23.30757 6.01799 521.8927 547.7073 505.50 576.00
MCH control 3 68.3500 2.54313 1.46828 62.0325 74.6675 65.65 70.70
Aloe 0.5%
3 67.9500 1.90000 1.09697 63.2301 72.6699 66.35 70.05
Aloe 1.0%
3 68.6833 1.87239 1.08102 64.0321 73.3346 67.10 70.75
Aloe 2% 3 69.6667 .53463 .30867 68.3386 70.9948 69.20 70.25
Aloe 4% 3 67.9333 1.51438 .87433 64.1714 71.6953 66.20 69.00
Total 15 68.5167 1.65709 .42786 67.5990 69.4343 65.65 70.75
RBC control 3 1.7917 .29616 .17099 1.0560 2.5274 1.45 1.98
Aloe 0.5%
3 2.1233 .12332 .07120 1.8170 2.4297 2.04 2.27
Aloe 1.0%
3 2.0417 .28593 .16508 1.3314 2.7520 1.77 2.34
Aloe 2% 3 1.8595 .17564 .10141 1.4232 2.2958 1.72 2.06
Aloe 4% 3 1.5217 .32521 .18776 .7138 2.3295 1.30 1.90
Total 15 1.8676 .30545 .07887 1.6984 2.0367 1.30 2.34
PLT control 3 22.8333 7.00595 4.04489 5.4296 40.2371 16.00 30.00
Aloe 0.5%
3 11.1667 1.60728 .92796 7.1740 15.1594 10.00 13.00
Aloe 1.0%
3 14.3333 6.21155 3.58624 -1.0970 29.7637 10.50 21.50
Aloe 2% 3 19.1667 7.63763 4.40959 .1938 38.1396 12.50 27.50
Aloe 4% 3 12.1667 3.61709 2.08833 3.1813 21.1520 8.00 14.50
Page 208
184
Total 15 15.9333 6.63289 1.71260 12.2602 19.6065 8.00 30.00
ALT control 3 90.0000 35.36948 20.42058 2.1373 177.8627 60.00 129.00
Aloe 0.5%
3 44.8333 9.56992 5.52519 21.0603 68.6063 37.00 55.50
Aloe 1.0%
3 51.3333 14.35560 8.28821 15.6720 86.9946 35.50 63.50
Aloe 2% 3 72.5000 19.83053 11.44916 23.2382 121.7618 56.00 94.50
Aloe 4% 3 110.6667 28.08173 16.21299 40.9078 180.4255 79.50 134.00
Total 15 73.8667 32.02926 8.26992 56.1295 91.6039 35.50 134.00
AST control 3 483.8333 187.99224 108.5377 16.8347 950.8320 338.00 696.00
Aloe 0.5%
3 140.1667 7.07696 4.08588 122.5865 157.7468 132.00 144.50
Aloe 1.0%
3 176.8333 41.46183 23.93800 73.8364 279.8302 140.50 222.00
Aloe 2% 3 328.1667 76.83803 44.36246 137.2904 519.0429 242.50 391.00
Aloe 4% 3 268.5000 143.36405 82.77127 -87.6360 624.6360 106.50 379.00
Total 15 279.5000 158.05119 40.80864 191.9742 367.0258 106.50 696.00
Glu control 3 3.9667 .35119 .20276 3.0943 4.8391 3.60 4.30
Aloe 0.5%
3 2.8000 1.03320 .59652 .2334 5.3666 1.70 3.75
Aloe 1.0%
3 3.0833 .25166 .14530 2.4582 3.7085 2.85 3.35
Aloe 2% 3 5.5500 3.97524 2.29510 -4.3250 15.4250 2.75 10.10
Aloe 4% 3 2.9833 .67515 .38980 1.3062 4.6605 2.30 3.65
Total 15 3.6767 1.90130 .49091 2.6238 4.7296 1.70 10.10
CHOL control 3 3.78 0.621 0.359 2.23 5.32 3 4
0.5% Aloe 3 3.66 0.545 0.315 2.31 5.02 3 4
1.0% Aloe 3 3.86 0.253 0.146 3.23 4.49 4 4
2.0% Aloe 3 3.69 0.527 0.304 2.38 5 3 4
4.0% Aloe 3 3.41 0.758 0.438 1.52 5.29 3 4
Total 15 3.68 0.503 0.13 3.4 3.96 3 4
TG control 3 2.6 0.105 0.061 2.33 2.86 2 3
0.5% Aloe 3 2.27 0.193 0.111 1.79 2.75 2 2
1.0% Aloe 3 2.2 0.321 0.186 1.4 3 2 3
2.0% Aloe 3 2.3 0.672 0.388 0.63 3.97 2 3
4.0% Aloe 3 2.23 0.186 0.108 1.77 2.69 2 2
Total 15 2.32 0.336 0.087 2.13 2.5 2 3
Page 209
185
Table 4 Test of homogeneity of variance in growth, feed utilization, survival, and
haemato-biochemical indices of African catfish (Clarias gariepinus) fingerlings fed 30%
Aloe vera crude polysaccharide extracts supplemented diets for 60 d.
Levene Statistic df1 df2 Sig.
FW 3.990 4 10 .535WG 3.990 4 10 .635FCR 2.386 4 10 .121FI 2.886 4 10 .079FER 3.700 4 10 .425
PER 3.990 4 10 .055
HSI 1.771 4 10 .211VSI 7.376 4 10 .055SUr .585 4 10 .681
SGR 3.272 4 10 .058CF 5.613 4 10 .052WBC 2.511 4 10 .108Lym 1.753 4 10 .215MONO 2.894 4 10 .079GRAN 1.020 4 10 .443HCT 1.336 4 10 .322MCV 2.471 4 10 .112RDWa 2.005 4 10 .170HGB 1.825 4 10 .201MCHC 1.855 4 10 .195MCH 1.242 4 10 .354RBC 1.230 4 10 .358PLT 1.438 4 10 .291ALT 1.737 4 10 .218AST 4.785 4 10 .060Glu 8.740 4 10 .053
CHOL 1.34 4 10 0.321TG 2.293 4 10 0.131AGR 3.99 4 10 0.065
Page 210
186
Table 5 Analysis of variances (ANOVA) of growth and feed utilization indices of
African catfish (Clarias gariepinus) fingerlings fed 30% Aloe vera crude polysaccharide
extracts supplemented diets for 60 d.
Sum of Squares df Mean Square F Sig.
Between Groups
528.163 4 132.041 2.977 .074
Within Groups 443.483 10 44.348Total 971.647 14Between Groups
528.163 4 132.041 2.977 .074
Within Groups 443.483 10 44.348Total 971.647 14Between Groups
1.064 4 .266 2.585 .102
Within Groups 1.029 10 .103Total 2.093 14Between Groups
80.997 4 20.249 2.545 .105
Within Groups 79.566 10 7.957Total 160.564 14Between Groups
.163 4 .041 2.016 .168
Within Groups .202 10 .020Total .366 14Between Groups
.587 4 .147 2.977 .074
Within Groups .493 10 .049Total 1.080 14Between Groups
.115 4 .029 .463 .762
Within Groups .621 10 .062Total .735 14Between Groups
18.792 4 4.698 .502 .735
Within Groups 93.512 10 9.351Total 112.304 14Between Groups
110.000 4 27.500 .971 .465
Within Groups 283.333 10 28.333Total 393.333 14Between Groups
1.266 4 .317 3.471 .050
Within Groups .912 10 .091Total 2.178 14Between Groups
.004 4 .001 .676 .624
Within Groups .015 10 .002Total .019 14
AGR Between Groups 0.147 4 0.037 2.977 0.074Within Groups 0.123 10 0.012Total 0.27 14
FI
FW
WG
FCR
CF
FER
PER
HSI
VSI
SUr
SGR
Page 211
187
Table 6 Quadratic regression model output on weight gain and feed efficiency ratio
against dietary A. vera crude polysaccharide extracts inclusion level in African catfish
(Clarias gariepinus) fingerlings’ culture.
WGModel SummaryR R Square Adjusted R SquareStd. Error of the Estimate
0.609 0.37 0.265 7.141The independent variable is Groups.ANOVA
Sum of Squaresdf Mean SquareF Sig.Regression 359.797 2 179.899 3.528 0.042Residual 611.85 12 50.987Total 971.647 14The independent variable is Groups.Coefficients
Unstandardized Coefficients Standardized Coefficientst Sig.B Std. Error Beta
Groups 9.95 4.966 1.748 2.004 0.036Groups ** 2 -2.778 1.162 -2.087 -2.391 0.034(Constant) 29.291 3.506 8.355 0FERModel SummaryR R Square Adjusted R SquareStd. Error of the Estimate
0.498 0.248 0.123 0.151The independent variable is Groups.ANOVA
Sum of Squaresdf Mean SquareF Sig.Regression 0.091 2 0.045 1.98 0.045Residual 0.275 12 0.023Total 0.366 14The independent variable is Groups.Coefficients
Unstandardized Coefficients Standardized Coefficientst Sig.B Std. Error Beta
Groups 0.152 0.105 1.378 1.445 0.048Groups ** 2 -0.043 0.025 -1.672 -1.754 0.105(Constant) 0.593 0.074 7.983 0
Page 212
188
Table 7 Analysis of variances (ANOVA) of haemato-biochemical indices of African
catfish (Clarias gariepinus) fingerlings fed 30% Aloe vera crude polysaccharide extracts
supplemented diets for 60 d.
Sum of Squares df Mean Square F Sig.
WBC Between Groups 565.262 4 141.315 6.115 .009
Within Groups 231.092 10 23.109 Total 796.353 14
Lym Between Groups 422.249 4 105.562 4.755 .021
Within Groups 221.995 10 22.200 Total 644.244 14
MONO Between Groups 3.867 4 .967 3.946 .036
Within Groups 2.450 10 .245 Total 6.317 14
GRAN Between Groups 4.161 4 1.040 1.938 .181
Within Groups 5.367 10 .537 Total 9.527 14
HCT Between Groups .016 4 .004 2.589 .101
Within Groups .015 10 .002 Total .031 14
MCV Between Groups 224.756 4 56.189 1.901 .187
Within Groups 295.512 10 29.551 Total 520.267 14
RDWa Between Groups 359.148 4 89.787 2.589 .101
Within Groups 346.813 10 34.681 Total 705.961 14
HGB Between Groups 3265.400 4 816.350 2.514 .108
Within Groups 3247.833 10 324.783 Total 6513.233 14
MCHC Between Groups 4595.567 4 1148.892 3.817 .039
Within Groups 3009.833 10 300.983 Total 7605.400 14
MCH Between Groups 6.118 4 1.530 .473 .755
Within Groups 32.325 10 3.232 Total 38.443 14
Page 213
189
RBC Between Groups .664 4 .166 2.582 .102
Within Groups .643 10 .064 Total 1.306 14
PLT Between Groups 292.600 4 73.150 2.262 .135
Within Groups 323.333 10 32.333 Total 615.933 14
ALT Between Groups 8901.233 4 2225.308 4.075 .033
Within Groups 5461.000 10 546.100 Total 14362.233 14
AST Between Groups 222587.333
4 55646.833 4.377 .027
Within Groups 127135.16 10 12713.517 Total 349722.50 14
Glu Between Groups 15.584 4 3.896 1.112 .403
Within Groups 35.025 10 3.503 Total 50.609 14
CHOL Between Groups 0.35 4 0.087 0.273 0.889 Within Groups 3.197 10 0.32 Total 3.547 14
TG Between Groups 0.306 4 0.077 0.6 0.671 Within Groups 1.276 10 0.128 Total 1.583 14
Page 214
190
Table 8 Post hoc test (Duncan multiple range test) of growth, survival and feed
utilization indices of African catfish (Clarias gariepinus) fingerlings fed 30% Aloe vera
crude polysaccharide extracts supplemented diets for 60 d.
Homogeneous Subsets Post Hoc Tests
Subset for alpha =
0.05
1 2 1 2 1Aloe 4% 3 28.4480 Aloe 4% 3 25.3980 Aloe 2% 3 1.4524
control 3 28.5658 control 3 25.5158 Aloe 0.5% 3 1.5020Aloe 2% 3 37.1262 37.1262 Aloe 2% 3 34.0762 34.0762 Aloe 4% 3 1.5507Aloe 0.5% 3 40.6750 40.6750 Aloe 0.5% 3 37.6250 37.6250 Aloe 1.0% 3 1.5913Aloe 1.0% 3 42.4873 Aloe 1.0% 3 39.4373 control 3 1.7093Sig. .062 .369 Sig. .062 .369 Sig. .271
Absolute Growth RateGroups N Subset for alpha = 0.05
1 2Subset for
alpha =
1 2 4.0% aloe 3 0.4233 1Aloe 4% 3 3.6874 control 3 0.4253 Aloe 2% 3 5.6448
control 3 3.7100 2.0% aloe 3 0.5679 0.5679 Aloe 1.0% 3 6.5742Aloe 2% 3 4.1631 4.1631 0.5% aloe 3 0.6271 0.6271 control 3 7.4550Aloe 0.5% 3 4.3145 1.0% aloe 3 0.6573 Aloe 4% 3 8.3386Aloe 1.0% 3 4.3537 Sig. 0.062 0.369 Aloe 0.5% 3 8.6792
Sig. .095 .477 Means for groups in homogeneous subsets are displayed.Sig. .288
a Uses Harmonic Mean Sample Size = 3.000.
SurvivalSubset for
alpha = 0.05
1 2 1 2 1Aloe 1.0% 3 1.3410 Aloe 4% 3 48.1067 Aloe 4% 3 85.0000
Aloe 0.5% 3 1.4141 1.4141 control 3 48.5467 48.5467 control 3 88.3333Aloe 2% 3 1.5847 1.5847 Aloe 1.0% 3 50.1000 50.1000 Aloe 0.5% 3 90.0000control 3 1.9441 1.9441 Aloe 0.5% 3 53.0100 53.0100 Aloe 1.0% 3 90.0000Aloe 4% 3 1.9862 Aloe 2% 3 53.8533 Aloe 2% 3 93.3333Sig. .057 .069 Sig. .075 .057 Sig. .108
Subset for
1Subset for
alpha = control 3 .5248 1 2 1Aloe 4% 3 .5272 Aloe 4% 3 .8466 control 3 .6801
Aloe 2% 3 .6340 control 3 .8505 Aloe 0.5% 3 .6886Aloe 0.5% 3 .7112 Aloe 2% 3 1.1359 1.1359 Aloe 2% 3 .6954Aloe 1.0% 3 .7928 Aloe 0.5% 3 1.2542 1.2542 Aloe 4% 3 .6981Sig. .060 Aloe 1.0% 3 1.3146 Aloe 1.0% 3 .7289
Sig. .062 .369 Sig. .189
Means for groups in homogeneous subsets are displayed.
Subset for alpha = 0.05
N
Protein Efficiency Ratio
Means for groups in homogeneous subsets are displayed.a. Uses Harmonic Mean Sample Size = 3.000.
Duncan
groups N
Viserosomatic indexDuncan
Hepatosomatic indexDuncan
groups N
groups N
Subset for alpha = 0.05
N Subset for alpha = 0.05
Means for groups in homogeneous subsets are displayed.a. Uses Harmonic Mean Sample Size = 3.000.
Feed Intake
Means for groups in homogeneous subsets are displayed.a. Uses Harmonic Mean Sample Size = 3.000.
Condition FactorDuncan
groups N
Means for groups in homogeneous subsets are displayed.a. Uses Harmonic Mean Sample Size = 3.000.
Specific Growth RateDuncan
groups N
Subset for alpha = 0.05
Means for groups in homogeneous subsets are displayed.a. Uses Harmonic Mean Sample Size = 3.000.
groups N
Means for groups in homogeneous subsets are displayed.a. Uses Harmonic Mean Sample Size = 3.000.
Means for groups in homogeneous subsets are displayed.a. Uses Harmonic Mean Sample Size = 3.000.
a. Uses Harmonic Mean Sample Size = 3.000.
Feed Conversion RatioDuncan Duncan
groups N
Subset for alpha = 0.05
Means for groups in homogeneous subsets are displayed.a. Uses Harmonic Mean Sample Size = 3.000.
Feed Efficiency RatioDuncan
groupsDuncan
groups N
Final Weight
Means for groups in homogeneous subsets are displayed.a. Uses Harmonic Mean Sample Size = 3.000.
Duncan
groups N
Subset for alpha = 0.05
Means for groups in homogeneous subsets are displayed.a. Uses Harmonic Mean Sample Size = 3.000.
Weight GainDuncan
groups
Page 215
191
Table 9 Post hoc test (Duncan multiple range test) of haemato-biochemical indices of
African catfish (Clarias gariepinus) fed 30% Aloe vera crude polysaccharide extracts
supplemented diets for 60 d.
1 2 3 1 2 1 2Aloe 4% 3 28.2000 Aloe 4% 3 26.3000 Aloe 4% 3 .9667Aloe 2% 3 35.6333 35.6333 control 3 32.3333 32.3333 Aloe 2% 3 1.4333 1.4333control 3 36.6833 36.6833 36.6833 Aloe 2% 3 32.3667 32.3667 control 3 1.8667 1.8667Aloe 1.0%
3 43.1833 43.1833 Aloe 1.0%
3 38.6333 Aloe 0.5%
3 2.2000
Aloe 0.5%
3 45.6333 Aloe 0.5%
3 41.4000 Aloe 1.0%
3 2.3500
Sig. .066 .096 .054 Sig. .163 .052 Sig. .059 .060
Subset for alpha = 0.05
1 2 1 2 1 1 2Aloe 4% 3 .9333 Aloe 4% 3 .1868 Aloe 4% 3 121.5000 Aloe 4% 3 84.4000Aloe 2% 3 1.8333 1.8333 control 3 .2342 .2342 Aloe 2% 3 126.4000 Aloe 2% 3 85.2000Aloe 0.5%
3 2.0333 2.0333 Aloe 2% 3 .2352 .2352 control 3 130.9000 Aloe 0.5%
3 90.1333 90.1333
Aloe 1.0%
3 2.2000 2.2000 Aloe 1.0%
3 .2695 Aloe 1.0%
3 131.0833 Aloe 1.0%
3 91.6500 91.6500
control 3 2.4833 Aloe 0.5%
3 .2797 Aloe 0.5%
3 131.5500 control 3 97.9167
Sig. .076 .334 Sig. .180 .215 Sig. .064 Sig. .190 .153
Subset for alpha
1 2 1 2 3 1 1 2Aloe 4% 3 103.1667 Aloe
0.5%3 516.0000 Aloe 4% 3 67.9333 Aloe 4% 3 1.5217
control 3 121.1667 121.1667 control 3 522.0000 522.0000 Aloe 0.5%
3 67.9500 control 3 1.7917 1.7917
Aloe 2% 3 128.3333 128.3333 Aloe 1.0%
3 524.5000 524.5000 control 3 68.3500 Aloe 2% 3 1.8595 1.8595
Aloe 1.0%
3 140.8333 Aloe 2% 3 551.8333 551.8333 Aloe 1.0%
3 68.6833 Aloe 1.0%
3 2.0417
Aloe 0.5%
3 144.1667 Aloe 4% 3 559.6667 Aloe 2% 3 69.6667 Aloe 0.5%
3 2.1233
Sig. .133 .176 Sig. .580 .072 .592 Sig. .301 Sig. .150 .166
Subset for alpha = 0.05
1 2 1 2 1 2 1Aloe 0.5%
3 11.1667 Aloe 0.5%
3 44.8333 Aloe 0.5%
3 140.1667 Aloe 0.5%
3 2.8000
Aloe 4% 3 12.1667 12.1667 Aloe 1.0%
3 51.3333 Aloe 1.0%
3 176.8333 Aloe 4% 3 2.9833
Aloe 1.0%
3 14.3333 14.3333 Aloe 2% 3 72.5000 72.5000 Aloe 4% 3 268.5000 Aloe 1.0%
3 3.0833
Aloe 2% 3 19.1667 19.1667 control 3 90.0000 90.0000 Aloe 2% 3 328.1667 328.1667 control 3 3.9667control 3 22.8333 Aloe 4% 3 110.6667 control 3 483.8333 Aloe 2% 3 5.5500Sig. .139 .058 Sig. .052 .085 Sig. .086 .122 Sig. .129
CHOL TGDuncan a Duncan aGroups N Subset for alpha = 0.05 Groups N Subset for alpha = 0.05
1 14.0% Aloe 3 3.41 1.0% Aloe 3 2.20.5% Aloe 3 3.66 4.0% Aloe 3 2.232.0% Aloe 3 3.69 0.5% Aloe 3 2.27control 3 3.78 2.0% Aloe 3 2.31.0% Aloe 3 3.86 control 3 2.6Sig. 0.387 Sig. 0.24Means for groups in homogeneous subsets are displayed.Means for groups in homogeneous subsets are displayed.a Uses Harmonic Mean Sample Size = 3.000. a Uses Harmonic Mean Sample Size = 3.000.
Duncan MCHC
a. Uses Harmonic Mean Sample Size = Means for groups in homogeneous
Subset for alpha = N
RDWa
a. Uses Harmonic Mean Means for groups in
groups
DuncanHGB
Subset for alpha = 0.05Ngroups
a. Uses Harmonic Mean Sample Size = 3.000.Means for groups in homogeneous subsets are
a. Uses Harmonic Mean Sample Size = Means for groups in homogeneous
Subset for alpha = 0.05
Ngroups
Duncan
groups N
Means for groups in a. Uses Harmonic Mean
N
Subset for alpha = 0.05
Means for groups in homogeneous a. Uses Harmonic Mean Sample Size =
ALTDuncan
a. Uses Harmonic Mean Sample Size =
GluDuncanDuncan
groups N
Subset for alpha = 0.05
Means for groups in homogeneous a. Uses Harmonic Mean Sample Size =
groups N
Means for groups in a. Uses Harmonic Mean
RBCDuncan
NSubset for alpha =
Means for groups in homogeneous a. Uses Harmonic Mean Sample Size =
MONODuncanDuncan
groups NSubset for alpha = 0.05
Means for groups in homogeneous subsets are a. Uses Harmonic Mean Sample Size = 3.000.
LymDuncan
groups
Means for groups in homogeneous
groups N
Subset for alpha = 0.05
ALTDuncan
groups
Means for groups in homogeneous a. Uses Harmonic Mean Sample Size =
PLT
groups NSubset for alpha =
MCHDuncan
groups N
HCTDuncan
groups
Means for groups in homogeneous a. Uses Harmonic Mean Sample Size =
GRAN
groups NSubset for alpha =
N
Subset for alpha = 0.05
Means for groups in homogeneous a. Uses Harmonic Mean Sample Size =
MCVDuncanDuncan
groups N
Subset for alpha = 0.05
Means for groups in homogeneous a. Uses Harmonic Mean Sample Size =
WBC
Page 216
192
Table 10 Kaplan–Meier analysis (survival) output of African catfish (Clarias
gariepinus) fingerlings subjected to low water pH after being fed 30% Aloe vera crude
polysaccharide extracts supplemented diets for 60 d.
Chi-Square df Sig.
Log Rank (Mantel-Cox)
22.304 4 0
Breslow (Generalized Wilcoxon)
18.479 4 0.001
Tarone-Ware 20.407 4 0
Overall Comparisons
Test of equality of survival distributions for the different levels of Groups.
Page 217
193
Appendix B
Table 1 Descriptive statistics of growth performance indices of African catfish (Clarias
gariepinus) juveniles fed 30% Allium sativum crude polysaccharide extracts
supplemented diets for 60 d.
Descriptives
N Mean Std. DeviationStd. Error 95% Confidence Interval for MeanMinimum Maximum
Lower Bound Upper BoundFW Control 3 93.3833 15.45116 8.92073 55.0005 131.7661 83.28 111.17
0.5% Garlic 3 99.79 10.09144 5.8263 74.7215 124.8585 91.93 111.171.0% Garlic 3 124.0467 21.47994 12.40145 70.6875 177.4058 99.67 140.22.0% Garlic 3 126.16 9.14271 5.27854 103.4483 148.8717 116.15 134.074.0% Garlic 3 67.4233 3.00057 1.73238 59.9695 74.8772 64.7 70.64Total 15 102.1607 25.1027 6.48149 88.2593 116.0621 64.7 140.2
WG Control 3 80.7333 15.45116 8.92073 42.3505 119.1161 70.63 98.520.5% Garlic 3 87.14 10.09144 5.8263 62.0715 112.2085 79.28 98.521.0% Garlic 3 111.3967 21.47994 12.40145 58.0375 164.7558 87.02 127.552.0% Garlic 3 113.5093 9.1438 5.27918 90.7949 136.2238 103.5 121.424.0% Garlic 3 54.7733 3.00057 1.73238 47.3195 62.2272 52.05 57.99Total 15 89.5105 25.10262 6.48147 75.6092 103.4119 52.05 127.55
AGR Control 3 1.3456 0.25752 0.14868 0.7058 1.9853 1.18 1.640.5% Garlic 3 1.4523 0.16819 0.0971 1.0345 1.8701 1.32 1.641.0% Garlic 3 1.8566 0.358 0.20669 0.9673 2.7459 1.45 2.132.0% Garlic 3 1.8918 0.1524 0.08799 1.5132 2.2704 1.72 2.024.0% Garlic 3 0.9129 0.05001 0.02887 0.7887 1.0371 0.87 0.97Total 15 1.4918 0.41838 0.10802 1.2602 1.7235 0.87 2.13
SGR Control 3 3.3601 0.26626 0.15373 2.6986 4.0215 3.18 3.670.5% Garlic 3 3.4801 0.1658 0.09573 3.0682 3.8919 3.35 3.671.0% Garlic 3 3.8315 0.30517 0.17619 3.0734 4.5896 3.48 4.052.0% Garlic 3 3.8747 0.12283 0.07091 3.5696 4.1799 3.74 3.984.0% Garlic 3 2.9084 0.09201 0.05312 2.6798 3.1369 2.82 3Total 15 3.4909 0.40443 0.10442 3.267 3.7149 2.82 4.05
CF Control 3 0.5383 0.11939 0.06893 0.2417 0.8348 0.41 0.640.5% Garlic 3 0.5559 0.15847 0.0915 0.1623 0.9496 0.43 0.741.0% Garlic 3 0.4886 0.12481 0.07206 0.1785 0.7986 0.4 0.632.0% Garlic 3 0.4752 0.12187 0.07036 0.1725 0.778 0.34 0.564.0% Garlic 3 0.6955 0.07618 0.04398 0.5062 0.8847 0.63 0.78Total 15 0.5507 0.13182 0.03404 0.4777 0.6237 0.34 0.78
HSI Control 3 3.0371 0.27138 0.15668 2.363 3.7113 2.72 3.210.5% Garlic 3 3.1108 0.21973 0.12686 2.565 3.6567 2.92 3.351.0% Garlic 3 3.1309 1.34593 0.77707 -0.2126 6.4744 2.28 4.682.0% Garlic 3 3.3756 0.47652 0.27512 2.1918 4.5593 3.04 3.924.0% Garlic 3 2.9651 0.15163 0.08754 2.5884 3.3417 2.79 3.07Total 15 3.1239 0.57669 0.1489 2.8045 3.4433 2.28 4.68
VSI Control 3 8.7699 0.56246 0.32474 7.3727 10.1671 8.12 9.140.5% Garlic 3 8.8767 1.87241 1.08104 4.2254 13.528 6.78 10.381.0% Garlic 3 7.1096 0.52361 0.30231 5.8089 8.4103 6.55 7.582.0% Garlic 3 7.5411 0.27391 0.15814 6.8607 8.2215 7.34 7.854.0% Garlic 3 7.5795 0.2216 0.12794 7.029 8.1299 7.4 7.83Total 15 7.9754 1.07094 0.27651 7.3823 8.5684 6.55 10.38
Page 218
194
Table 2 Descriptive statistics of feed utilization indices and survival rate of African
catfish (Clarias gariepinus) juveniles fed 30% Allium sativum crude polysaccharide
extracts supplemented diets for 60 d.
Page 219
195
Table 3 Descriptive statistics of haematological indices and body proximate
composition parameters of African catfish (Clarias gariepinus) juveniles fed 30%
Allium sativum crude polysaccharide extracts supplemented diets for 60 d.
Std. Deviation Std. Error
95% Confidence Interval for Mean
N Mean Lower Bound Upper Bound Mini Max
WBC Control 3 47.5 6.15386 3.55293 32.213 62.787 42.1 54.2
0.5% Garlic 3 50.7667 3.4858 2.01253 42.1074 59.4259 46.75 53
1.0% Garlic 3 41.4333 3.84231 2.21836 31.8885 50.9782 37.2 44.7
2.0% Garlic 3 47.3167 1.92635 1.11218 42.5313 52.102 45.35 49.2
4.0% Garlic 3 47.65 11.22731 6.48209 19.7598 75.5402 40.65 60.6
Total 15 46.9333 6.13464 1.58396 43.5361 50.3306 37.2 60.6
LYM Control 3 38.4833 0.57951 0.33458 37.0437 39.9229 37.95 39.1
0.5% Garlic 3 42.6167 2.22785 1.28625 37.0824 48.151 40.05 44.05
1.0% Garlic 3 38.5 4.45084 2.5697 27.4435 49.5565 33.4 41.6
2.0% Garlic 3 42.4667 1.594 0.9203 38.507 46.4264 40.75 43.9
4.0% Garlic 3 38.62 1.50622 0.86962 34.8783 42.3617 37.15 40.16
Total 15 40.1373 2.89966 0.74869 38.5316 41.7431 33.4 44.05
MON Control 3 2.2333 0.57951 0.33458 0.7937 3.6729 1.7 2.85
0.5% Garlic 3 3.4167 0.50083 0.28916 2.1725 4.6608 2.85 3.8
1.0% Garlic 3 1.4167 0.27538 0.15899 0.7326 2.1007 1.1 1.6
2.0% Garlic 3 2.45 0.47697 0.27538 1.2651 3.6349 2.15 3
4.0% Garlic 3 2.5 1.47309 0.85049 -1.1594 6.1594 1.6 4.2
Total 15 2.4033 0.93512 0.24145 1.8855 2.9212 1.1 4.2
GRAN Control 3 2.45 0.69462 0.40104 0.7245 4.1755 2 3.25
0.5% Garlic 3 4.7167 0.7911 0.45674 2.7515 6.6819 3.85 5.4
1.0% Garlic 3 2.85 0.83217 0.48045 0.7828 4.9172 2.25 3.8
2.0% Garlic 3 2.7667 0.59231 0.34197 1.2953 4.2381 2.4 3.45
4.0% Garlic 3 2.0333 0.63311 0.36553 0.4606 3.6061 1.55 2.75
Total 15 2.9633 1.12971 0.29169 2.3377 3.5889 1.55 5.4
HCT Control 3 0.2058 0.071 0.04099 0.0295 0.3822 0.14 0.28
0.5% Garlic 3 0.237 0.01754 0.01013 0.1934 0.2806 0.22 0.26
1.0% Garlic 3 0.2257 0.02954 0.01705 0.1523 0.299 0.2 0.26
2.0% Garlic 3 0.2295 0.01994 0.01151 0.18 0.279 0.22 0.25
4.0% Garlic 3 0.2036 0.03227 0.01863 0.1235 0.2838 0.17 0.22
Total 15 0.2203 0.03582 0.00925 0.2005 0.2402 0.14 0.28
MCV Control 3 111.35 4.13068 2.38485 101.0888 121.6112 108.6 116.1
0.5% Garlic 3 117.6833 5.39776 3.1164 104.2745 131.0921 111.6 121.9
1.0% Garlic 3 115.5333 9.63397 5.56217 91.6012 139.4654 106.4 125.6
Page 220
196
2.0% Garlic 3 124.5167 6.63067 3.82822 108.0452 140.9882 118.05 131.3
4.0% Garlic 3 123.2833 7.91033 4.56703 103.633 142.9337 114.15 127.95
Total 15 118.4733 7.79242 2.01199 114.158 122.7886 106.4 131.3
RDWa Control 3 79.2667 2.80238 1.61795 72.3052 86.2282 77 82.4
0.5% Garlic 3 81.8 4.00905 2.31463 71.841 91.759 79.05 86.4
1.0% Garlic 3 77.2167 6.48389 3.74348 61.1098 93.3235 72.45 84.6
2.0% Garlic 3 86.0333 12.53239 7.23558 54.9011 117.1655 74.25 99.2
4.0% Garlic 3 90.2667 10.96099 6.32833 63.0381 117.4953 79.6 101.5
Total 15 82.9167 8.53032 2.20252 78.1927 87.6406 72.45 101.5
HGB Control 3 119 1.5 0.86603 115.2738 122.7262 117.5 120.5
0.5% Garlic 3 131 10.75872 6.21155 104.2739 157.7261 120.5 142
1.0% Garlic 3 129.3333 18.92969 10.92906 82.3094 176.3573 116 151
2.0% Garlic 3 122.8333 11.55783 6.67291 94.1221 151.5446 112 135
4.0% Garlic 3 117.6667 2.25462 1.30171 112.0659 123.2675 115.5 120
Total 15 123.9667 10.89473 2.81301 117.9334 130 112 151
MCHC Control 3 534.6667 3.17543 1.83333 526.7785 542.5549 531 536.5
0.5% Garlic 3 553.8333 10.75097 6.20707 527.1264 580.5402 542 563
1.0% Garlic 3 554.8333 13.54929 7.82269 521.175 588.4916 542 569
2.0% Garlic 3 526.8333 8.00521 4.62181 506.9473 546.7194 519 535
4.0% Garlic 3 524.3333 10.86662 6.27384 497.3392 551.3275 514.5 536
Total 15 538.9 15.90283 4.10609 530.0933 547.7067 514.5 569
MCH Control 3 65.1 1.67108 0.9648 60.9488 69.2512 63.7 66.95
0.5% Garlic 3 65.1833 2.48713 1.43595 59.005 71.3617 62.85 67.8
1.0% Garlic 3 66.2333 3.06159 1.76761 58.6279 73.8387 62.7 68.1
2.0% Garlic 3 66.8 1.2278 0.70887 63.75 69.85 65.75 68.15
4.0% Garlic 3 65.8667 2.40849 1.39054 59.8836 71.8497 63.35 68.15
Total 15 65.8367 2.02639 0.52321 64.7145 66.9588 62.7 68.15
RBC Control 3 1.3517 0.18724 0.1081 0.8865 1.8168 1.15 1.52
0.5% Garlic 3 2.0083 0.12868 0.07429 1.6887 2.328 1.86 2.09
1.0% Garlic 3 1.9633 0.37978 0.21927 1.0199 2.9068 1.71 2.4
2.0% Garlic 3 1.8833 0.20306 0.11724 1.3789 2.3878 1.65 2.02
4.0% Garlic 3 1.2883 0.37869 0.21864 0.3476 2.2291 1.05 1.73
Total 15 1.699 0.39888 0.10299 1.4781 1.9199 1.05 2.4
PLT Control 3 8.7 0.60828 0.35119 7.189 10.211 8 9.1
0.5% Garlic 3 9.6667 2.08167 1.20185 4.4955 14.8378 8 12
1.0% Garlic 3 9.6667 1.1547 0.66667 6.7982 12.5351 9 11
2.0% Garlic 3 11.1667 2.5658 1.48137 4.7929 17.5405 9 14
4.0% Garlic 3 8.6667 1.60728 0.92796 4.674 12.6594 7.5 10.5
Total 15 9.5733 1.74907 0.45161 8.6047 10.5419 7.5 14
Moisture Control 3 72.2957 0.10966 0.06331 72.0232 72.5681 72.23 72.42
0.5% Garlic 3 72.7933 0.6877 0.39704 71.085 74.5017 72 73.22
1.0% Garlic 3 72.043 0.5876 0.33925 70.5833 73.5027 71.4 72.55
Page 221
197
2.0% Garlic 3 72.063 1.09591 0.63272 69.3406 74.7854 70.82 72.89
4.0% Garlic 3 72.7712 1.51152 0.87268 69.0164 76.526 71.39 74.39
Total 15 72.3932 0.85626 0.22108 71.9191 72.8674 70.82 74.39
Ash Control 3 6.4067 2.48528 1.43488 0.2329 12.5805 3.9 8.87
0.5% Garlic 3 6.87 0.87504 0.50521 4.6963 9.0437 5.9 7.6
1.0% Garlic 3 6.7333 0.55293 0.31924 5.3598 8.1069 6.1 7.12
2.0% Garlic 3 6.99 0.11136 0.06429 6.7134 7.2666 6.87 7.09
4.0% Garlic 3 7.248 0.53007 0.30603 5.9312 8.5648 6.93 7.86
Total 15 6.8496 1.07732 0.27816 6.253 7.4462 3.9 8.87
Lipid Control 3 8.8867 0.53613 0.30953 7.5549 10.2185 8.31 9.37
0.5% Garlic 3 8.9933 3.32506 1.91973 0.7334 17.2532 5.68 12.33
1.0% Garlic 3 8.5785 1.70714 0.98562 4.3377 12.8193 6.67 9.96
2.0% Garlic 3 6.829 0.38882 0.22449 5.8631 7.7949 6.47 7.24
4.0% Garlic 3 6.767 0.8713 0.50304 4.6026 8.9314 5.8 7.49
Total 15 8.0109 1.79944 0.46461 7.0144 9.0074 5.68 12.33
Protein Control 3 69.9367 2.06776 1.19382 64.8001 75.0733 67.98 72.1
0.5% Garlic 3 70.7233 1.205 0.69571 67.7299 73.7167 69.86 72.1
1.0% Garlic 3 71.88 2.11026 1.21836 66.6378 77.1222 69.66 73.86
2.0% Garlic 3 72.22 0.62602 0.36143 70.6649 73.7751 71.65 72.89
4.0% Garlic 3 70.3533 1.46603 0.84641 66.7115 73.9951 68.97 71.89
Total 15 71.0227 1.6279 0.42032 70.1212 71.9242 67.98 73.86
Page 222
198
Table 4 Test of homogeneity of variance in growth, feed utilization, haemato-
biochemical indices, and body proximate composition parameters of African catfish
(Clarias gariepinus) juveniles fed 30% Allium sativum crude polysaccharide extracts
supplemented diets for 60 d.
Test of Homogeneity of VariancesLevene Statisticdf1 df2 Sig.
WG 3.386 4 10 0.054AGR 3.386 4 10 0.054SGR 2.6 4 10 0.1CF 0.697 4 10 0.611HSI 8.46 4 10 0.052VSI 5.595 4 10 0.063FI 2.43 4 10 0.116FCR 0.764 4 10 0.572FER 0.629 4 10 0.653PER 0.629 4 10 0.653WBC 4.364 4 10 0.057LYM 4.43 4 10 0.06MONO 4.958 4 10 0.058GRAN 0.214 4 10 0.925HCT 1.333 4 10 0.323MCV 0.617 4 10 0.66RDWa 1.402 4 10 0.302HGB 3.863 4 10 0.058MCHC 0.929 4 10 0.485MCH 0.906 4 10 0.496RBC 2.563 4 10 0.104PLT 1.877 4 10 0.191Moisture 2.573 4 10 0.103Ash 2.521 4 10 0.107Lipid 2.234 4 10 0.138protein 0.849 4 10 0.525FW 3.387 4 10 0.054
Page 223
199
Table 5 Analysis of variances (ANOVA) of growth and feed utilization indices of
African catfish (Clarias gariepinus) juveniles fed 30% Allium sativum crude
polysaccharide extracts supplemented diets for 60 d.
ANOVASum of Squaresdf Mean Square F Sig.
FW Between Groups 7032.927 4 1758.232 9.827 0.002Within Groups 1789.111 10 178.911Total 8822.038 14
WG Between Groups 7032.831 4 1758.208 9.827 0.002Within Groups 1789.151 10 178.915Total 8821.982 14
AGR Between Groups 1.954 4 0.488 9.827 0.002Within Groups 0.497 10 0.05Total 2.451 14
SGR Between Groups 1.86 4 0.465 10.809 0.001Within Groups 0.43 10 0.043Total 2.29 14
CF Between Groups 0.092 4 0.023 1.522 0.268Within Groups 0.151 10 0.015Total 0.243 14
HSI Between Groups 0.289 4 0.072 0.165 0.951Within Groups 4.367 10 0.437Total 4.656 14
VSI Between Groups 7.616 4 1.904 2.255 0.135Within Groups 8.441 10 0.844Total 16.057 14
FI Between Groups 324.632 4 81.158 15.711 0Within Groups 51.657 10 5.166Total 376.289 14
FCR Between Groups 0.46 4 0.115 8.441 0.003Within Groups 0.136 10 0.014Total 0.596 14
FER Between Groups 1.247 4 0.312 7.329 0.005Within Groups 0.425 10 0.043Total 1.672 14
PER Between Groups 7.814 4 1.954 9.827 0.002Within Groups 1.988 10 0.199
Page 224
200
Table 6 Analysis of variances (ANOVA) of haematological and body proximate
composition indices of African catfish (Clarias gariepinus) juveniles fed 30% Allium
sativum crude polysaccharide extracts supplemented diets for 60 d.
ANOVA
Sum of Squares df
Mean Square F Sig.
WBC Between Groups 137.778 4 34.445 0.885 0.507 Within Groups 389.095 10 38.91 Total 526.873 14 LYM Between Groups 57.875 4 14.469 2.418 0.117 Within Groups 59.837 10 5.984 Total 117.713 14 MON Between Groups 6.122 4 1.531 2.501 0.109 Within Groups 6.12 10 0.612 Total 12.242 14 GRAN Between Groups 12.762 4 3.191 6.25 0.009 Within Groups 5.105 10 0.511 Total 17.867 14 HCT Between Groups 0.003 4 0.001 0.43 0.784 Within Groups 0.015 10 0.002 Total 0.018 14 MCV Between Groups 359.003 4 89.751 1.828 0.2 Within Groups 491.102 10 49.11 Total 850.104 14 RDWa Between Groups 332.387 4 83.097 1.211 0.365 Within Groups 686.342 10 68.634 Total 1018.728 14 HGB Between Groups 431.733 4 107.933 0.878 0.511 Within Groups 1230 10 123 Total 1661.733 14 MCHC Between Groups 2557.767 4 639.442 6.506 0.008 Within Groups 982.833 10 98.283 Total 3540.6 14 MCH Between Groups 6.167 4 1.542 0.3 0.871 Within Groups 51.32 10 5.132 Total 57.487 14 RBC Between Groups 1.466 4 0.367 4.818 0.02 Within Groups 0.761 10 0.076 Total 2.227 14 PLT Between Groups 12.423 4 3.106 1.021 0.442
Page 225
201
Within Groups 30.407 10 3.041 Total 42.829 14 Moisture Between Groups 1.633 4 0.408 0.473 0.755 Within Groups 8.632 10 0.863 Total 10.264 14 Ash Between Groups 1.166 4 0.291 0.193 0.936 Within Groups 15.083 10 1.508 Total 16.249 14 Lipid Between Groups 14.995 4 3.749 1.236 0.356 Within Groups 30.336 10 3.034 Total 45.332 14 protein Between Groups 11.657 4 2.914 1.145 0.39 Within Groups 25.444 10 2.544
Page 226
202
Table 7 Post hoc test (Duncan multiple range test) of growth parameters of African
catfish (Clarias gariepinus) juveniles fed 30% Allium sativum crude polysaccharide
extracts supplemented diets for 60 d.
Weight Gain Final WeightDuncan a Duncan aGroups N Subset for alpha = 0.05 Groups N Subset for alpha = 0.05
1 2 3 4 1 2 3 44.0% Garlic 3 54.7733 4.0% Garlic 3 67.4233Control 3 80.7333 Control 3 93.38330.5% Garlic 3 87.14 87.14 0.5% Garlic 3 99.79 99.791.0% Garlic 3 111.397 111.4 1.0% Garlic 3 124.047 124.0472.0% Garlic 3 113.51 2.0% Garlic 3 126.16Sig. 1 0.57 0.051 0.85 Sig. 1 0.57 0.051 0.85Means for groups in homogeneous subsets are displayed. Means for groups in homogeneous subsets are displayed.a Uses Harmonic Mean Sample Size = 3.000. a Uses Harmonic Mean Sample Size = 3.000.Specific Growth Rate Absolute Growth RateDuncan a Duncan aGroups N Subset for alpha = 0.05 Groups N Subset for alpha = 0.05
1 2 3 4 1 2 3 44.0% Garlic 3 2.9084 4.0% Garlic 3 0.9129Control 3 3.3601 Control 3 1.34560.5% Garlic 3 3.4801 3.4801 0.5% Garlic 3 1.4523 1.45231.0% Garlic 3 3.8315 3.8315 1.0% Garlic 3 1.8566 1.85662.0% Garlic 3 3.8747 2.0% Garlic 3 1.8918Sig. 1 0.495 0.065 0.804 Sig. 1 0.57 0.051 0.85Means for groups in homogeneous subsets are displayed. Means for groups in homogeneous subsets are displayed.a Uses Harmonic Mean Sample Size = 3.000. a Uses Harmonic Mean Sample Size = 3.000.Condition Factor Hepatosomatic Index Viscerosomatic IndexDuncan a Duncan a Duncan aGroups N Subset for alpha = 0.05Groups N Subset for alpha = 0.05 Groups N Subset for alpha = 0.05
1 1 12.0% Garlic 3 0.4752 4.0% Garlic 3 2.9651 1.0% Garlic 3 7.10961.0% Garlic 3 0.4886 Control 3 3.0371 2.0% Garlic 3 7.5411Control 3 0.5383 0.5% Garlic 3 3.1108 4.0% Garlic 3 7.57950.5% Garlic 3 0.5559 1.0% Garlic 3 3.1309 Control 3 8.76994.0% Garlic 3 0.6955 2.0% Garlic 3 3.3756 0.5% Garlic 3 8.8767Sig. 0.072 Sig. 0.497 Sig. 0.056Means for groups in homogeneous subsets are displayed.Means for groups in homogeneous subsets are displayed.Means for groups in homogeneous subsets are displayed.a Uses Harmonic Mean Sample Size = 3.000.a Uses Harmonic Mean Sample Size = 3.000.a Uses Harmonic Mean Sample Size = 3.000.
Page 227
203
Table 8 Post hoc test (Duncan multiple range test) of feed utilization indices of African
catfish (Clarias gariepinus) juveniles fed 30% Allium sativum crude polysaccharide
extracts supplemented diets for 60 d.
FI FCRDuncan a Duncan a
group N Subset for alpha = 0.05 group N Subset for alpha = 0.051 2 3 1 2
4% garlic 3 81.82 2% garlic 3 1.0405control 3 97.2733 1% garlic 3 1.05320.5% garlici 3 103.893 0.5% garlic 3 1.2038 1.20381% garlic 3 114.883 control 3 1.2292 1.22922% garlic 3 117.627 4% garlic 3 1.5012Sig. 1 0.122 0.5 Sig. 0.228 0.064Means for groups in homogeneous subsets are displayed. Means for groups in homogeneous subsets are displayed.a Uses Harmonic Mean Sample Size = 3.000. a Uses Harmonic Mean Sample Size = 3.000.
FER PERDuncan a Duncan a
group N Subset for alpha = 0.05 group N Subset for alpha = 0.051 2 1 2
4% garlic 3 0.6748 4% garlic 3 2.163control 3 0.8282 0.8282 control 3 2.654 2.65440.5% garlici 3 0.8399 0.8399 0.5% garlic 3 2.692 2.6922% garlic 3 0.9648 2% garlic 3 3.09241% garlic 3 0.9663 1% garlic 3 3.0972Sig. 0.133 0.211 Sig. 0.133 0.211Means for groups in homogeneous subsets are displayed.Means for groups in homogeneous subsets are displayed.a Uses Harmonic Mean Sample Size = 3.000. a Uses Harmonic Mean Sample Size = 3.000.
Page 228
204
Table 9 Quadratic regression model output on weight gain and feed efficiency ratio
against dietary garlic crude polysaccharide inclusion level in African catfish (Clarias
gariepinus) juveniles’ culture.
WGModel SummaryR R Square Adjusted R SquareStd. Error of the Estimate
0.875 0.765 0.726 13.142The independent variable is Groups.
ANOVASum of Squaresdf Mean Square F Sig.
Regression 6749.62 2 3374.81 19.541 0Residual 2072.418 12 172.701Total 8822.038 14The independent variable is Groups.
CoefficientsUnstandardized Coefficients Standardized Coefficientst Sig.B Std. Error Beta
Groups 41.689 9.14 2.431 4.561 0.001Groups ** 2 -11.809 2.138 -2.944 -5.524 0(Constant) 77.167 6.452 11.961 0
FERModel SummaryR R Square Adjusted R SquareStd. Error of the Estimate
0.722 0.522 0.442 0.112The independent variable is Groups.
ANOVASum of Squaresdf Mean Square F Sig.
Regression 0.163 2 0.082 6.54 0.012Residual 0.15 12 0.012Total 0.313 14The independent variable is Groups.
CoefficientsUnstandardized Coefficients Standardized Coefficientst Sig.B Std. Error Beta
Groups 0.189 0.078 1.853 2.436 0.031Groups ** 2 -0.056 0.018 -2.322 -3.052 0.01(Constant) 0.807 0.055 14.696 0
Page 229
205
Table 10 Post hoc test (Duncan multiple range test) of haematological indices, and body
proximate composition parameters of African catfish (Clarias gariepinus) fed 30%
Allium sativum crude polysaccharide extracts supplemented diets for 60 d.
WBC LYM HGB PLTDuncan a Duncan a Duncan a Duncan aGroups N Subset for alpha = 0.05 Groups N Subset for alpha = 0.05 Groups N Subset for alpha = 0.05 Groups N Subset for alpha = 0.05
1 1 1 11.0% Garlic 3 41.4333 Control 3 38.4833 4.0% Garlic 3 117.6667 4.0% Garlic 3 8.66672.0% Garlic 3 47.3167 1.0% Garlic 3 38.5 Control 3 119 Control 3 8.7Control 3 47.5 4.0% Garlic 3 38.62 2.0% Garlic 3 122.8333 0.5% Garlic 3 9.66674.0% Garlic 3 47.65 2.0% Garlic 3 42.4667 1.0% Garlic 3 129.3333 1.0% Garlic 3 9.66670.5% Garlic 3 50.7667 0.5% Garlic 3 42.6167 0.5% Garlic 3 131 2.0% Garlic 3 11.1667Sig. 0.123 Sig. 0.086 Sig. 0.205 Sig. 0.137
Means for groups in homogeneous subsets are displayed.Means for groups in homogeneous subsets are displayed.Means for groups in homogeneous subsets are displayed.Means for groups in homogeneous subsets are displayed.a Uses Harmonic Mean Sample Size = 3.000. a Uses Harmonic Mean Sample Size = 3.000. a Uses Harmonic Mean Sample Size = 3.000. a Uses Harmonic Mean Sample Size = 3.000.
MONO GRAN MCHC MoistureDuncan a Duncan a Duncan a Duncan aGroups N Subset for alpha = 0.05 Groups N Subset for alpha = 0.05 Groups N Subset for alpha = 0.05 Groups N Subset for alpha = 0.05
1 2 1 2 1 2 11.0% Garlic 3 1.4167 4.0% Garlic 3 2.0333 4.0% Garlic 3 524.3333 1.0% Garlic 3 72.043Control 3 2.2333 2.2333 Control 3 2.45 2.0% Garlic 3 526.8333 2.0% Garlic 3 72.0632.0% Garlic 3 2.45 2.45 2.0% Garlic 3 2.7667 Control 3 534.6667 Control 3 72.29574.0% Garlic 3 2.5 2.5 1.0% Garlic 3 2.85 0.5% Garlic 3 553.8333 4.0% Garlic 3 72.77120.5% Garlic 3 3.4167 0.5% Garlic 3 4.7167 1.0% Garlic 3 554.8333 0.5% Garlic 3 72.7933Sig. 0.145 0.115 Sig. 0.221 1 Sig. 0.251 0.904 Sig. 0.382
Means for groups in homogeneous subsets are displayed.Means for groups in homogeneous subsets are displayed.Means for groups in homogeneous subsets are displayed.Means for groups in homogeneous subsets are displayed.a Uses Harmonic Mean Sample Size = 3.000. a Uses Harmonic Mean Sample Size = 3.000. a Uses Harmonic Mean Sample Size = 3.000. a Uses Harmonic Mean Sample Size = 3.000.
GRAN HCT MCH AshDuncan a Duncan a Duncan a Duncan aGroups N Subset for alpha = 0.05 Groups N Subset for alpha = 0.05 Groups N Subset for alpha = 0.05 Groups N Subset for alpha = 0.05
1 2 1 1 14.0% Garlic 3 2.0333 4.0% Garlic 3 0.2036 Control 3 65.1 Control 3 6.4067Control 3 2.45 Control 3 0.2058 0.5% Garlic 3 65.1833 1.0% Garlic 3 6.73332.0% Garlic 3 2.7667 1.0% Garlic 3 0.2257 4.0% Garlic 3 65.8667 0.5% Garlic 3 6.871.0% Garlic 3 2.85 2.0% Garlic 3 0.2295 1.0% Garlic 3 66.2333 2.0% Garlic 3 6.990.5% Garlic 3 4.7167 0.5% Garlic 3 0.237 2.0% Garlic 3 66.8 4.0% Garlic 3 7.248Sig. 0.221 1 Sig. 0.358 Sig. 0.415 Sig. 0.456
Means for groups in homogeneous subsets are displayed.Means for groups in homogeneous subsets are displayed.Means for groups in homogeneous subsets are displayed.Means for groups in homogeneous subsets are displayed.a Uses Harmonic Mean Sample Size = 3.000. a Uses Harmonic Mean Sample Size = 3.000. a Uses Harmonic Mean Sample Size = 3.000. a Uses Harmonic Mean Sample Size = 3.000.
MCV RDWa RBC LipidDuncan a Duncan a Duncan a Duncan aGroups N Subset for alpha = 0.05 Groups N Subset for alpha = 0.05 Groups N Subset for alpha = 0.05 Groups N Subset for alpha = 0.05
1 1 1 2 1Control 3 111.35 1.0% Garlic 3 77.2167 4.0% Garlic 3 1.2883 4.0% Garlic 3 6.7671.0% Garlic 3 115.5333 Control 3 79.2667 Control 3 1.3517 2.0% Garlic 3 6.8290.5% Garlic 3 117.6833 0.5% Garlic 3 81.8 2.0% Garlic 3 1.8833 1.0% Garlic 3 8.57854.0% Garlic 3 123.2833 2.0% Garlic 3 86.0333 1.0% Garlic 3 1.9633 Control 3 8.88672.0% Garlic 3 124.5167 4.0% Garlic 3 90.2667 0.5% Garlic 3 2.0083 0.5% Garlic 3 8.9933Sig. 0.061 Sig. 0.106 Sig. 0.784 0.608 Sig. 0.18Means for groups in homogeneous subsets are displayed.Means for groups in homogeneous subsets are displayed.Means for groups in homogeneous subsets are displayed.Means for groups in homogeneous subsets are displayed.a Uses Harmonic Mean Sample Size = 3.000. a Uses Harmonic Mean Sample Size = 3.000. a Uses Harmonic Mean Sample Size = 3.000. a Uses Harmonic Mean Sample Size = 3.000.
ProteinDuncan aGroups N Subset for alpha = 0.05
1Control 3 69.93674.0% Garlic 3 70.35330.5% Garlic 3 70.72331.0% Garlic 3 71.882.0% Garlic 3 72.22Sig. 0.138Means for groups in homogeneous subsets are displayed.a Uses Harmonic Mean Sample Size = 3.000.
Page 230
206
Table 11 Kaplan–Meier analysis (survival) output of African catfish (Clarias
gariepinus) juveniles subjected to low water pH after being fed 30% Allium sativum
crude polysaccharide extracts supplemented diets for 60 d.
Overall ComparisonsChi-Square df Sig.
Log Rank (Mantel-Cox) 8.153 4 0.086Breslow (Generalized Wilcoxon) 5.413 4 0.248Tarone-Ware 6.582 4 0.16Test of equality of survival distributions for the different levels of Group.
Page 231
207
Appendix C
Table 1 Descriptive statistics of growth performance indices of African catfish (Clarias
gariepinus) fed Aloe vera-Allium sativum polysaccharide mixture supplemented diets for
60 d.
N Mean Std. DeviationStd. Error 95% Confidence Interval for MeanMinimum MaximumLower BoundUpper Bound
FW Control 3 76.4267 3.68609 2.12816 67.2699 85.5834 72.23 79.140.50% 3 81.5 7.01986 4.05292 64.0617 98.9383 75.5 89.221.00% 3 90.6 6.8942 3.98037 73.4739 107.7261 84.2 97.92.00% 3 72.18 1.98071 1.14356 67.2597 77.1003 69.94 73.74.00% 3 68.8067 1.28535 0.7421 65.6137 71.9997 67.4 69.92
Total 15 77.9027 8.89392 2.2964 72.9774 82.828 67.4 97.9WG Control 3 64.1467 3.68609 2.12816 54.9899 73.3034 59.95 66.86
0.50% 3 69.22 7.01986 4.05292 51.7817 86.6583 63.22 76.941.00% 3 78.32 6.8942 3.98037 61.1939 95.4461 71.92 85.622.00% 3 59.9 1.98071 1.14356 54.9797 64.8203 57.66 61.424.00% 3 56.5267 1.28535 0.7421 53.3337 59.7197 55.12 57.64
Total 15 65.6227 8.89392 2.2964 60.6974 70.548 55.12 85.62AGR Control 3 1.0691 0.06143 0.03547 0.9165 1.2217 1 1.11
0.50% 3 1.1537 0.117 0.06755 0.863 1.4443 1.05 1.281.00% 3 1.2442 0.14478 0.08359 0.8846 1.6039 1.08 1.362.00% 3 0.9983 0.03301 0.01906 0.9163 1.0803 0.96 1.024.00% 3 0.9421 0.02142 0.01237 0.8889 0.9953 0.92 0.96
Total 15 1.0815 0.13483 0.03481 1.0068 1.1562 0.92 1.36SGR Control 3 3.046 0.08143 0.04701 2.8437 3.2482 2.95 3.11
0.50% 3 3.1503 0.14179 0.08186 2.7981 3.5026 3.03 3.311.00% 3 3.3276 0.12616 0.07284 3.0142 3.641 3.21 3.462.00% 3 2.9516 0.04604 0.02658 2.8372 3.0659 2.9 2.994.00% 3 2.872 0.03123 0.01803 2.7944 2.9496 2.84 2.9
Total 15 3.0695 0.18349 0.04738 2.9679 3.1711 2.84 3.46CF Control 3 0.5732 0.04538 0.0262 0.4604 0.6859 0.52 0.61
0.50% 3 0.521 0.11966 0.06908 0.2237 0.8182 0.43 0.661.00% 3 0.6598 0.04546 0.02624 0.5469 0.7727 0.61 0.72.00% 3 0.6507 0.03689 0.0213 0.559 0.7424 0.62 0.694.00% 3 0.5862 0.04948 0.02857 0.4633 0.7091 0.53 0.63
Total 15 0.5982 0.07763 0.02004 0.5552 0.6412 0.43 0.7HSI Control 3 1.6639 0.20712 0.11958 1.1494 2.1784 1.52 1.9
0.50% 3 2.2914 0.3016 0.17413 1.5422 3.0406 2.01 2.611.00% 3 2.5857 0.19175 0.1107 2.1094 3.062 2.38 2.762.00% 3 2.0434 0.08202 0.04735 1.8397 2.2472 1.97 2.134.00% 3 2.0386 0.16135 0.09316 1.6377 2.4394 1.86 2.18
Total 15 2.1246 0.35924 0.09275 1.9257 2.3235 1.52 2.76VSI Control 3 5.3794 0.77144 0.44539 3.463 7.2958 4.82 6.26
0.50% 3 7.4522 0.7268 0.41962 5.6467 9.2577 6.96 8.291.00% 3 6.0683 0.46262 0.26709 4.9191 7.2175 5.63 6.552.00% 3 7.3617 0.64865 0.3745 5.7503 8.973 6.61 7.744.00% 3 8.7078 1.59186 0.91906 4.7534 12.6622 7.31 10.44
Total 15 6.9939 1.43483 0.37047 6.1993 7.7885 4.82 10.44
Page 232
208
Table 2 Descriptive statistics of feed utilization indices of African catfish (Clarias
gariepinus) fed Aloe vera-Allium sativum polysaccharide mixture supplemented diets for
60 d.
N Mean Std. DeviationStd. Error 95% Confidence Interval for MeanMinimum MaximumLower BoundUpper Bound
FI Control 3 98.7567 0.35445 0.20464 97.8762 99.6372 98.35 990.50% 3 99.0683 1.31302 0.75808 95.8066 102.3301 97.56 99.911.00% 3 98.3897 2.95949 1.70866 91.0379 105.7415 94.99 100.392.00% 3 97.6533 2.86572 1.65452 90.5345 104.7722 94.48 100.044.00% 3 94.4433 5.72532 3.30552 80.2208 108.6658 88.98 100.4
Total 15 97.6623 3.22265 0.83208 95.8776 99.4469 88.98 100.4FCR Control 3 1.5433 0.09452 0.05457 1.3085 1.7781 1.47 1.65
0.50% 3 1.4433 0.14012 0.0809 1.0953 1.7914 1.3 1.581.00% 3 1.2633 0.11372 0.06566 0.9808 1.5458 1.17 1.392.00% 3 1.63 0.01 0.00577 1.6052 1.6548 1.62 1.644.00% 3 1.67 0.08718 0.05033 1.4534 1.8866 1.61 1.77
Total 15 1.51 0.17271 0.04459 1.4144 1.6056 1.17 1.77FER Control 3 0.6496 0.03865 0.02231 0.5536 0.7456 0.61 0.68
0.50% 3 0.6987 0.06953 0.04014 0.526 0.8714 0.63 0.771.00% 3 0.7962 0.06806 0.03929 0.6271 0.9653 0.72 0.852.00% 3 0.6133 0.00278 0.0016 0.6065 0.6202 0.61 0.624.00% 3 0.5996 0.02932 0.01693 0.5268 0.6725 0.57 0.62
Total 15 0.6715 0.08435 0.02178 0.6248 0.7182 0.57 0.85PER Control 3 2.03 0.12078 0.06973 1.7299 2.33 1.89 2.12
0.50% 3 2.1834 0.21728 0.12545 1.6437 2.7232 1.98 2.411.00% 3 2.4882 0.21268 0.12279 1.9598 3.0165 2.25 2.672.00% 3 1.9167 0.00868 0.00501 1.8952 1.9383 1.91 1.924.00% 3 1.8739 0.09162 0.0529 1.6463 2.1015 1.77 1.94
Total 15 2.0984 0.26359 0.06806 1.9525 2.2444 1.77 2.67
Page 233
209
Table 3 Descriptive statistics of haematological indices and body composition
proximate parameters of African catfish (Clarias gariepinus) fed Aloe vera-Allium
sativum polysaccharide mixture supplemented diets for 60 d.
N Mean
Std. Deviation
Std. Error
95% Confidence Interval for Mean Min Max
Lower Bound
Upper Bound
WBC Control 3 57.0667 5.62257 3.24619 43.0994 71.0339 50.6 60.8 0.50% 3 58.0333 4.67047 2.6965 46.4312 69.6354 53.9 63.1
1.00% 3 63.7833 1.38774 0.80121 60.336 67.2307 62.3 65.0
5
2.00% 3 56.9833 2.93783 1.69616 49.6854 64.2813 53.9 59.7
5 4.00% 3 57.3333 5.68888 3.28448 43.2014 71.4653 50.9 61.7
Total 15 58.64 4.58212 1.1831 56.1025 61.1775 50.6
65.05
Lym Control 3 29.9 9.50631 5.48847 6.285 53.515 20.2 39.2 0.50% 3 27.2667 4.43772 2.56212 16.2428 38.2906 23.2 32
1.00% 3 32.6333 1.5987 0.92301 28.6619 36.6047 30.9 34.0
5 2.00% 3 27.2833 9.71807 5.61073 3.1423 51.4244 20.4 38.4 4.00% 3 26.6333 5.40494 3.12054 13.2067 40.0599 20.5 30.7
Total 15 28.7433 6.25785 1.61577 25.2779 32.2088 20.2 39.2
Mon Control 3 1.9 0.60828 0.35119 0.389 3.411 1.2 2.3 0.50% 3 2.4 0.1 0.05774 2.1516 2.6484 2.3 2.5 1.00% 3 2.2667 0.57951 0.33458 0.8271 3.7063 1.6 2.65 2.00% 3 1.9333 0.46188 0.26667 0.786 3.0807 1.4 2.2 4.00% 3 2.0333 0.92916 0.53645 -0.2748 4.3415 1.4 3.1
Total 15 2.1067 0.54474 0.14065 1.805 2.4083 1.2 3.1
Gran Control 3 1.6 0.52915 0.30551 0.2855 2.9145 1.2 2.2 0.50% 3 2.4167 0.20207 0.11667 1.9147 2.9186 2.2 2.6 1.00% 3 2.5833 0.88929 0.51343 0.3742 4.7924 1.8 3.55 2.00% 3 2.1 0.37749 0.21794 1.1623 3.0377 1.7 2.45 4.00% 3 2 0.60828 0.35119 0.489 3.511 1.3 2.4
Total 15 2.14 0.59797 0.1544 1.8089 2.4711 1.2 3.55
HCT Control 3 0.1947 0.03675 0.02122 0.1034 0.286 0.17 0.24 0.50% 3 0.2117 0.03523 0.02034 0.1241 0.2992 0.18 0.25 1.00% 3 0.253 0.03005 0.01735 0.1783 0.3277 0.22 0.27 2.00% 3 0.2202 0.05144 0.0297 0.0924 0.348 0.18 0.28 4.00% 3 0.2013 0.0168 0.0097 0.1596 0.2431 0.18 0.22
Total 15 0.2162 0.03691 0.00953 0.1957 0.2366 0.17 0.28
Page 234
210
MCV Control 3 138.733
3 2.01329 1.16237 133.732 143.734
6 136.6 140.
6
0.50% 3 137.316
7 4.28554 2.47426 126.6708 147.962
5 133.7 142.
05
1.00% 3 131.616
7 10.53664 6.08333 105.4422 157.791
1 119.7 139.
7
2.00% 3 143.583
3 3.90587 2.25506 133.8806 153.286
1 139.1 146.
25
4.00% 3 133.966
7 8.33447 4.81191 113.2627 154.670
6 127 143.
2
Total 15
137.0433 7.02124 1.81288 133.1551
140.9316 119.7
146.25
RDWa Control 3 94.4 12.79414 7.3867 62.6176 126.182
4 79.9 104.
1
0.50% 3 99.0167 3.49154 2.01584 90.3432 107.690
1 95.2 102.
05
1.00% 3 101.866
7 14.13164 8.15891 66.7617 136.971
6 90 117.
5
2.00% 3 106.983
3 3.83873 2.21629 97.4474 116.519
3 104.45 111.
4
4.00% 3 99.5333 6.90386 3.98595 82.3832 116.683
5 92.5 106.
3
Total 15 100.36 8.97779 2.31806 95.3883
105.3317 79.9
117.5
HGB Control 3 103 14.93318 8.62168 65.9039 140.096
1 92 120
0.50% 3 108.833
3 12.829 7.40683 76.9643 140.702
3 98 123
1.00% 3 132.5 6.61438 3.81881 116.069 148.931 125 137.
5
2.00% 3 113.833
3 27.25038 15.7330
2 46.1396 181.527 91 144
4.00% 3 111 14.42221 8.32666 75.1733 146.826
7 95 123
Total 15
113.8333 17.44447 4.50414 104.1729
123.4938 91 144
MCHC Control 3 530.333
3 22.50185 12.9914
5 474.4356 586.231 505 548
0.50% 3 517.333
3 26.40707 15.2461
3 451.7345 582.932
1 494 546
1.00% 3 526.833
3 41.28054 23.8333
3 424.2868 629.379
9 503 574.
5
2.00% 3 517.833
3 11.36148 6.55956 489.6098 546.056
8 507.5 530
4.00% 3 550.666
7 27.02468 15.6027
1 483.5336 617.799
7 520 571
Total 15 528.6 26.37924 6.81109 513.9917
543.2083 494
574.5
MCH Control 3 71.5 1.83303 1.0583 66.9465 76.0535 69.9 73.5 0.50% 3 71.0667 3.26548 1.88532 62.9548 79.1786 67.3 73.1 1.00% 3 69.15 1.13027 0.65256 66.3423 71.9577 68.2 70.4 2.00% 3 74.35 0.6265 0.36171 72.7937 75.9063 73.75 75 4.00% 3 73.6333 0.9609 0.55478 71.2463 76.0203 72.6 74.5
Total 15 71.94 2.47099 0.63801 70.5716 73.3084 67.3 75
RBC Control 3 1.4 0.25981 0.15 0.7546 2.0454 1.25 1.7 0.50% 3 1.5417 0.25624 0.14794 0.9051 2.1782 1.34 1.83 1.00% 3 1.92 0.09539 0.05508 1.683 2.157 1.83 2.02
Page 235
211
2.00% 3 1.5317 0.34808 0.20096 0.667 2.3963 1.23 1.91 4.00% 3 1.5133 0.21385 0.12347 0.9821 2.0446 1.28 1.7
Total 15 1.5813 0.27865 0.07195 1.427 1.7356 1.23 2.02
PLT Control 3 20.6667 6.50641 3.75648 4.5039 36.8295 14 27 0.50% 3 31.4333 9.81139 5.66461 7.0605 55.8062 23.8 42.5 1.00% 3 30.1667 4.0104 2.31541 20.2043 40.1291 26 34 2.00% 3 38.1667 7.14726 4.12647 20.4119 55.9214 32 46 4.00% 3 28.9333 4.56216 2.63397 17.6003 40.2664 24 33
Total 15 29.8733 8.12399 2.09761 25.3744 34.3722 14 46
Moisture Control 3 72.2957 0.10966 0.06331 72.0232 72.5681 72.23 72.4
2
0.50% 3 72.7933 0.6877 0.39704 71.085 74.5017 72 73.2
2
1.00% 3 72.043 0.5876 0.33925 70.5833 73.5027 71.4 72.5
5
2.00% 3 72.063 1.09591 0.63272 69.3406 74.7854 70.82 72.8
9
4.00% 3 72.7757 1.51075 0.87223 69.0228 76.5286 71.39 74.3
9
Total 15 72.3941 0.85648 0.22114 71.9198 72.8684 70.82
74.39
Ash Control 3 5.6833 1.04505 0.60336 3.0873 8.2794 5.07 6.89 0.50% 3 6.9867 0.94522 0.54572 4.6386 9.3347 6.03 7.92 1.00% 3 6.3333 1.67739 0.96844 2.1665 10.5002 4.98 8.21 2.00% 3 6.98 1.55393 0.89716 3.1198 10.8402 5.21 8.12 4.00% 3 7.29 0.33779 0.19502 6.4509 8.1291 6.98 7.65
Total 15 6.6547 1.18489 0.30594 5.9985 7.3108 4.98 8.21
Lipid Control 3 9.3133 1.23087 0.71064 6.2557 12.371 7.91 10.2
1 0.50% 3 8.2667 0.56801 0.32794 6.8557 9.6777 7.89 8.92 1.00% 3 7.44 0.50478 0.29143 6.1861 8.6939 6.98 7.98 2.00% 3 6.6933 0.6309 0.36425 5.1261 8.2606 5.97 7.13 4.00% 3 7.18 0.41073 0.23714 6.1597 8.2003 6.89 7.65
Total 15 7.7787 1.13552 0.29319 7.1498 8.4075 5.97
10.21
Protein Control 3 70.7467 1.7065 0.98525 66.5075 74.9858 68.92 72.3
0.50% 3 73.7 3.3208 1.91726 65.4507 81.9493 69.89 75.9
8
1.00% 3 72.7 1.03068 0.59506 70.1397 75.2603 72.09 73.8
9
2.00% 3 76.5033 5.38749 3.11047 63.1201 89.8866 70.3 80.0
1 4.00% 3 75.6967 3.57033 2.06133 66.8275 84.5659 71.98 79.1
Total 15 73.8693 3.56392 0.9202 71.8957 75.843 68.92
80.01
Page 236
212
Table 4 Test of homogeneity of variance in growth, feed utilization, haematological, and
body proximate composition indices of African catfish (Clarias gariepinus) juveniles
fed Aloe vera-Allium sativum polysaccharide mixture supplemented diets for 60 d.
Test of Homogeneity of VariancesLevene Statisticdf1 df2 Sig.
FW 2.259 4 10 0.135WG 1.988 4 10 0.172AGR 3.451 4 10 0.051SGR 1.797 4 10 0.206CF 2.932 4 10 0.076HSI 1.043 4 10 0.432VSI 1.897 4 10 0.188FI 2.488 4 10 0.11FCR 1.7 4 10 0.226FER 2.424 4 10 0.117PER 2.408 4 10 0.118WBC 1.896 4 10 0.188Lym 1.945 4 10 0.179Mono 3.771 4 10 0.054Gran 1.847 4 10 0.197HCT 1.285 4 10 0.339MCV 2.979 4 10 0.074RDWa 2.651 4 10 0.096HGB 1.889 4 10 0.189MCHC 1.96 4 10 0.177MCH 4.141 4 10 0.051RBC 1.287 4 10 0.339PLT 1.06 4 10 0.425moisture 2.538 4 10 0.106Ash 2.099 4 10 0.156Lipid 2.51 4 10 0.108Protein 2.845 4 10 0.082
Page 237
213
Table 5 Analysis of variances (ANOVA) of growth and feed utilization indices of
African catfish (Clarias gariepinus) juveniles fed Aloe vera-Allium sativum
polysaccharide mixture supplemented diets for 60 d.
ANOVASum of Squares df Mean Square F Sig.
FW Between Groups 875.483 4 218.871 9.436 0.002Within Groups 231.942 10 23.194Total 1107.425 14
WG Between Groups 875.483 4 218.871 9.436 0.002Within Groups 231.942 10 23.194Total 1107.425 14
AGR Between Groups 0.175 4 0.044 5.459 0.014Within Groups 0.08 10 0.008Total 0.255 14
SGR Between Groups 0.38 4 0.095 10.379 0.001Within Groups 0.091 10 0.009Total 0.471 14
CF Between Groups 0.04 4 0.01 2.239 0.137Within Groups 0.045 10 0.004Total 0.084 14
HSI Between Groups 1.4 4 0.35 8.604 0.003Within Groups 0.407 10 0.041Total 1.807 14
VSI Between Groups 20.238 4 5.059 5.894 0.011Within Groups 8.584 10 0.858Total 28.822 14
FI Between Groups 42.196 4 10.549 1.022 0.442Within Groups 103.2 10 10.32Total 145.396 14
FCR Between Groups 0.319 4 0.08 8.11 0.004Within Groups 0.098 10 0.01Total 0.418 14
FER Between Groups 0.076 4 0.019 8.027 0.004Within Groups 0.024 10 0.002Total 0.1 14
PER Between Groups 0.742 4 0.185 8.027 0.004Within Groups 0.231 10 0.023Total 0.973 14
Page 238
214
Table 6 Analysis of variances (ANOVA) of haematological and body proximate
composition indices of African catfish (Clarias gariepinus) juveniles fed Aloe vera-
Allium sativum polysaccharide mixture supplemented diets for 60 d.
ANOVA Sum of Squares df Mean Square F Sig. WBC Between Groups 101.248 4 25.312 1.314 0.33 Within Groups 192.693 10 19.269 Total 293.941 14
Lym Between Groups 75.703 4 18.926 0.401 0.804 Within Groups 472.547 10 47.255 Total 548.249 14 Mono Between Groups 0.569 4 0.142 0.397 0.806 Within Groups 3.585 10 0.359 Total 4.154 14
Gran Between Groups 1.758 4 0.439 1.353 0.317 Within Groups 3.248 10 0.325 Total 5.006 14 HCT Between Groups 0.006 4 0.002 1.211 0.365 Within Groups 0.013 10 0.001 Total 0.019 14
MCV Between Groups 253.851 4 63.463 1.455 0.287 Within Groups 436.318 10 43.632 Total 690.169 14
RDWa Between Groups 252.444 4 63.111 0.72 0.597 Within Groups 875.967 10 87.597 Total 1128.411 14
HGB Between Groups 1496.5 4 374.125 1.354 0.317 Within Groups 2763.833 10 276.383 Total 4260.333 14 MCHC Between Groups 2207.767 4 551.942 0.733 0.59 Within Groups 7534.333 10 753.433 Total 9742.1 14
MCH Between Groups 52.248 4 13.062 3.93 0.036 Within Groups 33.233 10 3.323 Total 85.481 14 RBC Between Groups 0.469 4 0.117 1.895 0.188 Within Groups 0.618 10 0.062 Total 1.087 14
PLT Between Groups 470.836 4 117.709 2.598 0.101 Within Groups 453.153 10 45.315 Total 923.989 14
Moisture Between Groups 1.643 4 0.411 0.476 0.753
Page 239
215
Within Groups 8.627 10 0.863 Total 10.27 14
Ash Between Groups 4.999 4 1.25 0.853 0.524 Within Groups 14.656 10 1.466 Total 19.655 14
Lipid Between Groups 12.733 4 3.183 5.985 0.01 Within Groups 5.318 10 0.532 Total 18.052 14 protein Between Groups 64.272 4 16.068 1.415 0.298 Within Groups 113.549 10 11.355 Total 177.821 14
Page 240
216
Table 7 Post hoc test (Duncan multiple range test) of growth, and feed utilization
indices of African catfish (Clarias gariepinus) fingerlings fed Aloe vera-Allium sativum
polysaccharide mixture supplemented diets for 60 d.
Final Weight Duncan a Weight Gain Duncan aAbsoultue Growth RateDuncan a Groups N Subset for alpha = 0.05 Groups N Subset for alpha = 0.05Groups N Subset for alpha = 0.05 1 2 3 1 2 3
1 2 4.00% 3 56.53 4.00% 3 0.9424.00% 3 68.8 2.00% 3 59.9 2.00% 3 0.998 12.00% 3 72.2 Control 3 64.15 64 Control 3 1.069 1
Control 3 76.4 76 0.50% 3 69 0.50% 3 1 1.1540.50% 3 82 1.00% 3 78.32 1.00% 3 1.2441.00% 3 Sig. 0.094 0.2 1 Sig. 0.127 0 0.243
Sig. 0.09 0.2Means for groups in homogeneous subsets are displayed. Means for groups in homogeneous subsets are displayed.Means for groups in homogeneous subsets are displayed.a Uses Harmonic Mean Sample Size = 3.000. a Uses Harmonic Mean Sample Size = 3.000.
a Uses Harmonic Mean Sample Size = 3.000.
Duncan aSpecific Growth Rate Duncan a Condition Factor Duncan aHepatosomatic IndexGroups N Subset for alpha = 0.05Groups N Subset for alpha = 0.05 Groups N Subset for alpha = 0.05
1 2 1 2 1 2 34.00% 3 2.87 0.50% 3 0.521 Control 3 1.6642.00% 3 2.95 Control 3 0.573 0.6 4.00% 3 2.039 2
Control 3 3.05 3 4.00% 3 0.586 0.6 2.00% 3 2.043 20.50% 3 3.2 2.00% 3 0.651 0.7 0.50% 3 2 2.2911.00% 3 1.00% 3 0.7 1.00% 3 2.586
Sig. 0.06 0.2 Sig. 0.05 0.2 Sig. 0.052 0 0.104Means for groups in homogeneous subsets are displayed.Means for groups in homogeneous subsets are displayed. Means for groups in homogeneous subsets are displayed.a Uses Harmonic Mean Sample Size = 3.000.a Uses Harmonic Mean Sample Size = 3.000. a Uses Harmonic Mean Sample Size = 3.000.
Duncan aViscerosomatic Index Duncan a Feed Intake Duncan aFeed Conversion RatioGroups N Subset for alpha = 0.05Groups N Subset for alpha = 0.05 Groups N Subset for alpha = 0.05
1 2 1 1 2 3Control 3 5.38 4.00% 3 94.44 1.00% 3 1.2631.00% 3 6.07 6.1 2.00% 3 97.65 0.50% 3 1.443 12.00% 3 7.4 1.00% 3 98.39 Control 3 2 1.5430.50% 3 7.5 Control 3 98.76 2.00% 3 2 1.634.00% 3 0.50% 3 99.07 4.00% 3 1.67
Sig. 0.38 0.1 Sig. 0.136 Sig. 0.05 0 0.166Means for groups in homogeneous subsets are displayed.Means for groups in homogeneous subsets are displayed. Means for groups in homogeneous subsets are displayed.a Uses Harmonic Mean Sample Size = 3.000.a Uses Harmonic Mean Sample Size = 3.000. a Uses Harmonic Mean Sample Size = 3.000.
Duncan aFeed efficiency ratio Duncan a Protein Efficiency RatioGroups N Subset for alpha = 0.05Groups N Subset for alpha = 0.05
1 2 1 2 34.00% 3 0.6 4.00% 3 1.8742.00% 3 0.61 0.6 2.00% 3 1.917 1.9
Control 3 0.65 0.6 Control 3 2.03 20.50% 3 0.7 0.50% 3 2.21.00% 3 1.00% 3 2.4882
Sig. 0.26 0.1 Sig. 0.257 0.1 1Means for groups in homogeneous subsets are displayed.Means for groups in homogeneous subsets are displayed.a Uses Harmonic Mean Sample Size = 3.000.a Uses Harmonic Mean Sample Size = 3.000.
Page 241
217
Table 8 Quadratic regression model output on weight gain and feed efficiency ratio
against dietary Aloe vera-Allium sativum polysaccharide mixture in African catfish
(Clarias gariepinus) juveniles’ culture.
WGModel SummaryR R Square Adjusted R SquareStd. Error of the Estimate
0.239 0.057 -0.1 4.806The independent variable is Groups.
ANOVASum of Squaresdf Mean SquareF Sig.
Regression 16.729 2 8.365 0.362 0.704Residual 277.212 12 23.101Total 293.941 14The independent variable is Groups.
CoefficientsUnstandardized CoefficientsStandardized Coefficientst Sig.B Std. Error Beta
Groups 2.014 3.343 0.643 0.603 0.558Groups ** 2 -0.578 0.782 -0.789 -0.739 0.474(Constant) 58.075 2.36 24.612 0
FERModel SummaryR R Square Adjusted R SquareStd. Error of the Estimate
0.193 0.037 -0.123 0.046The independent variable is Groups.
ANOVASum of Squaresdf Mean SquareF Sig.
Regression 0.001 2 0 0.231 0.797Residual 0.025 12 0.002Total 0.026 14The independent variable is Groups.
CoefficientsUnstandardized CoefficientsStandardized Coefficientst Sig.B Std. Error Beta
Groups 0.021 0.032 0.704 0.653 0.526Groups ** 2 -0.004 0.007 -0.626 -0.58 0.573(Constant) 0.588 0.023 26.034 0
Page 242
218
Table 9 Post hoc test (Duncan multiple range test) of haemato-biochemical indices of
African catfish (Clarias gariepinus) fed Aloe vera-Allium sativum polysaccharide
mixture supplemented diets for 60 d.
Duncan a WBC Duncan a Lym Duncan aMonoGroups N Subset for alpha = 0.05 Groups N Subset for alpha = 0.05 Groups N Subset for alpha = 0.05
1 1 12.00% 3 57 4.00% 3 26.63 Control 3 1.9
Control 3 57.1 0.50% 3 27.27 2.00% 3 1.9334.00% 3 57.3 2.00% 3 27.28 4.00% 3 2.0330.50% 3 58 Control 3 29.9 1.00% 3 2.2671.00% 3 63.8 1.00% 3 32.63 0.50% 3 2.4
Sig. 0.11 Sig. 0.347 Sig. 0.367Means for groups in homogeneous subsets are displayed.Means for groups in homogeneous subsets are displayed.Means for groups in homogeneous subsets are displayed.
Duncan a Granu Duncan a HCT Duncan aMCVGroups N Subset for alpha = 0.05Groups N Subset for alpha = 0.05 Groups N Subset for alpha = 0.05
1 1 1Control 3 1.6 Control 3 0.195 1.00% 3 131.64.00% 3 2 4.00% 3 0.201 4.00% 3 1342.00% 3 2.1 0.50% 3 0.212 0.50% 3 137.30.50% 3 2.42 2.00% 3 0.22 Control 3 138.71.00% 3 2.58 1.00% 3 0.253 2.00% 3 143.6
Sig. 0.08 Sig. 0.097 Sig. 0.069Means for groups in homogeneous subsets are displayed.Means for groups in homogeneous subsets are displayed.Means for groups in homogeneous subsets are displayed.
Duncan a RDWa Duncan a HGB Duncan aMCHCGroups N Subset for alpha = 0.05 Groups N Subset for alpha = 0.05 Groups N Subset for alpha = 0.05
1 1 1Control 3 94.4 Control 3 103 0.50% 3 517.30.50% 3 99 0.50% 3 108.8 2.00% 3 517.84.00% 3 99.5 4.00% 3 111 1.00% 3 526.81.00% 3 102 2.00% 3 113.8 Control 3 530.32.00% 3 107 1.00% 3 132.5 4.00% 3 550.7
Sig. 0.16 Sig. 0.074 Sig. 0.201Means for groups in homogeneous subsets are displayed.Means for groups in homogeneous subsets are displayed.Means for groups in homogeneous subsets are displayed.
Duncan a MCH Duncan a RBC Duncan aPLTGroups N Subset for alpha = 0.05Groups N Subset for alpha = 0.05 Groups N Subset for alpha = 0.05
1 2 1 2 1 21.00% 3 69.2 Control 3 1.4 Control 3 20.670.50% 3 71.1 71.1 4.00% 3 1.513 1.5 4.00% 3 28.93 29
Control 3 71.5 71.5 2.00% 3 1.532 1.5 1.00% 3 30.17 304.00% 3 73.6 0.50% 3 1.542 1.5 0.50% 3 31.43 312.00% 3 74.4 1.00% 3 1.9 2.00% 3 38
Sig. 0.16 0.07 Sig. 0.529 0.1 Sig. 0.098 0Means for groups in homogeneous subsets are displayed.Means for groups in homogeneous subsets are displayed.Means for groups in homogeneous subsets are displayed.
Duncan a Moisture Duncan a Ash Duncan aLipidGroups N Subset for alpha = 0.05 Groups N Subset for alpha = 0.05 Groups N Subset for alpha = 0.05
1 1 1 2 31.00% 3 72 Control 3 5.683 2.00% 3 6.6932.00% 3 72.1 1.00% 3 6.333 4.00% 3 7.18 7
Control 3 72.3 2.00% 3 6.98 1.00% 3 7.44 74.00% 3 72.8 0.50% 3 6.987 0.50% 3 8 8.2670.50% 3 72.8 4.00% 3 7.29 Control 3 9.313
Sig. 0.38 Sig. 0.165 Sig. 0.259 0 0.109Means for groups in homogeneous subsets are displayed.Means for groups in homogeneous subsets are displayed. Means for groups in homogeneous subsets are displayed.
Duncan a ProteinGroups N Subset for alpha = 0.05
1Control 3 70.7
1.00% 3 72.70.50% 3 73.74.00% 3 75.72.00% 3 76.5
Sig. 0.08
Page 243
219
Table 10 Kaplan–Meier analysis (survival) output of African catfish (Clarias
gariepinus) fingerlings subjected to low water pH after being fed Aloe vera-Allium
sativum polysaccharide mixture supplemented diets for 60 d.
Overall Comparisons
Chi-Square df Sig.Log Rank (Mantel-Cox) 19.705 4 0.001Breslow (Generalized Wilcoxon) 10.375 4 0.035Tarone-Ware 14.144 4 0.007Test of equality of survival distributions for the different levels of Groups.
Page 244
220
Appendix D
(1) Research permission letter from the director of postgraduate studies.
Page 245
221
(2) Research ethical clearance from the postgraduate studies committee.
Page 246
222
(3) Supervision agreement letter.
4th April 2017
5 April 2017
Page 247
223
(4) Supervision letter from the current main supervisor Dr. Margit Wilhelm (2018 -
2019), department of fisheries and aquatic sciences, University of Namibia.
SUBMISSION
To: Prof. H. Bello HOD: Postgraduate Studies Faculty of Agriculture University of Namibia
From: Dr. Margit Wilhelm
Department of Fisheries and Aquatic Sciences Sam Nujoma Campus University of Namibia Henties Bay
Date: 13 June 2018 Postgraduate student supervision This is to inform you that I agree to supervise the following student: Mr. Naftal Gabriel (200516566) for his PhD Degree studies in the Department of Fisheries and Aquatic Sciences. His project title is: “Dietary aloe and garlic polysaccharides: Effects on growth, performance, body composition and haematological parameters of Clarias gariepinus”. I am replacing Prof. Edosa Omoregie, who is no longer employed at the University of Namibia. Yours sincerely, ___________________ Margit Wilhelm, PhD Email: [email protected]
Page 248
224
(5) Supervision letter from Dr. Michael Habte-Tsion (co-supervisor, 2018 -2019),
department of aquaculture nutrition, Kentucky State University, USA.