Page 1
arX
iv:a
stro
-ph/
9602
069v
1 1
4 Fe
b 19
96
DIFFUSE IONIZED GAS IN SPIRAL GALAXIES: PROBING LYMAN
CONTINUUM PHOTON LEAKAGE FROM HII REGIONS?
Annette M. N. Ferguson1 and Rosemary F. G. Wyse1,2
Department of Physics and Astronomy, The Johns Hopkins University, Baltimore, MD 21218
J. S. Gallagher III
Department of Astronomy, University of Wisconsin, Madison, WI 53706
Deidre A. Hunter
Lowell Observatory, 1400 W. Mars Hill Rd., Flagstaff, AZ 86001
ABSTRACT
As part of a large study to map the distribution of star formation across galactic
disks, we have obtained deep Hα images of the nearby Sculptor Group spirals
NGC 247 and NGC 7793. These images are of sufficiently high quality that they
allow identification and analysis of diffuse Hα emission at surface brightness levels
ranging from those of extremely low density HII regions to those of the local Galactic
disk diffuse emission. This paper presents a study of the large scale distribution and
global energetics of diffuse ionized gas (DIG) in these galaxies and investigates the
association between DIG and discrete HII regions. Our results support the hypothesis
that the DIG is photoionized by Lyc photons which leak out of traditional HII regions,
and suggest that the local HI column density plays a role in regulating the amount
of leakage which can occur. This interpretation has profound implications for the
derivation of star-formation rates based on Hα emission–line fluxes since HII region
counts alone will lead to significant underestimates of the true rate. The contribution
of the diffuse Hα component to the total Hα emission, ie. the diffuse fraction, in these
galaxies is found to be similar to values found in other disk galaxies with differing
Hubble types and star formation rates. The constancy of the diffuse fraction is rather
unexpected and implies that the overall fraction of photons which can leak out of HII
regions and ionize the ISM over large scales is relatively invariant from one galaxy to
another.
Subject headings: Normal Galaxies; HII Regions; Interstellar Matter; Star Formation
1Visiting Astronomer, Cerro Tololo Inter-American Observatory. CTIO is operated by AURA, Inc. under contract
to the National Science Foundation.
2Center for Particle Astrophysics, University of California, Berkeley, CA 94720, USA
Page 2
– 2 –
1. Introduction
Understanding the relationship between the star formation process and the interstellar
medium is a key step towards unravelling the complex history of galaxy evolution. A longstanding
problem has been the nature and importance of the feedback process by which massive stars
deposit energy into the interstellar medium via photoionization, stellar winds and supernovae.
This feedback mechanism affects the physical and dynamical state of the interstellar medium and
hence influences the rate and distribution of subsequent star formation. OB stars clearly provide
the largest source of Lyman continuum (Lyc) photons in typical spiral galaxies (Abbott 1982); a
major issue concerns whether the bulk of these photons are deposited over localized regions, such
as the Stromgren spheres which define traditional HII regions, or whether a significant fraction
can escape from the regions of recent star formation where they were created and can ionize the
interstellar medium over much larger scales. If large–scale ionization due to Lyc photon leakage
from HII regions were a common feature of spiral galaxies, then the resulting diffuse ionized
gas (DIG) component would provide an important tracer of the feedback process due to star
formation, as well the structure of the interstellar medium. It would be of crucial importance
to include this component in calculations of radial and global star formation rates derived on
the basis of Hα emission line fluxes. Furthermore, the existence of such a DIG component would
have direct bearing on the energy balance of the interstellar medium, regardless of the source of
photons that maintain it in an ionized state.
Indeed, the existence of widespread diffuse ionized gas lying outside the boundaries of
traditional HII regions has been known for over 20 years (Reynolds et al. 1971; Monnet 1971), but
the source of this ionization remains the subject of much debate. Pulsar dispersion measures and
optical line emission have been used to trace the Galactic DIG component (the ‘Reynolds Layer’)
and have established it to be an extremely important component of the interstellar medium,
occupying more than 20% of the interstellar volume, contributing at least 1/3 of the total HI
column at the solar circle and constituting ∼ 90% of the ionized hydrogen mass in the Galaxy
(see review by Reynolds 1991 and references therein). The location of the Sun close to the plane
of the disk of the Milky Way means that the vertical structure of the ionized gas is more easily
studied than is its radial distribution; it has been established that the Galactic DIG is distributed
in a thick disk with a scale–height locally of ∼ 1 kpc. Much of the DIG (sometimes referred
to as the Warm Ionized Medium; WIM) is observed to be in the form of discrete structures,
such as loops, filaments and shells (which are not obviously associated with discrete HII regions)
while the remainder is in the form of an apparently unstructured, diffuse background (Reynolds
1993). The power required to maintain this low-density (ne ∼ 0.1 cm−3), warm (< 10000 K)
ionized component is large – 1.0 × 10⁻⁴ erg s−1 cm−2 of disk – and can be met easily only by
ionizing photons from OB stars, although the kinetic energy from supernovae could possibly suffice
(Reynolds 1984; Kulkarni and Heiles 1988).
The identification of OB stars as the source of the ionization of the Galactic DIG would require
Page 3
– 3 –
that Lyman continuum photons be able to travel several hundred parsecs both perpendicular
to the plane, to account for the derived vertical scale–height of a kiloparsec, and parallel to the
plane, to account for the DIG seen at large radial distances from OB stars (see Reynolds 1990).
These requirements are even greater in irregular galaxies, where ionized gas has been observed
at distances of ∼> 1 kpc from bright OB associations (Hunter and Gallager 1990; Hunter and
Gallagher 1992). Recent calculations suggest that it is indeed possible for a large fraction of
ionizing photons to penetrate sufficiently large distances from their point of origin, depending on
cloud properties and distributions, as well as on their radial gas distributions (Dove and Shull
1994; Miller and Cox 1993). The observed optical emission line ratios of the Galactic DIG can
be explained by a rather dilute radiation field and hence argue further for photoionization by
distant OB stars (Domgorgen and Mathis 1994). Alternative sources for the ionizing radiation
that maintains the DIG which have been proposed include shocks, decaying massive neutrinos
(Sciama 1990), turbulent mixing layers (Slavin, Shull and Begelman 1993) and Galactic microflares
(Raymond 1992). In addition, significant contributions to the ionizing flux may come from evolved
stellar objects such as planetary nebula nuclei, hot white dwarfs and blue horizontal branch stars.
The large scale radial distribution of the DIG across galactic disks can provide stringent
constraints on the source of its ionization. For example, if the amount of Lyc photons produced
in star–forming regions were the only factor responsible, then the DIG distribution and intensity
should be expected to correlate, over both small and large scales, with that of discrete HII
regions. Furthermore, DIG properties should also be expected to vary systematically with the
morphological type of the host galaxy, reflecting the underlying variation in star formation and
structure within the ISM (Kennicutt, Edgar and Hodge 1989). Study of such correlations requires
observations of external galaxies at moderate inclinations. To date, few quantitative studies of the
DIG in external galaxies have been carried out, and the emphasis has largely been on edge–on
systems (eg. Rand, Kulkarni and Hester 1990; Dettmar 1992; Veilleux et al. 1995). Walterbos and
Braun (1994; hereafter WB94) studied the DIG component in selected areas of the nearby spiral
M31, but their small field of view restricted them to local analysis and they could not assess the
overall distribution and energetics of the ionized gas they detected.
The first quantitative study of the large–scale distribution and global energetics of diffuse
ionized gas in moderately face–on external disk galaxies is presented in this paper. Our data
consist of large field of view, deep Hα images of Sculptor Group late–type spirals NGC 247 and
NGC 7793 which were obtained as part of a large study to map the distribution of star formation
across galactic disks. NGC 7793 has been previously noted for having a significant DIG component
(Monnet 1971) but this earlier work was limited to photographic data, with surface brightness and
spatial resolution limits significantly lower than the CCD data presented here. Basic properties
of these galaxies are listed in Table 1. In the present paper, we derive the radial and azimuthal
distributions of the DIG and investigate the association between DIG and discrete HII regions. We
also study the global and radial variation of the diffuse fraction and the Lyc power requirements,
which allow tight constraints to be placed on the origin and nature of DIG component in spiral
Page 4
– 4 –
galaxies. Our results support the hypothesis that the DIG is photoionized by Lyc photons which
leak out of discrete HII regions, and suggest that the local HI column density plays a role in
regulating the amount of leakage which can occur. Given this hypothesis, we discuss the great
importance of taking account of the DIG component when deriving star formation rates based on
Hα emission line fluxes.
2. Observations and Data Analysis
The observations were carried out at the Cerro Tololo Inter–American Observatory (CTIO)
during the nights of December 14 – 18, 1993 and September 28 – October 2, 1994. Images were
obtained with the Tek 2048 × 2048 CCD on the 1.5m telescope, at f/7.5. The resulting pixel scale
was 0.44′′ and the field of view was 15′ on a side, corresponding to physical sizes of approximately
6 pc and 13 kpc, respectively, at the mean distance of our galaxies. The Hα filter was 68 A wide
(FWHM) centered on 6554 A and encompassed the [NII] lines. A broadband R filter was used for
the continuum observations. Total exposure times ranged from 3600 – 5700 secs in Hα and from
600 – 840 secs in R. The seeing was in the range of 1.2 – 2.5′′.
The large angular extent of the galaxies on the sky – 25th magnitude isophotes of 10.1′ × 6.1′
for NGC 7793 and 5.4′ × 19.9′ for NGC 247 (Carignan 1985) –resulted in several fields being
required to map each galaxy completely. Using the ‘shift and stare’ technique, we imaged each
galaxy in two sections along the major axis. Well–exposed, median–filtered twilight sky frames
were used to flat-field the images, and all frames were corrected to an airmass of zero. Images
of each section were registered and those taken through the same filter were combined using an
average sigma-clipping algorithm. The sky to be subtracted was determined in each of these
combined Hα and R–band frames as the mean of the mean pixel value in a series of 100 × 100
pixel boxes positioned well outside the Holmberg diameters. The uncertainty in the determination
of the sky value due to large scale flat–fielding errors was less than or equal to 1% in each case.
Foreground stars in the frames were used to determine the scaling factors between the Hα and
R–band images, and the scaled continuum images were subtracted from the Hα.
Observations of standard stars from the list of Stone and Baldwin (1983) were used to
calibrate the Hα images. Instrumental magnitudes of several stars were measured on the Hα
continuum–unsubtracted images. Standard magnitudes were derived from Stone and Baldwin
(1983) by integrating the interpolated flux at Hα across the filter band–pass, assuming a top–hat
transmission curve. Comparison of the two magnitudes provided the conversion between observed
counts and absolute flux. There are no previously measured HII regions with which to compare
our measurements. Our neglect of factors such as the true shape of the filter transmission curve
and the variation of stellar flux across the band–pass is likely to lead to uncertainties in the
calibration factor of ± 20%. The average sensitivity of the Hα continuum-subtracted images,
Page 5
– 5 –
taken to be 1σ of the sky background, is 4.3× 10⁻¹⁸ erg s−1 cm−2 pix−1 for the NGC 7793 image,
and 6.4× 10⁻¹⁸ erg s−1 cm−2 pix−1 for the NGC 247 image. These values correspond to emission
measures1 (EM) per pixel of ∼ 11 pc cm−6 and ∼ 16 pc cm−6 respectively, for an assumed electron
temperature of 104 K . The scaled R–band images had sufficiently high S/N that the noise in the
Hα continuum–subtracted images was limited by the noise in the original Hα frame alone.
The two separate Hα continuum–subtracted images of each galaxy were mosaiced together to
give a field of 13.8′ × 17.5′ centered on NGC 7793 and 10.6′ × 23.8′ centered on NGC 247. In
the mosaicing process, care was taken to ensure that fluxes of objects common to both frames
were matched. The sky levels across the mosaiced images were measured in areas beyond the
Holmberg diameters and were 0 ± 1.5 pc cm−6 in the NGC 7793 frame and 0 ± 3.2 pc cm−6
in the NGC 247 frame. This combination of low sky noise, small flat–fielding errors and a large
number of pixels allows us to reach very low Hα+[NII] surface brightnesses, comparable to those
observed locally in the Reynolds layer (∼ 6 pc cm−6; Reynolds 1984). Thus, a direct comparison
of the diffuse ionized ISM in the Milky Way and in external galaxies can be made.
A bright, foreground star was present in the field of NGC 247. Pixels contaminated
by emission from this star were masked out and subsequently ignored in the analysis. Hα
continuum–subtracted, mosaiced images of NGC 7793 and NGC 247 are shown in Figure 1 at two
different surface brightness cuts.
3. Isolating the Diffuse Hα Emission
The separation of total Hα flux into that from discrete HII regions and that from diffuse
emission is somewhat complex and subtle and there is as yet no standard procedure. Various
criteria have previously been adopted, for example based on the strength of forbidden line ratios
(WB94) or on the equivalent width of the Hα line (Veilleux et al. 1995). The current limited
information available concerning how DIG properties and excitation vary within and between
galaxies prevents a rigorous assessment of how appropriate either of these methods is for isolating
the diffuse emission in a truly unbiased manner. A much simpler approach to the separation,
based on surface brightness, is adopted here. We experimented with our images until we found a
simple isophotal cut which eliminated the bulk of the discrete HII region population. This cut was
made at a surface brightness of 1.6 × 10⁻¹⁶ erg s−1 cm−2/⊓⊔′′, uncorrected for [NII] or extinction,
corresponding to an EM of 80 pc cm−6 per pixel (for an assumed Te = 104 K); most of the Hα
emission lying below this could be classified as filamentary and/or diffuse. For comparison, this
isophotal cut is lower than the limits employed by recent studies of discrete HII region populations
1Emission measure is related to Rayleighs, the commonly used unit of surface brightness in Galactic DIG studies,
by EM (pc cm−6) = 2.78×IHα (Rayleighs) for Te=104 K.
Page 6
– 6 –
in spiral galaxies (Scowen 1992; Kennicutt et al. 1988) and also lower than the isophotal limit
which WB94 found isolated the bulk of the diffuse Hα emission in M31 (EM < 100 pc cm−6).
Hence, the present approach to the separation of the two components of the Hα emission is a
conservative one. Figure 2 illustrates the diffuse Hα emission in high–resolution subsections of
each galaxy, by masking out pixels having EM > 80 pc cm−6.
The moderate inclinations of the galaxies studied here do not allow us to determine whether
diffuse Hα emission is also superimposed on discrete HII regions, though this is very likely to be the
case. We point out that the observed DIG properties are derived only from pixels uncontaminated
by the emission of HII regions, and hence are strictly lower bounds to the true values.
It is of great importance to verify that the diffuse Hα emission we detect is indeed a distinct
source of emission (ie. ionized locally) and not simply recombination photons which are scattered
out of discrete HII regions. Following WB94, we consider two possible distinct mechanisms for
light scattering that could occur.
First, light could be scattered in the telescope and detector system, producing extended wings
to the point spread function and possibly containing a significant fraction of the total light. To
check for such an effect, we carried out aperture photometry of several bright stars in the Hα
frames of both galaxies. The stars chosen were isolated and far removed from any galaxian light.
In every case, at least 95% of the total emitted light was enclosed within an aperture of radius
11 pixels, corresponding to 4.8′′. The results of the aperture photometry were used to derive
azimuthally–averaged radial surface brightness profiles, which revealed that the total decline in
surface brightness (∼ 10 mag/⊓⊔′′) occurred over a radius of only 15 – 20 ′′. Beyond this radius,
much less than one percent of the total Hα light remained. As a result, if the diffuse emission
were merely Hα light from HII regions, scattered by the telescope optics, then it should be highly
localised around those regions and the luminosity of the diffuse component should be significantly
less than that of the discrete HII regions. As we will discuss below, there is no evidence for
either of these requirements. Furthermore, the distinct structure of the brighter diffuse emission
– filaments, bubbles, loops – cannot be explained if the diffuse emission were simply the result of
scattered Hα photons in the telescope and detector system.
The second type of scattering which could occur is reflection from dust grains in the HII
regions themselves. Since there is no evidence for halos around bright OB associations in the
R–band continuum images, which should suffer equally, if not more, from the effects of dust
scattering than the Hα images, we conclude that the role of this second type of scattering is also
negligible. We will henceforth refer to the diffuse Hα emission we have detected as diffuse ionized
gas (DIG).
4. Results
Page 7
– 7 –
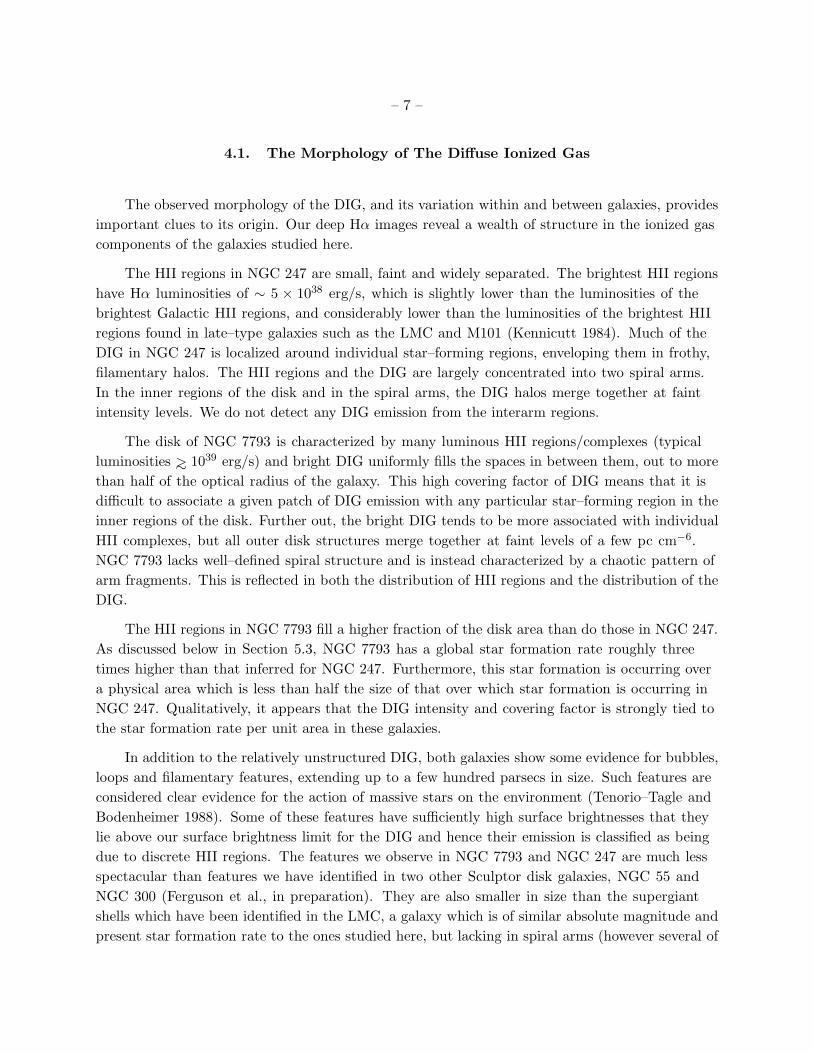
4.1. The Morphology of The Diffuse Ionized Gas
The observed morphology of the DIG, and its variation within and between galaxies, provides
important clues to its origin. Our deep Hα images reveal a wealth of structure in the ionized gas
components of the galaxies studied here.
The HII regions in NGC 247 are small, faint and widely separated. The brightest HII regions
have Hα luminosities of ∼ 5 × 1038 erg/s, which is slightly lower than the luminosities of the
brightest Galactic HII regions, and considerably lower than the luminosities of the brightest HII
regions found in late–type galaxies such as the LMC and M101 (Kennicutt 1984). Much of the
DIG in NGC 247 is localized around individual star–forming regions, enveloping them in frothy,
filamentary halos. The HII regions and the DIG are largely concentrated into two spiral arms.
In the inner regions of the disk and in the spiral arms, the DIG halos merge together at faint
intensity levels. We do not detect any DIG emission from the interarm regions.
The disk of NGC 7793 is characterized by many luminous HII regions/complexes (typical
luminosities ∼> 1039 erg/s) and bright DIG uniformly fills the spaces in between them, out to more
than half of the optical radius of the galaxy. This high covering factor of DIG means that it is
difficult to associate a given patch of DIG emission with any particular star–forming region in the
inner regions of the disk. Further out, the bright DIG tends to be more associated with individual
HII complexes, but all outer disk structures merge together at faint levels of a few pc cm−6.
NGC 7793 lacks well–defined spiral structure and is instead characterized by a chaotic pattern of
arm fragments. This is reflected in both the distribution of HII regions and the distribution of the
DIG.
The HII regions in NGC 7793 fill a higher fraction of the disk area than do those in NGC 247.
As discussed below in Section 5.3, NGC 7793 has a global star formation rate roughly three
times higher than that inferred for NGC 247. Furthermore, this star formation is occurring over
a physical area which is less than half the size of that over which star formation is occurring in
NGC 247. Qualitatively, it appears that the DIG intensity and covering factor is strongly tied to
the star formation rate per unit area in these galaxies.
In addition to the relatively unstructured DIG, both galaxies show some evidence for bubbles,
loops and filamentary features, extending up to a few hundred parsecs in size. Such features are
considered clear evidence for the action of massive stars on the environment (Tenorio–Tagle and
Bodenheimer 1988). Some of these features have sufficiently high surface brightnesses that they
lie above our surface brightness limit for the DIG and hence their emission is classified as being
due to discrete HII regions. The features we observe in NGC 7793 and NGC 247 are much less
spectacular than features we have identified in two other Sculptor disk galaxies, NGC 55 and
NGC 300 (Ferguson et al., in preparation). They are also smaller in size than the supergiant
shells which have been identified in the LMC, a galaxy which is of similar absolute magnitude and
present star formation rate to the ones studied here, but lacking in spiral arms (however several of
Page 8
– 8 –
these supergiant shells have surface brightnesses which lie above our criterion for diffuse emission
(Hunter 1994)). It is tempting to speculate that the sizes of the filamentary and bubble–like
features, which constitute the structured component of the DIG, are a direct result of the intensity
of local star formation, however magnetic fields may play an equally important role in regulating
their morphologies (Elmegreen 1987; Hunter and Gallagher 1990).
4.2. The Distribution of Diffuse Ionized Gas
4.2.1. Azimuthal Variation
The azimuthal variation of Hα emission provides important information on the uniformity of
the intensity distribution of the DIG and on the spatial association between bright HII regions and
the DIG. Figure 3 shows the azimuthal variation of Hα+[NII] emission measure around a series
of four elliptical annuli, chosen to span a large fraction of the optical disk in each galaxy. The
emission measures have not been corrected for extinction. The radial thickness of each annulus
is 250 pc and the data are binned in 2◦ sectors around the azimuthal direction. The adoption
of a fixed angle for azimuthal binning results in a variable smoothing factor in terms of pixels.
For example, in NGC 7793, the azimuthal bin size corresponds to physical areas of size ∼ 250 pc
× 15 pc and × 135 pc in the annuli centered on 0.1R25 and 0.9R25 respectively. In NGC 247, the
bin sizes are ∼ 250 pc × 19 pc and × 175 pc in the 0.1R25 and 0.9R25 annuli. For reference, small
Galactic HII regions have typical diameters of a few tens of parsecs and hence would be smoothed
over in our analysis. While this may account for some of the low surface brightness emission
seen in the azimuthal profiles in Figure 3, visual inspection of the images reassures us that the
bulk of this emission arises from truly diffuse and filamentary structures. The largest HII region
complexes found in late–type spirals have diameters of order a few hundred parsecs (Kennicutt
1984) and hence would be preserved in our azimuthal plots, if centered.
Two key results emerge from the azimuthal analysis. Firstly, in the inner radial bins of both
galaxies, the DIG fills the annuli uniformly defining a baseline in the value of the emission measure.
This baseline is ∼ 100 pc cm−6 in NGC 7993 and ∼ 20 pc cm−6 in NGC 247. As the radial
distance from the center of each galaxy increases, this baseline value gradually decreases and in
the outermost bins here, the Hα emission often becomes too faint to detect far from bright HII
regions and complexes. Secondly, our azimuthal plots reveal that bright HII regions/complexes
often have substantial halos which blend smoothly into the DIG. The brightest DIG emission
appears to be closely associated with sites of recent star formation and the intensity of the DIG
is observed to fall off with distance from the nearest HII region. The plots confirm that, in the
inner disks of both galaxies, it is impossible to associate a given patch of DIG emission with any
particular HII region. At larger galactocentric distances, however, much of the DIG is localized
around bright OB complexes, although these are few in number.
Page 9
– 9 –
Fig. 3.— (a) Plot of the azimuthal variation of uncorrected Hα +[NII] surface brightness at four
radii in NGC 7793 . The radii correspond to 0.1R25, 0.3R25, 0.6R25 and 0.9R25. The width of each
radial bin is 250 pc and the data are azimuthally binned into 2◦ sectors. (b) As in (a) but for NGC
247.
The radial and azimuthal smoothing above, while facilitating qualitative analysis, hampers
the derivation of quantitative information on the typical scales on which DIG is associated with
individual HII regions. Direct inspection of the images (Figures 1 and 2) reveals that DIG can be
found up to distances in the range of 200 – 900 pc from bright HII regions, with a typical extent
of around 500 pc. Clearly, the brighter DIG is associated with HII regions, but at fainter levels, it
becomes ubiquitous.
4.2.2. Radial Variation
In order to study the radial variation of the ionized gas components in these galaxies, we
carried out elliptical aperture photometry on our Hα images, using ellipses fit to the corresponding
R–band images. This approach was chosen since the Hα images themselves are too clumpy
for meaningful ellipses to be fit. The radial step size was 350 pc for NGC 7793 and 500 pc
for NGC 247. Radial surface brightness profiles were derived for the total Hα emission, the
Hα emission from HII regions alone, and the Hα emission from the DIG (using the isophotal
Page 10
– 10 –
surface brightness criterion discussed previously). In calculating the DIG surface brightness, we
normalised to the number of pixels that had a surface brightness less than 80 pc cm−6, as opposed
to the total number of pixels per annulus. This approach freed us from making assumptions about
the intensity of the DIG that is superimposed on bright HII regions. A deprojection was carried
out (cos(i) correction) using the values of the inclination listed in Table 1. We note that if the DIG
emission arises in a thick–disk component then the thin-disk correction we have applied will result
in an underestimate of the true radial surface brightness amplitude. In this case, the deprojection
becomes a complicated function of the radial and vertical profiles of the ionized gas disk and the
dust.
The discrete and diffuse Hα emission was corrected separately for contamination by the
[NII] lines and for the effects of Galactic and internal extinction. Webster and Smith (1983)
have presented spectra for various HII regions in the disk of NGC 7793. We have used these
data to derive the disk-averaged I([NII])/I(Hα) ratio and the Balmer decrement, CHβ, for the
HII regions in NGC 7793 with the result that [NII]/HαHII = 0.22 and CHβ=0.38. We note
that the data available indicate no significant change in the [NII]/Hα ratio across the disk (even
although the galaxy has a moderately steep metallicity gradient). The reddening law of Schild
(1977) then gives an extinction of AHα=0.64. Spectroscopic information does not exist for any HII
regions in NGC 247, so the NII]/Hα ratio and the mean extinction values derived for NGC 7793
were assumed equally applicable for NGC 247. Thus, the derived quantities for NGC 247 are
more uncertain than those for NGC 7793. There has not been a direct measurement of the
[NII]/Hα ratio in the DIG component of the galaxies presented here; however, studies of other
galaxies indicate that this ratio is often systematically higher than that measured for discrete HII
regions (Dettmar 1992; Dettmar and Schultz 1992; Veilleux et al. 1995; Hunter 1994). We adopt
[NII]/HαDIG=0.50 to be consistent with the mean values found in those studies. In the absence
of data which can be used to constrain directly the extinction of the diffuse gas (eg. WB94),
we adopt the same extinction correction for both the DIG and the discrete HII regions unless
otherwise noted. Figure 4 shows the radial variation of the ionized components measured out
to the optical radius and corrected for our adopted [NII] contamination and extinction. In both
galaxies, we clearly detect DIG over a large fraction of the star-forming disks (ie. to ∼ R25).
Very different Hα profiles are observed across the two galaxies. NGC7793 has a centrally
peaked Hα profile with a region of very active star formation, as traced by the HII regions,
occurring out to a galactocentric radius of ∼ 3 kpc. The total average emission measure falls off
quite steeply, ranging from ∼> 250 pc cm−6 in the center of the galaxy, to a few pc cm−6 in the
outer parts of the disk. The DIG emission measure ranges from ∼ 60 pc cm−6 in the center, to
a few pc cm−6 in the outer galaxy. The DIG profile in NGC7793 is much flatter than that of the
HII regions in the inner disk, but the profiles become very similar beyond a radius of ∼ 2.5 kpc.
Part of the central flattening must be due to the present definition of DIG; some high surface
brightness (EM ≃ 150 pc cm−6), truly diffuse emission is clearly visible in the inner regions of the
galaxy but has been misclassified by our separation technique. If properly included, the two inner
Page 11
– 11 –
Fig. 4.— (a) Deprojected radial profile of the total Hα surface brightness (solid line), the Hα
surface brightness derived by counting HII regions alone (dashed–dotted line) and the Hα surface
brightness of the DIG (dashed line) in NGC 7793. The optical radius (R25) is indicated. (b) As in
(a) but for NGC 247.
profiles would possibly show a more similar behaviour.
On the other hand, NGC247 is characterized by very low Hα surface brightnesses across
its disk, at least a factor of 10 below those observed in NGC7793 at similar radii, and has an
extremely flat profile with only a weak central enhancement. The radial distribution of the diffuse
ionized component closely follows that of the HII regions throughout the entire disk. The DIG
emission measure ranges from 12 pc cm−6 in the center to a few pc cm−6 in the outer regions, with
the bulk of the disk having a DIG surface brightness of around 5 pc cm−6. Thus, in NGC 247 we
have made a detection of an extragalactic ionized hydrogen disk of comparable surface brightness
to that measured locally in the Reynolds layer (∼ 6 pc cm−6; Reynolds 1984).
4.3. The Diffuse Fraction
4.3.1. Global Values
The observed total luminosity of the DIG in each galaxy was obtained by summing the
intensities of pixels with observed surface brightnesses corresponding to an EM < 80 pc cm−6
and then correcting for contamination by [NII] and extinction as described above. The observed
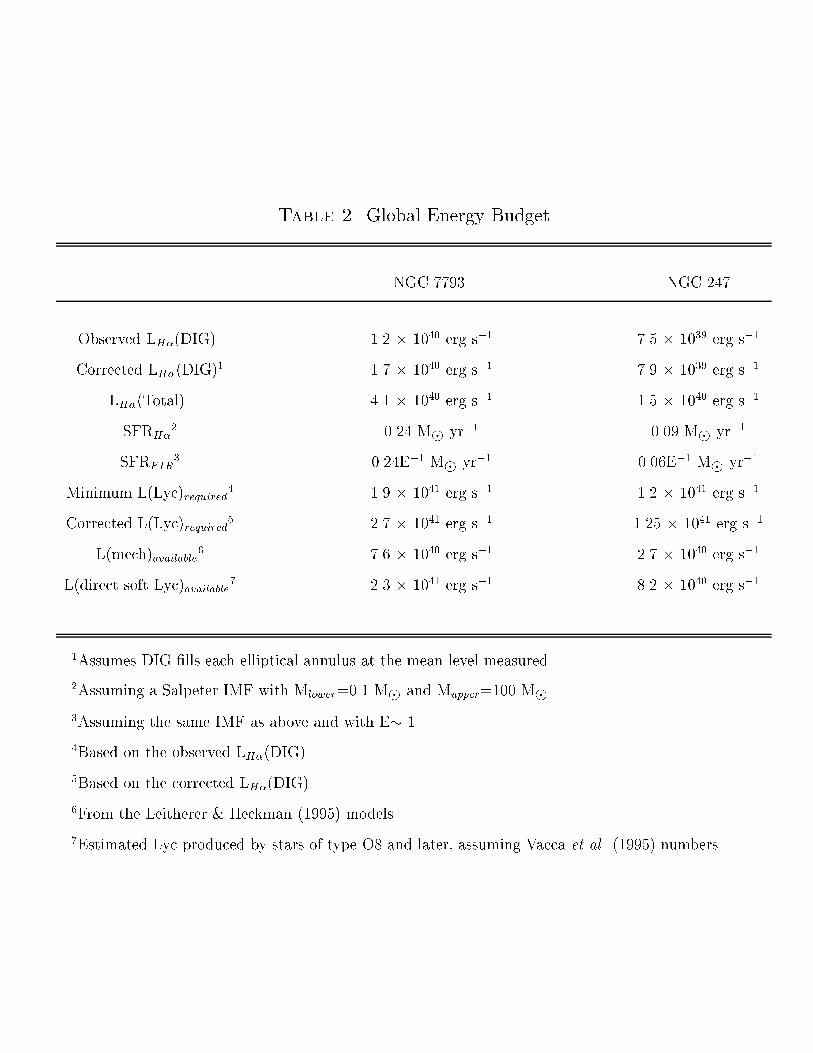
Hα DIG luminosities are found to be 7.5 × 1039 erg s −1 for NGC 247 and 1.2 × 1040 erg s−1
for NGC 7793. The observed global diffuse fractions, defined to be the fraction of the total Hα
Page 12
– 12 –
luminosity contributed by the DIG, are 50% for NGC 247 and 29% for NGC 7793. Lower limits
on the diffuse fraction may be derived by the assumption of zero extinction for the diffuse gas and
are 37% for NGC 247 and 19% for NGC 7793.
As previously mentioned, the observed DIG Hα luminosities are strictly lower bounds to the
true Hα luminosities since they are derived on the assumption that the intensity of the DIG is
zero on top of discrete HII regions. A more realistic estimate of the luminosity of the DIG can be
derived as follows. We assume that each elliptical annulus is filled with DIG at the mean DIG
surface brightness measured at that particular radius (as indicated in the DIG surface brightness
profiles presented in Figures 4a and b). In essence, this amounts to counting a fraction of the
flux from each HII as being emission due to superimposed DIG. This is a small effect everywhere
except in the innermost bins, where the HII region covering–factor is significant, and is still likely
to give an underestimate of the true Hα luminosity of the DIG. The total DIG luminosities of
all the individual annuli are then summed and corrected for [NII] and extinction. The resulting
corrected DIG Hα luminosities are 7.9 × 1039 erg s−1 for NGC 247 and 1.7 × 1040 erg s−1 for
NGC 7793. We note that the corrected DIG Hα luminosity in NGC 247 is only slightly larger
than the observed one; this is due to the small covering factor of bright HII regions across the disk
of the galaxy. These values can be used to calculate the corrected global diffuse fractions with the
result of 53% for NGC 247 and 41% for NGC 7793.
The global diffuse fractions derived here are very similar to the global diffuse fractions found
in other actively star–forming nearby galaxies (but being mindful of the wide range of assumptions
and corrections that different authors have applied): 40% in M31 (WB94); 30% in NGC 3079
(Veilleux et al. 1995); 35% in the LMC; 41% in the SMC (Kennicutt et al. 1995) and 35% and
50% in the Magellanic Irregulars NGC 4214 and NGC 4449 (Kennicutt et al. 1989). (Note that
Hunter and Gallagher (1990) find lower diffuse fractions, 15% – 20%, in NGC 4214 and NGC 4449;
this may be due to the lower isophotal surface-brightness cut they used to define the DIG.) Diffuse
fractions in this general range were also inferred for a large sample of nearby spirals on the basis
of emission–line ratios in their integrated spectra (Lehnert & Heckman 1994). The similarity in
the measured diffuse fractions is somewhat surprising given the wide range of morphological types
(Sb – Im) and star formation rates (0.01 – 0.6 M⊙ yr−1) spanned by these galaxies. Furthermore,
several of these galaxies have large kpc-scale ionized bubble and filamentary features (NGC 3079,
LMC, SMC, NGC 4449) while others do not. Such obvious signs of HII region disruption do not
appear to lead to relatively larger quantities of DIG. One possible interpretation of this result is
that the overall fraction of photons which leak out from HII regions is relatively constant from
galaxy to galaxy, appearing at first glance to be largely independent of star formation and ISM
properties. Alternatively, it could reflect the fact that these galaxies all have a significant fraction
of their OB star population residing outside the boundaries of classical HII regions (eg. Patel and
Wilson 1995).
Page 13
– 13 –
4.3.2. Radial Variation
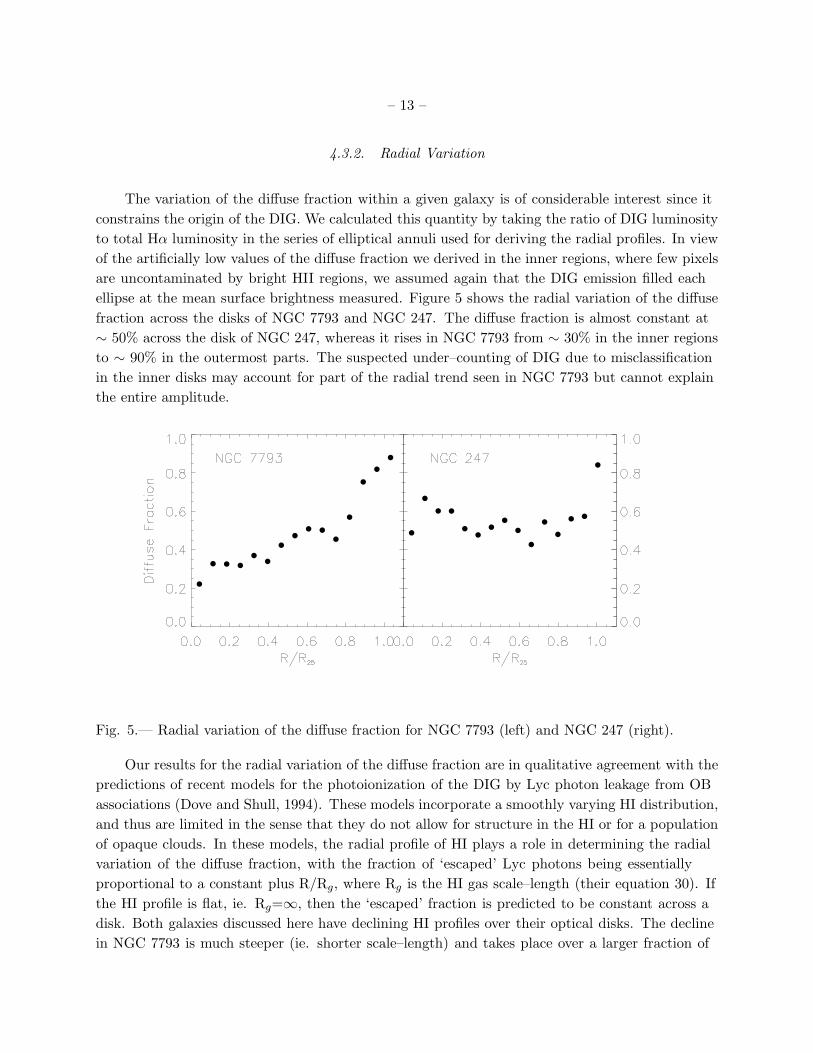
The variation of the diffuse fraction within a given galaxy is of considerable interest since it
constrains the origin of the DIG. We calculated this quantity by taking the ratio of DIG luminosity
to total Hα luminosity in the series of elliptical annuli used for deriving the radial profiles. In view
of the artificially low values of the diffuse fraction we derived in the inner regions, where few pixels
are uncontaminated by bright HII regions, we assumed again that the DIG emission filled each
ellipse at the mean surface brightness measured. Figure 5 shows the radial variation of the diffuse
fraction across the disks of NGC 7793 and NGC 247. The diffuse fraction is almost constant at
∼ 50% across the disk of NGC 247, whereas it rises in NGC 7793 from ∼ 30% in the inner regions
to ∼ 90% in the outermost parts. The suspected under–counting of DIG due to misclassification
in the inner disks may account for part of the radial trend seen in NGC 7793 but cannot explain
the entire amplitude.
Fig. 5.— Radial variation of the diffuse fraction for NGC 7793 (left) and NGC 247 (right).
Our results for the radial variation of the diffuse fraction are in qualitative agreement with the
predictions of recent models for the photoionization of the DIG by Lyc photon leakage from OB
associations (Dove and Shull, 1994). These models incorporate a smoothly varying HI distribution,
and thus are limited in the sense that they do not allow for structure in the HI or for a population
of opaque clouds. In these models, the radial profile of HI plays a role in determining the radial
variation of the diffuse fraction, with the fraction of ‘escaped’ Lyc photons being essentially
proportional to a constant plus R/Rg, where Rg is the HI gas scale–length (their equation 30). If
the HI profile is flat, ie. Rg=∞, then the ‘escaped’ fraction is predicted to be constant across a
disk. Both galaxies discussed here have declining HI profiles over their optical disks. The decline
in NGC 7793 is much steeper (ie. shorter scale–length) and takes place over a larger fraction of
Page 14
– 14 –
the disk than that observed in NGC 247 (Carignan & Puche 1991; Puche & Carignan 1991). As a
result, the Dove and Shull (1994) models predict that the diffuse fraction should rise more steeply
in NGC 7793 than in NGC 247, consistent with the observations.
4.3.3. Errors
It is important to quantify the effects that small errors in the flat–fielding, sky subtraction
and/or the continuum subtraction could have on the derived luminosities and hence the global
diffuse fractions presented above.
As discussed previously, the sky value is determined for each combined Hα and continuum
frame, and subtracted off before the continuum subtraction and mosaicing is carried out. Any
small error in the sky determination for a given frame could become more significant in the
final Hα continuum–subtracted mosaiced image. As discussed in Section 2, we determined the
sky level across the final mosaiced images using small (100 × 100 pixels) boxes situated beyond
the Holmberg diameters of each galaxy. The sky values obtained were 0 ± 1.5 pc cm−6 in the
NGC 7793 frame and 0 ± 3.2 pc cm−6 in the NGC 247 frame. Assuming a maximum error in the
sky of ± 1.5 pc cm−6 across the entire field of NGC 7793, the resulting error in the corrected DIG
Hα luminosity would be ∼ 6% , the error in the total Hα luminosity would be ∼ 2% and the error
in the corrected global diffuse fraction would be ∼ 2%. Likewise, an assumed maximum error of
± 3.2 pc cm−6 across the entire field of NGC 247 leads to an error in corrected DIG Hα luminosity
of ∼ 32%, an error in total Hα luminosity of ∼ 17% and an error in the corrected global diffuse
fraction of ∼ 8%. The larger errors for derived quantities in NGC 247 result from a combination
of a larger sky error per pixel and a larger number of pixels covered by the galaxy. While these
simple calculations neglect the fact that adjusting the sky value also affects our classification of
emission as being either diffuse or discrete, they serve to give a rough idea of the stability of our
derived quantities to realistic errors in the sky background.
Another source of possible uncertainty lies in the continuum scaling factor used to produce
the final Hα continuum–subtracted images. As previously discussed, the continuum scaling factor
was derived by measuring the ratio of the fluxes of foreground stars in the Hα and continuum
images. The scale factor was slightly adjusted until the bulk of the foreground stars were perfectly
subtracted and there were no large positive or negative regions across the galaxy, as judged by
eye. We experimented with changing the scaling factor by ± 2% and then by 7%, and noted how
this affected our derived quantities. For both galaxies, a 2% change in the scaling factor led to
changes of ∼ 5–8% in the corrected DIG Hα luminosities, ∼ 5% in the total Hα luminosities and
no appreciable change in the corrected global diffuse fractions. Changing the continuum scaling
factor by 7% led to changes of ∼ 25% in the corrected DIG Hα luminosities, ∼ 15% in the total
Hα luminosities and ∼ 5% in the corrected global diffuse fractions. We note that a 7% change in
Page 15
– 15 –
the continuum scaling factor corresponds to the point at which spurious large scale positive and
negative variations become clearly visible across the galaxies and foreground stars are improperly
subtracted; thus, this is the maximum possible error on the derived continuum scaling factor.
Application of a single continuum scaling factor across the disk of the galaxy, as done here,
implicitly assumes no gradient in the Hα equivalent width. This may not be entirely appropriate
but is expected to be a low amplitude effect.
4.4. Lyc Power Requirements
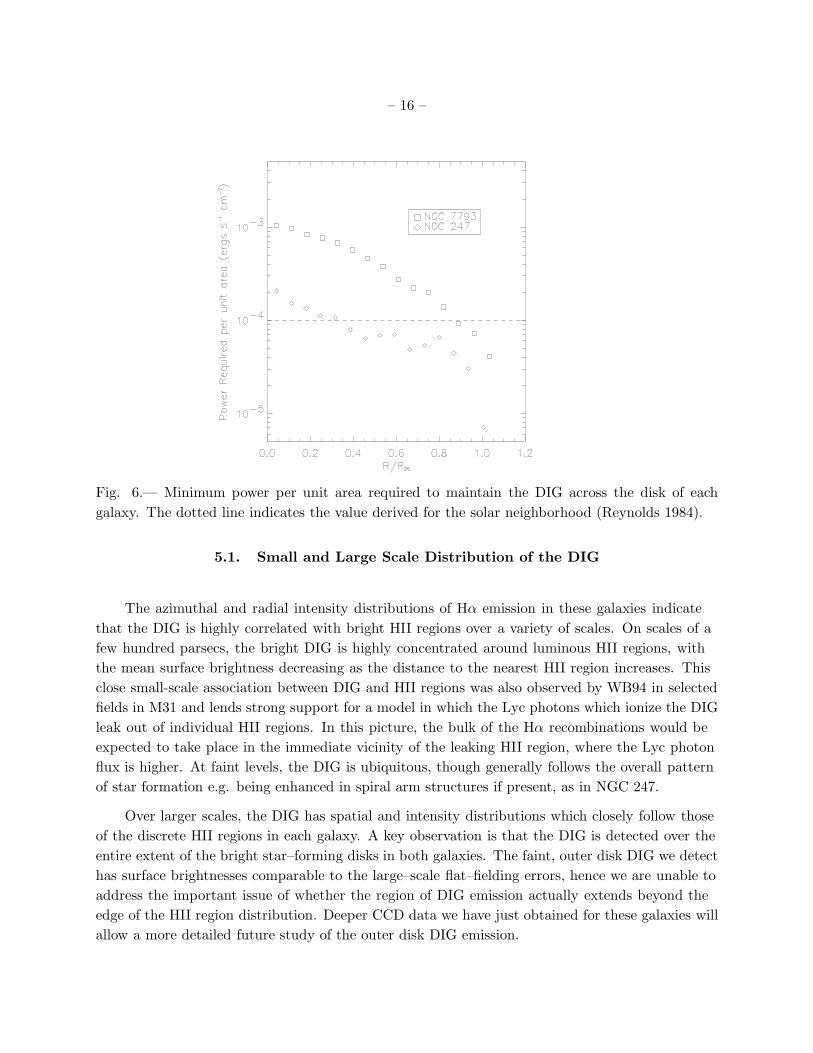
The deprojected, [NII]– and extinction-corrected radial profiles of the DIG in these galaxies
can be used to calculate the minimum power per unit area required to keep the DIG ionized. The
recombination rate per cm2 of disk, r, is first calculated using the relation
r =4 π
ǫIHα,
where ǫ is the average number of Hα photons per recombination (assumed to be ∼ 0.46; Case B
recombination at 104 K) and IHα is the Hα surface brightness in units of photons cm−2 s−1 sr−1 ;
the power consumption per unit area is then derived under the assumption that every ionization
requires a minumum input energy of 13.6 eV. These power requirements are plotted in
Figure 6, where the dashed line indicates the value estimated for the solar neighborhood,
1× 10⁻⁴ erg s−1 cm−2 (Reynolds 1984). As can be seen, NGC 7793 has minimum power per unit
area requirements which are significantly higher than the local Galactic value, whereas NGC 247
has requirements which are similar to the Milky Way.
Based on the observed total DIG Hα luminosities discussed in Section 4.3.1, we can derive the
minimum integrated Lyman continuum power required to keep the DIG ionized, using the same
procedure as outlined above. We find minimum Lyc power requirements of 1.2 × 1041 erg s−1
for NGC 247 and 1.9 × 1041 erg s−1 for NGC 7793. If we use the more realistic corrected Hα
luminosities of the DIG, we derive power requirements of 1.25 × 1041 erg s−1 for NGC 247 and
2.7 × 1041 erg s−1 for NGC 7793. These values are all slightly lower than the Galactic one of
6× 1041 erg s−1 (Reynolds 1984), which was derived on the basis of extrapolating local values over
the entire disk. The galaxies studied here are smaller than the Milky Way and hence lower global
power requirements are not unexpected. Nevertheless, the enormous amount of power required to
sustain the DIG in these galaxies (at least 3 − 5 × 10⁷ L⊙ in Lyc photons alone) places severe
constraints on the possible origin of the ionizing photons.
5. Discussion
Page 16
– 16 –
Fig. 6.— Minimum power per unit area required to maintain the DIG across the disk of each
galaxy. The dotted line indicates the value derived for the solar neighborhood (Reynolds 1984).
5.1. Small and Large Scale Distribution of the DIG
The azimuthal and radial intensity distributions of Hα emission in these galaxies indicate
that the DIG is highly correlated with bright HII regions over a variety of scales. On scales of a
few hundred parsecs, the bright DIG is highly concentrated around luminous HII regions, with
the mean surface brightness decreasing as the distance to the nearest HII region increases. This
close small-scale association between DIG and HII regions was also observed by WB94 in selected
fields in M31 and lends strong support for a model in which the Lyc photons which ionize the DIG
leak out of individual HII regions. In this picture, the bulk of the Hα recombinations would be
expected to take place in the immediate vicinity of the leaking HII region, where the Lyc photon
flux is higher. At faint levels, the DIG is ubiquitous, though generally follows the overall pattern
of star formation e.g. being enhanced in spiral arm structures if present, as in NGC 247.
Over larger scales, the DIG has spatial and intensity distributions which closely follow those
of the discrete HII regions in each galaxy. A key observation is that the DIG is detected over the
entire extent of the bright star–forming disks in both galaxies. The faint, outer disk DIG we detect
has surface brightnesses comparable to the large–scale flat–fielding errors, hence we are unable to
address the important issue of whether the region of DIG emission actually extends beyond the
edge of the HII region distribution. Deeper CCD data we have just obtained for these galaxies will
allow a more detailed future study of the outer disk DIG emission.
Page 17
– 17 –
The large scale radial distributions reveal that the DIG intensity falls off with the mean
surface brightness of HII regions and, hence, the mean level of star formation. Hester and Kulkarni
(1990) and Veilleux et al. (1995) have also noted a large scale radial variation of DIG intensity,
in studies of M33 and NGC 3079 respectively, but they did not make a comparison with the
distribution of discrete HII regions in these galaxies. The similarity between the DIG and the
discrete HII region surface brightness profiles observed further supports a leakage origin for the
ionizing photons which create the DIG. Moreover, the correlation between the mean surface
brightness of discrete HII regions and the DIG suggests that large–scale radial photon transport,
on scales comparable to the widths of our annular bins, 250 pc, does not involve a significant
number of ionizing photons.
The small and large scale distributions of the DIG are easily understood in terms of a model
where Lyc photon leakage from star–forming regions provides the dominant source of the ionizing
photons. The available evidence indicates that the star formation rate per unit area (traced by
the surface brightness of discrete HII regions) is correlated with the DIG surface brightness, in
the sense that a higher mean star formation rate per unit area leads to a higher number of Hα
recombinations occurring outside of discrete HII regions. The leakage model is not the only model
which can explain our observations of the large scale distribution of the DIG, however, and any
method of producing ionizing photons which is tied to Population I objects is equally plausible. A
model in which a significant fraction of the OB star population resides outside the boundaries of
discrete HII regions may also suffice (eg. Patel and Wilson 1995), but it remains unclear whether
ionization by in situ OB stars can explain other DIG properties, such as the observed line ratios.
Decaying neutrinos might be expected to produce an ionized gas component with a radial profile
similar to the density profile of the dark matter halo, ie. volume density proportional to the
inverse square of the radius (Sciama & Salucci 1990). While such a distribution is not necessarily
inconsistent with the profiles derived here, it is difficult to understand why the DIG emission
would be enhanced around individual HII regions, unless the gas becomes optically thin in these
regions as well.
5.2. The Diffuse Fraction
The global diffuse fractions of the galaxies presented here, together with those found in other
galaxies, show a striking similarity to each other. If the amount of Lyc photons produced in HII
regions were the only governing factor in determining the properties of the DIG, then galaxies with
low global star formation rates, such as the SMC, would be expected have different DIG properties
than more actively star– forming galaxies, such as NGC 7793 presented here. The constancy of
the diffuse fraction among galaxies of differing Hubble types and star formation rates suggests a
conspiracy between the level of star formation and some additional factor, with the result that the
fraction of photons which escape from discrete HII regions is more or less constant from galaxy to
Page 18
– 18 –
galaxy.
A similar conclusion can also be reached from inspection of the radial variation of the diffuse
fractions in NGC 247 and NGC 7793. Since the surface brightness of Hα emission from HII
regions, hence Lyc production, decreases with increasing galactocentric radius, one might expect
less diffuse emission to be present in the outermost parts. Instead, the diffuse fraction in NGC 247
is constant across the disk, while the diffuse fraction in NGC 7793 increases with galactocentric
radius. WB94 also found a relatively constant diffuse fraction in each of the fields they surveyed
in M31. This behavior suggests that the additional factor which regulates Lyc photon leakage in
galaxies is one which has some radial dependence within disks, and one which varies from galaxy
to galaxy.
This additional factor may be the HI column density; the (qualitative) agreement between
the observed radial profiles of the diffuse fraction and the predictions of the Dove and Shull
models lend support for this idea. Dust may also play an important role in regulating the fraction
of Lyc photons which can leak over large distances. NGC 7793 is known to have a moderately
steep metallicity gradient (Kennicutt, Zaritsky and Huchra 1994), implying more dust per unit
gas mass (and per unit star formation rate) in the central regions than in the outer parts. This
could result in enhanced absorption of Lyc photons in the central regions, when compared to the
outer disk, and provide at least a partial explanation for the trend observed in the diffuse fraction.
Furthermore, a higher dust fraction in the central regions would also mean that less of the DIG
produced here would actually be observed. A detailed study of the metallicity and extinction in
HII regions across the disks of NGC 7793 and NGC 247 is needed to address this issue further.
5.3. Lyc Power Requirements
The minimum Lyc power requirements we have derived for the DIG in NGC 247 and
NGC 7793 are huge and pose the greatest challenge to all models for the origin of the DIG.
The recent evolutionary synthesis models of Leitherer and Heckman (1995) can be used to place
constraints on several possible sources of the ionizing photons. These models may be used to
estimate the global star formation rates based on the observed Hα luminosities. We make the
assumption that the DIG is powered by star formation, and include its contribution in the total
Hα luminosities of the galaxies. Independent estimates of the SFRs, based on the far–infrared
luminosities, may then be used as a check on how realistic an assumption this is.
The [NII] and extinction–corrected total Hα (DIG plus HII regions) luminosities were
measured to be 4.1×1040 erg s−1 for NGC 7793 and 1.5×1040 erg s−1 for NGC 247. Formula (9)
of Leitherer and Heckman (1995) then translates these values into Lyc photon production rates
of 3.03 × 1052 s−1 and 1.10 × 1052 s−1. These photon production rates correspond to global star
formation rates (M> 1M⊙) of 0.096 M⊙ yr−1 for NGC 7793 and 0.035 M⊙ yr−1 for NGC 247,
Page 19
– 19 –
assuming a Salpeter IMF with Mupper = 100 M⊙ and solar metallicity (Leitherer and Heckman
1995). It should be noted that metallicity only influences the derived quantities to a small extent.
Adopting Mlower=0.1M⊙ would increase these star formation rates by a factor of 2.5. These
values are all tabulated in Table 2.
The integrated infrared luminosities of the galaxies provide an independent estimate of the
global star formation rates. Using the measured IRAS fluxes (Rice et al. 1988) and assuming the
distances in Table 1, the far infrared luminosities were calculated to be 1.9 × 1042 erg s−1 for
NGC 7793 and 4.5 × 1041 erg s−1 for NGC 247. From the derivations of Hunter et al. (1989) (their
equation 14), these luminosities can be converted into star formation rates of 0.24 E−1 M⊙ yr−1
for NGC 7793 and 0.06 E−1 M⊙ yr−1 for NGC 247, where E is a constant of order unity measuring
the coupling efficiency between the total power radiated by dust grains and that included in the
IRAS–based measurement of LIR. While these calculations are based on different stellar lifetimes
than those used in the Leitherer and Heckman models and have several uncertainties, such as the
value of the lowest main–sequence stellar mass that significantly contributes to LIR, they agree
with the star formation rates calculated on the basis of the total Hα luminosities to within a factor
of 2. Had we been incorrect to include the Hα luminosity of the DIG in our estimate of the star
formation rate, we could have expected much larger discrepancies between the rates calculated
based on these different methods. Thus, it seems quite reasonable that the DIG is indeed powered
by Lyc photons from OB stars.
We can use the set of Leitherer and Heckman (1995) models which are based on a constant
SFR to estimate the mechanical energy that is injected into the ISM from Type II supernovae and
stellar winds. These models give a mechanical luminosity of 7.6× 1040 erg s−1 for NGC 7793 and
2.7 × 1040 erg s−1 for NGC 247, based on the assumptions mentioned above and using the star
formation rates calculated from the Hα luminosities (note that these mechanical outputs would be
increased by a factor of two if we assumed a Miller–Scalo IMF). These numbers can be compared
with the minimum Lyc power required to ionize the DIG, derived in Section 4.4; they fall short by
a factor of 2.5 in NGC 7793 and by a factor of 4.4 in NGC 247. If we compare them to the more
realistic power requirements, calculated on the basis of the corrected DIG Hα luminosities, then
they fall short by factors of 3.6 in NGC 7793 and 4.5 in NGC 247. Type I supernovae will provide
an additional contribution to the mechanical luminosity, but given the estimates of the relative
rates of Type I and Type II supernovae in typical disk galaxies (van den Bergh and Tammann
1992), it is unlikely that this will change the available energy by more than a factor of two. We
can thus conclude that supernovae and stellar winds are unable to produce a substantial fraction
of the DIG ionization in these galaxies, even assuming that they can transfer their energy to the
ISM with 100% efficiency. This result contrasts with that found for the solar neighborhood where
the energy from supernovae can almost account for the observed level of DIG ionization (Reynolds
1984).
Despite the fact that OB stars are the only known source of ionizing photons which can easily
meet the overall power requirements for the DIG, several unresolved issues remain. As pointed out
Page 20
– 20 –
by Reynolds (1995), observations of HI clouds suggest that there are 3–4 clouds with NHI ∼ 3×
1019 cm−2 along every 300 pc line of sight near the midplane of the Galactic disk, with the number
possibly increasing dramatically towards lower column densities (Kulkarni and Heiles 1987; Dickey
and Garwood 1989). Such clouds are expected to present a significant opacity to Lyc photons and
should severely limit the distance which photons can travel radially within disks similar to that
of our Galaxy. In addition, the recent non-detection of the HeI λ5876 recombination line in the
direction of relatively high Galactic DIG surface brightness implies that the local DIG ionization
is due to a significantly softer spectrum than that expected from the bulk of the O star population
in the solar neighborhood (Reynolds and Tufte 1995). This result implies that either stars of
spectral type O8 and later provide most of the ionizing photons for the local DIG, or that some
mechanism is in place which effectively softens the radiation from early type O stars.
Late-type O and early B stars account for 24% of the total Lyc photons produced in the solar
neighborhood (Vacca, Garmany and Shull 1995), although this number may be an underestimate
(e.g. Cassinelli et al. 1995). Assuming this value, and using the Leitherer and Heckman models to
predict the total output in Lyc photons for the inferred star formation rates, we can estimate the
amount of ionizing luminosity produced by such stars in NGC 7793 and NGC 247. The Leitherer
and Heckman models predict total ionizing outputs of 9.6 × 1041 erg s−1 in NGC 7793 and
3.4 × 1041 erg s−1 in NGC 247. The power from soft Lyc photons produced directly by late-type
O and early B stars is then estimated to be 2.3 × 1041 erg s−1 in NGC 7793 and 8.2 × 1040 erg s−1
in NGC 247. Comparing these numbers with Lyc power requirements in each galaxy, we find that
the minimum power requirements can be met in NGC 7793 but not in NGC 247. Both numbers
fall short of satisfying the more realistic, corrected Lyc power requirements. Furthermore, these
estimates of the soft Lyc power available should be regarded as upper limits since a considerable
fraction of the power is consumed in the immediate vicinity of OB stars and hence is not available
to ionize ISM over large scales. Our simple calculations indicate that such stars are not likely to
produce enough direct soft Lyc radiation to match the power requirements and imply that another
mechanism may indeed be needed to produce the soft radiation field which a low HeIλ5876/Hα
ratio requires. The absorption and re–emission of Lyc photons as they travel through the ISM
could have such an effect; possible sites for this process include ‘chimney’ walls (Norman 1991)
and the extended envelopes of HII regions. Detailed maps of the ionization structure in the HII
region – DIG transition zone would be required to investigate these issues more thoroughly and to
place tighter constraints on the actual soft Lyc power that is available.
Of course, as mentioned above, there are many known sources of Lyc photons, and they all
must contribute at some level to produce the widespread ionization of the DIG which is observed.
6. Implications For Measuring Star Formation Rates
Page 21
– 21 –
Massive star formation in galaxies is commonly traced by Hα emission from HII regions. A
crucial issue is whether the contribution of the DIG should be included in this calculation. We
have concluded that the large scale radial distribution and intensity of the DIG across NGC 7793
and NGC 247, coupled with the global power requirements, strongly support a picture where
the DIG is ionized predominantly by Lyc photons which have leaked from sites of recent star
formation. In this scenario, the Hα emission from the DIG is as much related to present–day
massive star formation as is the Hα emission detected in discrete HII regions. Failure to count
DIG photons when estimating the total Hα emission then leads to an underestimate both of the
global and radial variation of SFRs in galaxies, especially in the outermost parts where the DIG
contribution is more substantial. For example, had only HII region fluxes been used to calculate
the global star formation rates presented in Section 5.3, then the derived rates would have been
29% lower for NGC 7793 and 50% lower for NGC 247.
Most integrated measurements of global SFRs are based on large-aperture Hα photometry,
and hence both the HII region and DIG contributions are automatically included. On the other
hand, it has been common practice to derive the radial variation of the SFR based on counts of
discrete HII regions alone (eg. Kennicutt 1989). In this case, the exclusion of the DIG component
becomes a more serious issue and particularly affects the star formation rates derived for the outer
parts of galaxies, where the DIG contribution to the Hα emission is considerable. Kennicutt et al.
(1995) also noted the possible importance of counting the DIG in deriving radial star formation
rates and raised the crucial issue of how to estimate the location of the origin of the DIG photons.
If significant Lyc photon transport occurs within disks, then the location of the recombination
photon (traced by Hα emission) may be very different from the location where the Lyc photon
originated. Our data are binned in radial bins of size 350 pc (NGC 7793) and 500 pc (NGC 247),
typical of the distance which is predicted to trap > 90% of the escaping Lyc photons vertically in
the disk of our Galaxy (Dove and Shull 1994). Since 350 pc corresponds to ∼ two HI scaleheights
in our Galaxy and is a small fraction of an HI scalelength, this suggests that possibly less transport
occurs over a similar distance radially within the disk. Thus we expect that less than 10% of
the DIG photons in a given bin will have been radially transported from other locations in the
disk. As noted earlier, DIG can generally be found at mean distances of ∼ 500 pc from bright HII
regions; this provides another constraint on the typical scales over which radial transport takes
place and is in good agreement with the distance required to produce the appropriate dilution of
the Lyc flux from O stars to explain the observed DIG line ratios (eg. Reynolds 1994). Constraints
on the amount of radial photon transport can come from calculating the total Lyc power required
per annulus as a function of radius. Both galaxies have almost constant power requirements per
annulus across their disks, declining significantly only in the last few bins. Thus, if radial transport
were occurring over significant scales, a very large, probably unrealistic fraction of the total Lyc
photons would have to be transported.
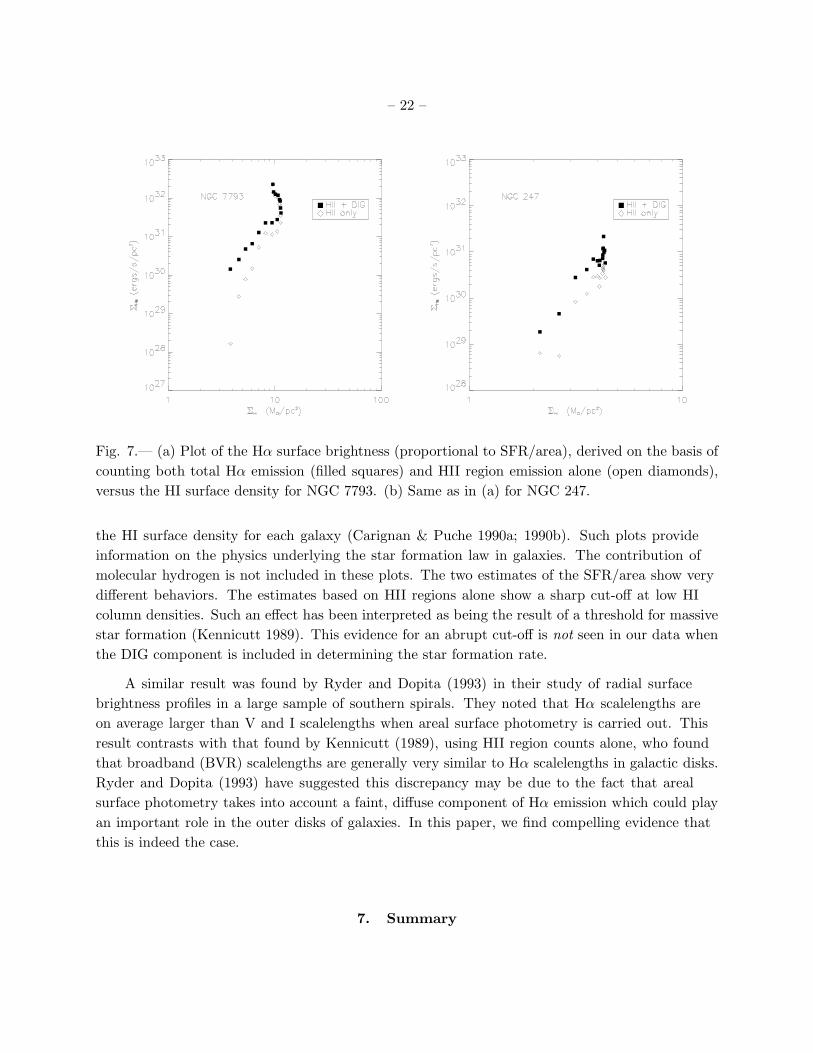
Figures 7a and b illustrate the variation of Hα surface brightness (proportional to SFR/area),
derived on the basis of counting either total Hα emission or only HII region emission, versus
Page 22
– 22 –
Fig. 7.— (a) Plot of the Hα surface brightness (proportional to SFR/area), derived on the basis of
counting both total Hα emission (filled squares) and HII region emission alone (open diamonds),
versus the HI surface density for NGC 7793. (b) Same as in (a) for NGC 247.
the HI surface density for each galaxy (Carignan & Puche 1990a; 1990b). Such plots provide
information on the physics underlying the star formation law in galaxies. The contribution of
molecular hydrogen is not included in these plots. The two estimates of the SFR/area show very
different behaviors. The estimates based on HII regions alone show a sharp cut-off at low HI
column densities. Such an effect has been interpreted as being the result of a threshold for massive
star formation (Kennicutt 1989). This evidence for an abrupt cut-off is not seen in our data when
the DIG component is included in determining the star formation rate.
A similar result was found by Ryder and Dopita (1993) in their study of radial surface
brightness profiles in a large sample of southern spirals. They noted that Hα scalelengths are
on average larger than V and I scalelengths when areal surface photometry is carried out. This
result contrasts with that found by Kennicutt (1989), using HII region counts alone, who found
that broadband (BVR) scalelengths are generally very similar to Hα scalelengths in galactic disks.
Ryder and Dopita (1993) have suggested this discrepancy may be due to the fact that areal
surface photometry takes into account a faint, diffuse component of Hα emission which could play
an important role in the outer disks of galaxies. In this paper, we find compelling evidence that
this is indeed the case.
7. Summary
Page 23
– 23 –
We have presented a study of the large scale distribution and global energetics of widespread
diffuse ionized gas lying outside the boundaries of discrete HII regions, identified from deep Hα
images of the nearby Sculptor spirals NGC 247 and NGC 7793. We have separated the total
Hα emission into that from discrete HII regions and that from diffuse emission by means of an
isophotal cut in surface brightness, corresponding to an emission measure of 80 pc cm−6. Most of
the Hα emission lying below this value is clearly diffuse and/or filamentary.
Radial and azimuthal intensity distributions of the DIG reveal that it is highly correlated
with bright HII regions over both small and large scales. On the scales of a few hundred parsecs,
the bright DIG is localised around individual luminous HII regions in frothy, filamentary halos.
At faint surface brightnesses, the DIG is ubiquitous, though maintains the overall pattern and
extent of the bright star–forming disk. Over larger scales, the DIG has spatial and intensity
distributions which closely follow those of the discrete HII regions, and, hence, of the mean level
of star formation.
The observed DIG Hα luminosities are considerable and the DIG contributes 50% of the
measured total Hα luminosity in NGC 247 and 29% in NGC 7793. These values are lower limits
derived by assuming that the intensity of the DIG overlying discrete HII regions is zero. More
realistic values of the diffuse fractions, calculated assuming that DIG fills the entire area of the
elliptical annuli used, are 53% in NGC 247 and 41% in NGC 7793. These values are remarkably
similar to the global diffuse fractions found in other actively star–forming galaxies, which span
a range of morphological types and star formation rates. This unexpected result suggests some
global regulation of the fraction of photons which can leak from HII regions and are available to
ionize the ISM over large scales. The radial variation of the diffuse fraction shows an increase
across the disk of NGC 7793 and is relatively constant across the disk of NGC 247, despite the
declining star formation rate per unit area (ie. Lyc production rate) with increasing radius. This
behaviour suggests that the additional factor which regulates photon leakage from HII regions is
one which has some radial dependence. The qualitative agreement between our observations and
the predictions of the Dove and Shull (1995) models for photoionization of the DIG suggest that
this factor may be the HI column density. We note the role that dust might play in regulating
photon leakage in galaxies. More detailed metallicity gradients are required for these galaxies in
order to further investigate this issue.
The integrated miminum Lyc powers required to sustain the DIG in these galaxies are
enormous and place tight constraints on the source of the ionizing photons. Only massive
star formation can easily satisfy the power requirements, with the mechanical luminosity from
supernovae and stellar winds falling short by more than a factor of two. This result contrasts with
that found for the local Galactic DIG where the energy from supernovae can almost account for
the observed level of ionization. In view of the new constraints imposed on the origin of the DIG
photons from the non–detection of the HeIλ5876 recombination line in the Galaxy, we estimated
the Lyc power supplied by stars of spectral type O8 and later. The available power falls short of
realistic estimates of the required Lyc power, implying that direct radiation from such stars alone
Page 24
– 24 –
cannot acount for the entire ionization of the DIG. This suggests that either some mechanism
is in place which softens the radiation field of early O stars, which produce the bulk of the Lyc
photons, or that the photons which ionize the DIG come from a variety of sources, all contributing
at some level to produce the widespread ionization which is observed.
Our results strongly support an interpretation of the DIG as being due to Lyc photon leakage
from discrete HII regions. In such a scenario, the DIG is a direct product of recent massive star
formation and its contribution to the Hα emission line flux of the galaxy should be included in
order to derive accurate star formation rates. We have illustrated the importance of taking the
DIG into account when studying the correlation between star formation rate per unit area and
HI gas surface density. If HII regions alone are used to trace the star formation rate per unit
area, then these plots show a sharp cut–off in star formation activity at low HI column densities,
commonly interpreted as being the result of a threshold for massive star formation (Kennicutt
1989). This evidence for an abrupt cut–off is not seen in our data when the DIG component is
included in determining the star formation rate per unit area.
We thank Piero Rosati for many useful discussions during the course of this work, both
scientific and technical, and Tim Heckman, Colin Norman and Gerhardt Meurer for commenting
on an earlier draft of this paper. The anonymous referee provided comments which helped us
improve the presentation of our results. We thank the staff of Cerro Tololo Inter–American
Observatory for their excellent support. AMNF acknowledges receipt of an Amelia Earhart
Fellowship awarded by the Zonta International Foundation. This research has been supported in
part by NASA grant NAGW–2892. The Center for Particle Astrophysics is funded by the NSF.
Page 25
– 25 –
REFERENCES
Abbott, D. C. 1982, ApJ, 263, 732
Carignan, C. 1985, ApJS, 58, 107
Carignan, C. & Puche, D. 1990a, AJ, 100, 641
Carignan, C. & Puche, D. 1990b, AJ, 100, 394
Cassinelli, J. P. et al. 1994, ApJ, 438, 932
Davies, R. D., Elliot, K. J. & Meaburn, J. 1976, MNRAS, 81, 89
Dettmar, R. J. 1992, Fund. Cosmic Physics, 15, 143
Dettmar, R. J. & Schulz, H. 1992, A&A, 254, 25
de Vaucouleurs, G., de Vaucouleurs, A., Corwin, H. R., Buta, R. J., Paturel, G., & Fouque, P.
1991, Third Reference Catalogue of Bright Galaxies (Springer-Verlag, New York)
Dickey, J. M. & Garwood, R. W. 1989, ApJ, 341, 201
Domgorgen, H. & Mathis, J. S. 1994, ApJ, 428, 647
Dove, J. B. & Shull, J. M. 1994, ApJ, 430, 222
Elmegreen, B. G. 1987, ApJ, 312, 626
Hester, J. J. & Kulkarni, S. R. 1990, in The Interstellar Medium in External Galaxies, edited by
D. Hollenbach & H. Thronson (NASA CP-3084), p. 288
Hunter, D. A., Gallagher, J. S., Rice, W. L. & Gillet, F. C. 1989, ApJ, 336, 152
Hunter, D. A. & Gallagher, J. S. 1990, ApJ, 362, 480
Hunter, D. A. & Gallagher, J. S. 1992, ApJ, 391, L9
Hunter, D. A. 1994, AJ, 108, 1658
Kennicutt, R. C. 1984, ApJ, 287, 116
Kennicutt, R. C. 1988, ApJ, 334, 144
Kennicutt, R. C., Edgar, B. K. & Hodge, P. W. 1989, ApJ, 337, 761
Kennicutt, R. C. 1989, ApJ, 344, 689
Kennicutt, R. C., Bresolin, F. , Bomans, D. J., Bothun, G. D. & Thompson, I. B. 1995, AJ, 109,
594
Kulkarni, S. R. & Heiles, C. 1988, in Galactic and Extragalactic Radio Astronomy, edited by
G. Verschuur & K. I. Kellerman (Springer, New York), p. 95
Lehnert, M. D. & Heckman, T. M. 1994, ApJ, 426, L27
Leitherer, C. & Heckman, T. M. 1995, ApJS, 96, 9
Miller, W. W. & Cox, D. P. 1993, ApJ, 417, 579
Page 26
– 26 –
Monnet, G. 1971, A&A, 12, 379
Norman, C. A. 1991, in The Disk–Halo Connection in Galaxies, IAU Symposium No. 144, edited
by H. Bloemen (Kluwer, Dordrecht), p. 337
Patel, K. & Wilson, C. D. 1995, ApJ, 451, 607
Rand, R. J., Kulkarni, S. R. & Hester, J. J. 1990, ApJ, 352, 1
Raymond, J. C. 1992, ApJ, 384, 502
Reynolds, R. J., Roesler, F. L., Scherb, F., & Boldt, E. 1971, in The Gum Nebula and Related
Problems, edited by S. P. Maran, J. C. Brandt & T. P. Stecher (NASA SP-332), p. 169
Reynolds, R. J. 1984, ApJ, 282, 191
Reynolds, R. J. 1990, ApJ, 348, 153
Reynolds, R. J. 1991 in The Disk–Halo Connection in Galaxies, IAU Symposium No. 144, edited
by H. Bloemen (Kluwer, Dordrecht), p. 67
Reynolds, R. J. 1993, in Back to the Galaxy, AIP Conf. Proc. No. 278, edited by S. S. Holt & F.
Verter, p. 156
Reynolds, R. J. & Tufte, S. L. 1995, ApJ, 439, 17
Reynolds, R. J. 1995, in The Physics of the Interstellar Medium and Intergalactic Medium, A.S.P.
Conf. Ser. Vol. 80, edited by A. Ferrara, C. F. McKee,C. Heiles and P. R. Shapiro, p. 388
Rice, W., Lonsdale, C. J., Soifer, B. T., Neugebauer, G. & Kopan, E. L. 1988, ApJS, 68, 91
Ryder, S. D. & Dopita, M. A. 1994, ApJ, 430, 142
Schild, R. E. 1977, AJ, 82, 337
Sciama, D. W. 1990, ApJ, 364, 549
Sciama, D. W. & Salucci, P. 1990, MNRAS, 247, 506
Scowen, P. A., 1992, Ph. D. Thesis, Rice University.
Slavin, J. D., Shull, J. M. & Begelman, M. C. 1993, ApJ, 407, 83
Stone, R. P. S. & Baldwin, J. A. 1983, MNRAS, 204, 347
Tenorio-Tagle, G. & Bodenheimer, P. 1988, ARA&A, 26, 145
Vacca, W. D., Garmany, C. D. & Shull, J. M. 1995, preprint.
van den Bergh, S. & Tammann, G. A. 1991, ARA&A, 29, 363
Veilleux, S., Cecil, G. & Bland-Hawthorn, J. 1995, ApJ, 445, 152
Walterbos, R. A. M. & Braun, R. 1994, ApJ, 431, 156 (WB94)
Webster, B. L. & Smith, M. G. 1983, MNRAS, 204, 743
This preprint was prepared with the AAS LATEX macros v3.0.
Page 27
– 27 –
FIGURE CAPTIONS
Fig.1 – (a) Hα continuum–subtracted image of NGC 7793 displayed at high contrast to show only
the cores of bright HII regions. North is up and east is to the left.
(b) Hα continuum–subtracted image of NGC 7793 displayed at low contrast to show the diffuse
ionized gas emission.
(c) Hα continuum–subtracted image of NGC 247 displayed to show the cores of bright HII regions.
North is up and east is to the left.
(d) Hα continuum– subtracted image of NGC 247 displayed to show the diffuse ionized gas
emission.
Fig.2 –(a) Subsection of NGC 7793 illustrating the DIG. Pixels with EM > 80 pc cm−6 have been
masked out (white).
(b) As in (a) but for NGC 247
Fig.3 – (a) Plot of the azimuthal variation of uncorrected Hα +[NII] surface brightness at four
radii in NGC 7793 . The radii correspond to 0.1R25, 0.3R25, 0.6R25 and 0.9R25. The width of
each radial bin is 250 pc and the data are azimuthally binned into 2◦ sectors.
(b) As in (a) but for NGC 247.
Fig.4 – (a) Deprojected radial profile of the total Hα surface brightness (solid line), the Hα
surface brightness derived by counting HII regions alone (dashed–dotted line) and the Hα surface
brightness of the DIG (dashed line) in NGC 7793. The optical radius (R25) is indicated.
(b) As in (a) but for NGC 247.
Fig.5 – Radial variation of the diffuse fraction for NGC7793 (left) and NGC247 (right).
Fig.6 – Minimum power per unit area required to maintain the DIG across the disk of each galaxy.
The dotted line indicates the value derived for the solar neighborhood (Reynolds 1984).
Fig.7 – (a) Plot of the Hα surface brightness (proportional to SFR/area), derived on the basis of
counting both total Hα emission (filled squares) and HII region emission alone (open diamonds),
versus the HI surface density for NGC 7793.
(b) Same as in (a) for NGC 247.
Page 28
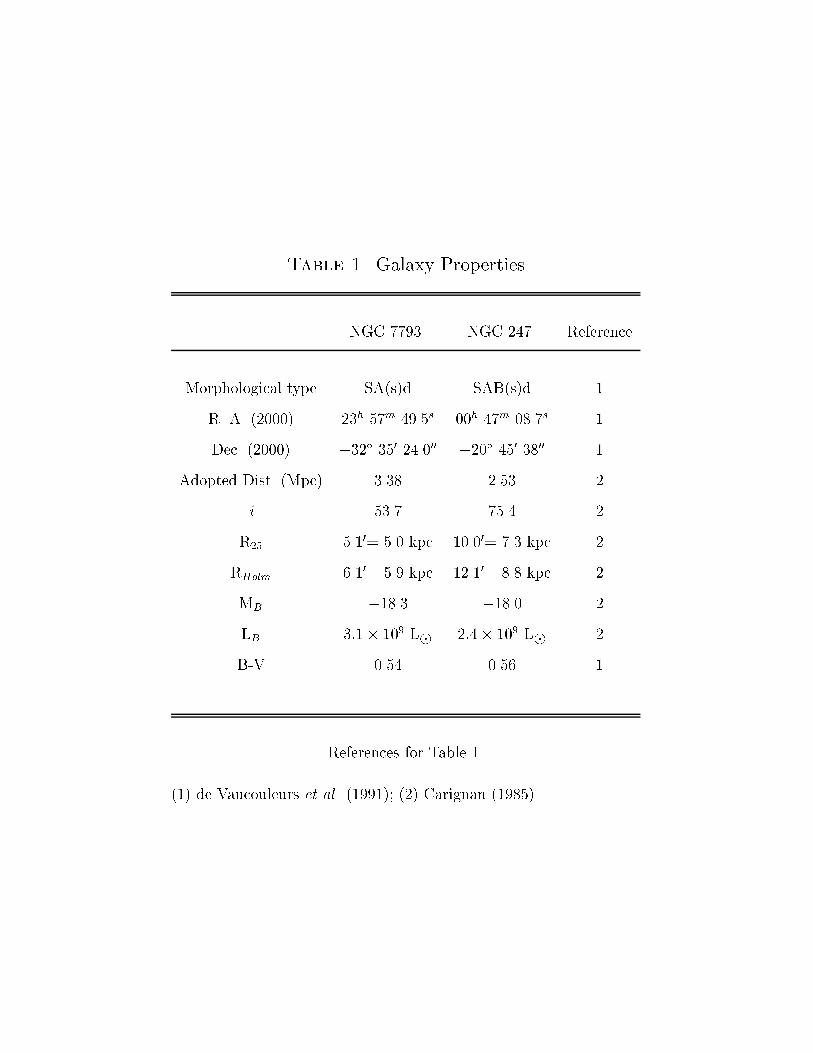
Table 1. Galaxy Properties
NGC 7793 NGC 247 Reference
Morphological type SA(s)d SAB(s)d 1
R. A. (2000) 23
h
57
m
49.5
s
00
h
47
m
08.7
s
1
Dec. (2000) �32
�
35
0
24.0
00
�20
�
45
0
38
00
1
Adopted Dist. (Mpc) 3.38 2.53 2
i 53.7 75.4 2
R
25
5.1
0
= 5.0 kpc 10.0
0
= 7.3 kpc 2
R
Holm
6.1
0
= 5.9 kpc 12.1
0
= 8.8 kpc 2
M
B
�18.3 �18.0 2
L
B
3:1� 10
9
L
�
2:4� 10
9
L
�
2
B-V 0.54 0.56 1
References for Table 1.
(1) de Vaucouleurs et al. (1991); (2) Carignan (1985)
Page 29
Table 2. Global Energy Budget
NGC 7793 NGC 247
Observed L
H�
(DIG) 1.2 � 10
40
erg s
�1
7.5 � 10
39
erg s
�1
Corrected L
H�
(DIG)
1
1.7 � 10
40
erg s
�1
7.9 � 10
39
erg s
�1
L
H�
(Total) 4.1 � 10
40
erg s
�1
1.5 � 10
40
erg s
�1
SFR
H�
2
0.24 M
�
yr
�1
0.09 M
�
yr
�1
SFR
FIR
3
0.24E
�1
M
�
yr
�1
0.06E
�1
M
�
yr
�1
Minimum L(Lyc)
required
4
1.9 � 10
41
erg s
�1
1.2 � 10
41
erg s
�1
Corrected L(Lyc)
required
5
2.7 � 10
41
erg s
�1
1.25 � 10
41
erg s
�1
L(mech)
available
6
7.6 � 10
40
erg s
�1
2.7 � 10
40
erg s
�1
L(direct soft Lyc)
available
7
2.3 � 10
41
erg s
�1
8.2 � 10
40
erg s
�1
1
Assumes DIG �lls each elliptical annulus at the mean level measured.
2
Assuming a Salpeter IMF with M
lower
=0.1 M
�
and M
upper
=100 M
�
.
3
Assuming the same IMF as above and with E� 1
4
Based on the observed L
H�
(DIG).
5
Based on the corrected L
H�
(DIG).
6
From the Leitherer & Heckman (1995) models.
7
Estimated Lyc produced by stars of type O8 and later, assuming Vacca et al. (1995) numbers.