31
Digital Landscape Group (DLGI) June 2020 Business Update

Digital Landscape Group (DLGI)
June 2020 Business Update

1
Notice to Recipient
Important Notices
This document has been prepared by Digital Landscape Group, Inc. (“DLGI”) solely for informational purposes and should not be construed to be, directly or indirectly, inwhole or in part, an offer to buy or sell and/or a recommendation and/or a solicitation of an offer to buy or sell any security or instrument or to participate in any investmentor trading strategy. Nor shall any part of this document form the basis of, or be relied on in connection with, any contract or investment decision in relation to any securitiesor otherwise.
Except where otherwise indicated, the information speaks as of the date hereof. No representation or warranty, express or implied, is made as to, and no reliance should beplaced on, the fairness, accuracy, completeness or correctness of the information or any opinion contained herein. Neither DLGI nor any of its affiliates has independentlyverified the information or any underlying reports contained in this presentation that are attributed to third parties. While DLGI believes that such third‐party information hasbeen prepared by reputable sources, there is no guarantee of the accuracy or completeness of such data. The information contained in this presentation should beconsidered in the context of the circumstances prevailing at the time and will not be updated to reflect material developments that may occur after the date of thepresentation. None of DLGI, AP WIP Investments Holdings, LP (“APW”), or any of their respective affiliates, officers, directors or advisors shall have any civil, criminal oradministrative liability whatsoever (willful, in negligence or otherwise) for any loss arising from any use of this presentation or its contents, including any inaccuracy orincompleteness thereof, or otherwise arising in connection with this presentation.
Non-GAAP Financial Measures
This presentation includes certain additional key performance indicators that are non-GAAP financial measures, including, but not limited to, Adjusted EBITDA. Each ofDLGI and APW believe these non-GAAP financial measures provide an important alternative measure with which to monitor and evaluate DLGI’s ongoing financial results,as well as to reflect its acquisitions. The calculation of these financial measures may be different from the calculations used by other companies and comparability maytherefore be limited. You should not consider these non-GAAP financial measures an alternative or substitute for APW’s results.
Forward-Looking Statements
This presentation contains certain statements that constitute forward-looking statements within the meaning of the “safe harbor” provisions of the United States PrivateSecurities Litigation Reform Act of 1995. Forward-looking statements may be identified by the use of words such as “anticipate”, “believe”, “expect”, “estimate”, “plan”,“outlook”, and “project” and other similar expressions that predict or indicate future events or trends or that are not statements of historical matters. Similarly, statementsthat describe DLGI’s expectations, intentions and projections regarding the combined company’s future performance, anticipated events or trends and other matters thatare not historical facts are forward-looking statements, including expectations regarding: (i) the ability of DLGI to effect the U.S. exchange listing following its London StockExchange re-listing; (ii) the company’s future operating and financial performance, (iii) the ability to drive shareholder value and achieve target levels of organic growth andlong-term leverage ratios, and (iv) the expected pro forma capitalization table. All such forward-looking statements are subject to certain risks and uncertainties that couldcause actual results to differ materially from those contemplated by the relevant forward-looking statement. There can be no assurance that the results and eventscontemplated by the forward-looking statements contained herein will in fact occur. None of the future projections, expectations, estimates or prospects in this presentationshould be taken as forecasts or promises nor should they be taken as implying any indication, assurance or guarantee that the assumptions on which such futureprojections, expectations, estimates or prospects have been prepared are correct or exhaustive or, in the case of assumptions, fully stated in the presentation. DLGI alsocautions that forward-looking statements are subject to numerous assumptions, risks and uncertainties, which change over time and which may be beyond DLGI’s control.DLGI assumes no duty to and does not undertake to update any forward-looking statements to reflect actual results, changes in assumptions or changes in factors affectingthese statements. No statement in this presentation constitutes or should be construed as constituting a profit forecast or estimate.
2
Key Business Updates
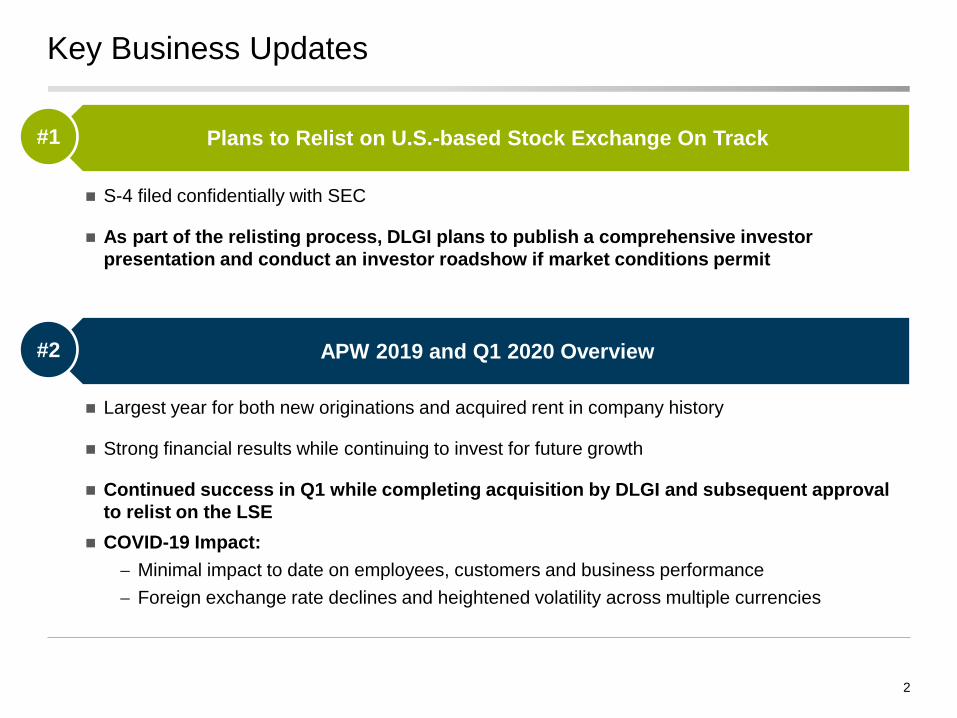
Plans to Relist on U.S.-based Stock Exchange On Track
APW 2019 and Q1 2020 Overview#2
#1
◼ Largest year for both new originations and acquired rent in company history
◼ Strong financial results while continuing to invest for future growth
◼ Continued success in Q1 while completing acquisition by DLGI and subsequent approval
to relist on the LSE
◼ COVID-19 Impact:
− Minimal impact to date on employees, customers and business performance
− Foreign exchange rate declines and heightened volatility across multiple currencies
◼ S-4 filed confidentially with SEC
◼ As part of the relisting process, DLGI plans to publish a comprehensive investor
presentation and conduct an investor roadshow if market conditions permit
◼ Revenue streams generated from tenants with “mission critical” requirements with long-term contracts
◼ High grade credit of tenant counterparties to limit the risk of default and subsequent disruptions to revenue
◼ Revenues which are recession-resilient and have minimal correlation to the macro economy
◼ Assets which enable access to historically low cost leverage
3
DLGI the Platform
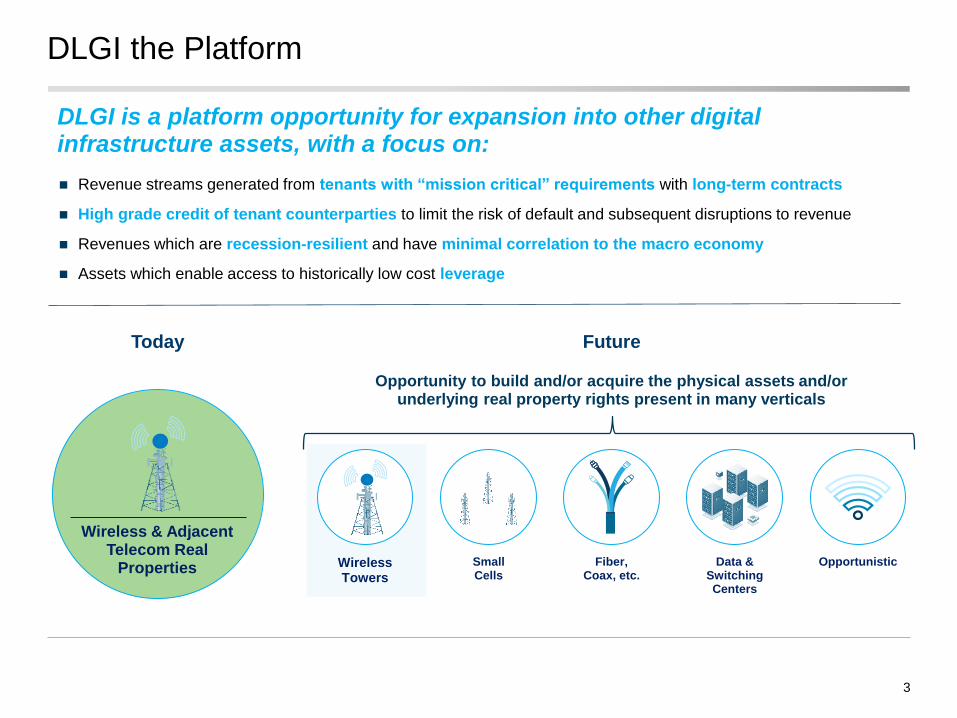
DLGI is a platform opportunity for expansion into other digital infrastructure assets, with a focus on:
Opportunity to build and/or acquire the physical assets and/or underlying real property rights present in many verticals
Today
Wireless & Adjacent Telecom Real
Properties Small Cells
Fiber, Coax, etc.
OpportunisticData & Switching Centers
Wireless Towers
Future

Leads to...
Data usage per capita driving need for network coverage
and densification
4
Global Demand Generates Wide Ranging Opportunities
Source: Ericsson Mobility Report (2019), Fierce Wireless Group, Morgan Stanley Research.(1) Mobile data traffic per active smartphone per month. “Ericsson Mobility Report,” November 2018.(2) “Small Cell Network Market 2019 Global Trends, Size, Industry Segments, and Growth by Forecast to 2023.”(3) Morgan Stanley, “5 Drivers of 5G Value”, includes estimated spectrum, base transceiver station, transmission, and tower spend in the U.S. between 2011 - 2018.(4) Morgan Stanley, “5 Drivers of 5G Value”, assumes the bull range of Morgan Stanley’s 5G capex spend between 2019 – 2030 in the four largest 5G markets: U.S., Korea, China, and Japan.
Sector Beneficiaries
AP Wireless
MNOs / CarriersTowerCos
2019A 2025E
Importance of strategically located digital assets has
never been greater
Need for enhanced network coverage and densification to
meet speed and capacity demands
Large percentage of the world transitioning from 2G / 3G
mobile networks to 4G / 5G mobile networks
Explosive Data Growth…
TowerCos, Fiber Networks and Power
MNOs / Carriers
Ground Leases

AP Wireless (“APW”)

6
APW – The Company
We are one of the largest international aggregators of rental streams
underlying wireless and other telecom related sites through the acquisition
of wireless telecom real property interests and contractual rights
Landlord / APW
Tenants
escalating rent
Note: Financial and operating statistics as of 3/31/2020, unless otherwise noted.(1) Comprised of initial all-in weighted average unlevered yields of 7% - 8% with 2% - 3% annual inflation-linked growth (metrics are based on all-in costs at AP Wireless, before any impact for costs at DLGI). (2) Represents total sites and lease streams acquired by the Company since inception, net of churn, as of 3/31/2020.(3) Based on 3/31/2020 in-place rent. Corporate rating of obligor to extent available (if not available, parent rating used). (4) Ground cash flow (“GCF”) is similar to concept of tower cash flow (“TCF”). GCF = Ground lease revenue less site specific costs (as applicable). Figures based on 12/31/2019 Gross Profit of $55.380 million and Revenue of
$55.706.
What We Do
Platform acquiring assets at attractive returns
APW’s ~300-person team acquires existing tower and rooftop antennae
rent streams from highly fragmented set of property owners
Sites underwritten based on multiple tenants, strategic location, and tenant
credit quality currently operating in 19 countries
Origination Platform
A portfolio of yielding assets that grow organically
Holds underlying real property interests and attached long-term resilient
rent streams critical for wireless communication
Triple-net leases are typically low risk and generally originated at 10%
unlevered yields(1) with favorable lease characteristics
Tenants are predominantly investment grade MNOs and tower companies
Yield Co (Portfolio of Rents)
Expert team Database
~55%8-year
Revenue CAGR
$55.7mm
2019 Revenue2011 Revenue
$1.7mm ~6,300Lease streams(2)
~4,800Sites(2)
>80%investment grade tenants
(counterparties)(3)
KeyFigures
99.4%Ground Cash Flow(4) Margin
$61MAnnualized Contractual Revenue
+14% vs Prior Year (+22% Constant Currency)(2%) vs Prior Quarter (+5% Constant Currency)
19Operating Countries

APW – Our Asset Origination Platform
Note: Diagram for illustrative purposes only. Data as of 3/31/2020.(1) Originations based on respective year end exchange rates. Annual originations includes capital expenditures and excludes or igination costs.
19 CountriesProprietary Screening Process and Database
On-the-GroundLocal Presence
AP Wireless has successfully acquired ~6,600 lease streams since 2010
Data-Driven Sourcing and Underwriting
Proven Execution and Scale
$8
$37
$53 $56
$64 $67 $67
$75 $80
$99
2010 2011 2012 2013 2014 2015 2016 2017 2018 2019
($ in millions)
Estimated<1%
of market
6,613Lease streams
closed to date
110k+Landlord dialogues
30k+In process (Leases received)
5k+Active negotiations
700k+Opportunities with a landlord address
700k+Opportunities with a landlord address
300+Underwritings
Annual originations since inception(1)
7
8
APW – Our Portfolio Characteristics
Note: Diagram for illustrative purposes only.
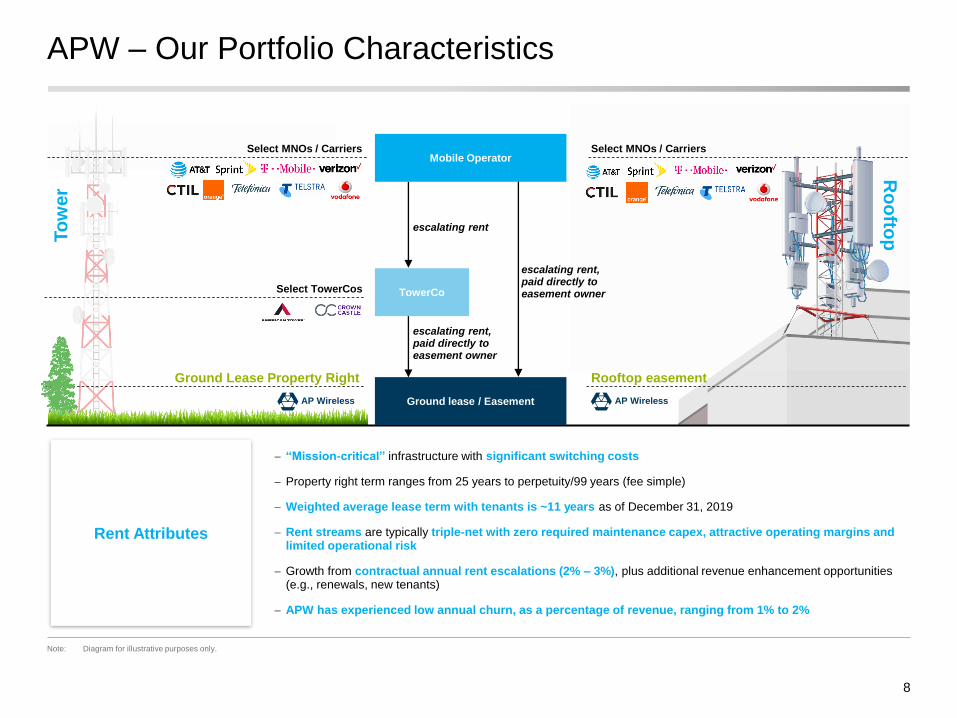
− “Mission-critical” infrastructure with significant switching costs
− Property right term ranges from 25 years to perpetuity/99 years (fee simple)
− Weighted average lease term with tenants is ~11 years as of December 31, 2019
− Rent streams are typically triple-net with zero required maintenance capex, attractive operating margins and limited operational risk
− Growth from contractual annual rent escalations (2% – 3%), plus additional revenue enhancement opportunities (e.g., renewals, new tenants)
− APW has experienced low annual churn, as a percentage of revenue, ranging from 1% to 2%
Rent Attributes
escalating rent
escalating rent, paid directly to easement ownerSelect TowerCos
Ground Lease Property Right
AP Wireless
Select MNOs / Carriers
Rooftop easement
AP Wireless
Select MNOs / Carriers
To
wer
Ro
ofto
p
Ground lease / Easement
Mobile Operator
TowerCo
escalating rent, paid directly to easement owner

9
Growth Potential of Core APW Business
APW has multiple avenues for sustained, long-term growth
APW
Wireless Real
Properties
Organic GrowthContinue Originating
in Existing Geographies
Expand into New Geographies
Other
◼ Growth at existing
assets from:
− Contractual escalators
− Lease-ups
− Lease modifications
◼ Significant whitespace
across all geographies in
which APW operates for
real property interests
◼ Estimated penetration by
geography:
− North America: ~0.3%
− Europe: ~0.6%
− South America: ~0.8%
◼ Future opportunity to
acquire assets in new
countries
◼ Portfolio acquisitions:
Acquisitions of portfolios
of leases and/or assets
around the globe
◼ Other Similar Digital
Infrastructure Assets:
− Acquisition of adjacent
assets which possess
similar attractive
attributes as core
wireless real properties

10
APW’s Opportunity to Continue Consolidating Massive & Growing Fragmented Market
Note: APW statistics based on 4,789 APW sites as of 3/31/2020. (1) Europe includes sites in Turkey and Australia. Total sites based on internal APW estimates.
Tremendous white space to continue APW’s roll-up strategy across the globe
435,000
2,707
Total sites APW sites
Europe (1)
(Includes 1,353 UK sites)
APW penetration:
~0.6%368,000
1,191
Total sites APW sites
North America (1)
(Includes 777 US sites)
APW penetration:
~0.3%
116,000
891
Total sites APW sites
South America (1)
APW penetration:
~0.8%
19%of APW portfolio in
South America
25%of APW portfolio in
North America
57%of APW portfolio in
Europe

APW Asset, Financial & Operational Summary

12
COVID-19 Impact Update
Focused Response Strong Business & Financial Positioning
◼ Minimal impact to underlying assets to date
− Telecom and digital infrastructure usage essential
during to stay at home orders
− No increase in asset churn or additions
− Nearly all essential cash functions are processed
electronically
◼ Origination activity largely unaffected
− Minor delays in the processing of transactions due
to periodic unavailability of third parties (e.g.
notaries public)
◼ Ample existing liquidity
− ~$295M of cash on balance sheet as of 12/31/19(1)
− No debt maturities until Oct. 2023
◼ Foreign exchange rate changes
− Foreign exchange rate declines and heightened
volatility across multiple currencies
While too early to determine the full impact of COVID, DLGI continues to face manageable business disruptions while focusing on the health of employees, customers and all stakeholders
◼ Ensure safety of employees and customers
− Work from home mandated for all employees
− Virtual meetings with customers whenever
possible
− Following CDC guidelines in US and local
guidelines internationally
◼ Maintaining contact with current and prospective
site owners
− Finding alternative ways to reach site owners
where necessary
− France, Canada and Belgium shut down for a
period of time
− Countries beginning to reopen
(1) Pro forma based on cash at APW as 0f 12/31/2019 and cash plus transaction impacts from Landscape’s year-end Oct-2019 statements as shown in prospectus. Excludes restricted cash of $15.1M

13
2019 Full Year Results; APW Business
Record new originations while continuing to invest for future growth
Record New Originations
Strong Financial
Performance
Acquired Rent
$8.6
$10.6
2018 2019
+23%
Note: Figures in millions. Currency as of respective year-end rates. (1) Figures exclude at least $18 million of annual run-rate cash expense resulting from the internalization of the management team and related costs as well as public company costs
Originations
$79.8
$98.9
2018 2019
+24%
◼ Largest year for both new
originations and acquired rent in
company history
◼ Origination multiples paid
remained largely flat year over
year at 9.3x
− Favorable acquisition pricing
was offset by shift in
geographies
◼ European countries scaling
(Italy, France and UK)
Adj. EBITDA(1)
$19.7 $20.5
2018 2019
+4%
Revenue
$46.4
$55.7
2018 2019
+20%
◼ Revenue grew 20% vs prior year
due to organic origination growth
and revenue enhancements (e.g.
lease modifications, lease up,
etc.) at existing sites
◼ No material change to churn
levels
◼ Certain originating costs relating
to continued investments
impacting Adj. EBITDA margins
in the short term

14
Q1 2020 Summary Results
$1.6
$2.6
Q1 19 Q1 20
+60%$14.5
$28.4
Q1 19 Q1 20
+95%$13.1
$15.5
Q1 19 Q1 20
+18%
▪ Run rate in-place rent of $60.8M as of 3/31/2020, up 14% year over year from the result of organic growth and
record acquisitions
▪ On a constant currency basis, +22% year over year and +5% vs prior quarter
▪ Originations grew 95% year over year, the highest ever growth for the company
▪ Acquisition multiple increased due to acquisition of adjacent assets and increased price related to longer purchased lease
terms
▪ Revenue growth of 18%, driven by originations and organic revenue growth mitigated by churn and foreign currency
Note: Figures in millions. Currency as of respective period-end rates.
Originations Acquired Rent Revenue
Continued success across all metrics while completing our transaction
15
Attractive High Credit Quality Tenant Base
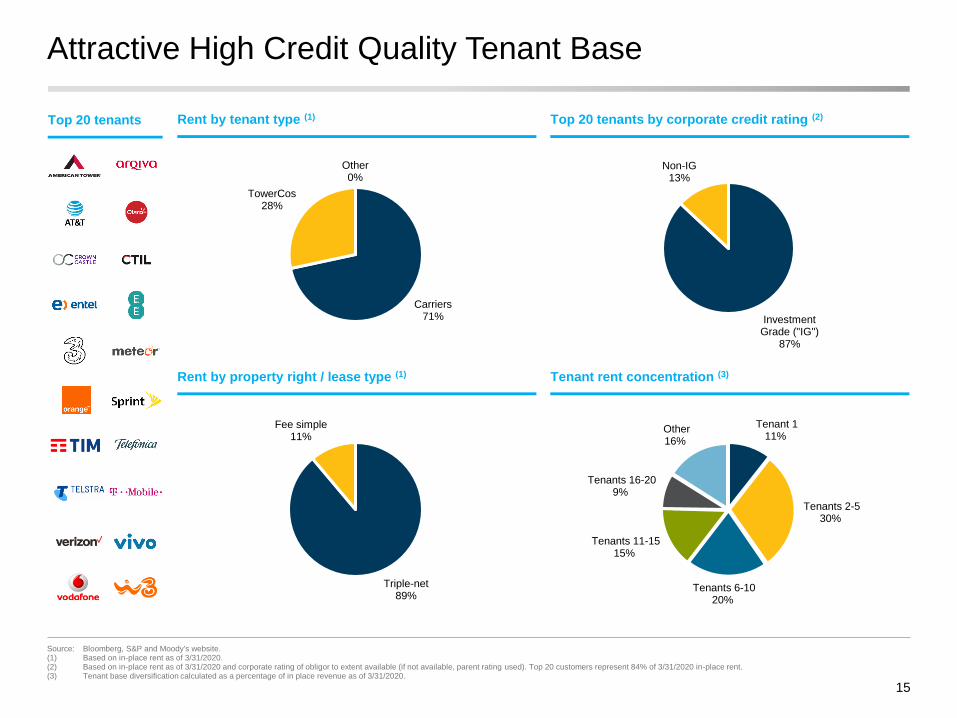
Carriers71%
TowerCos28%
Other0%
Triple-net89%
Fee simple11%
Source: Bloomberg, S&P and Moody's website.(1) Based on in-place rent as of 3/31/2020.(2) Based on in-place rent as of 3/31/2020 and corporate rating of obligor to extent available (if not available, parent rating used). Top 20 customers represent 84% of 3/31/2020 in-place rent.(3) Tenant base diversification calculated as a percentage of in place revenue as of 3/31/2020.
Tenant 111%
Tenants 2-530%
Tenants 6-1020%
Tenants 11-1515%
Tenants 16-209%
Other16%
Investment Grade ("IG")
87%
Non-IG13%
Top 20 tenants by corporate credit rating (2)Rent by tenant type (1)
Tenant rent concentration (3)Rent by property right / lease type (1)
Top 20 tenants

Tower73%
Rooftop23%
Other4%
Tower57%
Rooftop38%
Other5%
16
Portfolio Attributes
49.6 49.9
27.6
North America Europe South America
(1) Based on in-place rent as of 3/31/2020.(2) Includes Water Tank, Church Spire, Chimney, HUB, Pylon, Wind Turbine and Utility Pole.(3) OMV represents Open Market Value, which is not contractual
Monthly 40%
Quarterly14%
Bi-Annually7%
Annual39%
Asset type (International)(1)Asset type (U.S.)(1)
Rent payment frequency(1)
Index53%
OMV9%
Higher of Index/OMV
5%
Fixed31%
Index/OMV1%
None1%
Easement Interest
27%
Fee Simple Interest
11%
Leasehold Interest
33%
Usufruct 12%
Assignment of Rents
12%
Other6%
Property right type(1)
Contractual annual escalator(1)
(2) (2)
(3)
(3)
(3)
Weighted average remaining property right term (years)

17
Operating KPI Summary
1,804
2,522
3,234
3,971
4,904
6,046
2014 2015 2016 2017 2018 2019
1,273
1,770
2,336
2,969
3,717
4,586
2014 2015 2016 2017 2018 2019
($ in millions) ($ in millions)
(actuals) (actuals)
(1) Ground cash flow is equal to revenue less site specific taxes, utilities, maintenance and insurance related to fee-simple sites.(2) Figures as of 12/31/2019.
◼ Weighted average portfolio remaining property right of ~45 years(2)
◼ Weighted average remaining tenant property lease tenor of ~10 years(2)
◼ Revenue growth supported by origination activity and embedded organic growth from 2% to 3% fixed and/or local country CPI escalators
Number of sites Number of contractual lease streams
Revenue Ground cash flow(1)
$16.9
$23.1
$29.6
$37.0
$46.4
$55.7
2014 2015 2016 2017 2018 2019
$16.8
$23.0
$29.4
$36.8
$46.2
$55.4
2014 2015 2016 2017 2018 2019
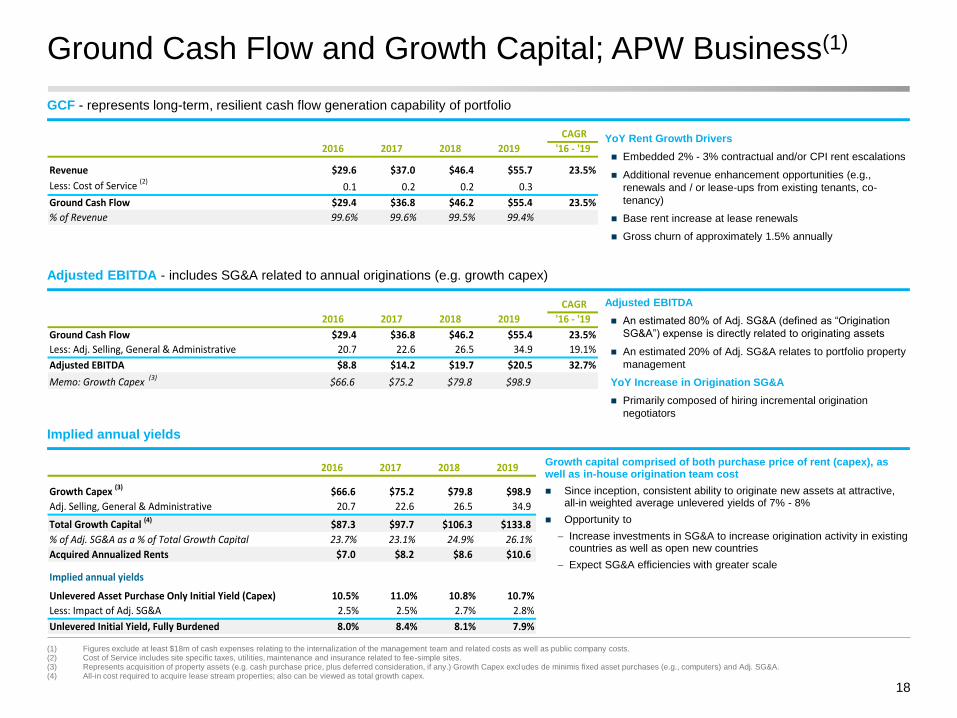
Growth capital comprised of both purchase price of rent (capex), as well as in-house origination team cost
◼ Since inception, consistent ability to originate new assets at attractive, all-in weighted average unlevered yields of 7% - 8%
◼ Opportunity to
− Increase investments in SG&A to increase origination activity in existing countries as well as open new countries
− Expect SG&A efficiencies with greater scale
Ground Cash Flow and Growth Capital; APW Business(1)
18
Adjusted EBITDA
◼ An estimated 80% of Adj. SG&A (defined as “Origination
SG&A”) expense is directly related to originating assets
◼ An estimated 20% of Adj. SG&A relates to portfolio property
management
YoY Increase in Origination SG&A
◼ Primarily composed of hiring incremental origination
negotiators
Implied annual yields
GCF - represents long-term, resilient cash flow generation capability of portfolio
(1) Figures exclude at least $18m of cash expenses relating to the internalization of the management team and related costs as well as public company costs.(2) Cost of Service includes site specific taxes, utilities, maintenance and insurance related to fee-simple sites.(3) Represents acquisition of property assets (e.g. cash purchase price, plus deferred consideration, if any.) Growth Capex excludes de minimis fixed asset purchases (e.g., computers) and Adj. SG&A.(4) All-in cost required to acquire lease stream properties; also can be viewed as total growth capex.
Adjusted EBITDA - includes SG&A related to annual originations (e.g. growth capex)
CAGR
2016 2017 2018 2019 '16 - '19
Revenue $29.6 $37.0 $46.4 $55.7 23.5%
Less: Cost of Service (2)0.1 0.2 0.2 0.3
Ground Cash Flow $29.4 $36.8 $46.2 $55.4 23.5%
% of Revenue 99.6% 99.6% 99.5% 99.4%
CAGR
2016 2017 2018 2019 '16 - '19
Ground Cash Flow $29.4 $36.8 $46.2 $55.4 23.5%
Less: Adj. Selling, General & Administrative 20.7 22.6 26.5 34.9 19.1%
Adjusted EBITDA $8.8 $14.2 $19.7 $20.5 32.7%
Memo: Growth Capex (3)$66.6 $75.2 $79.8 $98.9
2016 2017 2018 2019
Growth Capex (3)$66.6 $75.2 $79.8 $98.9
Adj. Selling, General & Administrative 20.7 22.6 26.5 34.9
Total Growth Capital (4)$87.3 $97.7 $106.3 $133.8
% of Adj. SG&A as a % of Total Growth Capital 23.7% 23.1% 24.9% 26.1%
Acquired Annualized Rents $7.0 $8.2 $8.6 $10.6
Implied annual yields
Unlevered Asset Purchase Only Initial Yield (Capex) 10.5% 11.0% 10.8% 10.7%
Less: Impact of Adj. SG&A 2.5% 2.5% 2.7% 2.8%
Unlevered Initial Yield, Fully Burdened 8.0% 8.4% 8.1% 7.9%
YoY Rent Growth Drivers
◼ Embedded 2% - 3% contractual and/or CPI rent escalations
◼ Additional revenue enhancement opportunities (e.g.,
renewals and / or lease-ups from existing tenants, co-
tenancy)
◼ Base rent increase at lease renewals
◼ Gross churn of approximately 1.5% annually

DLGI Financial Overview

20
DLGI Financial Position Overview (as of 12/31/2019)
Domestic26%
International74%
Domestic26%
International74%
Revenues(3)
USD - 26%
GBP - 24%EUR - 20%
BRL - 10%
CLP - 8%
AUD - 5%
CAD - 3%Other - 5%
Rent by Currency Debt outstanding(4)
(1) Based on weighted average cost of debt for all underlying series(2) Pro forma based on cash at APW as 0f 12/31/2019 and cash plus transaction impacts from Landscape’s year-end Oct-2019 statements as shown in prospectus. Excludes restricted cash of $15.1M(3) In place statistics as of 12/31/2019(4) Excludes installments payable
Balance Sheet (12/31/2019) – Excludes Installments
Currency Matching
Financial Position Highlights
◼ Outstanding debt is100% fixed rate and
approximately 26% USD, 32% GBP and
43% EUR denominations, with
borrowings in local currency when
possible
◼ Net leverage of 4.7x 12/31/19 in-place
rent
◼ Weighted-average fixed rate coupon
(including PIK) of 4.7%
◼ Weighted-average remaining term of ~7
years
◼ DLGI also has ~$37.5M of installment
payments outstanding
(1)
(1)
(2)
Local USD
Currency Amount FX Amount Maturity Interest
Domestic Senior USD $102.6 1.00 $102.6 Oct-23 Fixed @ 4.25%
Domestic Junior USD $49.3 1.00 $49.3 Jun-20 Fixed @ 6.50%
Total Domestic Debt $151.9
International Senior - EUR Tranche EUR € 155.0 1.12 $174.0 Oct-27 Fixed @ 3.93%
International Senior - GBP Tranche GBP £140.0 1.33 $185.7 Oct-27 Fixed @ 4.52%
International Junior EUR € 68.2 1.12 $76.6 Nov-28
Fixed @ 4.25% +
2% PIK
Total International Debt $436.4
Total Gross Debt $588.2 WA Cash Cost: 4.43%
Cash $295.0 WA Total Cost: 4.69%
Total Net Debt $293.2 WA Remaining Term: 6.7
In-Place Rent as of 12/31/2019 $62.1
Gross Leverage on In-Place Rent 9.5x
Net Leverage on In-Place Rent 4.7x

21
DLGI Financial Position Overview (as of 12/31/2019)
No material refinancing due prior to 2023
$102.6
$49.3
$359.7
$76.6
$0
$50
$100
$150
$200
$250
$300
$350
$400
2020 2021 2022 2023 2024 2025 2026 2027 2028
Domestic Senior Domestic Junior International Senior International Junior
c. 7 years for International maturity wall
(1) DLGI repurchased Domestic Junior note @ $98 on April 21, 2020
(1)

Appendix

Compelling APW Attributes
1 Strong tailwinds from global growth in mobile data consumption and infrastructure upgrades due to continued transition to 5G networks ensure that cell site ground rents remain fundamental building blocks of digital infrastructure
5 Seasoned executive management team with 30+ years of operating experience together
4 Predictable and durable escalating rent annuity with no maintenance capital expenditures from high credit quality tenants generates compelling risk-adjusted yields
2 Properties underlying “mission critical” infrastructure with high barriers to entry due to required expertise, zoning restrictions and “NIMBY” (“not in my backyard”) considerations
3 Proven wireless ground rent origination platform based on data-driven, underwriting to continue consolidating fragmented wireless easement market
AP W
irele
ss
23

24
How to View APW
(1) As of 3/31/2020.(2) Figures exclude at least $18 million of run-rate cash expense resulting from the internalization of the management team and related costs as well as public company costs excluding one-time year one costs(3) TUMI = Site specific taxes, Utilities, Maintenance and Insurance expense as applicable(4) An estimated 80% of Adj. SG&A is related to origination and 20% to maintaining the portfolio. Figures exclude at least $18 mi llion of run-rate cash expense resulting from the internalization of the management team and
related costs as well as public company costs excluding one-time year one costs
Illustrative Financial Breakdown
Portfolio Origination Consolidated
2019 Rent $55.7 - $55.7
(-) Site specific costs (TUMI)(3) 0.3 - 0.3
2019 Ground Cash Flow ("GCF") $55.4 - $55.4
Adj. SG&A(4) $7.0 $27.9 $34.9
Capex - 98.9 98.9
Growth Capital $7.0 $126.8 $133.8
2019 Adjusted EBITDA $48.4 ($27.9) $20.5
Memo: Acquired rent - $10.6 10.6
Memo: Implied yield 8.3%
($ in millions)
APW is a combination of a “Yield Co” and an “Origination Platform”
In-country dedicated teams identifying, underwriting and acquiring lease streams one by one
◼ Valuation typically based on implied yields on invested capital
◼ In 2019, APW invested ~$99M in direct capex and ~$28M in origination-related SG&A
◼ With ~$10.6M in acquired rents, the platform yielded assets at ~8.3%
Expert team Database
Platform acquiring assets at attractive returns
Origination Platform
6,300 in-place rent streams(1) generating steady, escalating cash flows with low required SG&A
◼ Primarily valued based on traditional valuation metrics and NTM rent
◼ APW generated $55.7M of rent in 2019 – which will grow via escalators
◼ Approximately $7M of Adj. SG&A is related to maintaining the platform, resulting in Yield Co Adj. EBITDA of $48.4M(2)
Yield Co (Portfolio of Rents)
A portfolio of yielding assets that grow organically

25
History of International Growth
USA2010
Canada2012
Australia2013
Netherlands2014
Puerto Rico2012
Brazil2013
Turkey2013
Mexico2013
Germany2012
Chile2015
Romania2017
Colombia2018
Portugal2018
``
Italy2018
Ireland2014
France2014
Belgium2019
UK2012
Spain2013
Hungary2018

26
Underlying APW-owned Leases Support Mission Critical Infrastructure
Cost of Decommission
Vs.
Cost of Replenishment(1)
Source: AltmanVilandrie & Co. AnalysisNote: Diagram for illustrative purposes only, not to scale. (1) Depends on country and type of tower. Cost of decommission is typically the obligation of the tower owner.
Infrastructure◼ “Backhaul” connectivity (e.g., fiber, microwave, coax)
◼ Existing equipment on site
✓
Coverage and Capacity
◼ Proximity to other competitors and tenant’s pre-existing cell sites
◼ Physical location (e.g., height, land for expansion, airspace, plans for obstructive construction)
✓
Underwriting Characteristics
Terms
◼ Term of underlying lease with tenant
◼ Asset term available for acquisition
◼ Financial terms (e.g., right of first refusal, price, magnitude of annual escalator, pre-existing mortgage)
✓
◼ Contractual requirement for tenant to return ground to original state
◼ Significant decommissioning costs and upfront cost to rebuilding wireless infrastructure
High Financial Costs of Switching
✓
Labor and Time Intensive
◼ Difficulty identifying underlying land / easement owner resulting in long lease execution processes
✓
Limited Alternatives
◼ Not In My Backyard attitude (“NIMBY”) and restrictive zoning laws results in difficulty replicating APW’s global portfolio
✓
Mission Criticality of Tower and Cell Sites
◼ Location and height designed for optimal coverage and wireless signal range
◼ Demand for ubiquitous coverage outdoors and indoors
Network Topology
✓

27
Overview of Digital Landscape’s Structure
Note: Structure above is referred to as an “UP-C”, similar to an UP-REIT. Data is as of 3/31/2020(1) All securities held by former investors in Associated Partners, LP are exchangeable for ordinary shares in Digital Landscape Group, Inc.(2) Ownership of future expansion opportunities could change on an individual deal basis.(3) Simplified cap table assumes all dilutive securities are “in the money” (whether “in the money” or not) nor has “treasury stock method” been applied when calculating any dilutive impact. Please refer to appendix and the
prospectus for full details on dilutive securities. Simplified cap table also excludes any impact from a potential Series A Founder Preferred Share dividend.(4) If all APW OpCo securities have vested and no securities have been exchanged for Ordinary Shares, the Company will own approximately 82% of APW OpCo.
◼ Future potential expansion into digital infrastructure adjacencies
Future Expansion Opportunities
◼ Core real property interests and attached rents aggregation business
◼ Includes ~300-person global operating and origination team and 6,300 lease streams
AP Wireless
Digital Landscape Group, Inc.
Rollover equity from former investors in Associated
Partners, LP(1)
91.8%(4)8.2%(1)
APW OpCo LLC
100% TBD(2)

28
DLGI “As Converted” Capitalization Table Detail(1)
Note: Data is as of 5/31/2020(1) Capitalization table assumes all dilutive securities are “in the money” (whether “in the money” or not) nor has “treasury stock method” been applied when calculating any dilutive impact. Please refer to the prospectus for full
details on dilutive securities. Cap table also excludes any impact from a potential Preferred Share dividend.(2) Please refer to prospectus for full detail on potential impact from Preferred Share dividends.
Share Class Shares Voting Rights Detail
Ordinary Shares 58,425,000 58,425,000
Class B Shares 5,389,030 5,389,030
Series A Founder Preferred Shares 1,600,000 1,600,000 Includes right to Preferred Share dividend (2)
Total Basic Shares 65,414,030 65,414,030
Potential Impact of Dilutive Securities
Warrants Related to Placement 16,675,000 16,675,000 Represents common equivalent. 50.25M total warrants redeemable 3:1. Strike price of $11.50
Directors Options 125,000 125,000 Strike price of $11.50
Series B Rollover Profit Units 625,000 625,000 Vests evenly over 3 years. No strike price.
Series A LTIPS - Time Vesting 3,376,076 3,376,076 ~1.4M shares vest evenly over 3 years. ~2.0M vest evenly over 5 years.
Series A LTIPS - Performance & Time Vesting 2,023,924 2,023,924 Two hurdles for vesting:
1) Performance vest: 25% at $11.50, 25% at $13.50, 25% at $15.50 and 25% at $17.50
2) Time vest: 50% over 3 years and 50% over 7 years
Total Series A LTIPs 5,400,000 5,400,000
Series B LTIPs 1,386,033 1,386,033 Ratable vesting from $10 to $20 with a 9 year expiration
Series A Stock Options 2,677,000 2,677,000 Strike price of $7.67, 5 year vesting
Series A Restricted Shares 366,875 366,875 345,875 vest in 1 year; 21,000 vest in 5 years
Total Potential Impact of Dilutive Securities 27,254,908 27,254,908
Total Potential Fully Diluted Shares Outstanding 92,668,938 92,668,938

29
APW Income Statement (Excluding DLGI Holdco Costs)
(1) Cost of Service includes taxes, utilities, maintenance and insurance related to fee-simple sites.(2) Figures exclude at least $18 million of run-rate cash expense resulting from the internalization of the management team and related costs as well as public company costs excluding one-time year one costs
2016 2017 2018 2019
Revenue $29.6 $37.0 $46.4 $55.7
Less: Cost of Service(1) 0.1 0.2 0.2 0.3
Ground Cash Flow $29.4 $36.8 $46.2 $55.4
Selling, General and Administrative (“SG&A”)(2) 21.0 23.5 27.9 36.8
Depreciation and Amortization 19.1 23.6 29.2 19.1
Management Incentive Plan 0.0 0.0 5.2 0.9
Non-cash Impairment 0.9 1.9 0.3 2.6
Total Operating Expense $41.0 $49.0 $62.6 $59.4
Operating Loss ($11.6) ($12.1) ($16.4) ($4.0)
Other, net 0.1 1.4 (2.5) 0.2
Loss on Extinguishment of Debt (1.3) 0.0 0.0 0.0
Realized / Unrealized Gain / (Loss) on Foreign Currency 9.7 (10.4) 13.8 (6.1)
Interest Expense (21.4) (26.4) (27.8) (32.0)
Net Loss Before Taxes ($24.4) ($47.5) ($32.8) ($42.0)
Income Taxes 0.1 (2.5) (2.8) (2.5)
Net Loss ($24.3) ($50.1) ($35.7) ($44.4)

30
APW EBITDA Reconciliation (Excluding DLGI Holdco Costs)
2016 2017 2018 2019
Net Loss ($24.3) ($50.1) ($35.7) ($44.4)
Depreciation and Amortization 19.1 23.6 29.2 19.1
Interest Expense 21.4 26.4 27.8 32.0
Tax Expense (0.1) 2.5 2.8 2.5
EBITDA $16.1 $2.4 $24.1 $9.2
Non-cash Impairment 0.9 1.9 0.3 2.6
Loss on Extinguishment of Debt 1.3 0.0 0.0 0.0
Realized / Unrealized (Gain) / Loss on Foreign Currency Debt (9.7) 10.4 (13.8) 6.1
Management Incentive Plan 0.0 0.0 5.2 0.9
Non-cash foreign currency adjustments and other 0.3 (0.5) 3.9 1.7
Adjusted EBITDA $8.8 $14.2 $19.7 $20.5
Selling, General & Administrative (“SG&A”)(1) 21.0 23.5 27.9 36.8
Other, net (0.1) (1.4) 2.5 (0.2)
Non-cash Foreign Currency Movements and other (0.3) 0.5 (3.9) (1.7)
Adjusted Selling, General & Administrative (“Adj. SG&A”) $20.7 $22.6 $26.5 $34.9
(1) Figures exclude at least $18 million of run-rate cash expense resulting from the internalization of the management team and related costs as well as public company costs excluding one-time year one costs
EBITDA Reconciliation(1)
Adjusted Selling, General & Administrative (“Adj. SG&A”)


