25
A million dollar challenge to map Indonesian peatlands – A Digital Soil Mapping Approach BUDIMAN MINASNY, RUDIYANTO, BUDI INDRA SETYAWAN
| Date post: | 19-Jan-2017 |
| Category: |
Science |
| Upload: | budiman-minasny |
| View: | 40 times |
| Download: | 0 times |

A million dollar challenge to map
Indonesian peatlands –
A Digital Soil Mapping Approach
BUDIMAN MINASNY,
RUDIYANTO, BUDI INDRA SETYAWAN
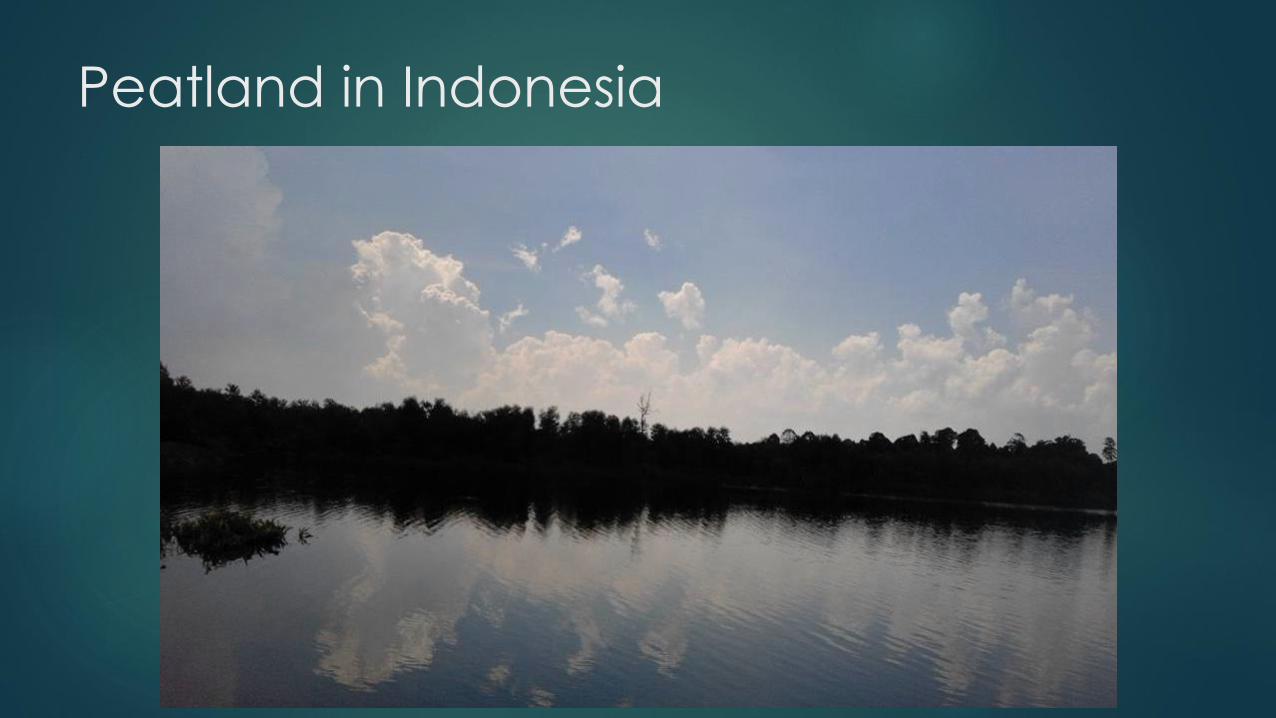
Peatland in Indonesia


Soil C stock in Indonesia
Land area: 190 Mha
C stock mineral soil: 0-30 cm: 9.9 ± 0.4 Gt C (Sulaeman, 2015)
Peatland: 33.7 Gt C (Wahyunto), area: 20.9 Mha

1997 Fire, released ~0.19-0.23 Gt C
2016 fire ~0.48 Gt C
Indonesia’s annual GHG emission
(excluding land use) ~0.21 Gt C.

A million dollar prize
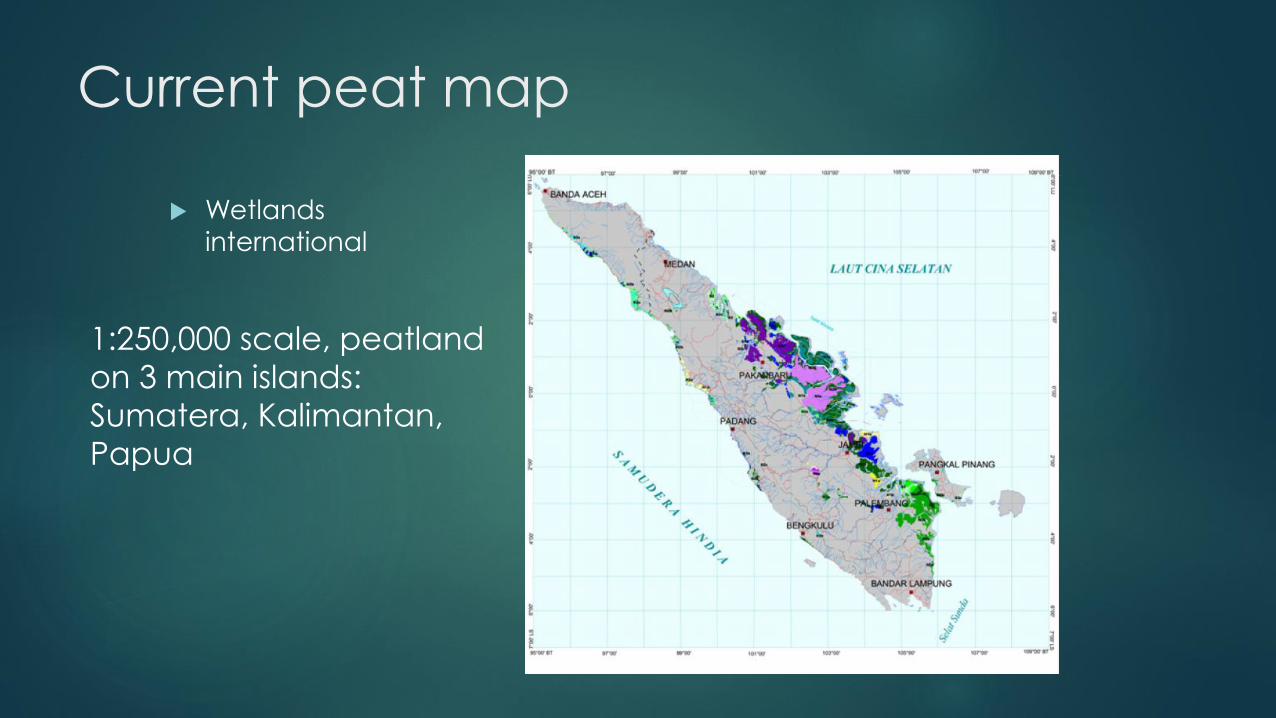
Current peat map
Wetlands
international
1:250,000 scale, peatland
on 3 main islands:
Sumatera, Kalimantan,
Papua

Proposed Methodologies
Using Remote & proximal sensing
LIDAR
Gamma Radiometrics (Ireland, Finland…)
EMI
These sensors require ground calibration, not cost effective over large
extent
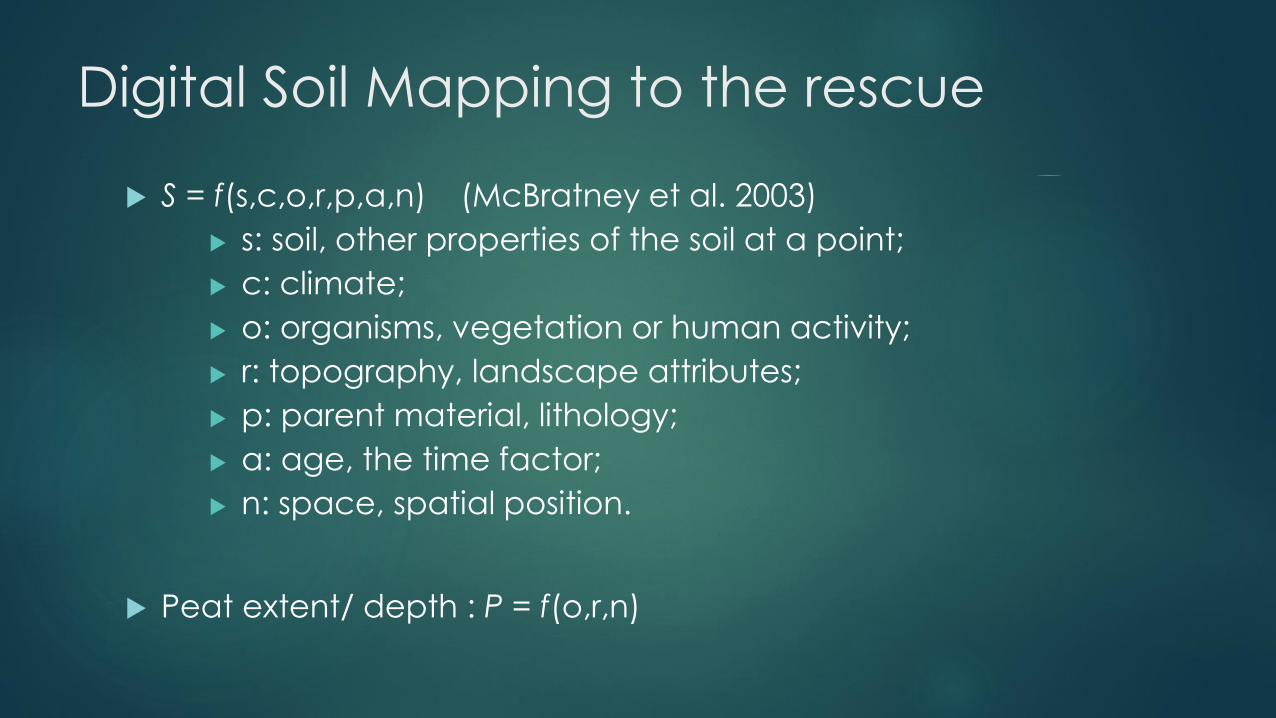
Digital Soil Mapping to the rescue
S = f(s,c,o,r,p,a,n) (McBratney et al. 2003)
s: soil, other properties of the soil at a point;
c: climate;
o: organisms, vegetation or human activity;
r: topography, landscape attributes;
p: parent material, lithology;
a: age, the time factor;
n: space, spatial position.
Peat extent/ depth : P = f(o,r,n)

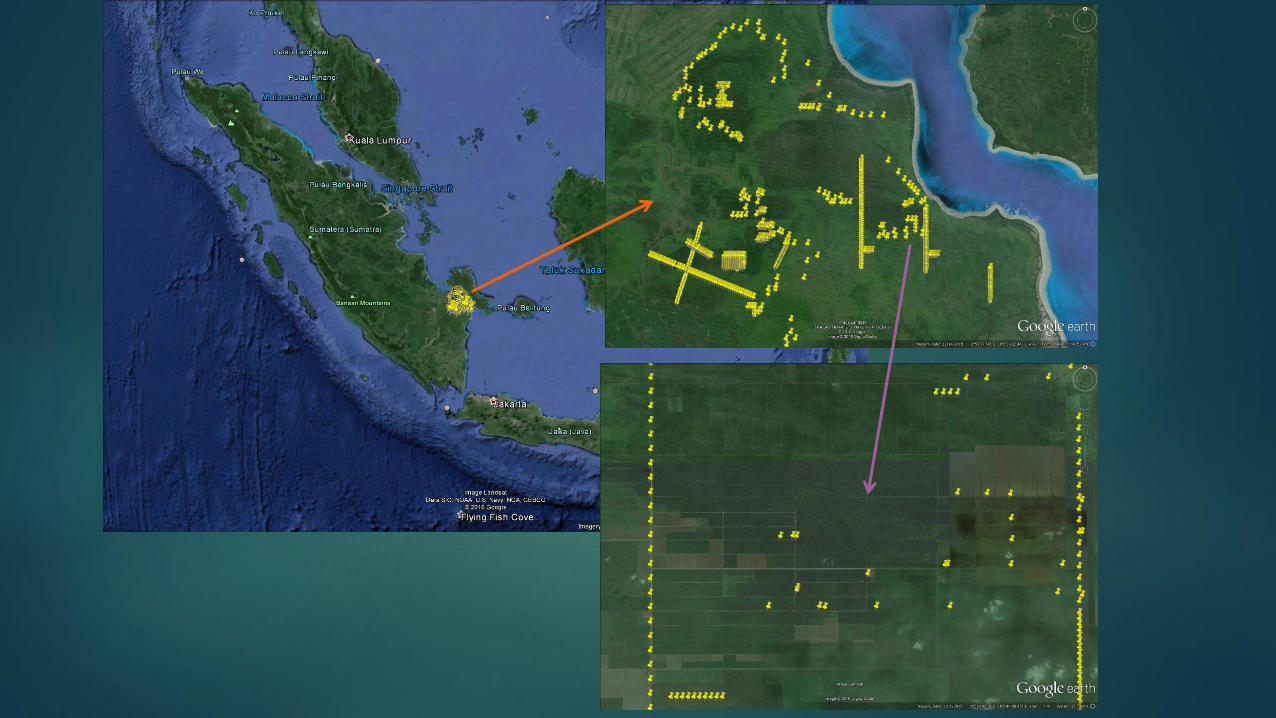
Mapping peat extent & depth
Ogan Komering Ilir (OKI) South Sumatra
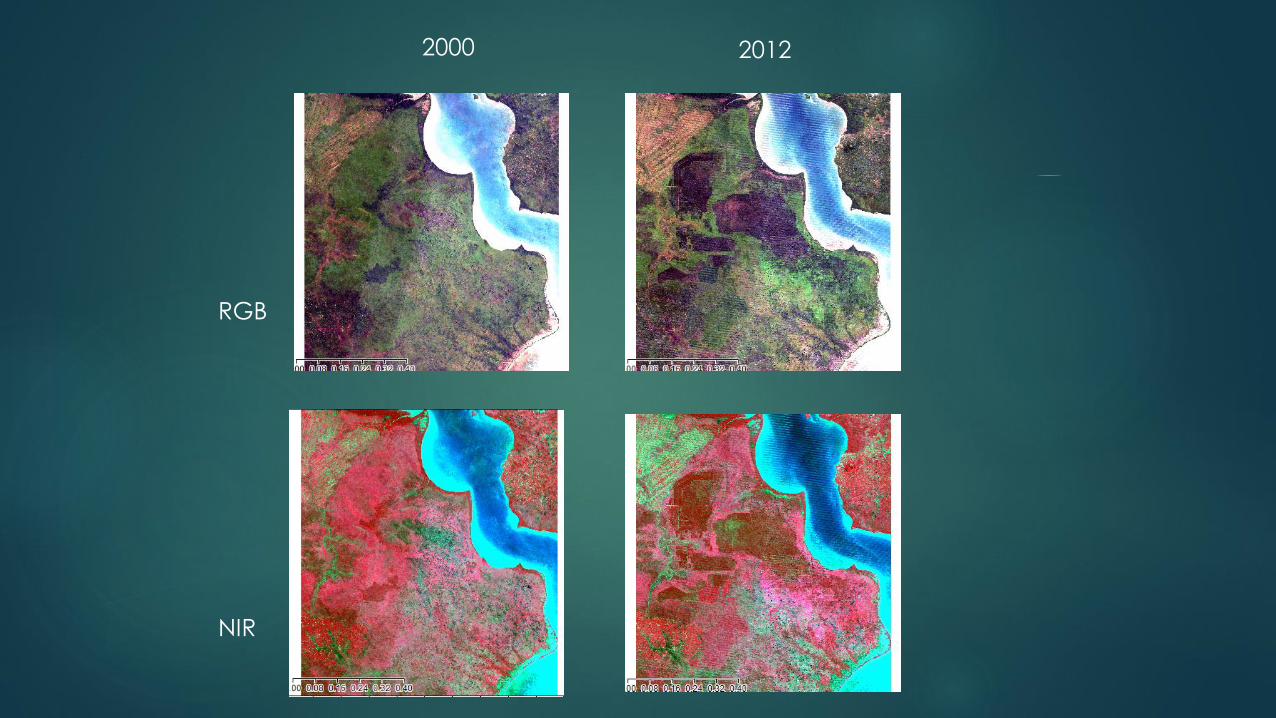
2000 2012
RGB
NIR

LS-TIR
Elevation
MrRTF
Distance to river
Random
Forests
Peat extentPeat Information &
Observations
Mapping peat extent

Peat extent
RF: Accuracy : 0.94, Kappa : 0.8956
Plantation
forest
Random?
forest

Mapping peat depth
Minasny, Budiman, Budi Indra Setiawan, Chusnul Arif, Satyanto Krido Saptomo, and Yudi Chadirin. "Digital mapping for cost-effective and accurate prediction of the depth and carbon stocks in Indonesian peatlands." Geoderma 272 (2016): 20-31.

Peat depth observations
Peat auger
GPS
Peat
Marine clayAround 10 m
depth
Peat depth
drilling

Peat depth = f(elevation,
distance to rivers,
wetness index…)
610,311 ha
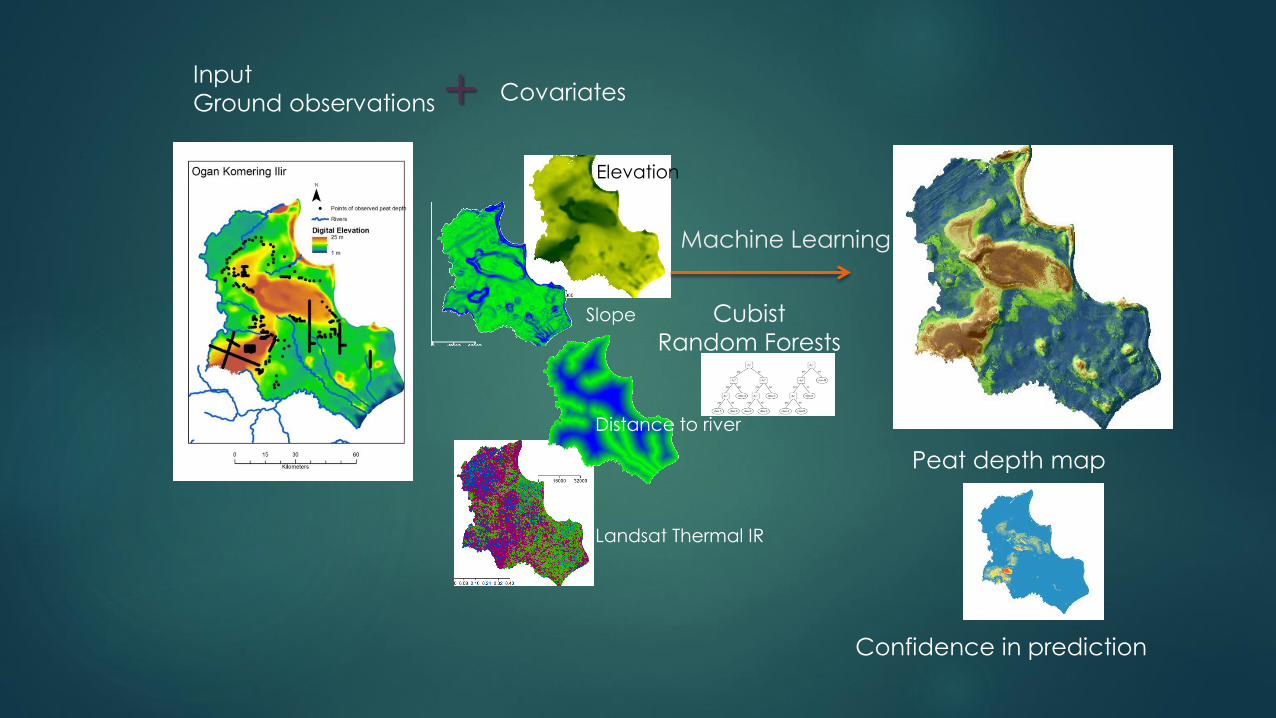
Input
Ground observations Covariates
Elevation
Slope
Distance to river
Landsat Thermal IR
Cubist
Random Forests
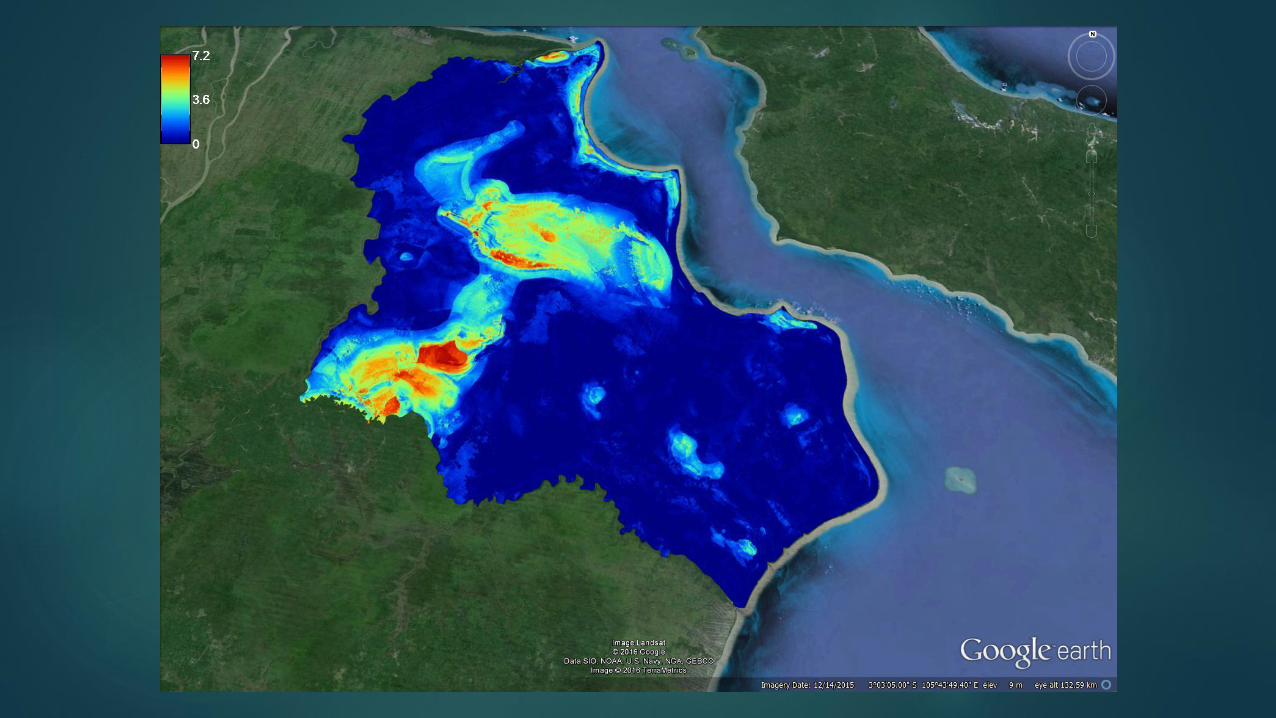
Peat depth map
+
¯
0 50 10025
Kilometers
Predicted peat depth
0 - 1 m
1 - 2 m
2 - 3 m
3 - 4 m
4 - 5 m
5 - 6 m
6 - 7 m
7 - 8 m
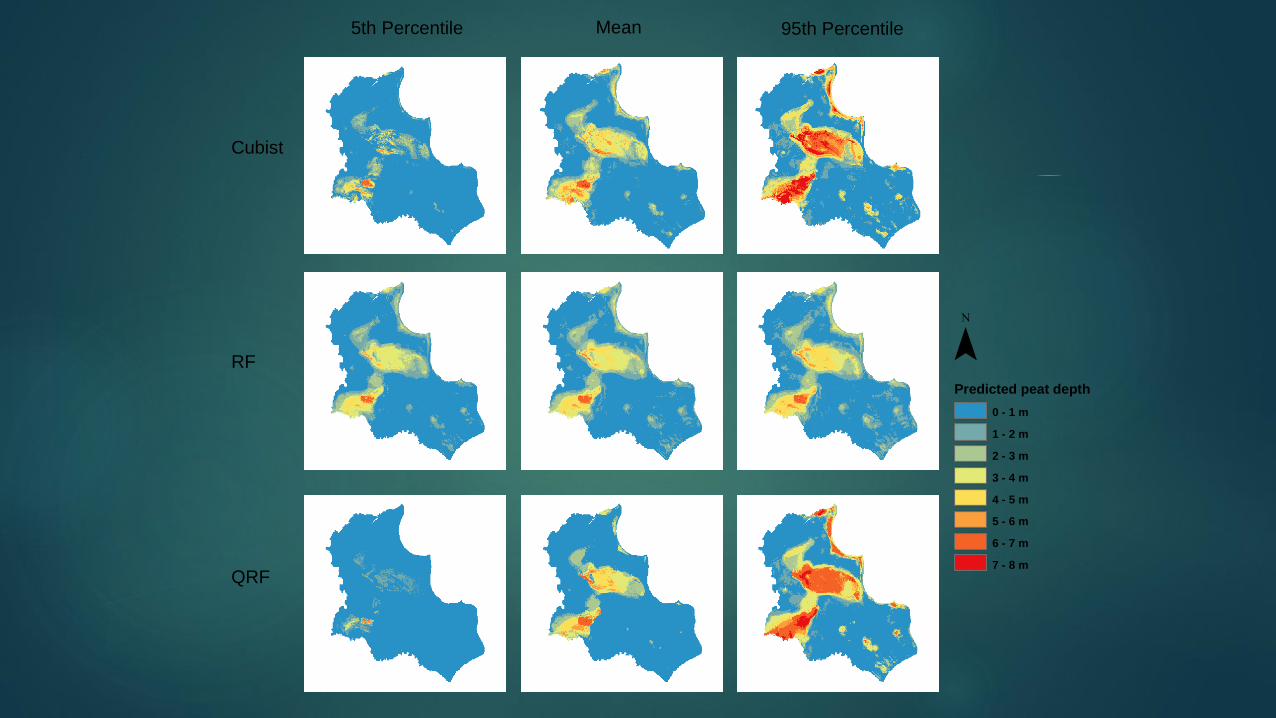
Mean 95th Percentile5th Percentile
ANN
QRF
RF
Cubist
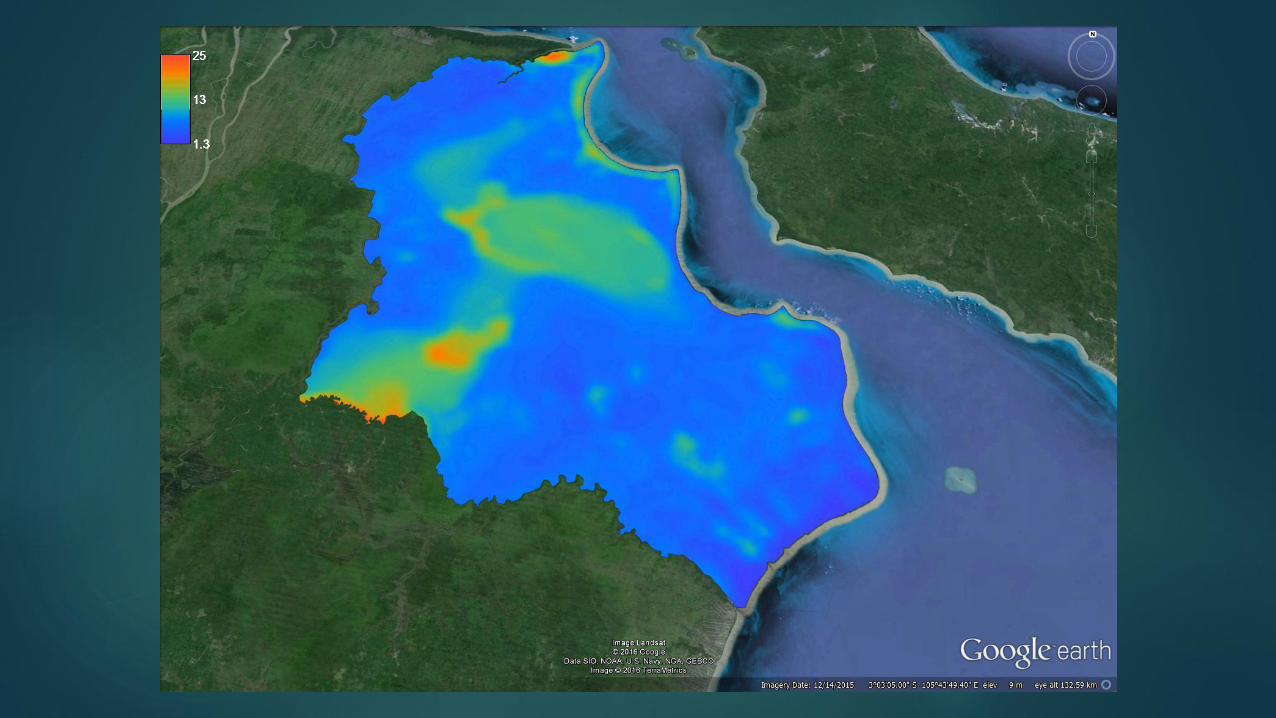
Confidence in prediction
Machine Learning

Condition Model
92 94 Elevation
45 78 Wetness Index
22 25 Slope
14 46 Distance to River
8 50 Aspect
44 Band 4 (NIR)
22 Band 7 (SWIR)
18 Band 5 (SWIR)
R2 RMSE bias
0.95 0.51 -0.078
Important Covariates
Percent of times covariates used in a Cubist model
Random Forests
¯
0 50 10025
Kilometers
Predicted peat depth
0 - 1 m
1 - 2 m
2 - 3 m
3 - 4 m
4 - 5 m
5 - 6 m
6 - 7 m
7 - 8 m
Mean 95th Percentile5th Percentile
ANN
QRF
RF
Cubist

𝑉𝑝 =
𝑖=1
𝑚
𝑇𝑖 𝐴𝑐𝑒𝑙𝑙 =
𝑖=1
𝑚
𝑇𝑖 ΔX ΔY
𝐶𝑝 = 𝑉𝑝 × 𝐵𝐷 × 𝐶𝑐
Peat Volume
Peat C stock
Prediction of peat volume
(x 109 m3)
Prediction of Carbon stock
(x 109 tonnes = Giga tonnes)
C stock
(t C/ha)
5th
percentile
Mean 95th
percentile
5th
percentile
Mean 95th percentile Mean
Cubist 2.6 6.3 10.4 0.1 0.5 0.9 816
RF 6.1 7.3 8.6 0.3 0.6 0.9 945
QRF 0.8 4.6 13.0 0.1 0.4 1.5 595
Whole Area: 6103 km2
Rudiyanto et al. 2015

Conclusions
DSM can facilitate the delivery of fine resolution peat maps
accurately and cost-effectively.

Update:
Peat Prize Competing teams 1. Bell Geospace and PT Rubotori Petrotech Indonesia
2. Duke University and PT Greencap NAA Indonesia
3. Deltares and Bandung Institute of Technology (ITB)
4. DRYAS, a team of independent Indonesian researchers
5. Bogor Institute of Agriculture (IPB) and the University of Sydney
6. Remote Sensing Solutions GmbH (RSS), Agency of the Assessment and Application of Technology (BPPT) and Sriwijaya University
7. UGM (Gadjah Mada University) Indonesian Peat Mapping Team
8. Applied GeoSolutions and National Institute of Aeronautics and Space (LAPAN)
9. PT EXSA Internasional/Forest Inform Pty Ltd
10. Stanford University and Tanjungpura University
11. NARIC Forest Research Institute


