26
Digital media trends survey A new world of choice for digital consumers A report by the Center for Technology, Media & Telecommunications

Digital media trends survey A new world of choice for digital consumers
A report by the Center for Technology, Media & Telecommunications
ABOUT THE CENTER FOR TECHNOLOGY, MEDIA & TELECOMMUNICATIONS
In a world where speed, agility, and the ability to spot hidden opportunities can separate leaders from laggards, delay is not an option. Deloitte’s Center for Technology, Media & Telecommunica-tions helps organizations detect risks, understand trends, navigate tough choices, and make wise moves.
While adopting new technologies and business models normally carries risk, our research helps clients take smart risks and avoid the pitfalls of following the herd—or sitting on the sidelines. We cut through the clutter to help businesses drive technology innovation and uncover sustainable business value. Armed with the center’s research, TMT leaders can efficiently explore options, evaluate opportunities, and determine whether it’s advantageous to build, buy, borrow, or part-ner to attain new capabilities.
The center is backed by Deloitte LLP’s breadth and depth of knowledge—and by its practical TMT industry experience. Our TMT-specific insights and world-class capabilities help clients solve the complex challenges our research explores.
Digital media trends survey, 12th edition
Introduction | 2
Insight No. 1: Streaming crosses the chasm | 4
Insight No. 2: Pay TV: minding the value gap | 7
Insight No. 3: Emergence of the ‘MilleXZials’ | 10
Insight No. 4: Personal data: a concern —and an opportunity | 15
What’s next? Understanding the power of mobile video | 17
Endnotes | 18
CONTENTS
A new world of choice for digital consumers
1
CONSUMERS today want original, high-qual-ity content, and are less willing to pay for packages containing programming they’ll
never watch. They are demanding the ability to view content whenever, wherever, and in the format that best suits their needs at any given moment. And, more than ever before, they are willing to leave pro-viders who don’t satisfy these requirements.
To understand where things stand today, and where they are going, every year Deloitte’s Technol-ogy, Media & Telecommunications practice exam-ines the generational habits of US consumers. We do this to uncover the shifting attitudes and behav-iors that involve entertainment devices, advertising, media consumption, social media, and the Internet.
In our Digital media trends survey, 12th edi-tion (formerly the Digital democracy survey), we
uncovered several key insights that illustrate major shifts in media consumption:• Streaming video crosses the chasm. The
adoption of streaming video subscriptions con-tinues to grow—fueled by consumers’ strong de-sire for original content and the flexibility to con-sume media wherever and whenever they want.
• Pay TV’s “value gap” is expanding. The growth of streaming video has, in part, led con-sumers to reassess the value of their pay TV subscriptions. There is a widening value gap be-tween what they expect and what pay TV provid-ers actually deliver.
• Emergence of the “MilleXZials.” The sur-vey revealed that younger generations are not the only ones driving these trends. In particular, the mobile consumption behaviors of Genera-
Introduction
With the proliferation of mobile devices, wireless connectivity, and alterna-tive digital media platforms, one thing has become clear: Consumers are increasingly in control. They now enjoy unparalleled freedom when it comes to selecting media and entertainment options and their expectations are at an all-time high.
Digital media trends survey, 12th edition
2

tion X (ages 35–51) now closely mirror those of Generation Z (ages 14-20) and millennials (ages 21-34). We are calling this combined group (Gen Z, millennials, and Gen X) the “MilleXZials.”
• Personal data is increasingly a concern—and an opportunity. With a sizable portion of consumption happening online, all consum-
ers are increasingly protective of their personal data. This creates an opportunity for provid-ers to give customers more control over their personal data.In the pages that follow, we explore major high-
lights from our survey and shed light on what each may signify for the future of digital media.
ABOUT DELOITTE’S DIGITAL MEDIA TRENDS SURVEYThis is the 12th edition of Deloitte’s Digital media trends survey, conducted by Deloitte’s Technology, Media & Telecommunications practice.
The survey provides insight into how five generations of US consumers are interacting with media, products and services, mobile technologies, and the Internet. It also captures consumers’ attitudes and behaviors toward advertising and social networks—and what their preferences might be in the future.
This year’s US data was collected in November 2017 and employed an online methodology among 2,088 consumers across the following age groups:
• Generation Z: ages 14–20 (born 1997–2003)
• Millennials: ages 21–34 (born 1983–1996)
• Generation X: ages 35–51 (born 1966–1982)
• Baby boomers: ages 52–70 (born 1947–1965)
• Matures: ages 71+ (born 1946 or earlier)
All data is weighted back to the US census to give a representative view of the average US consumer. For meaningful changes, we look for differences in year-over-year tracking and generational differences of at least 5 percentage points.
Note that the insights shared in this executive summary represent just a sample of the data included in the complete survey. If you are interested in additional insights, please email us at [email protected], or continue the conversation with us on Twitter @DeloitteTMT.
A new world of choice for digital consumers
3
PERHAPS more than any other factor, stream-ing is enabling the new level of autonomy that consumers now enjoy when choosing how,
when, and where they view digital video content. Since Deloitte started tracking subscription
video on demand (SVOD) in 2009, adoption of streaming video services has risen each year. How-ever, streaming truly “crossed the chasm” in 2017: 55 percent of US households now subscribe to paid streaming video services (the first time US streaming has passed the 50 percent threshold). In under a de-cade, the percentage of US households subscribing to a paid streaming video service grew 450 percent—from just 10 percent in 2009 to 55 per-cent in 2017.
Consumers’ appetite for video and streaming is insatiable
US consumers can now choose from among 200
SVOD options,1 and they are taking full advantage: Our survey indicates that they subscribe to an av-erage of three on-demand streaming services. That translates to collective monthly spending of $2.1 billion by US households on these services—and this figure keeps growing.2
US consumers clearly love watching video. In fact, they spend nearly as much time watching video as they do on their jobs. Our survey reveals that on average, US consumers spend 38 hours
watching video content each week, 15 hours (or 39 percent) of which is streamed.
These numbers reflect the continuing rise of video content consumption over the past several years, and are driven particularly by stream-ing services. As a result of the
increased consumption of live and streamed video,
consumers now spend less time on other en-tertainment activities such as reading and
listening to mu-sic. Ten years ago (2007), consumers reported watching about 15 hours of broadcast TV con-
tent per week;3 that number has now grown to 23 hours.
Insight No. 1Video streaming crosses the chasm
Digital media trends survey, 12th edition
4
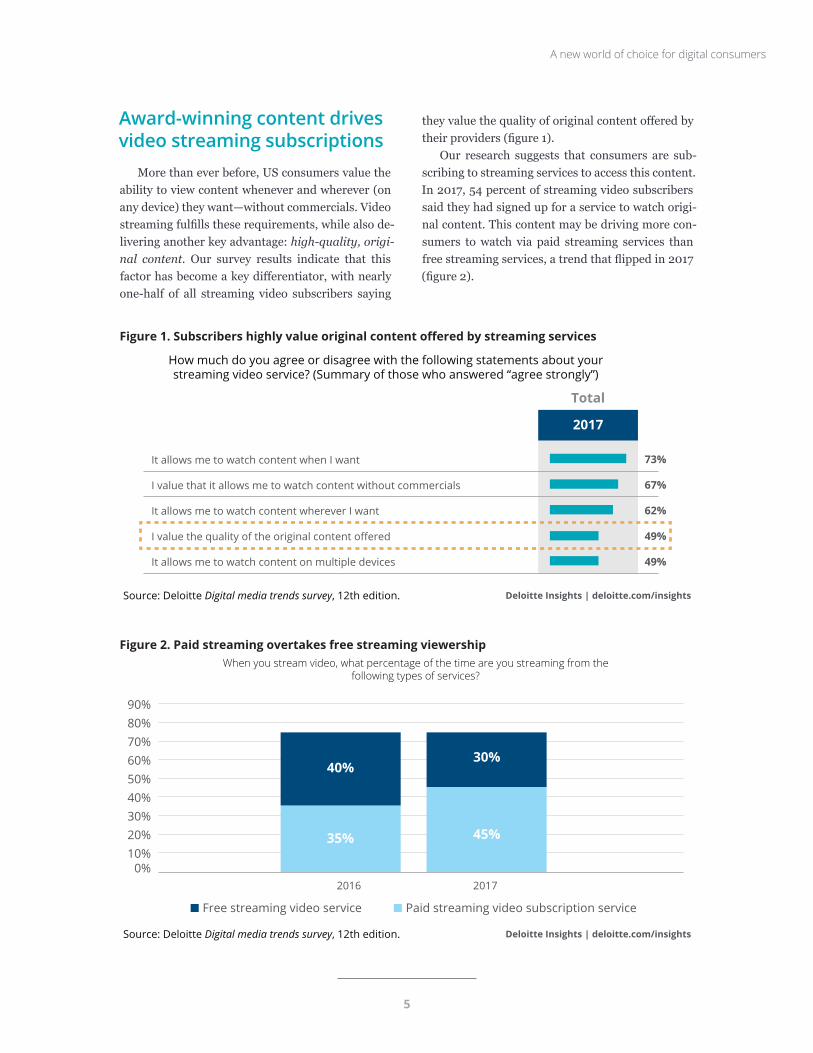
Award-winning content drives video streaming subscriptions
More than ever before, US consumers value the ability to view content whenever and wherever (on any device) they want—without commercials. Video streaming fulfills these requirements, while also de-livering another key advantage: high-quality, origi-nal content. Our survey results indicate that this factor has become a key differentiator, with nearly one-half of all streaming video subscribers saying
they value the quality of original content offered by their providers (figure 1).
Our research suggests that consumers are sub-scribing to streaming services to access this content. In 2017, 54 percent of streaming video subscribers said they had signed up for a service to watch origi-nal content. This content may be driving more con-sumers to watch via paid streaming services than free streaming services, a trend that flipped in 2017 (figure 2).
Deloitte Insights | deloitte.com/insightsSource: Deloitte Digital media trends survey, 12th edition.
Figure 1. Subscribers highly value original content offered by streaming services
73%
67%
62%
49%
49%
It allows me to watch content when I want
I value that it allows me to watch content without commercials
It allows me to watch content wherever I want
I value the quality of the original content offered
It allows me to watch content on multiple devices
How much do you agree or disagree with the following statements about your streaming video service? (Summary of those who answered “agree strongly”)
2017
Total
Deloitte Insights | deloitte.com/insightsSource: Deloitte Digital media trends survey, 12th edition.
Figure 2. Paid streaming overtakes free streaming viewership
10%20%30%40%50%60%70%80%90%
0%
Free streaming video service Paid streaming video subscription service
When you stream video, what percentage of the time are you streaming from the following types of services?
2016 2017
40%30%
45%35%
A new world of choice for digital consumers
5

The high quality of original content being of-fered by video streaming services was officially rec-ognized at the 2018 Golden Globe Awards, when the three largest streaming video services, Netflix, Hulu, and Amazon (by number of subscribers) combined to win 5 of 11 awards in the television category.4
This content appears to be driving an increase in TV streaming: Nearly one-half (48 percent) of all US consumers streamed television content every day or weekly in 2017, compared with just 37 per-cent of consumers doing so in 2016 (figure 3).
Video streaming trends cause industry to rethink business models
As video streaming becomes more frequent, and as more and more original content becomes avail-
able, traditional and premium cable broadcasters will continue to see fierce competition from technol-ogy companies that, in just a few short years, have morphed from distribution platforms into formi-dable sources of programming.
In addition, media companies are increasingly going direct-to-consumer with their own digital streaming services. One challenge, however, is that consumers may be reluctant to pay for exclusive content on top of their other paid subscription ser-vices. They may find multiple subscription services to be costly and confusing, and choose to scale back. For this reason, we may see some form of reaggrega-tion over the next year or two as limits on consumer spending could hinder the growth of certain content platforms.
Deloitte Insights | deloitte.com/insightsSource: Deloitte Digital media trends survey, 12th edition.
Figure 3. Video streaming becomes an everyday or weekly activity
10%
0%
20%
30%
40%
50%
60%
70%
Total Gen Z Millennials Gen X Boomers Matures
How frequently do you stream television programming?U
S co
nsum
ers
2016 2017
Summary of everyday/weekly
Digital media trends survey, 12th edition
6
WITH video streaming enabling unprec-edented freedom of choice, consumers are reassessing the value of their cur-
rent pay TV (cable and satellite) subscriptions as never before.
Pay TV is increasingly under siege because it often does not deliver the value consumers expect in the digital age—the content they want, whenever they want it, on their device of choice. In addition, since many pay TV subscription packages include hundreds of channels (many of them unwanted), content discovery has become difficult for consum-ers.
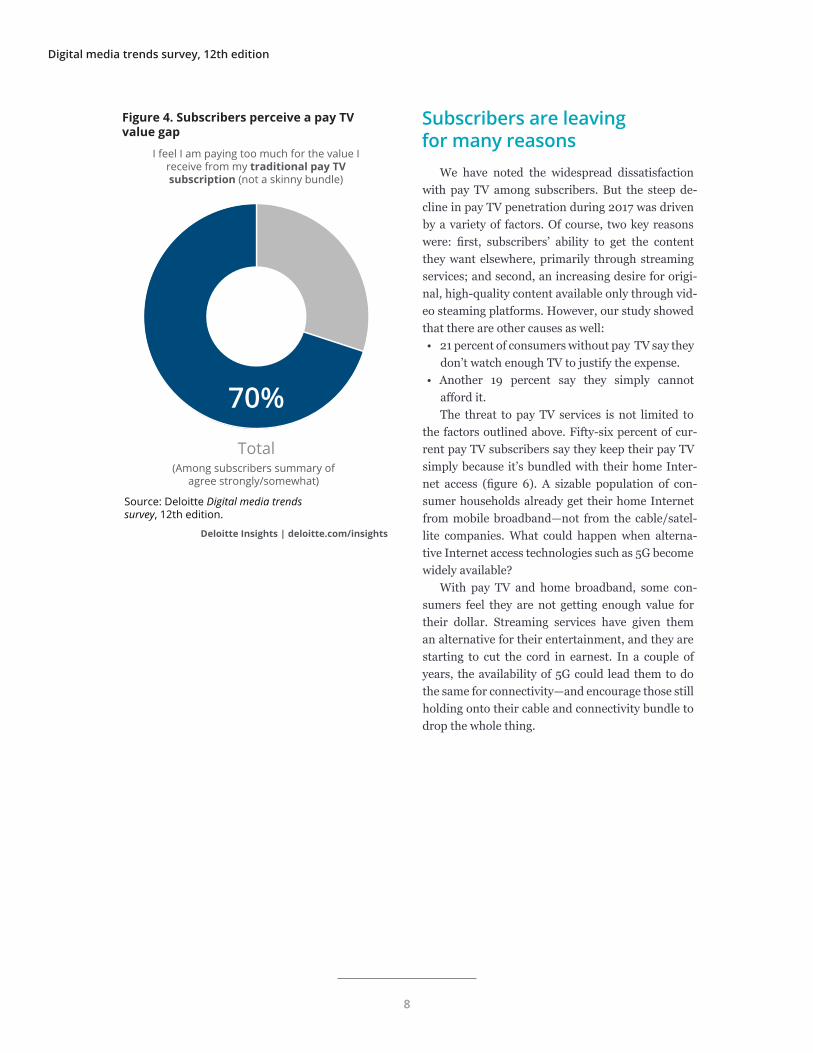
As a result, subscribers perceive a widening value gap between what they expect and what pay TV providers actually deliver. In fact, in our survey, nearly one-half of all pay TV subscrib-ers said they are dissatisfied with their service. Cost is a big rea-son: 70 percent feel they get too little value for their money. This dissatisfaction is widespread, even among boom-ers and matures, most of whom rely on their pay TV subscriptions
for the vast majority of their video entertainment (figure 4).
Value gap causes decline in pay TV penetration
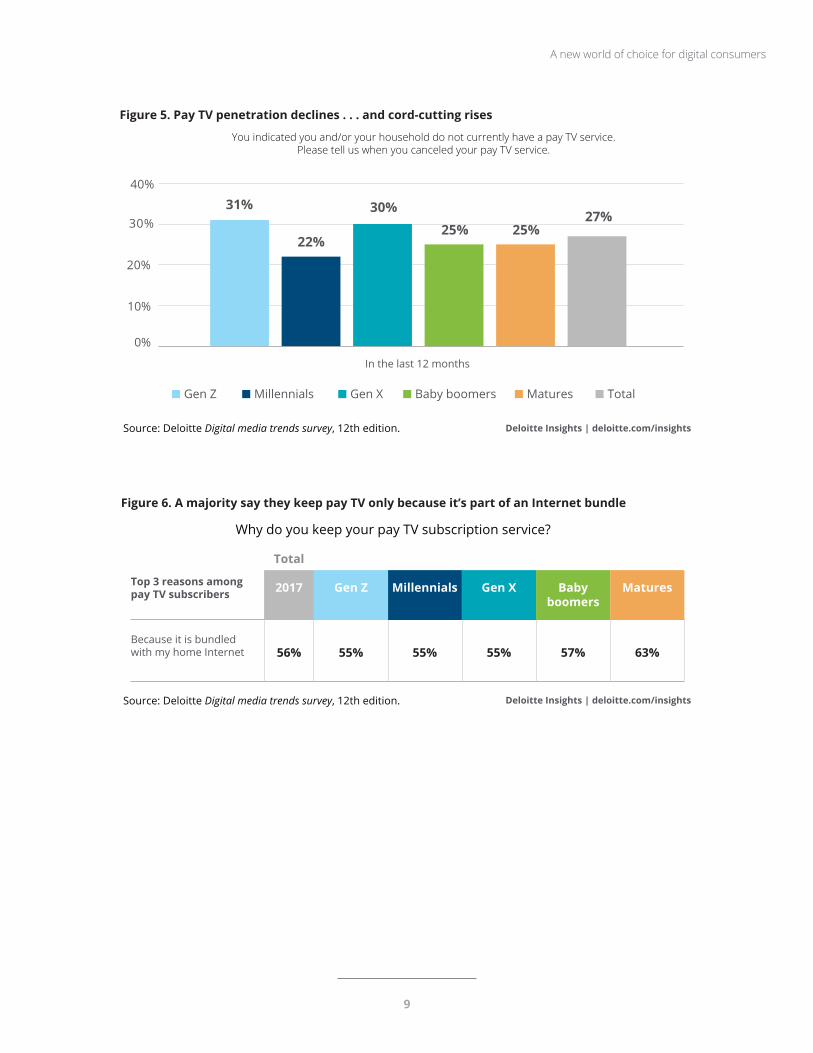
In 2017, the pay TV value gap produced an in-flection point for providers. Our study revealed that, after remaining steady at about 75 percent for years,
pay TV penetration fell to 63 percent in 2017. Among respondents who said they no lon-ger have a pay TV sub-scription, 27 percent reported they “cut the cord” within the last year.5
Another finding that could prove to be
challenging for provid-ers is that 16–22 per-cent of Gen Z, millennial,
and Gen X households have never subscribed to
a pay TV service (and are probably unlikely to do so in
the future) (figure 5).
Insight No. 2Pay TV’s value gap problem is expanding
A new world of choice for digital consumers
7
Subscribers are leaving for many reasons
We have noted the widespread dissatisfaction with pay TV among subscribers. But the steep de-cline in pay TV penetration during 2017 was driven by a variety of factors. Of course, two key reasons were: first, subscribers’ ability to get the content they want elsewhere, primarily through streaming services; and second, an increasing desire for origi-nal, high-quality content available only through vid-eo steaming platforms. However, our study showed that there are other causes as well:• 21 percent of consumers without pay TV say they
don’t watch enough TV to justify the expense.• Another 19 percent say they simply cannot
afford it. The threat to pay TV services is not limited to
the factors outlined above. Fifty-six percent of cur-rent pay TV subscribers say they keep their pay TV simply because it’s bundled with their home Inter-net access (figure 6). A sizable population of con-sumer households already get their home Internet from mobile broadband—not from the cable/satel-lite companies. What could happen when alterna-tive Internet access technologies such as 5G become widely available?
With pay TV and home broadband, some con-sumers feel they are not getting enough value for their dollar. Streaming services have given them an alternative for their entertainment, and they are starting to cut the cord in earnest. In a couple of years, the availability of 5G could lead them to do the same for connectivity—and encourage those still holding onto their cable and connectivity bundle to drop the whole thing.
Deloitte Insights | deloitte.com/insights
Figure 4. Subscribers perceive a pay TV value gap
Total
Source: Deloitte Digital media trends survey, 12th edition.
70%
I feel I am paying too much for the value Ireceive from my traditional pay TVsubscription (not a skinny bundle)
(Among subscribers summary of agree strongly/somewhat)
Digital media trends survey, 12th edition
8
Deloitte Insights | deloitte.com/insightsSource: Deloitte Digital media trends survey, 12th edition.
Figure 5. Pay TV penetration declines . . . and cord-cutting rises
10%
0%
20%
30%
40%
Gen Z Millennials Gen X Baby boomers Matures Total
You indicated you and/or your household do not currently have a pay TV service.Please tell us when you canceled your pay TV service.
In the last 12 months
31%
22%
30%25% 25%
27%
Deloitte Insights | deloitte.com/insightsSource: Deloitte Digital media trends survey, 12th edition.
Figure 6. A majority say they keep pay TV only because it’s part of an Internet bundle
Top 3 reasons amongpay TV subscribers
Because it is bundledwith my home Internet
Why do you keep your pay TV subscription service?
Total
2017 Millennials Gen X Babyboomers
MaturesGen Z
56% 55% 55% 57% 63%55%
A new world of choice for digital consumers
9
PERHAPS the most startling revelation of our latest survey is the emergence of Generation X (people aged 35–51) as cutting-edge adopt-
ers of digital media, on par with Gen Z and millen-nials. Because the media consumption behaviors of Gen Z, millennials, and Gen X are now so similar, we have nicknamed this combined group the “Mil-leXZials.”
Whether it’s ownership of smart devices or sub-scriptions to streaming services, our survey shows that Gen X respondents are matching—and in some cases even surpassing—the digital media behaviors typically associated with their younger counterparts.
Generation X’s emergence as part of the Mil-leXZial category presents new-age media and enter-tainment companies with an enticing opportunity. According to a recent Deloitte report, net wealth in the United States will grow from about $72 trillion in 2015 to $120 trillion by 2030. Generation X will experience the highest increase in share of national wealth through the forecast pe-riod, growing from un-der 14 percent of total net wealth in 2015 to nearly 31 per-cent by 2030.6 This means Gen X now b l e n d s digital sav-viness with r e l a t i v e l y
high (and rising) levels of disposable income—a dream scenario for providers of media and enter-tainment solutions. On the other hand, because Gen X consumers are watching more streaming ser-vices and watching video on mobile devices, it may be more challenging for pay TV providers to keep them in the fold.
Video streaming is already a mainstream activity for MilleXZials
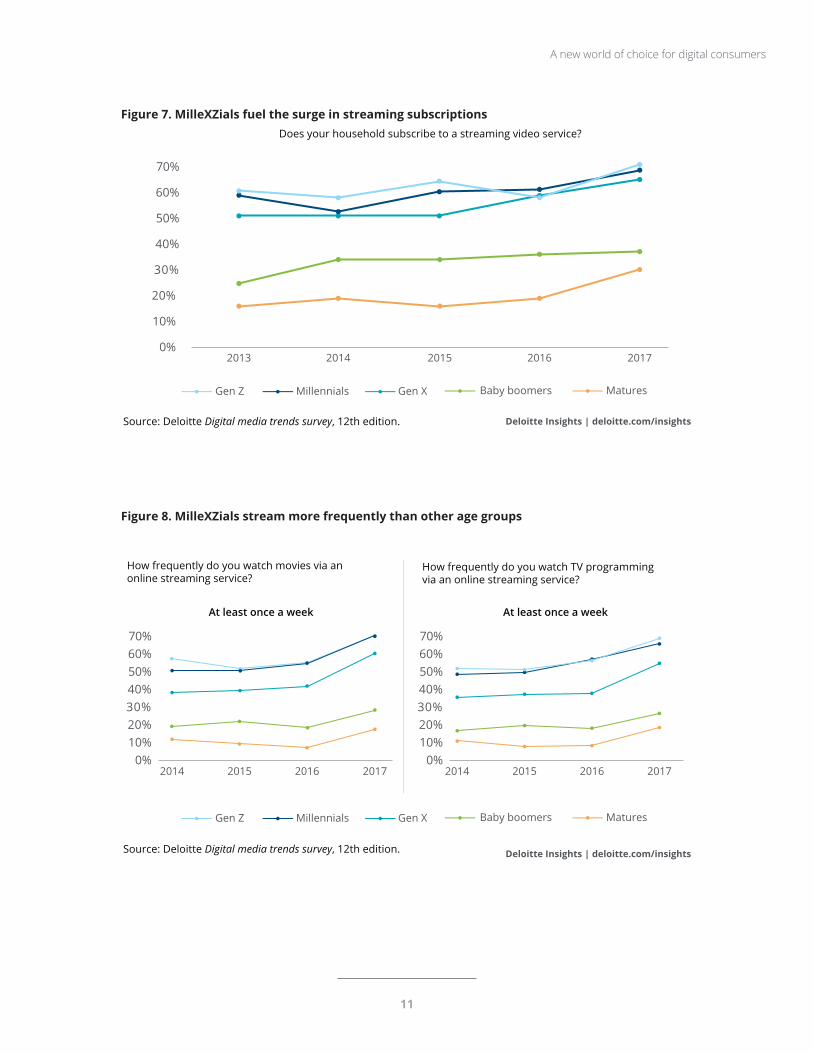
MilleXZials are driving the streaming phenom-enon. In 2017, 70 percent of Gen Z households had a streaming subscription, closely followed by mil-
lennial (68 percent) and Gen X (64 percent) households (figure 7).
Not only are MilleXZials streaming—they are doing it often. In fact, each week,
about 70 percent of Gen Z and mil-lennials stream movies (compared
with 60 percent of Gen X), and 69 percent of Gen Z stream TV
shows (compared with 66 percent of millennials and
55 percent of Gen X). MilleXZials’ in-
creased stream-ing behavior is largely driven by a desire for high-quality, original video
Insight No. 3Emergence of the “MilleXZials”
Digital media trends survey, 12th edition
10
Deloitte Insights | deloitte.com/insightsSource: Deloitte Digital media trends survey, 12th edition.
Figure 7. MilleXZials fuel the surge in streaming subscriptions
10%
0%
20%
30%
40%
50%
60%
70%
2013 2014 2015 2016 2017
Does your household subscribe to a streaming video service?
Gen Z Millennials Gen X Baby boomers Matures
Deloitte Insights | deloitte.com/insightsSource: Deloitte Digital media trends survey, 12th edition.
Figure 8. MilleXZials stream more frequently than other age groups
10%0%
20%30%40%50%60%70%
2014 2015 2016
At least once a week
2017
10%0%
20%30%40%50%60%70%
2014 2015 2016 2017
At least once a week
How frequently do you watch movies via an online streaming service?
How frequently do you watch TV programming via an online streaming service?
Gen Z Millennials Gen X Baby boomers Matures
A new world of choice for digital consumers
11

content, along with the ability to view this content whenever and wherever they want (figure 8).
Given MilleXZials’ skyrocketing usage of video streaming, it should not come as a surprise that they’re increasingly seeking content from sources other than pay TV. In 2017, less than 60 percent of millennial and Gen X households had a pay TV con-nection, which is below the average across the five age groups surveyed (63 percent) (figure 9). This decline in pay TV subscriptions among MilleXZials coincides with their increased video consumption on mobile platforms. In fact, our survey indicates that more than ever before, MilleXZials value mo-bile data subscriptions as a service (figure 10).
MilleXZials seek broad choice in content formats for mobile devices
As part of their rising usage of video streaming, MilleXZials are steadily boosting their consumption of long-form content (TV shows and movies) on mo-bile phones. Their consumption of long-form con-
tent over the last few years contrasts sharply with that of boomers and matures. Wider availability of unlimited data plans and the increased number of OTT platforms may also be fueling this phenom-enon (figure 11).
MilleXZials’ binge-watching behavior also ex-perienced a precipitous rise in 2017. Ninety-one percent of Gen Z, 86 percent of millennials, and 80 percent of Gen X say they binge-watch TV shows, which are each higher than the average across all age groups (75 percent). Binge-watching millennial and Gen X consumers view about seven episodes of a TV series in a single sitting, which exceeds the av-erage number of episodes for Gen Z (six) (figure 12).
MilleXZials also show dramatically increased consumption behavior in the area of gaming, par-ticularly on smartphones. Almost one-half of Gen X respondents report that they play video games fre-quently (at least once a week), which almost match-es Gen Z and millennial respondents. Interestingly, Gen X now leads all generations in the amount of time they spend playing games on their smart-phones (figure 13).
Figure 9. Pay TV’s decline especially pronounced among MilleXZials
40%
50%
60%
70%
80%
90%
2013 2014 2015 2016 2017
Does your household purchase a pay TV subscription?
Deloitte Insights | deloitte.com/insightsSource: Deloitte Digital media trends survey, 12th edition.
Gen Z Millennials Gen X Baby boomers Matures
Digital media trends survey, 12th edition
12
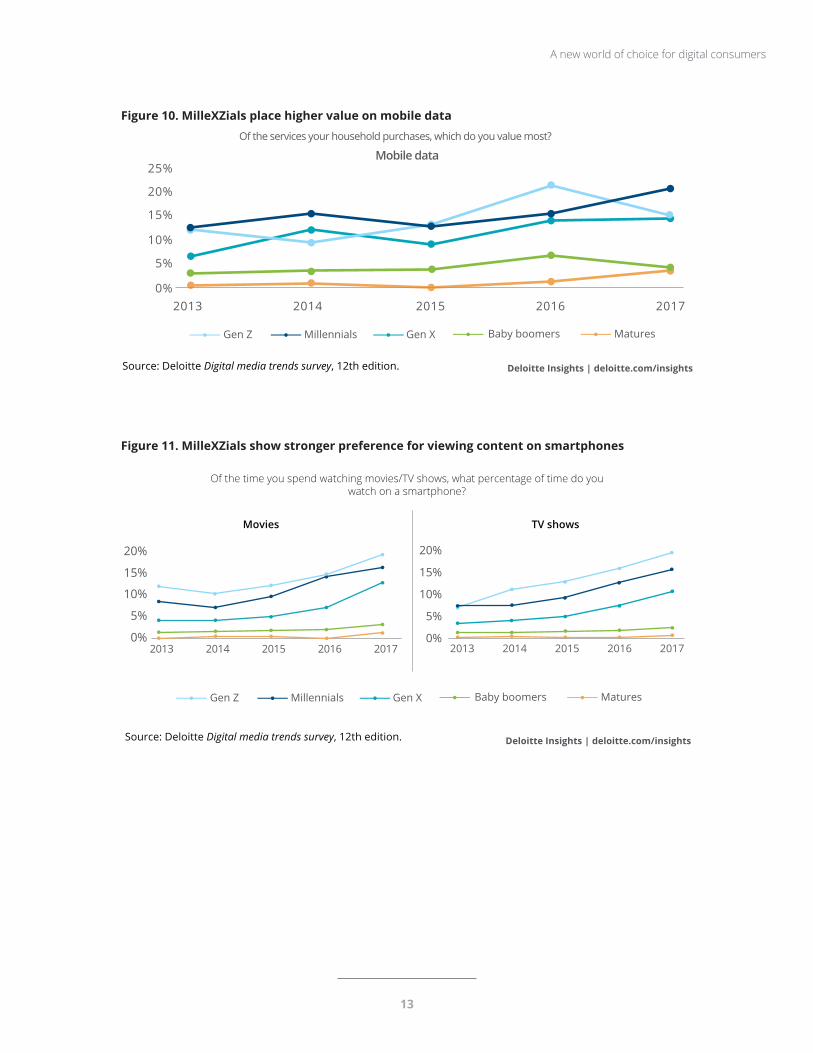
Figure 10. MilleXZials place higher value on mobile data
Mobile data
0%
5%
10%
15%
20%
25%
2013 2014 2015 2016 2017
Deloitte Insights | deloitte.com/insights
Of the services your household purchases, which do you value most?
Source: Deloitte Digital media trends survey, 12th edition.
Gen Z Millennials Gen X Baby boomers Matures
Deloitte Insights | deloitte.com/insights
Figure 11. MilleXZials show stronger preference for viewing content on smartphones
Movies TV shows
Of the time you spend watching movies/TV shows, what percentage of time do you watch on a smartphone?
0%
5%
10%
15%
20%
2013 2014 2015 2016 20170%
5%
10%
15%
20%
2013 2014 2015 2016 2017
Source: Deloitte Digital media trends survey, 12th edition.
Gen Z Millennials Gen X Baby boomers Matures
A new world of choice for digital consumers
13
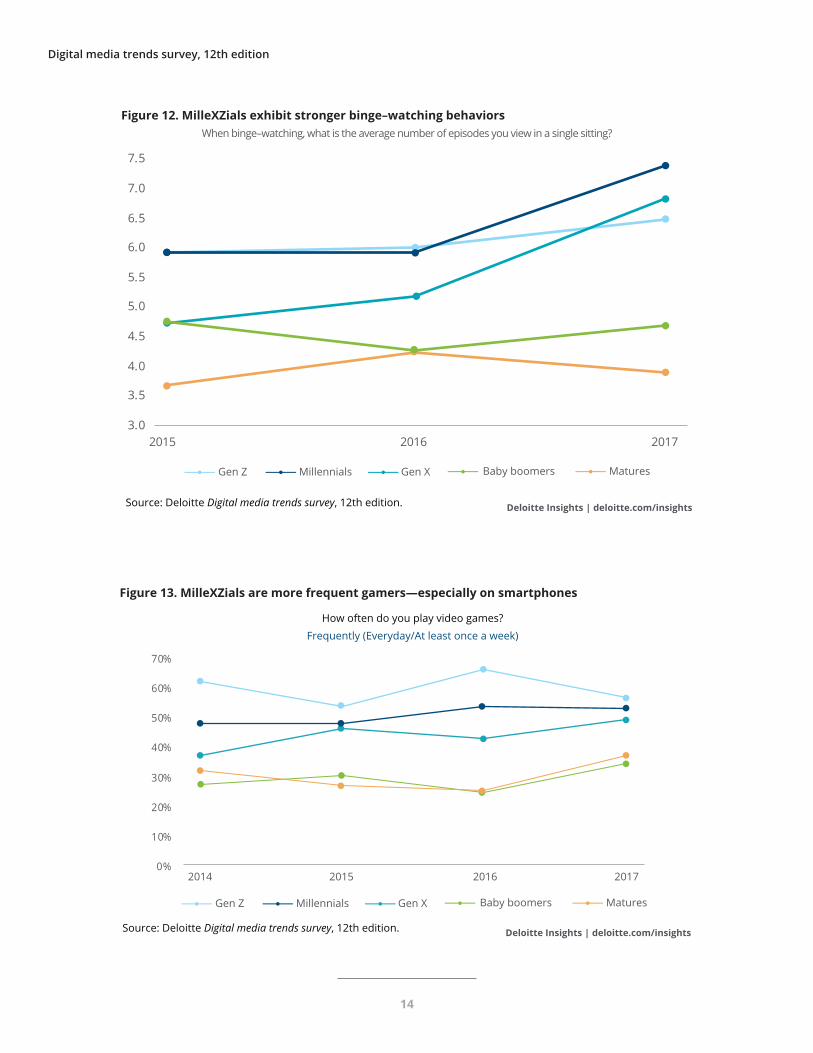
Figure 12. MilleXZials exhibit stronger binge–watching behaviors
Deloitte Insights | deloitte.com/insights
3.0
3.5
4.0
4.5
5.0
5.5
6.0
6.5
7.0
7.5
2015 2016 2017
When binge–watching, what is the average number of episodes you view in a single sitting?
Source: Deloitte Digital media trends survey, 12th edition.
Gen Z Millennials Gen X Baby boomers Matures
Deloitte Insights | deloitte.com/insights
Figure 13. MilleXZials are more frequent gamers—especially on smartphones
How often do you play video games?
Frequently (Everyday/At least once a week)
0%
10%
20%
30%
40%
50%
60%
70%
2014 2015 2016 2017
Source: Deloitte Digital media trends survey, 12th edition.
Gen Z Millennials Gen X Baby boomers Matures
Digital media trends survey, 12th edition
14
WE have already highlighted several key trends that reflect what is most impor-tant to US digital media consumers. A
key factor underlying all of these developments is consumers’ increasing concern about protecting their personal data.
Over the past year, a number of large-scale, highly visible data breaches in the United States may have prompted consumers to want more control over their personal data. In addition, pub-lic discussion concerning the rights of European Union (EU) consumers and their abilities to govern personal data may have increased US consumers’ awareness about what could or should be available to them.
In 2017, 73 percent of all US consumers indi-cated that they were concerned about sharing their person-al data online and the potential for identity theft. This number is consistent with the responses to this ques-tion in previous years.
However, in 2017, we saw a 10-point drop in willingness to share personal data in exchange for personalized advertising (from 37 percent to 27 percent).
The reason for the sudden change in US con-sumers’ attitudes is simple: They overwhelmingly lack confidence in companies’ ability to protect their data. Sixty-nine percent of respondents across generations believe that companies are not doing everything they can to protect consumers’ personal data.
This lack of consumer confidence threatens a key growth opportunity for media companies in 2018: targeted advertising. The success of targeted advertising depends heavily on gaining insights into customers’ demographics and viewing behav-
iors, then augmenting this customer information with social media data.
However, if consumers are unwilling to
share their data, none of this is possible.
Insight No. 4Personal data is increasingly a concern—and an opportunity
A new world of choice for digital consumers
15

Consumers are willing to share—with some strings attached
The good news, however, is that US consum-ers still want value-added services from companies, such as premium content, personalized experiences and ads, discounts, and rewards. They just want something in return for their money, time, and/or personal data.
What they want most is visibility into the data being collected and a measure of control over their personal data. Seventy-three percent of all consum-ers across all generations said they would be more comfortable sharing their data if they had some visi-bility and control. In addition, 93 percent of US con-sumers believe they should be able to delete their online data at their discretion.
This “right” to see and control their personal data online may be more valuable to consumers than the actual services they receive. Seventy-six percent of US consumers report that they would choose to delete all of their personal data online if necessary—even if it would negatively impact their level of service.
It would be natural for companies to fear that consumers might rush to delete all of their personal online data and never share it again. However, con-sumers are willing to share their personal data with companies in exchange for personalized experi-ences and advertising. According to our survey, that data includes:• Date of birth• Video viewing history• Purchase data• Contact data• Browsing history• Online search history• Social media activity• Home address
A new value exchange presents a unique opportunity
For years, consumers have been telling the mar-ket what they want and what is important to them and have repeatedly shown a willingness to pay for the services they value. Companies that have aligned their offerings to meet these consumer val-ues have been wildly successful; just look at the ex-plosive growth of video streaming.
A similar opportunity may be arising when it comes to offering visibility and control of personal data in exchange for personalized services and ad-vertising. Whether driven eventually by market reg-ulations, such as in the European Union, or simply by social media and brand reputation concerns, it seems likely that consumer pressure for more con-trol over their personal information will remain. Early recognition and positioning in this new value exchange could create a potentially profitable mar-ket.
Digital media trends survey, 12th edition
16

BY now, you have probably noticed the com-mon thread running through all of the key trends we’ve highlighted from our latest sur-
vey: mobile video. Here are some takeaways on its broad impact: • Mobile video is fueling the fast-paced growth
of streaming across all age groups—particularly the MilleXZials, who comprise Gen Z, millenni-als, and Gen X.
• Video streaming, in turn, is driving the signifi-cant decline in pay TV subscriptions and the growth of alternative platforms that feature high-quality, original content optimized for smaller screens.
• MilleXZials are motivating content providers to reassess their business models to take ad-vantage of market opportunities in the mobile video arena.
• To fully capitalize on this opportunity, however, providers must learn to address the privacy con-cerns that consumers share across all age groups.
Over the next few years, we will be following the evolution of these trends. We will be watch-ing closely as streaming and mobile video mature, pay TV improves its value proposition or continues its decline, media consumption breaks down gen-erational boundaries, and consumers pushing for more control of their personal data are willing to ex-change information when offered more protection.
These insights represent just a portion of the data included in the complete Digital Media Trends Survey, 12th Edition. If you are interested in additional insights, please email us at [email protected], or continue the conversa-tion with us on Twitter @DeloitteTMT #digitalme-dia #tmttrends.
What’s next? Understanding the power of mobile video
A new world of choice for digital consumers
17

1. PR Newswire, “Parks associates announces 2017 top 10 US subscription OTT video services,” November 9, 2017.
2. The United States Census Bureau reports that there were 126 million households in the United States in 2017. With 55 percent of these households now streaming an average of three services at $10 each per month ($30), total revenue generated is $2.1 billion.
3. Deloitte, Digital democracy survey, 2007.
4. Golden Globes website, accessed February 2018.
5. In the third quarter of 2017 alone, 1 million US viewers canceled their multichannel subscription television services, opting instead for some combination of broadband Internet and IPTV, digital video recorders, digital terrestrial television broadcasts, or free-to-air satellite television. (Since Nielsen includes virtual multichannel video programming distributors [vMVPDs] in its cable household universe estimates, vMVPD subscribers are not considered cord-cutters.) Kari Bode, “Another million subscribers cut the pay TV cord last quarter,” DSL Reports, October 31, 2017.
6. Val Srinivas and Urval Goradia, The future of wealth in the United States: Mapping trends in generational wealth, Deloitte University Press, November 9, 2015.
ENDNOTES
Digital media trends survey, 12th edition
18

KEVIN WESTCOTT
Kevin Westcott is a principal and leads the US Media and Entertainment practice. He has more than 25 years of experience in strategic and operational planning, as well as implementing global business change and technology projects for major media organizations. His industry experience spans film, TV, home entertainment, broadcasting, publishing, licensing, and games. Westcott is an author of Deloitte’s Digital Media Trends Survey and a co-author of Deloitte’s Digital Media Maturity Model.
JEFF LOUCKS
Jeff Loucks is the executive director of Deloitte’s Center for Technology, Media & Telecommunications, Deloitte Services LP. In his role, he conducts research and writes on topics that help companies capital-ize on technological change. An award-winning thought leader in digital business model transformation, Loucks is especially interested in the strategies organizations use to adapt to accelerating change. His academic background complements his technology expertise: Loucks has a Bachelor of Arts in political science from the Ohio State University, and a Master of Arts and PhD in political science from the Uni-versity of Toronto.
KEVIN DOWNS
Kevin Downs is a senior manager in Deloitte Services LP and the sector specialist for the US Media & En-tertainment sector. He has more than 22 years of systems, operations, and management consulting ex-perience implementing business-driven technology transformation and digital modernization programs for clients in TMT and the Public Sector.
JEANETTE WATSON
Jeanette Watson is the chief of staff for the Deloitte Center for Technology, Media & Telecommunica-tions. Prior to joining the center in May 2017, Watson served as the US marketing lead for the M&E sec-tor. In that role, she was responsible for the development of marketing programs and sector-specific thought leadership. Watson has a Bachelor of Arts in comparative literature from the University of Cali-fornia Santa Barbara and a Masters of Arts in journalism from the University of Southern California.
ABOUT THE AUTHORS
A new world of choice for digital consumers
19

The authors would like to thank Amy Booth of Deloitte Services LP for her marketing leadership and Anisha Sharma for her support with external communications.
We would like to thank Shashank Srivastava for his support in data analytics and contributions to the executive summary.
A special thanks to Rett Monson who jumped in to support the development of our Digital Media Trends creative assets.
Thanks Meg Huff for keeping us all aligned, on deadline, and in sync with our Green Dot agency.
Thanks to the tremendous support of the Deloitte Insights team including Karen Edelman (our editor), Sarah Jersild (video), Devon Mychal (promotion), Joanie Pearson and Alok Pepakalaya (interactive), and Kevin Weier (creative direction).
Digital Media Trends artwork by Josh Cochran.
ACKNOWLEDGEMENTS
Digital media trends survey, 12th edition
20
CONTACTS
Kevin WestcottUS Media & Entertainment sector leaderPrincipalDeloitte Consulting LLP+1 213 553 [email protected]
Scott LippstreuDeputy US Media & Entertainment practice Leader/principalDeloitte Consulting LLP+1 212 618 [email protected]
Jeff LoucksExecutive directorDeloitte Center for Technology, Media & TelecommunicationsDeloitte Services LP+1 614 477 [email protected]
David CutbillUS Advisory leader, Media & EntertainmentDeloitte & Touche LLP+1 213 593 [email protected]
Janet MoranUS Tax leader, Media & EntertainmentDeloitte Tax LLP+1 212 436 [email protected]
Erin ScanlonUS Audit & Assurance leader, Media & EntertainmentDeloitte & Touche LLP+1 212 436 [email protected]
For PR inquiries contact:Anisha Sharma+1 973 602 [email protected]
A new world of choice for digital consumers
21

Digital media trends survey, 12th edition
22


About Deloitte Insights Deloitte Insights publishes original articles, reports and periodicals that provide insights for businesses, the public sector and NGOs. Our goal is to draw upon research and experience from throughout our professional services organization, and that of coauthors in academia and business, to advance the conversation on a broad spectrum of topics of interest to executives and government leaders.
Deloitte Insights is an imprint of Deloitte Development LLC.
About this publication This publication contains general information only, and none of Deloitte Touche Tohmatsu Limited, its member firms, or its and their affiliates are, by means of this publication, rendering accounting, business, financial, investment, legal, tax, or other professional advice or services. This publication is not a substitute for such professional advice or services, nor should it be used as a basis for any decision or action that may affect your finances or your business. Before making any decision or taking any action that may affect your finances or your business, you should consult a qualified professional adviser.
None of Deloitte Touche Tohmatsu Limited, its member firms, or its and their respective affiliates shall be responsible for any loss whatsoever sustained by any person who relies on this publication.
About Deloitte Deloitte refers to one or more of Deloitte Touche Tohmatsu Limited, a UK private company limited by guarantee (“DTTL”), its network of member firms, and their related entities. DTTL and each of its member firms are legally separate and independent entities. DTTL (also referred to as “Deloitte Global”) does not provide services to clients. In the United States, Deloitte refers to one or more of the US member firms of DTTL, their related entities that operate using the “Deloitte” name in the United States and their respective affiliates. Certain services may not be available to attest clients under the rules and regulations of public accounting. Please see www.deloitte.com/about to learn more about our global network of member firms.
Copyright © 2018 Deloitte Development LLC. All rights reserved. Member of Deloitte Touche Tohmatsu Limited
Sign up for Deloitte Insights updates at www.deloitte.com/insights.
Follow @DeloitteInsight
Deloitte Insights contributorsEditorial: Karen Edelman, Nikita GariaCreative: Anoop K R, Tushar Barman, Kevin WeierPromotion: Devon MychalArtwork: Josh Cochran


