DISCUSSION PAPER SERIES IZA DP No. 11514 Deborah A. Cobb-Clark Nathan Kettlewell Stefanie Schurer Sven Silburn The Effect of Quarantining Welfare on School Attendance in Indigenous Communities APRIL 2018
Transcript
DISCUSSION PAPER SERIES
IZA DP No. 11514
Deborah A. Cobb-ClarkNathan KettlewellStefanie SchurerSven Silburn
The Effect of Quarantining Welfare on School Attendance in Indigenous Communities
APRIL 2018
Any opinions expressed in this paper are those of the author(s) and not those of IZA. Research published in this series may include views on policy, but IZA takes no institutional policy positions. The IZA research network is committed to the IZA Guiding Principles of Research Integrity.The IZA Institute of Labor Economics is an independent economic research institute that conducts research in labor economics and offers evidence-based policy advice on labor market issues. Supported by the Deutsche Post Foundation, IZA runs the world’s largest network of economists, whose research aims to provide answers to the global labor market challenges of our time. Our key objective is to build bridges between academic research, policymakers and society.IZA Discussion Papers often represent preliminary work and are circulated to encourage discussion. Citation of such a paper should account for its provisional character. A revised version may be available directly from the author.
* The authors thank the following people for their valuable feedback on this research: Heather d’Antoine, Victoria
Baranov, Nicholas Biddle, Gawaian Bodkin-Andrews, Robert Breunig, Julie Brimblecombe, David Cooper, Marco
Francesconi, Matthew Gray, James J. Heckman, Hilary Hoynes, Matthew James, Liz Moore, Patrick Nolan, David
Ribar and Jim Smith; participants of seminars at the University of California Santa Barbara, University of Chicago,
University of Essex, University of Melbourne, Australian National University, University of Western Australia, University
of Technology Sydney, University of Wollongong, Institute for Fiscal Studies; and participants of an organised session
at the Inaugural Conference of the Asian and Australasian Society of Labour Economists (Dec 2017).
1 Introduction
Indigenous people in Australia, Canada, New Zealand, and the United States often face extensive
social and economic hardship despite living in some of the world’s wealthiest nations. Indigenous
communities have been shaped by many unique historical, cultural, and political events; nevertheless
widespread disadvantage has been a nearly universal experience.1 Rates of suicide and disease-
related mortality are substantially higher in Indigenous populations than in general populations,
for example, leading to a substantial gap in life expectancy (e.g., Hunter & Harvey, 2002; Bramley
et al., 2004; Cooke et al., 2007; Clifford et al., 2013). Educational attainment and income levels are
also lower (e.g., Cooke et al., 2007), while drug and alcohol problems (e.g., Brady, 2000); family
violence (Memmott et al., 2001; Al-Yaman et al., 2006) and child abuse and neglect (Cross et
al., 2000; Stanley et al., 2003; Sinha et al., 2011) are all more prevalent. In short, in “all four
countries, Indigenous poverty has been not only deep and widespread but persistent, defying policy
prescriptions” (Cornell, 2006, p. 2).
This paper analyzes the impact of a recent initiative by the Australian Federal Government to
address the behavioral causes of disadvantage in Aboriginal communities in the Northern Territory
by quarantining welfare benefits.2 The policy – known as income management – quarantines 50
percent of welfare payments to be spent on meeting priority needs rather than on less socially-
desirable goods such as alcoholic beverages, tobacco products, pornographic material and gambling
services. Although priority and excluded items are both defined in the legislation,3 in practice
1Cornell (2006) discusses the differences in historical and contemporary models of self-government (self-management), land rights, and relations with central governments. Indigenous people occupy a unique policy space.They often have some form of self-governance, but like other citizens are also subject to the laws of the country inwhich they live (Brady, 2000).
2‘Aboriginal and Torres Strait Islander’ is the preferred terminology for referring to the Indigenous peoples ofAustralia. According to the official definition, “an Aboriginal or Torres Strait Islander is a person of Aboriginalor Torres Strait Islander descent, who identifies as being of Aboriginal or Torres Strait Islander origin and who isaccepted as such by the community with which the person associates” (Australian Institute of Aboriginal and TorresStrait Islander Studies, 2012). This definition has informed the standard Indigenous status question used in theCensus, ABS surveys, and other official administrative records. People are typically asked to identify whether theyare ‘Aboriginal’, ‘Torres Strait Islander’ or ‘Both Aboriginal and Torres Strait Islander’. We will refer to people ofAboriginal or Torres Strait Islander descent as simply ‘Aboriginal’ since the vast majority of Indigenous individualsin the Northern Territory identify as Aboriginal singularly or as both Torres Strait Islander and Aboriginal.
3Priority items are defined in the Social Security and Other Legislation Amendment (Welfare Payment Reform)Act 2007 No. 130, 2007, Section 123TH. Excluded items are all items not specified in the priority item list and aredefined in the Social Security and Other Legislation Amendment (Welfare Payment Reform) Act 2007 No. 130, 2007,Sections 123TI and 123 TJ.
1
income managed funds could be spent on anything other than excluded goods and services. Income
management targets Aboriginal communities, is compulsory, and left communities with little choice
over when and how it was rolled out. Its legislation was part of a reform package – the Northern
Territory Emergency Response (NTER) – implemented in response to a highly publicized report
documenting high levels of child sexual abuse and family violence within these communities (Wild
& Anderson, 2007). The core objective of income management was to “stem the flow of cash going
towards substance abuse and gambling and ensure that funds meant to be for children’s welfare
are used for that purpose” (Brough, 2007b). By restricting welfare payments, the legislation aimed
“to promote socially responsible behaviour, particularly in relation to the care and education of
children”.4 Informally, the aims of quarantining welfare payments also included an attempt to
protect vulnerable family members – especially women – from financial exploitation and demands
for money from relatives, a practice known as ‘humbugging’ (see Howard, 2007). Thus, income
management involves an element of female empowerment, which is associated with better outcomes
for children (Duflo, 2012).
Income management had a broad reach. The communities targeted for income management are
extremely disadvantaged and have high rates of welfare dependence. Moreover, income management
applied to virtually all social assistance benefits including child care benefits, family tax benefits,
and old-age pensions, not just those welfare benefits directed towards low-income families (e.g.,
unemployment benefits, parenting payments, disability payments) (see Appendix Table A1).5 The
consequence is that approximately 55 percent of all adults in prescribed communities were being
income managed by the end of the rollout; around 75 percent of adults had been income managed
at some point between the start of the rollout (September 2007) and March 31, 2009 (AIHW,
2010). As Australia’s social security system specifically targets families with children, it is likely
that virtually all parents of the children in our sample would have been income managed after the
4Social Security and Other Legislation Amendment (Welfare Payment Reform) Act 2007 No. 130, 2007 123TBObjects, Section (a). The legislation (123TB Objects, Section (c)) further stated that it should ensure that “theamount set aside is directed to meeting the priority needs of (i) the recipient of the welfare payment; and (ii) therecipient’s partner; and (iii) the recipient’s children; and (iv) any other dependants of the recipient.”
5The Australian social security system delivers benefits to a broad cross-section of the population. Unemploymentbenefits, for example, are a key element of the social security system and are paid out of general tax revenue ratherthan through an insurance mechanism, while income for older individuals is guaranteed through pensions which areincome- and asset-tested. Australia’s child care and family-tax payments correspond to the child care rebates andearned income tax credits provided through the U.S. tax system.
2
policy commenced in their communities.
Although the welfare of children took centre stage in the debate over the NTER, little empiri-
cal evidence has been brought to bear on the impact of restricting welfare payments on children’s
outcomes. This study will be the first to provide sound empirical evidence on the policy’s im-
pact on Aboriginal children’s welfare. We focus our analysis on daily school attendance rates,
which is a systematically recorded, high-frequency measure of community functionality. Although
boosting school attendance rates in the Northern Territory was not a formally specified goal of
the policy’s legislation, it was expected to improve as a consequence of the policy nonetheless.6
Improving school attendance rates is a first-order policy concern in regions where attendance rates
are critically low (see Kremer & Holla, 2009, for a review of the literature). The hope was that by
redirecting consumption decisions to improve children’s nutrition and purchase education-relevant
goods, protecting and stabilizing family life, and empowering women, income management would
improve school attendance rates.
We identify the causal impact of income management by exploiting exogenous variation from
the staggered rollout of the policy across communities. Because its initial rollout was place-based,
benefit recipients were automatically income managed if they had lived in a prescribed community
at any point between the time the policy was legislated and the time it was rolled out. This left
very little room for exemptions. Our empirical strategy relies on the estimation of difference-in-
difference models. Access to schools’ daily attendance data and exact program implementation
dates allows us to precisely time the introduction of income management; in effect, communities
that are treated later form the control group for communities that are treated earlier. The resulting
estimates have a causal interpretation so long as the rollout of income management is unrelated to
trends in school attendance rates. We investigate the plausibility of this identification assumption
by: i) carefully reviewing the administrative process underpinning the rollout; ii) examining the
6The Federal Government had high expectations that, once the new social security legislation measures wereimplemented in each community, all children of compulsory school age would be enrolled at and attending school.To cater for the increased demand of education services, the Federal Government therefore committed to a seriesof infrastructure and curriculum initiatives to enhance education (e.g., more classrooms, quality-teaching packagesetc.). The education enhancement initiatives were intended to be carried out mainly through a Memorandum ofUnderstanding between the Australian and Northern Territory Governments signed on 16 September 2007. Thelegislation allowed for the quarantining of up to 100 percent of welfare payments for families whose children are notattending school. However this part of the legislation was never implemented (Yu et al., 2008, p. 29).
3
relationship between community characteristics and program rollout; and iii) using event study
methods to assess trends in attendance patterns pre- and post-income management. In all cases,
the resulting evidence gives us confidence that our identification strategy is sound. Nonetheless,
we reduce the potential for any remaining unobserved heterogeneity to confound our estimates by
controlling for school-, day-, day-of-the-week-, and grade-level fixed effects and allowing each school
to have its own season-specific time-trend.
Our research builds on a growing literature that exploits variation in implementation timing to
evaluate the impact of major social programs (Ludwig & Miller, 2007; Finkelstein & McKnight,
2008; Hoynes & Schanzenbach, 2009; Cascio et al., 2010; Hoynes et al., 2011; Bailey, 2012), em-
powerment zones (Busso et al., 2013) and community health centers (Bailey & Goodman-Bacon,
2015). We are the first to evaluate the effectiveness of income management as a strategy for reduc-
ing social disadvantage among Aboriginal children. Importantly, we consider the differential effect
of income management on the attendance rates of boys vs. girls, primary vs. secondary school
students, and students with high vs. low levels of school attendance. Aboriginal boys are at an
educational disadvantage relative to Aboriginal girls from an early age (see Yap & Biddle, 2010;
Wilson, 2013; Biddle & Meehl, 2016), while providing educational opportunities for high school stu-
dents in remote Aboriginal communities is particularly challenging (Herbert et al., 2014). Students
with particularly low levels of school attachment are considered especially vulnerable because they
are at the brink of disengaging entirely with the formal education system (Prout, 2008). In light
of this, it is important to understand whether income management has heterogeneous effects on
students’ school attendance.
We find no evidence that income management led to an increase in student attendance. Rather,
the introduction of income management reduced school attendance by 2.7 percentage points (4
percent) on average in the first five months after which attendance rates eventually returned to their
initial levels. The attendance penalty is similar for boys and girls, but is stronger for secondary
school students. Interestingly, the drop in attendance is not confined to students with low school
attachment. Students with an above median propensity to attend school experienced greater (both
in absolute an relative terms) reductions in school attendance as a result of income management.
Our results are robust to a variety of modelling specifications and sensitivity checks.
4
We explore four key mechanisms – concurrent policy initiatives, geographic mobility patterns,
student enrollments and implementation issues – through which income management may have
reduced school attendance. Many programs and infrastructure projects were launched as part of
the NTER; thus, it is important to consider the extent to which the relationship between income
management and attendance is driven by concurrent policy effects. Moreover, Aboriginal families
frequently leave their ‘home’ communities to travel to other remote communities for social and
cultural reasons (Memmott et al., 2006), creating substantial attendance (and enrollment) churn
as students enter and exit schools (Taylor & Dunn, 2010). Income management may have affected
school attendance by increasing families’ incentives or ability to temporarily leave their communities.
At the same time, many children in the remote communities under study are not enrolled in school
at all (Wilson, 2013), raising the potential for changing enrollment patterns to drive the relationship
between income management and school attendance.
Furthermore, we carefully consider whether the way that income management was implemented
may have reduced school attendance. The way that social and economic programs are implemented
is often a defining factor in whether those programs achieve their intended goals (see Durlak &
DuPre, 2008; Cerna, 2013). The lacklustre performance of the Learnfare initiative that linked
families’ welfare payments to the school attendance of their teenage children, for example, is due
in part to the failure to fully overcome the challenges associated with administering it (Ethridge &
Percy, 1993). The form that financial incentives (or sanctions) take (Dee, 2011), the coherence of the
underlying statutes (Meier & McFarlane, 1995), and the way that parents are engaged (Gennetian,
Darling, & Aber, 2016) can all matter for program outcomes. Qualitative evidence indicates that
the introduction of income management was characterized by a lack of consultation with Aboriginal
communities, confusion about how to access existing benefits, and in some cases, short-run food
insecurity (Yu et al., 2008); each may have reduced children’s school attendance.
We demonstrate that income management did not significantly affect student enrollments or
mobility patterns into and out of Aboriginal communities; thus, the drop in school attendance
does not appear to be due to increased churning in student enrollments or transfers. Nor is it due
to concurrent policy initiatives. Instead we find that the attendance penalty associated with the
introduction of income management is virtually zero after the adoption of more flexible adminis-
5
trative arrangements suggesting that implementation issues may be responsible for the temporary
reduction in school attendance that we observe.
Our research makes an important contribution to the international debate on ending Indigenous
disadvantage. Unlike the case in Canada, New Zealand, or the United States, the Australian Gov-
ernment is unique in using the quarantining of welfare benefits as a key strategy in closing the gap
in Indigenous outcomes. Income management, however, has been controversial with critics arguing
that it is paternalistic and proponents arguing that it benefits Aboriginal communities. To date,
what is known about the NTER’s income management policy comes from qualitative evidence that
can at best be described as mixed. Despite widespread dissatisfaction with implementation prob-
lems and the proscriptive nature of the scheme (Yu et al., 2008), some Aboriginal Australians believe
that income management has had benefits in improving people’s diets, reducing ‘humbugging’, and
increasing savings (Central Land Council, 2008; AIHW, 2010). Evidence based on sound policy
evaluation methods has been lacking. Despite this, the Australian Government remains committed
to income management as a policy option announcing in the May 2017 federal budget that income
management will be extended in all existing sites until mid 2019.
2 Income Management in the Northern Territory
The Northern Territory is vast, covering approximately one sixth of the Australian continent. More
than half of its approximately 246,000 residents live in the capital city of Darwin. Aboriginal and
Torres Strait Islanders make up 25.5 percent of the Northern Territory’s total population – 51.0
percent of the population in remote areas – despite constituting only 2.8 percent of the Australian
population overall (ABS, 2016). The Northern Territory is governed by its own local government
in conjunction with the Australian Federal Government and approximately half of the Northern
Territory is Aboriginal-owned as a result of the Aboriginal Land Rights (Northern Territory) Act
of 1976.
Aboriginal kinship relationships are complex, dynamic and not easily captured by non-Aboriginal
notions of family based on physical living arrangements (see Lohoar et al., 2014; Martin, 2017;
Walter, 2017, for reviews). In particular, people see themselves in relation to others in their local
6
communities as well as in other remote areas, making it common for children and adults to move
between households. Raising children is a collective responsibility; Aboriginal children are given a
great deal of autonomy to develop their skills by exploring their environment under the watchful
eyes of the community at large (Lohoar et al., 2014; Muir & Bohr, 2014). Although parents have
high educational aspirations for their children (Walter, 2017), education experts and community
leaders have struggled to find ways to ensure that Aboriginal children can access “Western cultural
capital” while at the same time nurturing their Aboriginality and Aboriginal culture (McTaggart,
1991; Trudgett et al., 2017). Low levels of school engagement and achievement have left critics
arguing that education for Aboriginal students in remote parts of the Northern Territory has been
“characterized by policy failure” (Fogarty et al., 2015, p. 1).
2.1 Background
In 2006, the NT Government responded to several media reports of child sexual abuse in Aboriginal
communities by establishing an independent review board to examine the issue and identify possible
policy responses. The board’s report was finalized in April 2007 (Wild & Anderson, 2007). While
the NT Government was still considering its own response, the Australian Federal Government
intervened with the Minister for Indigenous Affairs declaring that there was “clear evidence that
the Northern Territory Government was not able to protect these [Aboriginal] children adequately”
(Brough, 2007a, p. 10). The result was the announcement on June 21, 2007 of a significant set
of reforms collectively known as the Northern Territory Emergency Response. The NTER package
was legislated on July 17, 2007, less than one month after it was announced.
Income management is the cornerstone of the NTER. Once income management begins in a
community, 50 percent of residents’ welfare entitlements (most income support and family assistance
transfers) is paid in the usual way. The remaining 50 percent is retained by Centrelink7 in an
individual account to be allocated to a combination of priority goods.8 Initially, people accessed
their income-managed funds in three ways. First, in remote areas, purchases could be made at a
licensed community store which would deduct funds from people’s income-management accounts
7Centrelink is the Australian Government agency responsible for administering all transfer payments.8Most advances, lump-sum payments and baby bonus installments were quarantined fully.
7
at the point of sale. Second, people could obtain store cards (gift cards) from Centrelink which
were redeemable at participating stores in larger towns. Third, people could organize a third-party
deduction, e.g., to a utility company or a landlord. Unallocated funds were retained in welfare
recipients’ income-management accounts.
Early reviews of income management documented numerous implementation problems including
a lack of understanding about the policy, difficultly in accessing funds (especially when outside home
Land Council, 2008; FAHCSIA, 2008; Yu et al., 2008; AIHW, 2010). In response, Centrelink
contact hours were extended to meet client demand during the transition period (FAHCSIA, 2008).
Additionally, in late 2008, the Basics Card was introduced as a fourth, more flexible transaction
method. The Basics Card operated through Australia’s EFTPOS system.9 It was particularly
useful for people travelling outside of their home communities. Effectively displacing store cards,
the Basics Card was perceived by users as a significant improvement to previous options for accessing
income-managed funds (AIHW, 2010).
Exact expenditure data is not available for the sample period, but the majority of the allocated
Centrelink funds under income management were spent on food (64 percent), housing (9.1 percent),
store cards (6.3 percent), and clothing and footwear (5.9 percent). Some funds were allocated to a
school nutrition program (2.6 percent), and a small fraction was allocated to education (less than
1.7 percent, bundled in a category called Other). Once the Basics Card was introduced, almost 100
percent of the allocated funds were in the categories food, housing and household goods (AIHW,
2010).
2.2 The Rollout of Income Management
Income management first commenced in September 2007 and was gradually rolled out over the next
13 months across 73 Aboriginal communities and associated town camps.10 The rollout occurred in
clusters of typically three to four communities simultaneously in the northern and southern parts of
9EFTPOS (electronic funds transfer at the point of sale) is Australia’s most widely used payment system handling70 percent of debit card transactions. See www.mobiletransaction.org/australian-eftpos-system/.
10Town camps are small Aboriginal settlements located within the boundaries of major towns such as Darwin,Tennant Creek and Alice Springs.
8
the Northern Territory. Figure 1 highlights the progressive coverage of income management across
communities.
[Figure 1 about here.]
The rollout of income management was not strictly random; several conditions needed to be met
before income management began, none of which related specifically to schools or children. The main
criterion was that the community had at least one store meeting certain restrictions around sound
financial practices (e.g., not engaging in monopoly pricing) and merchandise availability that could
be licensed to participate in the scheme. The objective was to ensure that communities had access
to affordable, high quality food (Brough, 2007a).11 Other requirements included that Centrelink
staff were available to discuss income management and set up budget allocations; a government
NTER administrator was in place for the community; arrangements were in place for deductions
associated with utilities and rent; and there was a police presence in the community. Once rolled out
to a community, income management became compulsory. Exemptions were possible only in special
circumstances when it could be demonstrated the person was not a regular member of an income-
managed community. By March 31, 2009, 15,125 people were subject to income management; only
649 exemptions, representing 3.0 percent of clients who had ever been income managed, had been
granted (AIHW, 2010).
The validity of our empirical strategy relies on the assumption that the rollout of income man-
agement was independent of trends in school attendance. To demonstrate that this assumption
holds, we first consider the spatial variation in the timing of income management (see Figure 2).
Although some regional clusters adopted income management at a similar time, there is no obvious
spatial pattern to the rollout itself.
[Figure 2 about here.]
Second, we formally test whether or not there is observed heterogeneity in the timing of income
management by regressing the date that income management began on a set of community-level
11It is unclear whether store licensing affected food availability and pricing. The NTER legislation was vagueregarding licensing requirements and one year after the NTER commenced many stores were still operating withhigh prices and low quality stock (Yu et al., 2008). A subsequent review found that many stakeholders believed storelicensing had improved the quality and quantity of stock (CIRCA, 2011), although there is no pre- and post-data tosupport these perceptions.
9
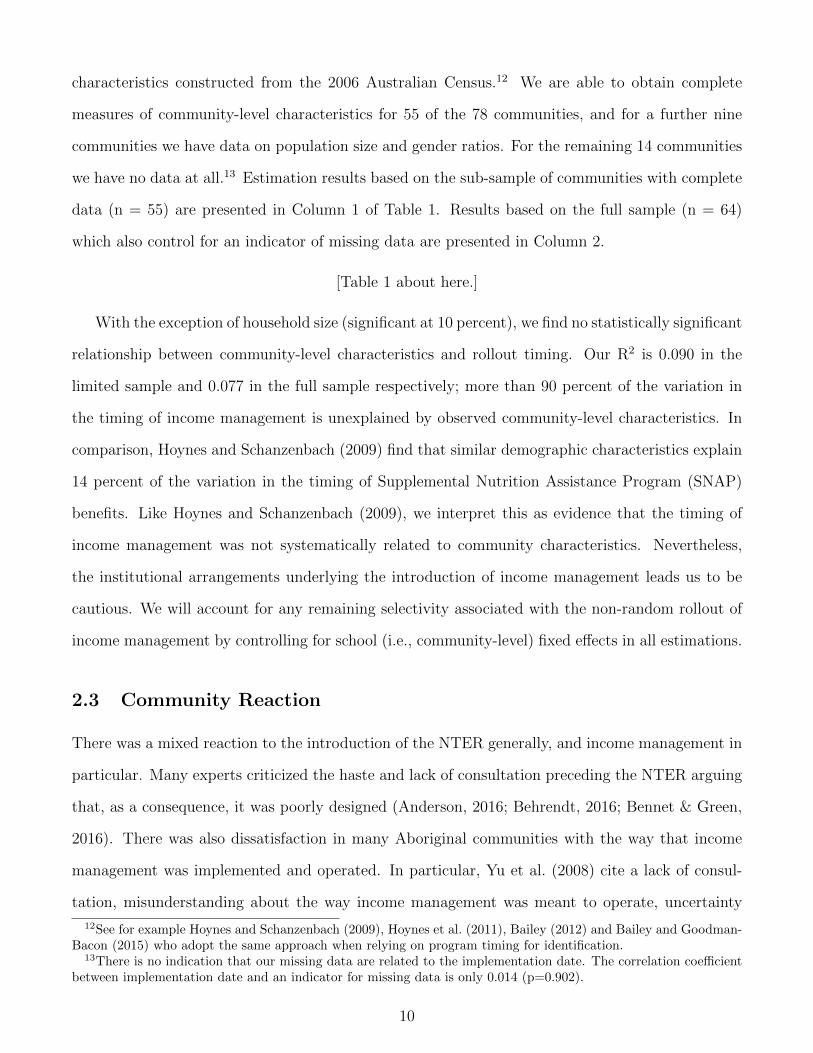
characteristics constructed from the 2006 Australian Census.12 We are able to obtain complete
measures of community-level characteristics for 55 of the 78 communities, and for a further nine
communities we have data on population size and gender ratios. For the remaining 14 communities
we have no data at all.13 Estimation results based on the sub-sample of communities with complete
data (n = 55) are presented in Column 1 of Table 1. Results based on the full sample (n = 64)
which also control for an indicator of missing data are presented in Column 2.
[Table 1 about here.]
With the exception of household size (significant at 10 percent), we find no statistically significant
relationship between community-level characteristics and rollout timing. Our R2 is 0.090 in the
limited sample and 0.077 in the full sample respectively; more than 90 percent of the variation in
the timing of income management is unexplained by observed community-level characteristics. In
comparison, Hoynes and Schanzenbach (2009) find that similar demographic characteristics explain
14 percent of the variation in the timing of Supplemental Nutrition Assistance Program (SNAP)
benefits. Like Hoynes and Schanzenbach (2009), we interpret this as evidence that the timing of
income management was not systematically related to community characteristics. Nevertheless,
the institutional arrangements underlying the introduction of income management leads us to be
cautious. We will account for any remaining selectivity associated with the non-random rollout of
income management by controlling for school (i.e., community-level) fixed effects in all estimations.
2.3 Community Reaction
There was a mixed reaction to the introduction of the NTER generally, and income management in
particular. Many experts criticized the haste and lack of consultation preceding the NTER arguing
that, as a consequence, it was poorly designed (Anderson, 2016; Behrendt, 2016; Bennet & Green,
2016). There was also dissatisfaction in many Aboriginal communities with the way that income
management was implemented and operated. In particular, Yu et al. (2008) cite a lack of consul-
tation, misunderstanding about the way income management was meant to operate, uncertainty
12See for example Hoynes and Schanzenbach (2009), Hoynes et al. (2011), Bailey (2012) and Bailey and Goodman-Bacon (2015) who adopt the same approach when relying on program timing for identification.
13There is no indication that our missing data are related to the implementation date. The correlation coefficientbetween implementation date and an indicator for missing data is only 0.014 (p=0.902).
10
generated by rapid program changes, frustration with a loss in empowerment, and embarrassment
associated with accessing income-managed funds in urban areas. Despite this, the authors also find
evidence of support for income management with some people reporting an improvement in the
quality and quantity of available food, less humbugging, reduced tobacco purchases, and higher
savings. One small survey of 141 residents of six remote communities found that 51 percent were in
favor of income management and 46 percent were opposed (Central Land Council, 2008). A survey
of 76 Centrelink clients found that two-thirds supported the policy (AIHW, 2010).
3 Previous Literature
Income management falls within a category of policies best described as ‘restricted welfare’. These
policies include in-kind transfers, conditional cash transfers (CCTs) and income quarantining. Pol-
icy makers often justify the restriction of welfare benefits by appealing to social preferences or
paternalism, especially when the consumption of certain goods has either negative (e.g., alcohol
and tobacco) or positive (e.g., education and health care) externalities for families and children
(Currie & Gahvari, 2008). In what follows, we provide a brief review of the restricted welfare
literature, focusing on policies targeting disadvantaged populations in developed countries.
In-kind transfers, in the broadest sense, simply refer to the public provision of goods and ser-
vices. Examples include public housing, medical care, child care and education. The most widely
studied program with direct relevance to income management is arguably SNAP, which provides
food vouchers to low-income families. Three important differences between SNAP and income
management are worth noting however. First, SNAP provides supplemental benefits, while income
sumption choices more than income management does, as SNAP benefits must be used for food
purchases. Third, the introduction of income management reduces the utility derived from receiving
welfare since benefits can no longer be spent in an unconstrained way, while the introduction of
SNAP raises utility by providing additional benefits.
SNAP has been difficult to evaluate, primarily due to self-selection into and misreporting of
program participation, with estimates of its effectiveness varying considerably (see Currie, 2003;
11
Hoynes & Schanzenbach, 2016, for reviews). The most compelling evidence exploits either exper-
imental or quasi-experimental variation. In particular, demonstration projects conducted in the
1980s indicate that cash benefits lead to lower food expenditures than benefits provided through
food vochers, although the negative treatment effect of cash benefits appears to be heterogeneous
(see Fraker, Martini, & Ohls, 1995; Fraker, Martini, Ohls, & Ponza, 1995). Research exploiting
variation in program commencement across counties also suggests that SNAP is associated with in-
creased food expenditure (Hoynes & Schanzenbach, 2009) as well as improved birth weight (Almond
et al., 2011) and gains in children’s health and women’s economic self-sufficiency (Hoynes et al.,
2016).
Income management also shares similar objectives with a number of CCT programs operat-
ing in developed countries.14 A common element of these programs is a focus on improving the
health and education of dependent children in disadvantaged families. In several U.S. states, for
example, receipt of Temporary Assistance for Needy Families (TANF) payments is conditional on
parents meeting objectives relating to health checks, immunizations, school attendance and student
grades (Ziliak, 2015). While CCT programs have often been successful in developing countries (see
Rawlings & Rubio, 2005), there is less evidence that they are successful in developed countries.
Opportunity NYC – a CCT program modelled on Mexico’s Oportunidades program – failed to
improve educational outcomes or health in New York (Riccio et al., 2013), for example. Slavin
(2010) reviews a large number of (predominately U.S.) CCT programs and finds that most do not
improve school attendance or educational attainment. Similarly, Medgyesy and Temesvary (2013)
find mixed evidence that CCT programs improve education and health outcomes.
Income quarantining has been the least utilized form of restricted welfare. Although it has
become increasingly important in Australia, we are aware of only one other scheme internationally
that involves involuntary income quarantining. Since 2012, New Zealanders aged 16-19 have been
subject to an income management scheme similar to that studied here. While New Zealand’s scheme
does not directly target its Indigenous population, it does disproportionately affect it (Humpage,
2016). We are not aware of any impact evaluation of income management in New Zealand.
14Examples include the Opportunity New York City Family Rewards initiative and Canada’s Self Sufficiencyproject (see Mendes et al., 2014).
12
Unfortunately, data limitations also preclude any impact evaluation of income management
on consumption and expenditure patterns in NT Aboriginal communities. Evidence, however,
suggests that any effect is likely to have been modest. Specifically, Brimblecombe et al. (2010) use
time series data from a sample of ten community stores to study purchasing patterns. Using a
before-after time series model, the authors find no evidence that income management influenced
spending patterns. The authors caution against generalizing these findings, however, since their
sample only includes stores managed by the Arnhem Land Progress Aboriginal Corporation which
had been operating a voluntary ‘food card’ system before income management was introduced.
Lamb and Young (2011) analyze similar data on revenue from electronic gambling machines in two
major townships – Alice Springs and Katherine. Although these towns were not covered by income
management, they both have large Aboriginal settlements on their outskirts (town camps) that
were affected. Most of the venues in their sample experienced no change in gambling, although two
venues servicing predominately Aboriginal patrons were exceptions. Finally, related research which
also uses the timing of program implementation for identification finds evidence that birth weights
fell in response to the introduction of income management (Doyle et al., 2017).
Overall, the literature on restricted welfare in developed countries suggests that, while some
policies do seem to improve social and economic well-being (e.g., SNAP), many others fail to
achieve their objectives and the long-term impact and cost-effectiveness of many programs remain
unclear (Gentilini, 2016). It is likely that the context and program fidelity are important predictors
of program outcomes. Campbell and Wright (2005), for example, argue that programs which
link welfare benefits to children’s school attendance need to be accompanied by case management,
financial support, and other support services to work well.
Our paper also contributes to the literature evaluating place-based policies. Unlike typical wel-
fare programs which target recipients based on individual characteristics, place-based policies target
people based on where they live in the belief that “in order to help people, one must build or revital-
ize communities” (Ladd, 1994, p. 195). Well-known examples include State Enterprise Zones and
Federal Empowerment Zones in the United States (see Neumark & Kolko, 2010; Ham et al., 2011;
Busso et al., 2013; Freedman, 2013; Reynolds & Rohlin, 2015, for recent evaluations). Neumark
and Simpson (2015) review this literature and find mixed evidence that place-based policies meet
13
their objectives. Income management differs from most place-based policies in terms of its central
mechanism; most schemes rely on initiatives like business subsidies and tax-breaks to improve local
employment opportunities whereas income management relies on changes in the delivery of welfare.
Income management also operates in a unique setting – remote Indigenous communities – while
most place-based policies target poor urban areas. Our work provides an interesting extension of
this literature.
4 Data
4.1 Attendance Data
Our analysis is conducted with data from the Northern Territory Early Childhood Data Linkage
Project, which is funded through a Partnership Project between the National Health and Medical
Research Council (NHMRC) and the NT Government. In particular, we rely on daily attendance
and enrollment records provided by the NT Department of Education, covering all students enrolled
in the public school system born from 1994 onwards.15 Our attendance data also provide daily
indicators of whether a child is expected to attend a specific school on that day providing us with a
measure of enrollment. The use of daily data is critical to our estimation strategy as it allows us to
fully exploit variation in program timing, despite the policy being rolled out over a relatively short
time frame. Moreover, our data come from the NT Education Department’s administrative system
allowing us to avoid the usual challenges associated with survey data (e.g small sample size, sample
selection, attrition bias and recall bias).
The sample is restricted to the period 2006-2009 (inclusive). Since income management was
first introduced in September 2007 and fully rolled out by October 2008, this window covers ap-
proximately 1.5 years before and after the implementation period. We restrict our analysis to this
window because the NTER income management scheme was reformed in 2010 in such a way that
is not amenable to evaluation with our data.16 Our observation window allows us to determine
15All NT Government schools are required to provide daily records of student attendance through a centralizedelectronic database – the Student Administration and Management System. Upon initial enrollment, each studentis given a unique identifying number, which allows us to track individual students across time and schools. We donot have data for private schools which operate in six of the communities in our sample.
16The rebranded scheme – New Income Management (NIM) – commenced on July 1, 2010, was rolled out across
14
whether income management was effective in the short- to medium-term.
To construct an estimation sample, we used the income management rollout schedule published
in AIHW (2010), which lists the exact day on which income management commenced in each
community. We matched communities to school names by looking up school addresses in the NT
Schools Directory, or, in some cases, using the school’s own website. We were able to match 130
schools in our data belonging to 78 separate communities. In most communities there is one major
school; 61 communities have a single school only. Forty-seven of our schools are ‘homeland learning
centers’. These are government-funded education facilities operating in very remote areas without
the staffing or infrastructure requirements of a regular school. They typically have only a few
enrollments at any time and comprise only 3.2 percent of student-day observations in our sample.
We also observe students’ year level in our data. In the Northern Territory, schooling is com-
pulsory from ages 6-17 (implying that most students are legally obligated to be in school until at
least the end of 10th grade). Grade levels are segmented into primary (1-6), middle (7-9) and senior
schools (10-12). An optional transition year is available before first grade. We restrict the sample
to students enrolled in grades 1-12. Our final dataset is an unbalanced panel of 9,162 students
attending 130 different schools. There are approximately 200 school days in each calendar year and
altogether we have more than 3.5 million student-day observations.
4.2 Student and Community Characteristics
Statistics on attendance and geographic mobility for the students in our sample highlight three
important stylized facts. First, school attendance is persistently low. Second, students are highly
mobile. Third, the vast majority of students reside in very remote areas that are characterized by
significant economic disadvantage.
Specifically, the average attendance rate is only 63.7 (57.9) percent for primary (secondary)
students living in income-managed communities over the sample period (see Table 2). In com-
parison, the attendance rate is 86 percent for the rest of the Northern Territory during the same
period. Non-attendance is a significant social concern. A major report on Aboriginal schooling
the entire Northern Territory, and involved substantial changes to the original scheme (Bray et al., 2014). We areunable to evaluate its impact due to the very short rollout period and the fact that post-2010 income managementno longer applied to entire communities (and hence schools).
15
in the Northern Territory estimated that students attending less than 80 percent of the time were
at high risk of not meeting minimum standards for literacy and numeracy (Wilson, 2013). More
generally, the attendance gap between Aboriginal and non-Aboriginal students contributes to dis-
parities in academic achievement and attainment. Biddle (2014), for example, finds that 20 percent
of the gap in PISA test scores between Aboriginal and non-Aboriginal students can be explained
by attendance.
Table 2 also highlights the significant degree of mobility within this population. Between 38.6 and
40.5 percent of primary students experience at least one move in each year. Mobility is even higher
for secondary students. This reflects the high degree of mobility of Aboriginal people generally in
the Northern Territory.
The majority of students in our sample are enrolled in primary school (years 1-6). This is in
part because there are more compulsory year levels in primary education. It also reflects the fact
that enrollment drops sharply with age in remote Aboriginal communities (Wilson, 2013). The
marked increase in secondary students over the period is driven by the cohort restrictions in the
data – students born in or after 1994 are at most 12 years old in 2006 and are too young for middle
school. By 2009 a much larger proportion of students have transitioned into secondary education.
[Table 2 about here.]
Finally, 93.3 percent of the schools in our sample are located in areas classified as ‘very remote’
by the Australian Bureau of Statistics (based on distance to urban centers). The remainder are
classified as ‘remote’. To put this in perspective, less than one percent of the 2006 Australian
population resided in very remote areas (ABS, 2008). All schools in our sample, except one, qualify
for remote area benefits offered by the NT Department of Education to attract teachers. More than
60 percent of schools qualify for the highest benefits.
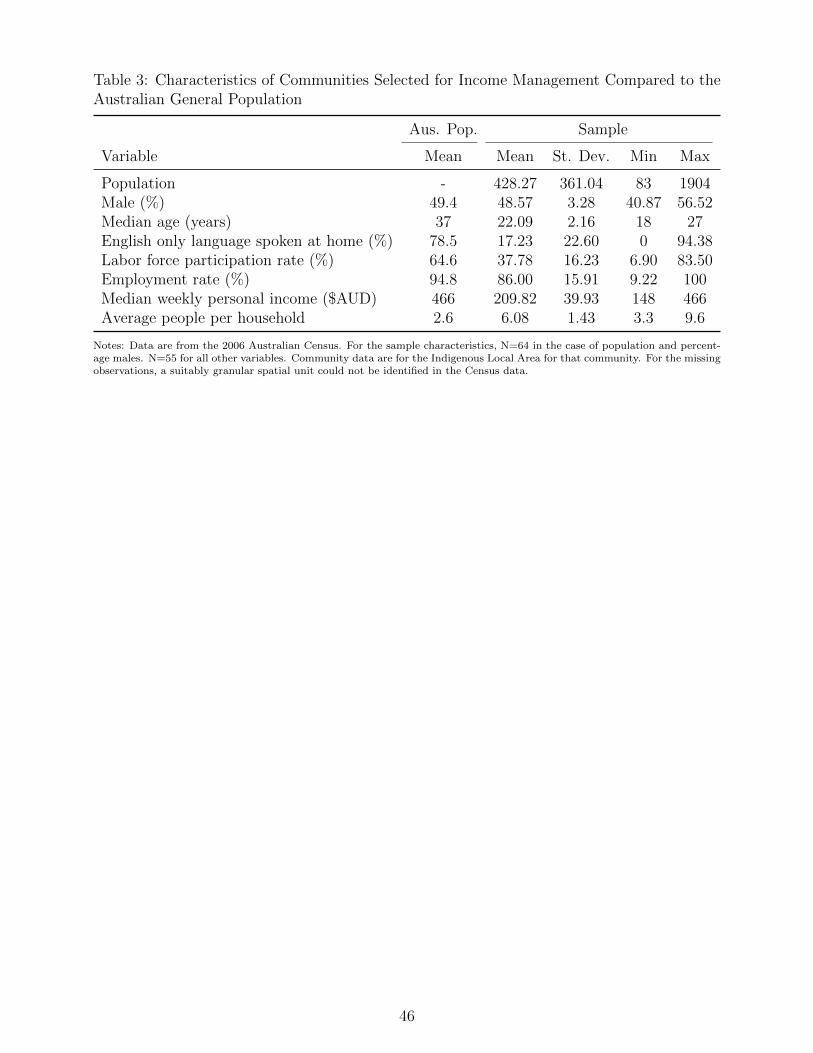
A comparison of community characteristics highlights the economic and social disparities be-
tween remote Aboriginal communities and the rest of Australia (see Table 3). The children in our
sample come from small, geographically disparate communities (see also Figure 2). The average
median age is much lower in our sample than in the rest of Australia; there are also substantial
disparities in terms of labor force participation, employment and income, and household size. Our
16
descriptive statistics reveal considerable heterogeneity across communities, in particular in labor
force participation and languages spoken at home. On average, only 17.2 percent of households in
income-managed communities speak English exclusively at home.17
[Table 3 about here.]
5 Estimation Strategy
5.1 Event Study Analysis
We begin by analyzing the effect of income management using an event study design, estimating
the following model:
Yist = α +365∑
d=−365
πi1(τst = d) + γs + εist, (1)
where Yist is an indicator of whether student i in school s attended school for the whole day on
school-day t and τst is the “event date” which measures the number of days since the introduction
of income management. For example, τst = −1 if income management will be rolled out tomorrow,
τst = 0 if it was rolled out today, and τst = 1 if it was rolled out yesterday. We restrict our data to the
one-year window on either side of the implementation date implying that all communities are equally
represented and sufficient observations are retained to examine pre- and post-implementation trends.
Note this does not mean we have a strictly balanced panel; school holidays and weekends create gaps
in the data such that for some t only a subset of schools identify the coefficient.18 Finally, γs captures
school fixed effects, εist is a stochastic error term and the remaining variables are parameters to be
estimated.
The main purpose of the event study analysis is to directly evaluate the validity of our iden-
tification assumption through a careful examination of the pattern in event-date coefficients (see
Hoynes & Schanzenbach, 2009). If the introduction of income management is unrelated to trends
in school attendance, then we would expect to see no systematic trend in our event-date coefficients
17Many Aboriginal languages are spoken across the Northern Territory. English is often the second language.18For example, if income management is introduced on a Monday for school s, then there is no observation for
τst = −1 for that school as no student is expected to attend school on a Sunday.
17
prior to the introduction of income management. At the same time, a discontinuous change in
attendance patterns that coincides with the introduction of income management is consistent with
income management having a causal effect.
5.2 Difference-in-Difference Estimation
Our baseline specification uses a difference-in-difference (DD) estimation model that effectively uses
communities that receive income management later as a control group for those receiving income
management earlier. The estimation equation is as follows:
which accounts for school-level fixed effects, fixed effects for the four school terms each year (ρn),
an interaction between the latter two, and a linear time trend t. Other variables are as defined in
Eq. 2. This specification is particularly appealing since school terms coincide with seasons in the
Northern Territory, allowing us to control for seasonal patterns in attendance at the school level. In
Eq. 3, both the level of and term-specific trends in attendance are allowed to vary across schools.
6 Results
6.1 Attendance
To establish the validity of the maintained assumptions underpinning the DD method, we first
present results obtained from estimation of the event study model. The estimation of Eq. 1
results in separate estimated coefficients for each of 717 different event days for which attendance is
measured. These coefficients effectively capture daily changes in attendance levels in the lead up to
and following the introduction of income management. In Figure 3, we plot these coefficients and
fit linear trends before and after the introduction of income management. To suppress the degree
of noise inherent in the daily data we group these coefficients into bins of roughly one month.19
[Figure 3 about here.]
There is little evidence of any systematic trend in school attendance prior to the introduction
of income management. Certainly, there is no evidence to suggest that school attendance was
falling in the lead up to income management; if anything the trend was upwards. At the same
time, we observe a discontinuous drop in attendance that occurs precisely at the onset of income
management. Attendance rebounds quickly, however, returning to baseline levels in about six to 12
months. These results support the validity of our identification strategy and point to an adverse
19In a robustness check, we also fitted nonlinear trends, which yield a similar conclusion. These results are providedupon request.
19
effect of income management on attendance, counter to the policy’s aims.20
We turn now to the results of our DD estimation (Eqs. 2 and 3), presenting four model speci-
fications: Model 1 includes no control variables; Model 2 includes control variables (Eq. 2); Model
3 includes school-specific quarterly trends (Eq. 3); and Model 4 adds a full set of interactions be-
tween i) school fixed effects, ii) school-term fixed effects, and iii) a linear time trend. Finally, since
our event study results point to a dynamic effect of income management on attendance – namely
a short-run decrease and subsequent return to trend – we also estimate Models 1-4 allowing the
treatment effect to vary with days elapsed since the onset of income management. Specifically, we
include indicators for the introduction of income management less than 30 days ago, 30-59 days
ago, 60-89 days ago, 90-119 days ago, 120-149 days ago and 150+ days ago. Results from models
with an aggregate treatment effect are presented in Panel A of Table 4; estimates from models with
dynamic treatment effects are presented in Panel B.
[Table 4 about here.]
We find that income management reduced school attendance by 1.8 percentage points (ppts) (see
Panel A). As our data cover approximately 1.5 years after the introduction of income management,
this can be interpreted as the estimated average treatment effect over the short- to medium-term.
The result is remarkably stable across specifications. Interestingly, results from Model 1 (no con-
trols) are close to results from the DD estimators, implying that school fixed effects and controls for
time trends are not overly important in driving the policy effect. To explore whether this estimate
is driven by specific communities, we iteratively estimate Model 4 dropping each community from
the sample in turn. Point estimates from this influence analysis range between -2.3 and -1.3 ppts
and in all cases are statistically significant. We also re-estimate Model 4 separately for communi-
ties receiving income management earlier (up until 30 April 2008) rather than later (after 30 April
2008). The average treatment effect for early recipients is -1.1 ppts in comparison to -2.3 ppts
for late recipients. Both estimates are statistically significant at the 1 percent level, while their
20Another common approach for testing the exogeneity of policy timing is to estimate a ‘pseudo policy effect’. Weare constrained by the fact that our data only go back to 2005. However, we calculated pseudo policy effects byassuming that income management was introduced two years before its actual implementation and re-estimating allmodels over the period 2005-2007 (inclusive). Results from this exercise (available on request) reveal no consistentevidence of a pseudo policy effect, which supports our identification strategy.
20
difference is statistically significant at the 10 percent level. Thus, the attendance penalty we find
does not stem from the influence of particular communities or the relative timing of the reform.
Results in Panel B indicate that the average effect masks important dynamics in attendance
behavior. The response in attendance follows a U-shaped pattern. In the immediate 30 days after
income management, school attendance is estimated to fall by a statistically significant 1-2 ppts. The
decrease in attendance (3-4 ppts) is greatest 60-89 days after income management is introduced,
while there is no statistical difference in attendance 150+ days post income management. The
average effect in the first five months is 2.7 ppts. Taken together, our results indicate that income
management caused a reduction in school attendance in the short-term. In the medium-term
attendance recovered but never beyond the baseline trend.
To put our results in perspective, note that a 2.7 ppts reduction in the probability of attendance
over the first five months translates to 2.3 additional absences over that period. Hancock et al.
(2013) argue that ‘every day counts’ in the sense that there is a strictly decreasing relationship
between attendance and academic achievement in Australia. On this basis, it is possible that income
management may have negatively affected student achievement. However, given the gradients
estimated in Hancock et al. (2013) it is also likely this effect was modest.
6.2 Heterogeneity by Gender, Grade Level, and School Attachment
There are many reasons to believe that the effect of income management on attendance may vary
with students’ gender, grade level, and school attachment. Aboriginal boys are less likely to be
attending school regularly and have lower levels of educational achievement (test scores) and at-
tainment than do Aboriginal girls. In our sample, the attendance rate for girls is 64.1 percent
compared to 61.3 percent for boys. Biddle and Meehl (2016) argue that differences in the way that
men and women experience discrimination, high incarceration rates among Aboriginal men, and
the near absence of job opportunities for uneducated Aboriginal women all contribute to the gender
gap in educational outcomes for Aboriginal children.
Moreover, educational disparities are much starker among high school students, particularly in
remote Aboriginal communities. A 2003 review of secondary education in the Northern Territory, for
21
example, pointed to the large number of Aboriginal adolescents in remote areas not participating in
education at all, noting that “the review team doubts that what is being delivered meets acceptable
criteria for secondary education” (Ramsey, 2003, p. 164). A decade later, a subsequent review
recommended that secondary education in remote and very remote schools be progressively relocated
to urban areas with students accommodated in residential facilities (Wilson, 2013). It is therefore
also paramount to understand whether the policy primarily affected students who were already at
the brink of disengaging with the formal education system (Prout, 2008).
We investigate whether income management has heterogeneous effects on school attendance by
estimating our preferred specification (Model 4) separately for: (i) boys versus girls; ii) primary
(years 1-6) versus secondary (years 7-12) students; and (iii) students with low versus high propensi-
ties to attend school. It is important to note that because we only observe students born in 1994 or
later, the results for secondary schools are largely driven by students in lower grade levels. Results
are reported in Table 5.
[Table 5 about here.]
We find that the average attendance response to income management is slightly larger for boys (-
1.9 ppts) than for girls (-1.6 ppts), but the difference is not statistically significant. The attendance
response to the timing of income management is also similar for boys and girls. In both cases, the
impact of income management on attendance follows a U-shaped pattern; attendance first falls, then
rebounds and after 150 days becomes statistically indistinguishable from its initial level. For both
boys and girls, the largest downturn in attendance occurs between 60-89 days after the introduction
of income management, although the drop is deeper for boys (4.8 ppts) than girls (2.9 ppts). There
is more evidence of heterogeneity across school level, with income management having a much larger
average effect on the attendance of secondary school students in both absolute and relative terms.
Most concerning, the policy continues to have a negative and relatively large (1.9 ppts) effect on
secondary school attendance after 150+ days, though this effect is only significant at the 10 percent
level. This is suggestive evidence that income management may have had an ongoing harmful effect
on the attendance of secondary school students.
We also explored how our estimates vary by students’ long-term attachment to the school.
22
Specifically, we re-estimate our models separately for students with high (above median) and low
(below median) attendance propensities.21 The average treatment effect is -2.8 ppts (-3.6 percent)
for students with high attendance propensities, while it is only -0.5 ppts (-1.0 percent) for students
with a low propensity to attend school. The difference is statistically significant at the 1 percent
level. Despite the disparity in average treatment effects, the short-term attendance response to the
introduction of income management is very similar across the two groups. Both groups experience a
large, statistically significant drop in attendance in the first month after the introduction of income
management. Attendance continues to drop up until four months following income management.
Only the longer run response depends on attendance propensity. Students with a high attendance
propensity do not return to their longer-term school attendance rates even after five months (-3.0
ppts), while attendance rates are 1.9 ppts higher for students with a low attendance propensity.
Thus, income management affected all students in the short run and had a longer-run effect on
students with relatively strong school attachment.
7 Potential Mechanisms
Policy makers had hoped that income management would redirect household spending away from
goods and services that can cause social harm and towards goods and services that are good for
child welfare. The belief was that this would increase school engagement by improving children’s
health and safety, increasing parents’ attentiveness, and reducing financial harassment.
Our results, however, indicate that income management reduced attendance in the short-term.
In what follows, we investigate the potential mechanisms underlying this result. Specifically, we
consider the extent to which our results reflect: i) the introduction of the NTER more broadly;
ii) changes in student enrollments; iii) changes in student mobility; and iv) the way that income
management was implemented. Overall, we find no support for the first three of these explana-
21The latent individual propensity to attend school for each student is predicted by backing-out the individualfixed effects after estimating Model 4 (including interactions with time since policy onset) using OLS regression andincluding all available observations on school attendance for each student. Because we have daily school data, theexpected bias in the estimation of the individual fixed effects is likely to be small (T = 542). A second source of biascomes from the fact that heterogeneity in the treatment effect by attendance propensity is not controlled for in theestimation used to obtain the individual fixed effects. However, since the average treatment effect is small relativeto the average attendance propensity (1.8 ppts relative to 62.7 percent), this bias is also likely to be small.
23
tions. However, we do find evidence that implementation issues may have been responsible for the
temporary downturn in school attendance following the introduction of income management.
7.1 Other NTER Measures
Income management was introduced into a fluid and rapidly changing policy environment. Many
other programs, including store licensing, child health checks, additional police support and various
infrastructure projects, were also rolled out to Aboriginal communities as part of the NTER (see
Table A1). One possibility is that, rather than identifying the effects of income management per
se, our results instead capture the effects of one or more of these other programs. While we cannot
rule this out theoretically, we believe it is unlikely for several reasons.
First, the introduction of other NTER measures did not coincide with the rollout of income man-
agement, which began in September of 2007 and was completed in 94.0 percent of the communities
by July 2008. Specifically, we document the cumulative coverage of the other key NTER measures
across communities over the period July 2007 to July 2008 in Table 6. Alcohol restrictions were
commonplace in remote communities even before 2007. The NTER introduced additional bans on
alcohol and pornography that became effective almost immediately.22 These bans were in place in
88 percent of communities before income management began. In contrast, extra police and related
measures were introduced into only a small number of communities during the period that income
management was being rolled out. Their introduction largely occurred later. Amongst all other
NTER measures, the school nutrition program seems to have the time-line that is most similar
to that of income management. However, it is difficult to envisage how this would have reduced
attendance.23 Rather, it provided an incentive for children to attend school, although Yu et al.
(2008) find no empirical evidence of improved attendance when comparing a sample of schools that
were early as opposed to late recipients of the school nutrition program.
[Table 6 about here.]
22Alcohol related laws came into effect on 18 August 2007 and alcohol offences on 15 September 2007 (CentralLand Council, 2008).
23School meal programs in developing countries have proven effective in raising school attendance. See Kremerand Holla (2009) for an overview.
24
Second, our event study analysis indicates that our results are capturing the effects of income
management rather than other components of the NTER. The decrease in school attendance occurs
precisely at the point when income management is introduced into each community (see Figure
3). Given that the introduction of other key NTER measures did not coincide with the rollout of
income management, they do not provide a compelling explanation for this result. Moreover, any
aggregate response to the NTER overall, for example driven by collective sentiment, is captured by
time fixed-effects.
For both reasons, we believe that our results are unlikely to be explained by confoundedness
with the introduction of other key NTER measures.
7.2 Enrollment
Although school enrollment is mandatory until age 17 in the Northern Territory, in practice many
children living in the remote Aboriginal communities are not enrolled in school (Wilson, 2013). In
this section we explore whether the reduction in school attendance that occurred after the intro-
duction of income management can be linked to changes in school enrollment. To the extent that
income management led to safer, healthier, and more stable environments for children, it may also
have had a beneficial effect in raising school enrollment rates. At the same time, enrollment rates
may have also increased as a result of the initial uncertainty about whether income management
would or would not be linked to children’s lack of school participation. In particular, the July 2007
legislative amendments to enact income management include provisions that allow for the quaran-
tining of up to 100 percent of welfare payments for families in which children are not maintaining an
acceptable level of school attendance; these provisions have never been enforced in practice however
(Yu et al., 2008). Nonetheless, some families may have moved to enroll children in school in the
expectation that they would lose their benefits if their children were not attending school. In this
case, the decline in attendance that we observe post income management might be due to a negative
selection effect. That is, income management may have encouraged children who were previously
un-enrolled – and who may have a lower propensity to attend – to enroll in school.
We observe the total number of students enrolled in each school on each day.24 If income
24We do not observe enrollment rates because we do not observe the number of children in the community.
25
management influenced enrollment decisions, then we should see an increase in student numbers
following its introduction. To investigate this, we re-estimate our event study model (Eq. 1)
focusing on the number of enrolled students in community c at time (day) t (d). As before, we
obtain estimates of our event-time indicators which identify deviations in the number of enrolled
students relative to the omitted period (τct = −365) and plot these against the onset of income
management. The results are presented in Figure 4.
[Figure 4 about here.]
Enrollment appears to be increasing with time. However, this is in part due to the fact that
our data only capture students born in 1994 or later. By 2009, these students are still yet to
age out of the education system, which means that students entering grade 1 each year are not
offset by students exiting secondary education. The slope of the trend in Figure 4 should therefore
be interpreted with caution. What is important for our analysis is whether there is a systematic
discontinuous change in enrollments that coincides with the onset of income management. There
is no strong evidence of such an effect. While the fitted linear trend lines give the perception of a
small drop in enrollments, this is driven by less stable event-date coefficients further away from the
onset of income management. Importantly, between ±150 days around the introduction of income
management there is a stable trend in enrollment. Overall, there is no indication that income
management influenced school enrollments, making it unlikely that changes in school enrollments
explain the estimated reduction in attendance.
7.3 Geographic Mobility
Geographic mobility is high in Northern Territory Aboriginal communities – families frequently relo-
cate for social and cultural reasons, including ceremonies and the maintenance of kinship (Memmott
et al., 2006). Income management may have been a barrier to geographic mobility since, before they
left their home communities, residents needed to contact Centrelink to organize a way of accessing
their benefits while they were away (AIHW, 2010). In theory, it is also possible that geographic
mobility increased to avoid the policy.25
25In practice, however, this is unlikely to be empirically important as virtually all Aboriginal communities wereultimately subject to income management. In order to avoid the policy, a community member would have had
26
If the onset of income management altered mobility patterns, our results could again be reflecting
a selectivity effect as children with higher attendance rates disproportionately leave Aboriginal com-
munities (or children with lower attendance rates disproportionately stay). We explore the pattern
in geographic mobility using data from the entire Northern Territory and categorizing schools by
whether they are located in income-managed communities or not. Geographic mobility is measured
by identifying students who change schools across communities (intra-community school changes
are not counted as moves) allowing us to focus on the dynamics of in- and out-migration in income-
managed communities. In-migration is defined as the number of students joining community c on
day t; this includes students moving from other income-managed communities; other non income-
managed communities; or from outside our administrative dataset (e.g., interstate moves or moves
between the private and public education sectors). Out-migration is defined as the reverse of in-
migration. The most common type of move is from one income-managed community to another
(56.2 percent of moves within the Northern Territory in 2008). Moves i) from income-managed to
non income-managed communities and ii) from non income-managed to income-managed commu-
nities account for an approximately even share of the remaining 43.8 percent of moves within the
Northern Territory. Finally, of the 6,665 students enrolled in schools in income-managed commu-
nities in 2008 approximately 17.5 percent either entered or exited our administrative data system.
Further details on mobility patterns are presented in Table A2.
Our approach to analyzing the mobility data is similar to that used for studying enrollments.
That is, we estimate event study models of the same form as Eq. 1 focusing on in- and out-migration
(as a fraction of student enrollment) at the community rather than individual level. As previously,
we plot the event-day coefficients against time since the onset of income management. This allows
us to assess whether there are any changes in mobility patterns that coincide with the introduction
of income management.
In Figure 5 we plot the relationship between time since the onset of income management and the
rate of in-migration (left) and out-migration (right).26 The Y-axis is the deviation in the relevant
to leave Aboriginal land altogether. Moreover, once income-managed, a welfare recipient would still be subject toincome management even if she moved away.
26We also conduct an event study analysis of the total mobility rate (i.e., in-migration + out-migration dividedby enrollments). We find no evidence that the onset of income management affected total mobility. Results areavailable upon request.
27
mobility rate with τst = −365 set as the reference period. Focusing first on in-migration, we find
no clear pattern in the data and certainly no evidence that mobility changes around the onset of
income management. There is some indication of a small increase in the rate of out-migration
around the time income management commenced. However, there is also considerable variability
in the data and this result is not significant. Overall, Figure 5 provides no strong evidence that
student mobility was affected by income management.
[Figure 5 about here.]
Although overall mobility into and out of income-managed communities seems to be unaffected
by the introduction of income management, it is possible that the composition of the migration
flow was affected. Specifically, in- and out-migrants may have become more or less selected with
respect to their propensity to attend school. We address this issue by focusing our attention on
those with a low propensity to move; i.e., the 41.9 percent of students who made no geographic
moves between 2006 and 2009. We estimate our main models using this sub-sample of students.
Despite the smaller sample size, we find the same substantive results; there is a short-run reduction
in attendance of up to 2.9 ppts and no effect on attendance after 150 days (Table A3). We conclude
that changes in mobility patterns are unlikely to explain the drop in school attendance as income
management was introduced.
7.4 Implementation Issues
It is possible that poor implementation of income management, coupled with widespread community
dissatisfaction, reduced families’ engagement with schools. In particular, the introduction of income
management was characterized by a lack of consultation with stakeholders, confusion about how the
policy would operate, hurdles in accessing welfare benefits, difficulty in checking account balances
and increased barriers to moving between local communities. Initially, Centrelink struggled to
administer the new, individual income management accounts and as a consequence it had to extend
its operating hours to meet the increased service demand (FAHCSIA, 2008). Some income-managed
clients experienced short-term consumption interruptions, because their welfare payments had been
quarantined without their knowledge. At the end of November 2007, 22.6 percent of Centrelink
28
clients were placed on “auto income management”, because they had failed to contact Centrelink
staff to allocate their funds (AIHW, 2010, p. 23). This lack of consultation with Centrelink staff
resulted in a high point of unallocated funds in the magnitude of 50.3 percent on 23 November
2007 (AIHW, 2010, p. 30). In some cases, the disruption caused by missing payments resulted
in children being absent from school as they travelled with their parents to Centrelink offices in
regional centers to sort out their benefits.27
There was also widespread dissatisfaction with the compulsory nature of the policy; many of
those directly affected felt that they were unfairly targeted and did not need to be income managed
(Yu et al., 2008; AIHW, 2010). Income management also placed constraints on resource sharing
within families, which policy makers hoped would reduce the pressure (“humbugging”) on women
and the elderly to share their benefits with extended family members (AIHW, 2010). This aspect of
the policy was poorly received, however, as remote Aboriginal communities are highly collectivist
and resource sharing is an important social institution. Finally, there was a great deal of confusion
about whether or not income management would be linked to school attendance and the perception
that schools would be supplying enrollment and attendance data to Centrelink may have undermined
community-school relations (Kroneman, 2007).
We investigate whether these initial implementation issues are the source of the reduction in
school attendance by taking advantage of the introduction of the Basics Card in 2008, a second
reform that significantly improved the operation of income management. The Basics Card overcame
many of the operational problems associated with income management by allowing clients to use
the card to purchase goods and services in the same way as a regular debit card. This eliminated
the need for priority goods to be purchased from either nominated community stores or using store
cards previously obtained from Centrelink. The Basics Card significantly reduced the transaction
costs associated with income management, particularly when travelling outside home communities.
It may have also assisted in restoring social capital by allowing family members to pool resources.
Although Basics Cards were protected by a personalized identification number (PIN) and clients
27Personal communication with Olga Havnen, NT Coordinator General for Remote Service Delivery during theNorthern Territory Emergency Response (November 22, 2017). Central Land Council (2008) reports disruptioneffects in six selected communities including lack of access to funds, missing transfers, and long waiting times atCentrelink to collect store cards.
29
were told not to share their card or PIN, in practice many people admit to doing both (AIHW,
2010; Bray et al., 2014). Qualitative evidence suggests that people viewed the Basics Card as a
substantial improvement in the way income management operated (AIHW, 2010). We posit that,
if implementation issues are driving our results, we should see attendance improve after the Basics
Card is introduced.
The Basics Card was introduced on September 8, 2008 and was completely rolled out to all
income-managed clients by December 15, 2008 three months later. Information regarding the rollout
schedule for the Basics Card is not available. However, aggregate data on the allocation of income-
managed funds imply that the rollout predominately occurred in the first month. Specifically, the
fraction of income-managed funds allocated to store cards dropped from more than 20 to around 5
percent between September 8, 2008 and October 10, 2008, eventually becoming almost zero by the
time the rollout was completed (AIHW, 2010).
We assess whether the introduction of the Basics Card mitigated the negative effect of income
management on attendance by re-estimating our main models and including an indicator variable
that takes the value one if t ≥ September 8, 2008 (and zero otherwise) (see Table 7).28 This
approach effectively acts as if the Basics Card was introduced across the whole Northern Territory
on a single day. Although this is not strictly correct, any ensuing bias will be small and at worst
attenuate our estimates. We estimate all models allowing the treatment effect to vary with time
since implementation.
[Table 7 about here.]
Our preferred specification is presented in Column 3. School attendance continues to have the
same U-shaped response to the introduction of income management. Moreover, the magnitude
of our estimates is largely unaffected by the inclusion of the Basics Card indicator. The only
difference is that attendance 150+ days post income management is now estimated to be 1.9 ppts
lower and statistically significant. Critically, attendance rates are estimated to be 1.6 ppts higher
following the introduction of the Basics Card. This finding provides evidence in support of the
hypothesis that income management led to lower levels of school attendance in the short run because
28This indicator is not identified in Model 2 due to the inclusion of time fixed effects.
30
of implementation issues. When the program implementation improved so too did attendance.29
Nevertheless, the coefficient on the Basics Card is not large enough to fully offset the initial effects of
income management. We find no evidence that the policy ever had a positive effect on attendance.
8 Conclusion
Relative to Canada, New Zealand, or the United States, Australia stands out for its use of welfare
quarantining as a key strategy to enhance the well-being of Indigenous communities. Income man-
agement – similar to other forms of conditional cash transfers – aims to improve social and economic
outcomes by creating a healthy consumption environment. Currently, the Australian Government
is actively extending its income management policy beyond Aboriginal communities. A new pro-
gram has been rolled out universally in the Northern Territory, and several place-based programs
are being trialled in other states to address entrenched disadvantage and high-risk consumption
patterns. In some cases, income management is voluntary; in others it is compulsory.30
While conditional cash transfer programs have been subjected to rigorous evaluation, there
is little credible evidence regarding the impact of income management on social and economic
outcomes. We provide the first causal evidence linking income management to a key policy target –
school attendance. In contrast to the policy’s objectives, we find no evidence that school attendance
increased after the introduction of income management. In fact, we estimate that attendance fell
by 2.7 percentage points on average in the short run. This drop in attendance does not appear
to be due to other contemporaneous social policy initiatives or to changes in either geographic
mobility or school enrollment patterns. Rather, we argue that the way that income management was
implemented may have resulted in income insecurity, barriers to day-to-day economic activity, and
a loss of empowerment which may have led to increased family stress and had adverse consequences
for parenting. These findings echo those of Gennetian, Seshadri, et al. (2016), who find that students
receiving food stamps have disproportionately more behavioral problems at the end of the month
29We are limited in our ability to conduct placebo tests around the timing of the Basics Card given the singleimplementation date and unstable policy environment during our study period. Nevertheless, we re-estimated allmodels including indicators for up to 90 days before the Basics Card commenced. In all cases, estimates indicatethat attendance was not increasing in the lead-up to the introduction of the Basics Card. Results are provided uponrequest.
30See www.dss.gov.au for more information.
31
when they are most likely to be subject to food insecurity.
Of course, the failure of income management to improve student attendance does not necessarily
rule out other positive social and economic outcomes. Nevertheless, if income management did meet
other key objectives (e.g., increased expenditure on food and education, less substance abuse) then
it is puzzling that we do not observe any improvement in school attendance over the study period
given the likely link between these outcomes and school engagement. More broadly, the overall
trend in school attendance between 2006-2009 suggests that the NTER in general failed to lift
attendance rates in remote Aboriginal communities despite the large number of policies targeting
this goal.
Taking a broader perspective, a key take-away message of our research is that program im-
plementation matters. Consistent with Cameron and Shah (2014), our results suggest that policy
makers should pay careful attention to the erosion of social capital when implementing new pro-
grams. This is particularly true in Aboriginal communities where attempts to reduce disadvantage
through increased social mobility may put social and cultural capital at risk (Walter, 2015). Income
management also provides an interesting case study for understanding how weak program fidelity
may not only undermine the benefits to social welfare reform, but may also have harmful conse-
quences. Of particular concern is the potential for these harmful effects to disproportionately affect
vulnerable groups. In particular, we find that the school attendance penalty was somewhat larger
for secondary school students who already have disproportionately low attendance rates. At the
same time, we find that income management affected not only vulnerable groups, but also had a
lingering effect on those students with a relatively high propensity to attend school regularly. Hence,
income management may have undermined the efforts of Aboriginal families who were ensuring that
their children attended school more regularly.
A key question for policy makers and researchers is whether restricted welfare policies, such
as income management, are preferable to regular cash transfers. Few studies compare the rela-
tive performance of cash versus in-kind transfers. Yet those that do find little evidence that one
mode of delivery is clearly superior to the other when the focus is on food consumption and nu-
trition (Gentilini, 2016). Our results imply that, with adequate program administration, income
management may at best be neutral with respect to student attendance.
32
At the same time, non-cash transfers are often associated with high administrative costs. The
cost of administering income management was $451 million (AUD) between the 2007-08 and 2009-10
financial years, or approximately $20,700 per income-managed person.31 Further research is needed
to understand whether or not this cost is offset by other social benefits beyond increased school
attendance or whether – as some experts have argued (Altman, 2016) – these resources could be
redeployed more productively to enhance the wellbeing of Indigenous Australians.
31Figures on the cost of income management are reported in Buckmaster et al. (2012) based on budget papersavailable at www.budget.gov.au. The cost per person is calculated using the total number of persons who had beensubjected to income management as of 31 March 2009 (21,763) (reported in AIHW, 2010).
33
References
ABS. (2008). Australian social trends 2008: Population distribution. Australian Bureau of Statistics:Canberra.
ABS. (2016). Australian census. Australian Bureau of Statistics. Retrieved from http://stat.abs
.gov.au/itt/r.jsp?databyregion\&ref=CTA2 (Viewed 30 November 2017)AIHW. (2010). Evaluation of income management in the Northern Territory. Australian Institute
of Health and Welfare: Occasional Paper No. 34.Almond, D., Hoynes, H., & Schanzenbach, D. W. (2011). Inside the war on poverty: The impact
of food stamps on birth outcomes. The Review of Economics and Statistics , 93 , 387–403.Altman, J. (2016). Blindsided by basics: Three perspectives on income management in an Aborig-
inal community in the Northern Territory. Australian Journal of Social Issues , 51 , 487–502.Al-Yaman, F., Van Doeland, M., & Wallis, M. (2006). Family violence among Aboriginal and Torres
Strait Islander peoples. Australian Institute of Health and Welfare Canberra: AIHW cat. no.IHW 17.
Anderson, P. (2016). The intervention: Personal reflections. In R. Scott & A. Heiss (Eds.), Theintervention: An anthology (2nd ed., pp. 26–39). Sydney: NewSouth Publishing.
Australian Institute of Aboriginal and Torres Strait Islander Studies. (2012). Guide-lines for ethical research in australian indigenous studies (Tech. Rep.). (Accessed athttp://aiatsis.gov.au/sites/default/files/docs/research-and-guides/ethics/GERAIS.pdf on 5March 2018)
Bailey, M. (2012). Reexamining the impact of family planning programs on US fertility: Evidencefrom the war on poverty and the early years of Title X. American Economic Journal: AppliedEconomics , 4 , 62–97.
Bailey, M., & Goodman-Bacon, A. (2015). The war on poverty’s experiment in public medicine:Community health centers and the mortality of older Americans. American Economic Review ,105 , 1067–1104.
Behrendt, L. (2016). The dialogue of intervention. In R. Scott & A. Heiss (Eds.), The intervention:An anthology (2nd ed., pp. 61–70). Sydney: NewSouth Publishing.
Bennet, B., & Green, S. (2016). Is community development equity or justice? In C. Kickett-Tucker (Ed.), Mia Mia Aboriginal community development: Sustaining cultural security (pp.128–141). Cambridge, UK Port Melbourne: VIC Cambridge University Press.
Biddle, N. (2014). Developing a behavioural model of school attendance: Policy implications forIndigenous children and youth. Centre for Aboriginal Economic Policy Research, WorkingPaper 94/2014.
Biddle, N., & Meehl, A. (2016). The gendered nature of Indigenous education participation andattainment. Centre for Aboriginal Economic Policy Research, Working Paper No.. 106/2016.
Brady, M. (2000). Alcohol policy issues for Indigenous people in the United States, Canada,Australia and New Zealand. Contemporary Drug Problems , 27 , 435–509.
Bramley, D., Hebert, P., Jackson, R., & Chassin, M. (2004). Indigenous disparities in disease-specific mortality, a cross-country comparison: New Zealand, Australia, Canada, and theUnited States. The New Zealand Medical Journal , 117 , 1–16.
Bray, J. R., Gray, M., Hand, K., & Katz, I. (2014). Evaluating New Income Management in theNorthern Territory: Final evaluation report. Social Policy Research Centre.
Brimblecombe, J. K., McDonnell, J., Barnes, A., Dhurrkay, J. G., Thomas, D. P., & Bailie, R. S.(2010). Impact of income management on store sales in the Northern Territory. MedicalJournal of Australia, 192 , 549–554.
34
Brough, M. (2007a). Northern Territory National Emergency Response Bill 2007: Second readingspeech. Commonwealth of Australia: House of Respresentatives.
Brough, M. (2007b). Social Security and other Legislation Amendment (Welfare Payment Reform)Bill 2007: Second Reading. Commonwealth of Australia: House of Respresentatives.
Buckmaster, L., Ey, C., & Klapdor, M. (2012). Income management: An overview. Department ofParliamentary Services: Parliamentary Library Information Analysis Advice.
Busso, M., Gregory, J., & Kline, P. (2013). Assessing the incidence and efficiency of a prominentplace based policy. American Economic Review , 103 , 897–947.
Cameron, L., & Shah, M. (2014). Can mistargeting destroy social capital and stimulate crime?Evidence from a cash transfer program in Indonesia. Economic Development and CulturalChange, 62 , 381–415.
Campbell, D., & Wright, J. (2005). Rethinking welfare school-attendance policies. Social ServiceReview , 79 , 2–28.
Cascio, E., Gordon, N., Lewis, E., & Reber, S. (2010). Paying for progress: Conditional grants andthe desegregation of southern schools. Quarterly Journal of Economics , 125 , 445–482.
Central Land Council. (2008). Reviewing the Northern Territory Emergency Response: Perspectivesfrom six communities. Central Land Council.
Cerna, L. (2013). The nature of policy change and implementation: A review of different theoreticalapproaches. Paris: OECD.
CIRCA. (2011). Evaluation of the Community Stores Licensing Program: Final report. Culturaland Indigenous Research Centre Australia: Commissioned by the Department of Families,Housing, Community Services and Indigenous Affairs: Australian Government.
Clifford, A. C., Doran, C. M., & Tsey, K. (2013). A systematic review of suicide prevention inter-ventions targeting Indigenous peoples in Australia, United States, Canada and New Zealand.BMC Public Health, 13 , 1–11.
Cooke, M., Mitrou, F., Lawrence, D., Guimond, E., & Beavon, D. (2007). Indigenous well-beingin four countries: An application of the UNDP’S Human Development Index to IndigenousPeoples in Australia, Canada, New Zealand, and the United States. BMC International Healthand Human Rights , 9 , 1–11.
Cornell, S. (2006). Indigenous peoples, poverty and self-determination in Australia, New Zealand,Canada and the United States. Native Nations Institute for Leadership, Management, andPolicy: JOPNA No. 2006-02.
Cross, T. A., Earle, K. A., & Simmons, D. (2000). Child abuse and neglect in Indian country:Policy issues. Families in Society: The Journal of Contemporary Human Services , 81 , 49–58.
Currie, J. (2003). US food and nutrition programs. In R. A. Moffitt (Ed.), Means-tested transferprograms in the United States (pp. 199–289). Chicago: University of Chicago Press.
Currie, J., & Gahvari, F. (2008). Transfers in cash and in-kind: Theory meets the data. Journal ofEconomic Literature, 46 , 333–383.
Dee, T. S. (2011). Conditional cash penalties in education: Evidence from the Learnfare experiment.Economics of Education Review , 30 , 924–937.
Doyle, M., Schurer, S., & Silburn, S. (2017). Do welfare restrictions improve child health? Esti-mating the causal impact of Income Management in the Northern Territory. LCC WorkingPaper Series: 2017-23.
Duflo, E. (2012). Women and empowerment and economic development. Journal of EconomicLiterature, 50 (4), 1051–1079.
Durlak, J. A., & DuPre, E. P. (2008). Implementation matters: A review of research on theinfluence of implementation on program outcomes and the factors affecting implementation.
35
American Journal of Community Psychology , 41 , 327–350.Ethridge, M. E., & Percy, S. L. (1993). A new kind of public policy encounters disappointing
results: Implementing Learnfare in Wisconsin. Public Administration Review , 53 , 340–347.FAHCSIA. (2008). Submission of background material to the Northern Territory Emergency Re-
sponse Review Board. Department of Families, Housing, Community Services and IndigenousAffairs: Australian Government.
FAHCSIA. (2011). Northern Territory Emergency Response: Evaluation report 2011. Departmentof Families, Housing, Community Services and Indigenous Affairs: Australian Government.
Finkelstein, A., & McKnight, R. (2008). What did Medicare do? The initial impact of Medicare onmortality and out of pocket medical spending. Journal of Public Economics , 92 , 1644–1668.
Fogarty, W., Lovell, M., & Dodson, M. (2015). Indigenous education in Australia: Place, pedagogyand epistemic assumptions. UNESCO Observatory Refereed e-Journal , 4 , 1–21.
Fraker, T. M., Martini, A. P., & Ohls, J. C. (1995). The effect of food stamp cashout on foodexpenditures: An assessment of the findings from four demonstrations. Journal of HumanResources , 30 , 633–649.
Fraker, T. M., Martini, A. P., Ohls, J. C., & Ponza, M. (1995). The effect of cashing-out foodstamps and household food use and the cost of issuing benefits. Journal of Policy Analysisand Management , 14 , 372–392.
Freedman, M. (2013). Targeted business incentives and local labor markets. Journal of HumanResources , 48 , 311–344.
Gennetian, L., Darling, M., & Aber, J. L. (2016). Behavioral economics and developmental science:A new framework to support early childhood interventions. Journal of Applied Research onChildren: Informing Policy for Children at Risk , 7 , Article 2.
Gennetian, L., Seshadri, R., Hess, N. D., Winn, A. N., & Goerge, R. M. (2016). SupplementalNutrition Assistance Program (SNAP) benefit cycles and student disciplinary infractions.Social Service Review , 90 , 403–433.
Gentilini, U. (2016). Revisiting the “cash versus food” debate: New evidence for an old puzzle?The World Bank Research Observer , 31 , 135–167.
Ham, J. C., Swenson, C., Imrohoroglu, A., & Song, H. (2011). Government programs can improvelocal labor markets: Evidence from state enterprise zones, federal empowerment zones andfederal enterprise community. Journal of Public Economics , 95 , 779–797.
Hancock, K. J., Shepherd, C. C. J., Lawrence, D., & Zubrick, S. R. (2013). School attendance andeducational outcomes: Every day counts. Report prepared for the Department of Education,Employment and Workplace Relations.
Herbert, J., McInerney, D. M., Fasoli, L., Stephenson, P., & Ford, L. (2014). Indigenous secondaryeducation in the Northern Territory: Building for the future. The Australian Journal ofIndigenous Education, 43 , 85–95.
Howard, J. (2007). To stabilise and protect. the hon john howard mp prime minister of australiaaddress to the sydney institute, four seasons hotel, sydney. Commonwealth of Australia: Houseof Respresentatives.
Hoynes, H., Page, M., & Stevens, A. H. (2011). Can targeted transfers improve birth outcomes?Evidence from the introduction of the WIC program. Journal of Public Economics , 95 ,813–827.
Hoynes, H., & Schanzenbach, D. W. (2009). Consumption responses to in-kind transfers: Evidencefrom the introduction of the food stamp program. American Economic Journal: AppliedEconomics , 1 , 109–139.
Hoynes, H., & Schanzenbach, D. W. (2016). US food and nutrition programs. In R. A. Moffitt
36
(Ed.), Economics of means-tested transfer programs in the United States (Vol. 1, pp. 219–301).Chicago: University of Chicago Press.
Hoynes, H., Schanzenbach, D. W., & Almond, D. (2016). Long-run impacts of childhood access tothe safety net. American Economic Review , 106 , 903–934.
Humpage, L. (2016). Income management in New Zealand and Australia: Differently framed butsimilarly problematic for Indigenous peoples. Critical Social Policy , 36 , 551–571.
Hunter, E., & Harvey, D. (2002). Indigenous suicide in Australia, New Zealand, Canada and theUnited States. Emergency Medicine, 14 , 14–23.
Kremer, M., & Holla, A. (2009). Improving education in the developing world: What have welearnt from randomized evaluations? Annual Review of Economics , 1 , 513–542.
Kroneman, M. (2007). Education is the key: An education future for Indigenous communities inthe Northern Territory. Melbourne, Australia: Australian Education Union.
Ladd, H. F. (1994). Spatially targeted economic development strategies: Do they work? Cityscape,1 , 193–218.
Lamb, D., & Young, M. (2011). ‘Pushing buttons’: An evaluation of the effect of Aboriginal incomemanagement on commercial gambling expenditure. Australian Journal of Social Issues , 46 ,119–140.
Lohoar, S., Butera, N., & Kennedy, E. (2014). Strengths of Australian Aboriginal cultural practicesin family life and child rearing. Child Family Community Australia Paper No. 25 2014.
Ludwig, J., & Miller, D. L. (2007). Does head start improve childrens life chances? Evidence froma regression discontinuity design. Quarterly Journal of Economics , 122 , 159–208.
Martin, K. L. (2017). Culture and identity: LSIC parents’ beliefs and values and raising youngIndigenous children in the twenty-first century. In M. Walter, K. L. Martin, & G. Bodkin-Andrews (Eds.), Indigenous children growing up strong: A longitudinal study of Aboriginaland Torres Strait Islander families (pp. 79–99). London: Palgrave Macmillan.
Matheson, D., & Hardie-Boys, N. (2011). Evaluation of the child health check initiative and theexpanding health service delivery initiative: Final report. Report to the Department of Healthand Ageing: Allen and Clarke Policy and Regulatory Specialists.
McTaggart, R. (1991). Western institutional impediments to Australian Aboriginal education.Journal of Curriculum Studies , 23 , 297–325.
Medgyesy, M., & Temesvary, Z. (2013). Conditional cash transfers in high-income OECD countriesand their effects on human capital accumulation. GINI Discussion Paper 84.
Meier, K. J., & McFarlane, D. R. (1995). Statutory coherence and policy implementation: Thecase of family planning. Journal of Public Policy , 15 , 281–298.
Memmott, P., Long, S., & Thomson, L. (2006). Indigenous mobility in rural and remote Australia.Australian Housing and Urban Research Institute Final Report No. 90.
Memmott, P., Stacy, R., Chambers, C., & Keys, C. (2001). Violence in Indigenous communities.Report to Crime Prevention Branch of the Attorney-Generals Department: Canberra.
Mendes, P., Waugh, J., & Flynn, C. (2014). Income management in Australia: A critical examina-tion of the evidence. International Journal of Social Welfare, 23 , 362–372.
Muir, N., & Bohr, Y. (2014). Contemporary practice of traditional Aboriginal child rearing: Areview. First Peoples Child and Family Review , 9 , 66–79.
Neumark, D., & Kolko, J. (2010). Do enterprise zones create jobs? Evidence from California’senterprise zone program. Journal of Urban Economics , 68 , 1–19.
Neumark, D., & Simpson, H. (2015). Place-based policies. In G. Duranton, J. V. Henderson,& W. Strange (Eds.), Handbook of regional and urban economics (Vol. 5, pp. 1198–1287).Elsevier.
37
Prout, S. (2008). The entangled relationship between indigenous spatiality and government servicedelivery (No. 41/2008). Centre for Aboriginal Economic Policy Research, working paper.
Ramsey, G. (2003). Report on future directions for secondary education in the Northern Territory.Charles Darwin University and NT Department of Employment, Education and Training:Report to the Northern Territory Government.
Rawlings, L. B., & Rubio, G. M. (2005). Evaluating the impact of conditional cash transferprograms. The World Bank Research Observer , 20 , 29–55.
Reynolds, C. L., & Rohlin, S. (2015). The effects of location-based tax policies on the distribution ofhousehold income: Evidence from the federal empowerment zone program. Journal of UrbanEconomics , 88 , 1–15.
Riccio, J., Dechausay, N., Miller, C., Nunez, S., Verma, N., & Yang, E. (2013). Conditional cashtransfers in New York City: The continuing story of the Opportunity NYC-Family RewardsDemonstration. MDRC Report.
Sinha, V., Trocme, N., Fallon, B., MacLaurin, B., Fast, E., Prokop, S. T., . . . Richard, K. (2011).Kiskisik awasisak: Remember the children understanding the overrepresentation of first na-tions children in the child welfare system. Ontario: Assembly of First Nations.
Slavin, R. E. (2010). Can financial incentives enhance educational outcomes? Evidence frominternational experiments. Educational Research Review , 5 , 68–80.
Stanley, J., Tomison, A. M., & Pocock, J. (2003). Child abuse and neglect in Indigenous Australiancommunities. Australian Institute of Family Studies: NCPC Issues No. 19.
Taylor, A., & Dunn, B. (2010). Conceptualising and measuring the mobility of Indigenous studentsin the Northern Territory. The Australian Journal of Indigenous Education, 39 , 88–97.
Trudgett, M., Page, S., Bodkin-Andrews, G., Franklin, C., & Whittaker, A. (2017). Another brickin the wall? Parent perceptions of school educational experiences of Indigenous Australianchildren. In M. Walter, K. L. Martin, & G. Bodkin-Andrews (Eds.), Indigenous childrengrowing up strong: A longitudinal study of Aboriginal and Torres Strait Islander families (pp.233–258). London: Palgrave Macmillan.
Walter, M. (2015). The vexed link between social capital and social mobility for Aboriginal andTorres Strait Islander people. Australian Journal of Social Issues , 50 , 69–88.
Walter, M. (2017). Doing Indigenous family. In M. Walter, K. L. Martin, & G. Bodkin-Andrews(Eds.), Indigenous children growing up strong: A longitudinal study of Aboriginal and TorresStrait Islander families (pp. 123–152). London: Palgrave Macmillan.
Wild, R., & Anderson, P. (2007). Ampe akelyernemane meke mekarle “little children are sacred”:Report of the Northern Territory board of inquiry into the protection of Aboriginal childrenfrom sexual abuse. Northern Territory Government.
Wilson, B. (2013). A share in the future: Review of Indigenous education in the Northern Territory.Northern Territory Government.
Yap, M., & Biddle, N. (2010). Gender gaps in Indigenous socioeconomic outcomes: Australianregional comparisons and international possibilities. The International Indigenous PolicyJournal , 1 , Article 3.
Yu, P., Duncan, M. E., & Gray, B. (2008). Northern Territory Emergency Response: Report of thereview board. Commonwealth of Australia.
Ziliak, J. P. (2015). Temporary assistance for needy families. In R. A. Moffitt (Ed.), Economics ofmeans-tested transfer programs (Vol. 1, pp. 303–396). Chicago: University of Chicago Press.
38
Figure 1: Cumulative Coverage of Income Management Across NTER Communities
Notes: The graph shows the cumulative number of communities that have started income management on each date as a proportionof the total number of communities selected for income management. Shaded regions are school holiday periods. Crosses representdates that income management commenced in one or more communities. For the complete rollout schedule see AIHW (2010).
39
Figure 2: Map of Communities Selected for Income Management and Program CommencementDates
Notes: Color-coding on communities selected for income management reflects the date income management started in the relevantcommunity as indicated in the legend. Major settlements in the Northern Territory are in boldface. People living in the municipalparts of these communities were not subject to income management (only those living in the associated town camps). Highways andarterial roads are identified by lines connecting certain communities.
40
Figure 3: Event Study Coefficients for School Attendance
Notes: Results are based on OLS estimation of Eq. 1 using observations between ±365 days from the onset of income managementin each community. The dependent variable is an indicator for whether student i in school s attended school for the whole day onschool-day t. The regression controls for school fixed effects and separate indicators for each event-date (i.e., time until/since incomemanagement commenced). Due to school holidays and weekends, some event-dates have no observations such that the number ofseparate indicators is 717. Scatter points correspond to coefficients on the event-date dummies in Eq. 1. These are binned into 12groups (approximately one month) each side of the implementation date. The reference period is τst = −365 and deviations in theattendance rate are relative to attendance on this date. Linear trend lines and 95% confidence intervals through these points arealso shown.
41
Figure 4: Event Study Coefficients for Number of Students Enrolled in Income-Managed Commu-nities
Notes: Results are based on OLS estimation of the same form as Eq. 1 using observations between ±365 days from the onset ofincome management in each community. The dependent variable is the number of students enrolled in schools located in community con school-day t. The regression controls for community fixed effects and separate indicators for each event-date (i.e., time until/sinceincome management commenced). Due to school holidays and weekends, some event-dates have no observations such that thenumber of separate indicators is 717. Scatter points correspond to coefficients on the event-date dummies in Eq. 1. These are binnedinto 12 groups (approximately one month) each side of the implementation date. The reference period is τst = −365 and deviationsin the average number of enrolled students are relative to the average number of enrolled students on this date. Linear trend linesand 95% confidence intervals through these points are also shown.
42
Figure 5: Event Study Coefficients for Student Movement Into/Out of Income-Managed Commu-nities
Notes: Results are based on OLS estimation of the same form as Eq. 1 using observations between ±365 days from the onset ofincome management in each community. For the left graph, the dependent variable is the total number of students moving into thecommunity divided by the number of students already enrolled in the community on day t. Moves into a community include studentsmoving from other income-managed communities; other non income-managed communities; or students joining the administrativedataset for the first time or after and absence of at least six months (e.g., interstate moves or moves between the private and publiceducation sector). For the right graph, the dependent variable is the total number of students leaving the community divided by thenumber of students enrolled in the community on day t. This is the reverse of moves into a community. The regressions control forcommunity fixed effects and separate indicators for each event-date (i.e., time until/since income management commenced). Due toschool holidays and weekends, some event-dates have no observations such that the number of separate indicators is 717. Scatterpoints correspond to coefficients on the event-date dummies in Eq. 1. These are binned into 12 groups (approximately one month)each side of the implementation date. The reference period is τst = −365 and deviations in the rate of in-migration/out-migrationare relative to the rate on this date. Linear trend lines and 95% confidence intervals through these points are also shown.
43
Table 1: OLS Regression of Community Characteristics on Income Man-agement Commencement Date
Variable Model 1 Model 2
Population/100 0.803 2.508(14.484) (14.450)
(Population/100)2 -0.287 -0.349(0.681) (0.676)
Percentage male 2.996 0.372(5.541) (5.194)
Median age 7.159 8.040(8.126) (8.028)
Percentage English only language spoken at home 0.811 0.861(0.615) (0.587)
Labor force participation rate -0.150 -0.045(1.005) (1.027)
Employment rate 0.228 0.230(0.703) (0.701)
Median weekly personal income 0.168 0.166(0.248) (0.230)
Average people per household 25.728∗ 25.512∗
(13.636) (13.813)
Demographics miss 366.269(260.483)
N 55 64R2 0.090 0.077
Notes: Robust standard errors in parentheses. The dependent variable is the date income managementwas implemented in the community, with each day equal to one unit. Data on community characteris-tics are from the 2006 Australian Census using the geospatial unit ‘Indigenous Local Area’. For the 14communities for which we have no data, a suitably granular spatial unit could not be identified in theCensus. Estimates are obtained by OLS. ∗ is statistical significance at the 10% level.
44
Table 2: Sample Statistics for School Attendance Data: Commu-nities Selected for Income Management
Notes: Data are from the NT Department of Education administrative records and thereported statistics are based on the authors’ calculations. The sample includes studentsborn from 1994 enrolled in schools administered by the NT Department of Education op-erating in communities selected for income management. a Primary students are thoseenrolled in grades 1-6. Secondary students are in grades 7-12.b The attendance rate is the sum of student-day observations where the student attendedschool the whole day divided by the number of student-day observations where the stu-dent was expected to attend school. c Moved is an indicator variable for if at any timeduring the period the student changed his/her enrollment to a school into a different com-munity (intra-community school changes are excluded) or left/joined the NT administra-tive dataset (which include interstate moves or moves between the private/public sector).Students are counted as having left if they exit the dataset for at least six months. Stu-dents are counted as having joined if they first enter the dataset or return to the datasetafter an absence of at least six months. Students who join the sample in grade 1 or exitthe sample in grades 11 or 12 are not included in this calculation.
45
Table 3: Characteristics of Communities Selected for Income Management Compared to theAustralian General Population
Aus. Pop. Sample
Variable Mean Mean St. Dev. Min Max
Population - 428.27 361.04 83 1904Male (%) 49.4 48.57 3.28 40.87 56.52Median age (years) 37 22.09 2.16 18 27English only language spoken at home (%) 78.5 17.23 22.60 0 94.38Labor force participation rate (%) 64.6 37.78 16.23 6.90 83.50Employment rate (%) 94.8 86.00 15.91 9.22 100Median weekly personal income ($AUD) 466 209.82 39.93 148 466Average people per household 2.6 6.08 1.43 3.3 9.6
Notes: Data are from the 2006 Australian Census. For the sample characteristics, N=64 in the case of population and percent-age males. N=55 for all other variables. Community data are for the Indigenous Local Area for that community. For the missingobservations, a suitably granular spatial unit could not be identified in the Census data.
46
Table 4: The Effect of Income Management on School Attendance: OLSRegression Results
(1) (2) (3) (4)
Panel A: Single treatment identifier
Treatment -0.015∗∗∗ -0.021∗∗∗ -0.018∗∗∗ -0.018∗∗∗
(0.003) (0.004) (0.003) (0.003)
Panel B: Treatment effect by time since income management commenced
<30 days ago -0.037∗∗∗ -0.011∗∗ -0.020∗∗∗ -0.020∗∗∗
(0.004) (0.004) (0.004) (0.004)
30-59 days ago -0.034∗∗∗ -0.021∗∗∗ -0.031∗∗∗ -0.029∗∗∗
(0.004) (0.005) (0.004) (0.004)
60-89 days ago -0.052∗∗∗ -0.033∗∗∗ -0.041∗∗∗ -0.038∗∗∗
(0.005) (0.005) (0.005) (0.005)
90-119 days ago -0.054∗∗∗ -0.031∗∗∗ -0.032∗∗∗ -0.030∗∗∗
(0.004) (0.006) (0.005) (0.005)
120-149 days ago -0.041∗∗∗ -0.027∗∗∗ -0.021∗∗∗ -0.019∗∗∗
(0.004) (0.006) (0.005) (0.005)
150+ days ago -0.006∗∗ -0.005 -0.003 -0.005(0.003) (0.007) (0.004) (0.004)
School FE Y Y YTime FE YTime trend Y YSchool-Term FE Y YSchool×Term Y YSchool×Time trend YTime trend×Term YSchool×Term×Time trend YGrade FE Y Y YDay of the week FE Y Y Y
N 3575294 3575294 3575294 3575294R2 0.001 0.092 0.094 0.101
Notes: Cluster robust (student level) standard errors reported in parentheses. The dependent variable isan indicator for whether the student attended school for the whole day at time t. The estimation sampleis an unbalanced panel of all students in grades 1-12 enrolled in the NT public education system dur-ing the period 2006-2009 (inclusive). The full set of available controls include school fixed effects, timefixed effects (day level), a linear time trend, grade fixed effects (grades 1-12), day of the week fixed ef-fects (Monday-Friday) and school-term fixed effects. There are four school terms per year; in 2007 theschool terms were as follows: term 1 – 29 January-5 April; term 2 – 16 April-22 June; term 3 – 23 July-28September; and term 4 – 8 October-14 December. These dates are similar for other years. Panel A andPanel B are the results of separate OLS regressions. *,** and *** is statistical significance at the 10%,5% and 1% level respectively.
47
Table 5: The Effect of Income Management on School Attendance by Gender, SchoolLevel and School Attachment: OLS Regression Results
Notes: Cluster robust (student level) standard errors reported in parentheses. All results are based on OLS estimation ofthe extended version of Eq. 3. The dependent variable is an indicator for whether the student attended school for thewhole day at time t. The regression includes a full set of interactions between i) school fixed effects, ii) school-term fixedeffects, and iii) a linear time trend (see Model 4 of Table 4), for the relevant sub-sample of students. The estimation sam-ples come from an unbalanced panel of all students in grades 1-12 enrolled in the NT public education system during theperiod 2006-2009 (inclusive). a High and low attendance students: The latent individual propensity to attend school foreach student is predicted by backing-out the individual fixed effects after estimating Model 4 (including interactions withtime since policy onset) by OLS regression using all available time series data on school attendance for each student. Lowattendance students have a latent propensity smaller than the median; high attendance students have a latent propensityequal or greater than the median. *,** and *** is statistical significance at the 10%, 5% and 1% level respectively.
48
Table 6: Number of Communities (Proportion of Total Selected) to Receive Major NTERMeasures July 2007–July 2008
Leases 27 (39.7) 27 (39.7) 65 (95.6) 68 (100.0)All CCU works completed 0 (0.0) 0 (0.0) 0 (0.0) 72 (98.6)
Governance
GBMs 12 (14.8) 67 (82.7) 81 (100.0) 81 (100.0)
Source: Yu et al. (2008). Figures for each quarter are the cumulative number of communities that received the measure by theend of that quarter. The percentage of communities to have received the measure relative to the target number of communitiesis in parentheses. For details on each measure see Table A1.
49
Table 7: The Effect of Income Management on School Atten-dance Controlling for Basics Card: OLS Regression Results
(1) (2) (3)
<30 days ago -0.036∗∗∗ -0.020∗∗∗ -0.020∗∗∗
(0.004) (0.004) (0.004)
30-59 days ago -0.033∗∗∗ -0.031∗∗∗ -0.029∗∗∗
(0.004) (0.004) (0.004)
60-89 days ago -0.049∗∗∗ -0.043∗∗∗ -0.041∗∗∗
(0.005) (0.005) (0.005)
90-119 days ago -0.049∗∗∗ -0.036∗∗∗ -0.036∗∗∗
(0.005) (0.005) (0.005)
120-149 days ago -0.034∗∗∗ -0.026∗∗∗ -0.028∗∗∗
(0.005) (0.005) (0.005)
150+ days ago 0.005 -0.011∗∗ -0.019∗∗∗
(0.006) (0.005) (0.005)
Basics Card -0.012∗∗ 0.010∗∗ 0.016∗∗∗
(0.005) (0.004) (0.004)
School FE Y YTime trend Y YSchool-Term FE Y YSchool×Term Y YSchool×Time trend YTime trend×Term YSchool×Term×Time trend YGrade FE Y YDay of the week FE Y Y
N 3575294 3575294 3575294R2 0.001 0.094 0.101
Notes: Cluster robust (student level) standard errors reported in parentheses. The de-pendent variable is an indicator for whether the student attended school for the wholeday at time t. The estimation sample is an unbalanced panel of all students in grades1-12 enrolled in the NT public education system during the period 2006-2009 (inclu-sive). Basics Card is an indicator for whether t is after this policy was introduced(September 8, 2008). The full set of available controls include school fixed effects, timefixed effects (day level), a linear time trend, grade fixed effects (grades 1-12), day of theweek fixed effects (Monday-Friday) and school-term fixed effects. There are four schoolterms per year; in 2007 the school terms were as follows: term 1 – 29 January-5 April;term 2 – 16 April-22 June; term 3 – 23 July-28 September; and term 4 – 8 October-14December. These dates are similar for other years. Estimates are obtained by OLS.*,** and *** is statistical significance at the 10%, 5% and 1% level respectively.
50
Appendix A
Table A1: Overview of Main Policies Introduced Under the NTER
Welfare reform and employmentIncome management Involved quarantining 50 percent of most welfare payments. Transfer payments subject to income management were:
Newstart allowance; Disability support pension; Parenting payments (partnered/single); Carer allowance; Carer payment;Youth allowance, Age pension; ABSTUDY; Family tax benefits Part A and B. Income management applied to all recipientsof these benefits unless they obtained an exemption. Exemptions could be given to: i) students living away from home orwhose payments are received by a third party; ii) temporary residents to a community; iii) persons who moved indefinitelyaway from a community; iv) persons in the community to assist with the NTER; v) persons with little connection to thecommunity. One-off payments (including the Baby Bonus) were subject to 100 percent income quarantining. Quarantinedincome could not be spent on alcohol, tobacco, pornography or gambling.
Store licence The licensing of community stores was a precondition for the introduction of income management to ensure thatparticipants had at least one local option for buying necessities with their managed funds. To obtain a licence storesneeded to demonstrate sound financial practices with regards to stock and pricing. Centrelink clients could organize toaccess their income management funds at licensed stores, with the store-operator responsible for ensuring the income wasnot spent on prohibited items.
Remote area exemptions(RAEs) lifted
RAEs refer to exemptions given to job seekers on the required obligations in order to receive welfare support. This measurealigned the requirements for urban and rural job seekers.
Community DevelopmentEmployment Projects(CDEP) transition
CDEP is a Government program whereby community members agree to pool unemployment benefits and have them paidas a type of wage in exchange for participation in various local community initiatives. Under the NTER, CDEP was to bephased out. However, the decision was overturned in April 2008 and CDEP was reinstated.
Community EmploymentBrokers (CEBs)
CEBs were employed to coordinate employment services under the NTER until mid-2009.
Education and child healthChild health checks Child health checks involved clinicians visiting areas covered by the NTER and conducting voluntary health assessments of
children aged 15 years and under. Under the measure between 57-65 percent of eligible children were seen by a physician(Matheson & Hardie-Boys, 2011).
School nutrition Under this measure, schools provide breakfast and lunch to students, paid for by parents.Accelerated literacy A teaching program for enhancing literacy skills across all ages.Quality teacher package(QTP)
The QTP is a professional development framework focused on improving the skills of local Indigenous staff in communities.
Law and OrderBanning alcohol Serious penalties associated with possession, use and supply of alcohol in affected communities.Banning pornography Made it an offence to possess or supply pornographic publications, videos or refused classification material.Night patrols Night patrols are community led services that aim to resolve issues of conflict and crime in a culturally appropriate way.
The exact operation and role of night patrols is fluid and differs across communities.Extra police Additional police officers were placed in some communities.
51
THEMIS police station Operation THEMIS involved the construction new police stations in 18 communities.
Family supportSafe house Additional safe houses were constructed or expanded. Safe houses provide sanctuary to people escaping family violence.
Funding was also allocated to cooling off houses, which are used by people to avoid committing family violence.Remote Aboriginal familyand community workers(RAFCWs)
These workers provide support and community education in the area of child protection. RAFCWs were placed in 13communities and provided outreach services to a further 20 communities (FAHCSIA, 2011).
Child special services Under this measure an Aboriginal Mobile Outreach Service was established, which involved teams of counsellors and socialworkers who provided support to children, adolescents and families in matters of sexual assault.
Housing and LandLeases Compulsory five-year leases were used by the Australian Government as a legal basis for undertaking infrastructure and
community service projects on Aboriginal land.All Community Clean Up(CCU) works completed
Funding was provided for several measures to improve the safety and condition of existing buildings. These includedproperty assessments, minor vital repairs, make safe works and an asbestos survey.
GovernanceGovernment BusinessManagers (GBMs)
GBMs were employees of the Department of Families, Housing, Community Services and Indigenous Affairs (AustralianGovernment) who were allocated to NTER communities and tasked with coordinating all Government services for thatcommunity.52
Table A2: Mobility Patterns of Students in Income-Managed Communities: Number ofStudents by Year (Proportion of Total Enrolled)
2006 2007 2008 2009
No. of students who move IM to IMa 726 862 1065 1264(14.4) (14.6) (16.0) (17.4)
No. of students who move IM to non-IMb 654 783 970 989(12.9) (13.3) (14.6) (13.6)
No. of students who move non-IM to IMc 558 729 917 1008(11.0) (12.4) (13.8) (13.9)
No. of students who join NT Education Systemd 629 725 691 665(12.4) (12.3) (10.4) (9.1)
No. of students who leave NT Education Systeme 562 558 695 797(11.1) (9.5) (10.4) (11.0)
No. of students with no movesf 2838 3347 3653 3975(56.8) (56.1) (54.8) (54.7)
Avg. no. IM to IM moves | at least one move 10.91 11.14 10.11 8.09
Avg. no. IM to non-IM moves | at least one move 3.88 4.73 4.36 4.50
Avg. no. non-IM to IM moves | at least one move 4.36 4.99 4.54 4.43
No. of students enrolledg 5060 5891 6665 7273
Notes: Data are from the NT Department of Education administrative records and the reported statistics are based onthe authors’ calculations. The sample includes students born from 1994 enrolled in schools administered by the NT De-partment of Education operating in communities selected for income management. Figures in parentheses are the numberof students with a relevant move divided by the total number of students enrolled at any stage that year. These figuresdo not sum to 100 since students can experience more than one type of move in a single year. a This is the number ofstudents who at any time during the year changed their enrollment from a NT Government school in an income-managedcommunity to a different NT Government school in a different income-managed community. b This is the number ofstudents who at any time during the year changed their enrollment from a NT Government school in an income-managedcommunity to a different NT Government school in a non income-managed community. c This is the number of studentswho at any time during the year changed their enrollment from a NT Government school in a non income-managed com-munity to a NT Government school in an income-managed community. d This is the number of students who at anytime during the year join the administrative dataset. Students are counted as having joined if they first enter the datasetor return to the dataset after an absence of at least six months. Students who join the sample in grade 1 are not includedin this calculation. e This is the number of students who at any time during the year leave the administrative dataset.Students are counted as having left if they exit the dataset for at least six months. Students who exit the sample in grades11 or 12 are not included in this calculation. f This is the number of students who for the whole year never changetheir enrollment to a school in a different community and do not join or leave the dataset. g This is the total number ofstudents who are enrolled in an NT Government school in an income-managed community at some point during the year.
53
Table A3: The Effect of Income Management on School Attendance, Non-MoversOnly: OLS Regression Results
(1) (2) (3)
Panel A: Single treatment identifier
Treatment -0.017∗∗ -0.010∗∗ -0.008∗
(0.006) (0.005) (0.005)
Panel B: Treatment effect by time since income management commenced
<30 days ago -0.008 -0.016∗∗ -0.015∗∗
(0.006) (0.006) (0.006)
30-59 days ago -0.014∗ -0.021∗∗ -0.017∗∗
(0.008) (0.006) (0.006)
60-89 days ago -0.030∗∗∗ -0.033∗∗∗ -0.029∗∗∗
(0.008) (0.007) (0.007)
90-119 days ago -0.027∗∗ -0.021∗∗ -0.018∗∗
(0.009) (0.007) (0.007)
120-149 days ago -0.023∗∗ -0.009 -0.006(0.009) (0.007) (0.007)
150+ days ago -0.002 0.005 0.004(0.010) (0.006) (0.006)
School FE Y Y YTime FE YTime trend Y YSchool-Term FE Y YSchool×Term Y YSchool×Time trend YTime trend×Term YSchool×Term×Time trend YGrade FE Y Y YDay of the week FE Y Y Y
N 1446422 1446422 1446422R2 0.104 0.105 0.114
Notes: Cluster robust (student level) standard errors reported in parentheses. The dependent variable is an indica-tor for whether the student attended school for the whole day at time t. The estimation sample is an unbalancedpanel of all students in grades 1-12 enrolled in the NT public education system during the period 2006-2009 (inclu-sive) that excludes those students who moved community during this period. Movers are those students who areeither i) enrolled in two or more different schools in different communities during the period (as identified in the NTDepartment of Education school enrollment records) or ii) who join/leave the estimation sample during the period,except for those students entering in grade 1 or exiting in grades 11 or 12. Students are counted as having left ifthey exit the dataset for at least six months. Students are counted as having joined if they first enter the dataset orreturn to the dataset after an absence of at least six months. The full set of available controls include school fixedeffects, time fixed effects (day level), a linear time trend, grade fixed effects (grades 1-12), day of the week fixed ef-fects (Monday-Friday) and school-term fixed effects. There are four school terms per year; in 2007 the school termswere as follows: term 1 – 29 January-5 April; term 2 – 16 April-22 June; term 3 – 23 July-28 September; and term4 – 8 October-14 December. These dates are similar for other years. Estimates are obtained by OLS. *,** and ***is statistical significance at the 10%, 5% and 1% level respectively.