Page 1
Dimensional Insight in THE BI Survey 13
1
Dim
en
sio
na
l Insig
ht in
Th
e B
I Su
rve
y
13 BI SURVEY TH
E
The Customer Verdict
The world’s largest survey of
business intelligence software users
This document is a specially produced
summary by BARC of the headline results for
Dimensional Insight
Page 2
Dimensional Insight in THE BI Survey 13
2
Table of contents
Dimensional Insight in THE BI Survey 13 .................................................................. 3
Introduction ............................................................................................................ 3
Dimensional Insight overview................................................................................. 3
Dimensional Insight customer responses ............................................................... 4
User and use case demographics .......................................................................... 4
Peer Groups .............................................................................................................. 5
The KPIs ................................................................................................................... 6
Summary ................................................................................................................. 21
Page 3
Dimensional Insight in THE BI Survey 13
3
Dimensional Insight in THE BI Survey 13
Introduction
The BI Survey 13 is based on findings from the world's largest and most
comprehensive survey of business intelligence end-users, conducted earlier this
year. In total, 3,149 people responded to The Survey with 2,298 answering a series
of detailed questions about their usage of a named product. Altogether, 30 products
or groups of products received a detailed analysis.
The BI Survey 13 examines BI product selection and usage among users in areas
including business benefits, costs, proportion of employees using the product,
competitiveness, recommendation, innovation, performance, customer satisfaction
and agility.
One thing that all BI deployments ought to have in common is that they should
deliver business benefits. We asked several questions that helped us measure how
successful respondents’ deployments had been. The combined results were then
used as a calibration tool that is widely used throughout The Survey to assess the
correlation between many factors and project success.
Dimensional Insight overview
Dimensional Insight was founded in 1989 and is headquartered in Burlington, MA.
The company was a pioneer in web-based business intelligence with its main
product, The Diver Solution™, first released in 1993.
The company has a worldwide distribution channel, most notably in EMEA but it also
covers South America and the Asia Pacific. The product is also available as an on-
demand solution.
The Diver Solution™ is an end-to-end business intelligence toolset and provides
powerful analytics and dashboard capabilities. It is often used to provide ad hoc
reporting capabilities for end-user oriented data discovery.
Page 4
Dimensional Insight in THE BI Survey 13
4
Dimensional Insight customer responses
This is the third time that Dimensional Insight has featured in The BI Survey and the
results were remarkably strong. It was represented by a total of 61 users in The
Survey. All were using version 6.
User and use case demographics
Product usage
This is more of a mid-market tool but it is used by a high percentage of users across
many scenarios.
93%
93%
64%
64%
54%
41%
38%
33%
3%
3%
25%
15%
8%
28%
33%
26%
Standard/Enterprise Reporting
Ad hoc query
Dashboards
Visual Analysis/Data Discovery
OLAP Analysis
Predictive Analytics/DataMining
Budgeting/Planning
Financial Consolidation
In use Planned
Page 5
Dimensional Insight in THE BI Survey 13
5
Company size (number of employees)
Percentage of employees
using Dimensional Insight
Average 26%
Average of all products
15%
Number of users using
Dimensional Insight
Median 50
Mean 260
On average 26 percent of employees at Dimensional Insight's customers use the
product. This is an impressive figure and well above the average for all products in
The BI Survey 13 (15 percent).
Peer Groups
Peer groups are used to ensure similar products are compared against each other
both in fairness to the vendor and for the benefit of the customer. The groups are
essential to allow fair and useful comparisons of products that are likely to compete.
The peer groups are primarily data-driven and based on how customers say they
use the product.
Dimensional Insight features in the following peer groups:
- Dashboard Vendors
- Ad-hoc Analysis Vendors
- Visual Analysis and Data Discovery Vendors
18%
66%
16%
Less than100
100 - 2500 More than2500
Page 6
Dimensional Insight in THE BI Survey 13
6
The KPIs
The BI Survey 13 provides the reader with well-designed dashboards packed with
concise information using aggregated KPIs, which can be absorbed at a glance. The
KPIs all follow these simple rules:
- Only measures that have a clear good/bad trend are used as the basis for
KPIs
- KPIs may be based on one or more measures from The BI Survey
- Only products with samples of at least 20 - 30 (depending on the KPI) for
each of the questions that feeds into the KPI are included
- Each KPI is normalized so that the overall sample always has a value of
1.0
- The KPIs are calculated so that better-than-average products always
have scores of greater than 1.0, while less good products score less than
1.0. When viewing the peer group KPI charts, note that the average for
each peer group will usually be either higher or lower than 1.0 because
the peer groups are all subsets of the overall sample.
The products are sorted by value, the better the product the higher the value. The
average is displayed as a green bar and separates the products into two groups, the
ones that have performed better than average and the ones that have performed
worse than average.
For more details on the KPIs, see the ‘KPIs and Dashboards’ document.
Page 7
Dimensional Insight in THE BI Survey 13
7
Leading Ad-hoc Analysis Vendor in business benefits
Benefits achieved by projects after implementation
The tool can be used in a variety of different ways.
Leading Visual Analysis & Data Discovery Vendor in goal achievement
The extent to which projects reach the goals initially set
1.25 1.19
1.16 1.13 1.12
1.08 1.06 1.04
1.02 1.00 1.00
0.96 0.91 0.90 0.89 0.89
0.86 0.85 0.85
0.74
Tableau (1)Yellowfin (2)TARGIT (3)Phocas (4)
Dimensional Insight (5)Oracle Essbase (6)Microsoft SSAS (7)
Bissantz (8)Cyberscience (9)
MicroStrategy (10)Average
IBM Cognos TM1 (11)Microsoft Excel (12)
Cubeware (13)SAP BW (14)
IBM Cognos BI (15)Infor (16)
Corporate Planning (17)SAS (18)
SAP BO WebI (19)
Average Ad-hoc Analysis Peer Group
1.07
1.07
1.07
1.03
1.03
1.01
1.00
0.98
0.81
Tableau (1)
Phocas (2)
Dimensional Insight (3)
Cyberscience (4)
QlikTech (5)
Average
TARGIT (6)
SAS (7)
Pyramid (8)
Average Visual Analysis & Data Discovery Peer
Group
Page 8
Dimensional Insight in THE BI Survey 13
8
Leading Ad-hoc Analysis Vendor in business achievement
The extent to which the product delivers business value and helps organizations
achieve their goals
Leading Visual Analysis & Data Discovery Vendor in business achievement
The extent to which the product delivers business value and helps organizations
achieve their goals
Dimensional Insight scored excellent ‘business achievement’ results in the Visual
Analysis and Data Discovery peer group. This is an important result for the company.
1.16 1.10 1.10 1.10 1.09 1.08 1.07
1.03 1.03 1.01 1.00 1.00
0.95 0.94
0.92 0.92
0.89 0.88
0.82 0.81
Tableau (1)Phocas (2)
Yellowfin (3)Dimensional Insight (4)
Oracle Essbase (5)TARGIT (6)Bissantz (7)
IBM Cognos TM1 (8)Cyberscience (9)
Microsoft SSAS (10)MicroStrategy (11)
AverageCubeware (12)
Corporate Planning (13)SAP BW (14)
SAS (15)Infor (16)
IBM Cognos BI (17)Microsoft Excel (18)SAP BO WebI (19)
Average Ad-hoc Analysis Peer Group
1.16
1.10
1.10
1.08
1.03
1.03
1.01
0.92
0.86
Tableau (1)
Phocas (2)
Dimensional Insight (3)
TARGIT (4)
Average
Cyberscience (5)
QlikTech (6)
SAS (7)
Pyramid (8)
Average Visual Analysis & Data Discovery Peer
Group
Page 9
Dimensional Insight in THE BI Survey 13
9
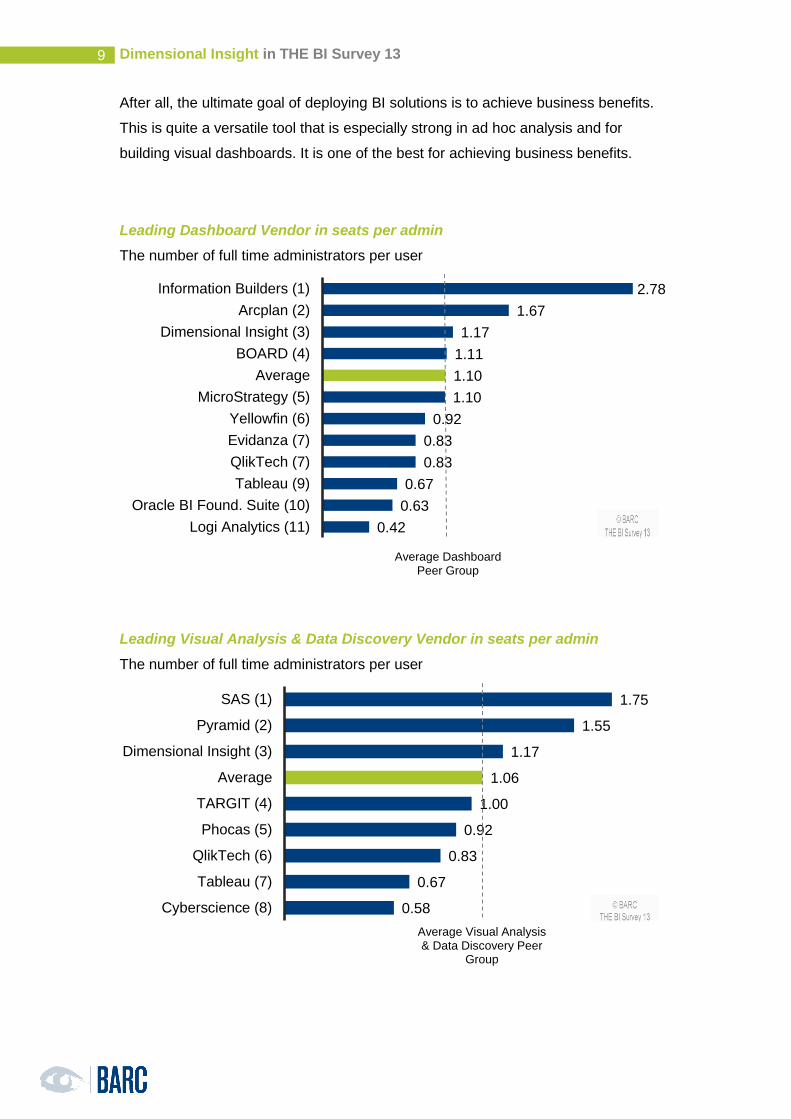
After all, the ultimate goal of deploying BI solutions is to achieve business benefits.
This is quite a versatile tool that is especially strong in ad hoc analysis and for
building visual dashboards. It is one of the best for achieving business benefits.
Leading Dashboard Vendor in seats per admin
The number of full time administrators per user
Leading Visual Analysis & Data Discovery Vendor in seats per admin
The number of full time administrators per user
2.78
1.67
1.17
1.11
1.10
1.10
0.92
0.83
0.83
0.67
0.63
0.42
Information Builders (1)
Arcplan (2)
Dimensional Insight (3)
BOARD (4)
Average
MicroStrategy (5)
Yellowfin (6)
Evidanza (7)
QlikTech (7)
Tableau (9)
Oracle BI Found. Suite (10)
Logi Analytics (11)
Average Dashboard Peer Group
1.75
1.55
1.17
1.06
1.00
0.92
0.83
0.67
0.58
SAS (1)
Pyramid (2)
Dimensional Insight (3)
Average
TARGIT (4)
Phocas (5)
QlikTech (6)
Tableau (7)
Cyberscience (8)
Average Visual Analysis & Data Discovery Peer
Group
Page 10
Dimensional Insight in THE BI Survey 13
10
The tool is able to administer high numbers of mid-market users efficiently. This is an
individual product rather than a technology bundle and one which has a long history.
It therefore offers mature administration functionality which we expect will develop
further over time.
Leading Dashboard Vendor in proportion of employees
Percentage of employees that use the product
3.20
2.54
2.25
1.75
1.42
1.29
1.18
0.87
0.71
0.64
0.62
0.55
Yellowfin (1)
Information Builders (2)
Dimensional Insight (3)
Logi Analytics (4)
Average
BOARD (5)
Evidanza (6)
MicroStrategy (7)
Oracle BI Found. Suite (8)
QlikTech (9)
Tableau (10)
Arcplan (11)
Average Dashboard Peer Group
Page 11
Dimensional Insight in THE BI Survey 13
11
Leading Ad-hoc Analysis Vendor in proportion of employees
Percentage of employees that use the product
Top ranked Visual Analysis & Data Discovery Vendor in proportion of
employees
Percentage of employees that use the product
3.20
2.25
2.22
1.50
1.25
1.11
1.09
0.97
0.94
0.88
0.87
0.85
0.75
0.69
0.67
0.63
0.62
0.35
0.34
Yellowfin (1)
Dimensional Insight (2)
Phocas (3)
TARGIT (4)
IBM Cognos BI (5)
Average
SAP BW (6)
Bissantz (7)
SAP BO WebI (8)
Cubeware (9)
MicroStrategy (10)
Microsoft SSAS (11)
Cyberscience (12)
SAS (13)
Infor (14)
Corporate Planning (15)
Tableau (16)
Oracle Essbase (17)
IBM Cognos TM1 (18)
Average Ad-hoc Analysis Peer Group
2.25
2.22
1.50
1.19
0.83
0.75
0.69
0.64
0.62
Dimensional Insight (1)
Phocas (2)
TARGIT (3)
Average
Pyramid (4)
Cyberscience (5)
SAS (6)
QlikTech (7)
Tableau (8)
Average Visual Analysis & Data Discovery Peer
Group
Page 12
Dimensional Insight in THE BI Survey 13
12
Top ranked Dashboard Vendor in competitive win rate
Based on the percentage of wins in competitive evaluations
As a small vendor the company lacks visibility. But when it’s considered for purchase
it fares well because of the flexibility of its user analysis functionality.
Leading Ad-hoc Analysis Vendor in competitive win rate
Based on the percentage of wins in competitive evaluations
1.68
1.34
1.12
0.99
0.96
0.91
0.87
0.87
0.75
0.74
0.70
Dimensional Insight (1)
Arcplan (2)
Yellowfin (3)
Average
Information Builders (4)
Evidanza (5)
MicroStrategy (6)
Oracle BI Found. Suite (7)
QlikTech (8)
BOARD (9)
Tableau (10)
Average Dashboard Peer Group
1.89
1.68
1.61
1.42
1.28
1.28
0.94
0.75
0.70
Cyberscience (1)
Dimensional Insight (2)
Phocas (3)
Pyramid (4)
Average
TARGIT (5)
SAS (6)
QlikTech (7)
Tableau (8)
Average Visual Analysis & Data Discovery Peer Group
Page 13
Dimensional Insight in THE BI Survey 13
13
Leading Visual Analysis & Data Discovery Vendor in competitive win rate
Based on the percentage of wins in competitive evaluations
Leading Dashboard Vendor in recommendation
How many users would recommend the product to others
1.89
1.68
1.61
1.38
1.30
1.28
1.22
1.16
1.12
1.12
1.11
1.03
1.02
0.94
0.87
0.87
0.81
0.70
0.68
0.59
Cyberscience (1)
Dimensional Insight (2)
Phocas (3)
Microsoft Excel (4)
Bissantz (5)
TARGIT (6)
Microsoft SSAS (7)
Infor (8)
Average
Yellowfin (9)
SAP BO WebI (10)
SAP BW (11)
Oracle Essbase (12)
SAS (13)
MicroStrategy (14)
IBM Cognos TM1 (15)
Cubeware (16)
Tableau (17)
IBM Cognos BI (18)
Corporate Planning (19)
Average Ad-hoc Analysis Peer Group
1.65
1.49
1.41
1.36
1.29
1.16
1.11
1.05
1.05
0.98
0.70
0.64
Yellowfin (1)
Tableau (2)
Dimensional Insight (3)
Logi Analytics (4)
Information Builders (5)
Average
BOARD (6)
Arcplan (7)
MicroStrategy (8)
QlikTech (9)
Evidanza (10)
Oracle BI Found. Suite (11)
Average Dashboard Peer Group
Page 14
Dimensional Insight in THE BI Survey 13
14
Leading Ad-hoc Analysis Vendor in recommendation
How many users would recommend the product to others
Leading Visual Analysis & Data Discovery Vendor in recommendation
How many users would recommend the product to others
It’s clear that users like the product and will recommend it to other companies.
1.65
1.49
1.46
1.41
1.33
1.23
1.20
1.15
1.14
1.12
1.05
1.02
1.02
0.92
0.77
0.62
0.51
0.47
0.44
0.40
Yellowfin (1)
Tableau (2)
Phocas (3)
Dimensional Insight (4)
Bissantz (5)
Cyberscience (6)
Microsoft SSAS (7)
Oracle Essbase (8)
IBM Cognos TM1 (9)
TARGIT (10)
MicroStrategy (11)
Corporate Planning (12)
Average
SAS (13)
Cubeware (14)
IBM Cognos BI (15)
Infor (16)
SAP BW (17)
Microsoft Excel (18)
SAP BO WebI (19)
Average Ad-hoc Analysis Peer Group
1.49
1.46
1.41
1.29
1.24
1.23
1.12
0.98
0.92
Tableau (1)
Phocas (2)
Dimensional Insight (3)
Pyramid (4)
Average
Cyberscience (5)
TARGIT (6)
QlikTech (7)
SAS (8)
Average Visual Analysis & Data Discovery Peer Group
Page 15
Dimensional Insight in THE BI Survey 13
15
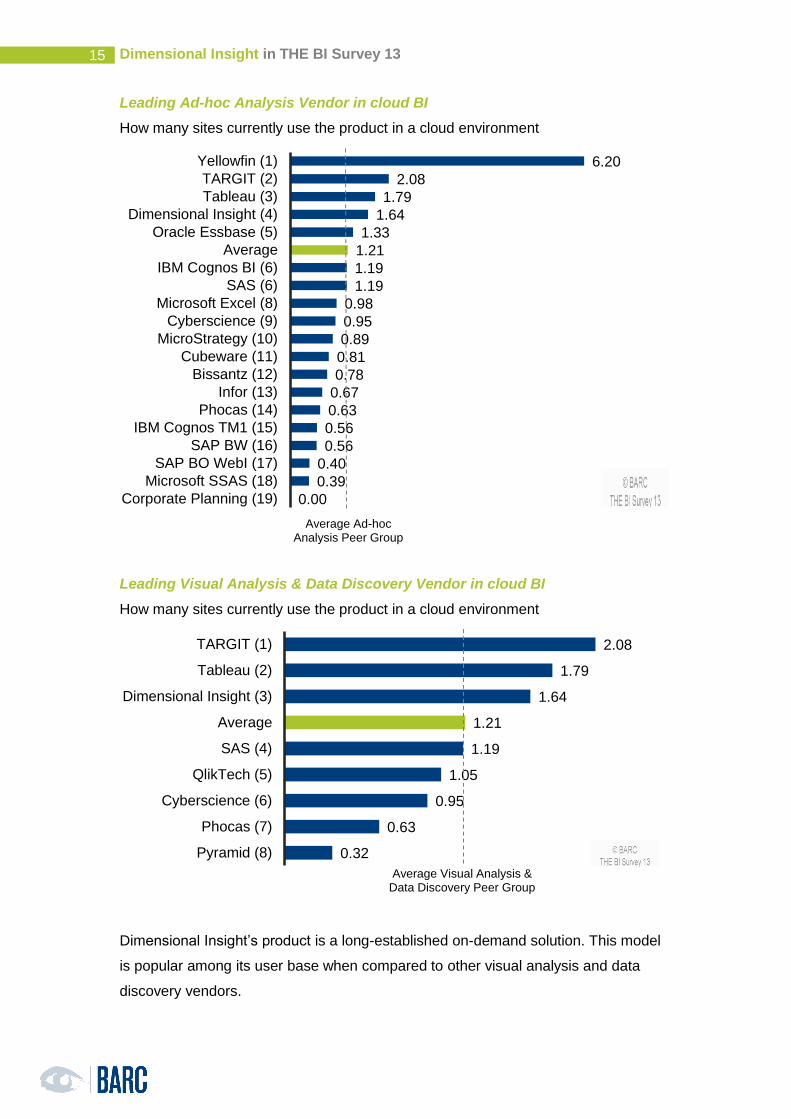
Leading Ad-hoc Analysis Vendor in cloud BI
How many sites currently use the product in a cloud environment
Leading Visual Analysis & Data Discovery Vendor in cloud BI
How many sites currently use the product in a cloud environment
Dimensional Insight’s product is a long-established on-demand solution. This model
is popular among its user base when compared to other visual analysis and data
discovery vendors.
6.20
2.08
1.79
1.64
1.33
1.21
1.19
1.19
0.98
0.95
0.89
0.81
0.78
0.67
0.63
0.56
0.56
0.40
0.39
0.00
Yellowfin (1)
TARGIT (2)
Tableau (3)
Dimensional Insight (4)
Oracle Essbase (5)
Average
IBM Cognos BI (6)
SAS (6)
Microsoft Excel (8)
Cyberscience (9)
MicroStrategy (10)
Cubeware (11)
Bissantz (12)
Infor (13)
Phocas (14)
IBM Cognos TM1 (15)
SAP BW (16)
SAP BO WebI (17)
Microsoft SSAS (18)
Corporate Planning (19)
Average Ad-hoc Analysis Peer Group
2.08
1.79
1.64
1.21
1.19
1.05
0.95
0.63
0.32
TARGIT (1)
Tableau (2)
Dimensional Insight (3)
Average
SAS (4)
QlikTech (5)
Cyberscience (6)
Phocas (7)
Pyramid (8)
Average Visual Analysis & Data Discovery Peer Group
Page 16
Dimensional Insight in THE BI Survey 13
16
Leading Visual Analysis & Data Discovery Vendor in advanced information
design
How many sites currently use advanced information design with their BI tool
Leading Ad-hoc Analysis Vendor in innovation
Combines the ‘Cloud BI’, ‘Collaboration’, ‘Mobile BI’ and ‘Advanced information
design’ KPIs to measure the product’s level of innovation
1.86
1.02
1.00
1.00
0.98
0.97
0.78
0.78
0.63
Tableau (1)
Dimensional Insight (2)
TARGIT (3)
Average
QlikTech (4)
SAS (5)
Pyramid (6)
Cyberscience (7)
Phocas (8)
Average Visual Analysis & Data Discovery Peer Group
2.81
1.71
1.40
1.24
1.23
1.22
1.03
1.03
1.00
0.95
0.92
0.90
0.81
0.78
0.70
0.68
0.67
0.55
0.53
0.46
Yellowfin (1)
Tableau (2)
TARGIT (3)
Dimensional Insight (4)
Bissantz (5)
MicroStrategy (6)
Average
SAS (7)
Phocas (8)
Cyberscience (9)
IBM Cognos BI (10)
Oracle Essbase (11)
Cubeware (12)
Infor (13)
IBM Cognos TM1 (14)
Microsoft SSAS (15)
Microsoft Excel (16)
SAP BO WebI (17)
Corporate Planning (18)
SAP BW (19)
Average Ad-hoc Analysis Peer Group
Page 17
Dimensional Insight in THE BI Survey 13
17
Leading Visual Analysis & Data Discovery Vendor in innovation
Combines the ‘Cloud BI’, ‘Collaboration’, ‘Mobile BI’ and ‘Advanced information
design’ KPIs to measure the product’s level of innovation
Dimensional Insight’s top rank in innovation is an excellent result showing that its
users value the vendor’s ongoing product development work.
Leading Dashboard Vendor in performance satisfaction
How common are complaints about the system’s performance
The product’s architecture is optimized for data analysis.
1.71
1.40
1.24
1.18
1.15
1.03
1.00
0.95
0.71
Tableau (1)
TARGIT (2)
Dimensional Insight (3)
QlikTech (4)
Average
SAS (5)
Phocas (6)
Cyberscience (7)
Pyramid (8)
Average Visual Analysis & Data Discovery Peer Group
1.14
1.10
1.10
1.09
1.08
1.07
1.04
1.03
1.02
0.99
0.97
0.81
Yellowfin (1)
Dimensional Insight (2)
QlikTech (3)
Information Builders (4)
Tableau (5)
Logi Analytics (6)
Average
BOARD (7)
MicroStrategy (8)
Arcplan (9)
Oracle BI Found. Suite (10)
Evidanza (11)
Average Dashboard Peer Group
Page 18
Dimensional Insight in THE BI Survey 13
18
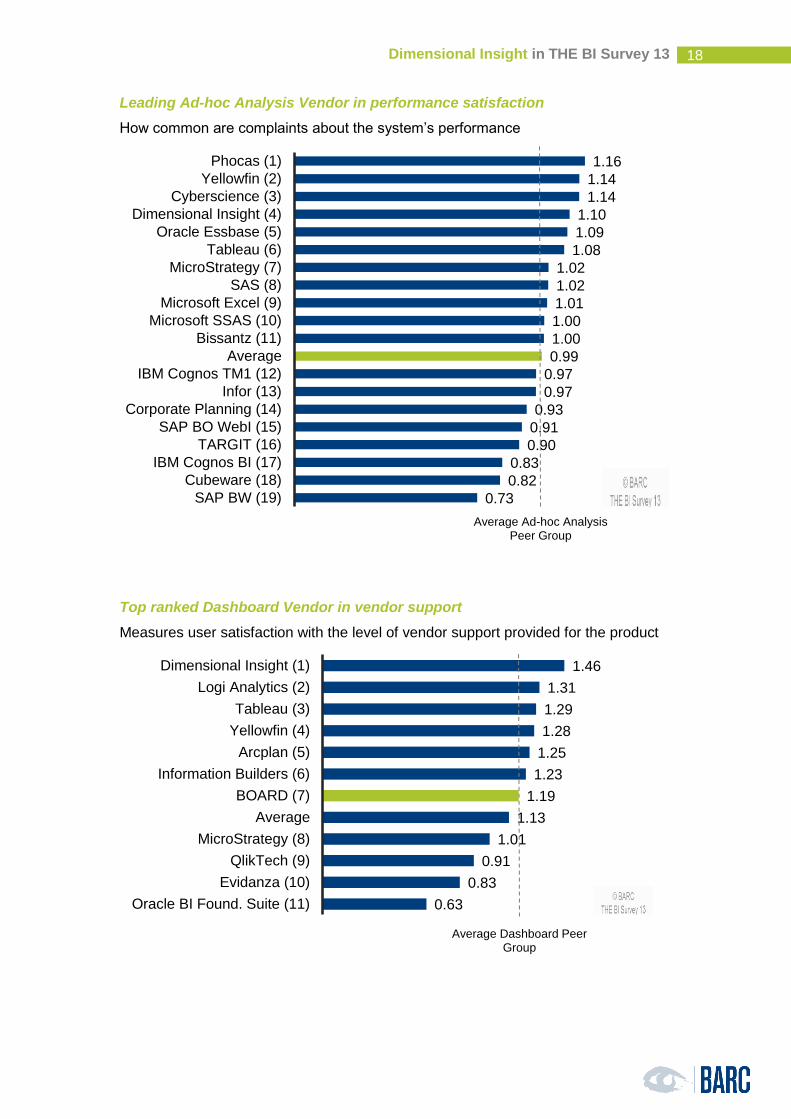
Leading Ad-hoc Analysis Vendor in performance satisfaction
How common are complaints about the system’s performance
Top ranked Dashboard Vendor in vendor support
Measures user satisfaction with the level of vendor support provided for the product
1.16
1.14
1.14
1.10
1.09
1.08
1.02
1.02
1.01
1.00
1.00
0.99
0.97
0.97
0.93
0.91
0.90
0.83
0.82
0.73
Phocas (1)
Yellowfin (2)
Cyberscience (3)
Dimensional Insight (4)
Oracle Essbase (5)
Tableau (6)
MicroStrategy (7)
SAS (8)
Microsoft Excel (9)
Microsoft SSAS (10)
Bissantz (11)
Average
IBM Cognos TM1 (12)
Infor (13)
Corporate Planning (14)
SAP BO WebI (15)
TARGIT (16)
IBM Cognos BI (17)
Cubeware (18)
SAP BW (19)
Average Ad-hoc Analysis Peer Group
1.46
1.31
1.29
1.28
1.25
1.23
1.19
1.13
1.01
0.91
0.83
0.63
Dimensional Insight (1)
Logi Analytics (2)
Tableau (3)
Yellowfin (4)
Arcplan (5)
Information Builders (6)
BOARD (7)
Average
MicroStrategy (8)
QlikTech (9)
Evidanza (10)
Oracle BI Found. Suite (11)
Average Dashboard Peer Group
Page 19
Dimensional Insight in THE BI Survey 13
19
Top ranked Ad-hoc Analysis Vendor in vendor support
Measures user satisfaction with the level of vendor support provided for the product
Top ranked Visual Analysis & Data Discovery Vendor in vendor support
Measures user satisfaction with the level of vendor support provided for the product
These outstanding results are thanks to support for the product provided by the
vendor and its partners.
1.46 1.34
1.30 1.29 1.28
1.19 1.13
1.11 1.09
1.05 1.01
0.97 0.96
0.84 0.83
0.79 0.72
0.56 0.33
0.14
Dimensional Insight (1)Bissantz (2)
Cyberscience (3)Tableau (4)
Yellowfin (5)Phocas (6)
Corporate Planning (7)TARGIT (8)
SAS (9)Cubeware (10)
MicroStrategy (11)Average
Microsoft SSAS (12)Infor (13)
SAP BW (14)IBM Cognos TM1 (15)
IBM Cognos BI (16)Oracle Essbase (17)Microsoft Excel (18)SAP BO WebI (19)
Average Ad-hoc Analysis Peer Group
1.46
1.39
1.30
1.29
1.22
1.19
1.11
1.09
0.91
Dimensional Insight (1)
Pyramid (2)
Cyberscience (3)
Tableau (4)
Average
Phocas (5)
TARGIT (6)
SAS (7)
QlikTech (8)
Average Visual Analysis & Data Discovery Peer Group
Page 20
Dimensional Insight in THE BI Survey 13
20
Leading Dashboard Vendor in implementer support
Measures user satisfaction with the level of the implementer’s support for the product
Leading Ad-hoc Analysis Vendor in implementer support
Measures user satisfaction with the level of the implementer’s support for the product
The company has a clear channel distribution strategy and works hard with its
partners. The vendor is not present in a lot of markets with its own subsidiary,
working mainly with its partners.
1.31
1.27
1.24
1.18
1.15
1.08
1.01
0.99
0.81
0.78
0.68
0.66
BOARD (1)
Arcplan (2)
Dimensional Insight (3)
Yellowfin (4)
Information Builders (5)
Evidanza (6)
Average
QlikTech (7)
MicroStrategy (8)
Tableau (9)
Oracle BI Found. Suite (10)
Logi Analytics (11)
Average Dashboard Peer Group
1.33 1.33
1.28 1.24
1.18 1.12
1.09 1.07
1.04 1.04 1.03 1.03
1.01 1.00
0.87 0.81
0.78 0.77
0.64 0.47
Corporate Planning (1)Bissantz (2)Phocas (3)
Dimensional Insight (4)Yellowfin (5)
Oracle Essbase (6)Microsoft SSAS (7)
Cubeware (8)SAS (9)
IBM Cognos TM1 (10)TARGIT (11)
Cyberscience (12)Average
Infor (13)SAP BW (14)
MicroStrategy (15)Tableau (16)
IBM Cognos BI (17)SAP BO WebI (18)
Microsoft Excel (19)
Average Ad-hoc Analysis Peer Group
Page 21
Dimensional Insight in THE BI Survey 13
21
Leading Visual Analysis & Data Discovery Vendor in implementer support
Measures user satisfaction with the level of the implementer’s support for the product
Summary
Dimensional Insight scores very well in a number of categories in The BI Survey 13.
In each of its peer groups it comes up against highly competitive rivals, and achieves
excellent user ratings in business achievement, competitive win rate, and also
recommendation. These factors contribute to Dimensional Insight’s position as a
leading vendor in customer satisfaction.
Dimensional Insight comfortably tops all its peer groups in the vendor support
category: a resounding vote of confidence from end-users in the level of product
support provided by the vendor and its partners.
On average 26 percent of employees at Dimensional Insight's customers use the
product. This is an impressive figure and well above the average for all products in
The BI Survey 13 (15 percent).
1.28
1.24
1.04
1.03
1.03
1.00
0.99
0.78
0.62
Phocas (1)
Dimensional Insight (2)
SAS (3)
TARGIT (4)
Cyberscience (5)
Average
QlikTech (6)
Tableau (7)
Pyramid (8)
Average Visual Analysis & Data Discovery Peer Group
Page 22
Copyright © BARC GmbH 2013. All rights reserved.
Business Application Research Center - BARC GmbH
Berliner Platz 7
97080 Würzburg
Germany
+49 (0)931 880651-0