+ All Categories
Home > Documents > Dina Mansur Abdat, S.Si, M.Si Head of Sub Directorate...

Dina Mansur Abdat, S.Si, M.Si Head of Sub Directorate...

Date post: 21-Mar-2019
Category:
Upload: hoangliem
View: 218 times
Download: 0 times
Share this document with a friend
11
Dina Mansur Abdat, S.Si, M.Si Head of Sub Directorate Pollution Control for Small Enterprises and Non Point Source MINISTRY OF ENVIRONMENT and FORESTRY (MOEF) REPUBLIC OF INDONESIA Place/Date of Birth: Surakarta Central Java/21 Januari 1970 Education: Faculty of Biology in Gadjah Mada University- Yogyakarta Magister of Public Administration in Gadjah Mada University- Yogyakarta Work Experience : 1996-2000 Environmental Impact Management Agency 2000-2010 Center for Environmental Management Region Bali,East Nusa, West Nusa – MOE 2010-2016 Center for Environmental Management Region Java – MOEF 2017 Directorate for Water Pollution Control-MOEF –Head of Sub Directorate for Pollution Control From Small Scale Enterprises and Non Point Source
Transcript

Dina Mansur Abdat, S.Si, M.SiHead of Sub Directorate Pollution Control for Small Enterprises and Non Point Source

MINISTRY OF ENVIRONMENT and FORESTRY (MOEF)REPUBLIC OF INDONESIA

Place/Date of Birth: Surakarta Central Java/21 Januari 1970Education:Faculty of Biology in Gadjah Mada University- YogyakartaMagister of Public Administration in Gadjah Mada University-YogyakartaWork Experience :1996-2000 Environmental Impact Management Agency2000-2010 Center for Environmental Management Region Bali,East Nusa, West Nusa – MOE2010-2016 Center for Environmental Management Region Java – MOEF2017 Directorate for Water Pollution Control-MOEF –Head of Sub Directorate for Pollution Control From Small Scale Enterprises and Non Point Source

Pollution to river

Domestic waste

Urban farming

Ocean

Industrial waste

Other activities

Kegiatan pertambangan

Livestock

Pollutan source, the receiving water body, total pollutant estimation (especially key parameter) Contribution from each pollution source – priority pollution

control programs/activity

MOEF/Provincial-District intitutionEF / Provincial-

District institution of

MSME

MOEF/Provincial-District intitutionEF / Provincial-

District institution of

MSME

Industry (CSR)Industry (CSR)

Industry Assosiation

Industry Assosiation

Private sector, NGO, universityPrivate sector,

NGO, university

Technical guideline, best

aplicabletechnology for MS enterprise

Technical guidance,

monev

Pilot Project,

replication

MOEF1. MSSE Mapping2. MSSE Database3. Priority Setting

MSSE: Micro Small Scale Enterprises

Source: National Statistical Buareu 2011

48,85%: Livestock,Farmeries, forestry, fisheries mostly micro and small enterprises

Constitution No. 20 year 2008 About Micro, Small, Medium Enterprises :1. Micro: Has a net worth/asset at most

Rp. 50 millions/USD 3.846 excluding lands and buildings. Maximum sale/ year Rp. 300 millions/USD 23.076

2. Small: Has a net worth Rp. 50 millions/USD 3.846 – Rp. 500 millions/USD 38.461 excluding lands and buildings. Maximum sales/year Rp. 300 millions/USD 23.076 - Rp. 2,5 billions/ USD 192.307

3. Medium: Has an asset > rp. 500 millions/ USD 38.461 – rp. 10 billions/USD 769.230. Maximum sales / year > Rp. 2,5 billions/USD 192.307 –Rp. 50 billions/ USD 3.846.153.

*note : 1 USD = Rp. 13.000

Study of MOEF (2015), the potential for water pollution load reduction from MSSE activities ranks third after the domestic and industrial sectors.

Source: Directorate General of Animal Husbandry and Animal Health Ministry of Agriculture, 2017

Tabel 1: Livestock Population

Tabel 3: Potential Pollution Load  from Livestock= unit of livestock X emission factor  X  20% (potential  runoff)

Source: Research Center for Water Resources Development, 2004

Parameter unit Buffalos Cows Horses Pigs Sheeps Goats Chickens Gooses

BOD gr/unit/day

207 292 226 128 55,7 34,1 2,36 2,46

COD 530 717 558 362 136 92,9 5,59 6,67

Parameter unit EF Cow( year 2017)

Potential Pollutan Load From Beef and Dairy cattle (2017)

(17.144.000 x EF x 0,2)

BOD Kg/unit/day 0,292 1.001.209 Kg/day

COD 0,717 2.458.449 Kg/day

Source: 2009 Rural Technology Development Institute in Decreasing Pollution Load - MOE 2014

Parameter unit EF Cow

Potential PollutanLoad From Beef and Dairy cattle (2017)(17.144.000 x EF x

0,2)

Potential PollutanLoad Reduction

(Kg/day)(Population x EF x

0,2) x DE

CO2 Reduction(Pop x 0,008 x

25)

Economic Value from LPG

substitution /day

(Rp 10.000/kg LPG)

=(Pop x 12 x 0,04

x 0,46 x Rp10.000)

BOD Kg/unit/day

0,292 1.001.209Kg/day 500.604 kg/day 3.428.800 kg/day

37.853.952.000 = US 2.911.842

COD 0,717 2.458.449 Kg/day 1.229.224 Kg/day

0,2 = potential runoff0,008 = emision factor methane/cattle 25 = convertion factor (1 kg CO2 equal to 25 kg methane)12 = buffalo feses/day (Kg)0,04 = convertion 1 kg feses equal to 40 liter biogas 0,46 = 1 k g biogas equal to 0,46 LPG

No YEAR LOCATIONAMOUNT OF BUFFALO 

POLUTAN LOAD BOD

(Kg/day)

POLUTAN LOAD REDUCTION 

BOD(Kg/day)

CO2 REDUCTION (Kg/day)

POTENTIAL BENEFIT 

ECONOMI(Rupiah/day)

TOTAL FAMILY

1 2008 KAB. WONOGIRI 616.00 161.39 145.25 80.08

1,360,100.00  148

2 2010 KAB. KULONPROGO 265.00 69.43 62.49 715.50

585,100.00  64

3 2010 KAB. ASAHAN 80.00 20.96 18.86 216.00

176,600.00  19

4 2011 KAB. KULONPROGO 178.00 46.64 41.97 480.60

393,000.00  43

5 2011 KAB. ASAHAN 80.00 20.96 18.86 216.00

176,600.00  19

6 2011 KAB. BLORA 207.00 54.23 48.81 558.90

457,100.00  50

7 2011 KAB. KUDUS 120.00 31.44 28.30 324.00

265,000.00  29

8 2011 KAB. DEMAK 210.00 55.02 49.52

567.00  463,700.00  50

9 2011 KAB. JEPARA 234.00 61.31 55.18 631.80

516,700.00  56

10 2011 KAB. KARANGANYAR 120.00 31.44 28.30 324.00

265,000.00  29

11 2011 KAB. SEMARANG 276.00 72.31 65.08 745.20

609,400.00  66

12 2011 KAB. TEGAL 120.00 31.44 28.30 324.00

265,000.00  29

Pilot Project MOEF 2007-2017 Reduction Polutan Load from Cattle’s Waste Becoming Biogas

No YEAR LOCATIONAMOUNT OF BUFFALO 

POLUTAN LOAD BOD

(Kg/day)

POLUTAN LOAD REDUCTION 

BOD(Kg/day)

CO2 REDUCTION (Kg/day)

POTENTIAL BENEFIT 

ECONOMI(Rupiah/day)

TOTAL FAMILY

13 2011 KAB. BREBES 120.00 31.44 28.30 324.00

265,000.00  29

14 2011 KAB. SUKOHARJO 150.00 39.30 35.37 405.00

331,200.00  36

15 2011 KAB. BANTUL 300.00 78.60 70.74 810.00

662,400.00  72

16 2011 HIVOS 27,798.00 7.283,08 6.554,77

75,054.00  61,370,000.00  6.672

17 2012 KAB. MUSIRAWAS 156.00 40.87 36.78

421.20 344,400.00  37

18 2012 KOTA KUPANG 36.00 9.43 8.49 97.20

79,500.00  9

19 2013 KOTA MATARAM 90.00 23.58 21.22 243.00

198,700.00  22

20 2013 KAB. KARANGANYAR 50.00 6.40 5.76

3.50  110,400.00  12

21 2013KAB. KOTA WARINGIN 

BARAT 44.00 11.53 10.38

118.80  97,200.00  11

22 2013 KAB. OGAN ILIR 60.00 15.72 14.15

162.00  132,500.00  14

23 2014KAB. BANDUNG 

MAJALAYA 45.00  11.79  3.54  121.50  99,360.00  11

24 2015 KAB. BANDUNG 60.00  15.72  4.72  162.00  132,480.00  14

25 2015 KOTA DEPOK 48.00  12.58  3.77  129.60  105,984.00  12

No YEAR LOCATIONAMOUNT OF BUFFALO 

POLUTAN LOAD BOD(Kg/day)

POLUTAN LOAD REDUCTION 

BOD(Kg/day)

CO2 REDUCTION (Kg/day)

POTENTIAL BENEFIT 

ECONOMI(Rupiah/day)

TOTAL FAMILY

26 2015 KAB. BOYOLALI 60.00  15.72  4.72  162.00  132,480.00  14

27 2015 KAB. SUKOHARJO 60.00  15.72  4.72  162.00  132,480.00  14

28 2015 KAB. SIDOARJO 45.00  11.79  3.54  121.50  99,360.00  11

29 2015 KAB. TULUNG AGUNG 60.00  15.72  4.72  162.00  132,480.00  14

30 2015 KOTA MALANG 60.00  15.72  4.72  162.00  132,480.00  14

31 2016 KOTA BLITAR 46.00  12.05  3.62  124.20  101,568.00  11

32 2016 KAB. GORONTALO 47.00  12.31  3.69  126.90  103,776.00  11

33 2016 KAB. BANDUNG 20.00  5.24  1.57  54.00  44,160.00  5

34 2017 KAB. BOJONEGORO 42.00  11.00  3.30  113.40  92,736.00  10

TOTAL 31,903.00  1,068.81 868.72  84,422.88  70,433,944.00  992.99 

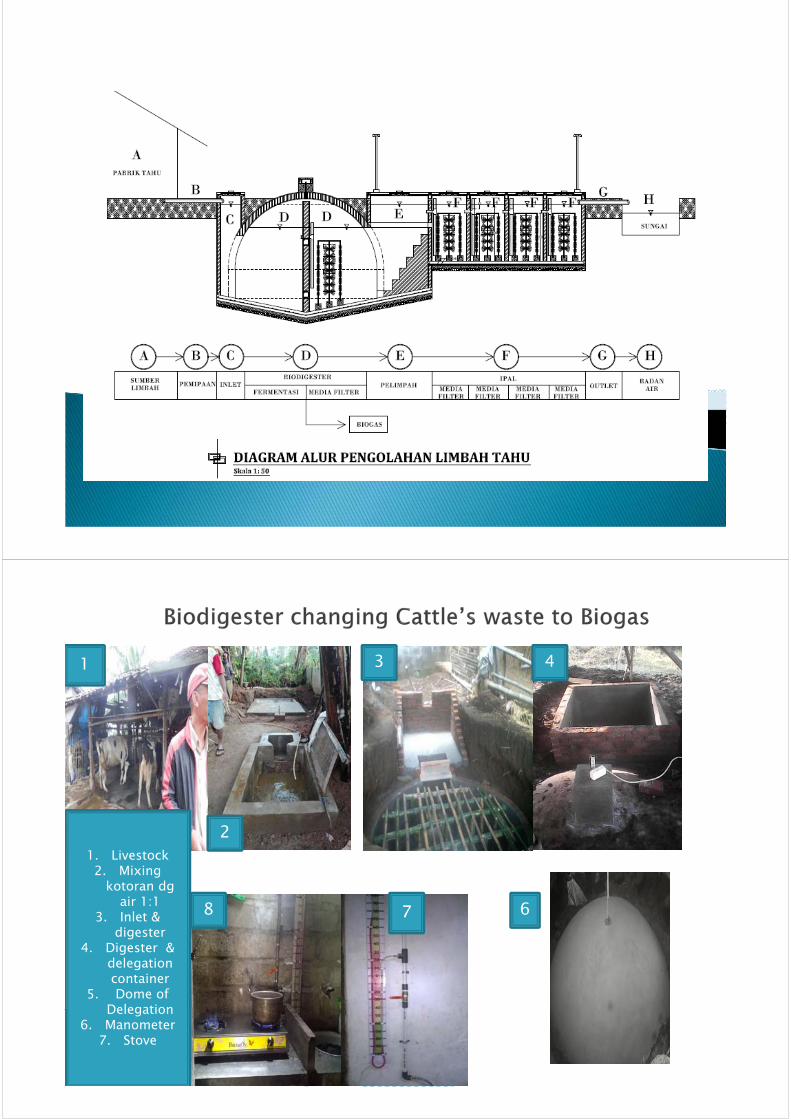
Basic Principal of Biodigester

Cattle’s CageMixing container

(feses + Water=liquid waste)

Inlet BiodigesterDelegation Container

Slurry tank

Bio fertelizer

1. Livestock2. Mixing

kotoran dg air 1:1

3. Inlet & digester

4. Digester & delegation container

5. Dome of Delegation

6. Manometer7. Stove

1 3 4

8 7 6

2

1. Livestock 2. inlet - mixing3. Inlet, Digester I,

Digester delegation container

4. Inlet, Digester, Delegation container

5. Manometer and stove

4

321

5

1. Soil Digging2. Placements

of bricks on the Digester3. inlet

4. Digester is plastered by

cement5. Digester

Delegation container

2

6 5

4

3

1

Technically: there is a constraint because the construction of biodigester generally can not be done independently by cattle ranchers

Economically: the cost for impurities from 4-5 cows is identical to the capacity of 6 M3 digester that costs Rp. 25 million/ US 1,923 (1 cow produced 20-30 Kg feses and urin)

Budget constrain of Provincial/District Environment Institution: Physical infrastructure support for biodigesterhas been provided as pilot project from MOEF by national budget/APBN.

MOEF encourages the establishment of provincial / regency / municipality government policy in developing zonation of micro small enterprises activities so that communal biodigester can be built for waste management into bioenergy

MOEF already develop draft of Ministerial Decree for Pollution Prevention from Micro and Small Enterprises that consist of articles: Design Urban Planning of District Government should take into account zonation to integrating micro and small enterprises and equiped with communal WWTP – Ministerial Decree will declare on 2018

Since 2006-2017 National Budget provide alocation to District Gov through DAK ( Special Budget) to suport infrastructure for biodigester, and will continue. Some Provincial district alocatedlocal budget to replicate biodig

1. Livestock waste maintenance in Indonesia besides to suppress pollution in water bodies also produces biogas as an additional benefit (co benefit)

2. The use of biogas reduces household expenditure to buy cooking fuel (LPG)

3. The potential of conversion of waste to energy in Indonesia is still very open because the number of livestock each year is increasing

4. Cattle waste management in Indonesia should continue to be encouraged in addition to improv water quality as well as supporting Greenhouse Gases emission reduction activities.

1. Livestock and Animal Health Statistics 2017. Publisher: Directorate General of Animal Husbandry and Animal Health Ministry of Agriculture

2. Constitution No. 20 of 2008 on Small, Medium and Micro Enterprises3. Constitution No. 32 of 2009 on Environmental Management4. Central Bureau of Statistics 20115. Reduction of Polutan Load From Small Scale Enterprises, MOE 2014

Ministry of Environment and ForestryRepublic of Indonesia


Recommended