Page 1
SUPPLEMENTARY MATERIALS FOR: 1
Direct evidence for fluid overpressure during hydrocarbon 2
generation and expulsion from organic-rich shales 3
Miao Wang1, 2, Yong Chen1, 3*, Wyatt M. Bain2, Guoqi Song1, Keyu Liu1, Zhenzhu 4
Zhou3 and Matthew Steele-MacInnis2 5
1School of Geosciences, China University of Petroleum (East China), Qingdao, Shandong, 6
266580, China 7
2Dept. of Earth & Atmospheric Sciences, University of Alberta, Edmonton, Alberta, T6G2E3, 8
Canada 9
3Shandong Key Lab. of Depositional Mineralization & Sedimentary Mineral, Shandong 10
University of Science & Technology, Qingdao, Shandong, 266590, China 11
12
ADDITIONAL DETAILS ON METHODS 13
Micro-spectrofluorimetry analysis 14
Fluid inclusion petrographic analysis carried out by using a Leica DM-2700P 15
microscope with transmitted light (TL) and ultra-violet (UV) illumination (365 nm peak of 16
Hg). The wavelength of excitation filter used for the fluorescence is from 340 – 380 nm, and 17
of suppression filter is 425 nm. Micro-spectrofluorimetry was used to study the liquid 18
hydrocarbon phase of individual inclusions under ultra-violet illumination, using a TIDAS 19
MSP 400 miniature fibre optic spectrometer. Parameters λmax (wavelength of maximum 20
intensity), Q(650/500) (the ratio of the intensity at 650 nm to the intensity at 500 nm) and QF-535 21
GSA Data Repository 2020106 https://doi.org/10.1130/G46650.1
Page 2
(the ratio of the 535 – 750 nm flux to the 430 – 535 nm flux) were used to determine the 22
gross compositions of liquid hydrocarbons of entrapped oil and their maturity. 23
Laser Raman spectroscopic analysis 24
Raman spectroscopy of organic matter can be used as an indicator of the thermal 25
maturity. Laser Raman analyses of the median plane and primary bitumen inclusions in 26
BDPVs were performed on a Bruker SENTERRA spectrometer and a 532 nm Ar-ion laser 27
focused to a 1 μm spot through a 100x objective mounted on a petrographic microscope at 28
MacEwan University (Edmonton, AB). All spectra were acquired using a laser power of 20 29
mW and two to three, 5-10s exposures summed to the final reported spectra. A silicon wafer 30
was used for wavenumber calibration. The Raman spectra were acquired and processed by 31
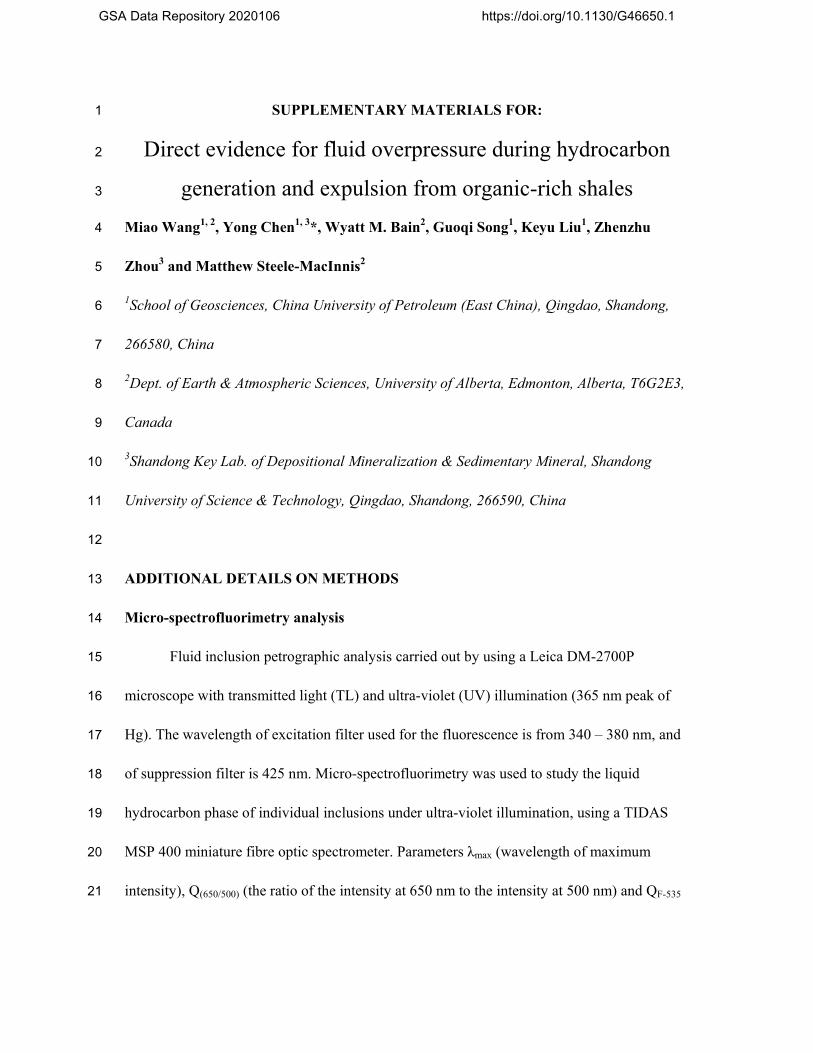
using the LabSpec 5 software by HORIBA. Linear baseline subtraction was performed on a 32
spectra truncated between 1100 and 1800 cm−1 (Fig. DR1A). Following this processing, D1-, 33
D2-, D3-, D4- and G-bands (Fig. DR1B) were fitted by a decomposition using 34
Gaussian-Lorentzian peak shapes, following the procedure described by Sforna et al. (2014). 35
Peak positions, intensities, areas and widths of each band was recorded. Raman spectra have 36
been widely used as proxies to estimate the peak temperatures and thermal maturities 37
experienced by organic matter (Liu et al., 2013; Wilkins et al., 2014; Kouketsu et al., 2014; 38
Schito et al., 2017). In light of the known geological context of our study area, we applied the 39
thermometer established by Kouketsu et al. (2014) based on full width at half maximum of 40
D1-band (FWHM-D1, Eq. 1). Previous testing by Baludikay et al. (2018) has shown that this 41
empirical model provides the best performance for the conditions of diagenesis (i.e., < 200 42
°C). 43
Page 3
T (°C) = -2.15 ∗ FWHM-D1+478. (1) 44
Microthermometry of fluid inclusions 45
Microthermometric studies of fluid inclusions were carried out by using a Linkam 46
THMSG600 heating-cooling stage with temperature calibrated according to the triple point of 47
H2O (0.0 °C) and the critical point of H2O (374.1 °C) using synthetic pure H2O fluid 48
inclusion, and the triple point of CO2 (-56.6 °C) using synthetic CO2 fluid inclusions. For the 49
inclusions measured here, we always conducted the heating measurements (analysis of 50
homogenization temperature, Th) prior to cooling the samples, because the volume fraction of 51
vapor in the aqueous inclusions was small and freezing could have induced stretching, which 52
would affect the measured Th. Thus, by heating prior to cooling, we were able to confidently 53
measure unmodified Th, and determine salinity thereafter by subsequent freezing. During 54
heating from room temperature, both the two-phase hydrocarbon and aqueous inclusions 55
homogenized to liquid. The homogenization temperatures of fluid inclusions in each FIA 56
were obtained by thermal cycling using temperature steps of 1°C as described by Goldstein 57
and Reynolds (1994). For the monophase hydrocarbon inclusions, all inclusions nucleated a 58
gas bubble when temperature reached approximately -60 °C during cooling. After nucleation, 59
the inclusions were re-heated to measure the homogenization temperature. Final ice melting 60
temperatures of aqueous inclusions were obtained after freezing using temperature steps of 61
1°C. The precision of the microthermometry is estimated to be ±0.1°C over the entire 62
temperature range. 63
PVT modeling 64
Page 4
The compositions of the petroleum inclusions were acquired on populations of 65
inclusions by crushing the samples, and analyzing the resulting leachates by chromatography 66
and mass spectrometry (Table DR1). The volume fraction of vapor of the two-phase 67
hydrocarbon inclusions at room temperature were estimated by optical microscopy as 68
described by Roedder (1984), and by digital image analysis. Only the inclusions with regular 69
and equilateral shapes were selected for estimation of the volume fraction of vapor. 70
The thermodynamic calculations of fluid phase equilibria and isochore for 71
hydrocarbon inclusions was done using the Peng-Robinson equation of state as implemented 72
in the computer program PVTsim. The input parameters in these calculations were 1) the 73
hydrocarbon compositions acquired on populations by crush/leach analysis, and 2) the 74
homogenization temperatures of the 5 samples. In these calculations, we followed the method 75
of Aplin et al. (1999). Specifically, we used the PVTsim software to calculate the saturation 76
pressure at the homogenization temperature of the inclusion, and then calculated the total 77
molar volume at the pressure-temperature point of homogenization. The calculated 78
(theoretical) volume fraction of vapor at room temperature was obtained by calculating the 79
conditions at which the molar volume of the mixture at room temperature matched the molar 80
volume calculated at the homogenization temperature. Thus, the representativeness 81
(accuracy) of the measured petroleum composition (measured based on populations, and now 82
compared to the petroleum composition within each individual inclusion) was verified by 83
comparison of the calculated volume fraction of vapor and the measured values obtained by 84
optical microscopy and image analysis. 85
Page 5
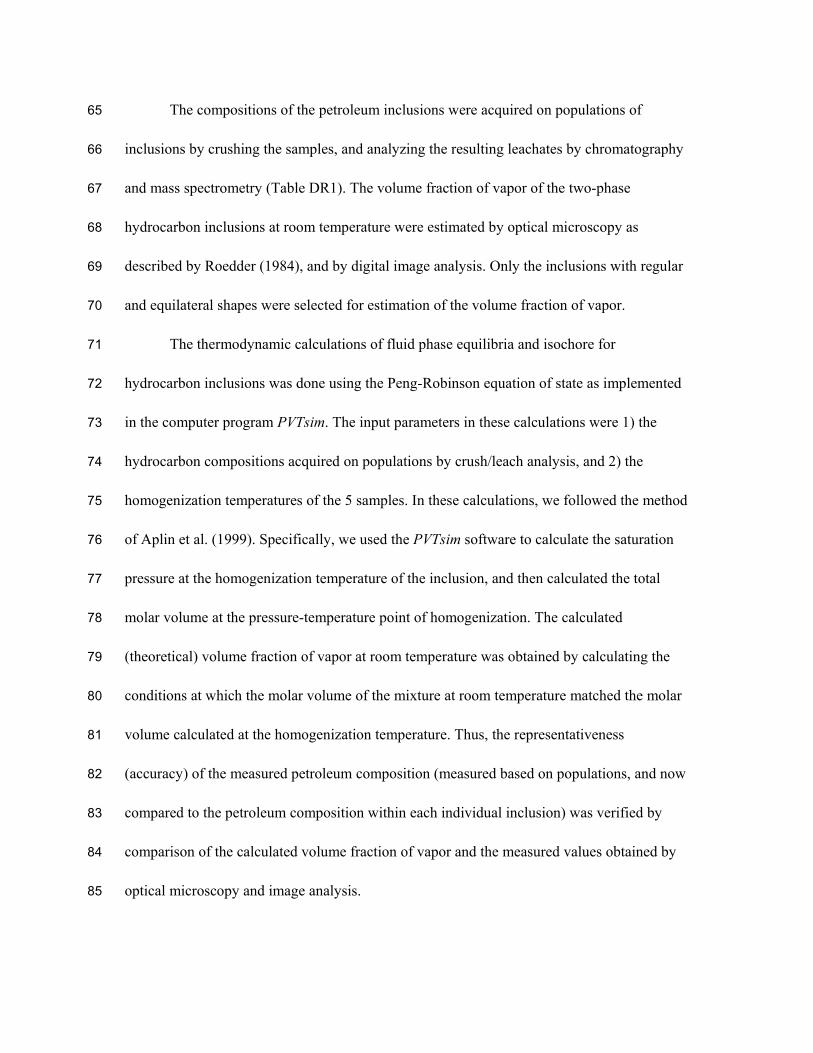
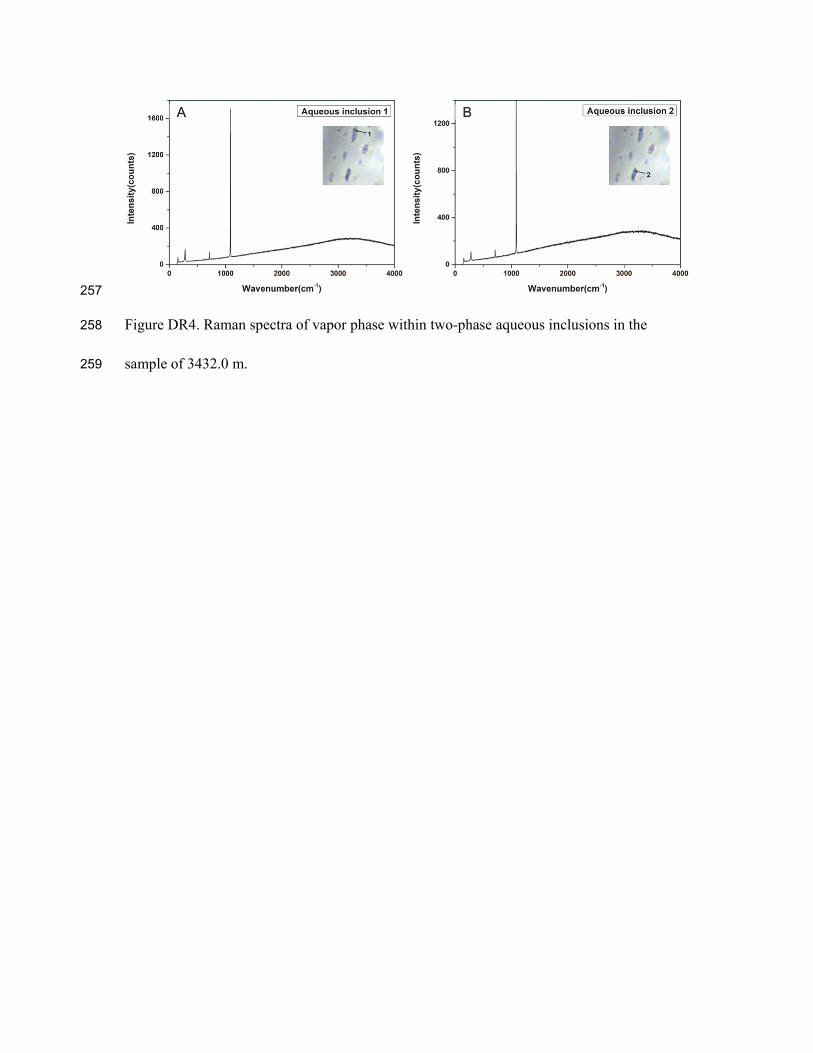
Methane is the most soluble hydrocarbon component in the aqueous phase coexisting 86
with oil phase, and even minor concentrations of CH4 in the aqueous inclusions can greatly 87
influence PVT interpretation (Dubessy et al., 2001; Caumon et al., 2014). However, as 88
described below, no CH4 was detected in the aqueous inclusions by Raman analysis (Fig. 89
DR4). Hence the PVT properties of the aqueous inclusions were modeled based on the 90
H2O-NaCl system. The thermodynamic calculations of phase equilibria and isochore of the 91
aqueous inclusions were based on the model of Steele‐MacInnis et al. (2012), with input 92
parameters of ice melting temperatures and the homogenization temperatures. To determine 93
the trapping pressure, we used the approach of intersecting isochores of coexisting petroleum 94
and aqueous inclusions (Goldstein, 2001). 95
Basin modeling 96
Basin modeling of Well NY-1 was conducted using the Basinmod 1D software. Input 97
parameters in this modeling were: the strata top depth; stratigraphic present thickness; 98
absolute ages; lithology; missing erosional thickness; surface temperature; measured borehole 99
temperatures (BHT); and heat flux during each stage. Modeling based on these parameters 100
was done to generate the standard burial history of the well. A summary of the information 101
upon which this parameterization was based is as follows. 102
The Bohai Bay Basin is located in East China (Fig. 1A), and represents a 103
faulted-depressed basin developed in the Paleozoic cratonic basement, filled by 104
Mesozoic-Cenozoic strata. The Cenozoic strata of the Dongying Depression comprise the 105
Eocene Kongdian Formation (Ek), Eocene Shahejie Formation (Es), Eocene Dongying 106
Formation (Ed), Neogene Guantao Formation (Ng), Neogene Minghuazhen Formation (Nm) 107
Page 6
and the Quaternary Pingyuan Formation (Qp), respectively from bottom to top (Fig. 1B). The 108
tectonic evolution of the basin consists of the syn-rifting stage (65.0-24.6 Ma, during the 109
deposition stage of the Kongdian, Shahejie and Dongying Formations) and post-rifting stage 110
(24.6 Ma to the present, during the deposition stage of Guantao, Minghuazhen and Pingyuan 111
Formations). The syn-rifting stage occurred from the Palaeocene to the Oligocene and can be 112
subdivided into 4 episodes including an initial episode (I), an expansion episode (II), an 113
expansion and rapid subsiding episode (III), and a contraction episode (IV) (Chang, 1991; 114
Xie et al., 2001). A subsequent period of uplift and erosion followed the deposition of the 115
Dongying Formation from 24.6 to 14 Ma, and the contact with the overlying Guantao 116
Formation is a regional unconformity in the study area (Guo et al., 2014). 117
The data we used for the basin modelling are presented in the Table DR4. The input 118
information about the strata top depth, the present thickness, the lithology and the missing 119
erosional thickness of the Well NY-1 was acquired from the well log profile from Shengli Oil 120
Company, SINOPEC. The current heat flux was calculated based on the measured BHT, with 121
the result of 67.3 mW/m2, using the transient heat flux model in the software. The values of 122
the paleo heat flux during the deposition of each formation were from Guo et al. (2012) and 123
Qiu et al. (2014) in the Bohai Bay Basin, from which a good agreement between the 124
measured and calculated Ro and temperature has been verified. An average surface 125
temperature was set at 15 °C for the entire geological time in the modelling (Guo et al., 2012; 126
Qiu et al., 2014). The initial porosity, matrix density, matrix thermal conductivity and matrix 127
heat capacity were adopted from the default values in the Basinmod 1D software. 128
Page 7
After completion of the basin model, the time dependent litho- and hydro-static 129
regimes of the five samples were then deduced from the basin model following the 130
procedures outlined by Bourdet et al. (2010) and Renard et al. (2019). The modelling 131
provides a reconstruction of the pressure-temperature-time trajectory under both hydrostatic 132
and lithostatic regimes throughout the basin evolution. The resulting trajectory in PT space is 133
related to the evolving heat flow, sedimentation and compaction rates through time. 134
Combined with the fluid inclusion data plotted in the same graph, this provides an assessment 135
of the relationship between fluid pressure versus hydrostatic and lithostatic pressures at the 136
time when the fluid inclusions were trapped (Fig. 4 and DR5). 137
138
ADDITIONAL DETAILS ON RESULTS 139
The two-phase hydrocarbon inclusions consist of both a hydrocarbon liquid phase 140
with various UV-fluorescence colors (yellow, yellow-green, green) and a non-luminescent 141
hydrocarbon gas phase (Figs. DR2). The inclusions in any individual FIA show consistent 142
fluorescence colors. In most cases fluorescence of petroleum is used to give a fingerprint of 143
the composition of hydrocarbons and different fluorescence colors indicate variable 144
compositions and maturities of the oil inclusions. Thus, the parameters deduced from the 145
micro-spectrofluorimetry are very sensitive to the chemical compositions and API (American 146
Petroleum Institute) gravity of hydrocarbon in inclusions (Stasiuk and Snowdon, 1997; 147
Bourdet et al., 2014; Nandakumar and Jayanthi, 2016). As for the micro-spectrofluorimetry 148
results, the yellow fluorescence color have relatively high value of λmax (avg. = 568 nm), Q 149
(650/500) (avg. = 0.71) and QF-535 (avg. = 1.99), the yellow-green fluorescence colors exhibit 150
Page 8
lower λmax (avg. = 536 nm), Q(650/500) (avg. = 0.51) and QF-535 (avg. = 1.38), while the green 151
fluorescence colors show the lowest λmax (avg. = 511 nm), Q(650/500) (avg. = 0.39) and QF-535 152
(avg. = 1.09) (Fig. DR2; Table DR2). From yellow to green fluorescence, the heavy 153
components (heterocompounds and aromatic hydrocarbons fraction) decrease, whereas the 154
light components (saturated hydrocarbons fraction) increase with the green fluorescent color 155
indicative of relatively high maturity (Hagemann and Hollerbach, 1986; Munz, 2000). In 156
addition, the spectral shape (Fig. DR2) and the fluorescence parameters (Table DR2) of the 157
individual petroleum inclusions that make up a given FIA are very consistent along the 158
direction of the fiber growth. Thus, the gross degree of maturity of the hydrocarbon fluids in 159
these veins is relatively low, and the liquid hydrocarbon composition remained consistent 160
during the BPFVs growth. 161
Two types of bitumen-bearing inclusions are present in veins. The first is 162
characterized by bitumen which coats the wall of the inclusions with the weak fluorescence 163
intensity (Fig. 3A). The second type coexists with petroleum inclusions within the same FIAs 164
and is difficult to differentiate from monophase aqueous inclusions, based solely on 165
petrography. However, Raman spectra of this second type of inclusions show a strong feature 166
at around 1600 cm−1 and a weaker feature at around 1360 cm−1 (Fig. 3B), which indicates that 167
these are bitumen inclusions. The formation temperatures of these primary monophase 168
bitumen inclusions based on Raman geothermometers range from 133.2 to 157.2 °C (avg. = 169
145.7 °C), which generally overlap with, but extend to slight higher values than the median 170
planes (130.6 to 141.0 °C; avg. = 133.6 °C; Table DR3). This generally suggests that, from 171
the median plane to the vein wall (i.e., along the direction of antitaxial growth) in BPFVs, the 172
Page 9
temperatures were rising due to the increasing burial depth during the hydrocarbon generation 173
and expulsion from organic-rich shales. 174
Verification of the representativeness of the (bulk) composition data used for the 175
thermodynamic calculations of the two-phase hydrocarbon inclusions was as follows. The 176
estimated volume fractions of vapor of the selected hydrocarbon inclusions in five samples, 177
based on optical microscopy and image analysis, were from 5 to 10%. The values obtained 178
from the thermodynamic calculations of the five samples, from shallow to deep, were 179
7.7-10.2%, 6.8-9.4%, 7.4-9.1%, 6.9-11.8% and 7.4-9.4%, respectively. Thus, the calculated 180
volume fractions of vapor at room temperature matched the estimated values, suggesting the 181
petroleum composition data acquired on populations of inclusions in the five samples are 182
accurate representations of the petroleum within the individual inclusions in each sample. In 183
addition, as we mentioned above, the HIs within any individual FIA show consistent 184
fluorescence colors and nearly uniform micro-spectrofluorimetry parameters, which also 185
indicate that the chemical compositions of the HIs are uniform within each FIA during the 186
fiber growth. 187
188
DATA REPOSITORY REFERENCES CITED 189
Baludikay, B. K., François, C., Sforna, M. C., Beghin, J., Cornet, Y., Storme, J. Y., Fagel, N., 190
Fontaine, F., Littke, Ralph., Daniel, B., Delvaux, D., and Javaux, D., 2018, Raman 191
microspectroscopy, bitumen reflectance and illite crystallinity scale: comparison of 192
different geothermometry methods on fossiliferous Proterozoic sedimentary basins (DR 193
Page 10
Congo, Mauritania and Australia): International Journal of Coal Geology, v. 191, p. 80–194
94. 195
Bourdet, J., Burruss, R. C., Chou, I. M., Kempton, R., Liu, K., and Hung, N. V., 2014, 196
Evidence for a palaeo-oil column and alteration of residual oil in a gas-condensate field: 197
Integrated oil inclusion and experimental results: Geochimica et Cosmochimica Acta, v. 198
142. p, 362–385. 199
Chang, C. Y., 1991, Geological characteristics and distribution patterns of hydrocarbon 200
deposits in the Bohai Bay Basin, east China: Marine and Petroleum Geology, v. 8, p. 98–201
106. 202
Guo, X., Liu, K., He, S., Song, G., Wang, Y., Hao, X., and Wang, B., 2012, Petroleum 203
generation and charge history of the northern Dongying Depression, Bohai Bay Basin, 204
China: insight from integrated fluid inclusion analysis and basin modelling: Marine and 205
Petroleum Geology, v. 32, p. 21–35. 206
Guo, X., He, S., Liu, K., Song, G., Wang, X., and Shi, Z., 2010, Oil generation as the 207
dominant overpressure mechanism in the Cenozoic Dongying depression, Bohai Bay 208
Basin, China: AAPG Bulletin, v. 94, p. 1859–1881. 209
Hagemann, H. W., and Hollerbach, A., 1986, The fluorescence behaviour of crude oils with 210
respect to their thermal maturation and degradation: Organic Geochemistry, v. 10, p. 211
473–480. 212
Liu, D., Xiao, X., Tian, H., Min, Y., Zhou, Q., Cheng, P., and Shen, J., 2013, Sample 213
maturation calculated using Raman spectroscopic parameters for solid organics: 214
Page 11
Methodology and geological applications: Chinese Science Bulletin, v. 58, p. 1285–215
1298. 216
Munz, I.A., 2001, Petroleum inclusions in sedimentary basins: systematics, analytical 217
methods and applications: Lithos, v. 55, p. 195–212. 218
Nandakumar, V., and Jayanthi, J. L., 2016, Hydrocarbon fluid inclusions, API gravity of oil, 219
signature fluorescence emissions and emission ratios: an example from Mumbai 220
offshore, India: Energy & Fuels, v. 30, p. 3776–3782. 221
Qiu, N., Zuo, Y., Chang, J., and Li, W., 2014, Geothermal evidence of Meso-Cenozoic 222
lithosphere thinning in the Jiyang sub-basin, Bohai Bay Basin, eastern North China 223
Craton: Gondwana Research, v. 26, p. 1079–1092. 224
Roedder E., 1984, Fluid Inclusions. Mineralogical Society of America: v. 12. 225
Schito, A., Romano, C., Corrado, S., Grigo, D., and Poe, B., 2017, Diagenetic thermal 226
evolution of organic matter by Raman spectroscopy: Organic Geochemistry, v. 106, p. 227
57–67. 228
Sforna, M. C., Van Zuilen, M. A., and Philippot, P., 2014, Structural characterization by 229
Raman hyperspectral mapping of organic carbon in the 3.46 billion-year-old Apex chert, 230
Western Australia: Geochimica et Cosmochimica Acta, v. 124, p. 18–33. 231
Stasiuk, L. D., and Snowdon, L. R., 1997, Fluorescence micro-spectrometry of synthetic and 232
natural hydrocarbon fluid inclusions: crude oil chemistry, density and application to 233
petroleum migration: Applied Geochemistry, v. 12, p. 229–241. 234
Page 12
Wilkins, R. W., Boudou, R., Sherwood, N., and Xiao, X., 2014, Thermal maturity evaluation 235
from inertinites by Raman spectroscopy: the ‘RaMM’ technique: International Journal of 236
Coal Geology, v. 128, p. 143–152. 237
Xie, X., Bethke, C. M., Li, S., Liu, X., and Zheng, H., 2001, Overpressure and petroleum 238
generation and accumulation in the Dongying Depression of the Bohaiwan Basin, China: 239
Geofluids, v. 1, p. 257–271. 240
241
DATA REPOSITORY FIGURES 242
243
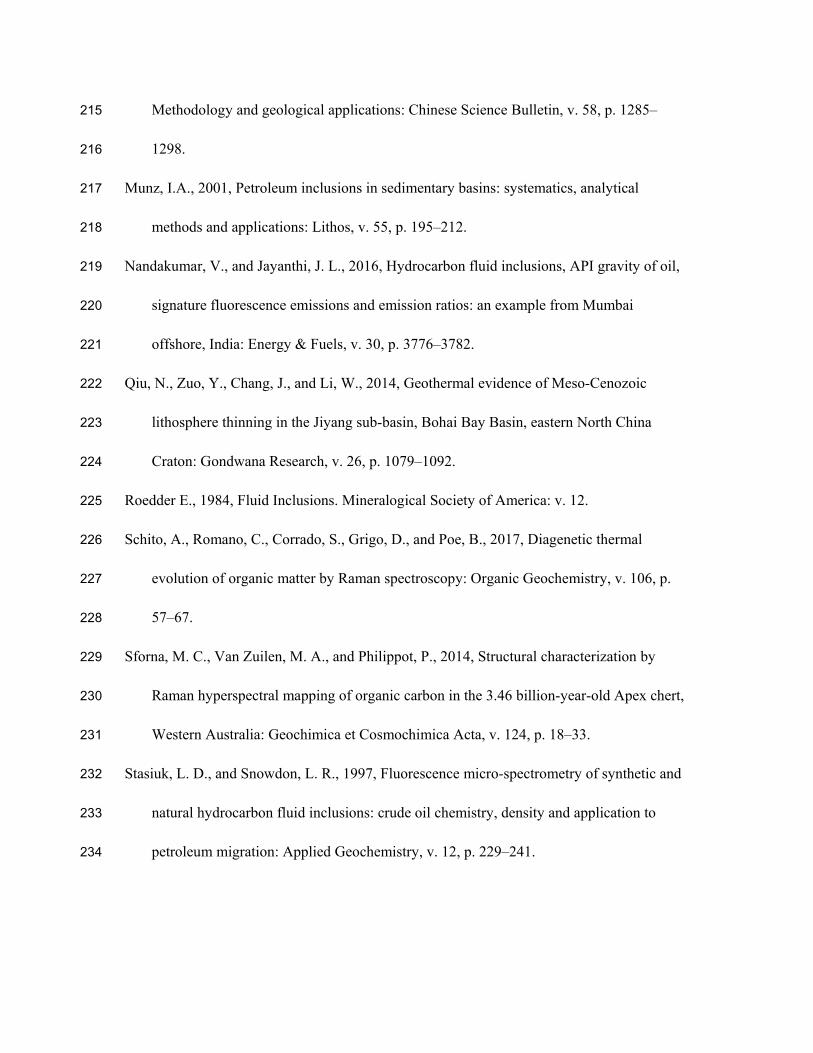
Figure DR1. A: Baseline subtraction of the Raman spectra of bitumen using a third order 244
polynomial curve fit. B: Decomposition of the Raman spectra of bitumen. FWHM-D1 = full 245
widths at half mean for a D1-band. 246
Page 13
247
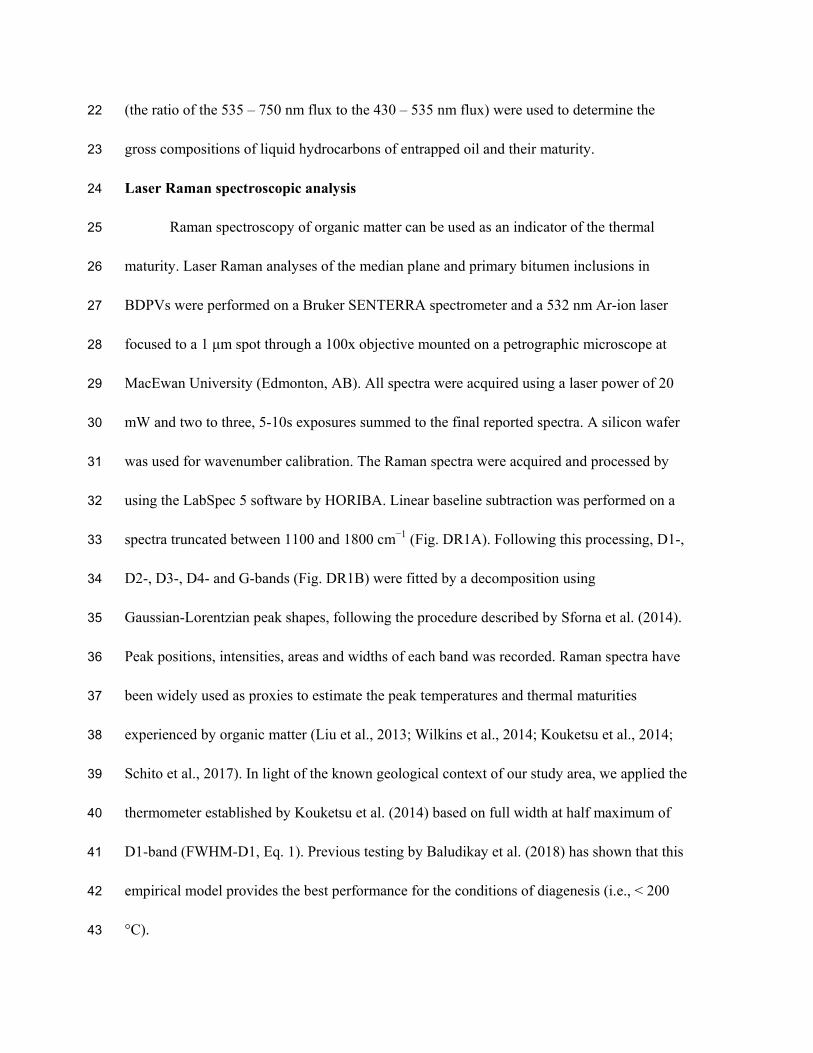
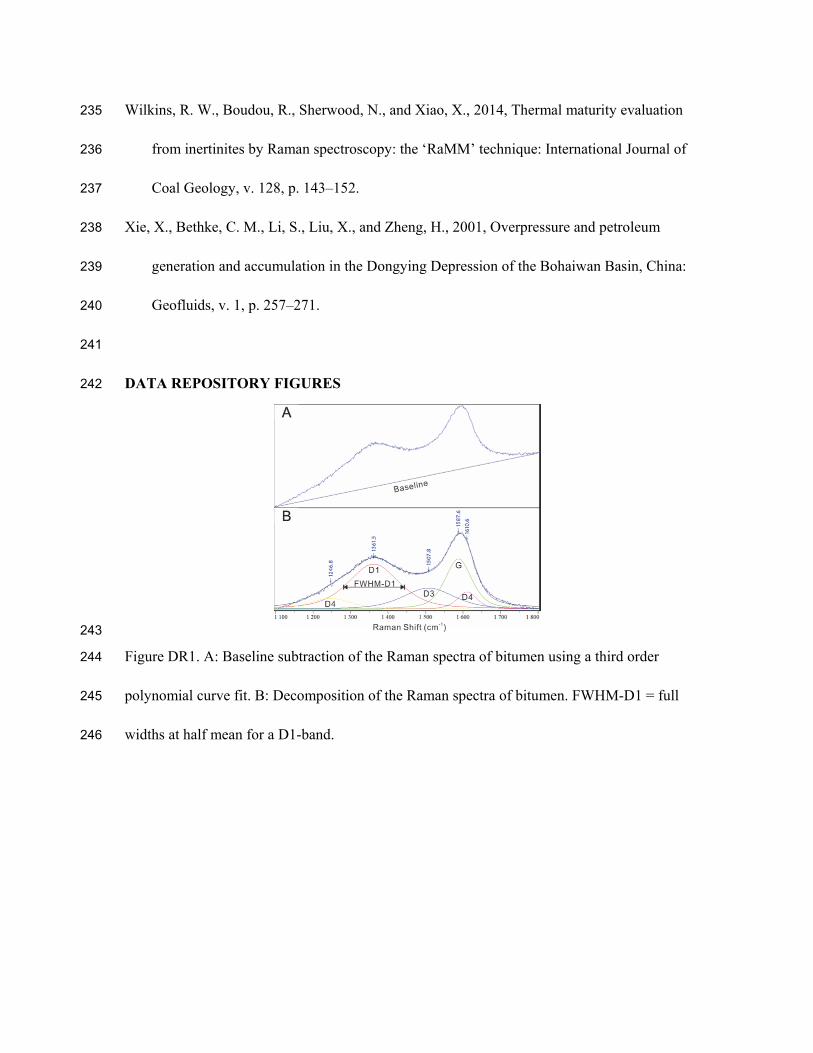
Figure DR2. Fluid inclusions hosted in BPFVs of Well NY-1 and micro-spectrofluorimetry. 248
HI = Hydrocarbon inclusion. A: From 3296.0 m, hydrocarbon inclusions in one FIA showing 249
yellow fluorescence color and their micro-spectrofluorimetry features. B: From 3432.0 m, 250
hydrocarbon inclusions in one FIA showing yellow-green fluorescence color and their 251
micro-spectrofluorimetry features. C: From 3426.0 m, hydrocarbon inclusions in one FIA 252
showing green fluorescence color and their micro-spectrofluorimetry features. 253
254
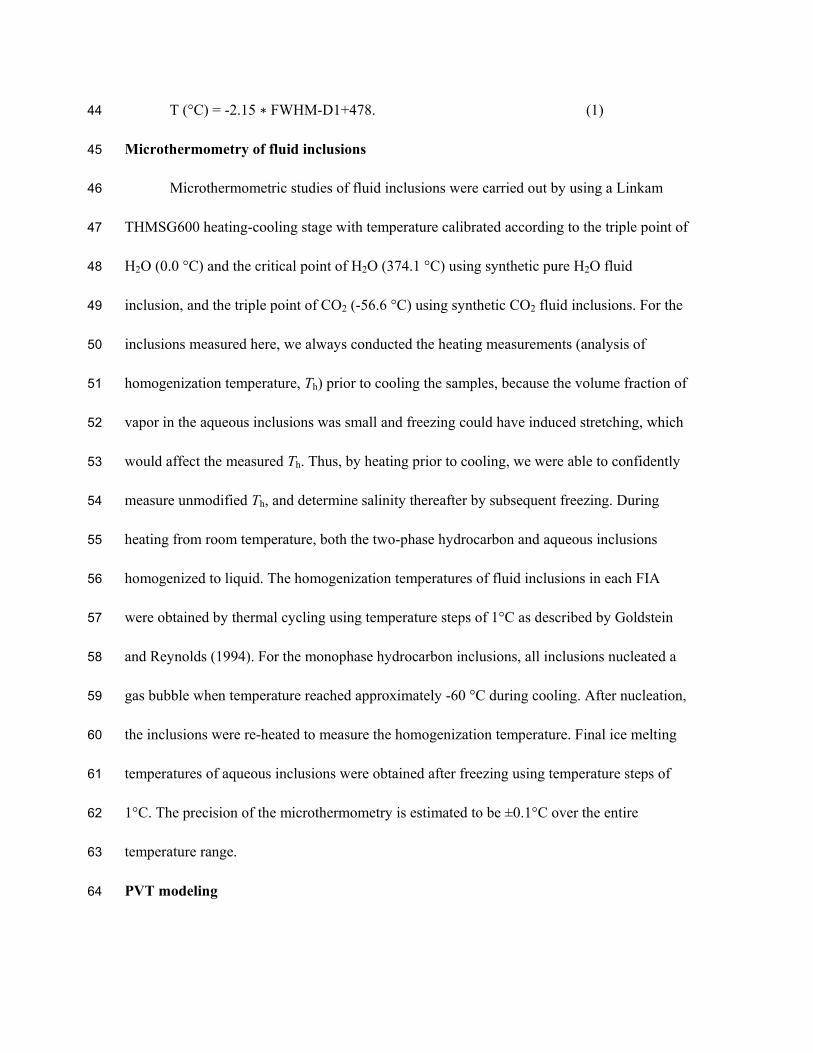
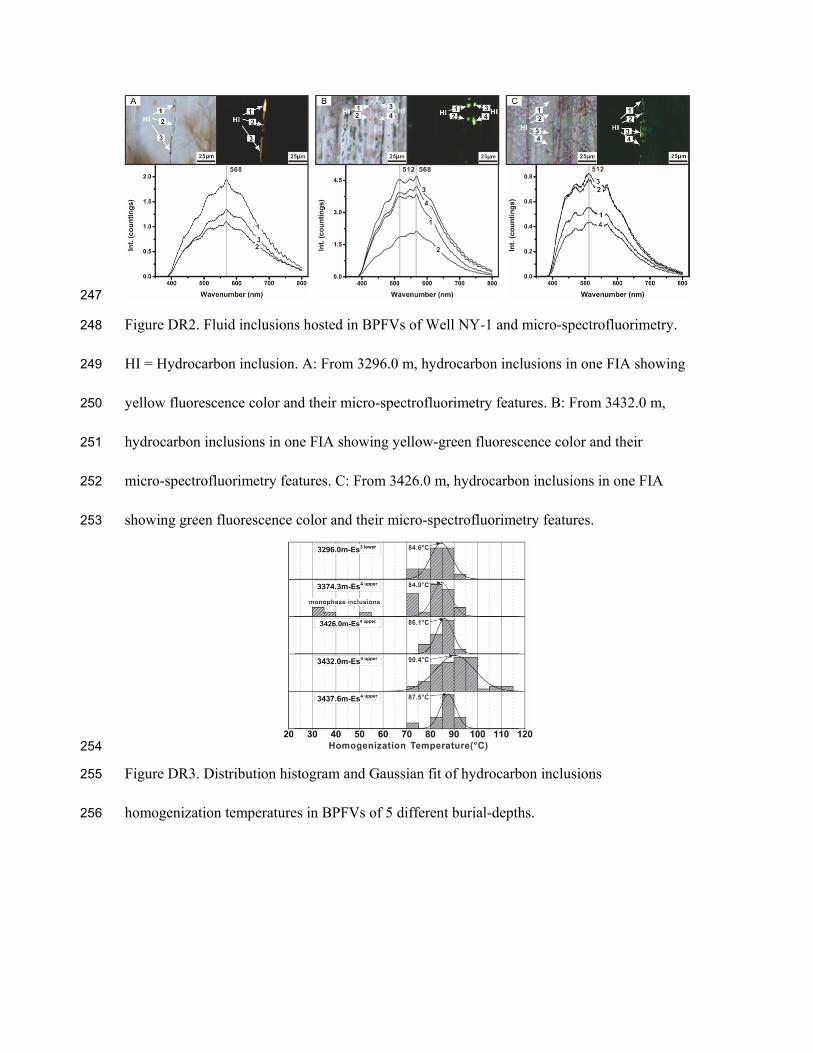
Figure DR3. Distribution histogram and Gaussian fit of hydrocarbon inclusions 255
homogenization temperatures in BPFVs of 5 different burial-depths. 256
Page 14
257
Figure DR4. Raman spectra of vapor phase within two-phase aqueous inclusions in the 258
sample of 3432.0 m. 259
Page 15
260
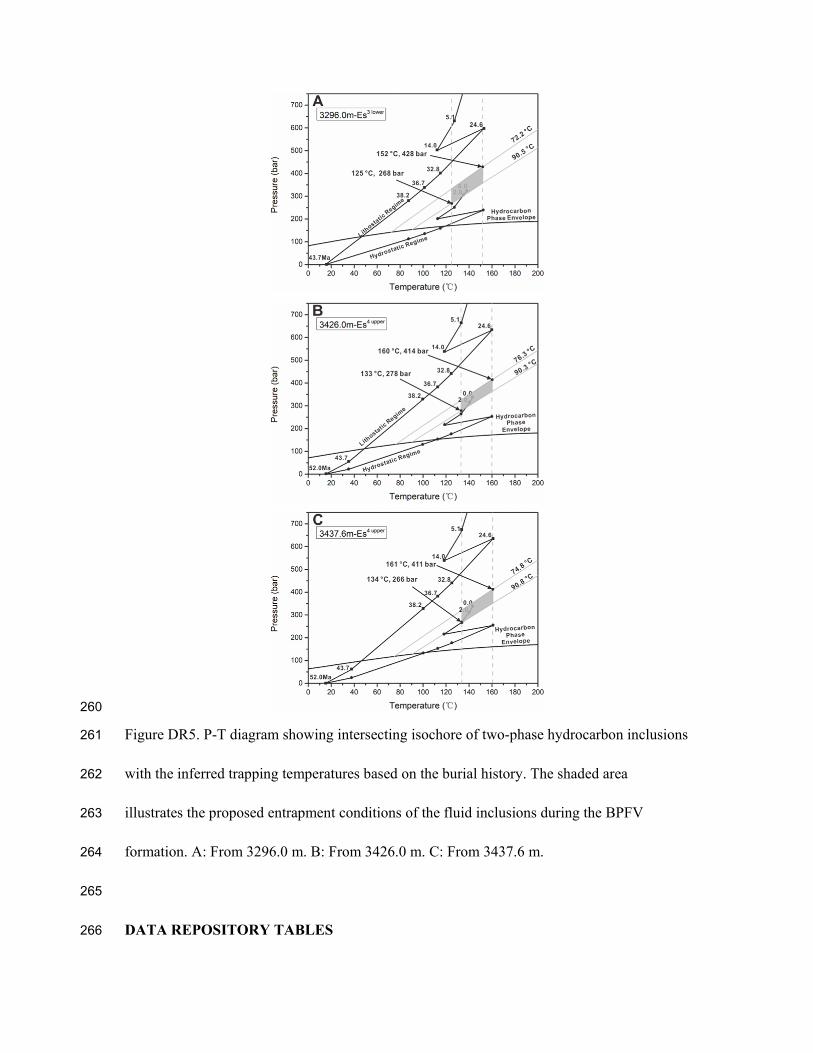
Figure DR5. P-T diagram showing intersecting isochore of two-phase hydrocarbon inclusions 261
with the inferred trapping temperatures based on the burial history. The shaded area 262
illustrates the proposed entrapment conditions of the fluid inclusions during the BPFV 263
formation. A: From 3296.0 m. B: From 3426.0 m. C: From 3437.6 m. 264
265
DATA REPOSITORY TABLES 266
Page 16
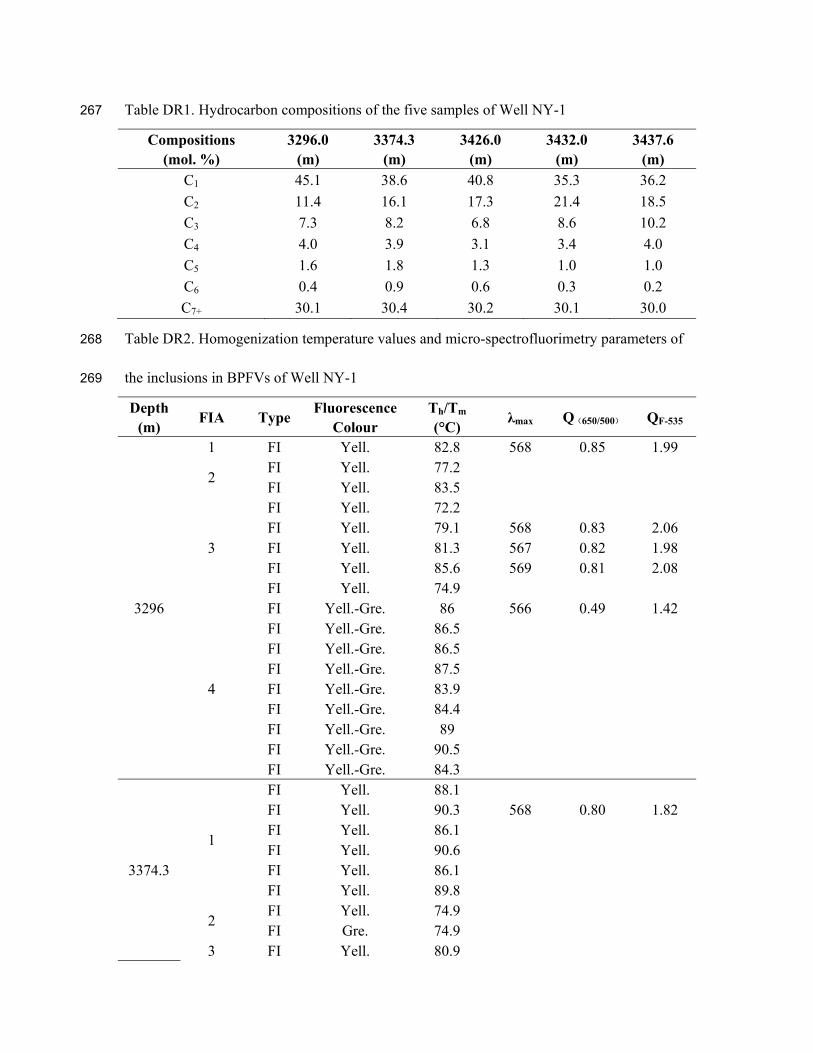
Table DR1. Hydrocarbon compositions of the five samples of Well NY-1 267
Compositions 3296.0 3374.3 3426.0 3432.0 3437.6 (mol. %) (m) (m) (m) (m) (m)
C1 45.1 38.6 40.8 35.3 36.2
C2 11.4 16.1 17.3 21.4 18.5
C3 7.3 8.2 6.8 8.6 10.2
C4 4.0 3.9 3.1 3.4 4.0
C5 1.6 1.8 1.3 1.0 1.0
C6 0.4 0.9 0.6 0.3 0.2
C7+ 30.1 30.4 30.2 30.1 30.0
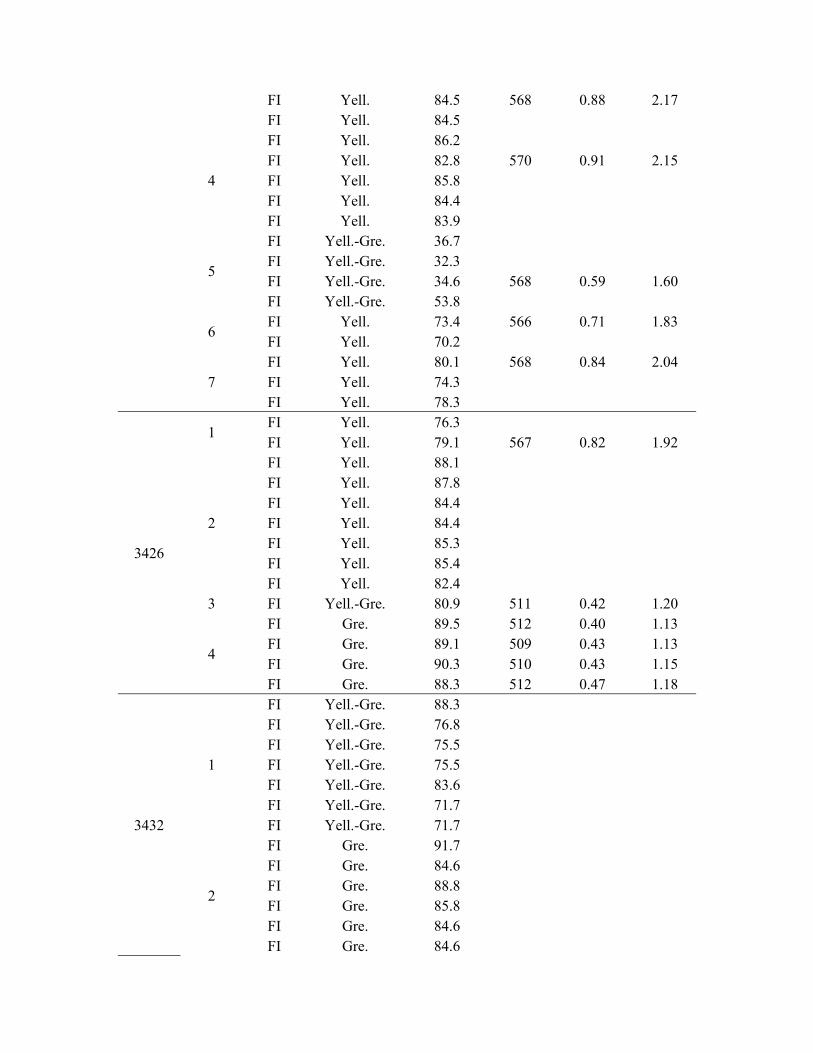
Table DR2. Homogenization temperature values and micro-spectrofluorimetry parameters of 268
the inclusions in BPFVs of Well NY-1 269
Depth (m)
FIA Type Fluorescence
Colour Th/Tm
(°C) λmax Q(650/500) QF-535
3296
1 FI Yell. 82.8 568 0.85 1.99
2 FI Yell. 77.2 FI Yell. 83.5
3
FI Yell. 72.2 FI Yell. 79.1 568 0.83 2.06 FI Yell. 81.3 567 0.82 1.98 FI Yell. 85.6 569 0.81 2.08 FI Yell. 74.9
4
FI Yell.-Gre. 86 566 0.49 1.42 FI Yell.-Gre. 86.5 FI Yell.-Gre. 86.5 FI Yell.-Gre. 87.5 FI Yell.-Gre. 83.9 FI Yell.-Gre. 84.4 FI Yell.-Gre. 89 FI Yell.-Gre. 90.5 FI Yell.-Gre. 84.3
3374.3
1
FI Yell. 88.1 FI Yell. 90.3 568 0.80 1.82 FI Yell. 86.1 FI Yell. 90.6 FI Yell. 86.1 FI Yell. 89.8
2 FI Yell. 74.9 FI Gre. 74.9
3 FI Yell. 80.9
Page 17
FI Yell. 84.5 568 0.88 2.17 FI Yell. 84.5
4
FI Yell. 86.2 FI Yell. 82.8 570 0.91 2.15 FI Yell. 85.8 FI Yell. 84.4 FI Yell. 83.9
5
FI Yell.-Gre. 36.7 FI Yell.-Gre. 32.3 FI Yell.-Gre. 34.6 568 0.59 1.60 FI Yell.-Gre. 53.8
6 FI Yell. 73.4 566 0.71 1.83 FI Yell. 70.2
7 FI Yell. 80.1 568 0.84 2.04 FI Yell. 74.3 FI Yell. 78.3
3426
1 FI Yell. 76.3 FI Yell. 79.1 567 0.82 1.92
2
FI Yell. 88.1 FI Yell. 87.8 FI Yell. 84.4 FI Yell. 84.4 FI Yell. 85.3 FI Yell. 85.4 FI Yell. 82.4
3 FI Yell.-Gre. 80.9 511 0.42 1.20
4
FI Gre. 89.5 512 0.40 1.13 FI Gre. 89.1 509 0.43 1.13 FI Gre. 90.3 510 0.43 1.15 FI Gre. 88.3 512 0.47 1.18
3432
1
FI Yell.-Gre. 88.3 FI Yell.-Gre. 76.8 FI Yell.-Gre. 75.5 FI Yell.-Gre. 75.5 FI Yell.-Gre. 83.6 FI Yell.-Gre. 71.7 FI Yell.-Gre. 71.7
2
FI Gre. 91.7 FI Gre. 84.6 FI Gre. 88.8 FI Gre. 85.8 FI Gre. 84.6 FI Gre. 84.6
Page 18
FI Gre. 83.3
3 FI Gre. 93.4 509 0.43 1.13 FI Gre. 83.2 FI Gre. 86.9
4
FI Yell.-Gre. 84.6 FI Yell.-Gre. 95.8 514 0.54 1.37 FI Yell.-Gre. 86.4 FI Yell.-Gre. 80.6 FI Yell.-Gre. 80.6 FI Yell.-Gre. 88
5
FI Yell.-Gre. 93.8 FI Yell.-Gre. 95.9 FI Yell.-Gre. 92 514 0.49 1.31 FI Yell.-Gre. 97.3 FI Yell.-Gre. 96.9 FI Yell.-Gre. 94.5 FI Yell.-Gre. 95.3 FI Yell.-Gre. 99.9 FI Yell.-Gre. 95.3 FI Yell.-Gre. 97.4 FI Yell.-Gre. 96.2
FI Yell.-Gre. 97.4 FI Yell.-Gre. 97.4 FI Yell.-Gre. 93.8
6 FI Gre. 80.3 516 0.39 1.13 FI Gre. 80.3
7
FI Yell.-Gre. 89.1 566 0.59 1.58 FI Yell.-Gre. 91.5 568 0.63 1.66 FI Yell.-Gre. 90.8 FI Yell.-Gre. 94.5 568 0.58 1.54 FI Yell.-Gre. 91.1 567 0.62 1.62
8
AI 142.4/-22.7 AI 142.4/-23.5 AI 134.1/-23.3 AI 140.2/-23.8 AI 125.2/-22.7 AI 125.2/-21.9 AI 139.5/-22.1 FI Yell.-Gre. 111.3 FI Yell.-Gre. 111.3 FI Yell.-Gre. 85.2 FI Yell.-Gre. 89.6 FI Yell.-Gre. 107.3
Page 19
FI Yell.-Gre. 96.8
9
FI Yell.-Gre. 97.2 FI Yell.-Gre. 106.5 FI Yell.-Gre. 95.3 FI Yell.-Gre. 100.3
10
FI Yell.-Gre. 88.6 FI Yell.-Gre. 86.9 FI Yell.-Gre. 93.4 FI Yell.-Gre. 93.4 FI Yell.-Gre. 91.8 FI Yell.-Gre. 78.9 FI Yell.-Gre. 89.1 FI Yell.-Gre. 91.8
3734.6
1 FI Yell.-Gre. 74.8
2
FI Gre. 81.3 509 0.35 1.03 FI Gre. 86.8 FI Gre. 86.8 FI Gre. 86.4 FI Gre. 83.9
3
FI Yell.-Gre. 87.6 FI Yell.-Gre. 90.8 FI Yell.-Gre. 90.4 510 0.45 1.13 FI Yell.-Gre. 87.3 FI Yell.-Gre. 89.3
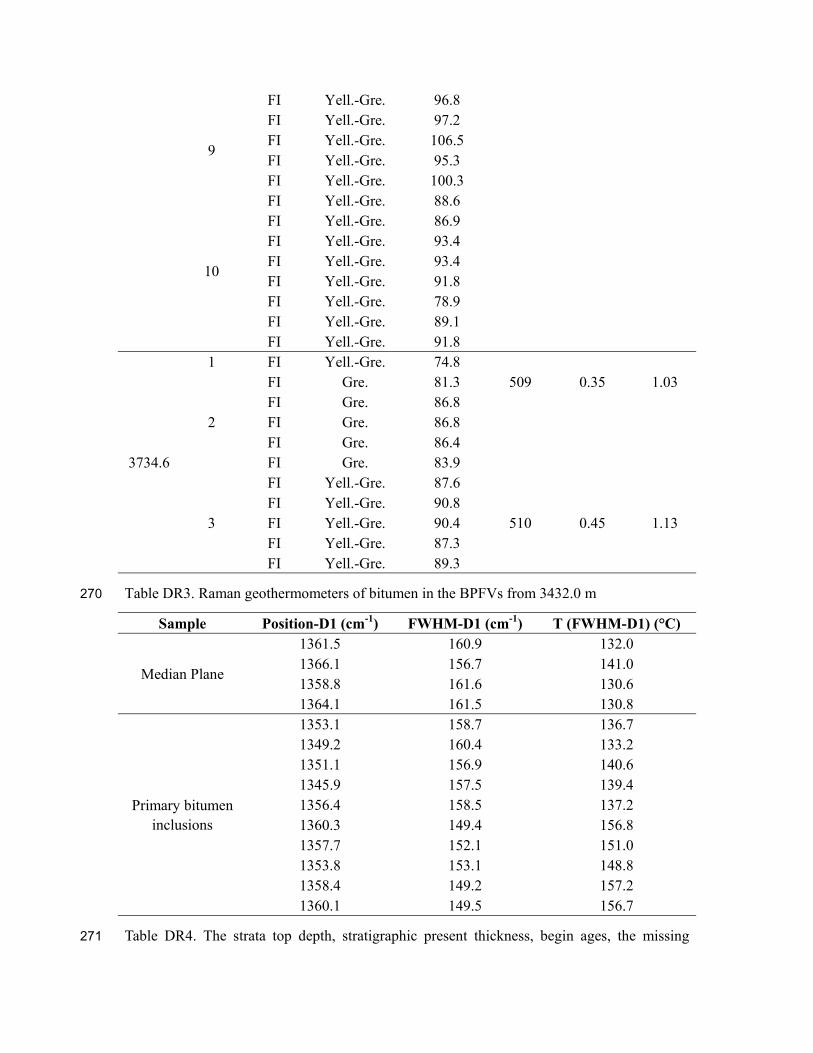
Table DR3. Raman geothermometers of bitumen in the BPFVs from 3432.0 m 270
Sample Position-D1 (cm-1) FWHM-D1 (cm-1) T (FWHM-D1) (°C)
Median Plane
1361.5 160.9 132.0 1366.1 156.7 141.0 1358.8 161.6 130.6 1364.1 161.5 130.8
Primary bitumen inclusions
1353.1 158.7 136.7 1349.2 160.4 133.2 1351.1 156.9 140.6 1345.9 157.5 139.4 1356.4 158.5 137.2 1360.3 149.4 156.8 1357.7 152.1 151.0 1353.8 153.1 148.8 1358.4 149.2 157.2 1360.1 149.5 156.7
Table DR4. The strata top depth, stratigraphic present thickness, begin ages, the missing 271
Page 20
erosion thickness and the heat flux of each formation of Well NY-1 272
Formation Begin age
(Ma) Top
depth (m) Present
thickness (m) Missing
thickness (m) Heat flux (mW/m2)
Q 2 0 300 69 Nm 5.1 300 751 71 Ng 14 1051 471 72.5
Erosion 24.6 -400 84.5 Ed 32.8 1522 564 85.5 Es1 36.7 2086 212 86.5 Es2 38.2 2298 196.5 87
Es3 upper 38.6 2494.5 290.5 88 Es3 middle 42 2785 403 87.5 Es3 lower 43.7 3188 127.98 86.5 Es4 upper 45 3315.98 222.02 85 Es4 below 52 3538 200 84
273