Direct measurementof standing evanescent waves with aphoton-scanning tunneling microscope
Alfred J. Meixner, Martin A. Bopp, and Guido Tarrach
We present a detailed analysis of a standing evanescent wave that is caused by total internal reflection ofan Ar-ion laser beam on a glass prism and investigate the coupling to a subwavelength dielectric tip of aphoton-scanning tunneling microscope that is raster scanned at a close distance over the prismsurface. The intensity of the evanescent field is spatially modulated with a period of 239.2 nm. Itdecays exponentially with a constant of 103.9 nm with increasing distance from the prism surface.Precise measurements of the standing evanescent wave can be used to calibrate the scanner and permitone to determine the spatial resolution and the coupling efficiency of the tip.
1. IntroductionIn recent years different schemes for superresolutionoptical microscopes (SROM's) have been realizedl2
that make it possible to record optical images ofsurfaces with visible light at a spatial resolution wellbelow Abb6's diffraction limit of about half of awavelength. One can achieve this by raster scan-ning a small aperture of subwavelength diameter inclose proximity over the sample surface. Either theaperture can act as a miniature light source when it isilluminated from the back side or it can be a smallprobe, collecting light from the optical near field inthe immediate proximity of the sample. The amountof light that couples through the aperture sensitivelydepends on its diameter and its distance from thesurface and on the local optical properties of thesample.
The principle of the SROM was first proposed in1928 by Synge3 and experimentally demonstrated in1972 by Ash and Nicholls4 in the microwave regionwith a spatial resolution of /60. In the opticalregime the feasibility of the SROM was first demon-strated independently by Pohl et al.5 and by Lewis etal.6 Since then several different types of near-fieldoptical probes have been developed.7 -'0 Often theendface of a tapered optical fiber or a micropipette
The authors are with the Institute of Physics, University ofBasel, CH-4056 Basel, Switzerland.
Received 19 October 1993; revised manuscript received 18 April1994.
serves as a nanometer-sized aperture, and a lateralresolution of 12 nm has been reported recently."Such a high resolution can be achieved by scanningelectron microscopes, electron scanning tunnelingmicroscopes, and scanning force microscopes. How-ever, the use of visible light adds an important newaspect to scanning probe microscopy: Wavelength-specific' 2 and polarization-sensitivel 3 measurementscan be performed, providing spectroscopic informa-tion about the sample with nanometer spatial resolu-tion.
The use of an evanescent wave that is formed bytotal internal reflection (TIR) of a laser beam at thesample surface was introduced to the SROM byReddick et al. 14 and independently by Courjon et al. The evanescent wave decays from the optically densermedium (the sample) into the medium with lowerrefractive index (which is typically air) within only aquarter of a wavelength. The intensity of the evanes-cent wave is probed by means of a subwavelengthdielectric tip and provides a purely optical distancecontrol mechanism that is sensitive to local changesof the sample topography, the refractive index, andthe polarization.' 6"17 This concept is called photon-scanning tunneling microscopy (PSTM) because of itssimilarity to the tunneling of electrons through asmall gap between a conducting surface and theprobing tip.
Despite the formal analogy with electron tunnel-ing, at a surface where TIR takes place, abrupttopography or refractive-index changes always act assources for scattering and create homogeneous wavesthat are not bound to the surface. The tip probes the
superposition of both the evanescent waves and thehomogeneous waves. Particularly when the topogra-phy or the spatial variations of the refractive indexhave spatial frequencies that are similar to those ofthe homogeneous waves, intense interference pat-terns of homogenous waves that dominate the opticalfield above the surface and significantly complicatethe interpretation of the PSTM images can be pre-sent. 6 17 However, for many applications flatsamples with good surface quality can be prepared tominimize the effect of scattering and homogeneouswaves.
In combination with a spectrometer, the PSTM hasgreat potential as an analytical tool for surface spec-troscopy and fluorescence microscopy, providing spec-tra and hence chemical information of a surfacestructure or a thin film with subwavelength spatialresolution.' 8-2 0 Samples for such applications can beprepared with a very moderate roughness and gener-ally have only small refractive-index changes that actas weak perturbations of the evanescent field. Hereinterference patterns of purely evanescent waves canbe created on purpose in a controlled way as a meansfor in situ calibration of the scanner and the resolu-tion of the tip in a specific measurement.
We present detailed, quantitative PSTM measure-ments and topographic images of standing evanes-cent waves bound to a high-quality glass-air boundary.Images of a plane standing evanescent wave on aprism surface have been measured previously bymeans of a PSTM in the visible2l and very recently inthe near-IR region.22 Here we show how the analy-sis of the standing wave provides a precise calibrationof the scanner and permits one to determine theresolving power and the effective collection efficiencyof the tip. Moreover, such measurements are vitalfor the development of a theoretical understanding ofthe coupling mechanism between the evanescentwave and the tip.23-25
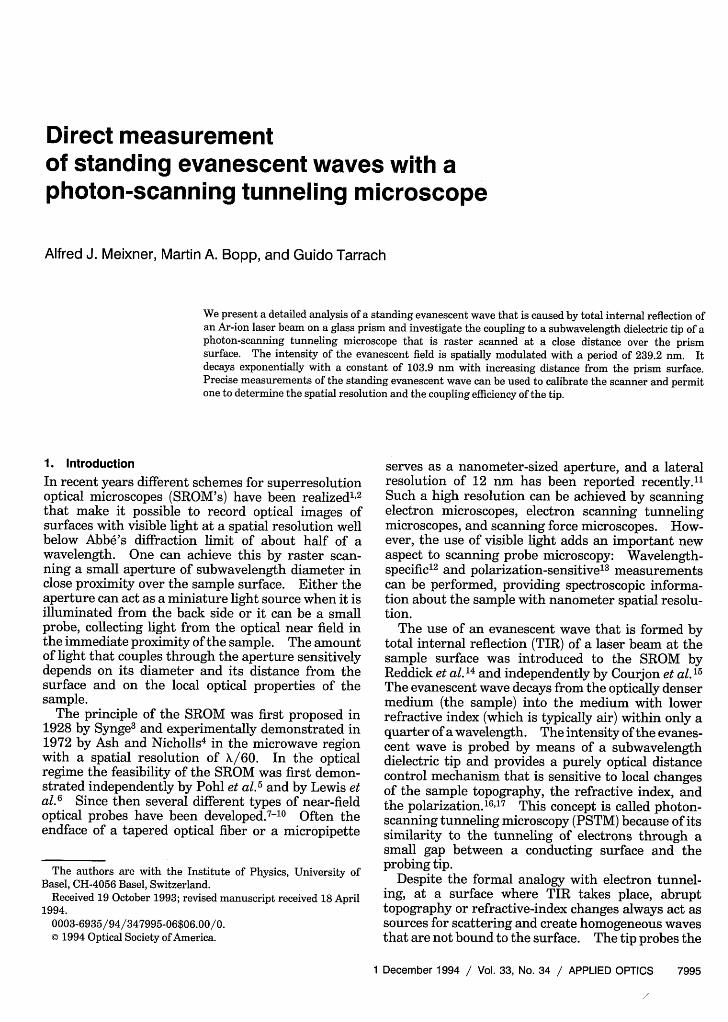
2. Principle of the PSTMThe optical part of the PSTM configuration is sche-matically shown in Fig. 1. Two counterpropagatingevanescent waves are formed by total reflection of anAr-ion laser beam inside a 900 prism, which has areflection coating on the output face. The probingtip is brought in a controlled fashion into the opticalnear field by means of a four-segment piezoelectrictube scanner. The tip scatters the evanescent fieldand creates propagating waves that can be detected inthe far field. A considerable fraction of the scatteredintensity is coupled into a propagating mode of thefiber. At its end the optical power is detected by acalibrated photodiode that is connected to a picowattoptical power meter, directly providing a power mea-surement. The analog output is connected to ascanning tuneling microscope control unit.
We fabricated the fiber tips reproducibly by locallymelting and pulling the single-mode optical fibers asdescribed by others." The typical fiber tips used inthese experiments had a cone half-angle of 10 deg
Fig. 1. Arrangement of a PSTM for collecting photons from astanding evanescent wave bound to the surface of a prism.
and a flat endface with a diameter of less than 200 nmas determined from scanning electron micrographs.
The evanescent field extends from the surface intothe air only of the order of a quarter of the wave-length, and although an optical field exists in thesecond medium, there is no net energy flow across theboundary. Hence the unperturbed evanescent fieldcannot be detected by the conventional far-field tech-nique on which the classical optical microscope isbased. The electric-field strength of an unperturbedevanescent wave at a point (x, z) above the boundarycan be derived from Fresnel's equations26 and is givenfor s polarization by Eq. (1):
E(x, z) = Eo exp(-z/d)exp[-i(2rr/X)x], (1)
where
4n,2 cos2 0
lEo 2= n2 - n22 Ei l-,s 0
nl sin 0
d =- 27r[(nl/n2 sin 0)2 - 1]1/2
In Eq. (1), E, X, and 0 are the amplitude of theincident wave, the vacuum wavelength, and the angleof incidence, respectively; nj and n2 are the indices ofrefraction of the optically denser medium and theoptically rarer medium, respectively. The amplitudeE0 of the evanescent wave at the boundary is given bythe vector sum of the electric-field amplitudes of theincident and the reflected beams. Hence the fieldstrength of the evanescent wave at the boundary canbe higher than the field strength of the incident wave,if 0 is close to the critical angle. Note that there is aphase shift between the incident and the reflectedwaves that varies from 0° to 1800, depending on theangle of incidence. When 0 equals the critical anglefor TIR reflection, the phase shift is zero and E0 istwice the amplitude of the incident wave, whereas for
0 = 90° the reflected wave is 1800 out of phase withrespect to the incident wave and E0 becomes zero.E0, the decay constant d, and the wavelength X of theevanescent field, depend only on X0, ni, n2, and 0.
A standing evanescent wave is formed by theinterference of two totally reflected counterpropagat-ing laser beams of identical wavelengths and polar-ized perpendicular to the plane of incidence. FromEq. (1) we can derive the intensity profile of thestanding evanescent wave:
I(x, z) = Io exp(-2z/d)[1 + r2 + 2r cos( A x +
(2)
The intensity Io = (o/2)IE0 12 can be directly relatedto the intensity of the incident wave by means of Eq.(1); c is the velocity of light, and e0 is the dielectricconstant. The intensity profile is modulated alongthe x direction with a period of A = Xo/(2n, sin 0),which is half of the wavelength of an individualevanescent wave and the modulation depth 2r is givenby the ratio of the electric-field components of the twocounterpropagating waves. 4) is an arbitrary phaseshift.
For our experimental arrangement in which X0 =514.5, 0 = 45°, n = 1.520, n2 = 1.000, and r2
= 0.9,we obtain for a standing evanescent wave A =239.2 ± 0.2 nm, d/2 = 103.9 0.3 nm, and E012 =(3.526 ± 0.007)EiJ2.
To estimate the coupling efficiency between theevanescent field and the tip, we consider a tip modelbased on frustrated TIR.'8 20 The tip is rigorouslyidealized by a semi-infinite medium with a planarboundary that is placed parallel to the prism surface.Assuming that the tip has the same refractive indexas the prism, we can derive the transmission functionthrough a gap of width d from Fresnel's equations27 :
T(z) =1 - cos P
(3)cosh - - cos P
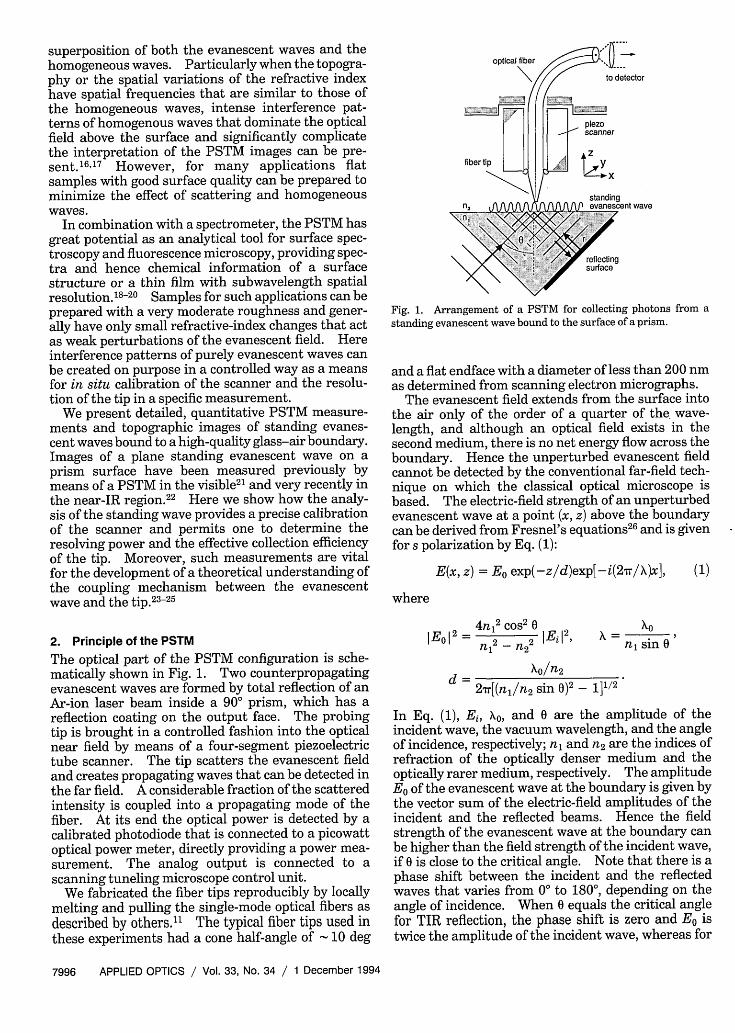
constant signal on the photodetector. The 3.8 VAm x3.8 pum area in Fig. 2 shows a contour of the standingevanescent wave measured at a constant intensity.The dark fringes correspond to the minima, i.e., thenodes of the standing evanescent wave where the tipnearly touches the surface. The bright fringes repre-sent the intensity maxima where the tip is movedaway from the surface. Note that the contours ofthe nodes are somewhat blurred along the scandirection, because there the tip comes extremely closeto the surface and occasionally becomes stuck onprotrusions. At greater distances these deteriora-tions disappear completely.
The spatial modulation and the decay of the stand-ing evanescent wave as a function of the tip-surfacedistance are shown in Fig. 3. The ordinate repre-sents the optical power P(nW), measured at theoutput face of the fiber. The x axis corresponds tothe movement of the tip perpendicular to the fringesat a constant height, and the z direction representsthe tip-surface distance. We clearly see the sinusoi-dal intensity modulation of the standing evanescentwave and the decay with increasing distance from thesurface. The curves on the logarithmic scale of Fig.4(a) represent line sections through the data of Fig. 3parallel to the z axis along an intensity maximum andalong a minimum. For tip-surface distances z >130 nm the signals follow an exponential decay. Atcloser distances the measured signals deviate fromthe exponential behavior because of the perturbationof the evanescent wave by the fiber tip and the finitetip diameter. However, note that the ratio A be-tween the amplitude of the modulation and theaverage power is independent of z. A line sectionalong the x axis at z' = 100 nm is shown in Fig. 4(b)
3000 -
where
cos(3/2) =ni2 cos(20) + n2
2
The mean power collected by the tip perpendicular toits effective aperture area or is then
P(z) = Ii cos 0(1 + r 2)rT(z),
where Ii is the intensity of the incident laser beam.
(4)
0
3. Experimental Results and Discussion
We have recorded the standing evanescent wave intwo ways: in the constant intensity mode and with aconstant tip-surface distance. In the first mode thetip follows the intensity variations of the field byadjusting the tip-sample gap so as to provide a
0 1000 2000 3000x (nm)
Fig. 2. Contour of the standing evanescent wave measured atconstant intensity. The gray scale represents the tip-surfacedistance adjusted by the feedback loop. The dark fringes corre-spond to the nodes, and the bright fringes correspond to theintensity maxima. The period is 239.2 nm in thex direction.
light is collected from a larger surface area and thespatial modulation of the signal becomes less than A>.Modeling the collection efficiency of the fiber tip by aGaussian probability distribution function with acylindrical symmetry along the fiber axis and a widthA, we can relate the amplitude of the measured signalAeXp to an effective aperture radius A:
A ex = A t e x ~( 2A 1 (5)
Fig. 3. Spatial modulation of the standing evanescent wave alongthe propagation direction of the two interfering waves (x axis) andthe decay of the intensity with the increasing tip-surface distance(the z direction). The ordinate represents the optical powermeasured by the detector at the output face of the fiber.
and gives an experimental value of Aexp = 0.33, whichis considerably less than what we expect from Eq. (2)for an unperturbed wave with Au = 2r/(1 + r2) =
0.999. This discrepancy arises from the finite effec-tive diameter of the tip. With an infinitely smallaperture one would expect the same modulationdepth as in Eq. (2). As the tip diameter increases,
1.00
1 .o
m. 0.10
0.01
Q
100 200 300 400z (nm)
0 200 400 600x (nm)
800 1000
Fig. 4. (a) Line section through the data of Fig. 3 along the zdirection at an intensity maximum and at a minimum. (b) Linesection through the data of Fig. 3 along the x axis at a tip-surfaceseparation of z' = 100 nm used for determining the effective tipdiameter A = 80 ± 1 nm.
With Eq. (5) we obtain a value of A = 80 ± 1 nm for aprobe used for the measurements shown in Figs. 3and 4, which is in good agreement with scanningelectron micrographs of the fiber tips.
In Fig. 5 we present a global analysis of the distancedependence of coupling between the evanescent fieldand the tip. The dashed curve P(z)/PA was obtainedby averaging the experimental data of Fig. 3 over fourmodulation periods along the x direction. It is nor-malized by the mean power PA that would be transmit-ted perpendicularly through the effective aperturearea ou of the tip in contact with the surface. PA isgiven by Ii cos 0(1 + r2)U = 3.38 nW, where Ii = 125mW/mm 2 is the intensity of the incident beam andor = MTA2 = 2.0 x 10⁴ nm2 is the effective aperture area.The dotted curve is a line fit of the transmissionfunction ET(z - Az) to the experimental data with thecollection efficiency E and the distance offset Az asfitting parameters. For the other parameters weused the values given in Section 2 and kept them fixedfor the fitting procedure. There are several pointsthat we should note here:
(1) For 0 < z < 325 nm the data show anexcellent fit by Eq. (3) with the decay constant d =103.9 nm given by the geometry of the experimentalarrangement. The coupling between the evanescentfield and the tip can be nicely explained on the basis offrustrated TIR, ction, as other authors have found.22
1.00
C.9._E 0.10U)C
I-
0.010 100 200
z (nm)300 400
Fig. 5. Global analysis of the distance dependence of couplingbetween the evanescent field and the tip. The dashed curveP(z)/PA was obtained by averaging the experimental data of Fig. 3over four modulation periods along the x direction. It is normal-ized by the mean power PA = 3.38 nW, which would be transmittedperpendicularly through the effective aperture area a of the tip incontact with the surface. The dotted curve is a line fit of thetransmission function given in Eq. (3) to the experimental data andgives a coupling efficiency e between the evanescent field and thedielectric tip of 63%.
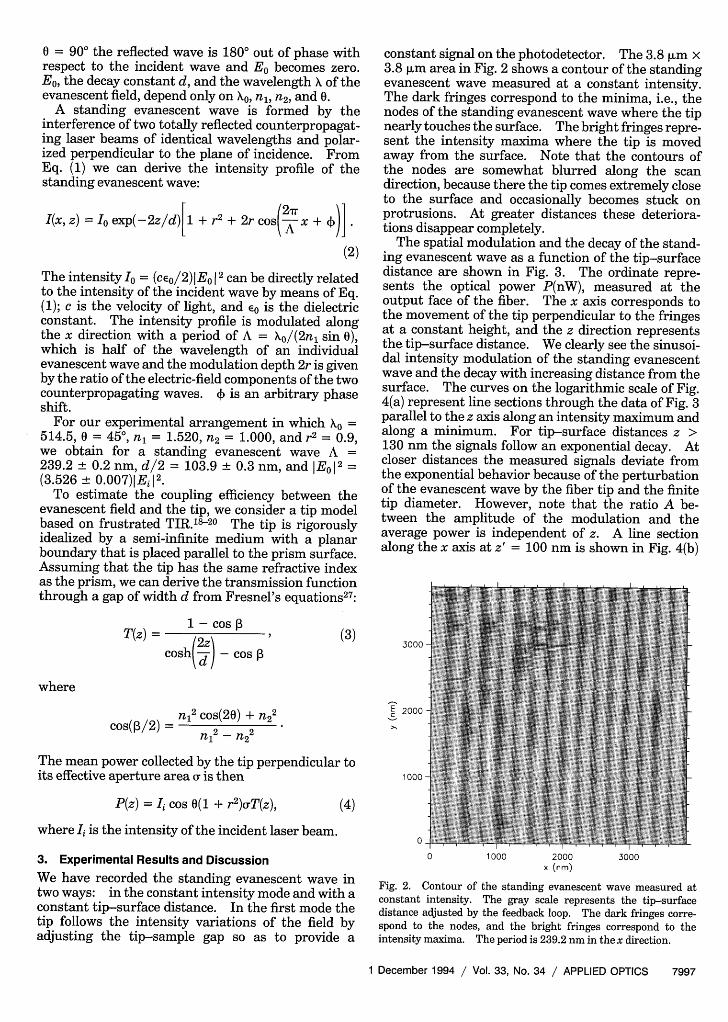
Fig. 6. (a) Operating the Ar-ion laser on all lines; the beatsbetween the different wavelength components become visible onthe standing evanescent wave. The image was recorded in theconstant intensity mode with a power set point of 230 pW. (b) Thesection along the dashed-dot line in (a) represents the z movementof the tip adjusted by the feedback loop.
(2) The collection efficiency E = 63% is ratherhigh. A collection efficiency of 100% could be ob-tained only by an infinitely extended aperture area.However, because the aperture radius A = 80 1 nmis considerably smaller than the wavelength of theevanescent wave and the cone half-angle is only 10deg, scattering losses at the boundary of the tip alsoplay an important role.
(3) When the gap exceeds 325 nm, another expo-nential decay behavior shows up with a considerablylarger decay constant of 140 nm. This looks as ifan additional weaker evanescent wave is present withan angle of incidence closer to the critical angle.However, extreme care has been taken to preventbeams that are backreflected from optical surfacesfrom reentering the prism, and so we do not under-stand this behavior currently.
(4) One could use the deviation from the exponen-tial decay of the signal at close tip-surface distancesfor a derivative distance control at z < 100 nm byvibrating the fiber tip in the z direction, which would
permit determining the width of the gap withouttouching the surface by the tip.
So far we have discussed only standing evanescentwaves caused by the interference of two counterpropa-gating waves of identical wavelength. Operating theAr-ion laser on all lines leads to a standing evanescentwave that shows beats between the different wave-length components. This is demonstrated in theconstant intensity measurement of Fig. 6(a) where a8.5 m x 8.5 jim section of such a wave is shown.The z movement of the fiber tip along the x directionis represented in Fig. 6(b); it is of the order of + 12 nmat the maxima of the beats and + 3 nm at the nodes.The wide z dynamics leads to a much better signal-to-noise ratio than can be obtained by the constantheight mode. The noise is less than 1 nm. A closerinspection reveals perturbations of the evanescentwave that are caused by variations of the surfacetopography,- e.g., scratches, of several nanometers onthe prism surface.
4. ConclusionsIn summary, we have shown that the intensity profileof a standing evanescent wave of visible light with amodulation period of 239.2 nm can be measureddirectly with a subwavelength spatial resolution bymeans of a small dielectric tip of the PSTM.
Given a high-quality prism surface, a standingevanescent wave has a well-defined intensity profile,and no additional radiating modes exist as opposed tothe conventional way of using holographic gratingstructures for determining the resolution of collection-mode near-field optical microscopes. Thus a stand-ing evanescent wave can serve as an ideal standardfor the in situ calibration of the scanner, the effectiveaperture diameter, and the collection efficiency of thenear-field optical probe. For tips with an aperturediameter of 120-220 nm, we found an amazingly highcoupling efficiency. This is vital for spectroscopicapplications of PSTM, particularly for detecting theweak fluorescence signal from single excited dyemolecules on a nanometer scale. The possibility ofselectively detecting photons from a volume elementwith a dimension well below the optical wavelengthpermits one to investigate optical phenomena from aradically new point of view and provides a new sourcein the search of novel quantum optical phenomena.
Financial support by the Swiss Optics PriorityProgram, the Schweizerischer Nationalfonds, and theTreubel Fonds Basel is gratefully acknowledged.We thank I. Zschokke-Grtinacher and H.-J. Gn-therodt for support and stimulating discussions.Finally we thank Brugg Telecom AG for providing thesingle-mode optical fibers.
References1. D. W. Pohl, "Scanning near-field optical microscopy (SNOM),"
Adv. Opt. Electron Microsc. 12, 243-312 (1991).2. E. Betzig and J. K. Trautman, "Near-field optics: micros-
copy, spectroscopy, and surface modification beyond the diffrac-tion limit," Science 257, 189-195 (1992) and references therein.
3. E. H. Synge, "A suggested method for extending microscopicresolution into the ultra-microscopic region," Philos. Mag. 6,356-362 (1928).
4. E. A. Ash and G. Nicholls, "Super-resolution aperture scan-ning microscope," Nature (London) 237, 510-512 (1972).
5. D. W. Pohl, W. Denk, and M. Lanz, "Optical stethoscopy:image recording with resolution X/20," Appl. Phys. Lett. 44,651-653 (1984).
6. A. Lewis, M. Isaacson, A. Harootunian, and M. Muray, "Devel-opment of a 500 A spatial resolution light microscope,"Ultramicroscopy 13, 227-231 (1984).
7. E. Betzig, M. Isaacson, and A. Lewis, "Collection mode near-field scanning optical microscopy," Appl. Phys. Lett. 51,2088-2090 (1987).
8. R. Kopelman, K. Lieberman, A. Lewis, and W. Tan, "Evanes-cent luminescence and nanometer-size light source," J. Lumi-nesc. 48-49, 871-875 (1991).
9. N. Kuck, K. Lieberman, A. Lewis, and A. Vecht, "Visibleelectroluminescent subwavelength point source of light," Appl.Phys. Lett. 61(2), 139-141 (1992).
10. E. Betzig, J. K. Trautman, J. S. Weiner, T. D. Harris, and R.Wolfe, "Polarization contrast in near-field scanning opticalmicroscopy," Appl. Opt. 31, 4563-4568 (1992).
11. E. Betzig, J. K. Trautman, T. D. Harris, J. S. Weiner, and R. L.Kostelak, "Breaking the diffraction barrier: optical micros-copy on a nanometric scale," Science 251, 1468-1470 (1991).
12. D. Birnbaum, S.-K. Kook, and R. Kopelman, "Near-fieldscanning optical spectroscopy: spatially resolved spectra ofmicrocrystals and nanoaggregates in doped polymers," J.Phys. Chem. 97, 3091-3094 (1993).
13. E. Betzig, J. K. Trautman, J. S. Weiner, T. D. Harris, and R.Wolfe, "Polarization contrast in near-field scanning opticalmicroscopy," Appl. Opt. 31, 4563-4568 (1992).
14. R. C. Reddick, R. J. Warmack, and T. L. Ferrell, "New form ofscanning optical microscopy," Phys. Rev. B 39, 767-770(1989).
15. D. Courjon, K. Sarayeddine, and M. Spajer, "Scanning tunnel-ing optical microscopy," Opt. Commun. 71, 23-28 (1989).
16. N. F. van Hulst, F. B. Segerink, F. Achten, and B. B6lger,
"Evanescent-field optical microscopy: effects of polarization,tip shape and radiative waves," Ultramicroscopy 42-44, 416-421 (1992).
17. T. L. Ferrell, J. P. Goudonnet, R. C. Reddick, S. L. Sharp, andR. J. Warmack, "The photon scanning tunneling microscope,"J. Vac. Sci. Technol. B 9, 525-530 (1991).
18. P. J. Moyer, C. J. Jahncke, M. A. Paesler, R. C. Reddick, andR. J. Warmack, "Spectroscopy in the evanescent field with ananalytical photon scanning tunneling microscope," Phys. Lett.A 145, 343-347 (1990).
19. M. A. Paesler, P. J. Moyer, C. J. Jahncke, C. E. Johnson, R. C.Reddick, R. J.Warmack, and T. L. Ferrell, "Analytical photonscanning tunneling microscopy," Phys. Rev. B 42, 6750-6753(1990).
20. S. L. Sharp, R. J. Warmack, J. P. Goudonnet, I. Lee, and T. L.Ferrell, "Spectroscopy and imaging using the photon scanning-tunneling microscope," Acc. Chem. Res. 26, 377-382 (1993).
21. R. C. Reddick, R. J. Warmack, D. W. Chilcott, S. L. Sharp, andT. L. Ferrell, "Photon scanning tunneling microscopy," Rev.Sci. Instrum. 61, 3669-3677 (1990).
22. F. De Fornel, E. Lesniewska, L. Salomon, and J. P. Goudonnet,"First images obtained in the near infrared spectrum with thephoton scanning tunneling microscope," Opt. Commun. 102,1-5 (1993).
23. D. Van Labeke and D. Barchiesi, "Probes for scanning tunnel-ing optical microscopy: a theoretical comparison," J. Opt.Soc. Am. A 10, 2193-2201 (1993).
24. D. Barchiesi and D. Van Labeke, "Application of Mie scatter-ing of evanescent waves to scanning tunnelling optical micros-copy theory," J. Mod. Opt. 40, 1239-1254 (1993).
25. L. Salomon, F. De Fornel, and J. P. Goudonnet, "Sample-tipcoupling efficiencies of the photon-scanning tunneling micro-scope," J. Opt. Soc. Am. A 8, 2009-2015 (1991).
26. M. Born and E. Wolf, Principles of Optics (Pergamon, London,1975), Chap. 1, pp. 47-51.
27. S. Zhu, A. W. Yu, D. Hawley, and R. Roy, "Frustrated totalinternal reflection: a demonstration and review," Am. J.Phys. 54, 601-607 (1986).