1 Disability Adjusted Life Year (DALY) estimates for injury utilising the European Injury Data Base (IDB) BRIDGE-Health (WP9 – Injury Surveillance Platform) Ronan Lyons, Samantha Turner, Angharad Walters, Rupert Kisser, Wim Rogmans, Jane Lyons, Ashley Akbari, Bjarne Larsen, Huib Valkenberg, Dritan Bejko, Robert Bauer, Monica Steiner, Gabriele Ellsaesser Contents Contributions and Acknowledgments ............................................................................................................................... 2 Executive Summary ........................................................................................................................................................... 3 Introduction ...................................................................................................................................................................... 4 How were the IDB DALY estimates calculated? ................................................................................................................ 5 Key Data Elements ........................................................................................................................................................ 5 Data Coverage ............................................................................................................................................................... 5 Injury-VIBES Disability Weights ..................................................................................................................................... 6 Remaining Years of Life ................................................................................................................................................. 6 IDB DALY calculations.................................................................................................................................................... 7 IDB DALY estimates ........................................................................................................................................................... 9 DALY estimates for all injuries by country .................................................................................................................... 9 DALY estimates for all injuries by country and gender ............................................................................................... 10 DALY estimates for all injuries by age ......................................................................................................................... 11 DALY estimates by type of injury ................................................................................................................................ 14 Strengths and Limitations of the IDB DALY estimates ................................................................................................ 14 How do the IDB DALY estimates compare to other DALY estimates? ............................................................................ 15 IDB-Burden of Injury (IDB-BOI) Online Interactive Tool.................................................................................................. 15 References ...................................................................................................................................................................... 17 Appendix ......................................................................................................................................................................... 18 Appendix 1: DWs used in the IDB DALY estimates ..................................................................................................... 18 Appendix 2: Remaining Years of Life – Global Burden of Disease Study 2013 ........................................................... 30
Transcript
1
Disability Adjusted Life Year (DALY) estimates for injury
utilising the European Injury Data Base (IDB) BRIDGE-Health (WP9 – Injury Surveillance Platform)
How were the IDB DALY estimates calculated? ................................................................................................................ 5
Key Data Elements ........................................................................................................................................................ 5
Data Coverage ............................................................................................................................................................... 5
Remaining Years of Life ................................................................................................................................................. 6
DALY estimates for all injuries by country .................................................................................................................... 9
DALY estimates for all injuries by country and gender ............................................................................................... 10
DALY estimates for all injuries by age ......................................................................................................................... 11
DALY estimates by type of injury ................................................................................................................................ 14
Strengths and Limitations of the IDB DALY estimates ................................................................................................ 14
How do the IDB DALY estimates compare to other DALY estimates? ............................................................................ 15
IDB-Burden of Injury (IDB-BOI) Online Interactive Tool.................................................................................................. 15
Appendix 1: DWs used in the IDB DALY estimates ..................................................................................................... 18
Appendix 2: Remaining Years of Life – Global Burden of Disease Study 2013 ........................................................... 30
2
Contributions and Acknowledgments
This report was made possible by the contribution of many people and groups, including the EU Injury Data Base
(IDB) steering group, the National Data Administrators from all the countries that participated and provided data,
and the Injury-VIBES consortium that produced disability weights for the groups of disorders included in this report.
3
Executive Summary
Injuries are a leading cause of morbidity and mortality in Europe, and not only place a huge burden on
individuals and health care services but on society as a whole.
The European Injury Data Base (IDB) project was commissioned as part of BRIDGE-Health to generate
comparable burden of injury estimates across Europe and to support injury prevention research and policy
development.
Traditionally, the impact of injuries have been measured using singular outcomes such as emergency
department attendances, hospital admissions and deaths. In recent years, however, the combination of
these outcomes in composite measures such as Disability Adjusted Life Years (DALYs) have become
increasingly important at providing comparable estimates of the impact of injury.
DALY estimates were generated for IDB countries and years where both fatal and non-fatal injury data were
available. Non-fatal injury data were acquired from Emergency Department data recorded in the IDB
Minimum Data Set (MDS), fatal data were obtained from the European Detailed Mortality Database (EDMD)
and disability weights from the injury-VIBES study were used to calculate the DALY estimates.
The general approach to calculating DALYs followed that of the Global Burden of Disease (GBD) study but
utilised new and different disability weights created by the analysis of data from the largest injury outcome
cohort studies from the Injury-VIBES cohort and detailed injury incidence data from nineteen countries.
DALY estimates were between 2-10 times larger than estimates generated by previous studies such as the
Global Burden of Disease (GBD) study, due to much higher incidence figures and larger disability weights.
Males, 10-14 year old children and accidental falls have the highest DALY estimates and contribute
considerably to the burden of injuries across Europe
The DALY estimates generated by the IDB project demonstrate that the burden of injury in Europe is
considerably higher than previously estimated.
There is an ongoing need to support national and EU data administrators and policy makers in the
calculation of burden of injury metrics and their use in the evaluation of national and EU wide policies and
strategies to reduce the burden.
4
Introduction Injuries are a leading cause of disability in Europe, and place a huge burden on individuals and society as a whole.
Traditionally, the health impact of injuries were measured using singular outcomes e.g. fatalities, hospital admissions
or injury related emergency department attendances. However in recent years, composite measures which combine
mortality and morbidity outcomes, have become increasingly important at providing comparable population level
summaries of disease and injury burden.
A key composite measure, first introduced in 1993 in the World Development Report[1], and widely used to measure
the population burden of injury and disease, is Disability Adjusted Life Years (DALYs). DALYs combine healthy years
of life lost through premature mortality with healthy years of life lost through disability for any given injury or
disease (e.g. the healthy years of life which would have been expected if the injury or disease hadn’t occurred).
Essentially, one DALY equates to one “healthy” year of life lost, and the sum of these DALYs across a population, can
be used to measure the gap between the current and ideal health situation e.g. where the entire population lives to
an advanced age free from disease/injury.
The calculation of injury related DALYs requires several data elements including: non-hospitalised injury cases,
hospitalised injury cases, injury fatalities, disability weights (indication of the severity of an injury), and remaining
years of life. Previous DALY estimates (e.g. Meerding et al’s study[2], Dutch Panel study[3], the Global Burden of
Disease study[4]) have been based on varying data sources and methods. The following report provides injury
related DALY estimates for several European countries, utilising non-fatal injury incidence data from the European
Injury Data Base[5] (IDB), fatal injury data from the World Health Organisation (WHO) European Detailed Mortality
Database[6] (EDMD), disability weights calculated in the Injury-VIBES study (The Validating and Improving injury
Burden Estimates Study) [7], and remaining years of life adopted in the Global Burden of Disease burden calculator
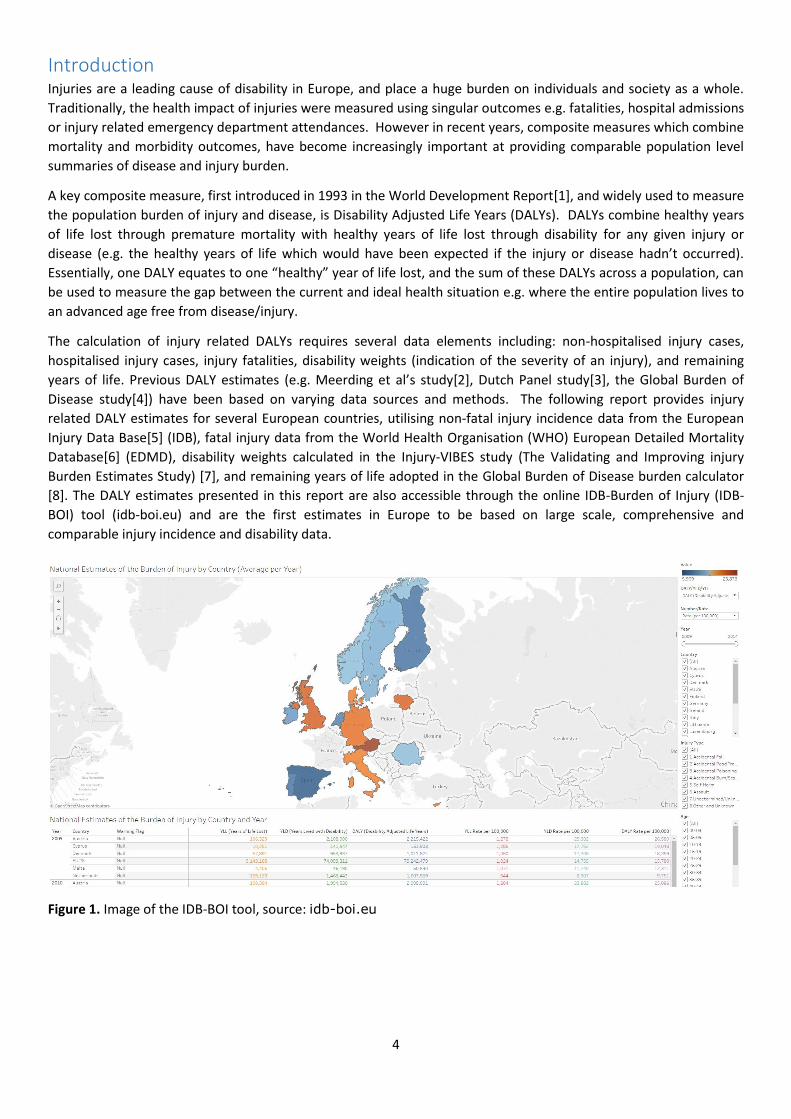
[8]. The DALY estimates presented in this report are also accessible through the online IDB-Burden of Injury (IDB-
BOI) tool (idb-boi.eu) and are the first estimates in Europe to be based on large scale, comprehensive and
comparable injury incidence and disability data.
Figure 1. Image of the IDB-BOI tool, source: idb-boi.eu
5
How were the IDB DALY estimates calculated? DALYs are calculated as the sum of Years Life Lost (YLL) due to premature mortality in the population and Years Lost
due to Disability (YLD).
DALY = YLL + YLD
Key Data Elements Five key data elements are required to calculate YLL, YLDs and DALY estimates. Table 1 details these elements and
the data sources utilised, in addition to whether each element was utilised in the calculation of YLDs, YLLs or both.
Age weighting and time discounting were excluded from the IDB DALY calculations.
Data Element YLL/YLDs or both? Data Source
Injury related Emergency Department (ED) attendances not admitted to hospital
YLD IDB Minimum Data Set (MDS). All injury ED attendances not admitted to hospital were identified using the “Treatment and Follow-up” field in the MDS[9]
Injury related hospital admissions
YLD IDB Minimum Data Set (MDS). All injury ED attendances admitted to hospital were identified using the “Treatment and Follow-up” field in the MDS[9]
Injury Fatalities YLL WHO European Detailed Mortality Database [6] Injury deaths included all underlying causes of death in the ICD-10 codes V-Y, excluding Y40-Y84, Y88.
Disability Weights (DWs) YLD Disability weights provide an indication of the severity of an injury and are required to calculate the YLD portion of a DALY. They range on a scale from 0 (which equates to perfect health) to 1 (which equates to death). DWs can be derived through several methods, and several classifications systems have been generated. DWs produced in the Injury VIBES Project were utilised in the IDB DALY estimates[7]. Further information in the main report.
Remaining Years of Life YLD and YLL Global Burden of Disease Burden Calculator [8] Table 1: Data elements and data sources utilised in the IDB DALY estimates
Data Coverage IDB DALY estimates were generated for countries and years where both non-fatal injury data (IDB-MDS) and fatal
injury data (EDMD[6]) were available. Table 2 lists the availability of data in the IDB-MDS, WHO EDMD, and
consequently data included in the IDB estimates.
6
Country IDB-MDS availability (years)
EDMD availability (years)
IDB DALY estimates (years included in IDB estimates)
Austria 2009-2014 2009-2014 2009 - 2014
Cyprus 2009 - 2010 2009 - 2013 2009-2010
Denmark 2009 - 2015 2009 - 2012 2009 - 2012
Estonia 2015 2009 - 2014
Finland 2010 - 2014 2009 - 2014 2010 - 2014
Germany 2011 - 2012 2009 - 2014 2011-2012
Iceland 2010 - 2013 2009
Italy 2011 2009 - 2012 2011
Lithuania 2013 - 2015 2009 - 2014 2013 - 2014
Luxembourg 2013 - 2015 2009 - 2014 2013 - 2014
Malta 2009 - 2013 2009 - 2014 2009 - 2013
Netherlands 2009 - 2014 2009 - 2013 2009 - 2013
Norway 2012 - 2014 2009 - 2014 2012 - 2014
Portugal 2011 - 2015 2009 - 2014 2011 - 2014
Romania 2013 2009 - 2014 2013
Slovenia 2011- 2015 2009 - 2010
Spain 2013 2009 - 2014 2013
Sweden 2009 - 2015 2009 - 2014 2009 - 2014
United Kingdom 2010 - 2015 2009 - 2013 2010 - 2013 Table 2: IDB-MDS and EDMD data availability, and subsequent data included in the IDB DALY estimates
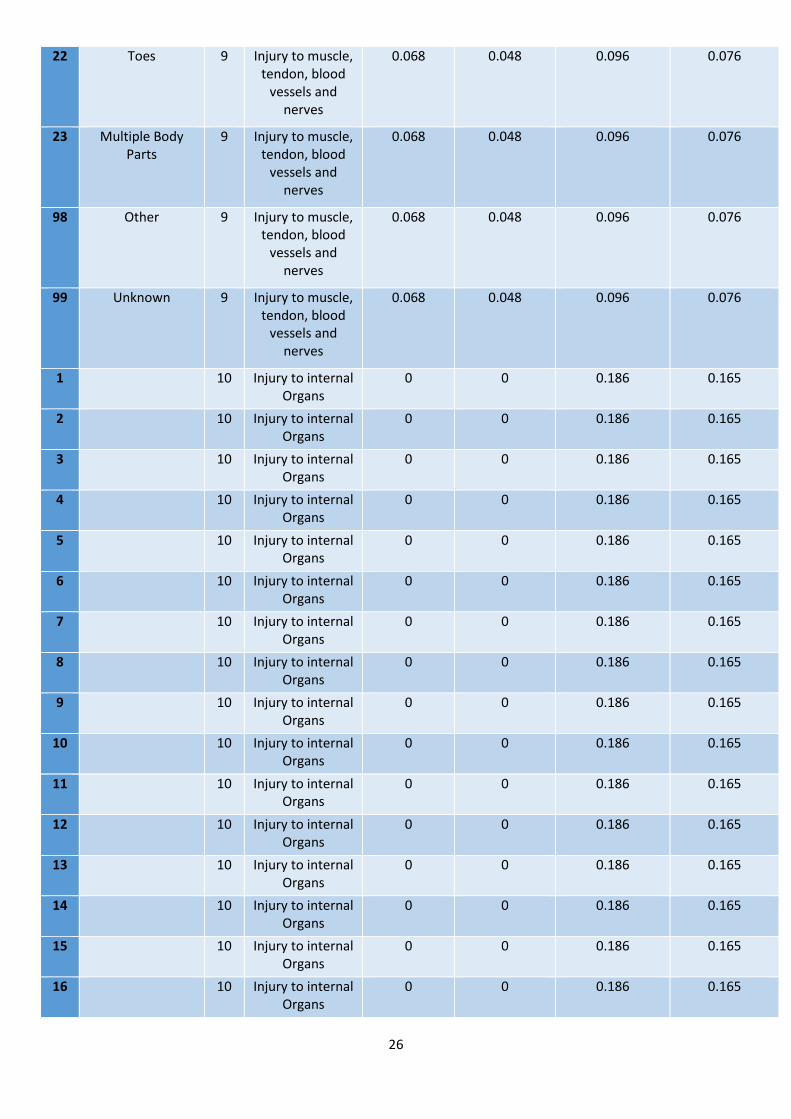
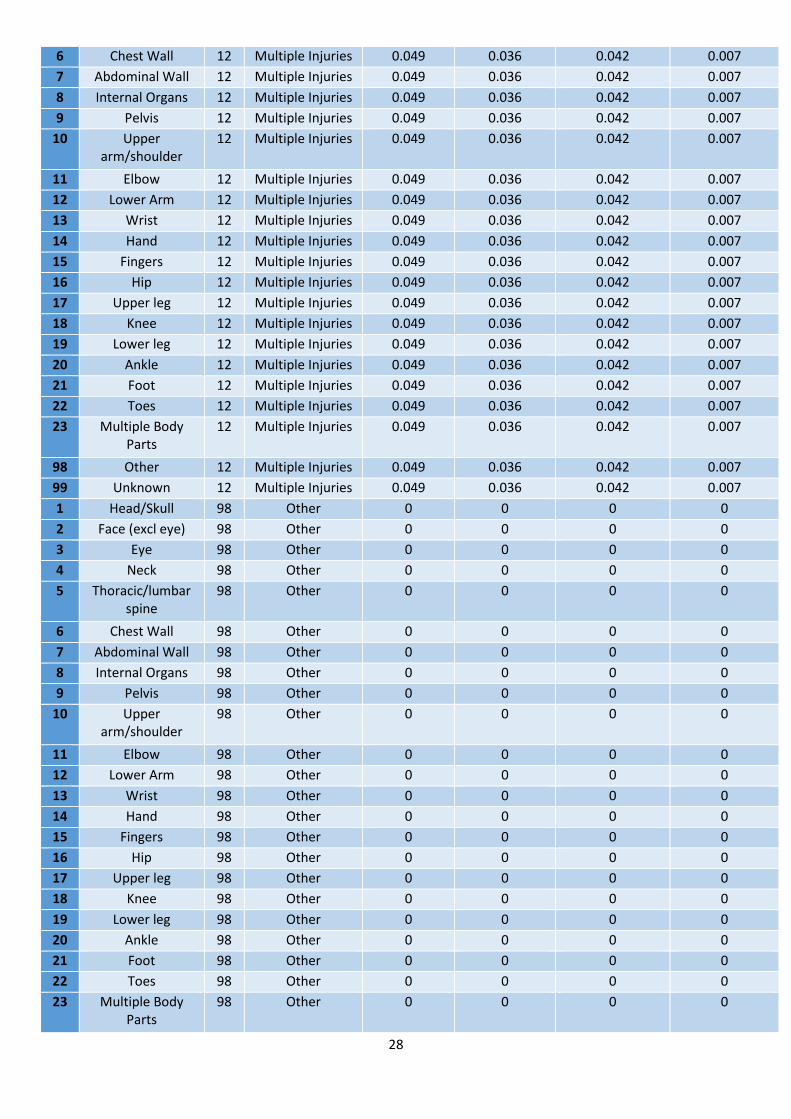
Injury-VIBES Disability Weights Disability weights (DWs) provide an indication of the severity of an injury and are required to calculate the YLD
portion of a DALY. They range on a scale from 0 (which equates to perfect health) to 1 (which equates to death).
DWs can be derived through several methods, and several classifications systems have been developed (e.g.
Meerding et al [2], Beeck et al’s Dutch Panel study[3], and the Global Burden of Disease study[4]).
DWs generated in the Injury-VIBES cohort study[7] were used in our IDB DALY estimates. The Injury-VIBES study
used data from six of the largest and most comprehensive cohort studies across five countries, to evaluate methods
for determining the disability associated with injury, address issues specific to injury and identify improved methods
for burden estimates. The study produced DWs for both short-term disability (disability up to 12 months) and long
term disability (disability 12 months post injury), hospitalised and non-hospitalised injuries. Where possible, the IDB-
MDS ‘Nature of injury’ and ‘Body part’ fields were mapped to Injury-VIBES disability weights. The disability weights
utilised in our calculations are detailed in Appendix 1. In several instances, where it was not possible to generate
DWs for specific injuries, DWs for similar injuries were utilised. Further, as no DWs were generated for poisonings in
the Injury-VIBES study, poisonings DWs generated in the 2013 Global Burden of Disease study were utilised [10].
Remaining Years of Life To estimate YLL and long term YLDs, an estimation of expected remaining years of life is required to estimate health
loss due to premature death or disability at a particular age. In our IDB calculations, default values utilised in the
Global Burden of Disease Calculator[8] have been adopted (please see Table 3).
Table 3: Remaining years of life utilised in IDB estimates
IDB DALY calculations The following acronyms will be utilised in the step by step IDB DALY calculations below:
Non-hospitalised short term disability (NHST) Non-hospitalised long term disability (NHLT) Hospitalised short term disability (HST) Hospitalised long term disability (HLT) Non-hospitalised years lived with disability (NHYLD) Hospitalised years lived with disability (HYLD) Years lived with disability (YLD) Years of life lost (YLL) Disability Adjusted Life Year (DALY)
Step 1: The first step involved mapping NHST DWs to non-admitted injury cases in the IDB-MDS using the VIBES
DWs.
Step 2: The second step involved mapping NHLT DWs to non-admitted cases in the MDS. These DWs were then
multiplied by ‘remaining years of life lost’ (Table 3).
Step 3: NHYLD were calculated by summing NHST and NHLT together e.g.
NHST + (NHLT x remaining years) = NHYLD
Step 4: HYLD were calculated in the same way as the above but for injury cases admitted to hospital e.g.
HST + (HLT x remaining years) = HYLD
Step 5: YLDs were calculated by summing NHYLD and HYLD e.g.
NHYLD + HYLD = YLD
Step 6: YLLs were calculated by assigning ‘remaining years of life’ lost to each fatal case.
Step 7: DALYs were calculated by summing YLL and YLD
8
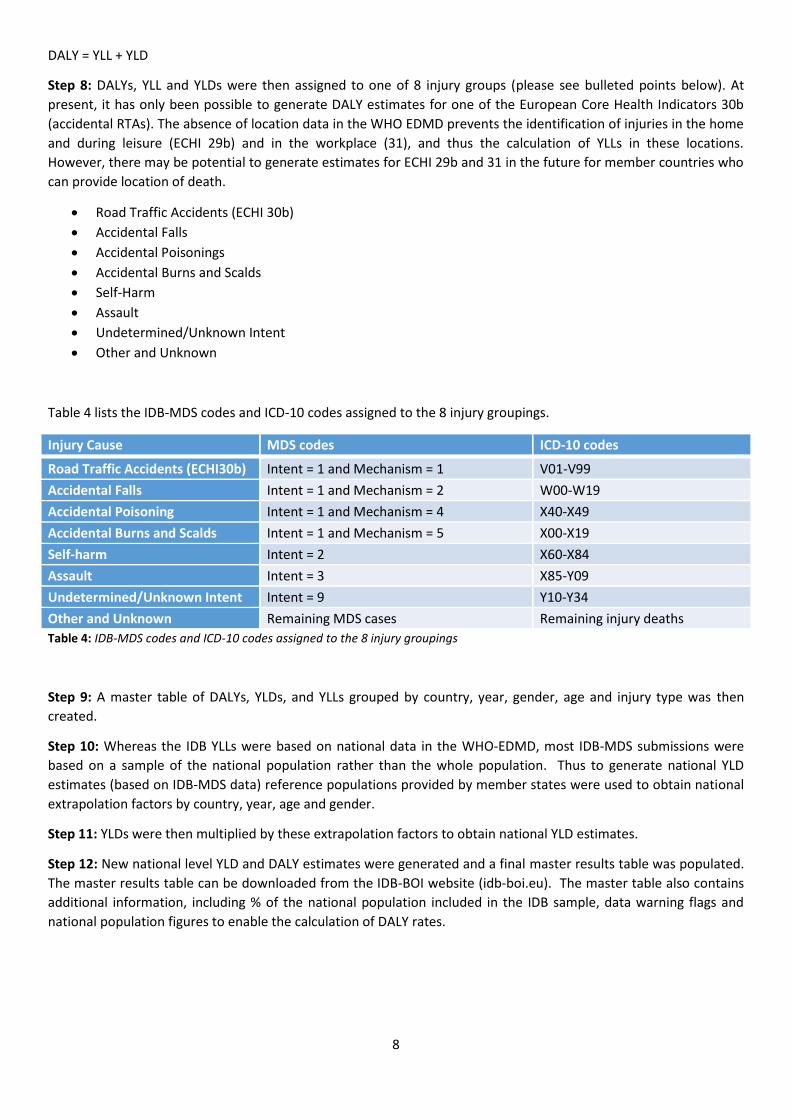
DALY = YLL + YLD
Step 8: DALYs, YLL and YLDs were then assigned to one of 8 injury groups (please see bulleted points below). At
present, it has only been possible to generate DALY estimates for one of the European Core Health Indicators 30b
(accidental RTAs). The absence of location data in the WHO EDMD prevents the identification of injuries in the home
and during leisure (ECHI 29b) and in the workplace (31), and thus the calculation of YLLs in these locations.
However, there may be potential to generate estimates for ECHI 29b and 31 in the future for member countries who
can provide location of death.
Road Traffic Accidents (ECHI 30b)
Accidental Falls
Accidental Poisonings
Accidental Burns and Scalds
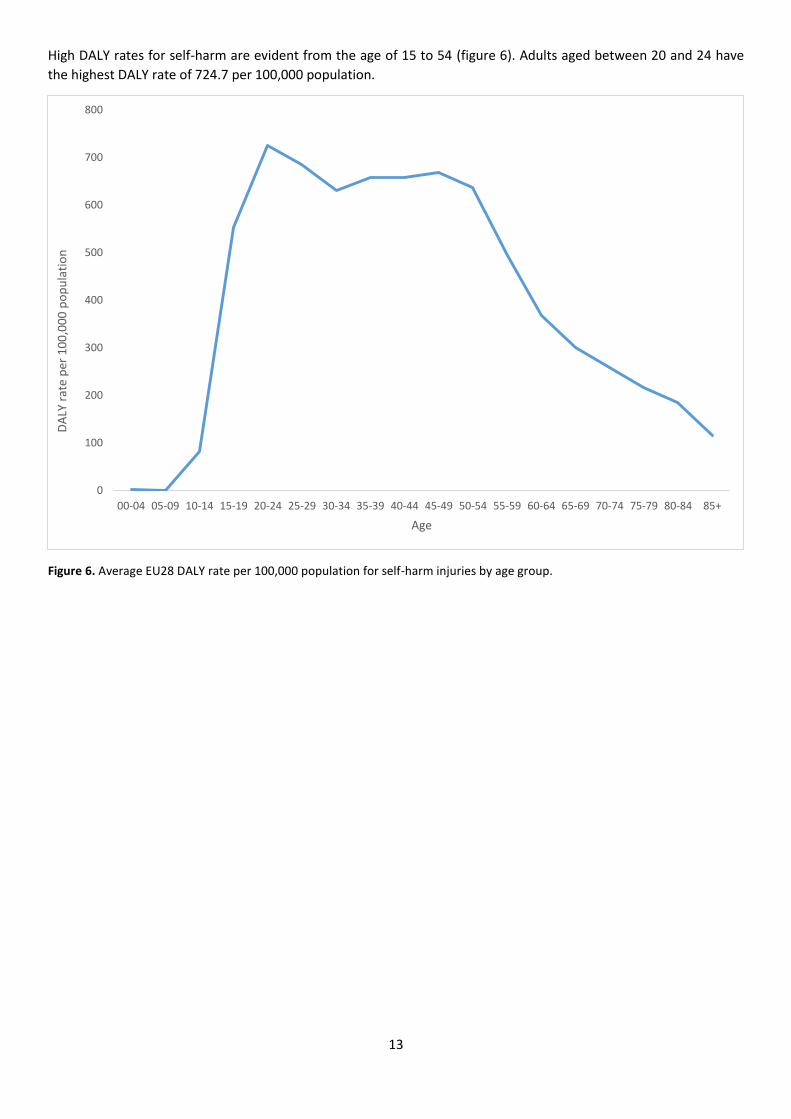
Self-Harm
Assault
Undetermined/Unknown Intent
Other and Unknown
Table 4 lists the IDB-MDS codes and ICD-10 codes assigned to the 8 injury groupings.
Accidental Falls Intent = 1 and Mechanism = 2 W00-W19
Accidental Poisoning Intent = 1 and Mechanism = 4 X40-X49
Accidental Burns and Scalds Intent = 1 and Mechanism = 5 X00-X19
Self-harm Intent = 2 X60-X84
Assault Intent = 3 X85-Y09
Undetermined/Unknown Intent Intent = 9 Y10-Y34
Other and Unknown Remaining MDS cases Remaining injury deaths
Table 4: IDB-MDS codes and ICD-10 codes assigned to the 8 injury groupings
Step 9: A master table of DALYs, YLDs, and YLLs grouped by country, year, gender, age and injury type was then
created.
Step 10: Whereas the IDB YLLs were based on national data in the WHO-EDMD, most IDB-MDS submissions were
based on a sample of the national population rather than the whole population. Thus to generate national YLD
estimates (based on IDB-MDS data) reference populations provided by member states were used to obtain national
extrapolation factors by country, year, age and gender.
Step 11: YLDs were then multiplied by these extrapolation factors to obtain national YLD estimates.
Step 12: New national level YLD and DALY estimates were generated and a final master results table was populated.
The master results table can be downloaded from the IDB-BOI website (idb-boi.eu). The master table also contains
additional information, including % of the national population included in the IDB sample, data warning flags and
national population figures to enable the calculation of DALY rates.
9
IDB DALY estimates
DALY estimates for all injuries by country The EU28 average DALY rate is 16,390 per 100,000 population (figure 2). Austria, Cyprus, Denmark, Germany, Italy,
Lithuania and the United Kingdom all have rates higher than the EU28 average. Austria have the highest DALY rate at
23,873 per 100,000 population; Spain have the lowest DALY rate at 5,969 per 100,000 population.
Figure 2. DALY rate per 100,000 population for all cause injuries by country. The red dashed lines represents the EU28 average.
23.873
19.080 18.733
8.041
19.424
10.755
18.648
20.373
14.608
9.895 8.918
13.228
7.930
13.098
5.969
12.254
20.406
0
5.000
10.000
15.000
20.000
25.000
30.000
DA
LY r
ate
per
10
0,0
00
po
pu
lati
on
Country
EU28 Average
10
DALY estimates for all injuries by country and gender Males have the highest DALY rates across Europe with an EU28 average rate of 19,158 per 100,000 compared with
an average rate of 13,751 per 100,000 for females (figure 3). Portugal is the only country with a higher rate for
females. In all other countries, males have a substantial increased rate compared with females; in particular, there is
a large difference between the rate for males and females in Lithuania and Austria.
Figure 3. DALY rate per 100,000 population for all cause injuries by country and gender. The dashed lines represents the EU28
average for males and females.
0
5.000
10.000
15.000
20.000
25.000
30.000
35.000
DA
LY r
ate
per
10
0,0
00
po
pu
lati
on
Country
Male Female EU28 Male EU28 Female
11
DALY estimates for all injuries by age Children aged between 10 and 14 have the highest DALY rate of 36,008 per 100,000 population (figure 4).
Thereafter, rates decrease though the life-course until age 65-69 (rate of 6,792 per 100,000 population), with a
subsequent increase in rates from age 70 onwards.
Figure 4. Average EU28 DALY rate per 100,000 population for all cause injuries by age group.
DALY estimates by type of injury Of the known injury types, accidental falls contribute the most to the burden of injuries with a DALY rate of 5,965 per
100,000, followed by road traffic accidents, self-harm, assault, accidental poisoning and accidental burns and scalds
(figure 7).
Figure 7. Average EU28 DALY rate per 100,000 population by type of injury.
Strengths and Limitations of the IDB DALY estimates The IDB is a large scale comparable European injury surveillance system, with the ability to investigate DALY rates
across Europe. Comprehensive guidance is available in the form of manuals and data dictionaries to ensure
consistency and standardisation across the member states. IDB data suppliers are trained in the IDB methodology
and are qualified and experienced in handling statistical data [11]. Data suppliers must confirm that delivered
datasets meet basic quality requirements. Rigorous data checks by the network coordinator are integral to ensure
high quality data is submitted to the database.
Of the 36 eligible countries, the IDB currently includes data from 26 countries, of which, 23 are EU member states.
IDB DALY estimates were generated for countries and years where both non-fatal injury data (IDB-MDS) and fatal
injury data (EDMD[6]) were available; 16 countries satisfied this constraint. The IDB-MDS is based on a sample of
hospitals from the member states therefore outputs could suffer from sampling error and bias [11]. Mandatory
collection of IDB-MDS data initiatives have been introduced in some countries, however implementation has not yet
begun. Hospitals provide data on a voluntary basis therefore the sample may be biased towards hospitals interested
in research. Due to variation in hospital size, geographical distributions and the quality of the data submitted, there
are variations in the accuracy of the statistics reported. Accuracy of estimates could also be affected by non-
sampling error such as under-reporting of injury (refusal rate to provide injury information is low), over reporting
due to double counting and coding errors.
5.965
2.264
119 96 453 437
1.111
5.945
0
1.000
2.000
3.000
4.000
5.000
6.000
7.000
DA
LY r
ate
per
10
0,0
00
po
pu
lati
on
Injury Type
15
The VIBES disability weights were derived using case-reported outcomes from high-income country cohort studies
[7]. The weights from this study were generally considerably higher than the Global Burden of Disease 2013 weights
which largely used panel based studies relying on responses from the public or a panel of experts on their
judgements of the impact of living with conditions described in very short vignettes. The VIBES study also identified
certain injury groups resulting in long term disability that did not have a corresponding long term weight in the GBD
2013 study. The VIBES disability weights were especially higher in injuries such as fractures and dislocations. It was
also found that the general public overestimate disability burden in more severe injuries such as spinal cord lesions.
The VIBES disability weights were generated at individual ICD10 code levels; this granularity ensures greater accuracy
since variation exists in the burden of injuries of the same body part. Another strength of the VIBES study was the
large sample size which used data from multiple studies to estimate the weights for both admitted and non-
admitted cases.
The VIBES study did have some limitations. Coding of injury diagnoses may not always be accurate, particularly in
emergency departments where injuries may not be recorded by a trained coder [7]. For some injury categories, the
disability weights were derived using a small number of cases. There were differing following-up rates and varying
amounts of EQ-5D data available within the datasets used. In datasets that did not collect EQ-5D scores, these were
estimated using responses from the Short Form Health Survey. Only the primary diagnosis of each case was mapped
to injury groups which would not take account of the effect of multiple injuries on disability at 12 month post injury.
The method did not take account of recovery within 3 months. The study datasets primarily consisted of falls and
road trauma cases; penetrating injuries were underrepresented. The study was based on data from adult cases only
and does not take account of comorbidities. The weights were generated using data from high income countries
therefore it is not clear if they can be applied in low and middle income countries.
The European Detailed Mortality Database is a large, widely used and publicly available international database [12].
Data are sourced from national vital registration systems from countries within the WHO European Region. The
database contains 5 year age groups and 3 digit ICD codes which can be used to find mortality rates by age and
underlying cause of death groups. Most of the data is complete and comparable, however, some countries do not
use standardised coding practises and the coverage of death registration is incomplete.
How do the IDB DALY estimates compare to other DALY estimates? The IDB-BOI estimates are between 2-10 times greater than national estimates generated in the Global Burden of
Disease study. The VIBES study derived long term disability weights for some injury categories where no weights
were provided by the GBD study; this would account for some of the increase. The VIBES DWs are much higher for
common injuries like fractures and dislocations. The GBD injury data sources are generally more limited than the
IDB; the GBD mainly derives morbidity data from inpatient data and survey data from a relatively small number of
countries; in some countries, such morbidity data have not yet been acquired and GBD imputes national values from
modelling regional averages [13].
The GBD study is a wonderful initiative that seeks to constantly improve the derivation of metrics on population
burden of diseases and injuries. Injury accounts for around 10% of global and European DALYs using the standard
GBD approach. Using enhanced data on injury incidence from IDB and the most up to date disability weights derived
from the largest longitudinal studies of injured individual through the Injury-VIBES consortium it is clear that injury is
an even greater problem than previously estimated, and hence deserves enhanced attention from national and
European health officials.
IDB-Burden of Injury (IDB-BOI) Online Interactive Tool As part of the BRIDGE-Health project, the National Centre for Population Health and Wellbeing Research and Farr
Institute of Health Informatics Research at Swansea University has developed the European Injury Database Burden
of Injury Tool (IDB-BOI tool). The IDB-BOI tool can be used to visually compare YLLs, YLDs, and DALYs by European
country, year, gender, age-group and injury types. Results are presented in several formats including maps, bar/line
charts and heat maps. The master results spreadsheet containing YLLs, YLDs, and DALYs by country, year, age,
gender and injury type can also be downloaded through the website (idb-boi.eu).
16
The tool will support health policy decision making in Europe by providing comparative data to support national and
EU policy development, including identifying domains that contribute disproportionately to the burden of injury. For
example, males, children aged 10-14 and accidental falls contribute considerably to the burden of injuries across
Europe. The tool should be used to form strategies and to develop policies to reduce the impact of the burden of
injuries.
Funding for the development and maintenance of this tool was provided by the BRIDGE-Health initiative, which ends
in October 2017. It is hoped that further funding will be obtained to continue this programme of work and expand
the number of countries involved.
17
References 1 World Bank. World development report 1993: investing in halth. New York: Oxford University
Press: 1993.
2 Meerding WJ, Looman CWN, Essink-Bot M-L, et al. Distribution and Determinants of Health and
Work Status in a Comprehensive Population of Injury Patients. J Trauma Inj Infect Crit Care
4 Wang H, Naghavi M, Allen C, et al. Global, regional, and national life expectancy, all-cause
mortality, and cause-specific mortality for 249 causes of death, 1980–2015: a systematic
analysis for the Global Burden of Disease Study 2015. Lancet 2016;388:1459–544. doi:10.1016/S0140-6736(16)31012-1
5 European Commission. Injury database - European Commission. 2009.https://webgate.ec.europa.eu/idb/ (accessed 23 Mar2017).
6 World Health Organization. European Detailed Mortality Database. http://data.euro.who.int/dmdb/ (accessed 23 Mar2017).
7 Gabbe BJ, Lyons RA, Simpson PM, et al. Disability weights based on patient-reported data from a
multinational injury cohort. Bull World Health Organ 2016;94:806–816C. doi:10.2471/BLT.16.172155
8 Bhalla K, Harrison J. Global Burden of Disease Burden Calculator. http://calculator.globalburdenofinjuries.org/ (accessed 23 Mar2017).
9 EuroSafe. IDB-JAMIE Minimum Data Set (IDB-MDS) Data Dictionary. Amsterdam: 2016. http://www.eurosafe.eu.com/uploads/inline-files/IDB_MDS_Data_Dictionary_JAN 2017.pdf
10 Haagsma JA, Graetz N, Bolliger I, et al. The global burden of injury: incidence, mortality,
disability-adjusted life years and time trends from the Global Burden of Disease study 2013. Inj Prev 2016;22:3–18. doi:10.1136/injuryprev-2015-041616.
11 EuroSafe. IDB-MDS Reference Metadata.
http://www.eurosafe.eu.com/key-actions/injury-data/toolbox (accessed 18 May 2017)
12 World Health Organization. European Detailed Mortality Database.
http://datanew.euro.who.int/DMDBPHP5/Help/ds.htm (accessed 18 May 2017).
13 GBD 2015 Disease and Injury Incidence and Prevalence Collaborators. Global, regional, and national disability-
adjusted life-years (DALYs) for 315 diseases and injuries and healthy life expectancy (HALE), 1990–2015: a
systematic analysis for the Global Burden of Disease Study 2015. The Lancet 2015;388:1603-1658. doi: