RESEARCH REPORT MARCH 2015 Discipline Practices in Chicago Schools Trends in the Use of Suspensions and Arrests W. David Stevens, Lauren Sartain, Elaine M. Allensworth, and Rachel Levenstein with Shannon Guiltinan, Nick Mader, Michelle Hanh Huynh, and Shanette Porter
Transcript
RESEARCH REPORT MARCH 2015
Discipline Practices in Chicago SchoolsTrends in the Use of Suspensions and Arrests
W. David Stevens, Lauren Sartain, Elaine M. Allensworth, and Rachel Levensteinwith Shannon Guiltinan, Nick Mader, Michelle Hanh Huynh, and Shanette Porter
This report was produced by UChicago CCSR’s publications and communications staff: Emily Krone, Director for Outreach and Communication; Bronwyn McDaniel, Senior Manager for Outreach and Communication; and Jessica Puller, Communications Specialist.
Graphic Design: Jeff Hall Design Photography: Cynthia Howe, David SchalliolEditing: Ann Lindner
We are grateful to the Chicago Public Schools for providing us the administrative data that allowed us to do this work. Staff at CPS, especially Karen van Ausdal and Justina Schlund, were helpful in offering clarity around discipline policies in the district. We thank our Steering Committee members for their thoughtful comments, in particular Aarti Dhupelia, Chris Jones, and Lila Leff for reading the report thoroughly. This report benefited from feedback from our fellow researchers at the University of Chicago Consortium on Chicago School Research (UChicago CCSR), in particular Jennie Jiang and Stacy Ehrlich. UChicago CCSR communications team members, especially Bronwyn McDaniel and Jessica Puller, provided assistance in publishing this report. We are also thankful for CPS administrators who took their time to share their experiences with discipline in their school buildings. The Atlantic Philanthropies provided generous funding for this line of research, which made this report possible. Finally, we also gratefully acknowledge the Spencer Foundation and the Lewis-Sebring Family Foundation, whose operating grants support the work of UChicago CCSR.
1 Executive Summary
Introduction
5 Growing Concerns about the Use of Exclusionary Disciplinary Practices
Chapter 1
11 Trends in Exclusionary Discipline Practices in CPS
Chapter 2
21 Reasons for Suspensions and Police Involvement
Chapter 3
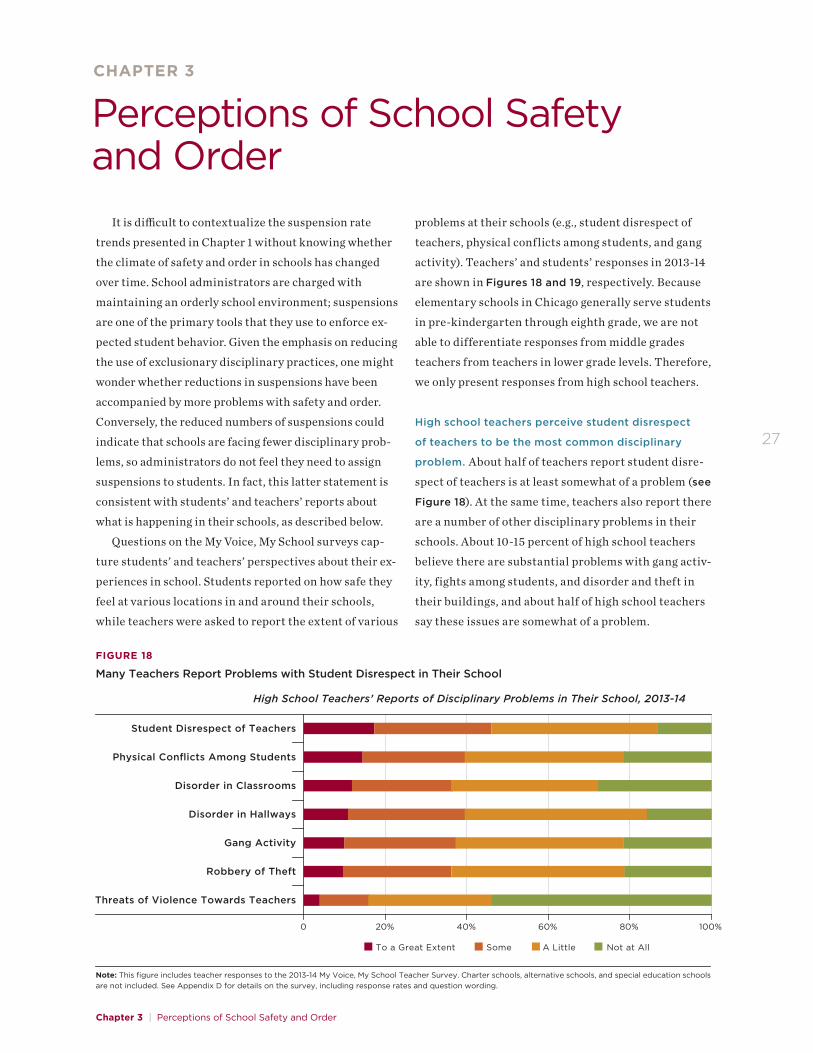
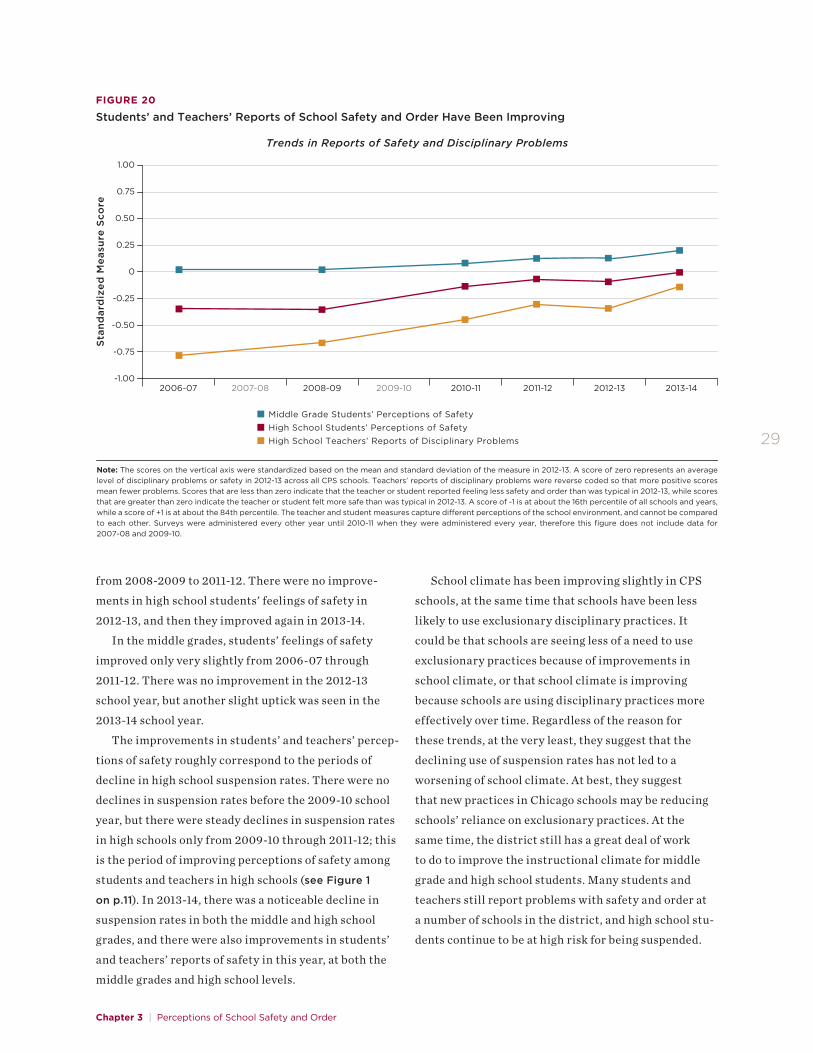
27 Perceptions of School Safety and Order
Chapter 4
31 Interpretive Summary
35 References
37 Appendices A-D
TABLE OF CONTENTS
Executive Summary
1
Executive SummaryThe Chicago Public Schools (CPS) have initiated a number of reforms to reduce the use of exclusionary practices that remove students from the classroom, like suspensions. This report, the first in a series on discipline practices in CPS, provides an overview of the use of suspensions and arrests in Chicago schools and the degree to which practices have changed from 2008-09 to 2013-14.
and police arrests for student misconduct. In recent
years, the general public, policymakers, and school
administrators, from the federal level down, have
strongly questioned this approach. Critics highlight
the growing number of schools with very high suspen-
sion rates, as well as inequities in suspension rates by
race, gender, family income, special education status,
and sexual orientation.1 They point out that students
who are suspended or expelled are more likely to
struggle academically and drop out of school.2 There
is evidence that students who attend schools with
zero-tolerance approaches to discipline are also likely
to experience negative school environments.3 As a
result, national and local policymakers have called on
schools to reduce the use of exclusionary disciplinary
practices—those that remove students from the class-
room (see box Definitions of Key Terms on p.8 for a
description of various discipline practices we highlight
in this report).
Key FindingsOut-of-school suspensions have been declining in
CPS, but are still given frequently, especially at the
high school level. In 2013-14, about 1-in-7 high school
students (16 percent) received an out-of-school sus-
pension (OSS). This number is down from the highest
point in the 2009-10 school year when about 1-in-4 high
school students (24 percent) received an OSS. Since
2009-10, OSS rates in high schools have declined each
year. At the middle grades level (grades 6-8), OSS rates
were unchanged, at around 13-14 percent from 2008-09
to 2012-13, but they dropped in the 2013-14 school year
to 10 percent.
The average length of suspensions has also been de-
clining over time, with the largest drop occurring in the
2012-13 school year. This drop coincided with changes
to the CPS Student Code of Conduct (SCC) which
explicitly constrained the use of long suspensions.
The decline in high school OSS rates has been
accompanied by a doubling of in-school suspension
rates among African American high school students.
In the 2013-14 school year, 15 percent of high school
students received at least one in-school suspension
UCHICAGO CCSR Research Report | Discipline Practices in Chicago Public Schools
2
(ISS). In-school suspensions are given more frequently
to African American students than students of other
racial/ethnic groups and the use of in-school suspen-
sions have been increasing over time. ISS rates nearly
doubled for African American high schools students
between 2008-09 and 2013-14, but remained the same
for other student groups. In-school suspensions are rare
outside of the high schools; 4 percent of middle grades
students received an ISS in the 2013-14 school year.
Some schools may be using in-school suspensions
in instances where they previously used out-of-school
suspensions, or shortening the length of out-of-school
suspensions while also giving students a day or two of ISS.
In-school suspensions tend to be shorter than out-of-
school suspensions and they allow for the possibility that
students could receive an intervention or support while
serving the suspension. Yet, they still result in a loss of
instructional time for students.
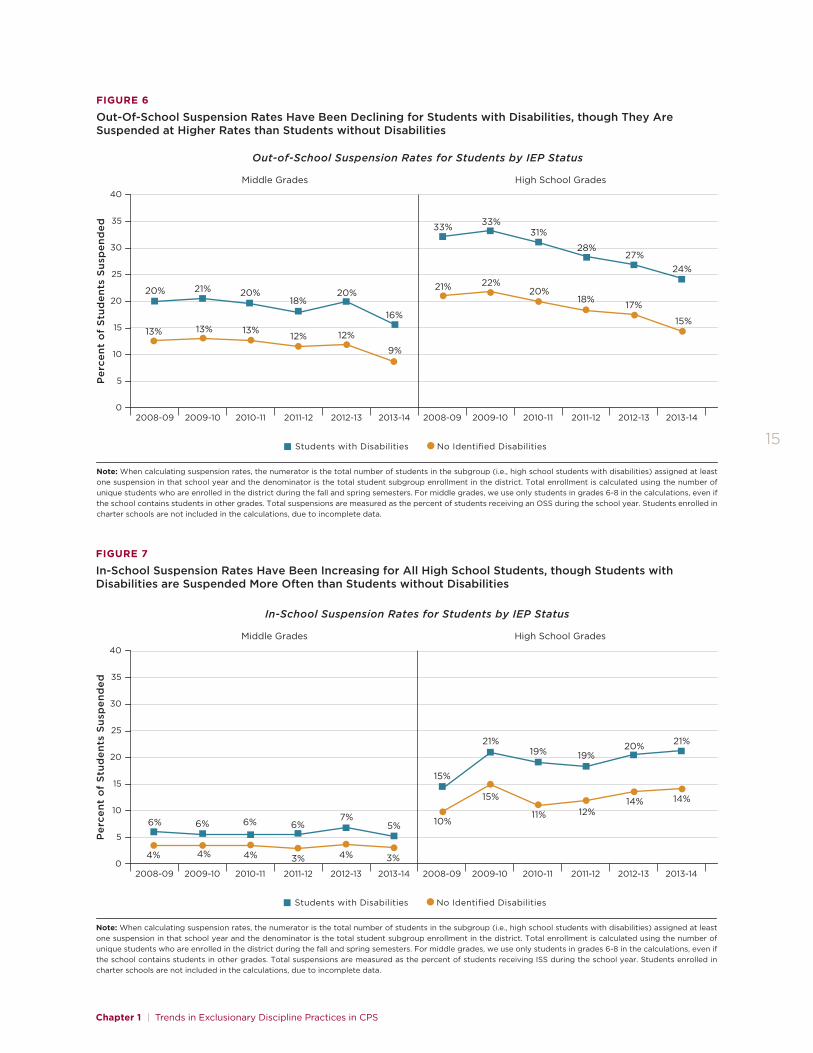
Suspension rates are strongly related to students’
prior test scores, their race, and their gender. African
American students are much more likely to be suspend-
ed than students of other races/ethnicities. Suspension
rates are particularly high for African American boys
in high school. About a third of African American boys
in high school (33 percent) received an OSS in 2013-14.
In comparison, 13 percent of Latino boys in high school
and 6 percent of white/Asian high school boys received
an OSS in 2013-14. African American girls also have
high OSS rates in high school, at 23 percent in 2013-14.
This compares to high school OSS rates of 6 percent
for Latina girls and 2 percent for white /Asian girls.
ISS rates are also much higher for African American
students than for Latino or white/Asian students.
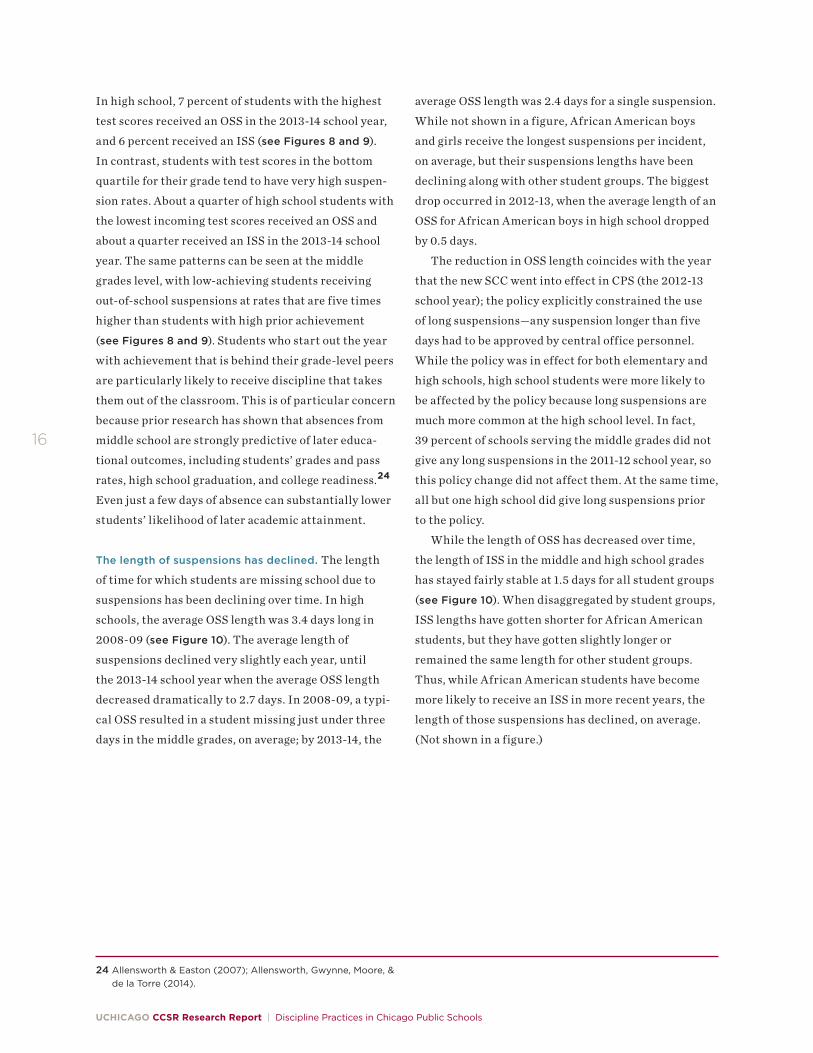
Suspension rates are also high for students with
disabilities and for students who begin the school year
with test scores that are below average. OSS rates for
students with identified disabilities were 24 percent
at the high school level and 16 percent in middle grades
in the 2013-14 school year. Among students with low
test scores (scores in the bottom quartile in the prior
school year), suspension rates are also very high:
27 percent received an OSS at the high school level and
17 percent received an OSS at the middle school level in
the 2013-14 year. Thus, students who start the year with
the weakest academic skills are more likely than other
students to receive a suspension that removes them
from classroom instruction.
Most suspensions in high schools result from acts of
student defiance—where students refuse to comply
with adults’ demands. At the high school level, about
60 percent of out-of-school suspensions and almost all
in-school suspensions result from defiance of school
staff, disruptive behaviors, and school rule violations.
While administrators we interviewed recognized fights
as a primary concern in their schools, 27 percent of
out-of-school and 7 percent of in-school suspensions in
high school are for physical conflict or threats to safety,
meaning most suspensions result from conflicts that in-
volve no physical harm. In the middle grades, conflicts
between students and acts of defiance toward teachers
account for most out-of-school suspensions, at about
equal rates.
Arrests for incidents at school are uncommon, though
African American high school boys are more likely to
be arrested than other students. In the 2011-12 school
year (the most recent year for which we have Chicago
Police Department data), 1.8 percent of high school
students and 1.1 percent of middle grades students were
arrested for incidents occurring at school. Arrest rates
were twice as high among African American boys as for
the district as a whole—3.6 percent of African American
high school boys enrolled in CPS were arrested for
at-school incidents in the 2011-12 school year, which is
about 1-in-28 students. In comparison, 1.6 percent of
Latino boys and 2 percent of African American girls and
fewer than 1 percent of white/Asian students or Latina
girls in high school were arrested for at-school events.
Students are arrested more often for incidents that
occur outside of school than for incidents at school. Over
4 percent of CPS high school students were arrested in
the 2011-12 school year for incidents occurring outside
of school. Combining arrests inside of school and outside
of school, 6 percent of CPS students were arrested in the
2011-12 school year.
Schools tend only to involve police in incidents for
which the SCC requires police notification. Incidents
for which police notification is optional but not required
Executive Summary
3
solicit police notification only 22 percent of the time.
Even when an infraction is serious enough to require
police notification, schools only notify police 43 percent
of the time.
When they occur, infractions that involve drugs or
weapons are most likely to result in a police notifica-
tion. That is, about one out of every three incidents that
involve drugs or weapons at a school result in police
involvement. However, drug and weapons infractions
represent a small portion of the discipline infractions
at schools, so they are not the source of most arrests.
Physical altercations, or physical fights among students,
are the source of most police involvement at schools.
Arrest rates for both in-school and out-of-school inci-
dents have declined over time for CPS students. The de-
clines in arrest rates have been driven by declining arrest
rates for African American boys, who have consistently
been much more likely to be arrested than other stu-
dents. Both out-of-school arrests and in-school arrests of
CPS students declined after 2009-10, up until 2011-12.
At the same time that OSS rates and arrests have de-
clined, students and teachers are reporting that they
feel safer at school. At the high school level, student
perceptions of safety and teacher perceptions of order
have been improving since the 2008-09 school year;
this is also the period during which OSS rates declined
in high schools. At the middle grades level, there have
been only marginal improvements in students’ feelings
of safety at school. However, there was a more marked
improvement in the 2013-14 school year, which was the
first year that OSS rates declined in the middle grades.
This research suggests three major areas of focus
if the district is to reduce the use of exclusionary
disciplinary practices in Chicago schools:
1. High schools. Students are suspended at all grade
levels, but very high suspension rates in high schools
account for 56 percent of out-of-school suspensions
districtwide. If the district is to reduce the use of
suspensions and disciplinary disparities substantial-
ly, it will require changes in high school practices.
Efforts aimed at lower grades will do little to reduce
the overall use of exclusionary practices in CPS,
unless there are concurrent changes in high schools.
2. Disparities in suspensions for African American
students, especially for African American boys, and
for students with low incoming achievement. While
students of all races are occasionally suspended, sus-
pension rates are much higher for African American
students, and especially high for boys. Students with
low incoming test scores are also at high risk for be-
ing suspended.
The fact that high suspension rates persist for
certain groups of students, despite policy efforts
aimed at reducing the use of exclusionary practices,
suggests a need for better support around reducing
exclusionary practices in schools and classrooms
that serve student groups with a higher likelihood
of being suspended.
3. Prevention and de-escalation of conflict, especially
between students and teachers. Most suspensions
and arrests at school are a result of conflict between
students and teachers—such as disobedience and
defiance—or conflicts among students, especially
in high schools. This suggests a need for increased
training for teachers and school staff to prevent and
de-escalate conflict, as well as to develop students’
social-emotional skills, particularly at schools with
high suspension rates.
This is the first in a series of reports on discipline
practices in CPS. The next report will show how the use
of exclusionary and non-exclusionary practices varies
considerably across schools in the district and describe
the types of schools that rely on particular practices.
It will also describe the ways in which the disciplinary
practices of the school are related to the quality of the
school climate and the instructional environments in
classrooms. The third report will examine the use
of alternative and preventative discipline strategies
in CPS schools. Other research will evaluate the
consequences of changes in disciplinary policies for
changes in school practices around discipline as well
as changes in school climate and instruction.
4
Introduction | Growing Concerns about the Use of Exclusionary Disciplinary Practices
5
INTRODUCTION
Growing Concerns about the Use of Exclusionary Disciplinary Practices Districts and policymakers across the United States are in the midst of a fundamental shift in how they approach school discipline.
4 Heaviside, Rowand, Williams, & Farris (1998).5 Shah & McNeil (2013).6 Losen & Martinez (2013). 7 Fabelo et al. (2011).
Skiba, Horner, Chung, Rausch, May, & Tobin (2011); Skiba, Shure, & Williams (2012); Welch & Payne (2010).
13 Fabelo et al. (2011); Balfanz et al. (2013). 14 Steinberg et al. (2011).15 Mattison & Amber (2007).
16 American Academy of Pediatrics (2003); American Psycho-logical Association Zero Tolerance Task Force (2008).
17 Alvarez (2013); Kwong (2014); Watanabe (2014).18 U.S. Department of Education (2014).19 Chicago Public Schools Office of Social and Emotional
Learning (n.d.)
students and LGBT youth are at greater risk than
heterosexual peers.11 Yet some research suggests there
may be few differences in the quantity or quality of mis-
behavior between students of different racial, ethnic,
and status groups.12
A final concern is that exclusionary practices are
ineffective for improving student behavior and school
climate and may even lead to worse outcomes for stu-
dents and a more problematic school environment for
learning. These concerns are based on research showing
that suspensions and expulsions are strongly associated
with negative outcomes for students and for schools.
For example, students who are expelled or suspended
are more likely to fail courses, repeat grades, and drop
out of school than other students.13 Prior research
from the University of Chicago Consortium on Chicago
School Research (UChicago CCSR) showed that schools
that give out more suspensions have lower levels of
safety—even among schools serving similar populations
of students who are from similar neighborhoods.14 One
study found that African American students were more
likely to experience racism and unfairness in schools
with higher rates of detention and suspension.15 Policy
statements from the American Academy of Pediatrics,
and the American Psychological Association have come
out strongly against zero-tolerance discipline policies
and the over-use of suspensions, noting negative educa-
tional, social, and health consequences that often result
from the punishments themselves.16
In response to these concerns, states and school
districts across the country are now attempting to
reduce their use of exclusionary discipline practices.17
The U.S. Department of Justice and the Department
of Education have been encouraging schools to reduce
the rates at which they use exclusionary practices for
student misbehavior since 2009. In January 2014, they
issued strong guidelines intended to reduce the high
rates of exclusionary discipline practices in schools
and reduce disparities in suspension and arrest rates
by students’ race and disability status.18 At the na-
tional release, Secretary of Education Arne Duncan
and Attorney General Eric Holder recognized the need
to provide a safe, productive school environment, but
emphasized concerns that have been raised across the
country about the extensive use of exclusionary disci-
pline practices, particularly for students of color and
students with disabilities.
In Chicago, there have been a number of district-
initiated reforms over the past five years intended
to decrease the amount of instructional time lost to
exclusionary practices and to improve students’ and
teachers’ feelings of safety at school (see box Policy
Shifts in Chicago Public Schools on p.8). These poli-
cies have included funding for implementing alternative
programs for addressing behavioral problems, as well
as modifications to the CPS Student Code of Conduct
(SCC) to discourage schools from using suspensions
and reduce the amount of time students miss school
when they are suspended. CPS has adopted a Multi-
Tiered System of Supports (MTSS),19 also known as
Response to Intervention (RtI), to help guide the use
of various alternative discipline approaches, including
the prevention of exclusionary disciplinary practices
among all students, targeted supports for students with
higher needs, and individualized interventions for the
most at-risk students. A number of schools have imple-
mented programs that teach students positive behav-
iors (e.g., Positive Behavioral Intervention Supports, or
PBIS) or that address social-emotional learning needs.
For students who are facing disciplinary action, many
schools are implementing restorative justice programs,
where students are taught to take responsibility and
repair harm, rather than simply issuing a suspension or
other punishment.
In February 2014, CPS released a plan to reduce the
use of exclusionary disciplinary practices in schools
called the Suspensions and Expulsions Reduction Plan
(SERP). The district gathered stakeholders from across
Introduction | Growing Concerns about the Use of Exclusionary Disciplinary Practices
7
20 Some of the authors of this report participated in some of the meetings of the Chicago Collaborative for Supportive School Discipline to learn about the issues that were brought up from stakeholders, and to provide information about research findings around disciplinary practices in Chicago schools.
21 Losen & Martinez (2013); Skiba & Rausch (2010).22 CPS released three early reports of discipline trends in 2014.
See Chicago Public Schools (2014a, 2014b, 2014c).
the city, calling the group the Chicago Collaborative
for Supportive School Discipline, to hear different
perspectives on school disciplinary practices.20 They
also developed new guidelines and training for school
leaders to try to address the high rates of exclusionary
disciplinary practices in schools.
As CPS schools, their community partners, and
parents continue to work on these issues, they need to
have a sense of the degree to which exclusionary disci-
pline practices are actually used in schools, why they
are used, and how practices have changed over time.
This report—the first in a series on discipline practices
in CPS—maps out the scope of the issue the district is
addressing. This report provides an overview of the
use of exclusionary discipline in CPS and the degree to
which practices have changed from 2008-09 to 2013-14.
It focuses on students in grades 6-12 who are at high-
est risk of receiving a suspension.21 This report builds
on statistics that have been released previously by the
district to provide additional information about the
use of disciplinary practices in schools.22 It provides
suspension rates separately for students in the middle
and high school grades and shows changes in ISS rates,
as well as changes in OSS rates and arrest rates of stu-
dents in schools. It examines differences across student
subgroups, analyzing suspension and arrest rates by
race, gender, special education status, and student
achievement. This report also provides an analysis of
the reasons that students are suspended and draws
on interviews with school administrators to highlight
some of the issues with which they struggle when trying
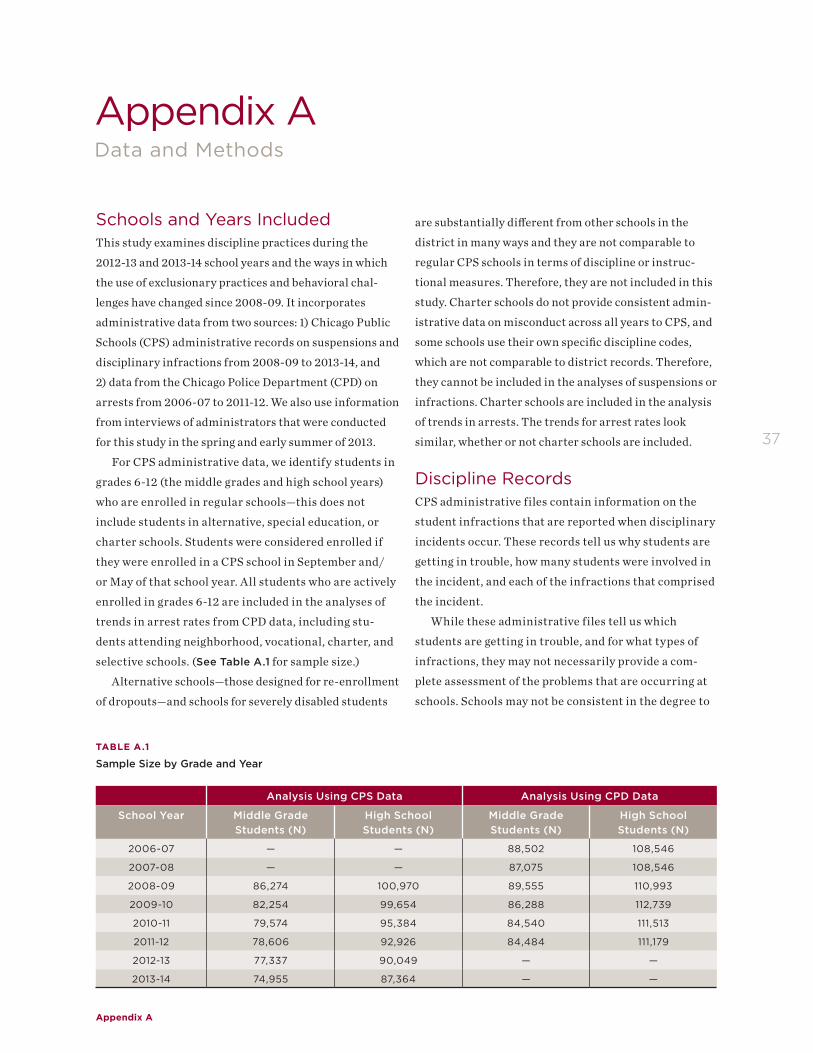
to maintain discipline in their building. Appendix A
provides information about the data used for this study
(see also box Data Sources and Years on p.9). This
report addresses the following questions:
• To what extent do CPS schools use exclusionary
disciplinary practices, including out-of-school
suspensions, in-school suspensions, and police
notifications/arrests?
• Have Chicago schools changed their use of exclusionary
disciplinary practices from 2008-09 to 2013-14, particu-
larly in years when district policy changes occurred?
• What are the differences in suspension rates across
different groups of students (by race, gender,
achievement level, and disability status)?
• Why do students receive exclusionary discipline?
What types of incidents are most prevalent in schools?
The next chapter presents detailed information
about the use of exclusionary discipline practices in
CPS from 2008-09 to 2013-14. Chapter 2 examines
student behaviors associated with suspensions and
police contact. Chapter 3 shows how students and
teacher perceptions of safety and discipline issues
have changed over time. Finally, the last section
considers implications of the report’s findings for
CPS and other districts looking to reduce the use of
exclusionary disciplinary practices.
UCHICAGO CCSR Research Report | Discipline Practices in Chicago Public Schools
8
Definitions of Key Terms
CPS Student Code of Conduct (SCC): This document outlines what behaviors are inappropriate for students and the appropriate ways for schools to address misbehavior. It is modified annually and parents and students are required to sign the SCC. The most recent version of the SCC is available here: http://cps.edu/Pages/StudentCodeofConduct.aspx
Exclusionary Practices: Practices that result in the removal of students from the classroom, including out-of-school and in-school suspensions, as well as arrests.
Out-of-School Suspension (OSS): A suspension that removes a student from the building for a set number of days.
In-School Suspension (ISS): A suspension that removes a student from the classroom, but not the building. Students often sit in a room designated for in-school suspensions where they are expected to do schoolwork.
Arrests: Chicago Police Department (CPD) data indicate whether a student was arrested, the address
at which the student was arrested, and the address at which the incident occurred. These addresses are used to identify whether an arrest was made for an incident that occurred at school or out of school.
Suspension and Arrest Rates: We define rates as the percentage of students who experience a par-ticular exclusionary practice in a given school year. For example, in 2013-14 the OSS rate for high school students was 16 percent—as we define it, this means that 16 percent of high school students received at least one OSS in the 2013-14 school year. Arrest rates only include arrests made during the school year, not during the summer.
Non-Exclusionary Discipline Practices: Practices other than suspensions that seek to change behav-iors or offer behavioral supports to students, such as restorative justice practices, counseling, and social-emotional training. While not included in this report, non-exclusionary practices are the focus of future work in this series.
Policy Shifts in Chicago Public Schools
CPS has enacted strategies to reduce the use of exclusionary practices like suspensions. These policies also emphasize the use of behavioral supports for students in lieu of suspensions.
Culture of Calm Initiative (2009-10 and 2010-11): Through the Culture of Calm Initiative, the district provided several high schools with funds to imple-ment programs for addressing behavioral and safety problems. New school-based strategies included peer juries, restorative justice, counseling, and other alternative practices to help students develop better relationships with peers and adults and to improve overall school climate. CPS piloted the initiative in six high schools in 2009-10 and expanded support to nearly 40 high schools in 2010-11.
Changes to the CPS Student Code of Conduct (at the start of the 2012-13 school year): In the fall of 2012, CPS modified its Student Code of Conduct (SCC) to reduce the length of suspensions. The changes in the SCC eliminated automatic 10-day suspensions and required principals to seek district approval to suspend students for more than five days. The new
SCC also offered a wide range of options to school administrators. According to the district, these op-tions were intended to provide flexibility to adminis-trators rather than a one-size-fits-all approach to dis-cipline. The amended SCC also recommended using non-exclusionary practices—such as peace circles and mentoring—to resolve conflicts and behavioral issues.
Suspensions and Expulsions Reduction Plan (SERP) (during 2013-14): In February 2013, CPS released a plan to explicitly reduce the use of exclusionary disciplinary practices in schools. They also developed new guidelines and training for school leaders to try to address the high rates of exclusionary disciplinary practices. In June 2014, they further revised the SCC. While these revisions to the SCC would not impact the trends reported here, the activities of the SERP could have encouraged schools to limit the use of out-of-school suspensions.
Introduction | Growing Concerns about the Use of Exclusionary Disciplinary Practices
9
Data Sources and Years
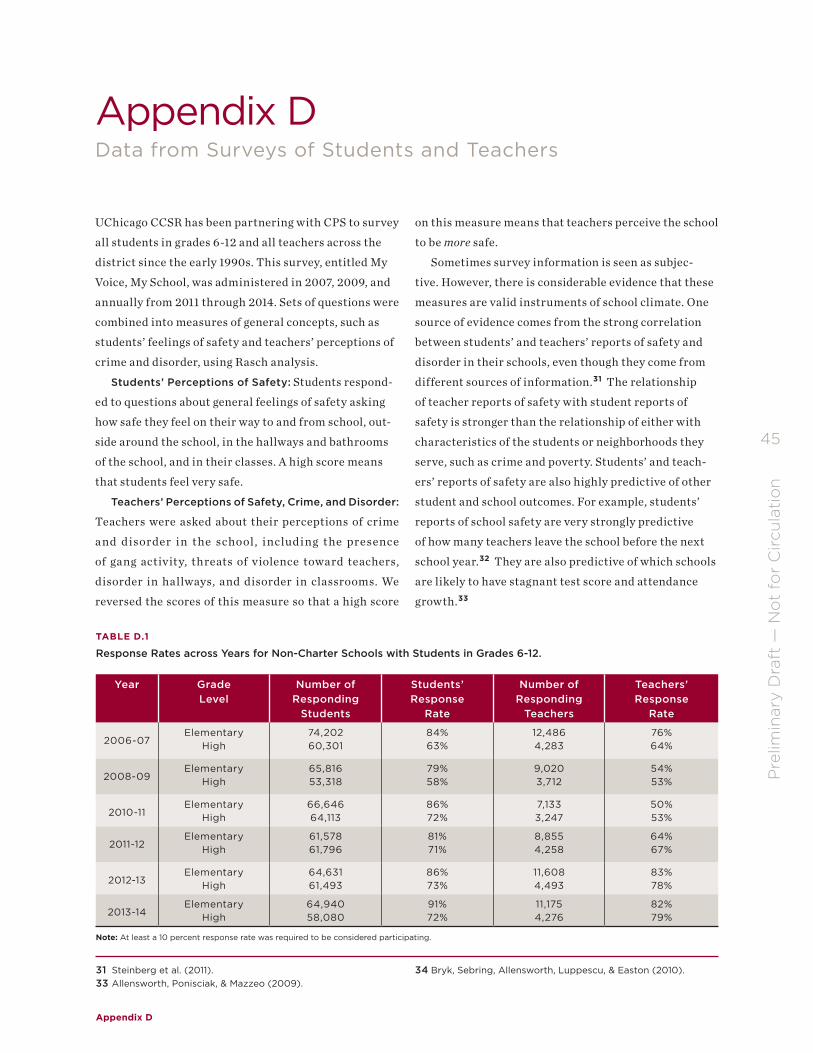
Data for this report come from a number of sources, including CPS administrative data, CPD arrest records, responses of students and teachers to the My Voice, My School surveys, and interviews of school administra-tors. Here we describe which sources of data were used for each chapter. Additional information on the data sources is provided in the appendices.
Chapter 1 Trends in Exclusionary Discipline Practices in CPSTrends in suspension rates are calculated from CPS administrative data from the 2008-09 to 2013-14 school years. These trends do not include students enrolled in charter, alternative, or special education schools, as described in Appendix A. Trends in arrest rates are calculated from CPD data that have been matched with CPS enrollment files from the 2006-07 to 2011-12 school years. These trends do include students in charter schools, but not alternative or special education schools.
Chapter 2 Reasons for Suspensions and Police InvolvementReasons for out-of school suspensions, in-school suspensions, and arrests are calculated from CPS administrative data for the 2012-13 school year.
These analyses do not include students enrolled in charter, alternative, or special education schools. Administrator concerns about behavioral and disciplinary issues come from interviews with 20 administrators conducted in the spring and summer of 2013.
Chapter 3 Perceptions of School Safety and OrderTrends in student perceptions of safety and teacher perceptions of discipline challenges come from district-wide My Voice, My School surveys from the spring of 2007 and 2009, and every following spring until 2014. Survey responses for individual items high-lighted are from the spring 2014 administration. These analyses do not include students enrolled in charter, alternative, or special education schools.
10
Chapter 1 | Trends in Exclusionary Discipline Practices in CPS
11
CHAPTER 1
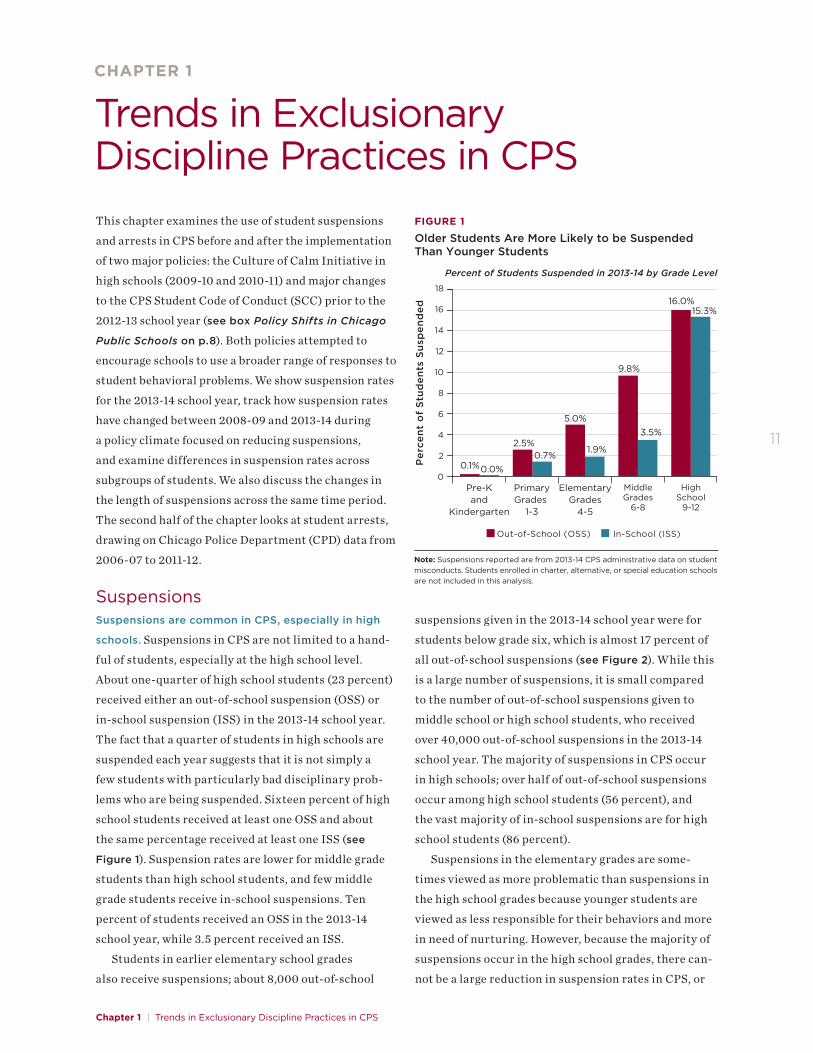
Trends in Exclusionary Discipline Practices in CPSThis chapter examines the use of student suspensions
and arrests in CPS before and after the implementation
of two major policies: the Culture of Calm Initiative in
high schools (2009-10 and 2010-11) and major changes
to the CPS Student Code of Conduct (SCC) prior to the
2012-13 school year (see box Policy Shifts in Chicago
Public Schools on p.8). Both policies attempted to
encourage schools to use a broader range of responses to
student behavioral problems. We show suspension rates
for the 2013-14 school year, track how suspension rates
have changed between 2008-09 and 2013-14 during
a policy climate focused on reducing suspensions,
and examine differences in suspension rates across
subgroups of students. We also discuss the changes in
the length of suspensions across the same time period.
The second half of the chapter looks at student arrests,
drawing on Chicago Police Department (CPD) data from
2006-07 to 2011-12.
SuspensionsSuspensions are common in CPS, especially in high
schools. Suspensions in CPS are not limited to a hand-
ful of students, especially at the high school level.
About one-quarter of high school students (23 percent)
received either an out-of-school suspension (OSS) or
in-school suspension (ISS) in the 2013-14 school year.
The fact that a quarter of students in high schools are
suspended each year suggests that it is not simply a
few students with particularly bad disciplinary prob-
lems who are being suspended. Sixteen percent of high
school students received at least one OSS and about
the same percentage received at least one ISS (see
Figure 1). Suspension rates are lower for middle grade
students than high school students, and few middle
grade students receive in-school suspensions. Ten
percent of students received an OSS in the 2013-14
school year, while 3.5 percent received an ISS.
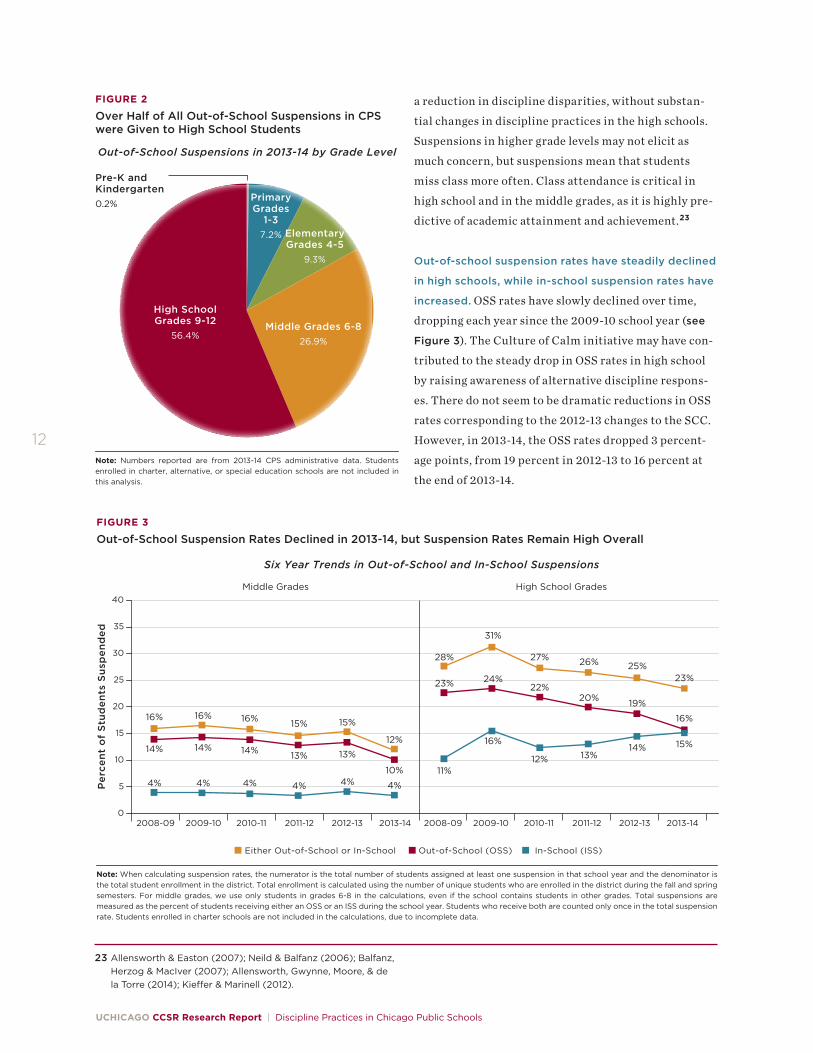
Students in earlier elementary school grades
also receive suspensions; about 8,000 out-of-school
suspensions given in the 2013-14 school year were for
students below grade six, which is almost 17 percent of
all out-of-school suspensions (see Figure 2). While this
is a large number of suspensions, it is small compared
to the number of out-of-school suspensions given to
middle school or high school students, who received
over 40,000 out-of-school suspensions in the 2013-14
school year. The majority of suspensions in CPS occur
in high schools; over half of out-of-school suspensions
occur among high school students (56 percent), and
the vast majority of in-school suspensions are for high
school students (86 percent).
Suspensions in the elementary grades are some-
times viewed as more problematic than suspensions in
the high school grades because younger students are
viewed as less responsible for their behaviors and more
in need of nurturing. However, because the majority of
suspensions occur in the high school grades, there can-
not be a large reduction in suspension rates in CPS, or
Per
cen
t o
f S
tud
ents
Su
spen
ded
8
6
4
0
10
Pre-Kand
Kindergarten
PrimaryGrades
1-3
ElementaryGrades
4-5
MiddleGrades
6-8
HighSchool
9-12
FIGURE 1
Older Students Are More Likely to be Suspended Than Younger Students
2
16
14
12
18
0.0%0.1%0.7%
2.5%1.9%
5.0%3.5%
9.8%
15.3%16.0%
Out-of-School (OSS) In-School (ISS)
Percent of Students Suspended in 2013-14 by Grade Level
Note: Suspensions reported are from 2013-14 CPS administrative data on student misconducts. Students enrolled in charter, alternative, or special education schools are not included in this analysis.
UCHICAGO CCSR Research Report | Discipline Practices in Chicago Public Schools
12
FIGURE 2
Over Half of All Out-of-School Suspensions in CPS were Given to High School Students
Out-of-School Suspensions in 2013-14 by Grade Level
High SchoolGrades 9-12
56.4%Middle Grades 6-8
26.9%
ElementaryGrades 4-5
9.3%
PrimaryGrades
1-37.2%
Pre-K and Kindergarten0.2%
Note: Numbers reported are from 2013-14 CPS administrative data. Students enrolled in charter, alternative, or special education schools are not included in this analysis.
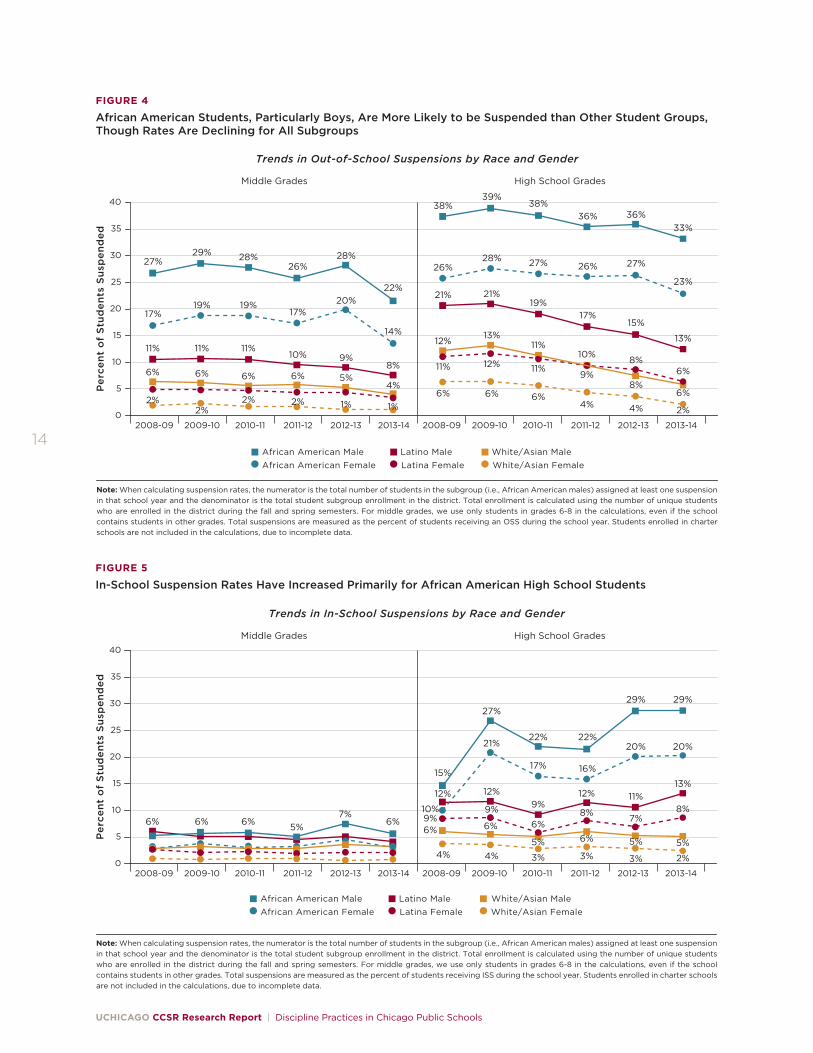
FIGURE 3
Out-of-School Suspension Rates Declined in 2013-14, but Suspension Rates Remain High Overall
Note: When calculating suspension rates, the numerator is the total number of students assigned at least one suspension in that school year and the denominator is the total student enrollment in the district. Total enrollment is calculated using the number of unique students who are enrolled in the district during the fall and spring semesters. For middle grades, we use only students in grades 6-8 in the calculations, even if the school contains students in other grades. Total suspensions are measured as the percent of students receiving either an OSS or an ISS during the school year. Students who receive both are counted only once in the total suspension rate. Students enrolled in charter schools are not included in the calculations, due to incomplete data.
Six Year Trends in Out-of-School and In-School Suspensions
High School GradesMiddle Grades
28%
23%
11%
31%
24%
16%
27%
22%
12%
26%
20%
13%
25%
19%
14%
23%
16%
15%
Either Out-of-School or In-School Out-of-School (OSS) In-School (ISS)
Note: When calculating suspension rates, the numerator is the total number of students in the subgroup (i.e., African American males) assigned at least one suspension in that school year and the denominator is the total student subgroup enrollment in the district. Total enrollment is calculated using the number of unique students who are enrolled in the district during the fall and spring semesters. For middle grades, we use only students in grades 6-8 in the calculations, even if the school contains students in other grades. Total suspensions are measured as the percent of students receiving ISS during the school year. Students enrolled in charter schools are not included in the calculations, due to incomplete data.
Trends in In-School Suspensions by Race and Gender
High School GradesMiddle Grades
15%
27%
21%22%
17%
22%
16%
29%
11%
29%
20%
13%12% 12%
9%12%
20%
4% 4% 3% 3% 3%
African American Male Latino Male White/Asian MaleAfrican American Female Latina Female White/Asian Female
2%
9%10% 9%
6%8% 7%
8%
6% 6%6% 5% 5%5%
FIGURE 4
African American Students, Particularly Boys, Are More Likely to be Suspended than Other Student Groups, Though Rates Are Declining for All Subgroups
Note: When calculating suspension rates, the numerator is the total number of students in the subgroup (i.e., African American males) assigned at least one suspension in that school year and the denominator is the total student subgroup enrollment in the district. Total enrollment is calculated using the number of unique students who are enrolled in the district during the fall and spring semesters. For middle grades, we use only students in grades 6-8 in the calculations, even if the school contains students in other grades. Total suspensions are measured as the percent of students receiving an OSS during the school year. Students enrolled in charter schools are not included in the calculations, due to incomplete data.
Trends in Out-of-School Suspensions by Race and Gender
High School GradesMiddle Grades
38%
26%
21%
39%
28%
21%
38%
27%
19%
36%
26%
17%
36%
27%
15%
33%
23%
13%12%13%
11%10% 8%
6%
6% 6% 6%4% 4%
African American Male Latino Male White/Asian MaleAfrican American Female Latina Female White/Asian Female
1%1%2%2%2%
11% 12% 11%9%
8%6%
Chapter 1 | Trends in Exclusionary Discipline Practices in CPS
15
FIGURE 6
Out-Of-School Suspension Rates Have Been Declining for Students with Disabilities, though They Are Suspended at Higher Rates than Students without Disabilities
Out-of-School Suspension Rates for Students by IEP Status
High School GradesMiddle Grades
20% 21% 20%18%
20%
16%
13% 13% 13% 12%12%9%
33% 33%31%
27%28%
24%
17%
15%
21% 22%20%
18%
Students with Disabilities No Identified Disabilities
Note: When calculating suspension rates, the numerator is the total number of students in the subgroup (i.e., high school students with disabilities) assigned at least one suspension in that school year and the denominator is the total student subgroup enrollment in the district. Total enrollment is calculated using the number of unique students who are enrolled in the district during the fall and spring semesters. For middle grades, we use only students in grades 6-8 in the calculations, even if the school contains students in other grades. Total suspensions are measured as the percent of students receiving an OSS during the school year. Students enrolled in charter schools are not included in the calculations, due to incomplete data.
FIGURE 7
In-School Suspension Rates Have Been Increasing for All High School Students, though Students with Disabilities are Suspended More Often than Students without Disabilities
In-School Suspension Rates for Students by IEP Status
High School GradesMiddle Grades
6% 6% 6% 6%7%
5%
4% 4% 4% 4%3% 3%
15%
21%19% 20%
19%21%
14% 14%
10%
15%
11% 12%
Students with Disabilities No Identified Disabilities
Note: When calculating suspension rates, the numerator is the total number of students in the subgroup (i.e., high school students with disabilities) assigned at least one suspension in that school year and the denominator is the total student subgroup enrollment in the district. Total enrollment is calculated using the number of unique students who are enrolled in the district during the fall and spring semesters. For middle grades, we use only students in grades 6-8 in the calculations, even if the school contains students in other grades. Total suspensions are measured as the percent of students receiving ISS during the school year. Students enrolled in charter schools are not included in the calculations, due to incomplete data.
UCHICAGO CCSR Research Report | Discipline Practices in Chicago Public Schools
16
24 Allensworth & Easton (2007); Allensworth, Gwynne, Moore, & de la Torre (2014).
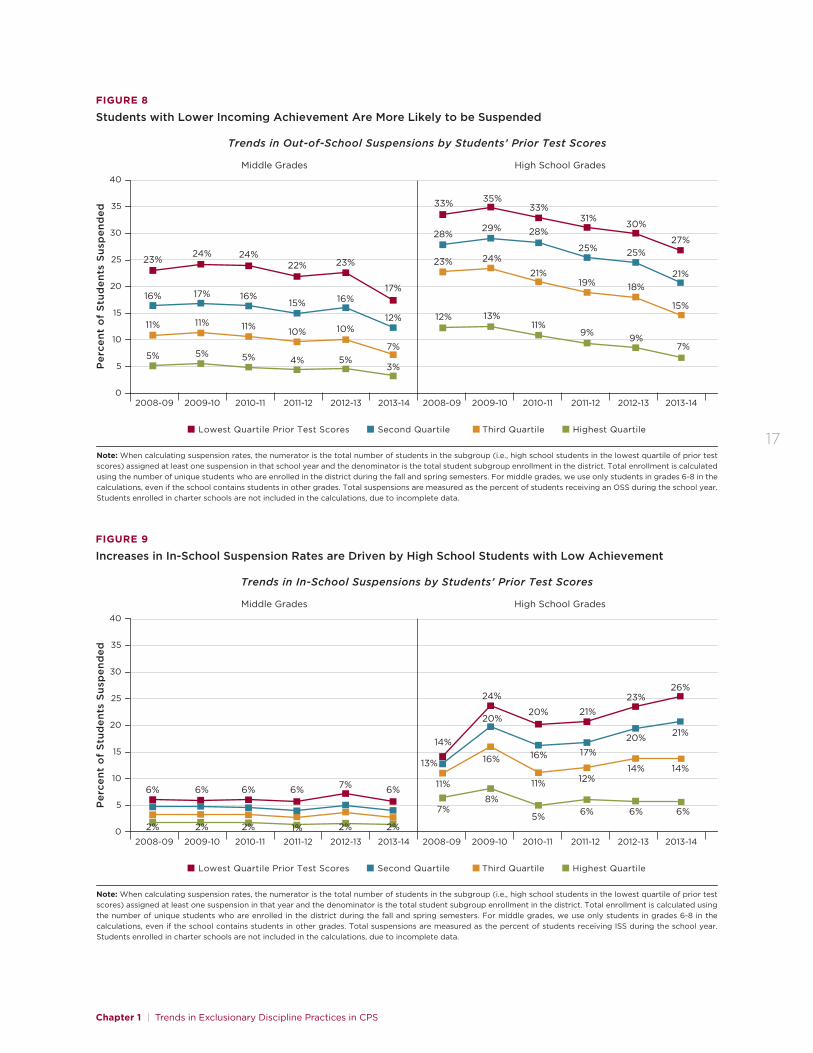
In high school, 7 percent of students with the highest
test scores received an OSS in the 2013-14 school year,
and 6 percent received an ISS (see Figures 8 and 9).
In contrast, students with test scores in the bottom
quartile for their grade tend to have very high suspen-
sion rates. About a quarter of high school students with
the lowest incoming test scores received an OSS and
about a quarter received an ISS in the 2013-14 school
year. The same patterns can be seen at the middle
grades level, with low-achieving students receiving
out-of-school suspensions at rates that are five times
higher than students with high prior achievement
(see Figures 8 and 9). Students who start out the year
with achievement that is behind their grade-level peers
are particularly likely to receive discipline that takes
them out of the classroom. This is of particular concern
because prior research has shown that absences from
middle school are strongly predictive of later educa-
tional outcomes, including students’ grades and pass
rates, high school graduation, and college readiness.24
Even just a few days of absence can substantially lower
students’ likelihood of later academic attainment.
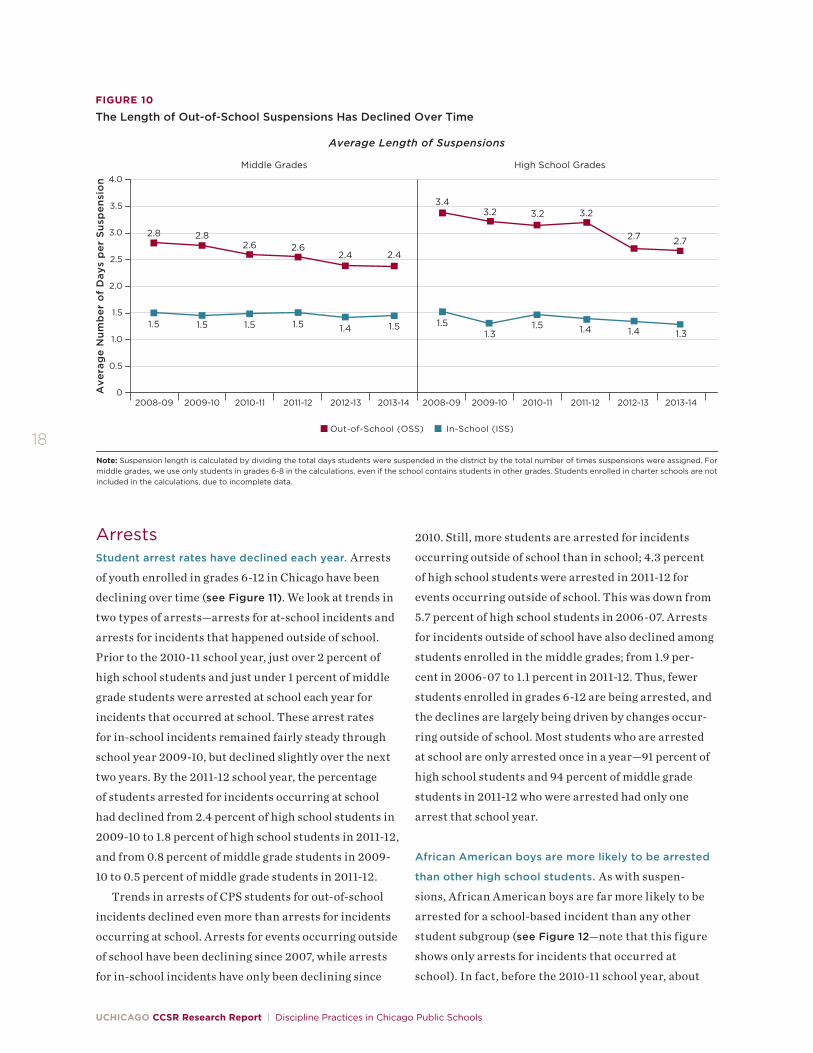
The length of suspensions has declined. The length
of time for which students are missing school due to
suspensions has been declining over time. In high
schools, the average OSS length was 3.4 days long in
2008-09 (see Figure 10). The average length of
suspensions declined very slightly each year, until
the 2013-14 school year when the average OSS length
decreased dramatically to 2.7 days. In 2008-09, a typi-
cal OSS resulted in a student missing just under three
days in the middle grades, on average; by 2013-14, the
average OSS length was 2.4 days for a single suspension.
While not shown in a figure, African American boys
and girls receive the longest suspensions per incident,
on average, but their suspensions lengths have been
declining along with other student groups. The biggest
drop occurred in 2012-13, when the average length of an
OSS for African American boys in high school dropped
by 0.5 days.
The reduction in OSS length coincides with the year
that the new SCC went into effect in CPS (the 2012-13
school year); the policy explicitly constrained the use
of long suspensions—any suspension longer than five
days had to be approved by central office personnel.
While the policy was in effect for both elementary and
high schools, high school students were more likely to
be affected by the policy because long suspensions are
much more common at the high school level. In fact,
39 percent of schools serving the middle grades did not
give any long suspensions in the 2011-12 school year, so
this policy change did not affect them. At the same time,
all but one high school did give long suspensions prior
to the policy.
While the length of OSS has decreased over time,
the length of ISS in the middle and high school grades
has stayed fairly stable at 1.5 days for all student groups
(see Figure 10). When disaggregated by student groups,
ISS lengths have gotten shorter for African American
students, but they have gotten slightly longer or
remained the same length for other student groups.
Thus, while African American students have become
more likely to receive an ISS in more recent years, the
length of those suspensions has declined, on average.
(Not shown in a figure.)
Chapter 1 | Trends in Exclusionary Discipline Practices in CPS
17
FIGURE 8
Students with Lower Incoming Achievement Are More Likely to be Suspended
Trends in Out-of-School Suspensions by Students’ Prior Test Scores
High School GradesMiddle Grades
33% 35%
29%
33%
28%31%
25%
30%
18%
27%
21%
15%
28%
23% 24%
21%19%
25%
12% 13%11%
9% 9%7%
Lowest Quartile Prior Test Scores Second Quartile Third Quartile Highest Quartile
Note: When calculating suspension rates, the numerator is the total number of students in the subgroup (i.e., high school students in the lowest quartile of prior test scores) assigned at least one suspension in that school year and the denominator is the total student subgroup enrollment in the district. Total enrollment is calculated using the number of unique students who are enrolled in the district during the fall and spring semesters. For middle grades, we use only students in grades 6-8 in the calculations, even if the school contains students in other grades. Total suspensions are measured as the percent of students receiving an OSS during the school year. Students enrolled in charter schools are not included in the calculations, due to incomplete data.
FIGURE 9
Increases in In-School Suspension Rates are Driven by High School Students with Low Achievement
Trends in In-School Suspensions by Students’ Prior Test Scores
High School GradesMiddle Grades
13%
20%
16% 16%
5%
17%
21%
20%
14%
26%
21%
14%
14%
11%
24%
20%
12%
23%
7%8%
11%
6% 6%
Lowest Quartile Prior Test Scores Second Quartile Third Quartile Highest Quartile
6%
2% 2% 2% 2% 2%1%
Note: When calculating suspension rates, the numerator is the total number of students in the subgroup (i.e., high school students in the lowest quartile of prior test scores) assigned at least one suspension in that year and the denominator is the total student subgroup enrollment in the district. Total enrollment is calculated using the number of unique students who are enrolled in the district during the fall and spring semesters. For middle grades, we use only students in grades 6-8 in the calculations, even if the school contains students in other grades. Total suspensions are measured as the percent of students receiving ISS during the school year. Students enrolled in charter schools are not included in the calculations, due to incomplete data.
UCHICAGO CCSR Research Report | Discipline Practices in Chicago Public Schools
18
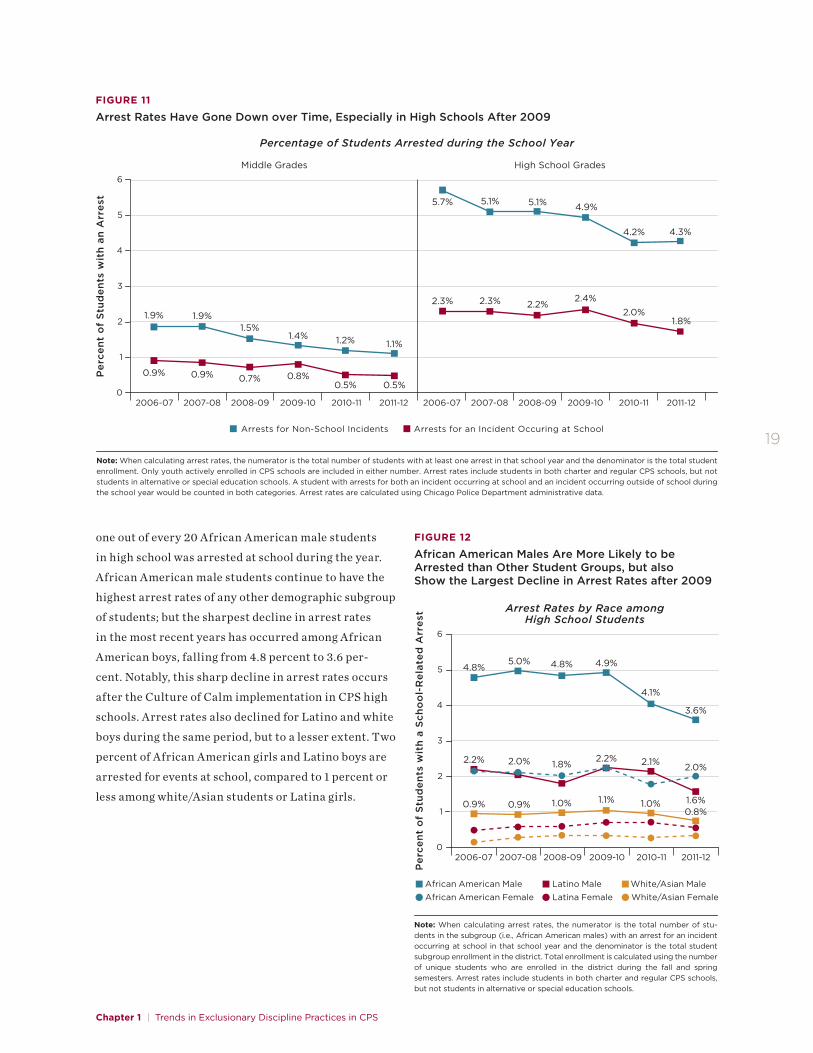
Arrests Student arrest rates have declined each year. Arrests
of youth enrolled in grades 6-12 in Chicago have been
declining over time (see Figure 11). We look at trends in
two types of arrests—arrests for at-school incidents and
arrests for incidents that happened outside of school.
Prior to the 2010-11 school year, just over 2 percent of
high school students and just under 1 percent of middle
grade students were arrested at school each year for
incidents that occurred at school. These arrest rates
for in-school incidents remained fairly steady through
school year 2009-10, but declined slightly over the next
two years. By the 2011-12 school year, the percentage
of students arrested for incidents occurring at school
had declined from 2.4 percent of high school students in
2009-10 to 1.8 percent of high school students in 2011-12,
and from 0.8 percent of middle grade students in 2009-
10 to 0.5 percent of middle grade students in 2011-12.
Trends in arrests of CPS students for out-of-school
incidents declined even more than arrests for incidents
occurring at school. Arrests for events occurring outside
of school have been declining since 2007, while arrests
for in-school incidents have only been declining since
2010. Still, more students are arrested for incidents
occurring outside of school than in school; 4.3 percent
of high school students were arrested in 2011-12 for
events occurring outside of school. This was down from
5.7 percent of high school students in 2006-07. Arrests
for incidents outside of school have also declined among
students enrolled in the middle grades; from 1.9 per-
cent in 2006-07 to 1.1 percent in 2011-12. Thus, fewer
students enrolled in grades 6-12 are being arrested, and
the declines are largely being driven by changes occur-
ring outside of school. Most students who are arrested
at school are only arrested once in a year—91 percent of
high school students and 94 percent of middle grade
students in 2011-12 who were arrested had only one
arrest that school year.
African American boys are more likely to be arrested
than other high school students. As with suspen-
sions, African American boys are far more likely to be
arrested for a school-based incident than any other
student subgroup (see Figure 12—note that this figure
shows only arrests for incidents that occurred at
school). In fact, before the 2010-11 school year, about
FIGURE 10
The Length of Out-of-School Suspensions Has Declined Over Time
Note: Suspension length is calculated by dividing the total days students were suspended in the district by the total number of times suspensions were assigned. For middle grades, we use only students in grades 6-8 in the calculations, even if the school contains students in other grades. Students enrolled in charter schools are not included in the calculations, due to incomplete data.
Chapter 1 | Trends in Exclusionary Discipline Practices in CPS
19
FIGURE 11
Arrest Rates Have Gone Down over Time, Especially in High Schools After 2009
Percentage of Students Arrested during the School Year
High School GradesMiddle Grades
2.2%
4.9%
4.3%
5.7% 5.1% 5.1%
4.2%
2.3% 2.3% 2.4%2.0%
1.8%
0.9% 0.9% 0.7%0.5% 0.5%
0.8%
Arrests for Non-School Incidents Arrests for an Incident Occuring at School
Note: When calculating arrest rates, the numerator is the total number of students with at least one arrest in that school year and the denominator is the total student enrollment. Only youth actively enrolled in CPS schools are included in either number. Arrest rates include students in both charter and regular CPS schools, but not students in alternative or special education schools. A student with arrests for both an incident occurring at school and an incident occurring outside of school during the school year would be counted in both categories. Arrest rates are calculated using Chicago Police Department administrative data.
one out of every 20 African American male students
in high school was arrested at school during the year.
African American male students continue to have the
highest arrest rates of any other demographic subgroup
of students; but the sharpest decline in arrest rates
in the most recent years has occurred among African
American boys, falling from 4.8 percent to 3.6 per-
cent. Notably, this sharp decline in arrest rates occurs
after the Culture of Calm implementation in CPS high
schools. Arrest rates also declined for Latino and white
boys during the same period, but to a lesser extent. Two
percent of African American girls and Latino boys are
arrested for events at school, compared to 1 percent or
less among white/Asian students or Latina girls.
FIGURE 12
African American Males Are More Likely to be Arrested than Other Student Groups, but also Show the Largest Decline in Arrest Rates after 2009
0.9% 0.9% 1.0% 1.0%1.1%0.8%1.6%
2.2% 2.0% 1.8% 2.1%2.2%2.0%
4.8%5.0% 4.8%
4.1%
4.9%
3.6%
Per
cen
t o
f S
tud
ents
wit
h a
Sch
oo
l-R
elat
ed A
rres
t
5
6
4
3
1
0
2
Arrest Rates by Race among High School Students
2006-07 2009-102007-08 2008-09 2010-11 2011-12
African American Male Latino Male White/Asian MaleAfrican American Female Latina Female White/Asian Female
Note: When calculating arrest rates, the numerator is the total number of stu- dents in the subgroup (i.e., African American males) with an arrest for an incident occurring at school in that school year and the denominator is the total student subgroup enrollment in the district. Total enrollment is calculated using the number of unique students who are enrolled in the district during the fall and spring semesters. Arrest rates include students in both charter and regular CPS schools, but not students in alternative or special education schools.
20
Chapter 2 | Reasons for Suspensions and Police Involvement
21
CHAPTER 2
Reasons for Suspensions and Police Involvement
TABLE 1
Types of Behavioral Infractions
Behavior Categories Behavior Groups
Defiance and Violations of School Rules
Defiance of School Staff
Disruptive Behaviors
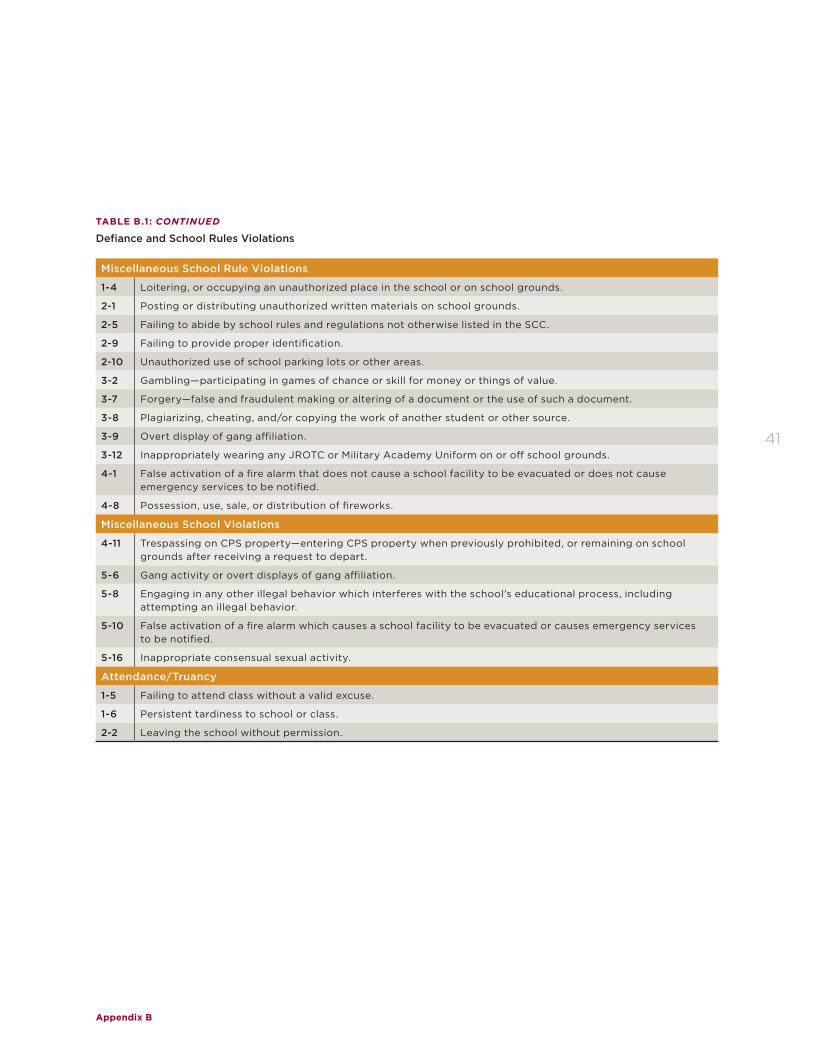
Miscellaneous School Rule Violations
Attendance/Truancy
Conflict and Threats to Safety
Physical Altercations
Bullying/Intimidation
Weapons Violations
Sexual Assault
Illegal Behaviors Illegal Substances
Technology Violations
Theft/Vandalism
Note: UChicago CCSR categorization of infractions in the 2012-13 CPS SCC.
The suspensions and arrests described in the previous
chapter are in response to the variety of behavioral
challenges faced by school leaders and educators, rang-
ing from minor infractions, like running in the halls,
to very severe incidents, such as aggravated assault.
Knowing which behaviors lead to suspensions can help
districts provide target supports for addressing prob-
lem areas and develop policies for leveraging specific
opportunities for improvements.
School staff record instances of student misbehav-
ior using a list of infractions in the CPS Student Code
of Conduct (SCC). Each recorded incident is placed on
a scale of 1 (minor infractions, such as running in the
halls) to 6 (very serious infractions, such as arson or
attempted murder). Within each group, infractions are
given an additional code denoting the exact nature of the
infraction (e.g., “Leaving class without permission”). In
total, the SCC identifies 216 possible infractions. Finally,
schools also record the actions taken in response to the
infraction, including whether the student received an
in-school (ISS) or out-of-school suspension (OSS).
In this chapter, we split the SCC infractions into
three main categories (see Appendix B for more infor-
mation on our classification). The first category of be-
haviors is Defiance and Violations of School Rules, which
includes infractions that do not threaten the physical
safety of students or adults. Rather, they disrupt the
learning environment and school processes, or they
challenge the authority of adults. The second category
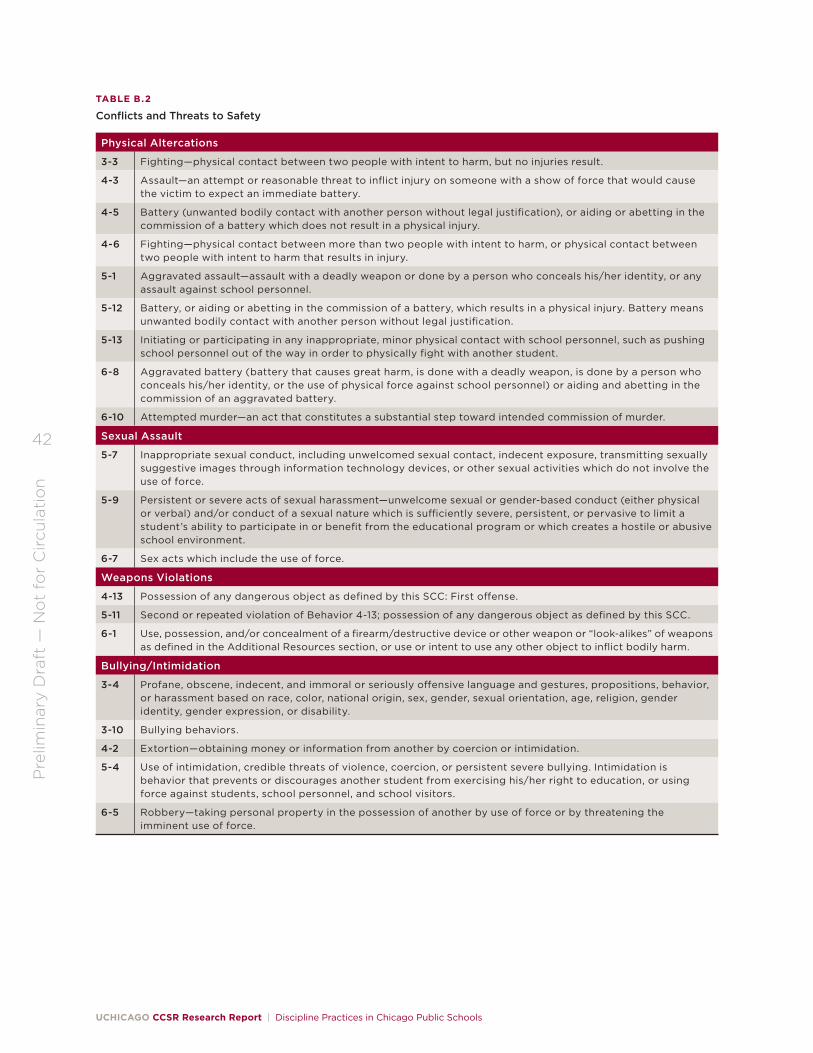
of behaviors is Conflict and Threats to Safety, which cap-
tures various levels of physical altercations and threats
between students or between adults and students. These
behaviors directly jeopardize the safety of people in
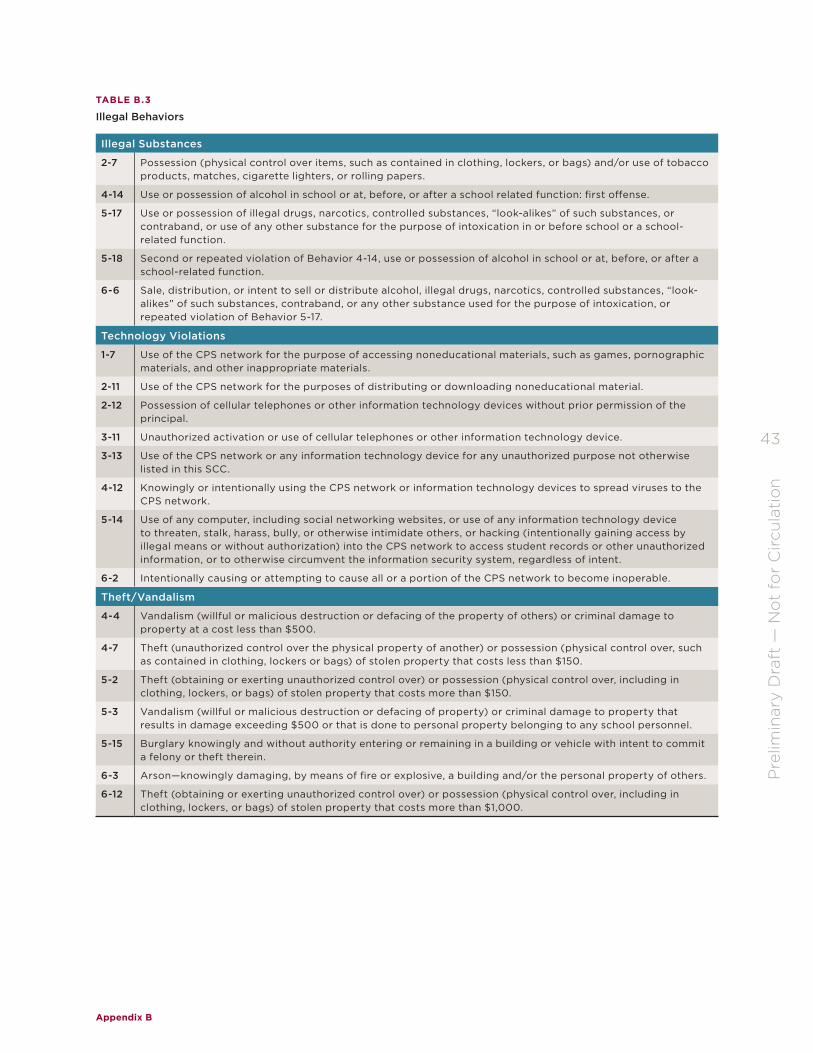
the school building. The third category of behaviors is
Illegal Behaviors, which includes cases of possession or
distribution of illegal substances, technology violations,
and acts of theft or vandalism. While serious and illegal,
these behaviors do not directly compromise the safety
of individuals or the school community (see Table 1).
We begin by looking at the reasons students receive
suspensions and how administrators describe common
problems in their schools, and we then discuss police
involvement.
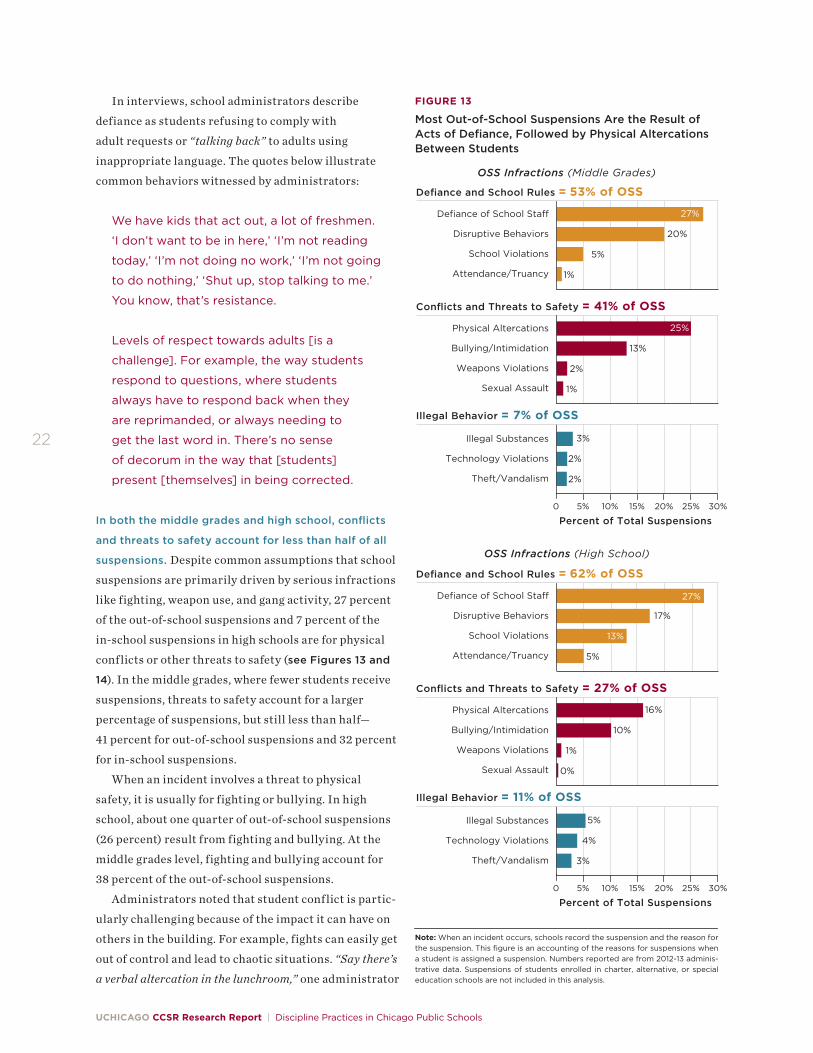
SuspensionsDefiance of adults and school rules accounts for
more suspensions than any other type of behavior.
Student defiance of adult authority and general school
rule violations are the most common type of offence
leading to suspensions. At the high school level, 62
percent of out-of-school suspensions and 87 percent of
in-school suspensions are a result of defiance of adults,
disruption, or breaking school rules (see Figures 13
and 14). In the middle grades, about half of out-of-
school suspensions (53 percent) and 62 percent of
in-school suspensions are a result of these types of
behaviors. Within this category of behaviors, defiance
of adults is the single most common cause of suspen-
sions; in high schools, this behavior accounts for 27
percent of out-of-school suspensions and 24 percent of
in-school suspensions. In the middle grades, 27 percent
of out-of-school suspensions and 25 percent of in-
school suspensions are due to defiance infractions.
UCHICAGO CCSR Research Report | Discipline Practices in Chicago Public Schools
22
30%5% 10% 15% 20% 25%0
FIGURE 13
Most Out-of-School Suspensions Are the Result of Acts of Defiance, Followed by Physical Altercations Between Students
OSS Infractions (Middle Grades)
5%
1%
Defiance of School Sta�
Disruptive Behaviors
School Violations
Attendance/Truancy
Defiance and School Rules = 53% of OSS
27%
20%
2%
1%
Physical Altercations
Bullying/Intimidation
Weapons Violations
Sexual Assault
Conflicts and Threats to Safety = 41% of OSS
25%
13%
2%
Illegal Substances
Technology Violations
Theft/Vandalism
Illegal Behavior = 7% of OSS
3%
2%
Percent of Total Suspensions
30%5% 10% 15% 20% 25%0
5%
Defiance of School Sta�
Disruptive Behaviors
School Violations
Attendance/Truancy
Defiance and School Rules = 62% of OSS
27%
17%
1%
0%
Physical Altercations
Bullying/Intimidation
Weapons Violations
Sexual Assault
Conflicts and Threats to Safety = 27% of OSS
16%
10%
3%
Illegal Substances
Technology Violations
Theft/Vandalism
Illegal Behavior = 11% of OSS
5%
4%
Percent of Total Suspensions
OSS Infractions (High School)
13%
Note: When an incident occurs, schools record the suspension and the reason for the suspension. This figure is an accounting of the reasons for suspensions when a student is assigned a suspension. Numbers reported are from 2012-13 adminis-trative data. Suspensions of students enrolled in charter, alternative, or special education schools are not included in this analysis.
In interviews, school administrators describe
defiance as students refusing to comply with
adult requests or “talking back” to adults using
inappropriate language. The quotes below illustrate
common behaviors witnessed by administrators:
We have kids that act out, a lot of freshmen.
‘I don’t want to be in here,’ ‘I’m not reading
today,’ ‘I’m not doing no work,’ ‘I’m not going
to do nothing,’ ‘Shut up, stop talking to me.’
You know, that’s resistance.
Levels of respect towards adults [is a
challenge]. For example, the way students
respond to questions, where students
always have to respond back when they
are reprimanded, or always needing to
get the last word in. There’s no sense
of decorum in the way that [students]
present [themselves] in being corrected.
In both the middle grades and high school, conflicts
and threats to safety account for less than half of all
suspensions. Despite common assumptions that school
suspensions are primarily driven by serious infractions
like fighting, weapon use, and gang activity, 27 percent
of the out-of-school suspensions and 7 percent of the
in-school suspensions in high schools are for physical
conflicts or other threats to safety (see Figures 13 and
14). In the middle grades, where fewer students receive
suspensions, threats to safety account for a larger
percentage of suspensions, but still less than half—
41 percent for out-of-school suspensions and 32 percent
for in-school suspensions.
When an incident involves a threat to physical
safety, it is usually for fighting or bullying. In high
school, about one quarter of out-of-school suspensions
(26 percent) result from fighting and bullying. At the
middle grades level, fighting and bullying account for
38 percent of the out-of-school suspensions.
Administrators noted that student conflict is partic-
ularly challenging because of the impact it can have on
others in the building. For example, fights can easily get
out of control and lead to chaotic situations. “Say there’s
a verbal altercation in the lunchroom,” one administrator
Chapter 2 | Reasons for Suspensions and Police Involvement
23
30%5% 10% 15% 20% 25%0
FIGURE 14
Most In-School Suspensions Result from Defiance of Adults and School Rules
ISS Infractions (Middle Grades)
8%
3%
Defiance of School Sta�
Disruptive Behaviors
School Violations
Attendance/Truancy
Defiance and School Rules = 62% of ISS
25%
26%
1%
0%
Physical Altercations
Bullying/Intimidation
Weapons Violations
Sexual Assault
Conflict and Threats to Safety = 32% of ISS
18%
13%
2%
Illegal Substances
Technology Violations
Theft/Vandalism
Illegal Behavior = 5% of ISS
1%
2%
Percent of Total Suspensions
30%5% 10% 15% 20% 25%0
Defiance of School Sta�
Disruptive Behaviors
School Violations
Attendance/Truancy
Defiance and School Rules = 87% of ISS
24%
16%
0%
0%
Physical Altercations
Bullying/Intimidation
Weapons Violations
Sexual Assault
Conflict and Threats to Safety = 7% of ISS
3%
4%
0%
Illegal Substances
Technology Violations
Theft/Vandalism
Illegal Behavior = 5% of ISS
1%
4%
Percent of Total Suspensions
ISS Infractions (High School)
27%
20%
Note: When an incident occurs, schools record the suspension and the reason for the suspension. This figure is an accounting of the reasons for suspensions when a student is assigned a suspension. Numbers reported are from 2012-13 adminis-trative data. Suspensions of students enrolled in charter, alternative, or special education schools are not included in this analysis.
explained. “Every kid in the lunchroom is getting up and
trying to go watch a potential fight. To me, that’s one of
the most important things as far as climate is concerned.”
Pervasive student conflict can also weaken students’
connection to school. “When students see fighting every
day, they can say, ‘I don’t want to go to school today,
because who knows what could happen,’” an adminis-
trator reported. By reducing fights, they believed that
students would be able to concentrate on learning and
would want to be in the school building.
According to some administrators, conflicts are
generally the result of limited social-emotional skills
of students. “Many of our students do not know how to
socialize in a positive sense; that’s why we see a lot of
fights,” one principal explained. “The biggest problem
we have is [teaching] students to be socially responsible
and understand how to either talk to adults or talk to their
peers in a positive, educational way.” Administrators
witness students using profanity, slurs, and other
put-downs as a routine part of their interactions. One
assistant dean characterized cursing as natural as
“breathing to kids now. ‘Okay, good morning, [expletive].’
They greet each other vulgarly.”
Another principal said that students can feel com-
pelled by their peers to address disrespect:
If you’re 14 or 15 and you’re in the lunchroom,
and your friends say, “That girl over there
doesn’t like you, we heard her saying she
didn’t like you,” well, to buy into the peer
pressure, that person has to approach her,
or defend their own position.
A number of administrators expressed hope that giv-
ing students skills and tools to resolve their differences
would prevent verbal and physical fights from escalat-
ing. “[If we can] just figure out a way for our students to
be socially responsible, solve their own problems, or talk
with somebody, the majority of problems will go away,”
one person reasoned. “That is the underlying problem
that we have.”
High schools routinely use in-school suspensions in
response to minor behavioral problems. High schools
frequently issue in-school suspensions for violations of
UCHICAGO CCSR Research Report | Discipline Practices in Chicago Public Schools
24
general schools rules and attendance issues, as well as
defiance and disruption (see Figure 14). In-school sus-
pensions are rarely used for threats to school safety or
for illegal behavior. Just over half of the 10 high school
administrators we interviewed described regularly
responding to minor infractions—such as uniform
violations or being late for class—with in-school sus-
pensions. None of the 10 middle school administrators
used this approach.
When asked what happens to students who show up
to school out of uniform, one high school dean replied:
If they don’t have their uniform, students have
to sit an in-school suspension. Automatic. You
have to have your dress code, your uniform
on. There have been some exceptions, but if
they just didn’t feel like wearing their uniform
they don’t have the assets to go to class.
Another administrator said behaviors that would
trigger an ISS at their school included:
Not going to class on time, tardy to class too
many times, or calling somebody a ‘[expletive]’
for no apparent reason. Things that we try to
change, small behavior that leads to a bigger
one. Those are the things that can quickly get
you to in-school suspension.
These comments highlight how administrators may
issue in-school suspensions as a strategy for reducing
common and minor behavior issues.
Some administrators also view ISS as beneficial
for students and school culture more generally. The
theory is that responding strongly to minor infractions
reduces the chance of students engaging in more serious
behavior in the future. For example, one dean described
a situation where suspension can be used as a proactive
response to students’ emotional needs:
If a student is having a rough day, rough
situation, we get them out of the population.
We like to get them back into the school
community that day, but oftentimes that’s
not logical, because during the early part of
the day we saw things going on that if we let
them out there they’re fighting. Someone’s
going to say something insensitive to what’s
going on with them, and their coping skills
aren’t the greatest, and they’re in a really
bad mood. So this is a nurturing spot, a lot of
times it keeps them away from other things,
and we find that method to be very helpful.
By putting students dealing with challenging emo-
tions into an ISS, this dean believes he is protecting
students from potentially more serious conflict with
their peers. This is a strategy the school uses to sup-
port students who may have limited skills for managing
emotional stress.
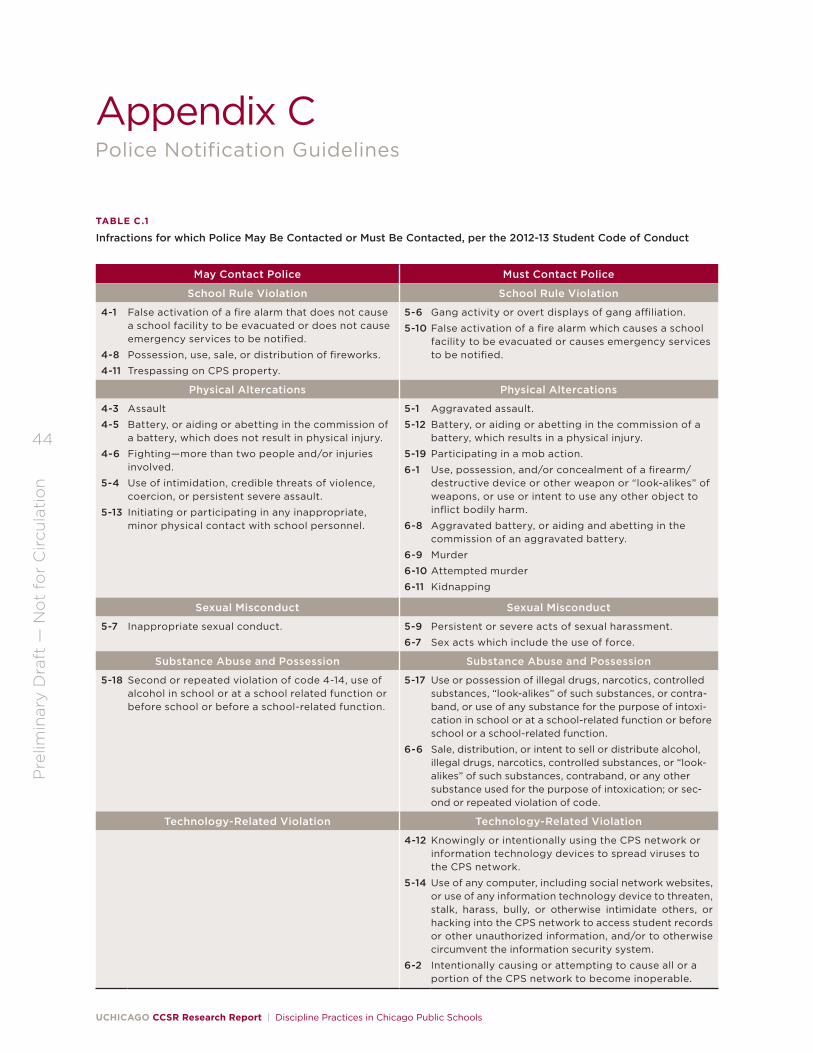
Police InvolvementEven very severe infractions usually do not result
in police involvement. The SCC specifies which
incidents require schools to contact police, which
allow discretion in whether or not to contact police,
and which do not warrant police involvement. For
example, in the case of battery with no resulting
physical injury, the SCC says schools may contact
police; but if the battery results in physical injury,
schools must contact police. Other infractions that
may or must include police involvement include theft,
drugs possession, and sexual misconduct. (For a full
list of infractions for which schools may or must contact
police, see Appendix C.)
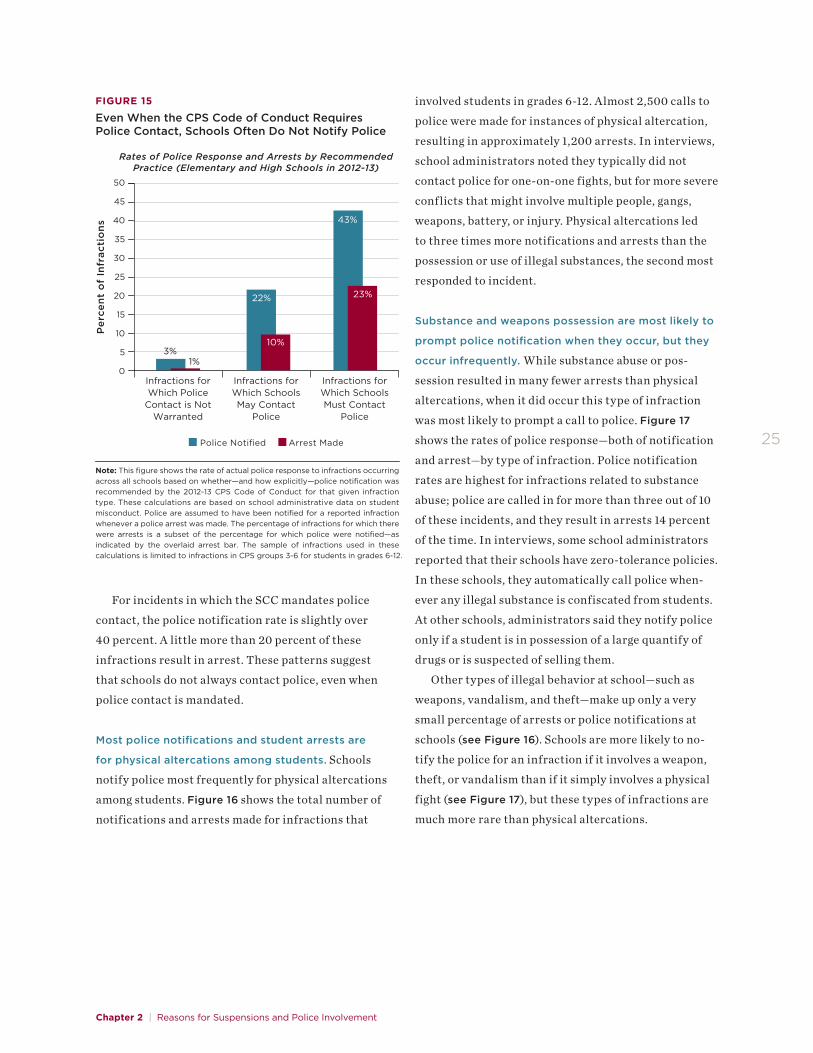
Even when students engage in behavior for which
the SCC recommends or requires police notification,
schools usually do not involve police in these reported
incidents. Figure 15 shows the rate of police involvement
for incidents involving students in grades 6-12 by SCC
recommendations for police notification. Only about 3
percent of incidents for which police involvement is not
recommended or required result in police notification,
and even fewer result in arrest; this indicates that
schools are generally not involving police when it is
recommended that they not notify police. For incidents
where the SCC specifies that police may be notified,
police notification occurs only 22 percent of the time,
or for 1-in-5 of these incidents, and arrest occurs about
10 percent of the time.
Chapter 2 | Reasons for Suspensions and Police Involvement
25
Per
cen
t o
f In
frac
tio
ns
25
20
15
0
30
Infractions for Which Police
Contact is Not Warranted
Infractions for Which Schools May Contact
Police
Infractions for Which Schools Must Contact
Police
FIGURE 15
Even When the CPS Code of Conduct Requires Police Contact, Schools Often Do Not Notify Police
10
5
45
40
35
50
3%1%
Police Notified Arrest Made
Note: This figure shows the rate of actual police response to infractions occurring across all schools based on whether—and how explicitly—police notification was recommended by the 2012-13 CPS Code of Conduct for that given infraction type. These calculations are based on school administrative data on student misconduct. Police are assumed to have been notified for a reported infraction whenever a police arrest was made. The percentage of infractions for which there were arrests is a subset of the percentage for which police were notified—as indicated by the overlaid arrest bar. The sample of infractions used in these calculations is limited to infractions in CPS groups 3-6 for students in grades 6-12.
Rates of Police Response and Arrests by Recommended Practice (Elementary and High Schools in 2012-13)
22%
10%
43%
23%
For incidents in which the SCC mandates police
contact, the police notification rate is slightly over
40 percent. A little more than 20 percent of these
infractions result in arrest. These patterns suggest
that schools do not always contact police, even when
police contact is mandated.
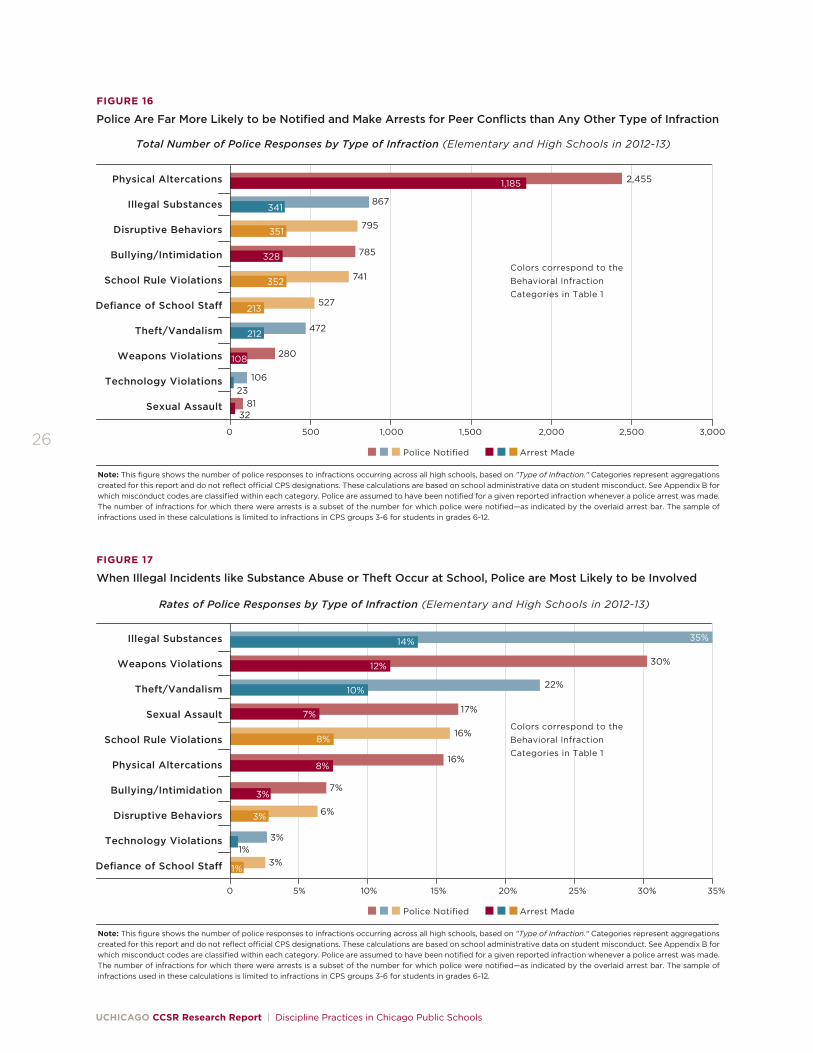
Most police notifications and student arrests are
for physical altercations among students. Schools
notify police most frequently for physical altercations
among students. Figure 16 shows the total number of
notifications and arrests made for infractions that
involved students in grades 6-12. Almost 2,500 calls to
police were made for instances of physical altercation,
resulting in approximately 1,200 arrests. In interviews,
school administrators noted they typically did not
contact police for one-on-one fights, but for more severe
conflicts that might involve multiple people, gangs,
weapons, battery, or injury. Physical altercations led
to three times more notifications and arrests than the
possession or use of illegal substances, the second most
responded to incident.
Substance and weapons possession are most likely to
prompt police notification when they occur, but they
occur infrequently. While substance abuse or pos-
session resulted in many fewer arrests than physical
altercations, when it did occur this type of infraction
was most likely to prompt a call to police. Figure 17
shows the rates of police response—both of notification
and arrest—by type of infraction. Police notification
rates are highest for infractions related to substance
abuse; police are called in for more than three out of 10
of these incidents, and they result in arrests 14 percent
of the time. In interviews, some school administrators
reported that their schools have zero-tolerance policies.
In these schools, they automatically call police when-
ever any illegal substance is confiscated from students.
At other schools, administrators said they notify police
only if a student is in possession of a large quantify of
drugs or is suspected of selling them.
Other types of illegal behavior at school—such as
weapons, vandalism, and theft—make up only a very
small percentage of arrests or police notifications at
schools (see Figure 16). Schools are more likely to no-
tify the police for an infraction if it involves a weapon,
theft, or vandalism than if it simply involves a physical
fight (see Figure 17), but these types of infractions are
much more rare than physical altercations.
UCHICAGO CCSR Research Report | Discipline Practices in Chicago Public Schools
263,0002,5002,0001,5001,0005000
FIGURE 16
Police Are Far More Likely to be Notified and Make Arrests for Peer Conflicts than Any Other Type of Infraction
Physical Altercations
Illegal Substances
Disruptive Behaviors
Bullying/Intimidation
School Rule Violations
Defiance of School Sta�
Theft/Vandalism
Weapons Violations
Technology Violations
Sexual Assault
2,4551,185
867341
795351
785328
527213
472212
280108
10623
8132
Total Number of Police Responses by Type of Infraction (Elementary and High Schools in 2012-13)
Police Notified Arrest Made
Note: This figure shows the number of police responses to infractions occurring across all high schools, based on "Type of Infraction." Categories represent aggregations created for this report and do not reflect o�cial CPS designations. These calculations are based on school administrative data on student misconduct. See Appendix B for which misconduct codes are classified within each category. Police are assumed to have been notified for a given reported infraction whenever a police arrest was made. The number of infractions for which there were arrests is a subset of the number for which police were notified—as indicated by the overlaid arrest bar. The sample of infractions used in these calculations is limited to infractions in CPS groups 3-6 for students in grades 6-12.
741352Colors correspond to the Behavioral Infraction Categories in Table 1
35%25%20%15%10%5% 30%0
FIGURE 17
When Illegal Incidents like Substance Abuse or Theft Occur at School, Police are Most Likely to be Involved
Illegal Substances
Weapons Violations
Theft/Vandalism
Sexual Assault
School Rule Violations
Physical Altercations
Bullying/Intimidation
Disruptive Behaviors
Technology Violations
Defiance of School Sta�
30%12%
22%10%
17%7%
16%8%
16%8%
7%3%
6%3%
3%1%
3%1%
Rates of Police Responses by Type of Infraction (Elementary and High Schools in 2012-13)
14% 35%
Police Notified Arrest Made
Note: This figure shows the number of police responses to infractions occurring across all high schools, based on "Type of Infraction." Categories represent aggregations created for this report and do not reflect o�cial CPS designations. These calculations are based on school administrative data on student misconduct. See Appendix B for which misconduct codes are classified within each category. Police are assumed to have been notified for a given reported infraction whenever a police arrest was made. The number of infractions for which there were arrests is a subset of the number for which police were notified—as indicated by the overlaid arrest bar. The sample of infractions used in these calculations is limited to infractions in CPS groups 3-6 for students in grades 6-12.
Colors correspond to the Behavioral Infraction Categories in Table 1
Chapter 3 | Perceptions of School Safety and Order
27
CHAPTER 3
Perceptions of School Safety and Order
100%80%60%40%20%0
FIGURE 18
Many Teachers Report Problems with Student Disrespect in Their School
Student Disrespect of Teachers
Physical Conflicts Among Students
Disorder in Classrooms
Disorder in Hallways
Gang Activity
Robbery of Theft
Threats of Violence Towards Teachers
Note: This figure includes teacher responses to the 2013-14 My Voice, My School Teacher Survey. Charter schools, alternative schools, and special education schools are not included. See Appendix D for details on the survey, including response rates and question wording.
High School Teachers’ Reports of Disciplinary Problems in Their School, 2013-14
To a Great Extent Some A Little Not at All
It is difficult to contextualize the suspension rate
trends presented in Chapter 1 without knowing whether
the climate of safety and order in schools has changed
over time. School administrators are charged with
maintaining an orderly school environment; suspensions
are one of the primary tools that they use to enforce ex-
pected student behavior. Given the emphasis on reducing
the use of exclusionary disciplinary practices, one might
wonder whether reductions in suspensions have been
accompanied by more problems with safety and order.
Conversely, the reduced numbers of suspensions could
indicate that schools are facing fewer disciplinary prob-
lems, so administrators do not feel they need to assign
suspensions to students. In fact, this latter statement is
consistent with students’ and teachers’ reports about
what is happening in their schools, as described below.
Questions on the My Voice, My School surveys cap-
ture students’ and teachers’ perspectives about their ex-
periences in school. Students reported on how safe they
feel at various locations in and around their schools,
while teachers were asked to report the extent of various
problems at their schools (e.g., student disrespect of
teachers, physical conflicts among students, and gang
activity). Teachers’ and students’ responses in 2013-14
are shown in Figures 18 and 19, respectively. Because
elementary schools in Chicago generally serve students
in pre-kindergarten through eighth grade, we are not
able to differentiate responses from middle grades
teachers from teachers in lower grade levels. Therefore,
we only present responses from high school teachers.
High school teachers perceive student disrespect
of teachers to be the most common disciplinary
problem. About half of teachers report student disre-
spect of teachers is at least somewhat of a problem (see
Figure 18). At the same time, teachers also report there
are a number of other disciplinary problems in their
schools. About 10-15 percent of high school teachers
believe there are substantial problems with gang activ-
ity, fights among students, and disorder and theft in
their buildings, and about half of high school teachers
say these issues are somewhat of a problem.
UCHICAGO CCSR Research Report | Discipline Practices in Chicago Public Schools
28
100%80%60%40%20%0
FIGURE 19
Students Feel Safest in Places with a Stronger Adult Presence
Outside Around the School
Traveling Between Home and School
In Hallways and Bathrooms
In Your Classes
Students’ Reports of Their Feelings of Safety at and around School, 2013-14(Middle Grade Students)
Not Safe Somewhat Safe Mostly Safe Very Safe
100%80%60%40%20%0
Outside Around the School
Traveling Between Home and School
In Hallways and Bathrooms
In Your Classes
Students’ Reports of Their Feelings of Safety at and around School, 2013-14(High School Students)
Note: This figure includes responses from sixth- to twelfth-grade students to the 2013-14 My Voice, My School Student Survey. Charter schools, alternative schools, and special education schools are not included. See Appendix D for details on the survey, including response rates and question wording.
Students feel the most safe when they are in environ-
ments with strong adult presence. The surveys ask
students about how safe they feel in different areas of
the school, or on their route to and from school. Almost
all students across grade levels—about 90 percent—feel
mostly or very safe in their classrooms (see Figure 19).
However, only about 60 percent of students feel mostly
or very safe outside around the school where there is less
adult supervision. The area just outside of the school is
the place that students feel the least safe—even less safe
than when traveling between home and school. This is
an area that all students must pass through, but there
are often fewer adults to monitor student behavior in
this area than there are inside of the school building.
High school students’ and teachers’ perceptions of
safety and order have improved over time. These
same questions about school safety and discipline have
been asked of students and teachers across school years,
so we can track how students’ and teachers’ perceptions
of their schools have changed over time. To track overall
changes in climate, the questions are combined into
measures that capture students’ and teachers’ overall
perceptions. Figure 20 shows trends in students’ and
teachers’ reports of safety between 2006-07 and
2013-14.
While about half of high school teachers say they
face at least some problems in terms of conflict, disrup-
tion, and disorder at their schools, they are reporting
climates that are much safer, less disruptive, and more
orderly than they were in 2006-07 (see Figure 20).
High school teachers reported substantially fewer
disciplinary problems from the 2008-09 school year
to the 2011-12 school year; this is consistent with the
period of the Culture of Calm, which targeted a number
of high schools. There were no improvements in the
2012-13 school year, but then a sharp improvement
was seen again in the 2013-14 school year.
High school students’ reports of their perceptions
of safety at school generally mirror those of high school
teachers; after no improvement from 2006-07 to
2008-09, they reported feeling more safe at school
Chapter 3 | Perceptions of School Safety and Order
29
FIGURE 20
Students’ and Teachers’ Reports of School Safety and Order Have Been ImprovingS
Trends in Reports of Safety and Disciplinary Problems
Middle Grade Students’ Perceptions of SafetyHigh School Students’ Perceptions of SafetyHigh School Teachers’ Reports of Disciplinary Problems
Note: The scores on the vertical axis were standardized based on the mean and standard deviation of the measure in 2012-13. A score of zero represents an average level of disciplinary problems or safety in 2012-13 across all CPS schools. Teachers’ reports of disciplinary problems were reverse coded so that more positive scores mean fewer problems. Scores that are less than zero indicate that the teacher or student reported feeling less safety and order than was typical in 2012-13, while scores that are greater than zero indicate the teacher or student felt more safe than was typical in 2012-13. A score of -1 is at about the 16th percentile of all schools and years, while a score of +1 is at about the 84th percentile. The teacher and student measures capture di�erent perceptions of the school environment, and cannot be compared to each other. Surveys were administered every other year until 2010-11 when they were administered every year, therefore this figure does not include data for 2007-08 and 2009-10.
from 2008-2009 to 2011-12. There were no improve-
ments in high school students’ feelings of safety in
2012-13, and then they improved again in 2013-14.
In the middle grades, students’ feelings of safety
improved only very slightly from 2006-07 through
2011-12. There was no improvement in the 2012-13
school year, but another slight uptick was seen in the
2013-14 school year.
The improvements in students’ and teachers’ percep-
tions of safety roughly correspond to the periods of
decline in high school suspension rates. There were no
declines in suspension rates before the 2009-10 school
year, but there were steady declines in suspension rates
in high schools only from 2009-10 through 2011-12; this
is the period of improving perceptions of safety among
students and teachers in high schools (see Figure 1
on p.11). In 2013-14, there was a noticeable decline in
suspension rates in both the middle and high school
grades, and there were also improvements in students’
and teachers’ reports of safety in this year, at both the
middle grades and high school levels.
School climate has been improving slightly in CPS
schools, at the same time that schools have been less
likely to use exclusionary disciplinary practices. It
could be that schools are seeing less of a need to use
exclusionary practices because of improvements in
school climate, or that school climate is improving
because schools are using disciplinary practices more
effectively over time. Regardless of the reason for
these trends, at the very least, they suggest that the
declining use of suspension rates has not led to a
worsening of school climate. At best, they suggest
that new practices in Chicago schools may be reducing
schools’ reliance on exclusionary practices. At the
same time, the district still has a great deal of work
to do to improve the instructional climate for middle
grade and high school students. Many students and
teachers still report problems with safety and order at
a number of schools in the district, and high school stu-
dents continue to be at high risk for being suspended.
30
Chapter 4 | Interpretive Summary
31
CHAPTER 4
Interpretive SummaryChicago Public Schools exemplifies patterns in the use of exclusionary discipline practices across the country. Suspension rates are high, especially for high school students. Schools disproportionately suspend and arrest African American students compared to other student groups. And most students are suspended for behaviors that challenge adult authority and school rules, rather than behaviors that directly threaten the safety of the school environment.
25 Allensworth & Easton (2007). 26 McFarland (2001); Vavrus & Cole (2002).27 Classroom order—the degree to which students are doing
the work that is expected in their class—is the strongest
predictor of learning gains among different elements of classroom instruction. For students to learn, classes need to be both orderly and challenging (Allensworth, Gwynne, Pareja, Sebastian, & Stevens, 2014; Gates Foundation, 2010).
Taking a long-term perspective, district trends give
reason for both optimism and pause. On one hand, out-
of-school suspension (OSS) and arrest rates have been
declining over the last several years. These downward
trends started before changes to CPS’s Student Code
of Conduct (SCC) and may have been facilitated by
the earlier Culture of Calm Initiative, at least in high
schools. In addition, requirements limiting the num-
ber of days for which students can be suspended per
incident seem to have had an immediate impact on
the length of out-of-school suspensions, especially in
high schools. Yet, in-school suspension (ISS) rates for
African American high school students are at an all-
time high, with big jumps occurring over the last two
years. While students receiving an ISS are technically
in school, they are still missing classroom instruction.
Research suggests that even small amounts of absence
can have substantial long-term consequences on educa-
tional attainment.25 Thus, an ISS may still lead stu-
dents to fall behind in their courses, even if they remain
in the building. These trends also suggest that dispari-
ties across racial/ethnic groups may continue to grow in
the future without significant changes in disciplinary
practices, especially for African American students.
These findings raise several issues for the district,
schools, and policymakers to consider as they attempt
to reduce the use of exclusionary discipline practices.
Since most suspensions are for non-violent, non-
threatening incidents, schools might be able to
reduce their use without compromising safety. One
concern that school administrators have about limiting
the use of suspensions is that there may be a trade-off
in terms of school safety. Yet, the high percentage of
suspensions for non-violent behaviors (e.g., disruption,
defiance, and school-rules violation) suggests poten-
tial opportunities for reducing student suspensions
without compromising the safety of school communi-
ties. Some studies suggest using suspensions for things
like defiance and disruption reflect the need to support
teachers’ instructional and de-escalation skills, as well
as supporting students’ positive behaviors and social-
emotional learning.26 Teachers need to maintain an
orderly classroom in order to do their jobs of teaching
and promoting student learning and disruptive stu-
dents can prevent this.27 This can be frustrating not
only because teachers feel personally disrespected but
also because they worry about other students in the
UCHICAGO CCSR Research Report | Discipline Practices in Chicago Public Schools
class being able to learn. Providing teachers and school
administrators with support and training on behav-
ioral management, and developing effective systems for
helping teachers deal with disruptive student behavior,
is needed if they are to reduce their reliance on exclu-
sionary practices. This is particularly critical in high
schools, where suspensions are most common.
Teachers who have large numbers of students with
low achievement levels need support in developing
strong skills in classroom management and conflict
resolution. Students with low achievement and dis-
abilities are much more likely to get suspended than
other students. This can exacerbate their problems in
school, as missing class can cause them to fall even fur-
ther behind. Other UChicago CCSR studies have found
that classrooms that serve students with low incoming
achievement are much more likely than classrooms
with high-achieving students to have problems with
student behavior—even when they have similar teachers
and similar subjects.28 Likewise, the school charac-
teristic that is most strongly associated with low levels
of safety is the average incoming achievement level of
students at the school. In fact, school safety is more
strongly related to the incoming academic skills of the
student body than to poverty or crime in the neighbor-
hood of the school, or in the neighborhoods where its
students live.29 There is a need to recognize the higher
demands on teachers and school staff who provide
instruction to students who have struggled with school
in the past; they need to have particularly strong skills
around engaging and supporting students in learning,
as well as in managing potential conflicts that arise.
There is a need to better understand the consequences
of replacing out-of-school suspensions with in-school
suspensions. The changes that CPS made in 2012 to
their SCC seem to have encouraged schools to reduce
their use of out-of-school suspensions. However, these
changes did not discourage them from using in-school
suspensions; instead, these changes may have con-
tributed to their growing use. In the absence of clear
alternatives to out-of-school suspensions, staff at some
schools may have simply responded to the new direc-
tives by issuing in-school suspensions in their place. It
could be that in-school suspensions are more effective
than out-of-school suspensions, or at least potentially
less harmful. Some students might view in-school
suspensions as a more salient punishment. Some
schools—as recommended by current district initia-
tives—might use in-school suspensions in a way that
keeps students from falling behind in their classes. On
the other hand, the differences in their consequences
for student engagement in school and the prevention of
future problems might not be much different than those
for out-of-school suspensions. And there are potential
costs to using in-school suspensions in schools, as they
require space and staff to enact. If the district is to
reduce the overall use of suspensions in high schools,
it may need to provide school leaders with concrete,
alternative responses to OSS in order to help them avoid
turning to other exclusionary practices.
The district still has substantial work to do if it is to
reduce disciplinary disparities by student subgroups.
Even though suspension and arrest rates have declined
over the last five years, Chicago still has very high
suspension rates for African American high school
students, students with disabilities, and students with
weak academic skills. African American high school
boys are at particular risk of being suspended or
arrested in any given year. This leads to questions
about what can be done to reduce the discipline
disparities that exist.
One issue is the degree to which students in the
same school are at different levels of risk for suspension,
based on the structures that are in place at the school
around discipline. To address within-school dispari-
ties, schools might consider comparing their suspension
rates based on students’ race, gender, disability status,
and incoming achievement levels to discern different
levels of suspension risk for their students and to
develop strategies to reduce those disparities.
Another issue is the degree to which there are
Chapter 4 | Interpretive Summary
33
Coming Next: Variation in Discipline Practices Across Schools
This report is the first step in understanding discipline practices in CPS. While districtwide trends are helpful, it is at the school level that districtwide policies are translated into outcomes for students. The next report will show how schools vary in their approaches to discipline. It will answer questions such as:
• What is the variation in suspension rates across schools and among schools that serve similar student populations?
• Which types of schools are more likely to suspend students than others?
• How are schools’ exclusionary disciplinary prac-tices related to school climate and to the quality of the classroom instructional environment?
A third report in the series will examine the use of alternative and preventative discipline strategies in CPS schools. Subsequent work will examine the consequences of changes in disciplinary policies for changes in school practices around discipline, as well as changes in school climate and instruction.
differences in disciplinary practices across schools
serving different populations of students. As will be
shown in the next report, there are large differences
across schools in suspension rates, and the schools
with the largest suspension rates tend to have three
characteristics in common: 1) they are high schools,
2) they predominantly serve African American
students, and 3) the average incoming achievement
levels of their students are below the district average.
As long as there are large differences in practices
across schools that serve different populations of
students, there will be substantial discipline
disparities in the district.
34
References
35
Pre
limin
ary
Dra
ft —
No
t fo
r C
ircu
lati
on
References
Allensworth, E..M., Gwynne, J.A., Moore, P., & de la Torre, M. (2014). Looking forward to high school and college: Middle grade indicators of readiness in Chicago Public Schools. Chicago, IL: University of Chicago Consortium on Chicago School Research.
Allensworth, E.M., Gwynne, J.A., Pareja, A.S., Sebastian, J., & Stevens, W.D. (2014). Free to fail or on-track to college: Setting the stage for academic challenge; classroom control and support. Chicago, IL: University of Chicago Consortium on Chicago School Research.
Allensworth, E.M., & Easton, J.Q. (2007). What matters for staying on-track and graduating in Chicago Public Schools. Chicago, IL: University of Chicago Consortium on Chicago School Research.
Allensworth, E., Ponisciak, S., & Mazzeo, C. (2009). The schools teachers leave: Teacher mobility in Chicago Public Schools. Chicago, IL: University of Chicago Consortium on Chicago School Research.
Alvarez, L. (2013, December 3). Seeing the toll, schools revisit zero tolerance. New York Times. Retrieved from http://www.nytimes.com/2013/12/03/education/seeing-the-toll-schools- revisit-zero-tolerance.html?_r=0
American Academy of Pediatrics Committee on School Health. (2003). Out-of-school suspension and expulsion. Pediatrics, 112 (5), 1206-1209.
American Psychological Association Zero Tolerance Task Force. (2008). Are zero tolerance policies effective in schools? An Evidentiary Review and Recommendations. American Psychologist, 63(9), 852–862.
Balfanz, R., Byrnes, V., & Fox, J. (2013). Sent home and put off-track: The antecedents, dispropor-tionalities, and consequences of being suspended in the ninth grade. In D. Losen (Ed.), Closing the school discipline gap: Research for policymakers. New York, NY: Teachers College Press.
Balfanz, R., Herzog, L., & MacIver, D.J. (2007). Preventing student disengagement and keeping stu-dents on the graduation path in urban middle grades schools: Early identification and effective interventions. Educational Psychologist, 42(4), 223-235.
Bryk, A.S., Sebring, P.B., Allensworth, E., Luppescu, S., & Easton, J.Q. (2010). Organizing schools for improvement: Lessons from Chicago. Chicago, IL: University of Chicago Press.
Chicago Public Schools Office of Social and Emotional Learning. (n.d.) Strategies. Retrieved from https://sites.google.com/site/cpspositivebehavior/home/about-positive-behavior- supports/strategies
Chicago Public Schools. (2012).Student Code of Conduct. Chicago, IL: Chicago Public Schools.
Chicago Public Schools. (2014a). CPS sees 36 percent drop in suspensions. Retrieved from http://cps.edu/News/Press_releases/Pages/PR1_02_07_2014.aspx
Chicago Public Schools. (2014b). CPS suspensions and expulsions reduction plan and data highlights. Retrieved from http://www.cpsboe.org/ content/documents/student_suspension_and_expulsion_reduction_plan.pdf
Chicago Public Schools. (2014c). Improving student safety and school climate in Chicago Public Schools. Retrieved from http://www.cityofchicago.org/content/dam/city/depts/mayor/Press%20Room/Press%20Releases/2014/July/07.02.14SafeCpsreport.pdf
Dawson, D.A. (1991). Family structure and children’s health and well-being: Data from the 1988 National Health Interview Survey on Child Health. Journal of Marriage and Family, 53(3), 573-584.
Fabelo, T., Thompson, M.D., Plotkin, M., Carmichael, D., Marchbanks, M.P. III, & Booth, E.A. (2011). Breaking schools’ rules: A statewide study of how school discipline relates to students’ success and juvenile justice involvement. New York, NY: Council of State Governments Justice Center.
Finn, J.D., & Servos, T.J. (2013). Misbehavior, suspensions, and security measures in high school: Racial/ethnic and gender differences. In D. Losen (Ed.), Closing the school discipline gap: Research for policy-makers. New York, NY: Teachers College Press.
Gates Foundation. (2010). Learning about teaching: Initial findings from the measures of effective teaching project. Retrieved from http://www.metproject.org/downloads/Preliminary_Findings-Research_Paper.pdf
UCHICAGO CCSR Research Report | Discipline Practices in Chicago Public Schools
36
Pre
limin
ary
Dra
ft —
No
t fo
r C
ircu
lati
on
Hatch, A.J. (2002). Doing qualitative research in education settings. Albany, NY: State University of New York Press.
Heaviside, S., Rowand, C., Williams, C., & Farris, E. (1998). Violence and discipline problems in U.S. public Schools: 1996-97. (NCES 98030). U.S. Department of Education. Washington, DC: National Center for Education Statistics. Retrieved from http://nces.ed.gov/pubs98/98030.pdf
Himmelstein, K.E.W., & Brückner, H. (2010). Criminal-justice and school sanctions against nonhetero-sexual youth: A national longitudinal study. Pediatrics, 127 (1), 49-57.
Kieffer, M.J., & Marinell, W.H. (2012). Navigating the middle grades: Evidence from New York City. New York, NY: Research Alliance for New York City Schools.
Kwong, J. (2014, February 26). SFUSD board approves measure favoring alternatives to suspensions. The San Francisco Examiner. Retrieved from http://www.sfexaminer.com/sanfrancisco/sfusd-board-approves-measure-favoring-alternatives-to-suspensions/Content?oid=2715041
LeCompte, M.D., & Preissle, J. (1993). Ethnography and qualitative design in educational research (2nd Ed.). New York, NY: Academic Press.
Losen, D.J., Hewitt, D., & Toldson, I. (2014). Eliminating excessive and unfair exclusionary discipline in schools policy recommendations for reducing disparities. Bloomington, IN: The Equity Project at Indiana University.
Losen, D.J., & Gillespie, J. (2012). Opportunities suspended: The disparate impact of disci-plinary exclusion from school. Los Angeles, CA: The Civil Rights Project/Proyecto Derechoes Civiles.
Losen, D.J., & Martinez, T. (2013). Out of school and off track: The overuse of suspensions in American middle and high schools. Los, Angeles, CA: The Civil Rights Project/Proyecto Derechoes Civiles.
Mattison, E., & Amber, M.S. (2007). Closing the achievement gap: The association of racial climate with achievement and behavioral outcomes. American Journal of Community Psychology, 40(1-2), 1-12.
McFarland, D.A. (2001). Student resistance: How the formal and informal organi-zation of classrooms facilitate everyday forms of student defiance. American Journal of Sociology, 107(3), 612-678.
Neild, R.C., & Balfanz, R. (2006). Unfulfilled promise: The dimensions and characteristics of Philadelphia’s dropout crisis, 2000-05. Philadelphia, PA: Philadelphia Youth Transitions Collaborative.
Osher, D., Bear, G.G., Sprague, J.R., & Doyle, W. (2010).How can we improve school discipline? Educational Researcher, 39(1), 48-58.
Porowski, A., O’Conner, R., & Aikaterini, P. (2014). Disproportionality in school discipline: An assessment of trends in Maryland, 2009-12. Washington, DC: U.S. Department of Education, Institute of Education Sciences, National Center for Education and Regional Assistance, Regional Educational Laboratory Mid-Atlantic.
Schreck, C.J., & Miller, J.M. (2003). Sources of fear of crime at school: What is the relative contribution of disorder, individual characteristics, and school security. Journal of School Violence, 2(4), 57–79.
Shah, N., & McNeil, M. (2013). Suspension, expulsion data cast some in harsh light. Education Week Quality Counts, 32(16), 12.
Skiba, R.J., Horner, R.H., Chung, C., Rausch, M.K., May, S.L., & Tobin, T. (2011). Race is not neutral: A national investigation of African American and Latino disproportionality in school disci-pline. School Psychology Review, 40(1), 85-107.
Skiba, R.J., & Rausch, M.K. (2010). Suspended education: Urban middle schools in crisis. Los Angeles, CA: Civil Rights Project at UCLA.
Skiba, R.J., Shure, L., & Williams, N. (2012). Racial and ethnic disproportionality in suspension and expulsion. In A.L. Noltemeyer & C.S. Mcloughlin (Eds.), Disproportionality in education and special education: A guide to creating more equitable learning environments. Springfield, IL: Charles C. Thomas Publisher, Ltd.
Steinberg, M., Allensworth, E., & Johnson, W.D. (2011).Student and teacher safety in Chicago Public Schools: The roles of community context and school social organization. Chicago, IL: University of Chicago Consortium on Chicago School Research.
U.S. Department of Education. (2014). Guiding principals: A resource guide for improving school climate & discipline. Washington, DC: U.S. Department of Education.
Vavrus, F., & Cole, K.M. (2002). ‘I didn’t do nothing’: The discursive construction of school suspension. The Urban Review, 34(2), 87-111.
Watanabe, T. (2013, May 14). L.A. Unified bans suspension for ‘willful defiance.’ The Los Angeles Times. Retrieved from http://articles.latimes.com/print/2013/may/14/local/la-me-lausd- suspension-20130515
Welch, K., & Payne, A.A. (2010). Racial threat and punitive school discipline. Social Problems, 57(1), 25-48.
Appendix A
37
Appendix AData and Methods
Schools and Years IncludedThis study examines discipline practices during the
2012-13 and 2013-14 school years and the ways in which
the use of exclusionary practices and behavioral chal-
lenges have changed since 2008-09. It incorporates
administrative data from two sources: 1) Chicago Public
Schools (CPS) administrative records on suspensions and
disciplinary infractions from 2008-09 to 2013-14, and
2) data from the Chicago Police Department (CPD) on
arrests from 2006-07 to 2011-12. We also use information
from interviews of administrators that were conducted
for this study in the spring and early summer of 2013.
For CPS administrative data, we identify students in
grades 6-12 (the middle grades and high school years)
who are enrolled in regular schools—this does not
include students in alternative, special education, or
charter schools. Students were considered enrolled if
they were enrolled in a CPS school in September and/
or May of that school year. All students who are actively
enrolled in grades 6-12 are included in the analyses of
trends in arrest rates from CPD data, including stu-
dents attending neighborhood, vocational, charter, and
selective schools. (See Table A.1 for sample size.)
Alternative schools—those designed for re-enrollment
of dropouts—and schools for severely disabled students
are substantially different from other schools in the
district in many ways and they are not comparable to
regular CPS schools in terms of discipline or instruc-
tional measures. Therefore, they are not included in this
study. Charter schools do not provide consistent admin-
istrative data on misconduct across all years to CPS, and
some schools use their own specific discipline codes,
which are not comparable to district records. Therefore,
they cannot be included in the analyses of suspensions or
infractions. Charter schools are included in the analysis
of trends in arrests. The trends for arrest rates look
similar, whether or not charter schools are included.
Discipline RecordsCPS administrative files contain information on the
student infractions that are reported when disciplinary
incidents occur. These records tell us why students are
getting in trouble, how many students were involved in
the incident, and each of the infractions that comprised
the incident.
While these administrative files tell us which
students are getting in trouble, and for what types of
infractions, they may not necessarily provide a com-
plete assessment of the problems that are occurring at
schools. Schools may not be consistent in the degree to
TABLE A.1
Sample Size by Grade and Year
Analysis Using CPS Data Analysis Using CPD Data
School Year Middle Grade Students (N)
High School Students (N)
Middle Grade Students (N)
High School Students (N)
2006-07 — — 88,502 108,546
2007-08 — — 87,075 108,546
2008-09 86,274 100,970 89,555 110,993
2009-10 82,254 99,654 86,288 112,739
2010-11 79,574 95,384 84,540 111,513
2011-12 78,606 92,926 84,484 111,179
2012-13 77,337 90,049 — —
2013-14 74,955 87,364 — —
UCHICAGO CCSR Research Report | Discipline Practices in Chicago Public Schools
38
which they are aware of incidents or how they report
incidents, or the way that they record incidents if a
student does not receive a suspension. In our interviews
with administrators, we learned that in some high
schools, lower-level infractions often were not reported
at all, particularly if they did not result in a suspension.
This is consistent with the data in the discipline files;
low-level infractions (falling in Groups 1 or 2) are much
more rarely seen in the data than incidents that would
be expected to occur at much lower rates (falling in
Group 3 or higher). Almost all of the infractions that are
reported (87 percent) include a suspension, which also
suggests that schools rarely report infractions unless
they result in a suspension.
Disciplinary incidents can include multiple infrac-
tions and multiple students. One particular student may
have multiple infractions associated with an incident.
For example, if an incident involves both bullying and
a physical fight between two students, one student may
receive an infraction of “Fighting: Two people, no inju-
ries,” and the other may receive that infraction as well
as “Intimidation/Threats/Coercion/Severe Bullying.” In
our analysis, in order to avoid inflating the number of
instances of misconduct, we focus on counts of inci-
dents rather than infractions. In cases where infrac-
tions of two different types are reported for the same
incident for the same student, we use the most serious
infraction to define the incident for the student.
Police Records CPD data provide information on all arrests and report-
ed criminal incidents in Chicago. These records identify
individuals arrested, the location and date of the arrest,
the location and date of the incident, and a description
of the charges.
Chapin Hall matched the CPD data to CPS admin-
istrative data to identify arrest records for all students
in this study. Student names in the CPS administra-
tive records (for all students enrolled in 1991 through
fall 2013) and the CPD data (all arrests occurring from
2000 through 2012) were cleaned and standardized.
Each component of the name (last, first, and middle)
was scanned in order to remove unwanted characters
and to correct embedded names (i.e., two names in one
name field). MatchWorks’ AutoStan program was used
for name standardization. De-duplication and matching
were done using AutoMatch software. Fields included
in the match were first name, middle name or initial,
last name, birth date, race, and gender. Matches are
performed separately from analysis on suspensions
and arrests, and names are removed before analysis;
analysts, therefore, have an ID number but do not know
the identity of subjects.
Arrest records were obtained for all students who
were actively enrolled in grades 6-12 during the years
being studied. Students who left CPS are included in
the analyses for the years in which they were actively
enrolled. These include arrests at school and outside of
school. At the time of this report, CPD data were only
available through December 2012, so we are only able to
report on arrests using this data set through school year
2011-12.
Qualitative InterviewsTo better understand why schools use different disci-
plinary approaches, one administrator at each of 20
schools was interviewed in the late spring and summer
of 2013. The semi-structured interviews, which were
done on location at the interviewee’s school, varied in
length and number of sessions but took on average 1.75
hours across one to three sessions. The schools con-
sisted of 10 high schools and 10 schools serving middle
grades that were selected to participate based on differ-
ent school and student populations, as described below.
School sample selection for the qualitative interviews.
We used CPS administrative data to guide the selec-
tion process for the schools in which we interviewed
administrators. We compared actual suspension rates
to rates of suspensions that were predicted by prior
student achievement, as well as the prevalence of crime
and poverty in the students’ home neighborhoods. This
comparison was used to identify three strata of schools:
1) schools suspending more than other schools serving
similar student populations, 2) schools with similar
suspension rates to other schools serving similar
student populations, and 3) schools with lower suspen-
sion rates than other schools serving similar student
populations. We then stratified explicitly on race—
Appendix A
39TABLE A.2
Sampling Scheme for Interview Schools
Comparison of Actual to Predicted Suspension Rates
Majority African American Majority Not African American
Higher Suspension Rate than Expected
2 Middle Grade Schools 2 High Schools
2 Middle Grade Schools 2 High Schools
Suspension Rate about as Expected
1 Middle Grade School 1 High School
1 Middle Grade School 1 High School
Lower Suspension Rate than Expected
2 Middle Grade Schools 2 High Schools
2 Middle Grade Schools 2 High Schools
30 Hatch (2002); LeCompte & Preissle (1993).
identifying schools that were majority African American
(more than 65 percent of students) and those that were
not. We stratified by race because, on average, suspen-
sion rates were substantially higher in schools that
predominantly served African American students;
without this stratification, the three categories would
have largely been defined based on their racial com-
position. Once schools were categorized, we randomly
selected high schools and schools serving the middle
grades from within each of the categories shown in
Table A.2.
Interviews were conducted with staff who were
considered the best contact person from their school
to speak about discipline practices and policies in their
school, which included principals, assistant principals,
deans, and/or dean supervisors. We reached out to
schools by calling the school main office number and
relied on them to direct us to the appropriate person
(“the individual in charge of discipline in your school”).
In situations where they were uncertain, we asked for
a school contact who could better direct us.
Our qualitative data was analyzed using typological
analysis. Interviews were transcribed and entered into
the ATLAS.ti qualitative software program. Transcript
quotes were then labeled according to broad themes
that paralleled the interview protocol. This process
facilitated data management, allowing us to easily sort
and retrieve data for further analysis. Working with
general themes individually, we coded transcripts
excerpts inductively for emerging patterns.
UCHICAGO CCSR Research Report | Discipline Practices in Chicago Public Schools
40
Appendix BInfractions and Codes
In Chapter 2, we discuss behavior categories and
behavior groups that we developed using the 2012-13
Chicago Public Schools Student Code of Conduct (SCC).
In Table B.1, numbers in the left-hand column corre-
spond with infraction codes in the SCC. The first number
is the infraction group. The SCC categorizes infractions
into six different groups, according to the extent to which
the infraction disrupts the learning environment. The
second number denotes the nature of the infraction.
For more information on infraction codes, see the SCC:
http://cps.edu/Pages/StudentCodeofConduct.aspx. We
split the 216 SCC infractions into three main categories
shown in these appendix tables. Note that these are not
CPS-defined categories.
TABLE B.1
Defiance and School Rules Violations Defiance of School Staff
2-8 Defying (disobeying) the authority of school personnel.
3-5 Persisting in serious acts of disobedience or inappropriate behaviors listed in Groups 1 through 3 of this SCC.
5-5 Persistent defiance of multiple directives by school personnel resulting in the most serious disruption of the educational process.
Disruptive Behaviors
1-1 Running and/or making excessive noise in the hall or building.
1-2 Leaving the classroom without permission.
1-3 Engaging in any behavior that is disruptive to the orderly process of classroom instruction.
2-3 Interfering with school authorities and programs through walkouts or sit-ins.
2-4 Initiating or participating in any unacceptable minor physical actions.
2-6 Exhibiting or publishing any profane, obscene, indecent, immoral, libelous, or offensive materials, or using such language or gestures.
3-1 Disruptive behavior on the school bus.
3-6 Any behavior not otherwise listed in Groups 1 through 3 of this SCC that seriously disrupts the educational process.
4-9 Any behavior not otherwise listed in Groups 1 through 4 of this SCC that very seriously disrupts the educational process.
4-10 Disorderly conduct.
5-19 Participating in a mob action—a large or disorderly group of students using force to cause injury to a person or property, or persisting in severe disruption after being directed to cease by school personnel or police.
6-4 Bomb threat—false indication that a bomb, or other explosive of any nature, is concealed in a place that would endanger human life if activated.
41
Appendix B
Miscellaneous School Rule Violations
1-4 Loitering, or occupying an unauthorized place in the school or on school grounds.
2-1 Posting or distributing unauthorized written materials on school grounds.
2-5 Failing to abide by school rules and regulations not otherwise listed in the SCC.
2-9 Failing to provide proper identification.
2-10 Unauthorized use of school parking lots or other areas.
3-2 Gambling—participating in games of chance or skill for money or things of value.
3-7 Forgery—false and fraudulent making or altering of a document or the use of such a document.
3-8 Plagiarizing, cheating, and/or copying the work of another student or other source.
3-9 Overt display of gang affiliation.
3-12 Inappropriately wearing any JROTC or Military Academy Uniform on or off school grounds.
4-1 False activation of a fire alarm that does not cause a school facility to be evacuated or does not cause emergency services to be notified.
4-8 Possession, use, sale, or distribution of fireworks.
Miscellaneous School Violations
4-11 Trespassing on CPS property—entering CPS property when previously prohibited, or remaining on school grounds after receiving a request to depart.
5-6 Gang activity or overt displays of gang affiliation.
5-8 Engaging in any other illegal behavior which interferes with the school’s educational process, including attempting an illegal behavior.
5-10 False activation of a fire alarm which causes a school facility to be evacuated or causes emergency services to be notified.
5-16 Inappropriate consensual sexual activity.
Attendance/Truancy
1-5 Failing to attend class without a valid excuse.
1-6 Persistent tardiness to school or class.
2-2 Leaving the school without permission.
TABLE B.1: CONTINUED
Defiance and School Rules Violations
UCHICAGO CCSR Research Report | Discipline Practices in Chicago Public Schools
42
Pre
limin
ary
Dra
ft —
No
t fo
r C
ircu
lati
on
TABLE B.2
Conflicts and Threats to Safety
Physical Altercations
3-3 Fighting—physical contact between two people with intent to harm, but no injuries result.
4-3 Assault—an attempt or reasonable threat to inflict injury on someone with a show of force that would cause the victim to expect an immediate battery.
4-5 Battery (unwanted bodily contact with another person without legal justification), or aiding or abetting in the commission of a battery which does not result in a physical injury.
4-6 Fighting—physical contact between more than two people with intent to harm, or physical contact between two people with intent to harm that results in injury.
5-1 Aggravated assault—assault with a deadly weapon or done by a person who conceals his/her identity, or any assault against school personnel.
5-12 Battery, or aiding or abetting in the commission of a battery, which results in a physical injury. Battery means unwanted bodily contact with another person without legal justification.
5-13 Initiating or participating in any inappropriate, minor physical contact with school personnel, such as pushing school personnel out of the way in order to physically fight with another student.
6-8 Aggravated battery (battery that causes great harm, is done with a deadly weapon, is done by a person who conceals his/her identity, or the use of physical force against school personnel) or aiding and abetting in the commission of an aggravated battery.
6-10 Attempted murder—an act that constitutes a substantial step toward intended commission of murder.
Sexual Assault
5-7 Inappropriate sexual conduct, including unwelcomed sexual contact, indecent exposure, transmitting sexually suggestive images through information technology devices, or other sexual activities which do not involve the use of force.
5-9 Persistent or severe acts of sexual harassment—unwelcome sexual or gender-based conduct (either physical or verbal) and/or conduct of a sexual nature which is sufficiently severe, persistent, or pervasive to limit a student’s ability to participate in or benefit from the educational program or which creates a hostile or abusive school environment.
6-7 Sex acts which include the use of force.
Weapons Violations
4-13 Possession of any dangerous object as defined by this SCC: First offense.
5-11 Second or repeated violation of Behavior 4-13; possession of any dangerous object as defined by this SCC.
6-1 Use, possession, and/or concealment of a firearm/destructive device or other weapon or “look-alikes” of weapons as defined in the Additional Resources section, or use or intent to use any other object to inflict bodily harm.
Bullying/Intimidation
3-4 Profane, obscene, indecent, and immoral or seriously offensive language and gestures, propositions, behavior, or harassment based on race, color, national origin, sex, gender, sexual orientation, age, religion, gender identity, gender expression, or disability.
3-10 Bullying behaviors.
4-2 Extortion—obtaining money or information from another by coercion or intimidation.
5-4 Use of intimidation, credible threats of violence, coercion, or persistent severe bullying. Intimidation is behavior that prevents or discourages another student from exercising his/her right to education, or using force against students, school personnel, and school visitors.
6-5 Robbery—taking personal property in the possession of another by use of force or by threatening the imminent use of force.
43
Appendix B
TABLE B.3
Illegal Behaviors
Illegal Substances
2-7 Possession (physical control over items, such as contained in clothing, lockers, or bags) and/or use of tobacco products, matches, cigarette lighters, or rolling papers.
4-14 Use or possession of alcohol in school or at, before, or after a school related function: first offense.
5-17 Use or possession of illegal drugs, narcotics, controlled substances, “look-alikes” of such substances, or contraband, or use of any other substance for the purpose of intoxication in or before school or a school-related function.
5-18 Second or repeated violation of Behavior 4-14, use or possession of alcohol in school or at, before, or after a school-related function.
6-6 Sale, distribution, or intent to sell or distribute alcohol, illegal drugs, narcotics, controlled substances, “look-alikes” of such substances, contraband, or any other substance used for the purpose of intoxication, or repeated violation of Behavior 5-17.
Technology Violations
1-7 Use of the CPS network for the purpose of accessing noneducational materials, such as games, pornographic materials, and other inappropriate materials.
2-11 Use of the CPS network for the purposes of distributing or downloading noneducational material.
2-12 Possession of cellular telephones or other information technology devices without prior permission of the principal.
3-11 Unauthorized activation or use of cellular telephones or other information technology device.
3-13 Use of the CPS network or any information technology device for any unauthorized purpose not otherwise listed in this SCC.
4-12 Knowingly or intentionally using the CPS network or information technology devices to spread viruses to the CPS network.
5-14 Use of any computer, including social networking websites, or use of any information technology device to threaten, stalk, harass, bully, or otherwise intimidate others, or hacking (intentionally gaining access by illegal means or without authorization) into the CPS network to access student records or other unauthorized information, or to otherwise circumvent the information security system, regardless of intent.
6-2 Intentionally causing or attempting to cause all or a portion of the CPS network to become inoperable.
Theft/Vandalism
4-4 Vandalism (willful or malicious destruction or defacing of the property of others) or criminal damage to property at a cost less than $500.
4-7 Theft (unauthorized control over the physical property of another) or possession (physical control over, such as contained in clothing, lockers or bags) of stolen property that costs less than $150.
5-2 Theft (obtaining or exerting unauthorized control over) or possession (physical control over, including in clothing, lockers, or bags) of stolen property that costs more than $150.
5-3 Vandalism (willful or malicious destruction or defacing of property) or criminal damage to property that results in damage exceeding $500 or that is done to personal property belonging to any school personnel.
5-15 Burglary knowingly and without authority entering or remaining in a building or vehicle with intent to commit a felony or theft therein.
6-3 Arson—knowingly damaging, by means of fire or explosive, a building and/or the personal property of others.
6-12 Theft (obtaining or exerting unauthorized control over) or possession (physical control over, including in clothing, lockers, or bags) of stolen property that costs more than $1,000.
Pre
limin
ary
Dra
ft —
No
t fo
r C
ircu
lati
on
UCHICAGO CCSR Research Report | Discipline Practices in Chicago Public Schools
44
Appendix CPolice Notification Guidelines
TABLE C.1
Infractions for which Police May Be Contacted or Must Be Contacted, per the 2012-13 Student Code of Conduct
May Contact Police Must Contact Police
School Rule Violation School Rule Violation
4-1 4-84-11
False activation of a fire alarm that does not cause a school facility to be evacuated or does not cause emergency services to be notified.
Possession, use, sale, or distribution of fireworks.
Trespassing on CPS property.
5-6 5-10
Gang activity or overt displays of gang affiliation.
False activation of a fire alarm which causes a school facility to be evacuated or causes emergency services to be notified.
Physical Altercations Physical Altercations
4-3 4-5 4-6 5-4 5-13
Assault
Battery, or aiding or abetting in the commission of a battery, which does not result in physical injury.
Fighting—more than two people and/or injuries involved.
Use of intimidation, credible threats of violence, coercion, or persistent severe assault.
Initiating or participating in any inappropriate, minor physical contact with school personnel.
5-1 5-12 5-19 6-1 6-8 6-9 6-10 6-11
Aggravated assault.
Battery, or aiding or abetting in the commission of a battery, which results in a physical injury.
Participating in a mob action.
Use, possession, and/or concealment of a firearm/destructive device or other weapon or “look-alikes” of weapons, or use or intent to use any other object to inflict bodily harm.
Aggravated battery, or aiding and abetting in the commission of an aggravated battery.
Murder
Attempted murder
Kidnapping
Sexual Misconduct Sexual Misconduct
5-7 Inappropriate sexual conduct. 5-9 6-7
Persistent or severe acts of sexual harassment.
Sex acts which include the use of force.
Substance Abuse and Possession Substance Abuse and Possession
5-18 Second or repeated violation of code 4-14, use of alcohol in school or at a school related function or before school or before a school-related function.
5-17 6-6
Use or possession of illegal drugs, narcotics, controlled substances, “look-alikes” of such substances, or contra-band, or use of any substance for the purpose of intoxi-cation in school or at a school-related function or before school or a school-related function.
Sale, distribution, or intent to sell or distribute alcohol, illegal drugs, narcotics, controlled substances, or “look-alikes” of such substances, contraband, or any other substance used for the purpose of intoxication; or sec-ond or repeated violation of code.
Knowingly or intentionally using the CPS network or information technology devices to spread viruses to the CPS network.
Use of any computer, including social network websites, or use of any information technology device to threaten, stalk, harass, bully, or otherwise intimidate others, or hacking into the CPS network to access student records or other unauthorized information, and/or to otherwise circumvent the information security system.
Intentionally causing or attempting to cause all or a portion of the CPS network to become inoperable.
Pre
limin
ary
Dra
ft —
No
t fo
r C
ircu
lati
on
45
Appendix D
Appendix DData from Surveys of Students and Teachers
TABLE D.1
Response Rates across Years for Non-Charter Schools with Students in Grades 6-12.
Year Grade Level
Number of Responding
Students
Students’ Response
Rate
Number of Responding
Teachers
Teachers’ Response
Rate
2006-07Elementary
High74,202 60,301
84% 63%
12,486 4,283
76% 64%
2008-09Elementary
High65,816 53,318
79% 58%
9,020 3,712
54% 53%
2010-11Elementary
High66,646 64,113
86% 72%
7,133 3,247
50% 53%
2011-12Elementary
High61,578 61,796
81% 71%
8,855 4,258
64% 67%
2012-13 Elementary
High64,631 61,493
86% 73%
11,608 4,493
83% 78%
2013-14Elementary
High64,940 58,080
91% 72%
11,175 4,276
82% 79%
Note: At least a 10 percent response rate was required to be considered participating.
31 Steinberg et al. (2011).33 Allensworth, Ponisciak, & Mazzeo (2009).
UChicago CCSR has been partnering with CPS to survey
all students in grades 6-12 and all teachers across the
district since the early 1990s. This survey, entitled My
Voice, My School, was administered in 2007, 2009, and
annually from 2011 through 2014. Sets of questions were
combined into measures of general concepts, such as
students’ feelings of safety and teachers’ perceptions of
crime and disorder, using Rasch analysis.
Students’ Perceptions of Safety: Students respond-
ed to questions about general feelings of safety asking
how safe they feel on their way to and from school, out-
side around the school, in the hallways and bathrooms
of the school, and in their classes. A high score means
that students feel very safe.
Teachers’ Perceptions of Safety, Crime, and Disorder:
Teachers were asked about their perceptions of crime
a nd disorder in the school, including the presence
of gang activity, threats of violence toward teachers,
disorder in hallways, and disorder in classrooms. We
reversed the scores of this measure so that a high score
on this measure means that teachers perceive the school
to be more safe.
Sometimes survey information is seen as subjec-
tive. However, there is considerable evidence that these
measures are valid instruments of school climate. One
source of evidence comes from the strong correlation
between students’ and teachers’ reports of safety and
disorder in their schools, even though they come from
different sources of information.31 The relationship
of teacher reports of safety with student reports of
safety is stronger than the relationship of either with
characteristics of the students or neighborhoods they
serve, such as crime and poverty. Students’ and teach-
ers’ reports of safety are also highly predictive of other
student and school outcomes. For example, students’
reports of school safety are very strongly predictive
of how many teachers leave the school before the next
school year.32 They are also predictive of which schools
are likely to have stagnant test score and attendance
growth.33
UCHICAGO CCSR Research Report | Discipline Practices in Chicago Public Schools
46
TABLE D.2
Survey Question Wording for Student and Teacher Reports of Safety and Order
Survey measure Survey questions
Students’ Perceptions of Safety How safe do you feel:
1. Outside around the school?
2. Traveling between home and school?
3. In the hallways and bathrooms of the school?
4. In your classes?
Not Safe, Somewhat Safe, Mostly Safe, Very Safe
Teachers’ Perceptions of Safety To what extent is each of the following a problem at your school:
1. Physical conflicts among students
2. Robbery or theft
3. Gang activity
4. Disorder in classrooms
5. Disorder in hallways
6. Student disrespect of teachers
7. Threats of violence toward teachers
Not at All, A Little, Some, To a Great Extent
47
48
W. DAVID STEVENS is a Manager in the Center for Research, Evaluation, and Assessment at Education Northwest. Stevens has extensive experience leading mixed-methods research projects across a broad range of subject areas including high school reform, teacher human capital, school discipline, school transitions, and district evaluation systems. Prior to joining Education Northwest, Stevens spent 10 years at UChicago CCSR where he was Director of Research Engagement. He received his PhD in sociology from Northwestern University.
LAUREN SARTAIN is a Research Analyst at UChicago CCSR. She has a bachelor’s degree from the University of Texas at Austin, as well as a master’s degree in Public Policy at the Harris School at the University of Chicago where she is currently a PhD student. She has worked at Chapin Hall and the Federal Reserve Bank of Chicago. Sartain’s research in-terests include principal and teacher quality, school choice, and urban school reform.
ELAINE M. ALLENSWORTH is the Lewis-Sebring Director at UChicago CCSR where she has conducted research on educational policy for the last 15 years. She is best known for her studies of high school graduation and college
readiness, and also conducts research in the areas of school leadership and school organization. Her work on early indicators of high school graduation has been adopted for tracking systems used in Chicago and other districts across the country. She is one of the authors of the book Organizing Schools for Improvement: Lessons from Chicago, which provides a detailed analysis of school practices and community conditions that promote school improvement. Allensworth holds a PhD in Sociology and an MA in Urban Studies from Michigan State University. She was once a high school Spanish and science teacher.
RACHEL LEVENSTEIN is the Senior Manager for Survey Research at UChicago CCSR, where she oversees the annual census of roughly 225,000 Chicago Public Schools students, teachers, and principals. She directs all aspects of the survey process, including content design and pre-testing, data collection, documentation, item analysis, and tests for response bias. She is also involved in reporting and dissemination of the results to the nearly 700 schools in CPS. Her research specialties include nonresponse and measurement error issues in survey data collection. Rachel received her PhD in survey methodology from the University of Michigan.
This report reflects the interpretation of the authors. Although UChicago CCSR’s Steering Committee provided technical advice, no formal endorsement by these individuals, organizations, or the full Consortium should be assumed.
ABOUT THE AUTHORS
CONSORTIUM ON CHICAGO SCHOOL RESEARCH
KATHLEEN ST. LOUIS CALIENTOCo-Chair Spark, Chicago
KIM ZALENTCo-Chair Business and Professional People for the Public Interest
Ex-Officio Members
TIMOTHY KNOWLESUrban Education Institute
Institutional Members
JOHN R. BARKERChicago Public Schools
CLARICE BERRYChicago Principals and Administrators Association
AARTI DHUPELIAChicago Public Schools
CHRISTOPHER KOCHIllinois State Board of Education
KAREN G.J. LEWISChicago Teachers Union
SHERRY J. ULERYChicago Public Schools
Individual Members
VERONICA ANDERSON Communications Consultant
JOANNA BROWNLogan Square Neighborhood Association
CATHERINE DEUTSCHIllinois Network of Charter Schools
RAQUEL FARMER-HINTONUniversity of Wisconsin, Milwaukee
KIRABO JACKSONNorthwestern University
CHRIS JONESStephen T. Mather High School
DENNIS LACEWELLUrban Prep Charter Academy for Young Men
LILA LEFFUmoja Student Development Corporation
RUANDA GARTH MCCULLOUGHYoung Women’s Leadership Academy
LUISIANA MELÉNDEZErikson Institute
CRISTINA PACIONE-ZAYASLatino Policy Forum
PAIGE PONDEROne Million Degrees
LUIS R. SORIAChicago Public Schools
BRIAN SPITTLEDePaul University
MATTHEW STAGNERMathematica Policy Research
AMY TREADWELLChicago New Teacher Center
ERIN UNANDERAl Raby High School
ARIE J. VAN DER PLOEG American Institutes for Research (Retired)
DirectorsELAINE M. ALLENSWORTHLewis-Sebring Director
EMILY KRONEDirector for Outreach and Communication
JENNY NAGAOKADeputy Director
MELISSA RODERICKSenior DirectorHermon Dunlap Smith ProfessorSchool of Social Service Administration
PENNY BENDER SEBRINGCo-Founder
SUE SPORTEDirector for Research Operations
MARISA DE LA TORREDirector for Internal Research Capacity
Steering Committee
9 780990 956310
51500>ISBN 978-0-9909563-1-0
OUR MISSION The University of Chicago Consortium on Chicago School Research (UChicago CCSR) conducts research of high technical quality that can inform and assess policy and practice in the Chicago Public Schools. We seek to expand communication among researchers, policymakers, and practitioners as we support the search for solutions to the problems of school reform. UChicago CCSR encourages the use of research in policy action and improvement of practice, but does not argue for particular policies or programs. Rather, we help to build capacity for school reform by identifying what matters for student success and school improvement, creating critical indicators to chart progress, and conducting theory-driven evaluation to identify how programs and policies are working.