56
| Date post: | 17-May-2018 |
| Category: |
Documents |
| Upload: | phungnguyet |
| View: | 215 times |
| Download: | 2 times |


2© SGS SA 2017 ALL RIGHTS RESERVED
FULL-YEAR RESULTS PRESENTATION 23 JANUARY 2017
DISCLAIMER
Certain matters discussed in this presentation may constitute forward-looking
statements that are neither historical facts nor guarantees of future performance.
Because these statements involve risks and uncertainties that are beyond control or
estimation of SGS, there are important factors that could cause actual results to differ
materially from those expressed or implied by these forward looking statements.
These statements speak only as of the date of this document. Except as required by
any applicable law or regulation, SGS expressly disclaims any obligation to release
publicly any updates or revisions to any forward looking statements contained
herein to reflect any change in SGS Group’s expectations with regard thereto or
any change in events or conditions on which any such statements are based.
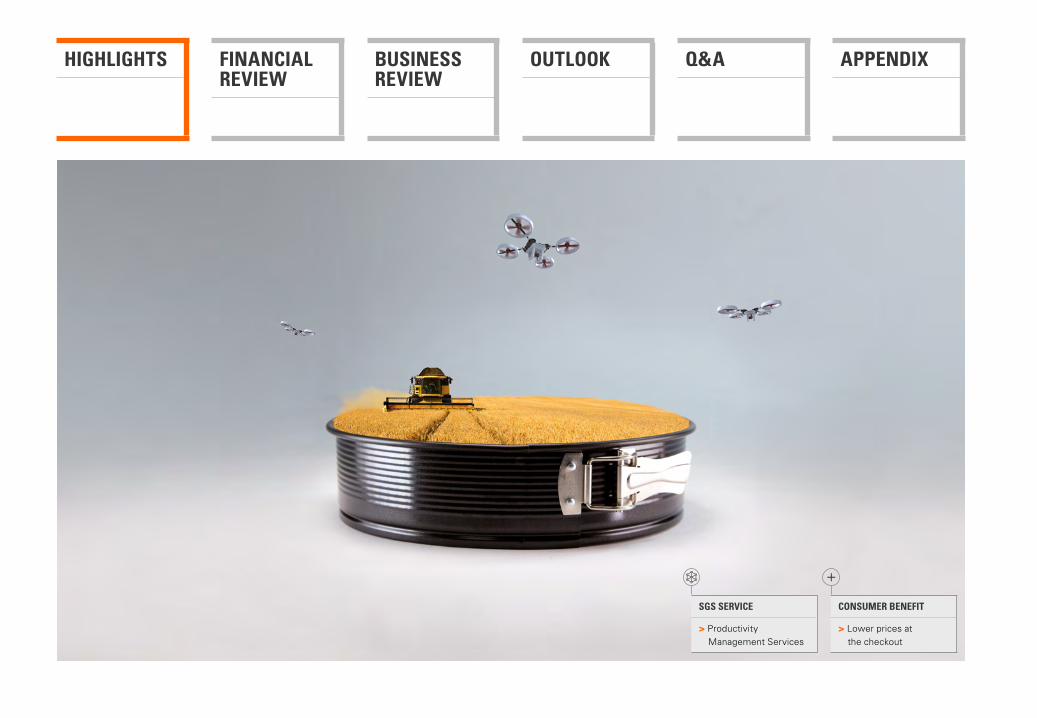
HIGHLIGHTS FINANCIAL REVIEW
BUSINESS REVIEW
OUTLOOK Q&A APPENDIX
SGS SERVICE
> Productivity Management Services
CONSUMER BENEFIT
> Lower prices at the checkout
4© SGS SA 2017 ALL RIGHTS RESERVED
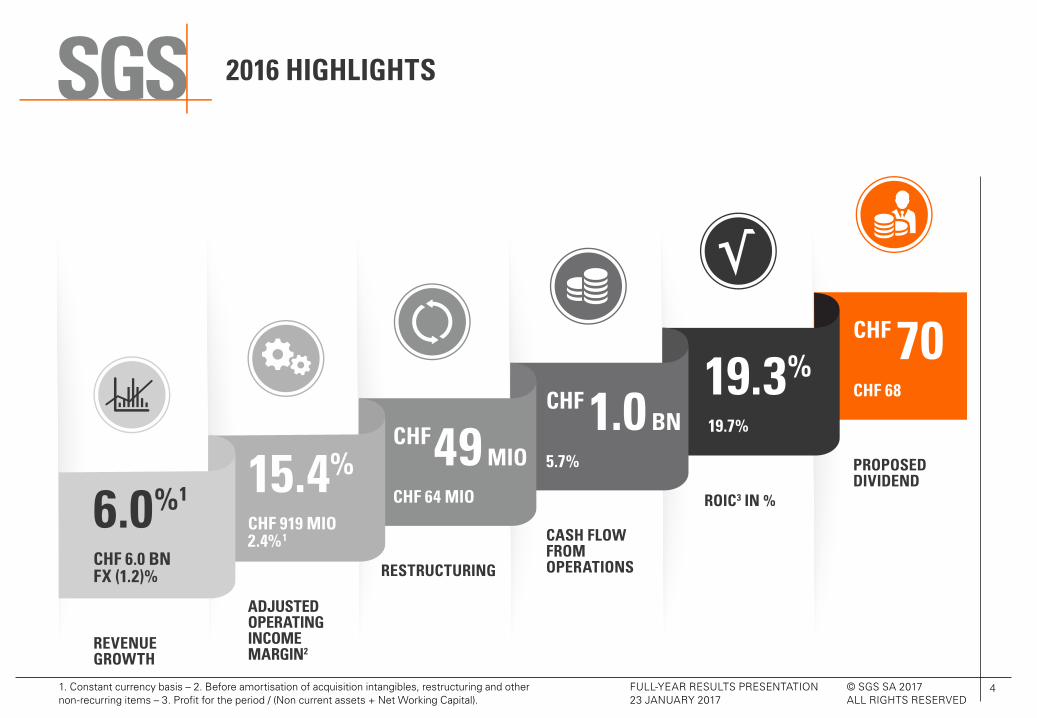
1. Constant currency basis – 2. Before amortisation of acquisition intangibles, restructuring and other non-recurring items – 3. Profit for the period / (Non current assets + Net Working Capital).
2016 HIGHLIGHTS
6.0% 1
CHF 6.0 BNFX (1.2)%
15.4%
CHF 919 MIO2.4% 1
19.3%
19.7% CHF 1.0 BN
5.7%
CHF 70
CHF 68
REVENUE GROWTH
RESTRUCTURING
ADJUSTED OPERATING INCOME MARGIN2
CASH FLOW FROM OPERATIONS
ROIC3 IN %
PROPOSED DIVIDEND
FULL-YEAR RESULTS PRESENTATION 23 JANUARY 2017
CHF 49 MIO
CHF 64 MIO

5© SGS SA 2017 ALL RIGHTS RESERVED
FULL-YEAR RESULTS PRESENTATION 23 JANUARY 2017
2016 ACQUISITIONS AND STRATEGIC PARTNERSHIPS
ACCUTEST LABORATORIES(ASSETS)USA
CARGO COMPLIANCE COMPANYNETHERLANDS
THE LAB (ASIA)(51% STAKE)HONG KONG
MATROLAB GROUPSOUTH AFRICA
CYBERMETRIXUSA
BATEMAN PROJECTS(ASSETS)SOUTH AFRICA
SUZHOU SAFETY-TECH (51% STAKE)CHINA
FIRSTRANK (75% STAKE)CHINA

6© SGS SA 2017 ALL RIGHTS RESERVED
FULL-YEAR RESULTS PRESENTATION 23 JANUARY 2017
1. Minority equity stake.
2016 ACQUISITIONS AND STRATEGIC PARTNERSHIPS
EECOLABCHILE
AGFLOW 1(15% STAKE)SWITZERLAND
UNIGEO AGRICULTURA DE PRECISÃO(75% STAKE)BRAZIL
COMPLIANCE CERTIFICATION SERVICESTAIWAN
LABORATORIOS CONTECON URBARCOLOMBIA AND PANAMA
IPS TESTINGUSA
TRANSPARENCY-ONE 1 (20% STAKE) USA
SPECHUB PANAMA

7© SGS SA 2017 ALL RIGHTS RESERVED
FULL-YEAR RESULTS PRESENTATION 23 JANUARY 2017
2016 ACQUISITIONS AND STRATEGIC PARTNERSHIPS
BIOPREMIER(70% STAKE)PORTUGAL
C-LABS SASWITZERLAND
LAAGRIMAMOROCCO
ROOS+BIJLNETHERLANDS
AXYS ANALYTICAL SERVICESCANADA
8© SGS SA 2017 ALL RIGHTS RESERVED
FULL-YEAR RESULTS PRESENTATION 23 JANUARY 2017
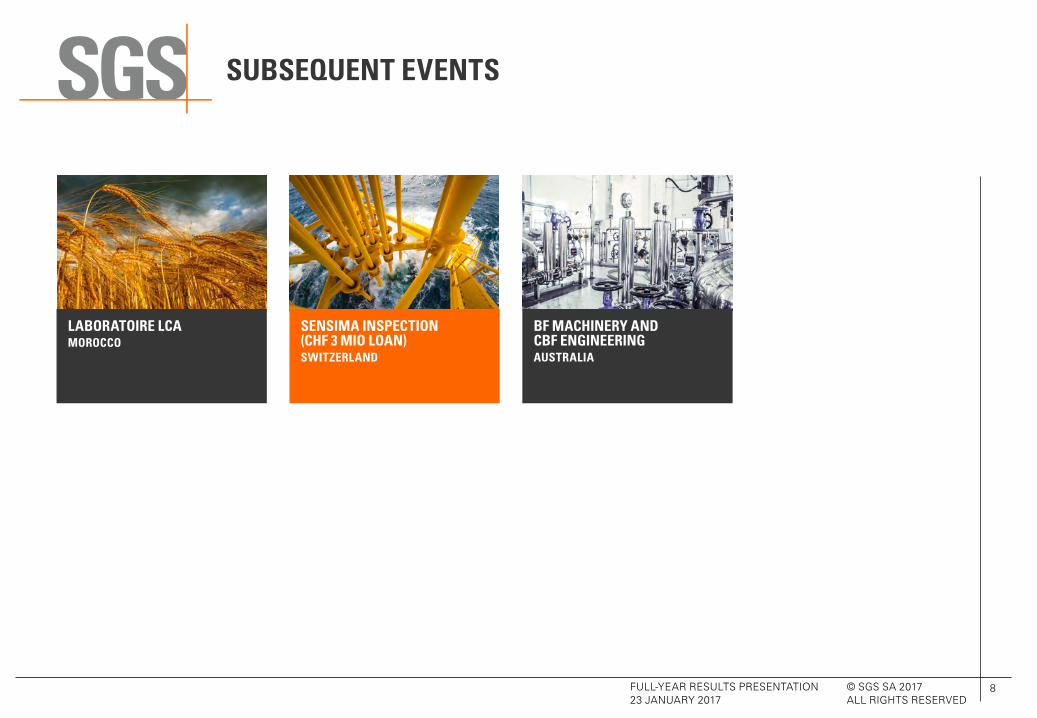
SUBSEQUENT EVENTS
SENSIMA INSPECTION(CHF 3 MIO LOAN)SWITZERLAND
BF MACHINERY AND CBF ENGINEERINGAUSTRALIA
LABORATOIRE LCAMOROCCO
9© SGS SA 2017 ALL RIGHTS RESERVED
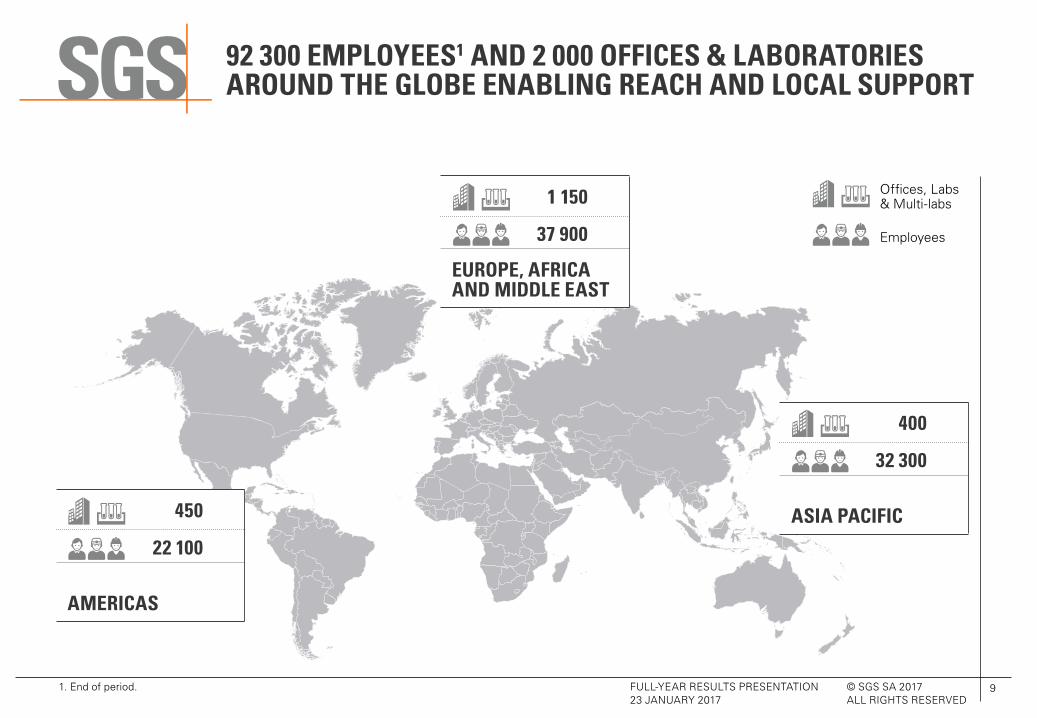
EUROPE, AFRICA AND MIDDLE EAST
AMERICAS
ASIA PACIFIC
1. End of period.
92 300 EMPLOYEES1 AND 2 000 OFFICES & LABORATORIES AROUND THE GLOBE ENABLING REACH AND LOCAL SUPPORT
450
22 100
1 150
37 900
400
32 300
Offices, Labs & Multi-labs
Employees
FULL-YEAR RESULTS PRESENTATION 23 JANUARY 2017

HIGHLIGHTS FINANCIAL REVIEW
BUSINESS REVIEW
OUTLOOK Q&A APPENDIX
CONSUMER BENEFIT
> A more secure internet
SGS SERVICE
> Digital Services

11© SGS SA 2017 ALL RIGHTS RESERVED
FULL-YEAR RESULTS PRESENTATION 23 JANUARY 2017
1. Before amortisation of acquisition intangibles, restructuring and other non-recurring items – 2. Constant currency basis.
2016 FINANCIAL HIGHLIGHTS
(CHF million) DECEMBER 2016DECEMBER 2015
PRO-FORMA2 DECEMBER 2015
REVENUE 5 985 5 644 5 712Change in % 6.0 4.8
ADJUSTED OPERATING INCOME1 919 898 917Change in % 2.4 0.2
ADJUSTED OPERATING INCOME MARGIN1 15.4 15.9 16.1
OPERATING INCOME (EBIT) 816 803 822Change in % 1.6 (0.7)
OPERATING INCOME (EBIT) MARGIN 13.6 14.2 14.4
PROFIT FOR THE PERIOD 586 561 584Change in % 4.5 0.3
PROFIT ATTRIBUTABLE TO EQUITY HOLDERS OF SGS SA 543 527 549Change in % 3.0 (1.1)
BASIC EPS (CHF) 71.54 69.17 71.99
ADJUSTED BASIC EPS (CHF)1 83.00 79.07 81.95

REVENUE
ADJUSTED OPERATING INCOME
BALANCE SHEET
CASH FLOW
CURRENCY
SECOND HALF 2016
HIGHLIGHTS FINANCIAL REVIEW
BUSINESS REVIEW
OUTLOOK Q&A APPENDIX
SGS SERVICE
> Digital Services
CONSUMER BENEFIT
> A more secure internet

13© SGS SA 2017 ALL RIGHTS RESERVED
FULL-YEAR RESULTS PRESENTATION 23 JANUARY 2017
2016 REVENUE GROWTH COMPOSITION
REVENUE DECEMBER 2015
CHF MIO
2015
ORGANIC
2.0%
ACQUISITIONS
1.6%
DISPOSALS
0.0%
CURRENCY IMPACT
(6.5)%
REVENUE DECEMBER 2016
(2.9)%
5 712
203
139
(1) (68)5 985
2.5% 0.0%3.5% (1.2)% 4.8%
Constant currency growth: 6.0%

14© SGS SA 2017 ALL RIGHTS RESERVED
FULL-YEAR RESULTS PRESENTATION 23 JANUARY 2017
2016 BUSINESS PORTFOLIO
4.6%GIS
0.2% 0.0% 15.6%AFL
18.3%OGC
10.6%MIN
8.2%TRP
0.5%(0.4)%
7.8%EHS
1.2%
(1.6)%14.9%IND
(0.1)%
5.4%CBE
0.1% 0.1% 14.6%CRS
2016 REVENUE
Change1 Change1
1. Constant currency basis.

15© SGS SA 2017 ALL RIGHTS RESERVED
2.9%
0.4%
16.7%
FULL-YEAR RESULTS PRESENTATION 23 JANUARY 2017
1. Constant currency basis.
2016 REVENUE GROWTH1 BY BUSINESS
AFL
MIN
OGC
CRS
CBE
IND
EHS
TRP
GIS
TOTAL
Organic Acquisitions Disposals
8.1%
3.5%
5.0%
1.6%
(0.2)%
(2.5)%
1.6%
(2.6)%
4.5%
(0.1)%
4.7%
9.1%
6.9%
7.9%
10.0%
2.5%
GROWTH
2016 2015
6.1%
2.6%
(2.1)%
6.3%
9.1%
5.5%
23.6%
12.9%
10.0%
6.0%
8.2%
(1.8)%
(2.6)%
2.9%
7.3%
(0.8)%
17.4%
13.5%
12.0%
3.6%

16© SGS SA 2017 ALL RIGHTS RESERVED
FULL-YEAR RESULTS PRESENTATION 23 JANUARY 2017
2016 REVENUE GROWTH1 BY REGION
EUROPE / AFRICA / MIDDLE EAST
AMERICAS
ASIA / PACIFIC
TOTAL GROUP
9.5%
3.5%
Organic Acquisitions Disposals
Revenue %
1. Constant currency basis.
3.3%
0.1%
1.3%3.2%
2.5%
1.9%
2016 2015
GROWTH
5.2%
9.6%
4.5%
6.0%
5.0%
4.6%
0.8%
3.6%

17© SGS SA 2017 ALL RIGHTS RESERVED
FULL-YEAR RESULTS PRESENTATION 23 JANUARY 2017
EVOLUTION OF HEADCOUNTS
HEADCOUNT END OF PERIOD
2 188 3 074 (955)
HEADCOUNT AVERAGE
2015
2015
2016
2016
85 90387 962
89 62692 269
89 62692 269
HEADCOUNT AVERAGE HEADCOUNT % REVENUE %
Europe/Africa/ Middle East
2 097 6.0 5.2
Americas 1 559 7.8 9.6
Asia/Pacific 67 0.2 4.5
TOTAL 3 723 4.3 6.0
BY REGION
3 723 INCREASE4.3%
4 307 INCREASE4.9%
GROUP HEADCOUNT END OF PERIOD
ORGANIC BUSINESS GROWTH ACQUISITIONS
DISPOSALS AND RESTRUCTURING
GROUP HEADCOUNT AVERAGE
APPENDIX
REVENUE
ADJUSTED OPERATING INCOME
BALANCE SHEET
CASH FLOW
CURRENCY
SECOND HALF 2016
HIGHLIGHTS FINANCIAL REVIEW
BUSINESS REVIEW
OUTLOOK Q&A
SGS SERVICE
> Digital Services
CONSUMER BENEFIT
> A more secure internet

19© SGS SA 2017 ALL RIGHTS RESERVED
FULL-YEAR RESULTS PRESENTATION 23 JANUARY 2017
1. Before amortisation of acquisition intangibles, restructuring and other non-recurring items.
2016 ADJUSTED OPERATING INCOME1 GROWTH
ADJ. OP. INC. DECEMBER 2015
2015
ORGANIC
1.2%
ACQUISITIONS
2.0%
DISPOSALS
0.0%
CURRENCY IMPACT
(6.4)%
ADJ. OP. INC. DECEMBER 2016
(3.2)%
917
20
2
- (20)
919
0.2% 0.0%2.2% (2.2)% 0.2%
Constant currency growth: 2.4%
CHF MIO
20© SGS SA 2017 ALL RIGHTS RESERVED
FULL-YEAR RESULTS PRESENTATION 23 JANUARY 2017
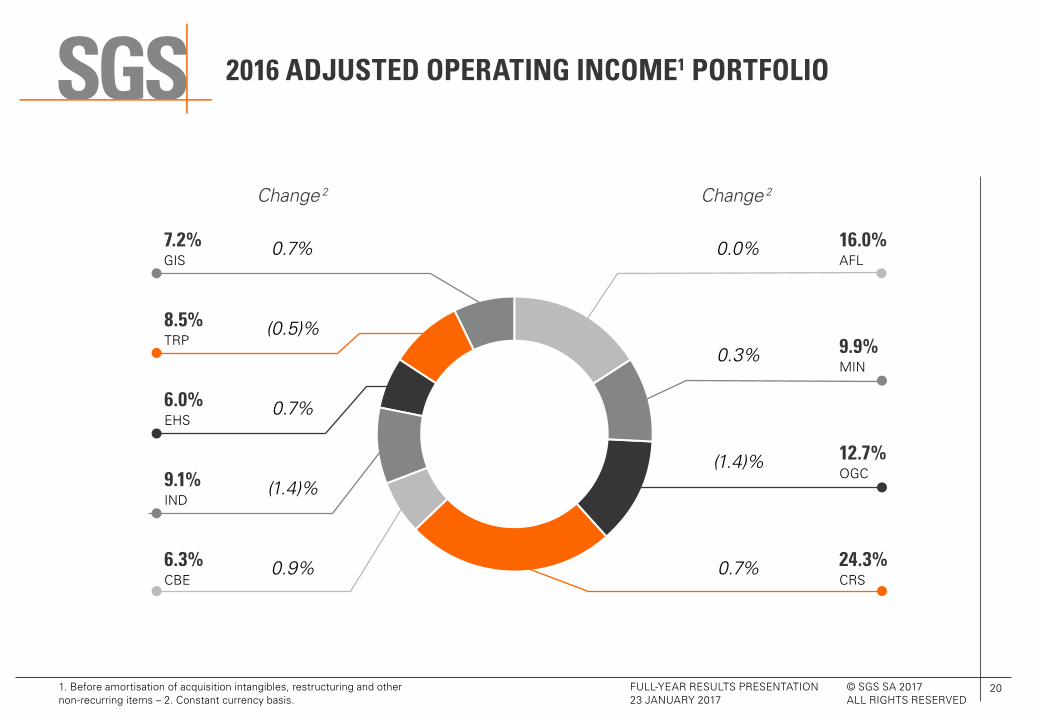
1. Before amortisation of acquisition intangibles, restructuring and other non-recurring items – 2. Constant currency basis.
2016 ADJUSTED OPERATING INCOME1 PORTFOLIO
Change 2 Change 2
7.2%GIS
0.7% 0.0% 16.0%AFL
12.7%OGC
9.9%MIN
8.5%TRP
(0.5)%0.3%
6.0%EHS
0.7%
(1.4)%9.1%IND
(1.4)%
6.3%CBE
0.9% 0.7% 24.3%CRS

21© SGS SA 2017 ALL RIGHTS RESERVED
1. Before amortisation of acquisition intangibles, restructuring and other non-recurring items – 2. Constant currency basis.
ADJUSTED OPERATING MARGIN1 BY BUSINESS
30%
25%
20%
15%
10%
5%
0%
AFL CRSMIN CBE TRPOGC IND GISEHS
16.3%
14.0%
11.3%
25.8%
16.2%
11.1%12.8%
18.5%
23.2%
15.7%14.3%
10.6%
25.6%
17.7%
9.4%
11.8%
16.0%
24.2%
20152 2016
FULL-YEAR RESULTS PRESENTATION 23 JANUARY 2017

22© SGS SA 2017 ALL RIGHTS RESERVED
PROCUREMENT EFFICIENCY
PROCUREMENT SAVINGS BY REGION PROCUREMENT SAVINGS BY NATURE
57 5760
50
40
30
20
10
0
Americas Asia Pacific EAME
TARGET 2016
17
18
19
22
18
20
ACTUAL 2016
FULL-YEAR RESULTS PRESENTATION 23 JANUARY 2017
19%OPEX cost avoidance
16%CAPEX
65%OPEX P&L
23© SGS SA 2017 ALL RIGHTS RESERVED
FULL-YEAR RESULTS PRESENTATION 23 JANUARY 2017
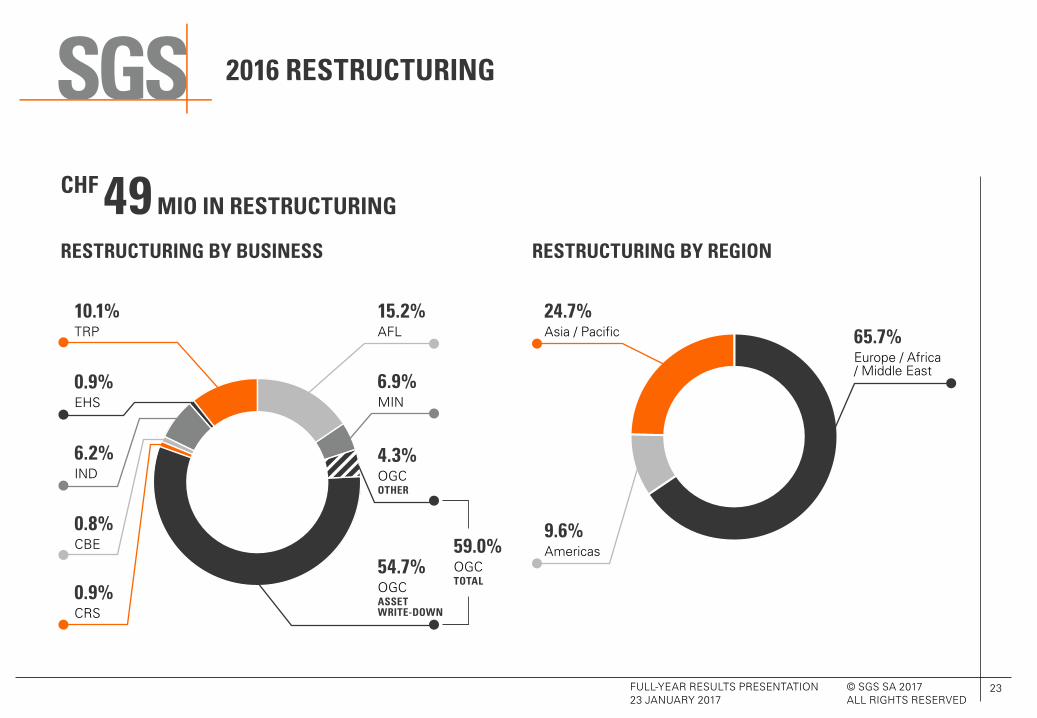
2016 RESTRUCTURING
CHF 49 MIO IN RESTRUCTURING
RESTRUCTURING BY BUSINESS RESTRUCTURING BY REGION
24.7%Asia / Pacific
9.6%Americas
65.7%Europe / Africa / Middle East
15.2%AFL
59.0%OGCTOTAL
6.9%MIN
10.1%TRP
0.9%EHS
6.2%IND
0.8%CBE
0.9%CRS
54.7%OGCASSET WRITE-DOWN
4.3%OGCOTHER

REVENUE
ADJUSTED OPERATING INCOME
BALANCE SHEET
CASH FLOW
CURRENCY
SECOND HALF 2016
HIGHLIGHTS FINANCIAL REVIEW
BUSINESS REVIEW
OUTLOOK Q&A APPENDIX
SGS SERVICE
> Digital Services
CONSUMER BENEFIT
> A more secure internet

25© SGS SA 2017 ALL RIGHTS RESERVED
FULL-YEAR RESULTS PRESENTATION 23 JANUARY 2017
1. Restated figures (cf note 2 of the 2016 annual report) – 2. Profit for the period / (Non current assets + Net Working Capital).
2016 CONSOLIDATED BALANCE SHEET
(CHF million) DEC 2016 DEC 20151
Land, buildings and equipment 972 964Goodwill 1 195 1 088Intangible assets 246 218Other Long-term assets 325 347
NON-CURRENT ASSETS 2 738 2 617
Unbilled revenues and inventories 290 288Trade accounts and notes receivable 997 917Other receivables and prepayments 340 338Marketable securities 9 244Cash and cash equivalents 975 1 490CURRENT ASSETS 2 611 3 277
TOTAL 5 349 5 894
ROIC2 19.3% 19.7%
(CHF million) DEC 2016 DEC 20151
Share capital 8 8Reserves 1 765 1 898SHAREHOLDERS’ EQUITY 1 773 1 906
NON-CONTROLLING INTERESTS 80 75
Long-term loans1 1 719 1 723Provisions and other liabilities 289 338NON-CURRENT LIABILITIES 2 008 2 061
Accounts payable 641 526Other creditors and accruals 846 832Loans1 1 494
CURRENT LIABILITIES 1 488 1 852
LIABILITIES 3 496 3 913
TOTAL 5 349 5 894
ASSETS SHAREHOLDERS’ EQUITY AND LIABILITIES
NET DEBT (736) (482)
REVENUE
ADJUSTED OPERATING INCOME
BALANCE SHEET
CASH FLOW
CURRENCY
SECOND HALF 2016
HIGHLIGHTS FINANCIAL REVIEW
BUSINESS REVIEW
OUTLOOK Q&A APPENDIX
SGS SERVICE
> Digital Services
CONSUMER BENEFIT
> A more secure internet

27© SGS SA 2017 ALL RIGHTS RESERVED
2016 CONDENSED CASH FLOW
(CHF million) DEC 2016 DEC 2015
PROFIT FOR THE PERIOD 586 584Non-cash items 560 541(Increase)/decrease in working capital 75 160Taxes paid (207) (223)CORE OPERATING CASH FLOW1 1 014 1 062Pension funds special contribution - (103)CASH FLOW FROM OPERATING ACTIVITIES 1 014 959Net (purchase) of fixed assets (276) (286)Net (acquisition) of businesses (172) (104)Decrease/(increase) in marketable securities and other 247 (235)CASH FLOW FROM INVESTING ACTIVITIES (201) (625)Dividends paid to equity holders of SGS SA (517) (522)Dividends paid to non-controlling interests (39) (34)Transaction with non-controlling interests (4) (2)Net cash received on treasury shares (161) (147)(Reimbursments)/Proceeds of corporate bonds (491) 549Interest paid (58) (55)Net flows on interest rate swaps - 16(Decrease)/increase in borrowings (3) (15)CASH FLOW FROM FINANCING ACTIVITIES (1 273) (210)Currency translation (55) 25INCREASE/(DECREASE) IN CASH AND CASH EQUIVALENTS (515) 149
FREE CASH FLOW2 738 658
1. Before cash flows related to pension fund special contribution – 2. Cash flow from operating activities net of capital expenditures.
FULL-YEAR RESULTS PRESENTATION 23 JANUARY 2017

28© SGS SA 2017 ALL RIGHTS RESERVED
2016 NET WORKING CAPITAL MOVEMENT
AVERAGE 2010 – 2014 2015 2016
CHF 75 MIO
CHF 160 MIO
CHF (66) MIO
TOTAL 2015 – 2016 IMPROVEMENT
CHF 235 MIO
FULL-YEAR RESULTS PRESENTATION 23 JANUARY 2017

29© SGS SA 2017 ALL RIGHTS RESERVED
FULL-YEAR RESULTS PRESENTATION 23 JANUARY 2017
2016 OPERATING CASH FLOW
1. Cash flow from operating activities less net Capex – 2. Operating cash flow / Adjusted EBITDA.
1 200
1 100
1 000
900
800
700
600
500
400
300
200
100
0
2012
67.6%
2013
75.8%
2014
74.4%
2015
80.5%
2016
84.6%
948798 912 959 1 014
Net CAPEX in CHF MIO
Free cash flow1 in CHF MIO
Operating cash flow in % of revenue
20%
18%
16%
14%
12%
10%
8%
6%
4%
2%
0%
386
357 305301 276
412591 607 658 738
ADJ. CASH CONVERSION RATIO2

30© SGS SA 2017 ALL RIGHTS RESERVED
FULL-YEAR RESULTS PRESENTATION 23 JANUARY 2017
2016 CAPITAL EXPENDITURE
CAPEX BY REGION
ANNUAL CAPEX CHF MIO
400
300
2002011 20152012 20162013 2014
Capital Expenditure
Depreciation and amortisation
CHF 288 MIO
CHF 288 MIO
4.0%GIS
15.0%TRP
6.8%EHS
12.2%IND
1.3%CBE
17.3%AFL
17.0%OGC
7.4%MIN
19.0%CRS
CAPEX BY BUSINESS
33.9%Asia / Pacific
19.4%Americas
46.7%Europe / Africa / Middle East

31© SGS SA 2017 ALL RIGHTS RESERVED
FULL-YEAR RESULTS PRESENTATION 23 JANUARY 2017
1. Net Capex.
CASH SOURCES AND USES IN 2016
SOURCES USES
CHF 1.0 BN
CHF 1.1 BN
ORGANIC CASH FLOW GENERATION COVERING 90% OF USES
OPERATING CASH FLOW GENERATION
GROWTH OPPORTUNITIES• Organic growth1
• M&A
SHAREHOLDERS RETURNS• Dividends paid• Share buy-back programme
CHF 0.4 BN
CHF 0.7 BN

REVENUE
ADJUSTED OPERATING INCOME
BALANCE SHEET
CASH FLOW
CURRENCY
SECOND HALF 2016
HIGHLIGHTS FINANCIAL REVIEW
BUSINESS REVIEW
OUTLOOK Q&A APPENDIX
SGS SERVICE
> Digital Services
CONSUMER BENEFIT
> A more secure internet

33© SGS SA 2017 ALL RIGHTS RESERVED
FULL-YEAR RESULTS PRESENTATION 23 JANUARY 2017
2016 FOREIGN CURRENCY REVENUES
MAJOR CURRENCIES
26.6%OTHER
2.3%HKD
2.4%AUD
2.7%BRL
3.1%GBP
3.1%CLP
3.3%CAD
25.9%EUR
14.4%USD
12.8%CNY
3.4%TWD

34© SGS SA 2017 ALL RIGHTS RESERVED
EUR USD CNY TWD CAD CLP GBP BRL AUD HKD20162015
CHANGE
FULL-YEAR RESULTS PRESENTATION 23 JANUARY 2017
FOREIGN CURRENCY AVERAGE RATE CHANGE FY 2016 VERSUS FY 2015 RATE
4%
2%
0%
(2)%
(4)%
(6)%
(8)%
(10)%
2.0% 2.3%
(3.2)%
0.7%
(1.4)% (1.3)%
(9.2)%
1.1%
(3.4)%
2.2%
1.09011.06912.0%
0.98490.96262.3%
0.14830.1532(3.2)%
0.03050.03030.7%
0.74360.7545(1.4)%
0.00150.0015(1.3)%
1.33601.4719(9.2)%
0.28380.2937(3.4)%
0.73270.72441.1%
0.12690.12422.2%
REVENUE
ADJUSTED OPERATING INCOME
BALANCE SHEET
CASH FLOW
CURRENCY
SECOND HALF 2016
HIGHLIGHTS FINANCIAL REVIEW
BUSINESS REVIEW
OUTLOOK Q&A APPENDIX
SGS SERVICE
> Digital Services
CONSUMER BENEFIT
> A more secure internet

36© SGS SA 2017 ALL RIGHTS RESERVED
FULL-YEAR RESULTS PRESENTATION 23 JANUARY 2017
H2 2016 FINANCIAL HIGHLIGHTS
1. Before amortisation of acquisition intangibles, restructuring and other non-recurring items – 2. Constant currency basis.
(CHF million) 2016 H22015 H2
PRO-FORMA2 2015 H2
REVENUE 3 084 2 932 2 960Change in % 5.2 4.2
ADJUSTED OPERATING INCOME1 508 497 505Change in % 2.2 0.6
ADJUSTED OPERATING INCOME MARGIN1 16.5 17.0 17.1
OPERATING INCOME (EBIT) 422 480 489Change in % (12.1) (13.7)
OPERATING INCOME (EBIT) MARGIN 13.7 16.4 16.5
PROFIT FOR THE PERIOD 309 337 353Change in % (8.1) (12.4)
PROFIT ATTRIBUTABLE TO EQUITY HOLDERS OF SGS SA 289 320 335Change in % (9.7) (13.7)

37© SGS SA 2017 ALL RIGHTS RESERVED
FULL-YEAR RESULTS PRESENTATION 23 JANUARY 2017
H2 2016 REVENUE GROWTH COMPOSITION
REVENUE H2 2015
CHF MIO
H2 2015
ORGANIC
2.2%
ACQUISITIONS
1.6%
DISPOSALS
0.0%
CURRENCY IMPACT
(7.6)%
REVENUE H2 2016
(3.8)%
2 960
107
46
(1) (28)3 084
1.6% 0.0%3.6% (1.0)% 4.2%
Constant currency growth: 5.2%

38© SGS SA 2017 ALL RIGHTS RESERVED
4.0%
FULL-YEAR RESULTS PRESENTATION 23 JANUARY 2017
H2 2016 REVENUE GROWTH1 BY BUSINESS
1. Constant currency basis.
AFL
MIN
OGC
CRS
CBE
IND
EHS
TRP
GIS
TOTAL
Organic Acquisitions Disposals
7.7%
3.6%
16.1%
3.6%
2.8% 1.2%
(0.2)%
(2.9)% 0.4%
2.9%3.9%
7.5%
(4.8)%
4.4%
8.3%
11.7%
1.6%
(0.1)%
GROWTH
2016 2015
4.0%
3.7%
(2.5)%
6.8%
7.5%
2.9%
20.5%
11.9%
11.7%
5.2%
10.4%
(1.6)%
(4.8)%
2.6%
8.4%
1.5%
11.0%
14.6%
15.5%
3.8%

39© SGS SA 2017 ALL RIGHTS RESERVED
FULL-YEAR RESULTS PRESENTATION 23 JANUARY 2017
1. Before amortisation of acquisition intangibles, restructuring and other non-recurring items – 2. Constant currency basis.
H2 2016 ADJUSTED OPERATING MARGIN1 BY BUSINESS
30%
25%
20%
15%
10%
5%
0%
AFL CRSMIN CBE TRPOGC IND GISEHS
18.9%
14.9%
12.0%
26.8%
17.3%
11.3%12.6%
20.1%
23.5%
17.2%15.6%
11.3%
26.6%
20.2%
9.3%
13.0%
16.1%
28.4%
H2 20152 H2 2016

40© SGS SA 2017 ALL RIGHTS RESERVED
FULL-YEAR RESULTS PRESENTATION 23 JANUARY 2017
FINANCIAL SUMMARY
1. Before amortisation of acquisition intangibles, restructuring and other non-recurring items – 2. Profit for the period / (Non current assets + Net Working Capital).
· Revenue growth of 6.0% of which 2.5% organic
· Increase in Adjusted Operating Income1 on a constant currency basis by 2.4%
· Investment of CHF 448 million in Capex and Acquisitions
· Operating cash flow of 1.0 billion
· Return on Invested Capital (ROIC2) of 19.3%
· Proposed dividend of CHF 70

HIGHLIGHTS FINANCIAL REVIEW
BUSINESS REVIEW
OUTLOOK Q&A APPENDIX
SGS SERVICE
> Polymer Testing
CONSUMER BENEFIT
> More responsive carbon fibre products

FULL-YEAR RESULTS PRESENTATION 23 JANUARY 2017
1. Before amortisation of acquisition intangibles, restructuring and other non-recurring items – 2. Constant currency basis – 3. Restated figures due to the change in business structure.
AGRICULTURE, FOOD AND LIFE (AFL)
(CHF million)
20162015
PRO-FORMA2, 3 20153
REVENUE 934.9 880.9 892.4 Change in % 6.1 4.8ADJUSTED OPERATING INCOME¹ 147.2 144.0 146.8
Change in % 2.2 0.3MARGIN %¹ 15.7 16.3 16.5
OVERVIEW · Solid growth from Food, Life and Trade activities · Strong testing services drove Food in Asia and high demand for certification · Slow input market impacted Seed & Crop · Double-digit growth in Life laboratories · Strategic investment in Transparency One and AgFlow
OUTLOOK · Recent investments and strong demand for food safety will drive growth · Strong organic growth expected in Life laboratories · Acquisition of Unigeo along with new services will benefit Seed and Crop portfolio · Trade activities to remain strong
42© SGS SA 2017 ALL RIGHTS RESERVED
FULL-YEAR RESULTS PRESENTATION 23 JANUARY 2017
MINERALS (MIN)
1. Before amortisation of acquisition intangibles, restructuring and other non-recurring items – 2. Constant currency basis.
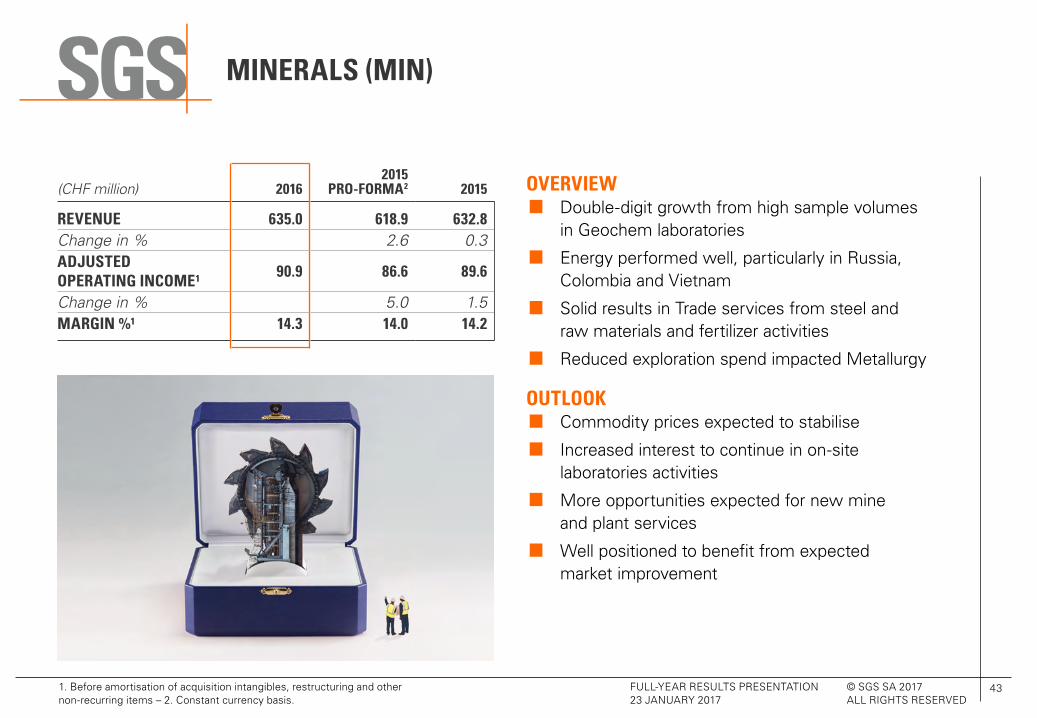
OVERVIEW · Double-digit growth from high sample volumes in Geochem laboratories · Energy performed well, particularly in Russia, Colombia and Vietnam · Solid results in Trade services from steel and raw materials and fertilizer activities · Reduced exploration spend impacted Metallurgy
OUTLOOK · Commodity prices expected to stabilise · Increased interest to continue in on-site laboratories activities · More opportunities expected for new mine and plant services · Well positioned to benefit from expected market improvement
(CHF million)
20162015
PRO-FORMA2
2015
REVENUE 635.0 618.9 632.8 Change in % 2.6 0.3ADJUSTED OPERATING INCOME¹ 90.9 86.6 89.6
Change in % 5.0 1.5MARGIN %¹ 14.3 14.0 14.2
43© SGS SA 2017 ALL RIGHTS RESERVED

FULL-YEAR RESULTS PRESENTATION 23 JANUARY 2017
1. Before amortisation of acquisition intangibles, restructuring and other non-recurring items – 2. Constant currency basis – 3. Restated figures due to the change in business structure.
OIL, GAS AND CHEMICALS (OGC)
OVERVIEW · Trade-related activities remained flat · Solid results in Sample Management segment and Oil Condition Monitoring · Plant and Terminal Operations (PTO) remained stable · Upstream services continued to be impacted by market conditions
OUTLOOK · Oil and Gas market expected to stabilise · Price volatility and increased trade volume to benefit Trade-related activities and PTO · Non-Inspection-related testing to remain flat · Upstream services to focus on production market
(CHF million)
20162015
PRO-FORMA2, 3 20153
REVENUE 1 098.4 1 122.2 1 126.4 Change in % (2.1) (2.5)ADJUSTED OPERATING INCOME¹ 116.4 126.5 128.6
Change in % (8.0) (9.5)MARGIN %¹ 10.6 11.3 11.4
44© SGS SA 2017 ALL RIGHTS RESERVED

FULL-YEAR RESULTS PRESENTATION 23 JANUARY 2017
CONSUMER AND RETAIL (CRS)
1. Before amortisation of acquisition intangibles, restructuring and other non-recurring items – 2. Constant currency basis – 3. Restated figures due to the change in business structure.
OVERVIEW · Solid results from Central and Eastern Europe and Asia · Strong growth in Softlines and Hardlines · Cosmetics, Personal Care and Household performs well in China, Germany and North America · Robust performance in Electrical & Electronics despite challenges in Wireless testing market
OUTLOOK · Strong performance in most regions despite impact of Wireless activity · Strong growth to continue in Softlines and Hardlines · Significant growth in Restriction of Hazardous Substance testing
(CHF million)
20162015
PRO-FORMA2, 3 20153
REVENUE 872.8 821.2 826.1 Change in % 6.3 5.7ADJUSTED OPERATING INCOME¹ 223.6 212.0 215.7
Change in % 5.5 3.7MARGIN %¹ 25.6 25.8 26.1
45© SGS SA 2017 ALL RIGHTS RESERVED
CERTIFICATION AND BUSINESS ENHANCEMENT (CBE)
FULL-YEAR RESULTS PRESENTATION 23 JANUARY 2017
1. Before amortisation of acquisition intangibles, restructuring and other non-recurring items – 2. Constant currency basis – 3. Restated figures due to the change in business structure.
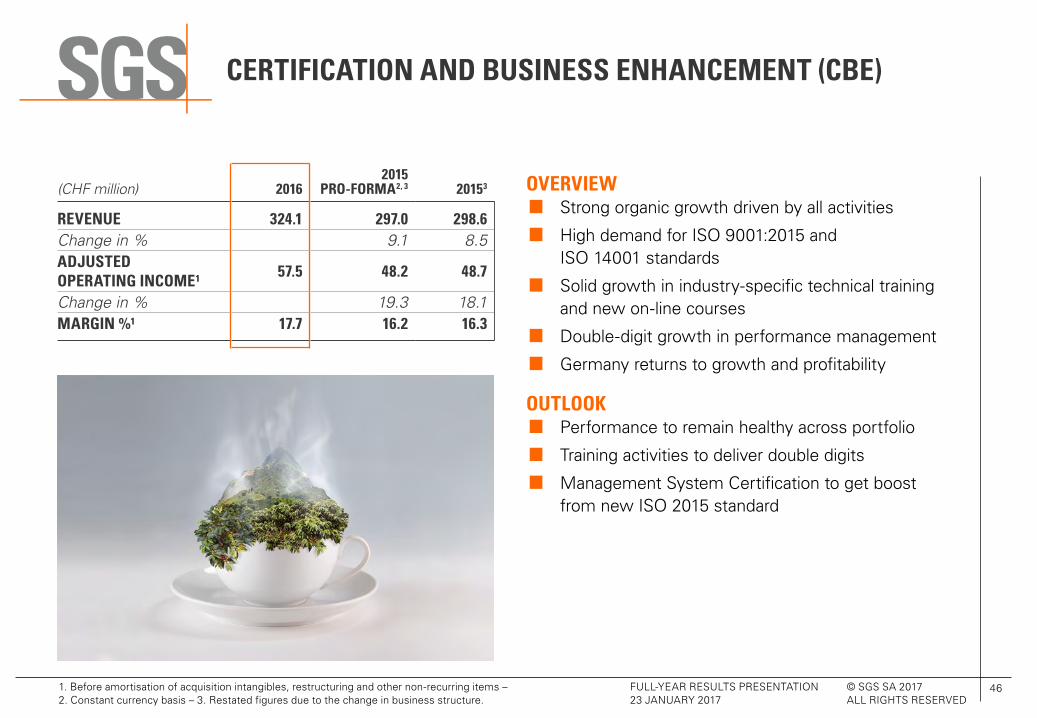
OVERVIEW · Strong organic growth driven by all activities · High demand for ISO 9001:2015 and ISO 14001 standards · Solid growth in industry-specific technical training and new on-line courses · Double-digit growth in performance management · Germany returns to growth and profitability
OUTLOOK · Performance to remain healthy across portfolio · Training activities to deliver double digits · Management System Certification to get boost from new ISO 2015 standard
(CHF million)
20162015
PRO-FORMA2, 3 20153
REVENUE 324.1 297.0 298.6 Change in % 9.1 8.5ADJUSTED OPERATING INCOME¹ 57.5 48.2 48.7
Change in % 19.3 18.1MARGIN %¹ 17.7 16.2 16.3
46© SGS SA 2017 ALL RIGHTS RESERVED

INDUSTRIAL (IND)
FULL-YEAR RESULTS PRESENTATION 23 JANUARY 2017
1. Before amortisation of acquisition intangibles, restructuring and other non-recurring items – 2. Constant currency basis – 3. Restated figures due to the change in business structure.
OVERVIEW · Acquisitive growth drives revenues offsetting weak organic performance · Double-digit growth in laboratory testing with added capabilities in construction and calibration testing · Low capital investment and spending affected Energy and Construction activities impacting organic growth
OUTLOOK · Energy sector to remain challenging · Low investment and high competition expected in Infrastructure and Construction · Manufacturing sector to grow in single digits · Laboratory services will maintain single-digit growth trend, both organically and acquisitively
(CHF million)
20162015
PRO-FORMA2, 3 20153
REVENUE 890.9 844.2 852.4 Change in % 5.5 4.5ADJUSTED OPERATING INCOME¹ 83.6 93.9 95.5
Change in % (11.0) (12.5)MARGIN %¹ 9.4 11.1 11.2
47© SGS SA 2017 ALL RIGHTS RESERVED

ENVIRONMENT, HEALTH AND SAFETY (EHS)
FULL-YEAR RESULTS PRESENTATION 23 JANUARY 2017
1. Before amortisation of acquisition intangibles, restructuring and other non-recurring items – 2. Constant currency basis – 3. Restated figures due to the change in business structure.
OVERVIEW · Strong results in Europe from high volume/high margin laboratory contracts · Acquisitions strengthen presence and global service portfolio in the USA · High single-digit growth in South America with strong demand for dioxins testing · Margin pressure continued in Australia
OUTLOOK · Continued focus on Health & Safety and Testing services · New regulations to accelerate Marine services revenue · Optimisation of Accutest network will improve margins · New opportunities for drones in field services
(CHF million)
20162015
PRO-FORMA2, 3 20153
REVENUE 464.3 375.7 375.6 Change in % 23.6 23.6ADJUSTED OPERATING INCOME¹ 54.9 48.0 48.0
Change in % 14.4 14.4MARGIN %¹ 11.8 12.8 12.8
48© SGS SA 2017 ALL RIGHTS RESERVED

TRANSPORTATION (TRP)
FULL-YEAR RESULTS PRESENTATION 23 JANUARY 2017
1. Before amortisation of acquisition intangibles, restructuring and other non-recurring items – 2. Constant currency basis – 3. Restated figures due to the change in business structure.
OVERVIEW · Solid performance in Regulated services particularly in Vehicle Inspection services · Strong performance in commercial inspection activities · Growth in testing services with solid results from China, France, India and USA · Successful replication of services from acquisitions
OUTLOOK · Tightening of exhaust emissions regulations will drive growth · Shift to connectivity and digitalisation will support solid supply chain solutions growth · Positive outlook for Regulated services in Africa and South America · Focus on acquisitions in the Aerospace sector
(CHF million)
20162015
PRO-FORMA2, 3 20153
REVENUE 489.8 433.7 447.6 Change in % 12.9 9.4ADJUSTED OPERATING INCOME¹ 78.5 80.4 82.1
Change in % (2.4) (4.4)MARGIN %¹ 16.0 18.5 18.3
49© SGS SA 2017 ALL RIGHTS RESERVED
GOVERNMENTS AND INSTITUTIONS (GIS)
FULL-YEAR RESULTS PRESENTATION 23 JANUARY 2017
1. Before amortisation of acquisition intangibles, restructuring and other non-recurring items – 2. Constant currency basis.
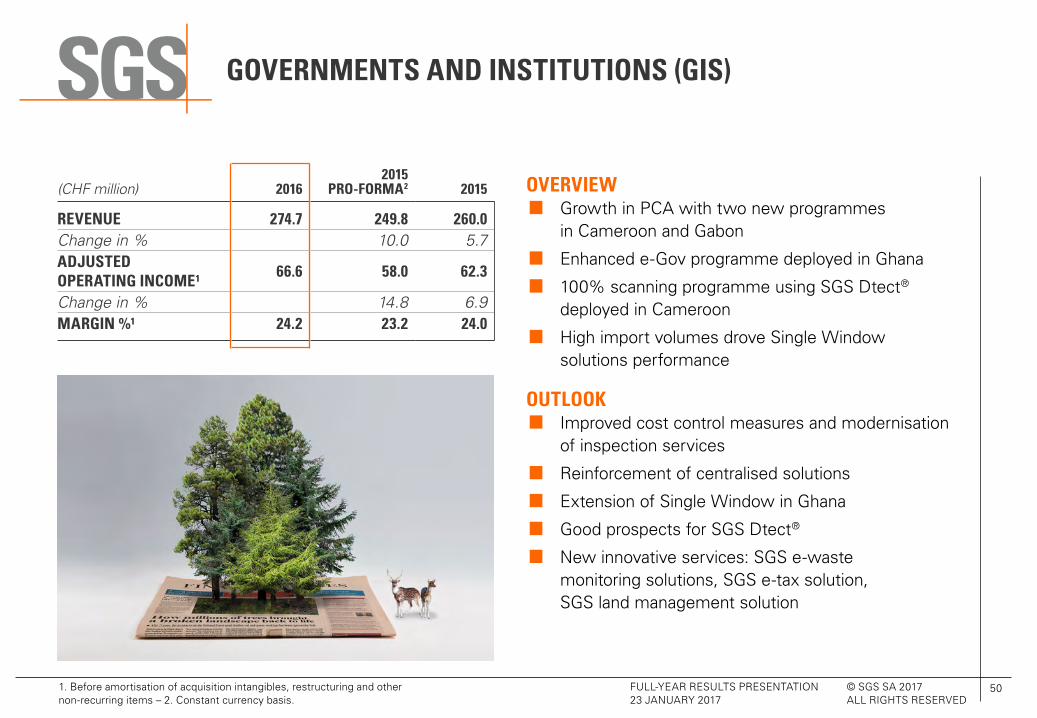
OVERVIEW · Growth in PCA with two new programmes in Cameroon and Gabon · Enhanced e-Gov programme deployed in Ghana · 100% scanning programme using SGS Dtect® deployed in Cameroon · High import volumes drove Single Window solutions performance
OUTLOOK · Improved cost control measures and modernisation of inspection services · Reinforcement of centralised solutions · Extension of Single Window in Ghana · Good prospects for SGS Dtect® · New innovative services: SGS e-waste monitoring solutions, SGS e-tax solution, SGS land management solution
(CHF million)
20162015
PRO-FORMA2 2015
REVENUE 274.7 249.8 260.0 Change in % 10.0 5.7ADJUSTED OPERATING INCOME¹ 66.6 58.0 62.3
Change in % 14.8 6.9MARGIN %¹ 24.2 23.2 24.0
50© SGS SA 2017 ALL RIGHTS RESERVED

HIGHLIGHTS FINANCIAL REVIEW
BUSINESS REVIEW
OUTLOOK Q&A APPENDIX
CONSUMER BENEFIT
> Trusting that purchases made online are up to scratch
SGS SERVICE
> E-Commerce Quality Control Service
52© SGS SA 2017 ALL RIGHTS RESERVED
SOLID ORGANIC REVENUE GROWTH
HIGHER ADJUSTED OPERATING INCOME ROBUST CASH FLOW
FULL-YEAR RESULTS PRESENTATION 23 JANUARY 2017
GUIDANCE 20171
1. At stable market conditions.

53© SGS SA 2017 ALL RIGHTS RESERVED
FULL-YEAR RESULTS PRESENTATION 23 JANUARY 2017
OUTLOOK 2020
· Mid single digit organic growth on average with improvement over the period supported by the new focused structure and new strategic initiatives
· Accelerating M&A activities with acquired revenue over the period in the range of CHF 1 billion
· Adjusted Operating Income Margin of at least 18% by end of the period supported by the new focused structure, new strategic and efficiency improvement initiatives
· Strong cash conversion
· Solid returns on invested capital
· Solid dividend distribution, in line with improvement in net earnings

54© SGS SA 2017 ALL RIGHTS RESERVED
FULL-YEAR RESULTS PRESENTATION 23 JANUARY 2017
UPCOMING EVENT DATES
ANNUAL GENERAL MEETING OF SHAREHOLDERS
Tuesday, 21 March 2017
Geneva, Switzerland
2017 HALF YEAR RESULTS
Monday, 17 July 2017
INVESTOR DAYS (IN ASIA)
Thursday and Friday
26 and 27 October 2017
DIVIDEND PAYMENT DATES
Ex-Date: 23 March 2017
Record data: 24 March 2017
Payment date: 27 March 2017

55© SGS SA 2017 ALL RIGHTS RESERVED
FULL-YEAR RESULTS PRESENTATION 23 JANUARY 2017
SGS SA CORPORATE OFFICE
1 place des Alpes P.O. Box 2152 CH – 1211 Geneva 1 t +41 (0)22 739 91 11 f +41 (0)22 739 98 86 e [email protected] www.sgs.com
CORPORATE DEVELOPMENT, COMMUNICATIONS & INVESTOR RELATIONS
Jean-Luc de Buman SGS SA 1 place des Alpes P.O. Box 2152 CH – 1211 Geneva 1 t +41 (0)22 739 93 31 f +41 (0)22 739 92 00 www.sgs.com
STOCK EXCHANGE TRADING
SIX Swiss Exchange
COMMON STOCK SYMBOLS
Bloomberg: Registered Share: SGSN.VX Reuters: Registered Share: SGSN.VX Telekurs: Registered Share: SGSN ISIN: Registered Share: CH0002497458 Swiss security number: 249745
STOCK EXCHANGE LISTING
SIX Swiss Exchange, SGSN
INVESTOR RELATIONS INFORMATION
© S
GS
Gro
up M
anag
emen
t S
A –
201
7 –
All
right
s re
serv
ed –
SG
S is
a r
egis
tere
d tr
adem
ark
of S
GS
Gro
up M
anag
emen
t S
A.
WWW.SGS.COM


