Discrepancies between Road Freight and Road Traffic HGV traffic estimates - Page 1 of 19 Discrepancies between Road Freight and Road Traffic HGV traffic estimates Methodology Note Introduction Both the Road Freight statistics series and the Road Traffic (RT) series obtain and publish estimates in vehicle-kilometres of Heavy Goods Vehicle (HGV) traffic. The Road Traffic HGV traffic estimates are consistently higher than those from the Road Freight series and the gap has increased by nearly 11% to 29% between 2000 and 2010. See Annex A for details of these increases. The two series also produce different estimates of HGV traffic according to the configuration of the vehicle. This paper intends to identify, explain and quantify the reasons for these differences and explain to users the strengths and weaknesses of each set of estimates and give recommendations in relation to their use. The Road Freight series can be found at: https://www.gov.uk/government/organisations/department-for- transport/series/road-freight-statistics The Road Traffic series can be found at: https://www.gov.uk/government/organisations/department-for- transport/series/road-traffic-statistics Data Collection and Geographical Coverage Road Traffic Estimates Annual Road Traffic estimates are mainly based on around 10,000 manual counts where trained enumerators count traffic by vehicle type over a 12 hour period. Traffic data are also collected continuously from a national network of around 180 Automatic Traffic Counters (ATCs). In addition to counting traffic, the ATCs record some of the physical properties of passing vehicles which are used to classify traffic by type. These two data sources are combined with road lengths statistics to produce the number of vehicle miles travelled each year by vehicle type, road category and region. Road Freight Estimates Road Freight statistics summarise the Continuing Survey of Road Goods Transport Great Britain (CSRGT GB), a weekly survey of GB-registered HGVs. The survey requires hauliers to record for a sampled HGV each domestic trip (and domestic legs of international trips), including the origin, the destination and mileage.
Transcript
Discrepancies between Road Freight and Road Traffic HGV traffic estimates - Page 1 of 19
Discrepancies between Road Freight and Road Traffic HGV traffic estimates
Methodology Note
Introduction
Both the Road Freight statistics series and the Road Traffic (RT) series obtain and publish estimates in vehicle-kilometres of Heavy Goods Vehicle (HGV) traffic. The Road Traffic HGV traffic estimates are consistently higher than those from the Road Freight series and the gap has increased by nearly 11% to 29% between 2000 and 2010. See Annex A for details of these increases. The two series also produce different estimates of HGV traffic according to the configuration of the vehicle.
This paper intends to identify, explain and quantify the reasons for these differences and explain to users the strengths and weaknesses of each set of estimates and give recommendations in relation to their use.
The Road Freight series can be found at: https://www.gov.uk/government/organisations/department-for-transport/series/road-freight-statistics
The Road Traffic series can be found at: https://www.gov.uk/government/organisations/department-for-transport/series/road-traffic-statistics
Data Collection and Geographical Coverage Road Traffic Estimates Annual Road Traffic estimates are mainly based on around 10,000 manual counts where trained enumerators count traffic by vehicle type over a 12 hour period. Traffic data are also collected continuously from a national network of around 180 Automatic Traffic Counters (ATCs). In addition to counting traffic, the ATCs record some of the physical properties of passing vehicles which are used to classify traffic by type. These two data sources are combined with road lengths statistics to produce the number of vehicle miles travelled each year by vehicle type, road category and region. Road Freight Estimates Road Freight statistics summarise the Continuing Survey of Road Goods Transport Great Britain (CSRGT GB), a weekly survey of GB-registered HGVs. The survey requires hauliers to record for a sampled HGV each domestic trip (and domestic legs of international trips), including the origin, the destination and mileage.
Discrepancies between Road Freight and Road Traffic HGV traffic estimates - Page 2 of 19
Only domestic trips on public roads where freight was carried (or empty trips as part of the freight business) are included in the final statistics. International mileage, mileage on private roads (e.g. site work) and mileage to and from, for example, repairs or service is excluded. Approximately 360 HGVs were surveyed per week (about 18,600 per year) in 2010, a marginally higher number than in previous years, and in 2010 the survey response rate was 93%. About 82% of all forms were usable. The breakdown of used and unused forms is given in table RFS0142 here: https://www.gov.uk/government/uploads/system/uploads/attachment data/file/10354/rfs0142.xls The sampling frame is the total population of GB-registered HGVs taxed as goods vehicles in the DVLA licensing records which provides information on the weight and tax class of licensed vehicles and is updated quarterly. Thus as the quarter nears its end, the sampling frame is more out of date as vehicles are scrapped or remain unlicensed (SORN). Heavy Goods Vehicles that are not taxed as goods vehicles, such as horse boxes and fire engines are excluded from the sample. Light goods Vehicles are also excluded from the survey. Estimates of the total annual activity of the HGV population are derived by applying a weighting factor to the distance and weight of goods carried by each sampled vehicle. The grossing factors are calculated using the population of heavy goods vehicles for each quarter, from DVLA licensing records (the same records from which the sample is drawn). The average population of the previous end quarter and current end quarter figures are used to gross up results for each quarter. Geographical Coverage RT estimates cover all traffic on GB roads including foreign and NI-registered vehicles whilst the CSRGT GB covers only GB-registered vehicles active on GB roads. In 2010, the RT series estimated that foreign HGVs accounted for 945 million vehicle-kilometres of total traffic (3.6% of HGV traffic on GB roads). NI-registered vehicles (the activity for which is captured in the CSRGT NI survey) undertook an estimated 90 million vkms on GB roads; these estimates are included in RT figures but not the CSRGT GB. It is important to note that RT and CSRGT estimates are designed for different purposes and intended to have different coverage of HGV traffic. Thus the two sets of estimates are not directly comparable and there will always be differences between the series.
Vehicle Classification Both series class vehicles with a gross vehicle weight (gvw) over 3.5 tonnes as a HGV and sub-classify these according to axle configuration. Differences in Total HGV Traffic Miscellaneous large vehicles: The CSRGT GB intentionally excludes some non-goods carrying large vehicles which will be classified as HGVs and included in the RT estimates. These include emergency service vehicles, mobile cranes, some large tractors, mechanical diggers and road maintenance vehicles such as sweepers. These are almost all
Discrepancies between Road Freight and Road Traffic HGV traffic estimates - Page 3 of 19
2-axle rigid or 5-axle articulated HGVs1. Figures from the DVLA database show that 79% of licensed HGVs are commercial (goods-carrying). The other 21% are vehicles with a HGV body type but do not carry commercial freight. However it is not possible to quantify the proportion of HGV traffic accounted for by these miscellaneous vehicles as not all vehicle types contribute equally to volume of traffic. For example, large tractors would contribute very little to the overall HGV traffic on GB roads compared with goods carrying vehicles, but the contribution of emergency vehicles, for example, is less clear. Differences in Sub-Classification of HGVs Treatment of drawbar trailers and retractable axles: The RT estimates class all HGVs towing a drawbar trailer as articulated vehicles, whilst the CSRGT GB classes these vehicles as rigid HGVs. This configuration is more common in foreign-registered vehicles which are only included in RT estimates. In addition, the RT estimates classify vehicles according to the number of axles on the ground whereas in the CSRGT GB there is no question in the survey that asks whether axles were retracted for a particular journey and so the total number of axles is used. Both of the above factors will contribute to the observed differences in traffic estimates for different sub-classifications of HGV between the two series but will not have an impact on the estimated levels of total HGV traffic. 2-axle rigid HGVs: The estimated volume of 2-axle rigid HGV traffic is approximately 4 billion vkms higher in the RT estimates than in the estimated derived from the CSRGT. This difference can be partially explained by the inclusion of the miscellaneous large vehicles in the RT estimates, which are excluded in CSRGT GB estimates, since the majority of these vehicles are of this configuration. Furthermore, 2-axle rigids are susceptible to ATC misclassification (see ATC Misclassification section below). Both of these factors contribute substantially to the overall discrepancy between the RT and CSRGT GB HGV traffic estimates as well as the sub-classification differences. 5-axle articulated HGVs: The RT estimate of 5-axle articulated HGV traffic is 4 billion vkms higher than the CSRGT estimate. Reasons for this difference include the treatment of HGVs with trailers as articulated by the RT estimates, the inclusion of some miscellaneous large vehicles of this configuration in the RT estimates and the inclusion of foreign HGVs in the RT estimates; 96% of foreign HGV traffic is undertaken in 5-axle articulated HGVs. Whilst the treatment of trailers only affects the sub-classification differences, foreign HGV traffic also affects the overall discrepancy between the RT and CSRGT GB total HGV traffic estimates and so this category creates a significant contribution to the overall discrepancy.
1 HGVs are subcategorised as either articulated or rigid vehicles; articulated vehicles are made of separate sections of tractor and trailers joined by permanent or semi-permanent pivoting joints whilst rigids consist solely of one section
Discrepancies between Road Freight and Road Traffic HGV traffic estimates - Page 4 of 19
6 or more-axle articulated HGVs: Unlike 2-axle rigid and 5-axle articulated HGVs, the CSRGT GB estimate for 6 or more axle articulated HGVs is approximately 1.3 billion vkms higher than the RT estimate. This is partly due to the fact that those vehicles with 6 or more axles that travel with axles raised may be classed as 5-axle vehicles in the RT estimates but may be recorded as 6 or more-axle vehicles by the CSRGT GB. Annex B provides further detail and figures on HGV sub-classification differences.
ATC Misclassification Due to similarities in vehicle body type, 2-axle rigid HGVs may sometimes be classified as either LGVs2 or buses, and vice versa. While this misclassification does occur in both directions, there is a greater misclassification of LGVs and buses as 2-axle rigids than in the opposite direction. Our current best estimate is that 23% of LGVs and 42% of buses are misclassified as 2-axle rigids. If the 2010 RT estimates are adjusted for ATC misclassification of 2-axle rigid HGVs, LGVs and buses, the new RT estimate for 2-axle rigids is approximately 14% lower, at 0.9 billion vkms. Due to the complex methodology involved in estimating the misclassification proportions the adjusted estimate should be treated with much caution. See Annex C for further misclassification proportions and details on the methodology used to adjust the RT estimates.
Underreporting in the CSRGT GB As is common with data from diary-based surveys, the CSRGT GB is subject to underreporting. Two methods of detecting this have been used: Tachograph Survey In 2002 a sample of hauliers answering the CSRGT GB were also asked to record and return tachograph readings. A tachograph is a device attached to the cab which electronically shows the distance covered. While there was some overestimation, 71% of tachographs returned higher mileage than the mileage recorded on the CSRGT GB by the haulier. The average weekly distance covered recorded by the tachographs was 164km higher than recorded on the CSRGT GB suggesting the CSRGT GB estimate should be uplifted by 15% to take underreporting into account. Odometer Readings Hauliers are required to return odometer3 readings which also show mileage undertaken. Odometer readings from 2004-6 corroborate the tachograph survey uplift figure of 15% but also suggest considerable difference in underreporting between rigid and articulated HGVs; that rigid vehicle CSRGT GB estimates should be uplifted by approximately 20% and articulated vehicle estimates should be uplifted by approximately 11%.
2 LGVs (light goods vehicles) are goods vehicles weighing up to (and including) 3.5 tonnes 3 Odometers are devices which either electronically or mechanically record the distance covered by a vehicle
Discrepancies between Road Freight and Road Traffic HGV traffic estimates - Page 5 of 19
The main causes of underreporting were deemed to be hauliers not recording every trip they made in the CSRGT GB, particularly near the end of the week, vehicles being used when recorded in the CSRGT GB as inactive and haulier confusion over whether to include trips made at weekends and simple misreporting of estimates of distance. As the odometer readings also suggest the overall HGV traffic estimate should be uplifted by 15% and it is the more recent study, we have used the estimated underreporting proportions from this study for rigid and for articulated HGVs to derive a new estimate of GB registered HGV traffic on GB roads. Care must been taken with this adjusted estimate of HGV traffic as both the tachograph survey and odometer readings have limitations. For example, odometer readings will include all site work and travel abroad which should not be included in the CSRGT GB traffic estimate. In addition, both odometer and tachograph readings are subject to misreporting on the survey forms. When comparing trip mileage from the CSRGT GB with mileage from the IRHS (International Road Haulage Survey)4, underreporting is further highlighted suggesting that those hauliers in receipt of both surveys may fail to complete the domestic legs of international trips on the CSRGT GB as this information is also recorded on the IRHS. Road Freight Methodology Underreporting is also magnified by the method of grossing up weekly mileages to annual estimates using the total population of HGVs in the DVLA records. Ideally, estimates of total annual mileage would be grossed up according to the number of trips and the total distance made by HGVs on UK roads but this is more problematic as we do not have the relevant data required. Sample sizes and sampling error estimates are calculated and published as part of the Road Freight Statistics series. Annual estimates of distance travelled are subject to a 1-2% error each year but when splitting estimates according to axle configuration the sampling error may be as much as 8% due to the small sample sizes involved. Thus the sub-categorised CSRGT GB estimates in particular should be treated with caution. This sampling error does not occur solely in one direction so there is no specific under- or over-estimation involved here; it merely means estimates are subject to some error5. The sample sizes and sampling errors can be found in table RFS0143 here: https://www.gov.uk/government/uploads/system/uploads/attachment data/file/10355/rfs0143.xls
Causes of Increasing Divergence between Road Freight and Road Traffic HGV Traffic Estimates The discrepancy between the RT and CSRGT GB estimates has widened over the previous decade. The difference in 2010 was 11% higher, at 29%, than in 2000 but the causes of this divergence are hard to quantify. Some possible reasons for this divergence are given below.
4 The IRHS covers the international activity of UK-registered freight operators in possession of international operator licenses. Operators are asked to record details of all international trips. The IRHS produces annual estimates of distance travelled, tonnes lifted, types of goods carried and country of loading/unloading 5 RTS estimates are also subject to a similar small error but it is not possible to quantify this
Discrepancies between Road Freight and Road Traffic HGV traffic estimates - Page 6 of 19
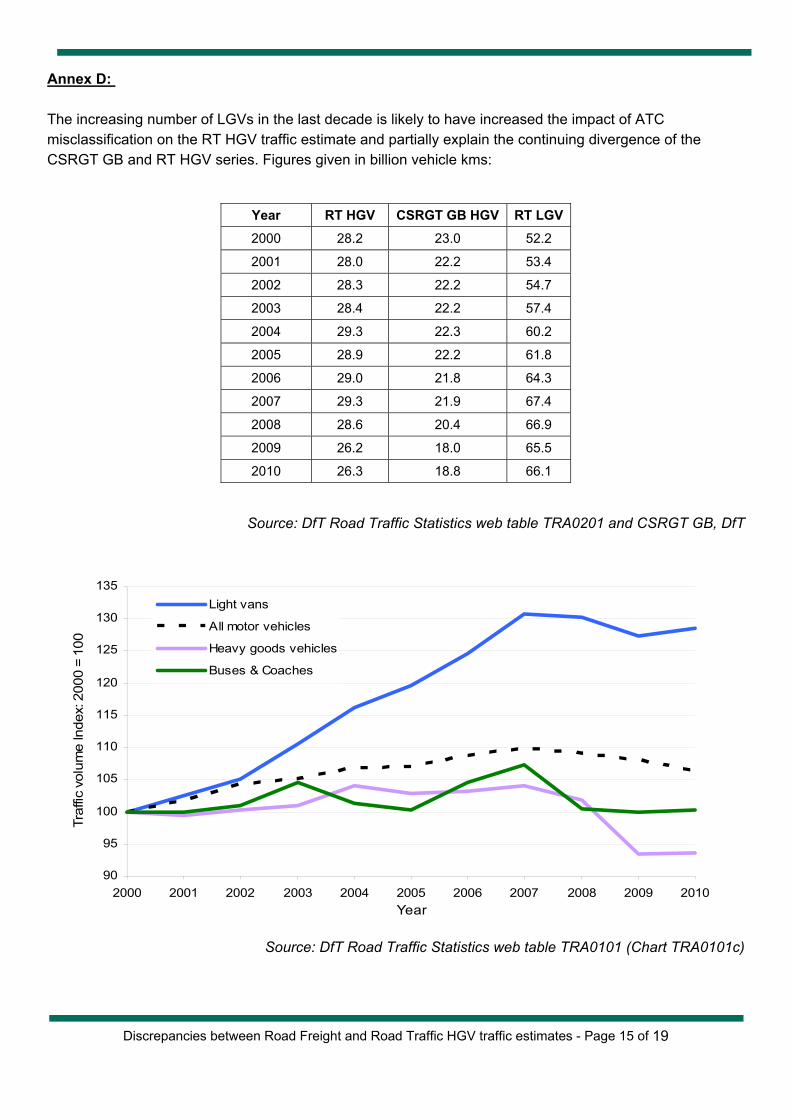
Increasing Numbers of LGVs LGV traffic has increased by 27% since 2000 which may, in part, account for the continuing divergence of the RT and CSRGT GB figures. Since more LGVs are misclassified as 2-axle rigids than vice versa, the higher proportion of LGV traffic will increase the impact of ATC misclassification resulting in higher 2-axle rigid RT estimates. See Annex D for details of this increase. Buses are also sometimes misclassified by ATCs as 2-axle rigids but the volume of bus traffic has remained roughly stable in the last decade so this is unlikely to be a cause of the increasing discrepancy. Impact of EU Expansion Another possible reason for the continuing divergence is the impact of the expansion of the European Union6 leading to higher volumes of foreign HGV traffic (as foreign-registered HGVs are included in RT estimates but excluded from the CSRGT GB). Figures from the 2003 and 2009 Survey of Foreign Goods Vehicles show that the New Member States (NMS) accounted for 32 million vkms of HGV traffic in 2003 but rose to 345 million vkms in 2009. In particular, Polish HGV traffic rose by approximately 150 million vkms so that by 2009 Polish vehicles accounted for the most foreign HGV traffic on GB roads However, traffic undertaken by HGVs registered in the original 14 EU member states7 (i.e. excluding UK-registered HGVs) dropped from 821 million vkms to 547 million vkms across the same time period. In particular, French HGVs accounted for the most HGV traffic in 2003 but by 2009 had dropped by 110 million vehicle kms to fourth. Another source of information on the activity of foreign-registered vehicles in the UK is the RoRo (Roll-on Roll-off International Freight) enquiry which records the number of powered goods vehicles and accompanied trailers leaving the UK via ferry routes and the Channel Tunnel. Unlike the Survey of Foreign Vehicles, the RoRo enquiry is continuous and produces estimates both annually and quarterly. RoRo estimates are counts of vehicles leaving the country rather than estimates of distance travelled but the RoRo enquiry shows similar trends corroborating the findings of the Survey of Foreign Goods Vehicles. In particular, RoRo figures show that the number of Polish HGVs leaving the UK has increased by 366% from 2004 to 2011 and that Polish HGVs are currently the most common foreign HGV leaving the UK. Also, RoRo figures show that the number of French HGVs leaving the UK dropped by 45% over the same time period. The Survey of Foreign Goods Vehicles shows that in total, foreign HGV traffic rose by 3% (24 million vkms) between 2003 and 2009. However the main change was not in the total HGV traffic figure, but in the make-up of that traffic. In 2003, traffic undertaken in HGVs registered in the original 14 EU member states accounted for 89% of HGV traffic whilst the NMS accounted for just 3%. By 2009, the original EU member states only accounted for 58% of traffic whilst the NMS accounted for 38%.
6 10 New Member States (Cyprus, Czech Republic, Estonia, Hungary, Latvia, Lithuania, Malta, Poland, Slovakia and Slovenia) joined the EU in 2004, followed in 2007 by Bulgaria and Romania 7 Here the original member states includes all member states of the EU who joined before 2007
Discrepancies between Road Freight and Road Traffic HGV traffic estimates - Page 7 of 19
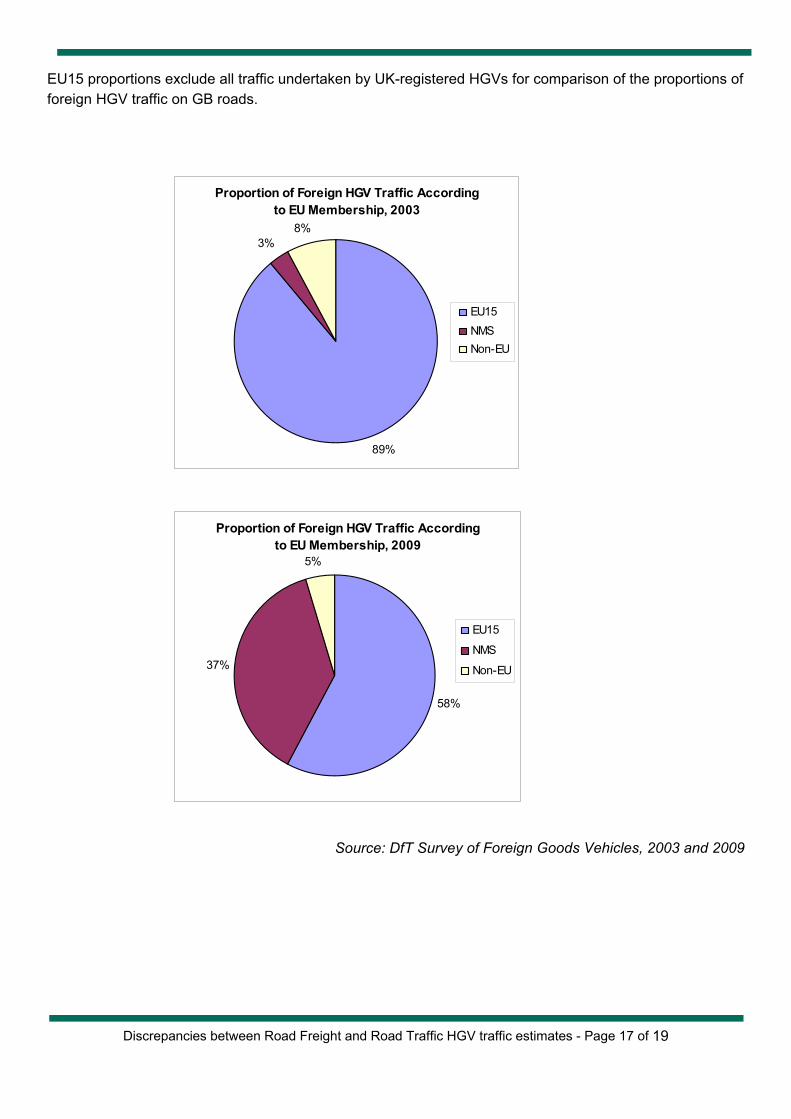
Similarly, RoRo estimates show that the total number of vehicles leaving the UK was only marginally higher in 2011 than in 2004 (0.1%) and gives similar trends in the make-up of those vehicles leaving the UK. In 2004, RoRo records that 86% and 9% of trips vehicles leaving the UK registered in the original EU member states and NMS countries respectively, but by 2011, EU member states accounted for 54% of HGVs leaving the UK and NMS accounted for 42%. In summary, whilst the EU expansion does appear to have made a substantial impact on the make-up of foreign HGV traffic, there was only a slight increase in total foreign HGV traffic (3%). Thus, the EU expansion does not seem to be a significant cause of the continuing divergence between CSRGT GB and RT HGV estimates. Accounting for Discrepancies A summary of the main factors causing the discrepancies between the RT and CSRGT GB HGV traffic estimates and their impacts:
Factor Impact ATC misclassification of 2-axle rigid HGVs, LGVs and buses
Over-estimation of the RT estimate (both total estimate and 2-axle rigid estimate)
Miscellaneous large non-goods-carrying vehicles
Over-estimation of the RT estimate (both total estimate and some sub-classification
estimates)
Underreporting in the CSRGT GB
Under-estimation of the CSRGT GB estimate (both total estimate and all sub-classification estimates)
Magnification of underreporting due to methodology of grossing
up CSRGT GB to annual estimates
Under-estimation of the CSRGT GB estimate (both total and all sub-classifications)
Foreign and NI-registered HGVs Coverage difference which should be included in the RT estimate but excluded from the CSRGT GB estimate
Differing treatment of drawbar trailers as rigids and artics
Definitional differences causing differences in estimates at a sub-classification level only
Differing treatment of axles – by total number, or number on the
ground
Definitional differences causing differences in estimates at a sub-classification level only
Increasing numbers of LGVs over time
An increasing impact on ATC misclassification (and thus increasing over-estimation of the RT estimate)
contributing to the continuing divergence over time
Impact of EU expansion Affects the proportion of foreign HGV traffic attributed to
each country but unlikely to be a significant cause of continuing divergence over time
Increasing foreign HGV traffic over time
Only a slight increase in foreign HGV traffic so only a marginal contribution to the continuing divergence over
time
Discrepancies between Road Freight and Road Traffic HGV traffic estimates - Page 8 of 19
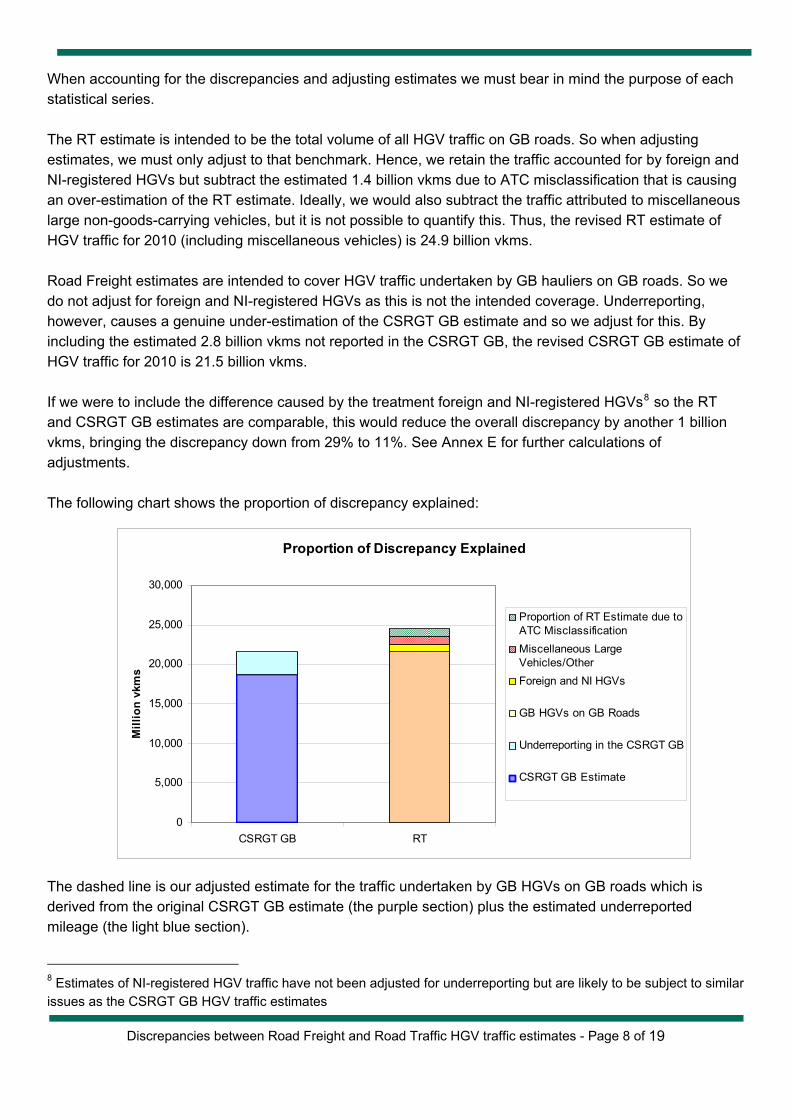
When accounting for the discrepancies and adjusting estimates we must bear in mind the purpose of each statistical series. The RT estimate is intended to be the total volume of all HGV traffic on GB roads. So when adjusting estimates, we must only adjust to that benchmark. Hence, we retain the traffic accounted for by foreign and NI-registered HGVs but subtract the estimated 1.4 billion vkms due to ATC misclassification that is causing an over-estimation of the RT estimate. Ideally, we would also subtract the traffic attributed to miscellaneous large non-goods-carrying vehicles, but it is not possible to quantify this. Thus, the revised RT estimate of HGV traffic for 2010 (including miscellaneous vehicles) is 24.9 billion vkms. Road Freight estimates are intended to cover HGV traffic undertaken by GB hauliers on GB roads. So we do not adjust for foreign and NI-registered HGVs as this is not the intended coverage. Underreporting, however, causes a genuine under-estimation of the CSRGT GB estimate and so we adjust for this. By including the estimated 2.8 billion vkms not reported in the CSRGT GB, the revised CSRGT GB estimate of HGV traffic for 2010 is 21.5 billion vkms. If we were to include the difference caused by the treatment foreign and NI-registered HGVs8 so the RT and CSRGT GB estimates are comparable, this would reduce the overall discrepancy by another 1 billion vkms, bringing the discrepancy down from 29% to 11%. See Annex E for further calculations of a
Proportion of Discrepancy Explained
0
5,000
10,000
15,000
20,000
25,000
30,000
CSRGT GB RT
Mill
ion
vkm
s
Proportion of RT Estimate due toATC MisclassificationMiscellaneous LargeVehicles/OtherForeign and NI HGVs
GB HGVs on GB Roads
Underreporting in the CSRGT GB
CSRGT GB Estimate
djustments.
he following chart shows the proportion of discrepancy explained:
GB estimate (the purple section) plus the estimated underreported
ileage (the light blue section).
T The dashed line is our adjusted estimate for the traffic undertaken by GB HGVs on GB roads which isderived from the original CSRGTm
8 Estimates of NI-registered HGV traffic have not been adjusted for underreporting but are likely to be subject to similar issues as the CSRGT GB HGV traffic estimates
Discrepancies between Road Freight and Road Traffic HGV traffic estimates - Page 9 of 19
Foreign and NI HGV traffic is treated differently by the RT series and the Road Freight statistics series due to their intended coverage. A part of the gap between the two bars on the chart is inclusion of foreign and NI-registered HGV traffic in the RT estimate. The red and green sections represent the over-estimation of traffic by the RT estimate. Part of this is explained by ATC misclassification (the green section) and the remaining discrepancy unaccounted for (the red section) is due to:
The over-estimation of the RT estimate caused by the inclusion of miscellaneous large non-goods-carrying vehicles in the RT estimate
Potential additional underreporting and ATC misclassification not covered adequately by the adjustments made to the series
Uses of HGV Traffic Estimates Due to the differing coverage and focus of these statistical series, some users may find one more appropriate for their use. The Road Traffic statistical releases are most appropriate for:
Volume of HGV traffic on GB roads HGV activity according to road class Comparison of HGV activity with the activity of other vehicle types Foreign and NI-registered HGV activity on GB roads Proportions of HGVs exceedingly the legal weight limit Headway between HGVs and vehicles in front HGV traffic distribution according to days of the week
The Road Freight domestic activity releases are most appropriate for GB-only information on:
Weight of goods hauled Tonne kilometres of goods hauled Types of commodities hauled Origin and destination of goods hauled Own account and public haulage Activity by type of business Average length of haulage trips Fuel consumption of HGVs GB freight trips on NI roads
Other Road Freight statistical releases collate statistics from other sources to include coverage specific to HGVs of:
Economic aspects of freight travel e.g. turnover of freight industry, employment figures, earnings
Environmental effects of freight travel e.g. heavy metal pollutants, greenhouse gases
Licensing
Discrepancies between Road Freight and Road Traffic HGV traffic estimates - Page 10 of 19
Safety These releases can be found here: https://www.gov.uk/government/uploads/system/uploads/attachment data/file/8968/road-freight-economic-environmental-safety-statistics.pdf
nt for pply the sampling frames and total population for
ttp://www.drdni.gov.uk/index/statistics/statscatagories/ni transport statistics.htm
Statistics for NI-registered domestic and international HGV activity are gathered via the CSRGT GB (NI). They are obtained in a similar manner to the CSRGT GB (GB) but are administered by the DepartmeRegional Development in Northern Ireland who sugrossing purposes and release the end statistics: h
(Roll-On Roll-Off) Survey. These are made available in a separate
Statistics on the international activity of UK-registered haulers are gathered via the International Road Haulage Survey (IRHS) and the RoRorelease from Road Freight statistics: https://www.gov.uk/goveruk-registered-HGVs.pdf Further information on the activity of foreign-registered HGVs is available from the Eurostat Transport Statistics Database: http://epp.eurostat.ec.europa.eu/portal/page/portal/transport/data/database For further information on Road Traffic statistics please email [email protected] For further information on Road Freight statistics please email [email protected]
Source: DfT Road Traffic Statistics web table TRA3105 and CSRGT GB, DfT
Discrepancies between Road Freight and Road Traffic HGV traffic estimates - Page 13 of 19
Annex C: Estimates of ATC misclassification proportions:
ATC
Car LGV 2-axle rigid (R2) Bus
Car 96% 4% - - LGV 31% 46% 23% -
2-axle rigid (R2) - 46% 53% 1% Act
ual
Bus - - 442% 58%
The above figures come from an exercise to estimate the proportion of vehicles being misclassified by ATCs circa 2002. The ATC algorithms used to classify vehicles by vehicle type have not changed since this date, although the weight and configuration of vehicles used in the algorithm may have done so. Methodology of producing new 2010 traffic estimates taking into account ATC misclassification: Road Traffic statistics uses expansion factors (EFs) to convert 12 hr raw counts into AADFs9. There are unique expansion factors for every count point according to the day, vehicle type and expansion factor category (which is based on road class, rural/urban roads, flow and geographical location). Using the ATC misclassification proportions table simultaneous equations of the form were created:
a×EFIC + b×EFIL = EFC
Where a = proportion of ATC cars that are actually cars
b= proportion of ATC cars that are actually LGVs EFIC = improved Expansion Factor for cars EFIL = improved Expansion Factor for LGVs EFC = current Expansion Factor for cars
Solving these equations gives the expansion factors that would be used if ATCs classified vehicles to the same level of accuracy as manual counts. As there are 16,390 unique expansion factors, we created new expansion factors grouped by road class and vehicle type. So to some extent, accuracy is lost as expansion factor category and day is no longer taken into consideration.
9 The AADF is the annual average daily flow i.e. the number of vehicles expected to pass that count point in a 24 hour period on an average day of the year
Discrepancies between Road Freight and Road Traffic HGV traffic estimates - Page 14 of 19
Once new expansion factors have been calculated, adjustments can be made to the original traffic estimate at count point level:
New Traffic = Old Traffic x (New EF/Old EF) Most count points are only counted every 2, 4 or 8 years. For these count points, in years where they are not counted traffic estimates are “grown” from the previous year by applying a growth factor (GF) calculated using the change in AADF. Using the same method as for expansion factors, we can create new growth factors assuming correct ATC classification. New traffic estimates for these “grown” count points are calculated thus:
New Traffic = Old Traffic x (New GF/Old GF)(2011 – Count Year) There are some other types of count points but due to the low proportion of HGV traffic on these roads, it was decided to leave the original estimates unchanged. This was also the case for minor road estimates where again there is a low proportion of HGV traffic, the ATCs are less involved and the methodology of producing new estimates would be more complex and time-consuming. It must be stressed that the estimate obtained for ATC misclassification is not a precise figure since accuracy is lost as a result of:
Creating an average expansion factor for all categories and days of the week, rather than creating individual factors
Leaving some count point estimates and minor road estimates unchanged Assuming the only misclassification of HGVs as other vehicle types occurs within the 2-axle rigid
sub-classification Following the above approach, the original RT 2010 HGV traffic estimate of 26.3 billion vkms was adjusted to an estimated 24.9 billion vkms.
Discrepancies between Road Freight and Road Traffic HGV traffic estimates - Page 15 of 19
Annex D: The increasing number of LGVs in the last decade is likely to have increased the impact of ATC misclassification on the RT HGV traffic estimate and partially explain the continuing divergence of the CSRGT GB and RT HGV series. Figures given in billion vehicle kms:
Source: DfT Road Traffic Statistics web table TRA0101 (Chart TRA0101c)
Discrepancies between Road Freight and Road Traffic HGV traffic estimates - Page 16 of 19
Annex E: The expansion of the EU from the original EU15 countries (countries who joined the EU pre-2004) to include the 12 New Member States (10 of which joined in 2004, 2 of which joined in 2007) has resulted in an increase in HGV traffic from the NMS. However, this is mostly off-set by a decrease in HGV traffic from the EU15 countries. Figures given in million vkms.
A Selection of HGV Traffic by Country of Vehicle Registration
020406080
100120140160180200220
France
Neth
erlan
ds
Germ
any
Italy
Belgium
Spain
Austria
Luxe
mbourg
Portuga
l
Poland
Cze
ch R
epub
lic
Hun
gary
Lithua
nia
Rom
ania
Slovenia
Mill
ion
vkm
s
20032009
Source: DfT Survey of Foreign Goods Vehicles, 2003 and 2009
Not all countries contributing to HGV traffic on GB roads have been included here. Countries were chosen on the basis of the proportion of HGV traffic they contribute to the total volume of foreign HGV traffic and EU membership. There is a clear divide between countries belonging to the EU15 (France to Portugal) and those belonging to the NMS (Poland to Slovenia).
Discrepancies between Road Freight and Road Traffic HGV traffic estimates - Page 17 of 19
EU15 proportions exclude all traffic undertaken by UK-registered HGVs for comparison of the proportions of foreign HGV traffic on GB roads.
Proportion of Foreign HGV Traffic According to EU Membership, 2003
89%
3%8%
EU15NMSNon-EU
Proportion of Foreign HGV Traffic According to EU Membership, 2009
58%
37%
5%
EU15
NMS
Non-EU
Source: DfT Survey of Foreign Goods Vehicles, 2003 and 2009
Discrepancies between Road Freight and Road Traffic HGV traffic estimates - Page 18 of 19
Annex F: Calculations of adjusted estimates for 2010 HGV estimates accounting for differences due to ATC misclassification, treatment of trailers and CSRGT GB underreporting. All figures given in million vkms. Those estimates which have been adjusted from their original values are approximate (denoted by ~ ). Original 2010 HGV traffic estimates: HGV sub-classification RT CSRGT GB % Difference
~ 24,900 The RT 2-axle rigid estimate was reduced by approximately 14% to take account of the over-estimation due to ATC misclassification of LGVs and buses as 2-axle rigids and vice versa.
Discrepancies between Road Freight and Road Traffic HGV traffic estimates - Page 19 of 19