Page 1
P1: FXS/ABE P2: FXS
0521609984c13.xml CUAT019-EVANS October 26, 2005 17:47
C H A P T E R
13Discrete ProbabilityDistributions and
Simulation
ObjectivesTo demonstrate the basic ideas of discrete random variables.
To introduce the concept of a probability distribution for a discrete random variable.
To introduce and investigate applications of the binomial probability distribution.
To show that simulation can be used to provide estimates of probability which are
close to exact solutions.
To use simulation techniques to provide solutions to probability problems where an
exact solution is too difficult to determine.
To use coins and dice as simulation models.
To introduce and use random number tables.
13.1 Discrete random variablesIn Chapter 10 the notion of the probability of an event occurring was explored, where an event
was defined as any subset of a sample space. Sample spaces which were not sets of numbers
were frequently encountered. For example, when a coin is tossed three times the sample
space is:
ε = {HHH, HHT, HTH, THH, HTT, THT, TTH, TTT}If it is only the number of heads that is of interest, however, a simpler sample space could be
used whose outcomes are numbers. Let X represent the number of heads in the three tosses of
the coin, then the possible values of X are 0, 1, 2, and 3. Since the actual value that X will take
is the outcome of a random experiment, X is called a random variable. Mathematically a
random variable is a function that assigns a number to each outcome in the sample space ε.
343
Page 2
P1: FXS/ABE P2: FXS
0521609984c13.xml CUAT019-EVANS October 26, 2005 17:47
344 Essential Mathematical Methods 1 & 2 CAS
A random variable X is said to be discrete if it can assume only a countable number of
values. For example, suppose two balls are selected at random from a jar containing several
white (W ) and black balls (B). A random variable X is defined as the number of white balls
obtained in the sample. Thus X is a discrete random variable which may take one of the
values 0, 1, or 2. The sample space of the experiment is:
S = {WW, WB, BW, BB}Each outcome in the sample space corresponds to a value of X, and vice-versa.
Experimental outcome Value of X
WW X = 2
BW X = 1
WB X = 1
BB X = 0
Many events can be associated with a given experiment. Some examples are:
Event Sample outcomes
One white ball: X = 1 {WB, BW}At least one white ball: X ≥ 1 {WW, WB, BW}No white balls: X = 0 {BB}
A probability distribution can be thought of as the theoretical description of a random
experiment. Consider tossing a die 600 times – we might obtain the following results:
x 1 2 3 4 5 6
Frequency 98 104 93 97 108 100
Experimental probability98
600
104
600
93
600
97
600
108
600
100
600
Theoretically, the frequencies will be equal, regardless of the number of trials (provided
they are sufficiently large). This can most easily be expressed by giving probabilities – for
instance, let X be ‘the outcome of tossing a die’.
x 1 2 3 4 5 6
Theoretical frequency 100 100 100 100 100 100
Pr(X = x)1
6
1
6
1
6
1
6
1
6
1
6
The table gives the probability distribution of X.
Page 3
P1: FXS/ABE P2: FXS
0521609984c13.xml CUAT019-EVANS October 26, 2005 17:47
Chapter 13 — Discrete Probability Distributions and Simulation 345
The probability distribution of X, p(x) = Pr(X = x) is a function that assigns probabilities to
each value of X. It can be represented by a rule, a table or a graph, and must give a probability
p(x) for every value x that X can take. For any discrete probability function the following must
be true:
1 The minimum possible value of p(x) is zero, and the maximum possible value of p(x) is 1.
That is:
0 ≤ p(x) ≤ 1
for every value x that X can take.
2 All values of p(x) in every probability distribution must sum to exactly 1.
To determine the probability that X lies in an interval, we add together the probabilities that
X takes all values included in that interval, as shown in the following example.
Example 1
Consider the function:
x 1 2 3 4 5
Pr(X = x) 2c 3c 4c 5c 6c
a For what value of c is this a probability distribution? b Find Pr(3 ≤ X ≤ 5).
Solution
a To be a probability distribution we require
2c + 3c + 4c + 5c + 6c = 1
20c = 1
c = 1
20
b Pr(3 ≤ X ≤ 5) = Pr(X = 3) + Pr(X = 4) + Pr(X = 5)
= 4
20+ 5
20+ 6
20
= 15
20= 3
4
Example 2
The table shows a probability distribution with random variable X.
x 1 2 3 4 5 6
Pr(X = x) 0.2 0.2 0.07 0.17 0.13 0.23
Page 4
P1: FXS/ABE P2: FXS
0521609984c13.xml CUAT019-EVANS October 26, 2005 17:47
346 Essential Mathematical Methods 1 & 2 CAS
Give the following probabilities:
a Pr(X > 4) b Pr(2 < X < 5) c Pr(X ≥ 5|X ≥ 3)
Solution
a Pr(X > 4) = Pr(X = 5) + Pr(X = 6) = 0.13 + 0.23 = 0.36
b Pr(2 < X < 5) = Pr(X = 3) + Pr(X = 4) = 0.07 + 0.17 = 0.24
c Pr(X ≥ 5|X ≥ 3) = Pr(X ≥ 5)
Pr(X ≥ 3)(as X ≥ 5 and X ≥ 3 implies X ≥ 5)
= Pr(X = 5) + Pr(X = 6)
Pr(X = 3) + Pr(X = 4) + Pr(X = 5) + Pr(X = 6)
= 0.13 + 0.23
0.07 + 0.17 + 0.13 + 0.23= 0.36
0.6
= 3
5
Example 3
The following distribution table gives the probabilities for the number of people on a carnival
ride at a paticular time of day.
No. of people (t) 0 1 2 3 4 5
Pr(T = t) 0.05 0.2 0.3 0.2 0.1 0.15
Find:
a Pr(T > 4) b Pr(1 < T < 5) c Pr(T < 3|T < 4)
Solution
a Pr(T > 4) = Pr(T = 5) = 0.15
b Pr(1 < T < 5) = Pr(T = 2) + Pr(T = 3) + Pr(T = 4) = 0.6
c Pr(T < 3|T < 4) = Pr (T < 3)
Pr (T < 4)
= 0.55
0.75
= 11
15
Exercise 13A
1 A random variable X can take the values x = 1, 2, 3, 4. Indicate whether or not each of the
following is a probability function for such a variable, and if not, give reasons:
a p(1) = 0.05 p(2) = 0.35 p(3) = 0.55 p(4) = 0.15
b p(1) = 0.125 p(2) = 0.5 p(3) = 0.25 p(4) = 0.0625
Page 5
P1: FXS/ABE P2: FXS
0521609984c13.xml CUAT019-EVANS October 26, 2005 17:47
Chapter 13 — Discrete Probability Distributions and Simulation 347
c p(1) = 13% p(2) = 69% p(3) = 1% p(4) = 17%
d p(1) = 51 p(2) = 12 p(3) = 34 p(4) = 3
e p(1) = 0.66 p(2) = 0.32 p(3) = −0.19 p(4) = 0.21
2 For each of the following write a probability statement in terms of the discrete random
variable X showing the probability that:
a X is equal to 2 b X is greater than 2 c X is at least 2
d X is less than 2 e X is 2 or more
f X is more than 2 g X is no more than 2
h X is greater than or equal to 2 i X is less than or equal to 2
j X is no less than 2 k X is greater than 2 and less than 5
3 A random variable X can take the values 0, 1, 2, 3, 4, 5. List the set of values that X can
take for each of the following probability statements:
a Pr(X = 2) b Pr(X > 2) c Pr(X ≥ 2)
d Pr(X < 2) e Pr(X ≤ 2) f Pr(2 ≤ X ≤ 5)
g Pr(2 < X ≤ 5) h Pr(2 ≤ X < 5) i Pr(2 < X < 5)
4 Consider the following function:Example 1
x 1 2 3 4 5
Pr(X = x) k 2k 3k 4k 5k
a For what value of k is this a probability distribution?
b Find Pr(2 ≤ X ≤ 4).
5 The number of ‘no-shows’ on a scheduled airline flight has the following probability
distribution:
r 0 1 2 3 4 5 6 7
p(r ) 0.09 0.22 0.26 0.21 0.13 0.06 0.02 0.01
Find the probability that:
a more than four people do not show up for the flight
b at least two people do not show up for the flight.
6 Suppose Y is a random variable with the distribution given in the table.
y 0.2 0.3 0.4 0.5 0.6 0.7 0.8 0.9
Pr(Y = y) 0.08 0.13 0.09 0.19 0.20 0.03 0.10 0.18
Find:
a Pr(Y ≤ 0.50) b Pr(Y > 0.50) c Pr(0.30 ≤ Y ≤ 0.80)
Page 6
P1: FXS/ABE P2: FXS
0521609984c13.xml CUAT019-EVANS October 26, 2005 17:47
348 Essential Mathematical Methods 1 & 2 CAS
7 The table shows a probability distribution with random variable X.Example 2
x 1 2 3 4 5 6
Pr(X = x) 0.1 0.13 0.17 0.27 0.20 0.13
Give the following probabilities:
a Pr(X > 3) b Pr(3 < X < 6) c Pr (X ≥ 4|X ≥ 2)
8 Suppose that a fair coin is tossed three times.
a List the eight equally likely outcomes.
b If X represents the number of heads shown, determine Pr(X = 2).
c Find the probability distribution of the random variable X.
d Find Pr(X ≤ 2).
e Find Pr(X ≤ 1|X ≤ 2).
9 When a pair of dice is rolled, 36 equally likely outcomes are possible. Let Y denote the
sum of the dice.
a What are the possible values of the random variable Y ?
b Find Pr(Y = 7).
c Determine the probability distribution of the random variable Y.
10 When a pair of dice is rolled, 36 equally likely outcomes are possible. Let X denote the
larger of the values showing on the dice. If both dice come up the same, then X denotes
the common value.
a What are the possible values of the random variable X ?
b Find Pr(X = 4).
c Determine the probability distribution of the random variable X.
11 A dart is thrown at a circular board with a radius of 10 cm. The board has three rings: a
bullseye of radius 3 cm, a second ring with an outer radius of 7 cm, and a third ring with
outer radius 10 cm. Assume that the probability of the dart hitting a region R is given by
Pr(R) = area of R
area of dartboard
a Find the probability of scoring a bullseye.
b Find the probability of hitting the middle ring.
c Find the probability of hitting the outer ring.
12 Suppose that a fair coin is tossed three times. You lose $3.00 if three heads appear and
$2.00 if two heads appear. You win $1.00 if one head appears and $3.00 if no heads
appear; $Y is the amount you win or lose.
a Find the probability distribution of the random variable Y.
b Find Pr(Y ≤ 1).
Page 7
P1: FXS/ABE P2: FXS
0521609984c13.xml CUAT019-EVANS October 27, 2005 11:59
Chapter 13 — Discrete Probability Distributions and Simulation 349
13.2 Sampling without replacementConsider the sort of probability distribution that arises from the most common sampling
situation.
A jar contains three mints and four toffees, and Bob selects two (without looking). If the
random variable of interest is the number of mints he selects, then this can take values of 0, 1
or 2. Suppose this was done experimentally many times (say 50). The following results may be
obtained:
Number of mints 0 1 2
Number of times observed 18 24 8
Let X be the number of mints Bob selects. From the table, the probabilities can be estimated
for each outcome as:
Pr(X = 0) ≈ 18
50= 0.36
Pr(X = 1) ≈ 24
50= 0.48
Pr(X = 2) ≈ 8
50= 0.16
Obviously, it is not desirable that an experiment needs to be carried out every time a situation
like this arises and it is not necessary. It is possible to work out the theoretical probability for
each value of the random variable by using the knowledge of combinations from Chapter 12.
Consider the situation in which the sample of two sweets contains no mints. Then it must
contain two toffees. Thus Bob has selected no mints from the three available, and two toffees
from the four available, which gives the number of favourable outcomes as:(3
0
)(4
2
)
Now the number of possible choices Bob has of choosing two sweets from seven is
(72
)and
thus the probability of Bob selecting no mints is:
Pr(X = 0) =
(30
) (42
)(
72
)
= 6
21
= 2
7
Page 8
P1: FXS/ABE P2: FXS
0521609984c13.xml CUAT019-EVANS October 26, 2005 17:47
350 Essential Mathematical Methods 1 & 2 CAS
Similarly, we can determine:
Pr(X = 1) =
(31
) (41
)(
72
) and Pr(X = 2) =
(32
) (40
)(
72
)
= 12
21= 3
21
= 4
7= 1
7
Thus the probability distribution for X is:
x 0 1 2
Pr(X = x)2
7
4
7
1
7
Note that the probabilities in the table add up to 1. If they did not add to 1 it would be known
that an error had been made.
This problem can also easily be completed with a tree diagram.
Toffee
Mint
Toffee
Toffee
Mint
Mint
37
47
36
36
46
26
Therefore Pr(X = 0) = 4
7× 3
6= 2
7
Pr(X = 1) = 4
7× 3
6+ 3
7× 4
6= 2
7+ 2
7= 4
7
and Pr(X = 2) = 3
7× 2
6= 1
7
This can be considered as a sequence of two trials in which the second is dependent on
the first.
Instead of evaluating the probabilities for all the values of X and listing them in a table, the
probability distribution could be given as a rule and, providing the values of X are specified for
which the rule is appropriate, the same information as before is available. In this case the
rule is:
Pr(X = x) =(
3x
)(4
2 − x
)(
72
) , x = 0, 1, 2
This example is an application of a distribution which is commonly called the hypergeometric
distribution.
Page 9
P1: FXS/ABE P2: FXS
0521609984c13.xml CUAT019-EVANS October 26, 2005 17:47
Chapter 13 — Discrete Probability Distributions and Simulation 351
Example 4
Marine biologists are studying a group of dolphins which live in a small bay. They know there
are 12 dolphins in the group, four of which have been caught, tagged and released to mix back
into the population. If the researchers return the following week and catch another group of
three dolphins, what is the probability that two of these will already be tagged?
Solution
Let X equal the number of tagged dolphins in the second sample.
We wish to know the probability of selecting two of the four tagged dolphins, and
one of the eight non tagged dolphins, when a sample of size 3 is selected from a
population of size 12. That is:
Pr(X = 2) =(
42
) (81
)(
123
)
= 12
55
Exercise 13B
1 A company employs 30 salespersons, 12 of whom are men and 18 are women. FiveExample 4
salespersons are to be selected at random to attend an important conference. What is the
probability of selecting two men and three women?
2 An electrical component is packaged in boxes of 20. A technician randomly selects three
from each box for testing. If there are no faulty components, the whole box is passed. If
there are any faulty components, the box is sent back for further inspection. If a box is
known to contain four faulty components, what is the probability it will pass?
3 A pond contains seven gold and eight black fish. If three fish are caught at random in a net,
find the probability that at least one of them is black.
4 A researcher has caught, tagged and released 10 birds of a particular species into the forest.
If there are known to be 25 of this species of bird in the area, what is the probability that
another sample of five birds will contain three tagged ones?
5 A tennis instructor has 10 new and 10 used tennis balls. If he selects six balls at random to
use in a class, what is the probability that there will be at least two new balls?
6 A jury of six persons was selected from a group of 18 potential jurors, of whom eight were
female and 10 male. The jury was supposedly selected at random, but it contained only one
female. Do you have any reason to doubt the randomness of the selection? Explain your
reasons.
Page 10
P1: FXS/ABE P2: FXS
0521609984c13.xml CUAT019-EVANS October 26, 2005 17:47
352 Essential Mathematical Methods 1 & 2 CAS
13.3 Sampling with replacement:the binomial distributionSuppose a fair six-sided die is rolled four times and a random variable X is defined as the
number of 3s observed. An approximate probability distribution for this random variable could
be found by repeatedly rolling the die four times, and observing the outcomes. On one
occasion the four rolls of the die was repeated 100 times and the following results noted:
x 0 1 2 3 4
No. of times observed 50 44 5 1 0
From this table the probabilities for each outcome could be estimated:
Pr(X = 0) ≈ 50
100= 0.50
Pr(X = 1) ≈ 40
100= 0.44
Pr(X = 2) ≈ 5
100= 0.05
Pr(X = 3) ≈ 1
100= 0.01
Pr(X = 4) ≈ 0
100= 0
The theoretical probability distribution can be determined in the following way.
One possible outcome of the experiment is TTNN, where T represents a 3 and N represents
not a 3.
The probability of this particular outcome (that is, in this order) is
1
6× 1
6× 5
6× 5
6=
(1
6
)2 (5
6
)2
How many different arrangements of T, T, N, and N are there? Listing we find that there are
six: TTNN, TNTN, TNNT, NTTN, NTNT, NNTT. The number of arrangements could be found
without listing them by recognising that this is equal to
(4
2
), the number of ways of placing
the two Ts in the four available places.
Thus, the probability of obtaining exactly two 3s when a fair die is tossed four times is:
Pr(X = 2) =(
4
2
) (1
6
)2 (5
6
)2
= 25
216
Page 11
P1: FXS/ABE P2: FXS
0521609984c13.xml CUAT019-EVANS October 26, 2005 17:47
Chapter 13 — Discrete Probability Distributions and Simulation 353
Continuing in this way the entire probability distribution can be defined as given in the
table. (Note that the probabilities shown do not add to exactly 1 owing to rounding errors.)
x 0 1 2 3 4
Pr(X = x) 0.4822 0.3858 0.1157 0.0154 0.0008
It would be convenient to be able to use a formula to summarise the probability distribution.
In this case it is:
Pr(X = x) =(
4
x
) (1
6
)x (5
6
)n−x
x = 0, 1, 2, 3, 4
This is an example of the binomial probability distribution, which has arisen from a
binomial experiment. A binomial experiment is one that possesses the following properties:
The experiment consists of a number, n, of identical trials.
Each trial results in one of two outcomes, which are usually designated as either a success,
S, or a failure, F.
The probability of success on a single trial, p say, is constant for all trials (and thus the
probability of failure on a single trial is (1 – p)).
The trials are independent (so that the outcome on any trial is not affected by the outcome
of any previous trial).
The random variable of interest, X, is the number of successes in n trials of a binomial
experiment. Thus, X has a binomial distribution and the rule is:
Pr(X = x) =(n
x
)(p)x (1 − p)n−x x = 0, 1, . . . , n
where(n
x
)= n!
x!(n − x)!
Example 5
Rainfall records for the city of Melbourne indicate that, on average, the probability of rain
falling on any one day in November is 0.4. Assuming that the occurrence of rain on any day is
independent of whether or not rain falls on any other day, find the probability that rain will fall
on any three days of a chosen week.
Solution
Since there are only two possible outcomes on each day (rain or no rain), the
probability of rain on any day is constant (0.4) regardless of previous outcomes. The
situation described is a binomial experiment. In this example occurrence of rain is
considered as a success, and so define X as the number of days on which it rains in a
given week. Thus X is a binomial random variable with p = 0.4 and n = 7.
Page 12
P1: FXS/ABE P2: FXS
0521609984c13.xml CUAT019-EVANS October 26, 2005 17:47
354 Essential Mathematical Methods 1 & 2 CAS
Pr(X = x) =(
7
x
)(0.4)x (0.6)7−x , x = 0, 1, . . . , 7
and Pr(X = 3) =(
7
3
)(0.4)3(0.6)7−3
= 7!
3!4!× 0.064 × 0.13
= 0.290 304 (values held in calculator)
Using a CAS calculatorA CAS calculator can be used to evaluate probabilities for many distributions,
including binomial distribution. To access the probability distributions stored in the
calculator use the application Stats/List Editor.
Press F5 Distr.
Scroll down to the two references to the binomial
distribution:
B:Binomial Pdf is used to determine probabilities
for the binomial distribution of the form Pr(X = x).
Here Pdf refers to probability distribution function.
C:Binomial Cdf is used to determine probabilities for the binomial
distribution of the form Pr(X ≤ x). Here Cdf refers to cumulative
distribution function.
Examples of how and when to use each of these functions are given in Example 6.
Example 6
For the situation described in Example 5, use the CAS calculator to find the probability that:
a rain will fall on any three days of a chosen week
b rain will fall on no more than three days of a chosen week
c rain will fall on at least three days of a chosen week.
Solution
a As shown in Example 5, Pr (X = 3) is required, where n = 7, p = 0.4.
Complete as shown and press ENTER . The result is shown.
Once again it is found that Pr(X = 3) = 0.2903.
Page 13
P1: FXS/ABE P2: FXS
0521609984c13.xml CUAT019-EVANS October 26, 2005 17:47
Chapter 13 — Discrete Probability Distributions and Simulation 355
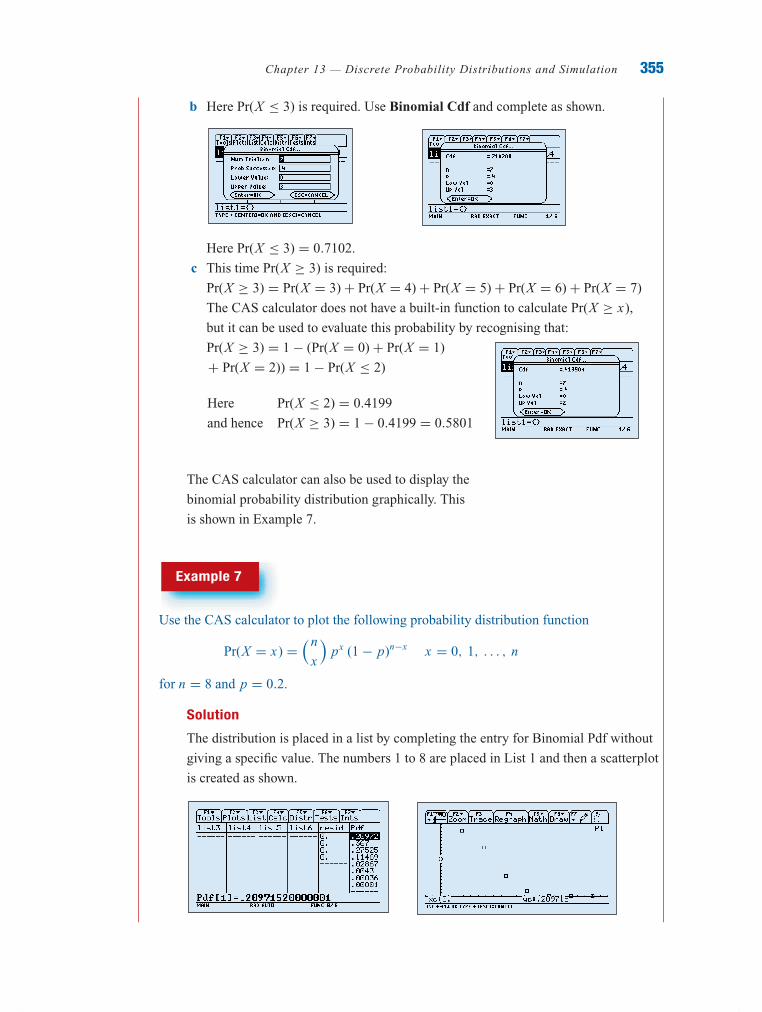
b Here Pr(X ≤ 3) is required. Use Binomial Cdf and complete as shown.
Here Pr(X ≤ 3) = 0.7102.
c This time Pr(X ≥ 3) is required:
Pr(X ≥ 3) = Pr(X = 3) + Pr(X = 4) + Pr(X = 5) + Pr(X = 6) + Pr(X = 7)
The CAS calculator does not have a built-in function to calculate Pr(X ≥ x),
but it can be used to evaluate this probability by recognising that:
Pr(X ≥ 3) = 1 − (Pr(X = 0) + Pr(X = 1)
+ Pr(X = 2)) = 1 − Pr(X ≤ 2)
Here Pr(X ≤ 2) = 0.4199
and hence Pr(X ≥ 3) = 1 − 0.4199 = 0.5801
The CAS calculator can also be used to display the
binomial probability distribution graphically. This
is shown in Example 7.
Example 7
Use the CAS calculator to plot the following probability distribution function
Pr(X = x) =(n
x
)px (1 − p)n−x x = 0, 1, . . . , n
for n = 8 and p = 0.2.
Solution
The distribution is placed in a list by completing the entry for Binomial Pdf without
giving a specific value. The numbers 1 to 8 are placed in List 1 and then a scatterplot
is created as shown.
Page 14
P1: FXS/ABE P2: FXS
0521609984c13.xml CUAT019-EVANS October 26, 2005 17:47
356 Essential Mathematical Methods 1 & 2 CAS
Example 8
The probability of winning a prize in a game of chance is 0.25. What is the least
number of games that must be played to ensure that the probability of winning at
least twice is more than 0.9?
SolutionAs the probability of winning each game is the same each time the game is
played, this is an example of a binomial distribution, with the probability of
success p = 0.25. We are being asked to find the value of n such that:
Pr(X ≥ 2) > 0.9
or, equivalently, Pr(X < 2) ≤ 0.1
Pr(X < 2) = Pr(X = 0) + Pr(X = 1)
=(n
0
)0.250(0.75)n +
(n
1
)0.251(0.75)n−1
= (0.75)n + n0.251(0.75)n−1 since(n
0
)= 1 and
(n
1
)= n
It is required to find the value of n such that:
(0.75)n + 0.25n(0.75)n−1 ≤ 0.1
This is not an equation that can be solved
algebraically; however, the CAS calculator
can be used to solve this equation numerically.
Thus, this game must be played at least 15 times
to ensure that the probability of winning at least
twice is more than 0.9.
Example 9
The probability of an archer obtaining a maximum score from a shot is 0.4. Find the
probability that out of five shots the archer obtains the maximum score:
a three times
b three times, given that it is known that she obtains the maximum score at least once.
Solution
a Let X be the number of maximum scores from 5 shots.
Pr(X = 3) = 5C3(0.4)3(0.6)2
= 10 × 0.064 × 0.36
= 0.2304
(= 144
625
)
Page 15
P1: FXS/ABE P2: FXS
0521609984c13.xml CUAT019-EVANS October 26, 2005 17:47
Chapter 13 — Discrete Probability Distributions and Simulation 357
b Pr(X = 3|X > 0) = Pr(X = 3)
Pr(X > 0)
= 0.2304
1 − Pr(X = 0)
= 0.2304
1 − 0.65
= 0.2304
0.92224= 0.2498 (correct to 4 decimal places)
Exercise 13C
1 For the binomial distribution Pr(X = x) =(
6
x
)(0.3)x (0.7)6−x , x = 0, 1, . . . , 6, find:Example 5
a Pr(X = 3) b Pr(X = 4)
2 For the binomial distribution Pr(X = x) =(
10
x
)(0.1)x (0.9)10−x , x = 0, 1, . . . , 10, find:Example 6
a Pr(X = 2) b Pr(X ≤ 2)
3 A fair die is rolled 60 times. Use your CAS calculator to find the probability of observing:
a exactly ten 6s b fewer than ten 6s c at least ten 6s
4 Rainfall records for the city of Melbourne indicate that, on average, the probability of rain
falling on any one day in November is 0.35. Assuming that the occurrence of rain on any
day is independent of whether or not rain falls on any other day, find the probability that:
a rain will fall on the first three days of a given week, but not on the other four
b rain will fall on exactly three days of a given week, but not on the other four
c rain will fall on at least three days of a given week.
5 A die is rolled seven times and the number of 2s that occur in the seven rolls is noted.
Find the probability that:
a the first roll is a 2 and the rest are not
b exactly one of the seven rolls results in a 2.
6 If the probability of a female child being born is 0.5, use your CAS calculator to find the
probability that, if 100 babies are born on a certain day, more than 60 of them will be
female.
Page 16
P1: FXS/ABE P2: FXS
0521609984c13.xml CUAT019-EVANS October 26, 2005 17:47
358 Essential Mathematical Methods 1 & 2 CAS
7 A breakfast cereal manufacturer places a coupon in every tenth packet of cereal entitling
the buyer to a free packet of cereal. Over a period of two months a family purchases five
packets of cereal.
a Find the probability distribution of the number of coupons in the five packets.
b What is the most probable number of coupons in the five packets?
8 If the probability of a female child being born is 0.48, find the probability that a family
with exactly three children has at least one child of each sex.
9 An insurance company examines its records and notes that 30% of accident claims are
made by drivers aged under 21. If there are 100 accident claims in the next 12 months, use
your CAS calculator to determine the probability that 40 or more of them are made by
drivers aged under 21.
10 A restaurant is able to seat 80 customers inside, and many more at outside tables.
Generally, 80% of their customers prefer to sit inside. If 100 customers arrive one day, use
your CAS calculator to determine the probability that the restaurant will seat inside all
those who make this request.
11 A supermarket has four checkouts. A customer in a hurry decides to leave without
making a purchase if all the checkouts are busy. At that time of day the probability of each
checkout being free is 0.25. Assuming that whether or not a checkout is busy is
independent of any other checkout, calculate the probability that the customer will make a
purchase.
12 An aircraft has four engines. The probability that any one of them will fail on a flight is
0.003. Assuming the four engines operate independently, find the probability that on a
particular flight:
a no engine failure occurs b not more than one engine failure occurs
c all four engines fail
13 A market researcher wishes to determine if the public has a preference for one of two
brands of cheese, brand A or brand B. In order to do this, 15 people are asked to choose
which cheese they prefer. If there is actually no difference in preference:
a What is the probability that 10 or more people would state a preference for brand A?
b What is the probability that 10 or more people would state a preference for brand A or
brand B?
14 It has been discovered that 4% of the batteries produced at a certain factory are defective.
A sample of 10 is drawn randomly from each hour’s production and the number of
defective batteries is noted. In what percentage of these hourly samples would there be a
least two defective batteries? Explain what doubts you might have if a particular sample
contained six defective batteries.
Page 17
P1: FXS/ABE P2: FXS
0521609984c13.xml CUAT019-EVANS October 26, 2005 17:47
Chapter 13 — Discrete Probability Distributions and Simulation 359
15 An examination consists of 10 multiple-choice questions. Each question has four possible
answers. At least five correct answers are required to pass the examination.
a Suppose a student guesses the answer to each question. What is the probability the
student will make:
i at least three correct guesses? ii at least four correct guesses?
iii at least five correct guesses?
b How many correct answers do you think are necessary to decide that the student is not
guessing each answer? Explain your reasons.
16 An examination consists of 20 multiple-choice questions. Each question has four possible
answers. At least 10 correct answers are required to pass the examination. Suppose the
student guesses the answer to each question. Use your CAS calculator to determine the
probability that the student passes.
17 Plot the probability distribution function Pr(X = x) =(n
x
)px (1 − p)n−x ,Example 7
x = 0, 1, . . . , n, for n = 10 and p = 0.3
18 Plot the probability distribution function Pr(X = x) =(n
x
)px (1 − p)n−x ,
x = 0, 1, . . . , n, for n = 15 and p = 0.6.
19 What is the least number of times a fair coin should be tossed in order to ensure that:Example 8
a the probability of observing at least one head is more than 0.95?
b the probability of observing more than one head is more than 0.95?
20 What is the least number of times a fair die should be rolled in order to ensure that:
a the probability of observing at least one 6 is more than 0.9?
b the probability of observing more than one 6 is more than 0.9?
21 Geoff has determined that his probability of hitting an ace when serving at tennis is 0.1.
What is the least number of balls he must serve to ensure that:
a the probability of hitting at least one ace is more than 0.8?
b probability of hitting more than one ace is more than 0.8?
22 The probability of winning in a game of chance is known to be 0.05. What is the least
number of times Phillip should play the game in order to ensure that:
a the probability that he wins at least once is more than 0.90?
b the probability that he wins at least once is more than 0.95?
23 The probability of a shooter obtaining a maximum score from a shot is 0.7. Find theExample 9
probability that out of five shots the shooter obtains the maximum score:
a three times
b three times, given that it is known that he obtains the maximum score at least once.
Page 18
P1: FXS/ABE P2: FXS
0521609984c13.xml CUAT019-EVANS October 26, 2005 17:47
360 Essential Mathematical Methods 1 & 2 CAS
24 Each week a security firm transports a large sum of money between two places. The day
on which the journey is made is varied at random and, in any week, each of the five days
from Monday to Friday is equally likely to be chosen. (In the following, give answers
correct to 4 decimal places.)
Calculate the probability that in a period of 10 weeks Friday will be chosen:
a two times b at least two times
c exactly three times, given it is chosen at least two times
13.4 Solving probability problems using simulationSimulation is a very powerful and widely used procedure which enables us to find approximate
answers to difficult probability questions. It is a technique which imitates the operation of the
real-world system being investigated. Some problems are not able to be solved directly and
simulation allows a solution to be obtained where otherwise none would be possible. In this
section some specific probability problems are looked at which may be solved by using
simulation, a valuable and legitimate tool for the statistician.
Example 10
What is the probability that a family of five children will include at least four girls?
Solution
This problem could be simulated by tossing a coin five times, once for each child,
using a model based on the following assumptions:
There is a probability of 0.5 of each child being female.
The sex of each child is independent of the sex of the other children. That is, the
probability of a female child is always 0.5.
Since the probability of a female child is 0.5, then tossing a fair coin is a suitable
simulation model. Let a head represent a female child and a tail a male child. A trial
consists of tossing the coin five times to represent one complete family of five
children and the result of the trial is the number of female children obtained in the
trial. To estimate the required probability several trials need to be conducted. How
many trials are needed to estimate the probability? As we have already noted in
Section 8.2, the more repetitions of an experiment the better the estimate of the
probability. Initially about 50 trials could be considered.
An example of the results that might be obtained from 10 trials is given in the table
on the next page:
Page 19
P1: FXS/ABE P2: FXS
0521609984c13.xml CUAT019-EVANS October 26, 2005 17:47
Chapter 13 — Discrete Probability Distributions and Simulation 361
Trial number Simulation results Number of heads
1 THHTT 2
2 HHHTH 4
3 HHHTH 4
4 HTTTH 2
5 HTHHH 4
6 HTTTH 2
7 TTHHH 3
8 HTHHT 3
9 TTTHH 2
10 HHTTT 2
Continuing in this way, the following results were obtained for 50 trials:
Number of heads Number of times obtained
0 1
1 8
2 17
3 13
4 10
5 1
The results in the table can be used to estimate the required probability. Since at
least four heads were obtained in 11 trials, estimate the probability of at least four
female children as 1150 or 0.22. Of course, since this probability has been estimated
experimentally, repeating the simulations would give a slightly different result, but we
would expect to obtain approximately this value most of the time.
Example 10 can be recognised as a situation involving a binomial random variable,
with n = 5 and p = 0.5. Thus the exact answer to the question ‘What is the probability
that a family of five children will include at least four girls?’ is:
Pr(X ≥ 4) =(
5
4
)(0.5)4(0.5)1 +
(5
5
)(0.5)5(0.5)0
= 0.1875
This is reasonably close to the answer obtained from the simulation.
In Example 10 simulation was used to provide an estimate of the value of a particular
probability. Simulation is also widely used to estimate the values of other quantities which are
of interest in a probability problem. We may wish to know the average result, the largest result,
the number of trials required to achieve a certain result, and so on. An example of this type of
problem is given in Example 11.
Page 20
P1: FXS/ABE P2: FXS
0521609984c13.xml CUAT019-EVANS October 26, 2005 17:47
362 Essential Mathematical Methods 1 & 2 CAS
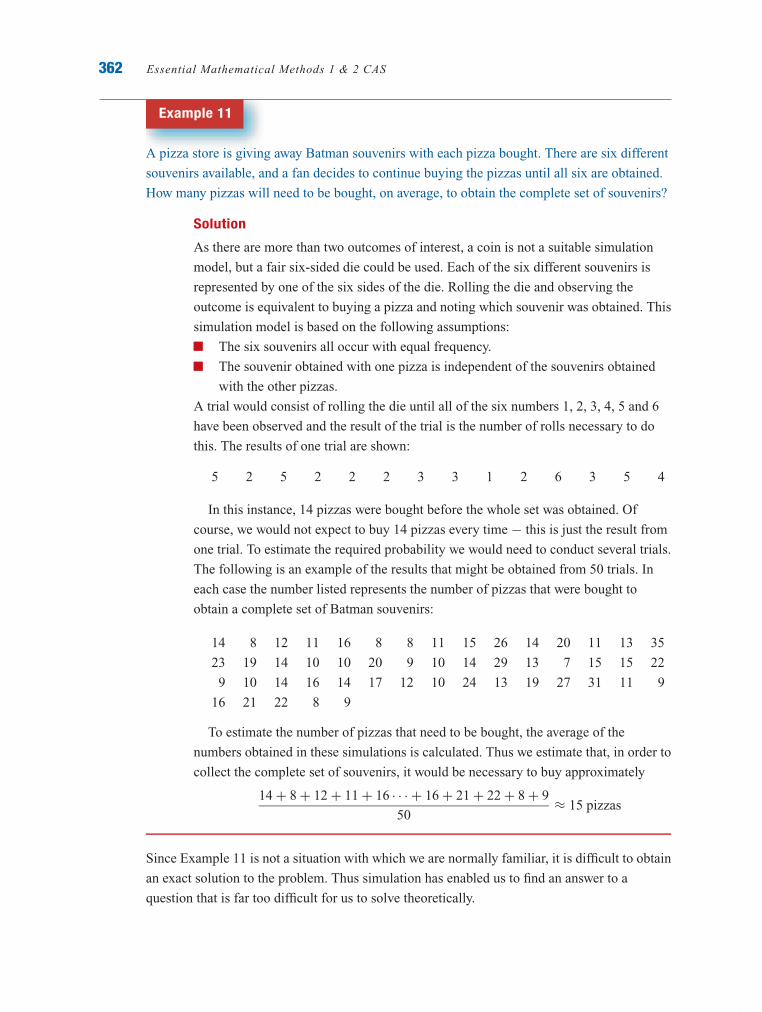
Example 11
A pizza store is giving away Batman souvenirs with each pizza bought. There are six different
souvenirs available, and a fan decides to continue buying the pizzas until all six are obtained.
How many pizzas will need to be bought, on average, to obtain the complete set of souvenirs?
Solution
As there are more than two outcomes of interest, a coin is not a suitable simulation
model, but a fair six-sided die could be used. Each of the six different souvenirs is
represented by one of the six sides of the die. Rolling the die and observing the
outcome is equivalent to buying a pizza and noting which souvenir was obtained. This
simulation model is based on the following assumptions:
The six souvenirs all occur with equal frequency.
The souvenir obtained with one pizza is independent of the souvenirs obtained
with the other pizzas.
A trial would consist of rolling the die until all of the six numbers 1, 2, 3, 4, 5 and 6
have been observed and the result of the trial is the number of rolls necessary to do
this. The results of one trial are shown:
5 2 5 2 2 2 3 3 1 2 6 3 5 4
In this instance, 14 pizzas were bought before the whole set was obtained. Of
course, we would not expect to buy 14 pizzas every time − this is just the result from
one trial. To estimate the required probability we would need to conduct several trials.
The following is an example of the results that might be obtained from 50 trials. In
each case the number listed represents the number of pizzas that were bought to
obtain a complete set of Batman souvenirs:
14 8 12 11 16 8 8 11 15 26 14 20 11 13 35
23 19 14 10 10 20 9 10 14 29 13 7 15 15 22
9 10 14 16 14 17 12 10 24 13 19 27 31 11 9
16 21 22 8 9
To estimate the number of pizzas that need to be bought, the average of the
numbers obtained in these simulations is calculated. Thus we estimate that, in order to
collect the complete set of souvenirs, it would be necessary to buy approximately
14 + 8 + 12 + 11 + 16 · · · + 16 + 21 + 22 + 8 + 9
50≈ 15 pizzas
Since Example 11 is not a situation with which we are normally familiar, it is difficult to obtain
an exact solution to the problem. Thus simulation has enabled us to find an answer to a
question that is far too difficult for us to solve theoretically.
Page 21
P1: FXS/ABE P2: FXS
0521609984c13.xml CUAT019-EVANS October 26, 2005 17:47
Chapter 13 — Discrete Probability Distributions and Simulation 363
In practice there are situations where coins and dice may not be used. Other methods of
simulation need to be adopted to deal with a wide range of situations. Suppose we wished to
determine how many pizzas would need to be bought, on average, to obtain a complete set of
eight souvenirs. This time we need to generate random numbers from 1 to 8 and a six-sided die
would no longer be appropriate, but there are other methods that could be used. We could
construct a spinner with eight equal sections marked from 1 to 8, or we could mark eight balls
from 1 to 8 and draw them (with replacement) from a bowl, or one of a number of other
methods. Often, when we wish to simulate and coins and dice are not appropriate we use
random number tables, which will be discussed in the next section.
Exercise 13D
1 A teacher gives her class a test consisting of 10 ‘true or false’ questions. Use simulation toExamples 10+11
estimate the probability of a student who guesses the answer to every question, and gets at
least seven correct. Use your knowledge of the binomial distribution to find an exact
answer to this question.
2 Because of overpopulation, some countries are trying to limit their birth rate. One countryExample 11
decides to implement a ‘one son’ policy, in which a family is allowed to continue having
children until their first son is born. Use simulation to answer the following questions:
a What is the ratio of girls to boys in this country?
b What is the average family size in this country?
13.5 Random number tablesTo extend the number of applications which can be simulated, a more flexible method of
generating data is needed. In practice this is often done by using random number tables, which
can be adapted to almost any situation. Random number tables consist of the digits 0 to 9 and
are constructed so that each of the digits is equally likely to appear in any position in the table.
You could generate your own random number tables by drawing balls numbered 0 to 9 from a
bag, replacing each ball every time so that the probability is unchanged for each draw.
An examination of a set of random number tables shows that they consist of a list of digits
with no apparent pattern or order. They are usually in blocks of five digits with spaces between
every fifth row to allow ease of movement around the table.
To use the tables select a starting point at random, by dropping a pencil on the tables for
instance, and then proceed around the table in a specific direction. This direction can be
vertical, horizontal, diagonal or whatever is chosen, but the method of movement must be
consistent during the particular simulation session.
Page 22
P1: FXS/ABE P2: FXS
0521609984c13.xml CUAT019-EVANS October 26, 2005 17:47
364 Essential Mathematical Methods 1 & 2 CAS
Random number table
8 6 5 4 1 7 6 1 7 3 7 5 2 0 4 8 6 9 8 5
5 5 7 8 5 3 7 6 5 2 3 9 7 4 3 4 8 6 9 9
7 2 9 2 4 2 5 6 8 8 7 6 7 1 7 9 0 4 9 4
6 0 1 6 5 3 4 6 6 8 0 4 9 1 5 2 2 2 5 6
8 8 3 6 2 7 3 9 7 4 8 8 7 1 5 6 1 9 7 3
9 9 5 4 3 7 7 5 6 0 6 3 1 9 1 9 3 7 6 7
1 1 4 5 5 5 0 1 9 3 7 8 2 5 0 5 7 9 1 9
7 5 6 3 2 3 3 7 1 6 2 3 5 4 8 2 8 7 1 7
9 9 7 7 2 3 5 6 9 9 6 9 7 6 0 0 8 9 2 5
5 5 1 6 6 3 5 4 6 8 4 4 0 9 4 9 7 7 4 5
7 0 0 4 1 9 2 5 7 3 3 9 5 8 2 9 4 7 2 1
0 9 7 9 3 2 7 7 3 4 0 2 0 3 9 4 7 9 4 0
9 3 2 0 8 5 1 4 6 1 4 2 9 1 3 0 1 2 2 9
8 7 8 6 1 9 5 0 5 3 9 9 6 3 1 0 6 8 5 1
8 8 7 5 8 6 5 5 0 4 8 2 8 5 9 9 9 3 5 0
3 8 0 0 7 1 3 0 4 5 0 4 3 3 7 1 3 5 9 6
5 8 5 9 8 5 0 0 6 4 5 6 5 7 9 2 2 2 4 6
2 1 9 0 3 1 3 8 7 1 2 9 7 3 2 7 4 3 8 2
9 0 9 2 5 6 5 0 5 0 0 1 8 6 4 3 5 7 5 8
0 4 5 7 3 6 5 6 7 8 5 0 0 3 5 4 5 4 0 9
2 1 5 0 9 0 3 1 3 9 5 1 7 6 5 6 4 8 1 1
2 9 5 6 8 1 9 6 3 7 9 3 4 0 6 3 6 4 5 5
2 4 8 0 3 3 7 2 5 9 0 6 5 7 8 7 9 3 4 8
3 6 8 7 4 3 8 8 8 3 5 6 7 6 0 5 1 5 4 8
6 5 5 4 0 7 1 4 3 6 9 5 9 9 9 9 2 9 3 2
8 2 9 3 7 6 4 2 9 8 1 8 1 3 4 0 9 2 2 7
3 1 5 8 6 7 0 3 2 2 1 6 6 3 4 6 1 7 9 7
9 4 7 0 8 7 2 9 0 0 6 4 7 9 8 1 1 7 4 5
5 7 6 2 4 4 8 8 7 0 8 1 3 9 4 5 4 2 9 5
6 9 1 3 2 4 4 5 0 9 7 5 6 8 4 5 2 3 1 2
6 0 2 8 4 0 6 3 9 4 4 3 7 7 8 1 7 1 1 9
6 6 0 4 0 2 1 4 1 1 7 5 3 5 7 6 6 6 8 8
1 1 4 5 0 1 9 6 5 2 2 3 5 4 9 0 5 4 1 9
1 8 2 7 1 8 5 3 8 1 8 9 1 1 7 5 9 0 2 6
4 9 9 0 9 0 2 9 3 4 1 8 2 1 7 5 4 8 6 3
2 7 0 8 4 9 4 7 6 1 0 2 2 0 2 9 2 9 1 9
3 5 9 3 8 4 6 7 9 1 1 7 3 8 7 7 9 7 3 8
1 2 6 9 4 3 5 6 2 9 4 9 7 7 0 0 2 5 0 7
3 1 7 9 6 2 8 5 2 9 8 0 5 8 9 3 3 8 8 5
3 0 9 9 4 8 1 9 1 8 2 4 3 1 1 9 2 0 3 6
Page 23
P1: FXS/ABE P2: FXS
0521609984c13.xml CUAT019-EVANS October 26, 2005 17:47
Chapter 13 — Discrete Probability Distributions and Simulation 365
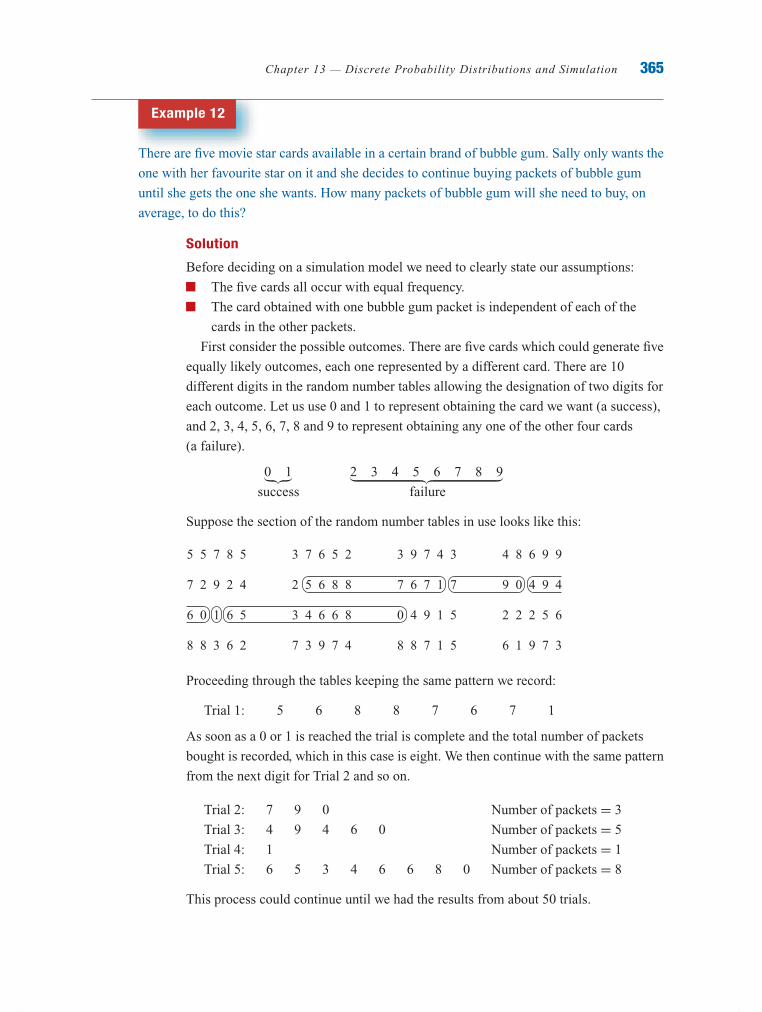
Example 12
There are five movie star cards available in a certain brand of bubble gum. Sally only wants the
one with her favourite star on it and she decides to continue buying packets of bubble gum
until she gets the one she wants. How many packets of bubble gum will she need to buy, on
average, to do this?
Solution
Before deciding on a simulation model we need to clearly state our assumptions:
The five cards all occur with equal frequency.
The card obtained with one bubble gum packet is independent of each of the
cards in the other packets.
First consider the possible outcomes. There are five cards which could generate five
equally likely outcomes, each one represented by a different card. There are 10
different digits in the random number tables allowing the designation of two digits for
each outcome. Let us use 0 and 1 to represent obtaining the card we want (a success),
and 2, 3, 4, 5, 6, 7, 8 and 9 to represent obtaining any one of the other four cards
(a failure).
0 1︸︷︷︸ 2 3 4 5 6 7 8 9︸ ︷︷ ︸success failure
Suppose the section of the random number tables in use looks like this:
5 5 7 8 5
7 2 9 2 4
6 0 1 6 5
8 8 3 6 2
3 7 6 5 2
2 5 6 8 8
3 4 6 6 8
7 3 9 7 4
3 9 7 4 3
7 6 7 1 7
0 4 9 1 5
8 8 7 1 5
4 8 6 9 9
9 0 4 9 4
2 2 2 5 6
6 1 9 7 3
Proceeding through the tables keeping the same pattern we record:
Trial 1: 5 6 8 8 7 6 7 1
As soon as a 0 or 1 is reached the trial is complete and the total number of packets
bought is recorded, which in this case is eight. We then continue with the same pattern
from the next digit for Trial 2 and so on.
Trial 2: 7 9 0 Number of packets = 3
Trial 3: 4 9 4 6 0 Number of packets = 5
Trial 4: 1 Number of packets = 1
Trial 5: 6 5 3 4 6 6 8 0 Number of packets = 8
This process could continue until we had the results from about 50 trials.
Page 24
P1: FXS/ABE P2: FXS
0521609984c13.xml CUAT019-EVANS October 26, 2005 17:47
366 Essential Mathematical Methods 1 & 2 CAS
A possible set of results might look like this:
8 3 5 1 8 3 4 2 5 2
4 7 2 9 2 3 6 4 4 6
4 5 12 10 1 2 12 2 3 1
5 5 6 1 2 3 4 2 1 6
4 1 2 5 2 1 4 3 4 16
From these simulation results it can be estimated that, on average, Sally would need to
buy about 4.3 packets of bubble gum in order to obtain the card she wants.
Random number tables may be used in many situations. If we wish to consider a problem
involving a probability of success of 0.4, we can use the digits 0,1, 2 and 3 to indicate success,
and 4, 5, 6, 7, 8 and 9 to indicate failure. If the probability is 0.36 we can use pairs of digits
from the tables, where 00−35 indicates success, and 36−99 failure, and so on.
Exercise 13E
1 How would you use random number tables to simulate the outcomes of each spinner?Example 12
1 2
34
1
2
1
2165°
a b
2 Use simulation to estimate the number of pizzas we would need to buy if the number of
Batman souvenirs described in Example 11 was extended to 10.
3 Use the information contained in Example 12 and simulation to estimate the number of
bubble gum packets Sally would need to buy if:
a she wishes to collect two cards in the set (that is, two different cards)
b she wishes to have two copies of her favourite card (that is, two of the same card).
4 A teacher gives the class a test consisting of 10 multiple-choice questions, each with five
alternatives. Use simulation to estimate the probability of a student who guesses the answer
to every question getting at least seven correct. Use your knowledge of the binomial
distribution to find an exact answer to this question.
5 An infectious disease has a one-day infection period and after that the person is immune.
Six people live on an otherwise deserted island. One person catches the disease and
randomly visits one other person for help during the infectious period. The second person
is infected and visits another person at random during the next day (their infection period).
The process continues, with one visit per day, until an infectious person visits an immune
person and the disease dies out.
a Use simulation to estimate the average number of people who will be infected before
the disease dies out.
b Use random number tables to extend this problem to different size populations.
Page 25
P1: FXS/ABE P2: FXS
0521609984c13.xml CUAT019-EVANS October 26, 2005 17:47
Review
Chapter 13 — Discrete Probability Distributions and Simulation 367
Chapter summary
A discrete random variable X is one which can assume only a countable number of values.
Often these values are whole numbers, but not necessarily.
The probability distribution of X, p(x) = Pr(X = x) is a function that assigns probabilities
to each value of X. It can be represented by a formula, a table or a graph, and must give a
probability p(x) for every value that X can take.
For any discrete probability function the following must be true:
a The minimum value of p(x) is zero, and the maximum value is 1, for every value
of X. That is, 0 ≤ p(x) ≤ 1 for all x.
b The sum of all values of p(x) must be exactly 1.
The binomial distribution arises when counting the number of successes in a sample
chosen from an infinite population, or from a finite population with replacement. In either
case, the probability, p, of a success on a single trial remains constant for all trials. If the
experiment consists of a number, n, of identical trials, and the random variable of interest,
X, is the number of successes in n trials, then:
Pr(X = x) =(n
x
)(p)x (1 − p)n−x , x = 0, 1, . . . , n
where(n
x
)= n!
x!(n − x)!
Simulation is a simple and legitimate method for finding solutions to problems when an
exact solution is difficult, or impossible, to find.
In order to use simulation to solve a problem a clear statement of the problem and the
underlying assumptions must be made.
A model must be selected to generate outcomes for a simulation. Possible choices for
physical simulation models are coins, dice and spinners. Random number tables,
calculators and computers may also be used.
Each trial should be defined and repeated several times (at least 50).
The results from all the trials should be recorded and summarised appropriately to provide
an answer to a problem.
Multiple-choice questions
1 Consider the following table which represents the probability distribution of the variable X.
x 0 1 2 3 4
Pr(X = x) k 2k 3k 2k k
For the table to represent a probability function, the value of k is
A1
10B
1
9C
1
5D
1
7E
1
8
Page 26
P1: FXS/ABE P2: FXS
0521609984c13.xml CUAT019-EVANS October 26, 2005 17:47
Rev
iew
368 Essential Mathematical Methods 1 & 2 CAS
2 Suppose that the random variable X has the probability distribution given in the table:
x 1 2 3 4 5 6
Pr(X = x) 0.05 0.23 0.18 0.33 0.14 0.10
Then Pr(X ≥ 5) is equal to
A 0.24 B 0.10 C 0.90 D 0.76 E 0.14
3 Suppose that there are two apples and three oranges in a bag. A piece of fruit is drawn from
the bag. If the fruit is an apple, it is not replaced and a second piece of fruit is drawn and the
process is repeated until an orange is chosen. If X is the number of pieces of fruit drawn
before an orange is chosen then the possible values for X are
A {0} B {0, 1} C {0, 1, 2} D {0, 1, 2, 3} E {1, 2, 3}4 Which one of the following random variables has a binomial distribution?
A the number of tails observed when a fair coin is tossed 10 times
B the number of times a player rolls a die before a 6 is observed
C the number of SMS messages a students sends in a day
D the number of people at the AFL Grand Final
E the number of accidents which occur per day at a busy intersection
5 Suppose that X is the number of male children born into a family. If the distribution of X is
binomial, with probability of success of 0.48, the probability that a family with six children
will have exactly three male children is
A 0.48 × 3 B (0.48)3 C (0.48)6 D 6C3(0.48)3 E 6C3(0.48)3(0.52)3
6 The probability that a student will be left-handed is known to be 0.23. If nine students are
selected at random for the softball team then the probability that at least one of these
students is left-handed is given by
A (0.23)9 B 9C1(0.23)1(0.77)8 C 1 – 9C0(0.23)0(0.77)9
D 1 – 9C0(0.23)0(0.77)9 – 9C1(0.23)1(0.77)8 E (0.23)9 + 9C1(0.23)1(0.77)8
7 Which one of the following graphs best represents the shape of a binomial probability
distribution of the random variable X with 10 independent trials and probability of
success 0.2?
A B
D E
C
Page 27
P1: FXS/ABE P2: FXS
0521609984c13.xml CUAT019-EVANS October 26, 2005 17:47
Review
Chapter 13 — Discrete Probability Distributions and Simulation 369
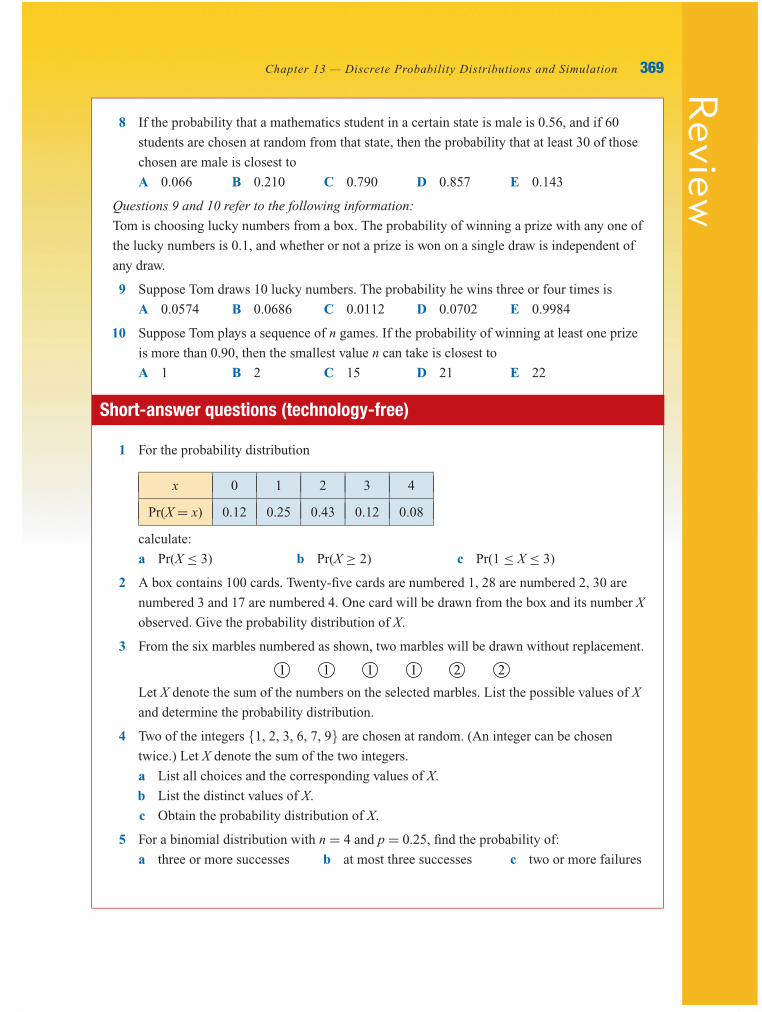
8 If the probability that a mathematics student in a certain state is male is 0.56, and if 60
students are chosen at random from that state, then the probability that at least 30 of those
chosen are male is closest to
A 0.066 B 0.210 C 0.790 D 0.857 E 0.143
Questions 9 and 10 refer to the following information:
Tom is choosing lucky numbers from a box. The probability of winning a prize with any one of
the lucky numbers is 0.1, and whether or not a prize is won on a single draw is independent of
any draw.
9 Suppose Tom draws 10 lucky numbers. The probability he wins three or four times is
A 0.0574 B 0.0686 C 0.0112 D 0.0702 E 0.9984
10 Suppose Tom plays a sequence of n games. If the probability of winning at least one prize
is more than 0.90, then the smallest value n can take is closest to
A 1 B 2 C 15 D 21 E 22
Short-answer questions (technology-free)
1 For the probability distribution
x 0 1 2 3 4
Pr(X = x) 0.12 0.25 0.43 0.12 0.08
calculate:
a Pr(X ≤ 3) b Pr(X ≥ 2) c Pr(1 ≤ X ≤ 3)
2 A box contains 100 cards. Twenty-five cards are numbered 1, 28 are numbered 2, 30 are
numbered 3 and 17 are numbered 4. One card will be drawn from the box and its number X
observed. Give the probability distribution of X.
3 From the six marbles numbered as shown, two marbles will be drawn without replacement.
1 1 1 221
Let X denote the sum of the numbers on the selected marbles. List the possible values of X
and determine the probability distribution.
4 Two of the integers {1, 2, 3, 6, 7, 9} are chosen at random. (An integer can be chosen
twice.) Let X denote the sum of the two integers.
a List all choices and the corresponding values of X.
b List the distinct values of X.
c Obtain the probability distribution of X.
5 For a binomial distribution with n = 4 and p = 0.25, find the probability of:
a three or more successes b at most three successes c two or more failures
Page 28
P1: FXS/ABE P2: FXS
0521609984c13.xml CUAT019-EVANS October 26, 2005 17:47
Rev
iew
370 Essential Mathematical Methods 1 & 2 CAS
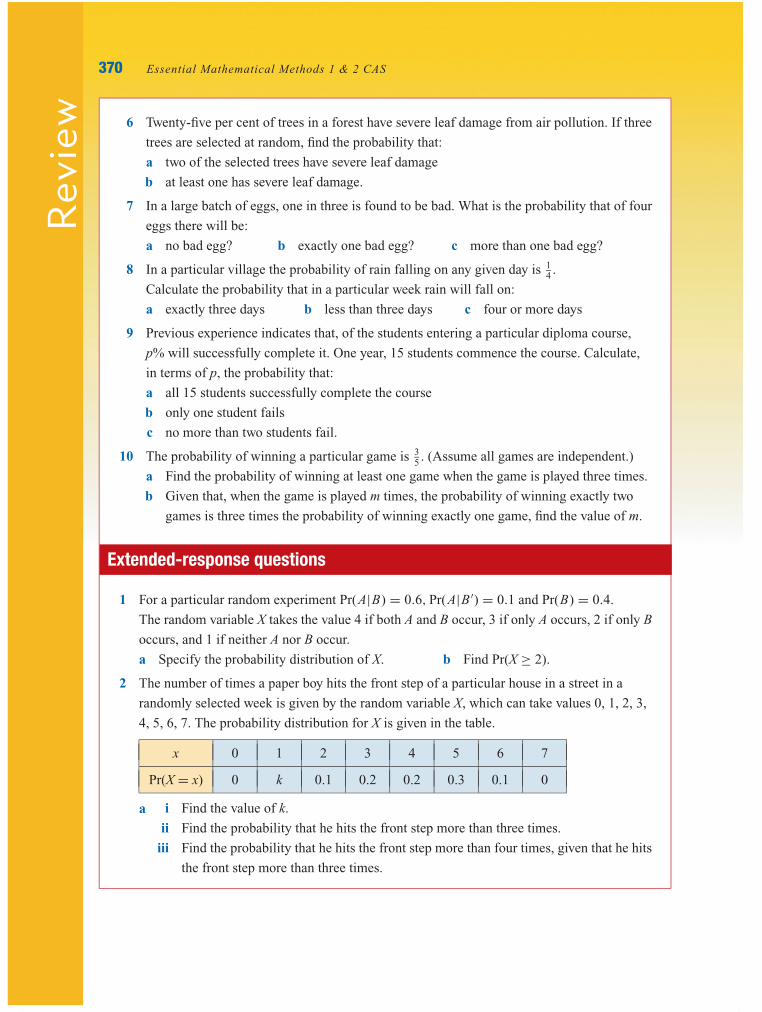
6 Twenty-five per cent of trees in a forest have severe leaf damage from air pollution. If three
trees are selected at random, find the probability that:
a two of the selected trees have severe leaf damage
b at least one has severe leaf damage.
7 In a large batch of eggs, one in three is found to be bad. What is the probability that of four
eggs there will be:
a no bad egg? b exactly one bad egg? c more than one bad egg?
8 In a particular village the probability of rain falling on any given day is 14 .
Calculate the probability that in a particular week rain will fall on:
a exactly three days b less than three days c four or more days
9 Previous experience indicates that, of the students entering a particular diploma course,
p% will successfully complete it. One year, 15 students commence the course. Calculate,
in terms of p, the probability that:
a all 15 students successfully complete the course
b only one student fails
c no more than two students fail.
10 The probability of winning a particular game is 35 . (Assume all games are independent.)
a Find the probability of winning at least one game when the game is played three times.
b Given that, when the game is played m times, the probability of winning exactly two
games is three times the probability of winning exactly one game, find the value of m.
Extended-response questions
1 For a particular random experiment Pr(A|B) = 0.6, Pr(A|B ′) = 0.1 and Pr(B) = 0.4.
The random variable X takes the value 4 if both A and B occur, 3 if only A occurs, 2 if only B
occurs, and 1 if neither A nor B occur.
a Specify the probability distribution of X. b Find Pr(X ≥ 2).
2 The number of times a paper boy hits the front step of a particular house in a street in a
randomly selected week is given by the random variable X, which can take values 0, 1, 2, 3,
4, 5, 6, 7. The probability distribution for X is given in the table.
x 0 1 2 3 4 5 6 7
Pr(X = x) 0 k 0.1 0.2 0.2 0.3 0.1 0
a i Find the value of k.
ii Find the probability that he hits the front step more than three times.
iii Find the probability that he hits the front step more than four times, given that he hits
the front step more than three times.
Page 29
P1: FXS/ABE P2: FXS
0521609984c13.xml CUAT019-EVANS October 26, 2005 17:47
Review
Chapter 13 — Discrete Probability Distributions and Simulation 371
b It is found that there are 10 houses on the round for which the paper boy’s accuracy is
given exactly by the distribution above. Therefore the probability of hitting the front
step of any one of these 10 houses three or four times a week is 0.4.
i Find the probability (correct to 4 decimal places) that out of the 10 houses he hits
the front step of exactly four particular houses three or four times a week.
ii Find the probability (correct to 4 decimal places) that out of 10 houses he hits the
front step any four houses three or four times a week.
3 A bag contains three blue cards and two white cards that are identical in all respects except
colour. Two cards are drawn at random and without replacement from the bag.
a Find the probability that the two cards are of different colour.
If the cards are of a different colour, two fair coins are tossed and the number of heads
recorded. If the cards are of the same colour, the two fair coins are each tossed twice and
the number of heads recorded.
Let X be the number of heads recorded.
b Find:
i Pr(X = 0) ii Pr(X = 2)
The events A and B are defined as follows:
A occurs if the two cards drawn are of the same colour, B occurs if X ≥ 2.
c Find:
i Pr(A ∪ B) ii Pr(B|A)
4 An examination consists of 20 multiple-choice questions. Each question has five possible
answers. At least 10 correct answers are required to pass the examination. Suppose the
student guesses the answer to each question.
a Use your CAS calculator to determine the probability that the student passes.
b Given that the student has passed, what is the probability that they scored at least 80%
on the test?
5 Jolanta is playing a game of chance. She is told that the probability of winning at least once
in every five games is 0.99968. Assuming that the probability of winning each game is
constant, what is her probability of winning in any one game?
6 A five-letter ‘word’ is formed by selecting letters from the word BINOMIAL. Each letter is
replaced after selection so that it may be chosen more than once. Find the probability that
the ‘word’ contains at least one vowel.
7 Suppose that a telephone salesperson has a probability of 0.05 of making a sale on any
phone call.
a What is the probability that they will make at least one sale in the next 10 calls?
b How many calls should the salesperson make in order to ensure that the probability of
making at least one sale is more than 90%?
Page 30
P1: FXS/ABE P2: FXS
0521609984c13.xml CUAT019-EVANS October 26, 2005 17:47
Rev
iew
372 Essential Mathematical Methods 1 & 2 CAS
8 Suppose that, in flight, aeroplane engines fail with probability q, independently of each
other, and a plane will complete the flight successfully if at least half of its engines do
not fail.
a Find, in terms of q, the probability that a two-engine plane completes the flight
successfully.
b Find, in terms of q, the probability that a four-engine plane completes the flight
successfully.
c For what values of q is a two-engine plane to be preferred to a four-engine one?
9 Use simulation to estimate the probability that in a group of 10 people at least two of them
will have their birthday in the same month. (Assume that each month is equally likely for
any person.)
10 In general 45% of people have type O blood. Assuming that donors arrive independently
and randomly at the blood bank, use simulation to answer the following questions.
a If 10 donors came in one day, what is the probability of at least four having type O
blood?
b On a certain day, the blood bank needs four donors with type O blood. How many
donors, on average, should they have to see in order to obtain exactly four with type O
blood?
11 Sixteen players are entered in a tennis tournament. Use simulation to estimate how many
matches a player will play, on average:
a if the player has a 50% chance of winning each match
b if the player has a 70% chance of winning each match.
12 Consider a finals series of games in which the top four teams play off as follows:
Game 1: Team A vs Team B
Game 2: Team C vs Team D
Game 3: Winner of game 2 plays loser of game 1
Game 4: Winner of game 3 plays winner of game 1
The winner of game 4 is then the winner of the series.
a Assuming all four teams are equally likely to win any game, use simulation to model
the series.
b Use the results of the simulation to estimate the probability that each of the four teams
wins the series.