Centre for Research and Analysis of Migration Department of Economics, University College London Drayton House, 30 Gordon Street, London WC1H 0AX Discussion Paper Series CDP No 03/08 The Effect of Immigration along the Distribution of Wages Christian Dustmann, Tommaso Frattini and Ian Preston
Transcript
Centre for Research and Analysis of Migration Department of Economics, University College London Drayton House, 30 Gordon Street, London WC1H 0AX
Discussion Paper Series
CDP No 03/08
The Effect of Immigration along the
Distribution of Wages
Christian Dustmann, Tommaso Frattini and Ian Preston
Centre for Research and Analysis of Migration Department of Economics, Drayton House, 30 Gordon Street, London WC1H 0AX
The Effect of Immigration along the Distribution of
Wages
Christian Dustmann, Tommaso Frattini, and Ian Preston
Centre for Research and Analysis of Migration, Department of Economics, University College London
Non-Technical Abstract
This paper analyses the effect immigration has on wages of native workers.
Unlike most previous work, we estimate wage effects along the distribution of
wages. We derive a flexible empirical strategy that does not rely on pre-allocating
immigrants to particular skill groups. In our empirical analysis, we demonstrate that
immigrants downgrade considerably upon arrival. As for the effects on native wages,
we find that immigration depresses wages below the 20th percentile of the wage
distribution, but leads to slight wage increases in the upper part of the wage
distribution. The overall wage effect of immigration is slightly positive. The positive
wage effects we find are, although modest, too large to be explained by an
immigration surplus. We suggest alternative explanations, based on the idea that
immigrants are paid less than the value of what they contribute to production,
generating therefore a surplus, and we assess the magnitude of these effects.
1
The Effect of Immigration along the Distribution of
Wages1
Christian Dustmann, Tommaso Frattini, and Ian Preston
Department of Economics
and
Centre for Research and Analysis of Migration (CReAM)
University College London
Abstract: This paper analyses the effect immigration has on wages of
native workers. Unlike most previous work, we estimate wage effects along the
distribution of wages. We derive a flexible empirical strategy that does not rely on
pre-allocating immigrants to particular skill groups. In our empirical analysis, we
demonstrate that immigrants downgrade considerably upon arrival. As for the
effects on native wages, we find that immigration depresses wages below the 20th
percentile of the wage distribution, but leads to slight wage increases in the upper
part of the wage distribution. The overall wage effect of immigration is slightly
positive. The positive wage effects we find are, although modest, too large to be
explained by an immigration surplus. We suggest alternative explanations, based
on the idea that immigrants are paid less than the value of what they contribute to
production, generating therefore a surplus, and we assess the magnitude of these
effects.
1 We are grateful to the Low Pay Commission and the ESRC (grant RES-000-23-0332) for
funding this research. We are also grateful to George Borjas, David Card, Andrew Chesher and
Simon Lee for helpful comments and discussions.
2
1. Introduction
This paper analyses the effect of immigration on the wages of native born
workers. Our analysis is for the UK, which experienced an increase of its foreign
born population equal to three percent of the native population over the period
between 1997 and 2005. We focus on the effect of immigration on wages of
native born workers along the native wage distribution. Importantly, the estimator
we develop does not rely on pre-allocation of immigrants to skill categories. Our
estimation strategy is motivated by two observations. First, we believe that the
distributional effect of immigration on wages is a matter of considerable policy
interest. Secondly, we believe that estimation of relative wage effects across skill
groups is problematic, at least in the case of the UK, as immigrants considerably
downgrade after arrival, and pre-allocation to skill groups may therefore lead to
considerable misclassification error.
Our paper adds to the current literature on immigration in various ways.
First, we propose a simple estimation method that allows assessing the effect
immigration has on native workers at each point in the native wage distribution,
without pre-assigning immigrants to particular skill groups. Secondly, we provide
a clear theory-based interpretation to the estimated parameter, and show that it is
exactly proportional to the density of immigrants along the native wage
distribution. Our analysis gives a fresh interpretation to the latest work by
Manacorda, Manning and Wadsworth (2006) for the UK, suggesting that the
incomplete substitutability of immigrants and natives within age and education
cells they find is much related to a substantial downgrading of immigrants on
arrival.2 Finally, we address the overall positive wage effect that we find, and we
propose, and assess, alternative explanations for these.
We commence with a general theoretical discussion. First, we note that the
common notion that immigration depresses average wages of native workers is
2 See Ottaviano and Peri (2005, 2006) for a similar argument for the US, and Borjas, Grogger and
Hanson (2008) for a critical re-assessment.
3
based on a simple one industry model, where capital is fixed.3 We develop a
model with not just two, but many skill types and capital as factors of production.
We show that, whenever the immigrant skill composition differs from that of the
native labour force, and if capital is elastic in supply, the effect on average wages
of native workers should be zero or even slightly positive. This result is
unsurprising as it is based on a simple surplus argument, but has, in our view, not
received sufficient attention in the literature on the effects of immigration, where
capital supply is usually assumed as being fixed, so that the surplus goes mainly
to capital owners.
Although the overall wage effect of immigration may therefore be close to
zero, the effects of immigration should be differently felt along the wage
distribution, possibly depressing wages of workers who are in segments of the
labour market where the density of immigrants is higher than that of native
workers. This calls for an empirical approach that investigates the impact of
immigration along the wage distribution. Earlier papers do distinguish between
wage effects on skilled and unskilled workers (see e.g. Altonji and Card 1991,
Borjas 2003, Card 2001, Dustmann et al. 2005, Friedberg 2001 and Jaeger 2007a),
and/or analyse the effect of immigration on relative wages (see e.g. Card 2005,
2007, Card and Lewis 2007, Manacorda et al. 2006, Ottaviano and Peri 2006,
Glitz 2006). These approaches require pre-allocation of immigrants to skill
groups, based on their observable characteristics.4 We demonstrate for the case of
the UK that immigrants downgrade upon arrival, and that pre-allocation of
immigrants according to their measured skills would place them at different
locations across the native wage distribution than where we actually find them.
This is particularly problematic when estimation is based on differences between
time periods defined as years rather than decades, as only recent arrivals will
affect estimates.
We suggest a strategy that circumvents this problem. Based on our
theoretical framework, where we allow for many different skill types, we derive
an estimable model where we allocate immigrants to skill groups according to
3 See Ottaviano and Peri (2006) and Lewis (2005) for a similar critical assessment of this
assumption. 4 Card (2008) defines skill groups according to the quartile of the wage distribution where a
worker would be predicted to be located. This is similar in spirit to our approach.
4
their observed position in the native wage distribution rather than pre-allocating
them to skill groups according to their observed characteristics. We then estimate
wage effects of immigration across the distribution of native wages. With our
approach no ex-ante restriction is imposed on where immigrants compete with
natives.
Our empirical investigation first demonstrates that immigrants to the UK
over the period we consider are on average much better educated than natives. But
while perfect substitutability of immigrants with natives within measured age-skill
groups would imply that immigrants are located at the upper and middle part of
the wage distribution, their observed location after arrival is at the lower end of
this distribution. Our estimated wage effects along the wage distribution are
strikingly in line with the location of immigrants: while immigration depresses
wages below the 20th
percentile, it contributes to wage growth above the 20th
percentile.
We also find that the average effects of immigration on wages are
positive. Although this is in principle possible within a model where capital
supply is elastic, simulations of our model, based on the actual distribution of
immigrants across the wage distribution, suggest that the average wage effects we
find, although relatively modest, are too large to be explained by a surplus
argument. In the last section of the paper, we discuss a number of possible
mechanisms that may explain our estimates. The underlying idea of all
explanations is that immigrants are paid less than the value of what they
contribute to production, generating therefore a surplus. We then assess
empirically the magnitude of this surplus for our data.
The structure of the paper is as follows. In the next section we explain our
theoretical framework, and discuss our estimation strategy. In section 3 we
present the datasets we use in the analysis and describe the main features of the
immigrant population. Section 4 presents the results. Section 5 discusses
mechanisms of surplus generation and presents some simulations and section 6
concludes.
5
2. Theoretical and Empirical Framework
We commence by setting out the overall theoretical and empirical
framework on which our analysis is based. Our model is based on standard
economic theory, where as a starting point an equilibrium is considered where all
workers are fully employed. The most general model would not restrict the
number of industries that may produce different products, and allow for any
number of labour input types, as well as allowing for any number of capital inputs
into production. We develop such a model in Appendix A.1.
Here we elaborate a simplified version of this model, where we allow only
for one output and make the assumption that production follows a nested CES
technology. We analyse the model under different assumptions about the elasticity
of capital supply. We then develop the empirical implications of the model.
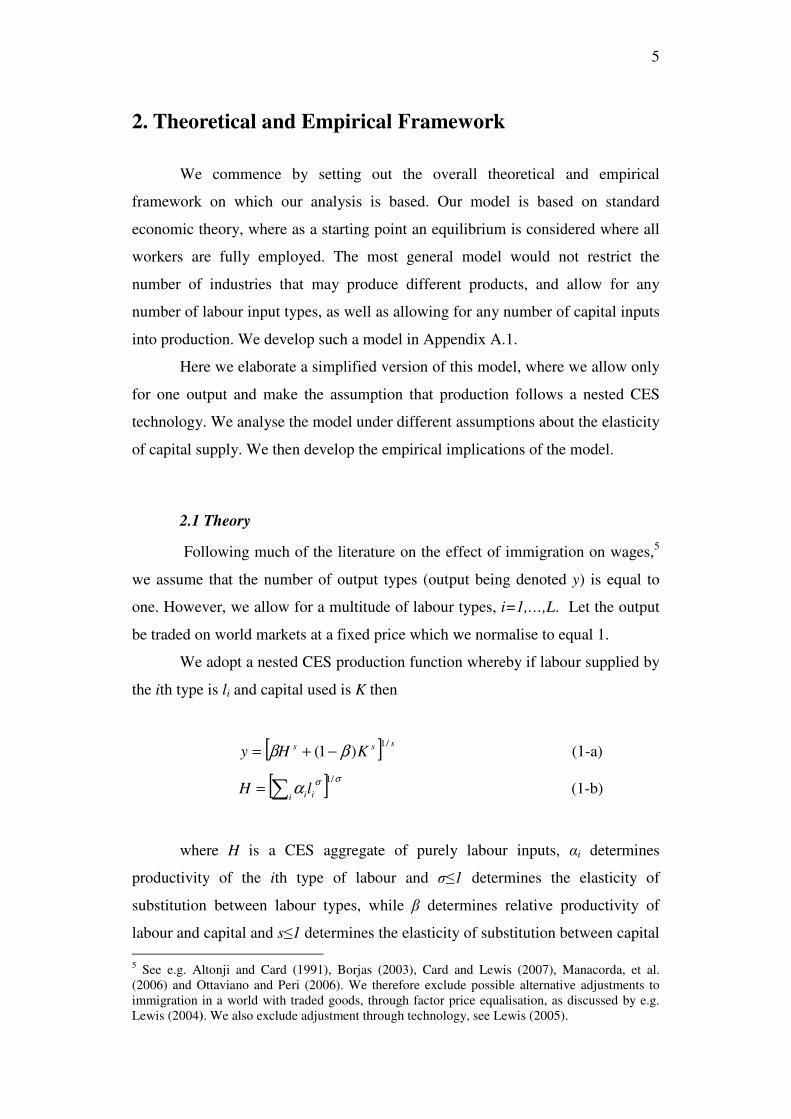
2.1 Theory
Following much of the literature on the effect of immigration on wages,5
we assume that the number of output types (output being denoted y) is equal to
one. However, we allow for a multitude of labour types, i=1,…,L. Let the output
be traded on world markets at a fixed price which we normalise to equal 1.
We adopt a nested CES production function whereby if labour supplied by
the ith type is li and capital used is K then
[ ] sss KHy/1
)1( ββ −+= (1-a)
[ ] σσα
/1
∑=i iilH (1-b)
where H is a CES aggregate of purely labour inputs, αi determines
productivity of the ith type of labour and σ≤1 determines the elasticity of
substitution between labour types, while β determines relative productivity of
labour and capital and s≤1 determines the elasticity of substitution between capital
5 See e.g. Altonji and Card (1991), Borjas (2003), Card and Lewis (2007), Manacorda, et al.
(2006) and Ottaviano and Peri (2006). We therefore exclude possible alternative adjustments to
immigration in a world with traded goods, through factor price equalisation, as discussed by e.g.
Lewis (2004). We also exclude adjustment through technology, see Lewis (2005).
6
and labour. We assume without loss of generality, a numbering of labour types
such that αi> αj for i>j.
Firms can employ either native labour 0
il or immigrant labour 1
il of each
type i. We assume that native and immigrant labour of the same type are both
perfect substitutes and equally productive: .10
iii lll += 6 For the markets for each
labour type to clear7, li=ni for all i, where ni is the supply of labour of the ith type.
The labour supply is made up of natives 0
in and immigrants 1
in , 0 1
i i in n n= + , so
that )( 10mNn iii ππ += where 0
iiN n=∑ is total native labour supply,
0 0 /i i
n Nπ = is the fraction of native labour of the ith type, 1 1 1/i i jj
n nπ = ∑ is the
fraction of immigrant labour of the ith type and 1 /jj
m n N=∑ is the ratio of the
immigrant to native labour force. First order conditions for cost-minimising input
choice imply that the real wage of the ith type of labour, wi, equals the marginal
product of labour. Similarly, the price of capital, ρ, equals the marginal product of
capital. Deriving the first order conditions and taking logs results in equilibrium
input prices of all labour types:
( )0 1
ln ln
ln ( 1) ln( ) 1 ln
11 ln (1 )
i
i
i i i
s
yw
l
Hm
N
K
s H
βα σ π π σ
β β
∂=
∂
= + − + + −
+ − + −
(2-a)
where ( )∑ +=
j jjj m
N
H σππασ
)(ln1
ln 10 and
6 Note that we do not identify labour types with education-age cells; thus, we do not make the
assumption criticised by Ottaviano and Peri (2006) and Manacorda et al. (2006) that immigrants
and natives are perfect substitutes in a given education-age cell. 7 We assume the existence of an equilibrium in which wages wi are ordered across types similarly
to productivity αi. It is possible that if low skilled types were in sufficiently short supply the
wages required to equate their supply and demand would exceed wages of the highly skilled. If
the highly skilled are able to do low skilled jobs then clearly this would not be an equilibrium.
Strictly, the appropriate equilibrium condition would require that for each skill type the demand
for those with skills no lower than that type should be no less than the supply of those with skills
no lower than that type. We assume away this complexity.
7
−+
−+
−+−=
∂
∂=
s
H
K
sH
Ks
K
y
)1(ln11
ln)1()1ln(
lnln
βββ
ρ
(2-b)
Let us suppose an elasticity of supply of capital given by ρ
θln
ln
∂
∂=
K.8 Then the
equilibrium change in native log wages as a reaction to changes in the immigrant-
native ratio is shown in Appendix A.2 to be given by:
( )11
0 0
0
ln1
ji ij
m i j
d w
dm
ππσ φ ω
π π=
= − −
∑ (3)
where ∑
=
j jj
ii
i σ
σ
πα
παω
)(
)(0
0
is the contribution of the ith type to the labour
aggregate Hσ,
ss
s
KH
H
)1( ββ
βψ
−+= is the contribution of labour to the overall
CES aggregate ys and
(1 )(1 ) 11
1 (1 ) 1
s
s
ψφ
θ ψ σ
− −= + + − −
is a parameter depending on
capital mobility θ, capital-labour substitutability s and the labour share ψ. The
pattern of the effects of immigration along the native wage distribution therefore
depends upon the relative density of immigrants and natives0
1
i
i
π
π along that
distribution.
Consider firstly the case 1φ = , which arises if capital is perfectly mobile
(θ=∞), capital and labour are perfectly substitutable (s=1) or the capital share is
zero (ψ=1). Since 1=∑i
iω , the expression in parenthesis in (3) is the difference
at that point in the distribution between the relative density of immigrants and
natives and a weighted average of these relative densities across the entire skill
distribution. The wage of any skill type is decreased by immigration if and only if
the intensity of immigration at that point in the distribution of types exceeds an
8 All discussion below covers the full range for possible values for θ , and is therefore compatible
with Ottaviano and Peri’s (2006) observation to allow for mobility of capital.
8
appropriately weighted average of immigration intensity across the whole
distribution. If the distribution of skill types in the immigrant inflow exactly
matches that in the native labour force, πi0= πi
1 for all i, then the effect on wages
is everywhere zero.
If capital is used, imperfectly mobile and imperfectly substitutable with
labour then 1φ < and even immigration which matches the native labour force in
composition will result in wage losses. However the pattern of wage effects along
the distribution will still be driven in just the same way by the relative density of
immigrants and natives0
1
i
i
π
π.
The first order effect of immigration on mean native wages 0
i iiwπ∑ , also
derived in Appendix A.2 is
0 10
0
0
( 1)(1 ) 0.i i i
i
im
d ww
dm
π πσ φ ω
π=
= − − ≤∑ ∑ (4)
where 0w is mean native wage before immigration. The first order effect
is negative unless φ =1 or σ=1. Native labour on average is harmed by
immigration, though obviously some labour types may gain if the composition of
immigrant and native labour differ.
However if capital is perfectly mobile so that φ =1 then the first order
effect is zero. Capital inflows follow the inflow of labour to keep marginal
product of capital constant, immigrant labour is paid the value of its marginal
product and there is no change at the margin in payments to native labour.
Turning for this case to second order effects, we obtain (as shown in Appendix
A.2)
222 1 1
0 0
2 0 0
0
(1 ) 0i i ii i i
i im
d ww
dm
π ππ σ ω ω
π π=
= − − ≥
∑ ∑ ∑
9
so that second order effects on the mean native wage are positive if the
immigrant inflow differs at all from native labour in its mix of skill types. Note
that the last term in parentheses is a weighted variance: it is larger the larger the
disparity between the immigrant and native skill distribution and disappears only
if 10
ii ππ = for all i. For small levels of immigration we should therefore expect to
find mean native wages rising if capital is perfectly mobile. Indeed, there can be a
positive surplus for labour if capital is fairly mobile and immigrant labour
sufficiently different to native labour, as we show quantitatively in section 6. This
is the conventional “immigration surplus” argument establishing that immigration
is beneficial to native factors – immigrating labour is paid less than the value of
what it adds to production and the surplus must be returned to native factors if
profits are zero9.
That does not, of course, mean that in this case wages increase throughout
the native skill distribution. Wages fall at any point in the distribution at which
0
1
i
i
π
π exceeds the weighted average
1
0
ii
i
πω
π∑ . In particular it will be those who
compete with immigrants who will suffer wage losses10
.
2.2 Empirical Specification
We turn now to empirical implementation of the CES model as outlined
above. Take the factor return equations in (2-a)-(2-b), combine with a capital
supply equation and let ρ0 be the equilibrium return to capital at m=0.
Taking a first order Taylor expansion of (2-a) around m=0 using the earlier
expression ( )11
0 0
0
ln1
ji ij
m i j
d w
dm
ππσ φ ω
π π=
= − −
∑ we obtain an approximate
expression for the wage of the ith type:
9 Appendix A.1 establishes that these qualitative observations apply in a much more general model
with many outputs and many perfectly mobile capital inputs, assuming only constant returns to
scale. 10
For example, any native subgroup of identical composition to immigrants must lose as shown in
Appendix: A.2 2 21 1 1
0
0 0
0
( 1) 0.i i i i
i i
i im
d ww
dm
π π πσ ω φ ω
π π=
= − − ≤
∑ ∑ ∑
10
( )
( )
0 0
0
11
0 0
1ln ln ( 1) ln ln ( ) ( )
1
i i i j jj
jij
i j
w G
m
σσβα σ π α π ρ
σ
ππσ φ ω
π π
−≈ + − + +
+ − −
∑
∑ (5)
where
/(1 )
1 1 1( ) ln ln
1 1
s s
sG
s
ρ ρ βρ
β β β β
− − −= + −
− − .
Our data come from different regions at different points in time and our
empirical approach is based on using variation in immigrant inflows across
different regions in the UK. We therefore observe a distribution of native and
immigrant wages in different regions at different points in time. We choose to
identify different skill types i with different locations in the observed distribution
of native wages. In other words, if Wprt denotes the pth percentile of the native
wage distribution in region r at time t then, in terms of the earlier theory, we
identify this with wi where i is the smallest value such that ∑≤
≥ij
j p1000π .
Accordingly, we adopt a model
lnprt pr pt p rt p rt prt
W a b c X mγ ε≈ + + + + (6)
where at each point in the distribution p we include region and time effects,
ptpr ba + . The former capture the role of technological parameters given the initial
skill distribution and capital price in the region, whereas the latter capture the
influence of changes in national capital prices on the chosen capital-labour ratio.
Controls for changing age and skill composition of the native labour force are
included in Xrt. The coefficient on the region-specific immigrant-native ratio is
then the key parameter of interest: ( )11
0 01
jip j
i j
ππγ σ φ ω
π π
= − −
∑ . Constancy of
this across regions reflects an assumption that immigrant skill composition relates
11
similarly to native skill composition in different regions and periods11
. Finally εprt
is a random error term.
3. Background, Data and Descriptives
3.1 Migration to the UK
In 2001, the last census year, 4.8m immigrants lived in the UK, which
amounts to 8.47 percent of the total population. Over 3.5m of them were of
working age (16-65), so that they counted for 9.75 percent of the working age
population. Since then, Britain has experienced a further increase in its foreign
born population, and the share of foreign born in the total working age population
in 2005 was 11.5%. The share of foreign born population in the UK is thus similar
to the corresponding share in the US, which was 11.9% in 200412
. Until the late
1990s almost one third of the foreign born population in the UK used to be from
Western European countries, one fifth from the Indian Sub-continent, and less
than 2 percent from Eastern Europe. Since the late 1990s migration from Eastern
Europe has intensified, and Eastern Europeans constitute now over 5% of the total
foreign born population, while Western Europeans are less than one fourth and
immigrants from the Indian Sub-Continent are still about 20%.
3.2 The Data
The main dataset we use for our analysis is the UK Labour Force Survey
(LFS) over the period from 1997 till 2005. The LFS, established in 1973, is a
sample survey of households living at private addresses in Great Britain,
conducted by the Office for National Statistics (ONS). We restrict our analysis to
Great Britain, and omit Northern Ireland. Since 1992, the LFS has been a rotating
11
It seems reasonable to assume that capital is perfectly mobile between regions (but not
necessarily internationally). In that case the capital price would be the same in all regions and any
influence of immigration on national capital price would be absorbed fully in the time effects. In
such a case it would make sense to identify ( )0 01( 1) ln( ) ln ( )pr i j ja σσσ π α π
σ
−= − + ∑ and
0ln ( )pt ib Gβα ρ= + and to have ( )11
0 01
ji
p j
i j
ππγ σ ω
π π
= − −
∑ .
12 Source: US Census Bureau – Current Population Survey.
12
quarterly panel. Each sampled address is interviewed for 5 consecutive times at 3
monthly intervals. The sample size is about 55,000 responding households in
Great Britain every quarter, representing about 0.2% of the population.
The LFS collects information on respondents' personal circumstances and
their labour market status during a reference period of one to four weeks
immediately prior to the interview. From the 1992 -1993 winter quarter onwards
the LFS contains information on gross weekly wages and on number of hours
worked. Initially this information was asked only in the final wave, but from the
1997 spring quarter onwards questions on wages were asked during the first and
the fifth interview.
Spatial information is available at regional level, where region is
determined according to usual residence. The LFS originally identifies 20
regions13
. We unify Inner and Outer London into Greater London, and Strathclyde
and the Rest of Scotland into Scotland, to create territorially homogeneous
regions, and limit our analysis to Great Britain, dropping Northern Ireland. We
have therefore 17 regions, and the usual average sample size for the period we
consider is about 19,29714
.
We combine information from the LFS with information from various
years of the UK Population Census. The Census is a decennial survey of all
people and households. The most recent Census was in 2001. Although providing
information on age, education, and employment status, the UK Census has no
information on wages. Moreover comparability across Census years is not always
possible, as variable classifications change quite often. This is for instance the
case for occupation and education between the 1991 and 2001 Census. In our
analysis below, we use information from the 1991 and 1981 Census to construct
variables for immigrants’ geographical distribution.
13
Tyne & Wear, Rest of Northern Region, South Yorkshire, West Yorkshire, Rest of Yorkshire &
Humberside, East Midlands, East Anglia, Inner London, Outer London, Rest of South East, South
West, West Midlands (Metropolitan counties), Rest of West Midlands, Greater Manchester,
Merseyside, Rest of North West, Wales, Strathclyde, Rest of Scotland, Northern Ireland. 14
The average population size in a region is 2,163,121.
13
3.3 Descriptive Evidence
In 1971, the percentage of foreign born individuals on the total population
in Great Britain was 5.9%, or 3 million individuals. Over the next decades this
number increased to 6.3% (1981), 6.8% (1991) and 8.47% (2001). Between 1989
and 1997, the foreign born working age (16-65) population on the total working
age population increased by only 0.7 percentage points. In contrast, between 1997
and 2005 the percentage of the foreign born in the working age population
increased by almost 3 percentage points. This is the period we consider for our
analysis, and we concentrate on the working age population only.
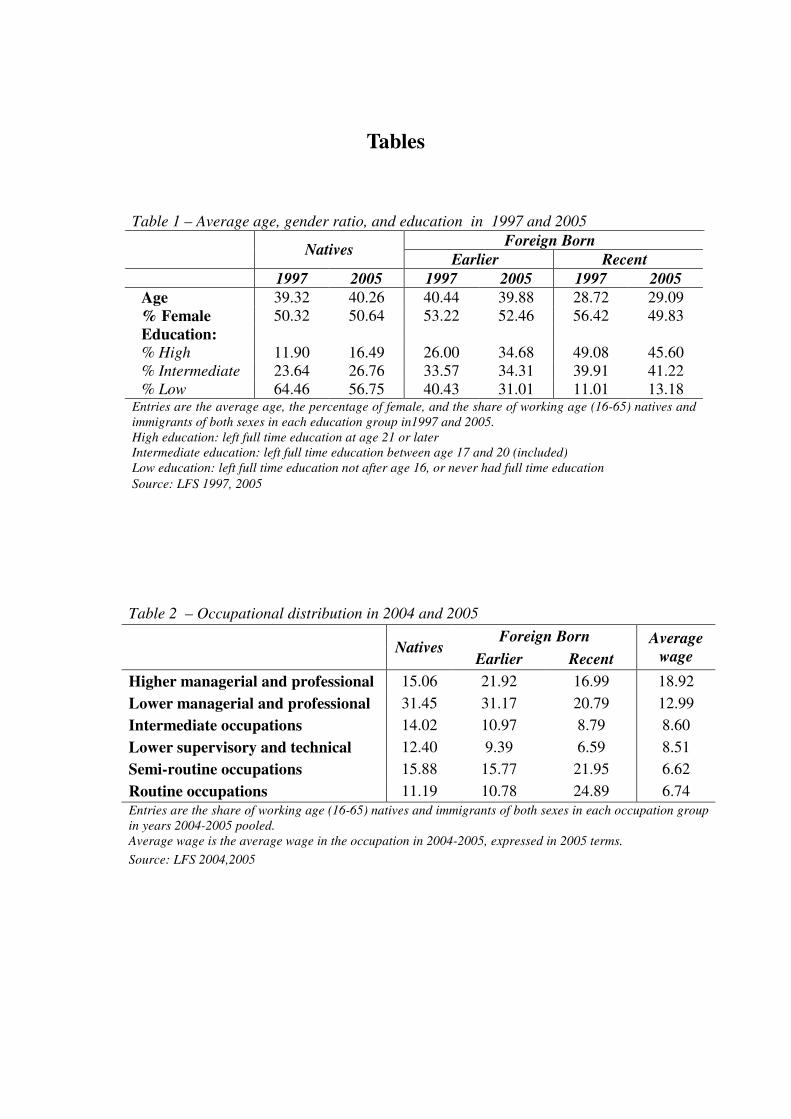
Table 1 reports some characteristics of the native born and foreign born
population in Britain, where among the foreign born we distinguish between
earlier and more recent immigrants. We define as “earlier immigrants” all foreign
born who have been in the UK two years or more at the time of interview; we
define as “recent immigrants” all immigrants who arrived in the UK over the last
two years. This distinction is important as our empirical analysis is based on
variation in the stock of immigrants between two subsequent years; this variation
is driven by recent arrivals.
[Table 1 here]
In Table 1, we report average age and educational attainments for 1997
and 2005, the first and the last year of our observation period. Natives and earlier
immigrants are very similar in their average age (around 40) while new
immigrants are about 10 years younger. The percentage of females on the other
hand is roughly similar, with a slight drop for more recent immigrants between
1997 and 2005.
The lower panel of the table reports educational attainment of the different
groups. We base our measures on information about the age at which the
individual left full time education15
, and we classify individuals in three groups:
15
The LFS has two alternative measures for educational achievements, age at which individuals
left full time education, and “highest qualification achieved”. The problem with the latter measure
14
low (left full time education before the age of 17), intermediate (left full time
education between 17 and 20), and high (left full time education after age 20). For
natives and earlier immigrants, the table shows an improvement in educational
attainment between 1997 and 2005. However, earlier immigrants are better
educated than natives in both years, with a higher percentage in the highest
category, and lower percentages in the lowest category. Nearly one in two of new
arrivals is in the highest educational category, and slightly more than one in 10 in
the lowest category. The educational attainment of new arrivals have roughly
remained constant over the period considered.
Recent immigrants may not be able to make use of their educational
background to its full potential, as they may lack complementary skills like
language, or they may have to start searching for their best job match (see
Eckstein and Weiss 2004). In Table 2 we display the occupational distribution of
immigrants in 2004 and 2005, where we distinguish between 6 occupational
categories using the National Statistics Socio-economic Classification (NS-SEC).
We exclude employers and the self-employed because we do not have information
on their wages. The last column shows the average wage by occupation in the
years considered, expressed in 2005 prices16
.
[Table 2 here]
The occupational distribution of those who have been in the country for at
least 2 years is similar to the native born, except for the higher immigrant
concentration in the highest paid category, and the slightly higher concentration of
natives in the two intermediate categories. However, recent immigrants, i.e. those
who arrived within 2 years of the interview, although being better educated than
the overall immigrant population (see table 1), tend to be in lower occupation
categories, with the partial exception of higher managerial and professional
occupations: 47% are in the lowest three occupational groups, compared with
27% of natives and of earlier immigrants. This suggests that new arrivals, unable
to put their human capital into immediate use, start lower down the occupational
is that it is defined on the British education system and classifies all foreign classifications as
“other qualification” (see the discussion in the appendix of Manacorda et al. (2006)). 16
We discount wages using the 2005-based CPI.
15
distribution, and compete with native workers much further down the distribution.
This finding mirrors results for Israel on considerable downgrading of new
immigrants - see the work by Eckstein and Weiss (2004).
In table 3 we break down the occupational distribution by educational
attainment, using the same grouping. The figures show that within each education
group, recent immigrants are distributed more towards the lower end of the
occupational distribution. For instance, while among highly skilled natives, only
5% work in the lowest two occupational categories, this is the case for 11% of
earlier immigrants, but 26% of recent immigrants. The respective numbers for the
intermediate education category are 19%, 29% and 63%. Again, this suggests
considerable downgrading of recent immigrants within educational categories.
[Table 3 here]
In our empirical analysis, we will associate the changes in wages across
different spatial units with the changes in the stock of immigrants. Our theoretical
model above suggests that the immigrant population will exert pressure on wages
of natives at those parts of the distribution where the relative density of
immigrants is higher than that of the weighted relative density of natives.
Where we actually find immigrants in the native wage distribution can be
straightforwardly estimated from the data: in each year, and for each immigrant,
we can calculate the proportion of natives with a lower wage. In figure 1, we
display the distribution17
of immigrants along the wage distribution of native
workers, where again we distinguish between immigrants who have been in the
country for less than 2 years, and immigrants who have been in the country for
less than 6 years.
[Figure 1 here]
17
These are kernel density estimates. Given that the variable in question is bounded, by
construction, between 0 and 1, conventional kernel estimation with fixed window width would
give misleading estimates at the extremes. The kernel estimates are therefore calculated on the log
of the odds of the position in the non-immigrant distribution and appropriately transformed.
16
The dashed line shows the density of recent immigrants along the wage
distribution of natives. Contrary from what we should expect based on
information on their educational background, the density of recent immigrants is
higher than that of natives everywhere below the 25th
percentile of the wage
distribution. On the other hand, it is lower between the 25th
percentile and the 90th
percentile, and higher again afterwards. The dotted line shows the distribution for
immigrants who have been in the country for less than 6 years. The overall pattern
is still similar, but it is apparent that some “upgrading” has taken place, with less
mass below the 25th
percentile. Based on these figures, we should expect therefore
that immigrants put a pressure on wages below the 25th
percentile of the native
wage distribution.
Where would we find immigrants along the native wage distribution if we
had allocated them according to their observed age and education distribution?
We illustrate that in Figure 2. Figure 2 is obtained by estimating a flexible log
wage regression for natives, where we condition on five age categories and four
educational categories, as well as interactions between the two18
. We estimate that
equation separately for males and females. If immigrants and natives are perfect
substitutes within age and education categories, then immigrants should be
located in the native wage distribution according to their predicted wages. We
predict wages for all recent immigrants, where we add an error term to the
prediction which is drawn from a normal distribution, with heteroscedastic
variance according to age, education and gender. We then draw the density of
immigrants across the native wage distribution.
[Figure 2 here]
The difference between figure 1 and 2 is striking. In figure 2, immigrants
are strongly present at the very low end of the wage distribution; however, above
the 7th
percentile, their density is much lower than that of native workers. On the
other hand, the density becomes increasingly larger above the 60th
percentile.
18
Our regressors include five age categories (16/25, 26/35, 36/45, 46/55, 56/65), four educational
categories, based on age at which individuals left full time education (before 16, 16/18, 19/20,
after 20), interaction between the two, a dummy for London residents, and quarter dummies. We
fit separate models for men and women and for different years.
17
Based on this figure, we would expect immigrants to exert a pressure on wages at
the bottom of the native wage distribution, and above the median. The figure
shows clearly that it may be misleading to pre-allocate recent immigrants across
the native skill distribution based on their observable characteristics.
4. Estimation
4.1 Implementation and Identification
In our empirical analysis, we estimate the effects of immigration along the
distribution of wages. Our starting point is the empirical model that derives
directly from our theoretical framework, as in (6). The parameter we estimate in
that model is a combination of the elasticity of substitution between skill groups,
and the relative density of immigrants at the particular part of the native wage
distribution. As we explain above, the relative size of the parameter should
directly correspond to the density of immigrants, as we have illustrated in Figure
1.
The way we implement that model is to regress differences over time in
percentiles of log wages across different regions in the UK on changes in the
fraction of immigrants to natives rtm∆ , time dummies tβ , and changes in the
average age of immigrant and native workers in the region as well as the ratio of
high (intermediate) to low educated native workers, prtc∆ :
prtrtpprttprt mcW εγβ ∆+∆+∆+=∆ ln (7)
It is important to note that our approach does not depend in any way on
pre-assignment of immigrants to particular skill cells. For estimation, we use
variation across spatial units r and across time. This approach may potentially
lead to an overly optimistic picture of immigration on native outcomes if natives
leave labour markets that experienced in-migration. However, if this occurs, it is
likely to be less relevant in our case, as the large regional definitions we use in our
analysis make it more likely that any movements will be internalised (see Borjas
18
et al. 1997 for a similar argument). We nevertheless check this by using an
extension of the methodology in Card (2001), adapted to our quantile approach,
and find no evidence for native responses to immigration19
(details are available
on request). In addition, we condition on native skill group proportions, which
should take account of changes in the native skill group over time. Of course,
there are obvious concerns about whether such proportions ought themselves to be
regarded as endogenous in such a setting and there are less obvious instruments to
deal with the issue.
A further problem is the endogenous allocation of immigrants into
particular regional labour markets. One solution is to use instrumental variables
estimation. We follow the literature and use settlement pattern of previous
immigrants as instruments. This instrument has been used in various studies in
this literature, following Altonji and Card (1991), and is motivated by a number of
studies (see for instance Bartel 1989, Jaeger 2007b, Munshi 2003) showing that
settlement patterns of previous immigrants are a main determinant of immigrants’
location choices.20
When estimating equation (7) we use years 1997-2005, and we
compute the ratio of immigrants to natives for each year in each of the 17 regions.
Estimation in differences eliminates region specific permanent effects that are
correlated with immigrant settlement patterns and economic conditions alike. We
instrument the change in this ratio using two alternative but closely related
instruments: the 1991 ratio of immigrants to natives for each of these regions,
from the Census of Population, and four period lags of the ratio of immigrants to
natives in each region from the LFS. Both instrumental variables are strongly
correlated to the ratio of immigrants to natives. The first stage regression of the
change in the immigrant-native ratio on the 1991 ratio and time dummies gives a
coefficient of 0.068 with a t-statistic of 9.5121
, while the partial 2R of excluded
instruments is 0.29, and the F-test for their significance is 90.47. A regression of
the endogenous variable on the fourth lag of the immigrants-natives ratio and on
time dummies gives a coefficient of 0.043, with a t-statistic of 12.22, while the
19
Absence of counterbalancing native outflows is also detected by Card and DiNardo (2000), Card
(2001) and Cortes (2006) among others. Borjas et al. (1997) on the other hand do find significant
displacement effects of immigrants on resident natives. 20
See among others Card (2001), Card and Lewis (2007), Cortes (2006), Cortes and Tessada
(2008), Lewis (2005), Ottaviano and Peri (2006, 2007) and Saiz (2007) for a similar strategy. 21
Standard errors are clustered by region.
19
partial 2R of excluded instruments is 0.3 and the F-test for their significance is
149.27. The instruments are valid under the assumption that economic shocks are
not too persistent. We report in table 4 the results of Arellano-Bond tests for first
and second order serial correlation in the residuals of regressions for all the
dependent variables we consider. Absence of second order serial correlation
cannot be rejected for all variables except for the median wage and the 75th
percentile.
[Table 4 here]
In addition we perform several robustness checks, using instruments that
are based on settlement patterns further aback. We use further lags of the ratio of
immigrants to natives (going back to the 14th lag) and the 1981 immigrant-native
ratio. We also construct a series of instruments based on the predicted inflow of
immigrants in each region, along the lines of Card (2001). We take account of the
area of origin of immigrants and design a variable which predicts the total
immigrant inflow in each region in every year, net of contemporary demand
shocks. In order to do so we divide immigrants into 15 areas of origin22
and
calculate the number of immigrants from each area who entered the UK in every
year. We then allocate every group of immigrants across regions according to the
location of previous immigrants from the same area23
. Results obtained with these
alternative instrumental variables are very similar to those obtained with the
instruments described above, which we report in the tables (see Table A1 for
estimation results for average wages. Results along the distribution are available
on request).
22
Irish Republic, Old Commonwealth, Eastern Africa (New Commonwealth, NC), Other Africa
(NC), Caribbean (NC), Bangladesh, India, Pakistan, South East Asia (NC), Cyprus, Other New
Commonwealth, European Community (1992 members), Other Europe, China, Rest of the World.
23 If we define ctM as the number of new immigrants from area c in year t, and
c
cici M
M=λ
as the fraction of immigrants from area c in region i in a base period, then ctci Mλ is the predicted
number of new immigrants from area c in region i in year t. As base periods, we experiment with
different years: 1981, 1985, and 1991, using data from the LFS and for 1991 from the Census.
Finally, we sum over all origin groups to obtain a predicted total immigrant inflow into region i
which is “cleansed” of local demand shocks : ∑c ctci Mλ . Finally, we divide this predicted
inflow by the number of natives in the region at time t-2, to normalize by region size.
20
4.2 Measurement
As we explained in section 3.2 the LFS is a nationally representative
survey, and since the immigrant population accounted for less than 10% of the
total population for most of the years we consider (and much less so in some
regions), the number of observations for immigrants may be quite small.
Therefore measures of regional immigrant concentration may suffer from
measurement error due to small sample size. As we estimate our equations in first
differences, this may amplify the impact of measurement error, resulting in a
possibly severe downward bias. Instrumental variable estimation accounts for the
measurement error problem as long as the measurement error in the instrumental
variable is uncorrelated with the measurement error in the variable of interest.
Aydemir and Borjas (2006) argue that, if the instrument of choice is some lagged
measure of the immigrant share, and measurement error is correlated over time,
the instruments may not be valid. In our case this is not a concern because we use
a minimum of four lags as instrument, therefore avoiding any correlation in the
measurement error of the endogenous variable and the instrument even in first
differences. Alternatively we use as an instrument the immigrant concentration
from the Census, whose measurement error is independent from that in the LFS.
We use four different measures for average wages to test the robustness of
our results. First we use the simple average regional wage. Second, we compute a
robust regional average by trimming in every region and year the wage
distribution of natives at the region- and year- specific 1st and 99
th percentile. This
measure reduces the impact of outliers on our averages by considering only
central observations in the wage distribution. Third, we calculate a wage index
constructed as the weighted sum of the average wages in each education group,
defined as above in terms of years of education (see discussion in section 3.3).
The educational composition of the native population is kept constant by choosing
as weights the share of each education group in the native population in a base
year (which we choose to be 1998)24
. By holding constant the skill composition
24
The wage index is constructed for each region as follows. First we calculate etw , the average
wage for education group e=1,2,3 in time t=1997,…,2005. Then we calculate the time-invariant
21
of the assessed population, this measure is isolated from compositional issues
associated with changing native skills. The theoretical results of earlier sections
show that wage changes could raise average wages in the native population (if
capital is perfectly elastic) holding skill composition fixed and this measure
comes closest to capturing that. Finally, we use a robust version of this index
based on wages in the trimmed sample. The robust index is constructed using
robust average wages for each education group, where the average wages by
education group are computed on the same trimmed sample as explained above.
In table A2 in the Appendix we report means and standard deviations of all
the variables we use, and in table A3 we show the year specific means and
standard deviations of the change in the immigrant-native ratio.
5. Results
5.1 Effects along the wage distribution
We now turn to our analysis of immigration on wages of native workers.
We commence by estimating the effect of immigration along the distribution of
wages. In table 5, we report results for the 5th
, 10th
, 25th
, 50th
, 75th
, 90th
, and 95th
percentile of the wage distribution. Columns 1 and 2 present OLS results and
columns 3, 4, and 5, 6 present IV results, using alternative instruments. Reported
results are based on difference estimations. Columns 2, 4, and 6 control, in
addition to time effects, for average natives’ and immigrants’ age, and the
logarithm of the ratio of natives in each education group to natives with no
qualifications. Estimation is based on yearly data for the years 1997-2005 and for
17 regions.
[Table 5 here]
The regression results show a sizeable negative impact of immigration on
the lower wage quantiles. According to IV estimates in column 4, which use the
weights 98981998 NN ee =π , the proportion of natives in education group e in 1998. Finally, we
define the index ∑= = 3,2,1 98e etet wI π
22
1991 settlement patterns of immigrants drawn from the Census as instrument and
include all controls, the impact of an inflow of immigrants of the size of 1% of the
native population would lead to a 0.6% decrease in the 5th
wage percentile and a
0.4% decrease in the 10th
wage percentile. On the other hand, it would lead to an
almost 0.7% increase in the median wage and a 0.5% increase in the 90th
percentile. Estimates using the fourth lag of the ratio of immigrants to natives (see
columns 5 and 6) give the same picture, but with slightly smaller coefficients.
Both IV estimates indicate a strong positive impact of immigration around the
median wage, but a negative effect at the bottom of the wage distribution.
According to these estimates, immigration seems to put downward pressure on the
lower part of the wage distribution, but increases wages at the upper part of the
distribution.
We note that the OLS estimates are smaller in absolute magnitude than the
IV estimates. This is not what we should expect if immigrants allocate in regions
which experienced positive economic shocks. However, as we point out above,
instrumentation removes also measurement error, which leads to a bias towards
zero in the estimated parameters.25 Our results suggest that the measurement error
bias is larger in magnitude than the selection bias.26
In terms of magnitude, our estimates in column 6 of table 5 suggest that
each 1 percent increase in the immigrant/native working age population ratio led
over the period studied to a 0.5 percent decrease in wages at the 1st decile, a 0.6
percent increase in wages at the median, and a 0.4 percent increase in wages at the
9th
decile. The average increase in the immigrant/native working age population
ratio over the period considered was about 0.35% per year, whereas the real
hourly wage increased over the period by 18p (4.28%) per year at the 1st decile,
by 25p (3.25%) per year at the median, and by 53p (3.18%) per year at the 9th
decile (in 2005 terms). Therefore immigration held wages back by 0.7p per hour
25
Aydemir and Borjas (2006) show that the measurement error induced attenuation bias becomes
exponentially worse as the sample size used to calculate the immigrant concentration declines, and
that adjusting for attenuation bias can easily double or triple the estimated wage impact of
immigration. 26
It is worthwhile to note that the standard errors of the IV estimator are smaller than the standard
errors of the OLS estimator in differences. The reason is that standard errors are calculated on the
assumption of lack of serial correlation in the residuals of the levels equation so that the
differenced equation is assumed to have residuals with a specific pattern of first order serial
correlation. OLS is not efficient given such serial correlation, even under exogeneity of the
regressors, and IV may accordingly give lower standard errors.
23
at the 10th
percentile, contributed about 1.5p per hour to wage growth at the
median and slightly more than 2p per hour at the 90th
percentile.
To obtain a more detailed picture, we have estimated the model at a finer
grid of wage percentiles. In figure 3 we plot the estimated coefficients of
regressions from the 5th
to the 95th
percentile, in intervals of 5 percentage points
for the IV regressions, using the specification in column 6 of the table. The dotted
lines are the 95% confidence interval. The graph shows the negative impact on
low wage percentiles and the positive impact on percentiles further up the wage
distribution.
[Figure 3 here]
The graph of wage effects illustrated in the figure is strikingly similar to
the distribution of immigrants along the native wage distribution, as shown in
Figure 1. The wage effects curve is like a mirror image of the observed
distribution of recent immigrants over the native wage distribution. The
consonance of these two independent pieces of evidence offers strong support for
the pattern of effects as suggested by our theoretical model. Overall, these results
suggest that immigration tends to stretch the wage distribution, particularly below
the median. Our IV coefficients imply that an increase in the immigrant
population by about 1 percent of the native population would increases the 50-10
differential by about 1 percentage point, but there is hardly any effect of
immigration on the wage distribution above the median.
5.3 Immigration and Average Wages
In table 6 we present results on mean regressions from estimating equation
(7), using the different measures for average wages which we discuss above.
Results are consistent across all specifications, and show a positive impact of
immigration on natives’ average wages throughout.
[Table 6 here]
24
The coefficients on the wage index (in the third row), and on the robust
wage index (in the fourth row) capture most closely the mean impact at fixed skill
composition corresponding to our theoretical model (see section 4.3). These
estimates indicate that an increase in the foreign born population of the size of 1%
of the native population leads to an increase of between 0.2% and 0.3% in average
wages. As the average yearly increase in the immigrant/native ratio over our
sample period (1997-2005) was about 0.35%, and the average real wage growth
just over 3 percent, immigration contributed about 3.5-4.5 percent to annual real
wage growth. These estimates are similar in magnitude to those obtained in other
studies finding positive wage effects of immigration, such as Friedberg (2001) and
Ottaviano and Peri (2007).
6. Explaining positive mean wage effects
How can we explain the positive impact of immigration on mean native
wages? One reason, as set out in recent work by Ottaviano and Peri (2006), may
be imperfect substitutability of immigrants and natives within skill groups27
so
that native marginal product can be enhanced by expansion of the immigrant
labour force. We explore here a variety of possible reasons which are not
dissimilar in spirit. Common to each is the idea that immigrants are paid less than
the value of what they contribute to production, generating therefore a surplus.
Exactly who captures this surplus depends upon assumptions made about
production decisions. Under conditions implying zero profits, such a surplus will
result in enhanced payments to pre-existing factors of production. If factors other
than labour, and in particular capital, are supplied sufficiently elastically, because
for example of international mobility, then the surplus will accrue in increased
average wages to native labour.
We first consider the possibility that a surplus arises if immigration takes
the economy down its labour demand curve. We discuss this surplus in section
2.1. We show that such a surplus is second order and may create an increase in
native wages at larger inflows, and if capital supply is elastic. Secondly, we
27
See also D’Amuri, Ottaviano and Peri (2008) and Peri (2007) for a similar argument, and
Borjas, Grogger and Hanson (2008) for a reappraisal of Ottaviano and Peri (2006).
25
explore arguments that rely on immigrant wages falling below marginal products
and imply first order surplus effects. We consider two such possibilities. In the
first of these, in the pre-migration situation, wages paid are different from the
marginal product in local labour markets. This situation could occur if wages are
sticky, for instance through institutions, natives are insufficiently mobile to re-
establish an equilibrium, and immigrants tend to go to areas where the difference
between wage and marginal product is largest. In the second possibility,
immigrants work in jobs appropriate to lower skills and are paid below the value
of their marginal product. We provide strong evidence for downgrading in section
3.3. This will also generate a surplus, which will be captured by native workers.
Below we will explore each of these reasons in detail. Based on our data
and the parameters we have estimated, we then assess through simulation,
whether immigration of the magnitude observed in our data could account for
wage effects of the size found through such a means. We conclude that while it
seems unlikely that any of these arguments alone explain the size of positive
effects, it might be explained through a combination of the different explanations.
.
6.1 Equilibrium immigration surplus
We know from theoretical considerations (see Section 2.1) that positive
effects on native wages are compatible with a standard equilibrium model with
differentiated labour and elastically supplied capital. Immigration generates a
surplus which is paid to inelastically supplied native factors and which will accrue
to labour if other factors are supplied elastically. Such an effect is second order
however – the marginal impact is zero.
Can the positive mean wage effects of the magnitude found in our analysis
be accounted for by equilibrium surplus arguments for the sort of magnitudes of
immigration observe in our data? To investigate this, we simulate our model for
the distribution of immigrants we observe in the data, and establish the overall
effects on wages, for different sets of model parameters. To do this we first need
to augment the equations of Section 2.1 with a capital supply equation. Assuming
a constant elasticity of capital supply θ, the system of equations used for
26
simulation of the effects of immigration consists of equations (3-a), (3-c) and the
capital supply equation ρθ lnlnln += AK .
For simplicity we hold the labour share parameter β constant at 0.5. The
native ability distribution is set at 1=iπ for i=1,…,100 so that simulated wages
are percentiles of the distribution. The ability distribution, αi, is then chosen to
replicate the observed wage distribution at m=0. These parameters are kept
constant across simulations. Parameters varied are the elasticity of supply of
capital, θ, the elasticity of substitution between labour types, 1/(1-σ), and the
elasticity of substitution between capital and labour, 1/(1-s).
We consider firstly an ability distribution for immigrants to match the
estimated wage distribution of immigrants shown in Figure 1. On this basis we
are able to simulate the effect on mean native wages for different extents of
immigration, m, as shown in Table 7 (in the columns headed ‘Observed’). All
entries are percentage changes in mean native wage.
[Table 7 here]
As can be seen, and confirming the observations made above, perfectly
elastic supply of capital (θ=∞) or perfect substitutability of capital and labour
(s=1) leads always to an unambiguously non-negative mean native wage effect as
the immigration surplus accrues exclusively to native labour. In none of these
cases however is the size of this surplus large for immigrant ability distributions
of the sort suggested by the distribution of immigrant wages observed. As we
relax the assumption of elastic capital supply, mean native wage effects become
negative as would be expected. Although immigrants are concentrated at the
extremes of the native wage distribution they do not seem to be so to anything like
the extent necessary to make large positive equilibrium mean wage effects
plausible.
For comparison, we also consider a more extreme case where immigrants
are taken to be concentrated entirely (and therein evenly spread) in the lower half
of the distribution of native abilities. This alternative scenario (in the columns
headed ‘Extreme’) does generate larger effects, showing that the argument for
large equilibrium effects would be sustainable for more extreme configurations of
27
immigrant abilities. It may be, of course, that immigrants do differ from natives
not so much in their distribution across percentiles of the native wage distribution
but across labour types within percentiles and that the divergence between the
native and immigrant ability distributions is therefore more extreme than Figure 1
suggests. This argument is similar to that made by Ottaviano and Peri (2006)
regarding the imperfect substitutability of native and immigrant labour within
observed skill cells. However, it remains difficult to argue that the conventional
equilibrium immigration surplus accounts alone for mean wage effects of the
magnitude estimated.
6.2 Labour market disequilibrium
The above illustration seeks to rationalise the extent to which positive
mean wage effects can occur within an equilibrium framework. The native wage
gains which might occur under the assumption of highly elastic capital supply are
second order, which is inevitable if immigrant labour is paid the value of its
marginal product at the margin. In this section we explore an alternative possible
explanation based on an assumption of disequilibrium in the allocation of native
labour across markets.
The argument is similar to Borjas (2001) who suggests that immigration
may “grease the wheels” of the labour market. The idea is that sluggish
responsiveness of the native labour allocation to economic signals, because of
costs of internal migration between localities or sectors, may create scope for
immigration to realise efficiency gains. If the marginal product of identical labour
differs in different submarkets of the economy then there is scope for reallocation
of labour across submarkets to lead to greater output. If mechanisms exist
whereby inflows of relatively mobile immigrants are attracted towards those
submarkets where labour is more productive (see Jaeger 2007b) then such
inefficiencies can be eliminated. However, provided immigrants are paid the
value of their marginal products (as Borjas assumes), the associated gains are
captured by immigrants rather than flowing to native labour.
Now consider the possibility that wages deviate from the values of
marginal products. This may happen for instance because labour market
28
agreements impose equality of wages across regions or occupations or because
wages are rigid and local demand conditions lead to differences in the
productivity of identical labour. It is quite plausible that this characterises many
pre-migration situations.
More formally, suppose production is F(n,K). We can think in this
context of labour types corresponding not only to different skills but to different
locations and occupations. The difference at the margin between the contribution
of immigration to the value of production and payments made to migrants, per
native worker, is
11 ii i i
i ii i
nF Fw w
N n m nπ
∂∂ ∂− = −
∂ ∂ ∂ ∑ ∑ .
If we allow that the economy is out of equilibrium so that marginal
products and wages can diverge then this expression can be positive. Indeed in
this case it is possible that a simple proportional expansion of native labour could
generate a surplus
0 0,i i
i i
Fw
nπ δ
∂− ≡ ≠
∂ ∑
although if we assume constant returns to scale, capital stocks which adjust
elastically to keep marginal product of capital equal to a constant rate of return
and zero profits28
then 0δ = .
Immigration creates a first order surplus greater than would a comparable
expansion of the native labour force if
11 0
01 0i
i i i i
i ii i i
F Fw w
n n
ππ δ π
π
∂ ∂− − = − − >
∂ ∂ ∑ ∑
28
Given constant returns to scale, Euler’s theorem guarantees
0 0( , )i i i i
i ii
F Fw n F n K K w n
n K
∂ ∂− = − −
∂ ∂ ∑ ∑ which must be zero if capital is paid the
value of its marginal product and profits are zero.
29
so that the covariance, across the native wage distribution, between
disequilibrium wage gaps i
i
Fw
n
∂−
∂ and intensity of immigration
0
1
i
i
π
π is
positive. Hence, assuming 0δ = , immigration would generate a surplus if there
were skill shortages which attracted strong immigrant inflows. This could happen
for example if there were labour market institutions fixing relative wages across
different locations or occupations independently of differences in productivity and
if no mechanism were to exist to direct native labour adequately towards areas or
occupations of high productivity relative to wages.
We can use these observations to put a bound on the magnitude of wage
gaps required before immigration in order for this to rationalise the magnitude of
average wage effects observed. By the Cauchy-Schwarz inequality
2 2 21 1
0 0 0
0 01 1i i
i i i i i
i i ii i i i
F Fw w
n n
π ππ π π
π π
∂ ∂ − − ≤ − −
∂ ∂ ∑ ∑ ∑
and therefore
2
0 1
2
10
1i i i i
i ii i
F Fw w
n nπ π δ
χ
∂ ∂− ≥ − −
∂ ∂ ∑ ∑
where
21
2 0
10 01i
i
i i
πχ π
π
≡ −
∑ is the chi-square divergence between the
distributions of immigrant and native labour. To the extent that we can estimate
2
10χ we can therefore bound the standard deviation of prior wage gaps i
i
Fw
n
∂−
∂
given an estimate of the average wage effect 1
i i
i i
Fw
nπ δ
∂− −
∂ ∑ .
30
If we identify wage types with percentiles of the native wage distribution
then Figure 1 provides estimates of 0
1
i
i
π
π from which an estimate of 2
10χ can indeed
be calculated29
. Any such estimate will be somewhat sensitive to the bandwidth
used in density estimation. If we concentrate on immigrants arriving in the
previous two years then a sensible range of bandwidths suggests values for 2
10χ
around 0.3 which suggests, assuming 0δ = , required wage gaps around 3 times
the estimated average wage effect, which is quite large.
As noted above when discussing the conventional equilibrium surplus, this
may be misleadingly high, however, if the inefficiency in allocation of native
labour is not predominantly across labour types at different percentiles of the
wage distribution but across labour types differing in unobserved ways at similar
points in the wage distribution. The extreme scenario considered in section 6.1,
for comparison, would give the larger value 2
10 1χ = implying wage gaps of smaller
magnitude, similar in size to the estimated wage effect .
6.3 Downgrading
A third possible explanation, and one requiring no divergence between
wages and marginal products in the native population, is simply that wages paid to
immigrants fail to recognise their marginal product, perhaps because of allocation
to jobs inappropriate to their true skills. We observed in Section 3.3 that there is
evidence of considerable downgrading among immigrants, particularly in earlier
years of residence. If, because say of uncertainties or informational difficulties
leading to problems in recognition of qualifications, recent immigrants find
occupation in jobs in which they are more productive than native co-workers but
are nonetheless paid at wage rates equal to natives then it is evident that this also
will generate a first order surplus. Such an effect would be expected to be
29
For each immigrant k of the K in the data let k
f)
denote a consistent estimate of the density of
immigrants at the corresponding point in the native wage distribution, ie01 / ii ππ where
immigrant k is of type i. Then 1
1kk
fK
−∑)
is a consistent estimate of
12 1
10 01i
i
i i
πχ π
π
≡ −
∑ .
31
temporary as the mismatch is alleviated over time as immigrants move to more
suitable jobs.
Let us think of different labour types as corresponding to different
occupations and suppose we allow that native and immigrant labour may no
longer be equally productive so that 0 1
i i
F F
n n
∂ ∂≠
∂ ∂ because, for example, of
employment of immigrant labour in inappropriately low-skilled jobs. Immigrants
and natives are nonetheless paid equal wages in the same occupation determined
by native productivity. Immigration now generates a surplus
0 0
0 0 10
i i i
i i i
i i
F F Fw
n n nπ π
∂ ∂ ∂− = − ≠ ∂ ∂ ∂
∑ ∑ which will, under assumptions of zero
profits, be returned to native factors.
Wages paid to immigrants are observed. The difficulty in estimating the
possible magnitude of any such effect is in estimating immigrants’ true marginal
products 0
i
F
n
∂
∂. To the extent that underpayment may be related to downgrading,
one possible approach would be to compare their wages with those earned by
natives with similar levels of education and age, say i
w% , as estimated by wage
regressions in the native population, calculating the surplus as ( ) 0
i i i
i
w w π−∑ % .
The precise size of potential surplus estimated by such an approach depends on
the precise specification of the native wage regression30
. Our estimates that allow
for heteroscedasticity across individuals give a surplus per immigrant equal to
about 0.137 of the mean native wage. This is an appreciable fraction, between a
third and a half, of the positive effect we are seeking to explain.
30
We run separate native log-wage regressions by gender and year, and include as regressors five
age categories (16/25, 26/35, 36/45, 46/55, 56/65), four educational categories, based on age at
which individuals left full time education (before 16, 16/18, 19/20, after 20), interactions between
the two, a dummy for London residents, and quarter dummies. Based on these estimated
coefficients, we predict for every immigrant the wage of an identical native individual and take the
difference between this and the actual wage. We then add up all the differences and express this as
a share of the total native wage bill. The obtained value is then rescaled by dividing by the ratio of
immigrants to natives in the population.
32
7. Discussion and Conclusions
Upon arrival, immigrants may work in jobs or occupations that do not
correspond to their observed skill distribution. We demonstrate that this
“downgrading” is substantial for the case of the UK, and positions recent
immigrants at different percentiles of the native wage distribution as to where we
would expect them based on their observed skills. Based on a nested CES
framework with a large number of skill groups and capital, we derive an estimator
that determines the effect of immigration along the distribution of native wages.
Our approach is flexible, in the way that it does not necessitate pre-allocation of
immigrants to particular groups, and relies on estimating the impact of
immigration for different percentiles of the native wage distribution.
In our setting, immigration may have differential effects along the native
wage distribution, with some workers gaining, and others losing. In particular,
immigration should lead to wage pressure at those parts of the native wage
distribution where immigrants are relatively more “dense”, and to gains where
immigrants are less “dense”. Where in the distribution of native wages
immigration leads to wage pressure is in our view the interesting research
question. In particular, the estimated effect is a combination of the relative density
of immigrants at the particular point of the distribution of native wages, which
determines the sign of the immigration effect at that part in the distribution, and
structural model parameters.
The results we obtain are remarkably in line with what we should expect
given the actual density of immigrants along the distribution of natives, and what
our simple empirical model suggests. We find that immigration leads to a
decrease in wages at those parts of the distribution where the relative density of
immigrants is higher than the relative density of natives. On the other hand, it
leads to a slight increase in native wages at parts of the distribution where the
opposite is the case. On average over the distribution of natives, we find that
immigration, over the period considered, leads to a slight increase in average
wages.
We then investigate possible reasons for the positive average wage effects
we obtain. We note that even in a simple one industry model, where the only
33
adjustment mechanism to changes in skill mix are wages, average wages need not
to decrease if capital supply is sufficiently elastic. Moreover, with elastic capital
supply and finite immigration, the immigration surplus will be distributed among
native workers, so that the average wage effect may well be positive. Simulating
the magnitude of the surplus reveals however that the wage effects we obtain are
too large to be explained by this surplus.
We suggest two other reasons for a migration surplus. First, in the
presence of wage stickiness, changes in demand conditions may create a situation
where the wage received differs from the marginal product of labour within
particular skill groups. If immigrants tend to allocate to labour markets where this
difference is large, then this may lead to a surplus which may partly go to native
labour. Secondly, if immigrants downgrade (as we demonstrate in our data), and
work for wages which are below their marginal productivity, then this may again
lead to a surplus, where native workers are the beneficiaries. Our simulations
suggest that both explanations may contribute to the overall positive wage effect
we observe.
Our analysis adds a number of important insights to the academic debate
on the impact of immigration. First, we would like to argue that estimates of wage
effects along the distribution of native wages are useful and important parameters,
as it clearly reveals the impact immigration has on workers positioned across the
distribution. These effects may be masked if concentrating on mean effects, or on
effects between skill groups. Further, the approach we suggest has the added
advantage that it does not require any pre-allocation of immigrants to skill groups.
Finally, the parameters have a clear-cut interpretation as they translate the relative
density of immigrants along the native distribution in effect on wages at that part
of the distribution. As we show, the correspondence between these two
independent parts of evidence is remarkable.
The average effects on wages that we find are positive. We do not believe
that positive effects are surprising; they should perhaps be expected if we deviate
from some assumptions that are often made in the literature. First, we note that in
the simplest possible model, negative average wage effects are only to be
expected if capital is a fixed factor – which may well be a too restrictive
assumption, in particular given the openness of small economies like the UK, and
34
when accommodating the relatively small inflows of immigrants that are usually
considered in studies that estimate immigration effects. Secondly, we suggest that
perhaps labour markets are not in perfect equilibrium when immigration occurs. It
seems not unreasonable to think that wage stickiness may lead to wages being
different from marginal productivity of particular skill groups. Further, and
compatible with the substantial downgrading we observe for new immigrant
cohorts in our data, immigrants may well receive wages that are below their
marginal productivity, at least in the first periods after their arrival. This alone
could lead to quite substantial surpluses which may benefit native wages, as our
simulations show.
35
References
Aydemir, Abdurrahman and George J. Borjas (2006), “Attenuation Bias in
Measuring the Wage Impact of Immigration”, Working Paper, Harvard
University, July 2006.
Altonji, Joseph G. and David Card (1991), “The effects of immigration on
the labor market outcomes of less-skilled natives”, in: John M. Abowd and
Richard B. Freeman, (eds.), Immigration, trade and the labor market, University
of Chicago Press, 201–234
Bartel, Ann P. (1989), “Where Do the New United-States Immigrants
Live”, Journal of Labor Economics, 7 (4), 371-391
Borjas, George J. (2001), “Does Immigration Grease the Wheels of the
Labor Market?”, Brookings Papers on Economic Activity, 2001 (1), 69-119
Borjas, George J. (2003), “The Labor Demand Curve Is Downward
Sloping: Reexamining The Impact Of Immigration On The Labor Market”, The
Quarterly Journal of Economics, 118(4), 1335-1374.
Borjas, G. J., Freeman, R.B. and L.F. Katz (1997), “How Much Do
Immigration and Trade Affect Labor Market Outcomes?”, Brookings Papers on
Economic Activity, no. 1, 1-67.
Borjas, G. J., Grogger, J. and G.H. Hanson (2008), “Imperfect Substitution
between Immigrants and Natives: A Reappraisal”, NBER Working Paper
No.13887, National Bureau of Economic Research.
Card, David (2001), “Immigrant Inflows, Native Outflows and the Local
Labor Market Impacts of Immigration”, Journal of Labor Economics, Vol. 19 (1),
22-64.
36
Card, David (2005), “Is the New Immigration Really so Bad?”, Economic
Journal, vol. 115(507), F300-F323.
Card, David (2007), “How Immigration Affects US Cities”, CReAM
Discussion Paper Series, No. 11/07.
Card, David (2008), “Local Labor Market Adaptation to Increased
Immigration”, mimeo, University of Berkeley.
Card, David and John DiNardo, J. (2000) “Do Immigrant Inflows Lead to
Native Outflows?” American Economic Review, Vol. 90 (2), 360-367.
Card, David and Ethan Lewis (2007), “The Diffusion of Mexican
Immigrants during the 1990s: Explanations and Impacts”, in George J. Borjas
(editor), Mexican Immigration, Chicago: University of Chicago Press (for NBER).
Cortes, Patricia (2006), “The Effect of Low-skilled Immigration on U.S.
Prices: Evidence from CPI Data”, Manuscript, University of Chicago, October
2006.
Cortes, Patricia and Jose Tessada (2007), “Cheap Maids and Nannies:
How Low-skilled Immigration is changing the labor supply of High-skilled
American Women”, Manuscript, University of Chicago and MIT, August 2007.
D'Amuri, F., Ottaviano, G.I. and G. Peri (2008), “The Labor Market
Impact of Immigration in Western Germany in the 1990's”, NBER Working Paper
No.13851, National Bureau of Economic Research.
Dustmann, C., Fabbri, F. and I. Preston (2005), “The Impact of
Immigration on the British Labour Market”, Economic Journal, vol. 115(507),
F324-F341.
37
Eckstein, Zvi and Yoram Weiss (2004), “On the Wage Growth of
Immigrants: Israel 1990-2000”, Journal of the European Economic Association,
2(4), 665–695.
Friedberg, Rachel M. (2001), “The Impact of Mass Migration on the
Israeli Labor Market”, The Quarterly Journal of Economics, 116(4), 1373-1408.
Glitz, Albrecht (2006), “The Labour Market Impact of Immigration:
Quasi-Experimental Evidence“, CReAM DP 12/06
Jaeger, David A. (2007a), “Skill Differences and the Effect of Immigrants
on the Wages of Natives”, mimeo, College of William and Mary.
Jaeger, David A. (2007b), “Green Cards and the Location Choices of
Immigrants in the United States, 1971-2000”, Research in Labor Economics, 27,
131-183.
Leamer, Edward E. and James Levinsohn (1995), "International Trade
Theory: The Evidence", in Handbook of International Economics, Volume 3,
edited by G. M. Grossman and K. Rogoff, North Holland Press, 1339-1394.
Lewis, Ethan (2004), “Local Open Economies within the US: How Do
Industries Respond to Immigration”, Federal Reserve Bank of Philadelphia
Working Paper No. 04-1.
Lewis, Ethan (2005), “Immigration, Skill Mix, and the Choice of
Technique”, Federal Reserve Bank of Philadelphia Working Paper 05-08.
Manacorda, M., Manning, A. and J. Wadsworth (2006), “The Impact of
Immigration on the Structure of Male Wages: Theory and Evidence from Britain”,
CReAM Discussion Paper Series, No.08/06.
38
Munshi, Kaivan (2003), “Networks in the Modern Economy: Mexican
Migrants in the US Labor Market”, The Quarterly Journal of Economics, 118(2),
549-599.
Ottaviano, Gianmarco I.P. and Giovanni Peri (2005), “Rethinking the
Gains from Immigration: Theory and Evidence from the U.S”, NBER Working
Paper No. 11672, National Bureau of Economic Research.
Ottaviano, Gianmarco I.P. and Giovanni Peri (2006), “Rethinking the
Effects of Immigration on Wages”, NBER Working Paper No. 12497, National
Bureau of Economic Research.
Ottaviano, Gianmarco I.P. and Giovanni Peri (2007), “The effects of
Immigration on U.S. Wages and Rents: A General Equilibrium Approach”,
CReAM Discussion Paper Series, No 13/07.
Peri, Giovanni (2007), “Immigrants' Complementarities and Native
Wages: Evidence from California”, NBER Working Paper No.12956, National
Bureau of Economic Research,
Saiz, Albert (2003) “Immigration and Housing Rents in American Cities”,
Journal of Urban Economics, Vol.61 (2), 345–371.
39
Appendix A.1: General theory
We start with as general a setting as possible. Suppose the economy
consists of many firms producing many outputs using many inputs. Specifically,
suppose the ith
firm produces outputs yi using capital inputs ki and labour inputs
li, where each of these can be a vector of any length, according to technological
restrictions specifying that the output plan (yi,ki,li) lies in some technology set.
We assume technology obeys constant returns to scale, outputs are sold at fixed
world prices p and capital inputs are elastically supplied at world capital prices r.
Wages are denoted w.
Individual firms maximise profits taking prices as given so that economy-
wide profit p·y-r·k-w·l is maximised at the given prices where y=Σiyi, k=Σiki and
l=Σili. Equilibrium profits of zero are assured by the assumption of constant
returns to scale.
Wages are determined to equate aggregate demand for labour l to
aggregate supply. Before immigration aggregate supply is n0 where n
0 is native
labour and after immigration it is n=n0+n
1 where n
1 is immigrant labour.
Let y0 and k
0 be the equilibrium outputs and capital inputs and w
0 be the
equilibrium wages before immigration and let y and k be the equilibrium outputs
and capital inputs and w be the equilibrium wages after immigration.
By the assumption, given constant returns to scale, that profits are
maximised at zero before and after immigration
0 = p·y0-r·k
0-w
0·n
0 ≥ p·y-r·k-w
0· n (A.2-1)
and
0 = p·y-r·k-w·n ≥ p·y
0-r·k
0-w·
n
0. (A.2-2)
Hence, by subtraction of the rightmost expression in (A.2-2) from the
leftmost expression in (A.2-1)
40
∆w·n0 ≥ 0 (A.2-3)
which is to say the average wage of natives cannot fall. If wages change at
all, average native wages must rise. This is the immigration surplus. It arises
because demand curves for labour cannot slope up and immigrants are therefore
paid no more than the value of their addition to output. Given that profits are
zero, the resulting surplus is returned to existing factors and, given perfectly
elastic supply of capital, payments to existing labour must rise.31
Furthermore, by subtraction of the leftmost expression in (A.2-2) from the
rightmost expression in (A.2-1)
∆w·n≤ 0. (A.2-4)
Note here that if n is proportional to n0, so that immigrant skill
composition is the same as that in the existing population, then (A.2-3) and (A.2-
4) can both be true only if ∆w=0 so there are necessarily no changes to
equilibrium wages (and consequently also no surplus).
This is not the only case in which wage changes are zero. If the number of
output types produced is the same as the number of labour types before and after
immigration then immigration should also lead to no change in equilibrium wages
(see Leamer and Levinsohn 1995).
Further, by subtraction of (A.2-3) from (A.2-4) ,
∆w·n1≤ 0 (A.2-5)
Hence, given n1>0, if wages do change then equilibrium wages must fall
for some types. The inequality in (A.2-5) shows the sense in which these falls
must tend to be greater where immigration is most intense.
31
If capital is less than perfectly elastically supplied then some of the surplus may go to
capital and it can be said only that existing inputs as a whole gain.
41
Appendix A.2: CES Production
Wage determination
Production technology takes the nested CES form
( )
1/
1/0 1
(1 )s
s s
i i ii
y H K
H N mσσ
β β
α π π
= + −
= + ∑ (A.1-1)
Equilibrium values of wages wi and return to capital ρ are given by the
value of the respective marginal products
( )
−+
−+
−++−+=
s
iiiiH
K
sN
Hmw )1(ln1
1ln1)ln()1(lnln 10 ββσππσβα
(A.1-2)
−+
−+
−+−=
s
H
K
sH
Ks )1(ln1
1ln)1()1ln(ln βββρ
(A.1-3)
First order effect of immigration on the wage distribution
Differentiating these expressions gives
( ) ( )
( )
−−−=
+=
+
+=
−−−+−+
+−=
∑∑∑
−
dm
Hd
dm
Kds
dm
d
mm
m
dm
Hd
dm
Hd
dm
Kds
dm
Hd
mdm
wd
i ii
ii
i j jjj
iiii
ii
ii
lnln1
ln
)(
)(ln
lnln)1(1
ln1)1(
ln
10
1
10
1101
10
1
ψρ
ππ
πω
ππα
πππα
ψσππ
πσ
σ
σ
where ∑
=
j jj
ii
i σ
σ
πα
παω
)(
)(0
0
is share of the ith type in the labour aggregate Hσ and
ss
s
KH
H
)1( ββ
βψ
−+= is share of labour in the CES aggregate y
s.
Letting dm
d
dm
Kd ρθ
lnln= , where θ is the elasticity of supply of capital, we
can substitute into the expression for dm
d ρln to get
42
dm
Hd
s
s
dm
d ln
)1(1
)1(ln
ψθ
ψρ
−+
−=
and thus
( )
++
+−
+−=
−−+
−−−−
+−=
−+−++
−=
∑∑ mm
m
m
dm
Hd
s
s
m
dm
d
dm
Hd
mdm
wd
jj
j
j k kkk
jjj
ii
i
ii
i
ii
ii
10
1
10
10
10
1
10
1
10
1
)(
)()1(
ln
)1(
1
)1(1
)1)(1(1)1(
ln)1(
1ln1)1(
ln
ππ
π
ππα
ππαφ
ππ
πσ
σψθ
ψ
ππ
πσ
ρψ
ψσ
ππ
πσ
σ
σ
where (1 )(1 ) 1
1 1.1 (1 ) 1
s
s
ψφ
ψθ σ
− −= + ≤ + − −
Notice that φ =1 if there is perfectly
elastic supply of capital (θ=∞), perfect substitutability of capital and labour (s=1)
or capital share is zero (ψ=1).
If we set m=0 then we get
( )
−−= ∑
=0
1
0
1
0
1ln
j
j
j
i
i
m
i
dm
wd
π
πωφ
π
πσ (A.1-3)
First order effect of immigration on the mean native wage
From (A.1-2), at m=0, 00ww iii ωπ = where 0
w denotes the mean wage at
m=0. Hence the first order effect of immigration on mean wages in the
preexisting population is
0 10 0
0
00
ln( 1)(1 ) 0.
i i i ii i i
i imm
d w d ww w
dm dm
π ππ σ φ ω
π==
= = − − ≤∑ ∑ ∑ (A.1-4)
This is nonpositive since σ≤1 and φ ≤1 and equals zero iff φ =1 or σ=1.
First order effect of immigration on the wage of competing labour
The first order effect on mean wages of a population composed similarly
to immigrants is
1 10
0
00
2 21 1
0
0 0
ln
( 1) 0.
i i i ii i
i i mm
i ii i
i i
d w d ww
dm dm
w
π ππ
π
π πσ ω φ ω
π π
==
=
= − − ≤
∑ ∑
∑ ∑
(A.1-5)
43
In this case nonpositivity follows from the Cauchy-Schwarz inequality,
given φ ≤1, since
2 2 2 21 1 1 1
0 0 0 00,i i i i
i i i i
i i i i
π π π πω φ ω ω ω
π π π π
− ≥ − ≥
∑ ∑ ∑ ∑
and the first order effect is zero iff either φ =1 and 01
ii ππ = for all i or σ=1.
Second order effect of immigration on the mean native wage
In the special case that φ =1 it is necessary to turn to second order terms in
order to sign the effect of small amounts of immigration:
22 20 0
2 2
ln ln.i i i
i i i
d w d w d ww
dm dm dmπ π
= +
∑ ∑ (A.1-6)
Given φ =1,
++
+−
+−= ∑
∑ mm
m
mdm
wd
jj
j
j k kkk
jjj
ii
ii
10
1
10
10
10
1
)(
)()1(
ln
ππ
π
ππα
ππα
ππ
πσ
σ
σ
and therefore
++
++
++
+−−
+−
−=
∑∑
∑∑
2
10
1
10
10
2
10
1
10
102
10
1
2
2
)(
)(
)(
)()1(
)1(ln
mm
m
mm
m
m
dm
wd
jj
j
j k kkk
jjj
jj
j
j k kkk
jjj
ii
i
i
ππ
π
ππα
ππασ
ππ
π
ππα
ππασ
ππ
π
σ
σ
σ
σ
σ
++
++
++
+
+−
+−=
∑∑
∑∑2
10
1
10
10
10
1
10
10
10
12
10
1
2
2
)(
)(
)(
)(2
)1(ln
mm
m
mm
m
mm
dm
wd
jj
j
j k kkk
jjj
jj
j
j k kkk
jjj
ii
i
ii
i
i
ππ
π
ππα
ππα
ππ
π
ππα
ππα
ππ
π
ππ
π
σ
σ
σ
σ
σ
Substituting into (A.1-6), summing and simplifying for the case m=0,
gives
0)1(
lnln
2
0
12
0
10
0
2
2
20
0
2
20
≥
−
−=
+=
∑ ∑
∑∑==
i
ii
i
ii
m
iiii
m
ii
w
dm
wd
dm
wdw
dm
wd
π
πω
π
πωσ
ππ
(A.1-7)
44
which is positive provided the skill composition of immigrants differs
from the pre-existing population, again by the Cauchy-Schwarz inequality.
Furthermore the size of the second order effect on mean wages is evidently
greater the greater the dissimilarity.
Figures
Figure 1
.81
1.2
1.4
0 20 40 60 80 100Percentile of non-immigrant wage distribution
Less than 2 years Less than 6 years
Non-immigrant
Source: LFS, various years
Position of recent immigrants in wage distribution
The figure shows kernel estimates of the density of immigrants who arrived within the last two
(dashed line) or six (dotted line) years in the non-immigrant wage distribution. The horizontal line
shows as a reference the non-immigrant wage distribution The kernel estimates are above the
horizontal line at wages where immigrants are more concentrated than natives, and below the
horizontal line at wages where immigrants are less concentrated than natives.
Figure 2 .5
11.5
2
0 20 40 60 80 100Percentile of non-immigrant wage distribution
Less than 2 years Less than 6 years
Non-immigrant
Source: LFS, various years
Predicted position of recent immigrants in wage distribution
The figure shows kernel estimates of the predicted density of immigrants who arrived within the
last two (dashed line) or six (dotted line) years in the non-immigrant wage distribution. The
horizontal line shows as a reference the non-immigrant wage distribution The kernel estimates are
above the horizontal line at wages where immigrants are more concentrated than natives, and
below the horizontal line at wages where immigrants are less concentrated than natives. See text
for details about wage prediction.
Figure 3
-1.5
-1-.
50
.51
0 20 40 60 80 100Percentile
IV coefficients 95% confidence interval
IV 4 lags ; all controls
Impact of immigration across the wage distribution
The figure reports the estimated IV regression coefficients and the 95% confidence interval from a
difference regression of each wage percentile from the 5th
to the 95th
percentile in intervals of 5
percentage points on the ratio of immigrants to natives for years 1997/2005 and time dummies
Instrumental variable is the fourth lag of the ratio of immigrants to natives
Tables
Table 1 – Average age, gender ratio, and education in 1997 and 2005
Routine occupations 1.2 3.72 11.79 6.13 10.95 33.97 17.54 22.19 49.88 Entries are the share of working age (16-65) natives and immigrants of both sexes in each occupation group by level of
education in 2004-2005 pooled.
Source: LFS 2004, 2005
Table 4 – Test for serial correlation in wage variables
Dependent Variable M1 M2
Average Wage -2.860
p=0.004
0.320
p=0.750
Robust Average Wage -2.840
p=0.004
-1.190
p=0.233
Wage Index -2.490
p=0.013
-0.050
p=0.960
Robust Wage Index -2.590
p=0.010
-1.100
p=0.273
5th
Percentile -3.830
p=0.000
-0.900
p=0.369
10th
Percentile -3.940
p=0.000
0.090
p=0.926
25th
Percentile -3.950
p=0.000
0.440
p=0.661
50th
Percentile -2.370
p=0.018
-2.870
p=0.004
75th
Percentile -1.200
p=0.230
-4.040
p=0.000
90th
Percentile -2.830
p=0.005
-1.500
p=0.132
95th
Percentile -3.410
p=0.001
-0.570
p=0.566
The table reports Arellano-Bond tests for first (M1) and second (M2) order serial correlation
based on residuals from the first differenced equation with all control variables, estimated
using the 4th
lag of immigrant/native ratio as IV. The test is asymptotically distributed as a
normal.
Table 5 – Effect of immigration on wage distribution– impact on different wage
percentiles
OLS IV
[1991 Immigration Share]
IV
[4 period lag]
First Differences First Differences First Differences Dependent
Variable
(1) (2) (3) (4) (5) (6)
5th
Percentile -0.153
(0.373)
-0.162
(0.374)
-0.688
(0.271)
-0.590
(0.272)
-0.709
(0.283)
-0.604
(0.281)
10th
Percentile -0.032
(0.223)
-0.076
(0.227)
-0.445
(0.162)
-0.443
(0.166)
-0.523
(0.170)
-0.512
(0.172)
25th
Percentile 0.156
(0.203)
0.091
(0.198)
0.148
(0.146)
0.229
(0.144)
0.117
(0.153)
0.207
(0.149)
50th
Percentile 0.280
(0.185)
0.258
(0.183)
0.616
(0.135)
0.658
(0.134)
0.603
(0.141)
0.655
(0.139)
75th
Percentile 0.386
(0.203)
0.397
(0.196)
0.576
(0.147)
0.640
(0.143)
0.553
(0.153)
0.628
(0.148)
90th
Percentile 0.307
(0.253)
0.323
(0.246)
0.450
(0.183)
0.495
(0.178)
0.374
(0.191)
0.430
(0.184)
95th
Percentile 0.295
(0.312)
0.290
(0.315)
0.427
(0.225)
0.439
(0.228)
0.364
(0.235)
0.384
(0.236)
Coefficient for
IV in first stage
regression
0.068
(0.007)
0.068
(0.007)
0.043
(0.003)
0.043
(0.004)
R2
for first stage
regression 0.352 0.382 0.350 0.377
Year dummies Yes Yes Yes Yes Yes Yes
Other Controls No Yes No Yes No Yes
Observations 136 136 136 136 136 136 Entries are the estimated regression coefficients of the ratio of immigrants to natives in regressions of
different natives’ wage percentiles on the ratio of immigrants to natives for years 1997-2005.
“Other Controls” include average natives’ and immigrants’ age, and the logarithm of the ratio of
natives in each education group to natives with no qualifications.
Standard errors are reported in parenthesis.
Table 6 – Effect of immigration on average wages
OLS IV
[1991 Immigration Share]
IV
[4 period lag]
First Differences First Differences First Differences Dependent
Variable
(1) (2) (3) (4) (5) (6)
Average 0.309
(0.181)
0.292
(0.172)
0.373
(0.131)
0.433
(0.125)
0.319
(0.136)
0.393
(0.129)
Robust
average
0.317
(0.156)
0.304
(0.150)
0.473
(0.113)
0.531
(0.110)
0.422
(0.117)
0.489
(0.113)
Wage index 0.248
(0.162)
0.260
(0.159)
0.229
(0.117)
0.301
(0.115)
0.199
(0.122)
0.274
(0.119)
Robust index 0.258
(0.134)
0.275
(0.132)
0.334
(0.097)
0.399
(0.096)
0.302
(0.101)
0.365
(0.099)
Coefficient for
IV in first stage
regression
0.068
(0.007)
0.068
(0.007)
0.043
(0.003)
0.043
(0.004)
R2
for first stage
regression 0.352 0.382 0.350 0.377
Year dummies Yes Yes Yes Yes Yes Yes
Other Controls No Yes No Yes No Yes
Observations 136 136 136 136 136 136 Entries are the estimated regression coefficients of the ratio of immigrants to natives in regressions of
different measures of natives’ average wages on the ratio of immigrants to natives for years 1997-2005.
Robust average wages are computed by trimming the wage distribution at the (region- and year-
specific) top and bottom percentile .The wage index is the weighted log sum of the average wage of each
education group, using time invariant weights. Its robust version uses the trimmed distribution to
compute education-specific averages.
“Other Controls” include average natives’ and immigrants’ age, and the logarithm of the ratio of
natives in each education group to natives with no qualifications.
Standard errors are reported in parenthesis.
Table 7 - Simulated mean wage effects
Ability distribution of immigrants
Observed Extreme
Elasticity of
supply of
capital
θ
Elasticity of
substitution
between
labour types
1/(1-σ)
Elasticity of
substitution
between
capital and
labour
1/(1-s)
m=0.01 m=0.1 m=0.01 m=0.1
∞ ∞,2,1 0.000 0.000 0.000 0.000
2 ∞,2,1 0.000 0.002 0.002 0.201 ∞
1 ∞,2,1 0.000 0.005 0.005 0.397
∞ 0.000 0.000 0.000 0.000
2 -0.239 -2.240 -0.188 -1.788 ∞
1 -0.321 -3.044 -0.252 -2.422
∞ 0.000 0.002 0.002 0.201
2 -0.239 -2.237 -0.185 -1.539 2
1 -0.321 -3.041 -0.248 -2.156
∞ 0.000 0.005 0.005 0.396
2 -0.239 -2.234 -0.182 -1.297
1
1
1 -0.321 -3.038 -0.245 -1.896
∞ 0.000 0.000 0.000 0.000
2 -0.299 -2.775 -0.234 -2.219 ∞
1 -0.480 -4.496 -0.377 -3.589
∞ 0.000 0.002 0.002 0.201
2 -0.299 -2.772 -0.231 -1.959 2
1 -0.480 -4.492 -0.373 -3.292
∞ 0.000 0.005 0.005 0.396
2 -0.299 -2.768 -0.228 -1.706
0
1
1 -0.480 -4.489 -0.370 -3.002 Entries are the simulated percentage changes in mean native wage following an inflow of
immigrants of magnitude m*native population under different assumptions on the elasticity of
capital supply, the elasticity of substitution between labour types and between capital and labour,
and the ability distribution of migrants. “Observed” distribution is the distribution estimated in
figure 1; “Extreme” distribution assumes all immigrants are evenly spread in the lower half of the
distribution of native abilities.
Table A1 - Effect of immigration on log average natives' wages, different instruments
Average
wage
Robust
Average Instrumental variable
(1) (2)
4th
lag of immigrant-native ratio 0.319
(0.136)
0.422
(0.117)
10th
lag of immigrant-native ratio 0.330
(0.134)
0.446
(0.116)
1991 immigrant-native ratio (Census 1991) 0.373
(0.131)
0.473
(0.113)
1981 immigrant-native ratio (Census 1981) 0.372
(0.135)
0.478
(0.116)
change 91-81 0.375
(0.128)
0.456
(0.110)
Predicted inflow by ethnic group (Census 91) 0.222
(0.159)
0.365
(0.137)
Predicted inflow by ethnic group (LFS 91) 0.237
(0.163)
0.388
(0.140)
Predicted inflow by ethnic group (LFS 85) 0.184
(0.182)
0.343
(0.156)
Predicted inflow by ethnic group (LFS 81) 0.205
(0.169)
0.359
(0.145) Entries are the estimated IV regression coefficients of the ratio of immigrants to natives in regressions
of log average regional wages and robust log average regional wages on the ratio of immigrants to
natives for years 1997-2005. The instrumental variable used is described in the first column.
Robust average wages are computed by trimming the wage distribution at the (region- and year-
specific) top and bottom percentile.
Standard errors are reported in parenthesis.
Table A2 – Descriptive statistics
Variable Mean Std. Dev.
Log-wages, all natives
Average hourly pay 2.199 0.133
Robust average hourly pay 2.173 0.132
Wage index 3.315 0.143
Robust wage index 3.315 0.143
Average hourly pay, men 2.314 0.131
Average hourly pay, women 2.061 0.142
Robust average hourly pay, men 2.280 0.128
Robust average hourly pay, women 2.047 0.142
Log-wages, natives by education group
Average hourly pay, high 2.637 0.103
Average hourly pay, intermediate 2.247 0.116
Average hourly pay, low 2.062 0.105
Robust average hourly pay, high 2.573 0.103
Robust average hourly pay, intermediate 2.221 0.117
Robust average hourly pay, low 2.054 0.106
Log-wages, earlier immigrants
Average hourly pay 2.257 0.146
Robust average hourly pay 2.202 0.147
Natives’ log- wage percentiles
5th
1.266 0.148
10th
1.433 0.129
25th
1.678 0.131
50th
2.022 0.132
75th
2.413 0.134
90th
2.763 0.139
95th
2.970 0.152
Immigrant-native ratio 0.088 0.110
Annual change in immigrant-native ratio 0.004 0.008
Average natives’ age 39.881 0.890
Average immigrants’ age 38.895 1.961
ln high educ./low educ. -1.639 0.388
ln intermed. educ./low educ. -1.032 0.283 Entries are the mean value and the standard deviation of the variables used in the analysis, across
all regions and years 1997-2005.
Wages are expressed in 2005 pounds, using the 2005 CPI index.
Source: LFS 1997, 2005
Table A3 – Descriptive statistics on immigrants’ inflow
Years Mean Std.Dev Min Max
1997-1998 0.23% 0.78% -1.28% 2.59%
1998-1999 -0.02% 0.56% -1.25% 0.83%
1999-2000 0.22% 1.14% -0.69% 4.46%
2000-2001 0.41% 0.63% -0.48% 2.05%
2001-2002 0.43% 0.86% -0.53% 3.01%
2002-2003 0.29% 0.45% -0.42% 1.55%
2003-2004 0.50% 0.82% -0.80% 2.95%
2004-2005 0.77% 0.59% -0.43% 1.77%
Average 1997/2005 0.35%
1997-2005 2.83% 3.50% -0.27% 15.83% Entries are the annual mean, standard deviation, minimum, and maximum across all regions of the
change in immigrant-native ratio for years 1997-2005.
The last row reports the mean, standard deviation, minimum, and maximum across all regions of the