REACT-1 round 10 report: Level prevalence of SARS-CoV-2 swab-positivity in England during third national lockdown in March 2021 Steven Riley 1,2, *, Oliver Eales 1,2 , David Haw 1,2 , Caroline E. Walters 1,2 , Haowei Wang 1,2 , Kylie E. C. Ainslie 1,2,12 , Christina Atchison 1 , Claudio Fronterre 3 , Peter J. Diggle 3 , Deborah Ashby 1 , Christl A. Donnelly 1,2,4 , Graham Cooke 5,6,7 , Wendy Barclay 5 , Helen Ward 1,6,7 , Ara Darzi 6,7,8 , Paul Elliott 1,6,7,9,10,11 * 1 School of Public Health, Imperial College London, UK 2 MRC Centre for Global infectious Disease Analysis and Abdul Latif Jameel Institute for Disease and Emergency Analytics, Imperial College London, UK 3 CHICAS, Lancaster Medical School, Lancaster University, UK and Health Data Research, UK 4 Department of Statistics, University of Oxford, UK 5 Department of Infectious Disease, Imperial College London, UK 6 Imperial College Healthcare NHS Trust, UK 7 National Institute for Health Research Imperial Biomedical Research Centre, UK 8 Institute of Global Health Innovation at Imperial College London, UK 9 MRC Centre for Environment and Health, School of Public Health, Imperial College London, UK 10 Health Data Research (HDR) UK London at Imperial College 11 UK Dementia Research Institute at Imperial College 12 Centre for Infectious Disease Control, National Institute for Public Health and the Environment, Bilthoven, The Netherlands *Corresponding authors: Steven Riley and Paul Elliott, [email protected], [email protected], School of Public Health, Imperial College London, Norfolk Place, London, W2 1PG 1
Transcript
REACT-1 round 10 report: Level prevalence of SARS-CoV-2 swab-positivity in Englandduring third national lockdown in March 2021
Steven Riley1,2,*, Oliver Eales1,2, David Haw1,2, Caroline E. Walters1,2, Haowei Wang1,2, Kylie
E. C. Ainslie1,2,12, Christina Atchison1, Claudio Fronterre3, Peter J. Diggle3, Deborah Ashby1,
Christl A. Donnelly1,2,4, Graham Cooke5,6,7, Wendy Barclay5, Helen Ward1,6,7, Ara Darzi6,7,8,
Paul Elliott1,6,7,9,10,11 *
1 School of Public Health, Imperial College London, UK
2 MRC Centre for Global infectious Disease Analysis and Abdul Latif Jameel Institute for
Disease and Emergency Analytics, Imperial College London, UK
3 CHICAS, Lancaster Medical School, Lancaster University, UK and Health Data Research,
UK
4 Department of Statistics, University of Oxford, UK
5 Department of Infectious Disease, Imperial College London, UK
6 Imperial College Healthcare NHS Trust, UK
7 National Institute for Health Research Imperial Biomedical Research Centre, UK
8 Institute of Global Health Innovation at Imperial College London, UK
9 MRC Centre for Environment and Health, School of Public Health, Imperial College
London, UK
10 Health Data Research (HDR) UK London at Imperial College
11 UK Dementia Research Institute at Imperial College
12 Centre for Infectious Disease Control, National Institute for Public Health and the
Environment, Bilthoven, The Netherlands
*Corresponding authors: Steven Riley and Paul Elliott, [email protected],[email protected], School of Public Health, Imperial College London, Norfolk Place,London, W2 1PG
1
Abstract
Background
In England, hospitalisations and deaths due to SARS-CoV-2 have been falling consistentlysince January 2021 during the third national lockdown of the COVID-19 pandemic. The firstsignificant relaxation of that lockdown occurred on 8 March when schools reopened.
Methods
The REal-time Assessment of Community Transmission-1 (REACT-1) study augmentsroutine surveillance data for England by measuring swab-positivity for SARS-CoV-2 in thecommunity. The current round, round 10, collected swabs from 11 to 30 March 2021 and iscompared here to round 9, in which swabs were collected from 4 to 23 February 2021.
Results
During round 10, we estimated an R number of 1.00 (95% confidence interval 0.81, 1.21).Between rounds 9 and 10 we estimated national prevalence has dropped by ~60% from0.49% (0.44%, 0.55%) in February to 0.20% (0.17%, 0.23%) in March. There weresubstantial falls in weighted regional prevalence: in South East from 0.36% (0.29%, 0.44%)in round 9 to 0.07% (0.04%, 0.12%) in round 10; London from 0.60% (0.48%, 0.76%) to0.16% (0.10%, 0.26%); East of England from 0.47% (0.36%, 0.60%) to 0.15% (0.10%,0.24%); East Midlands from 0.59% (0.45%, 0.77%) to 0.19% (0.13%, 0.28%); and NorthWest from 0.69% (0.54%, 0.88%) to 0.31% (0.21%, 0.45%). Areas of apparent higherprevalence remain in parts of the North West, and Yorkshire and The Humber. The highestprevalence in March was found among school-aged children 5 to 12 years at 0.41% (0.27%,0.62%), compared with the lowest in those aged 65 to 74 and 75 and over at 0.09% (0.05%,0.16%). The close approximation between prevalence of infections and deaths (suitablylagged) is diverging, suggesting that infections may have resulted in fewer hospitalisationsand deaths since the start of widespread vaccination.
Conclusion
We report a sharp decline in prevalence of infections between February and March 2021.We did not observe an increase in the prevalence of SARS-CoV-2 following the reopening ofschools in England, although the decline of prevalence appears to have stopped. Futurerounds of REACT-1 will be able to measure the rate of growth or decline from this currentplateau and hence help assess the effectiveness of the vaccination roll-out on transmissionof the virus as well as the potential size of any third wave during the ensuing months.
2
Introduction
During the spring of 2021, many European populations are suffering from substantial third
waves of the COVID-19 pandemic with high pressure on health care systems [1] resulting in
stringent social distancing. In England, during the third national lockdown, hospitalisations
and deaths have fallen consistently since early January [2]. However, since the first
substantial relaxation of lockdown in England with the opening of schools on 8 March 2021
[3], the rate of decline of new cases has slowed considerably [2]. Large-scale testing of
school children and their families using lateral flow devices accompanied the opening of
schools [4].
The REal-time Assessment of Community Transmission-1 (REACT-1) study augments
routine surveillance data for England by measuring swab-positivity for SARS-CoV-2 in a
random sample of the community recruited regardless of symptom status [5]. We present
here the results from round 10 of REACT-1 from swabs collected from 11 to 30 March 2021.
We compare the results of REACT-1 round 10 to round 9, in which swabs were collected
from 4 to 23 February 2021.
Results
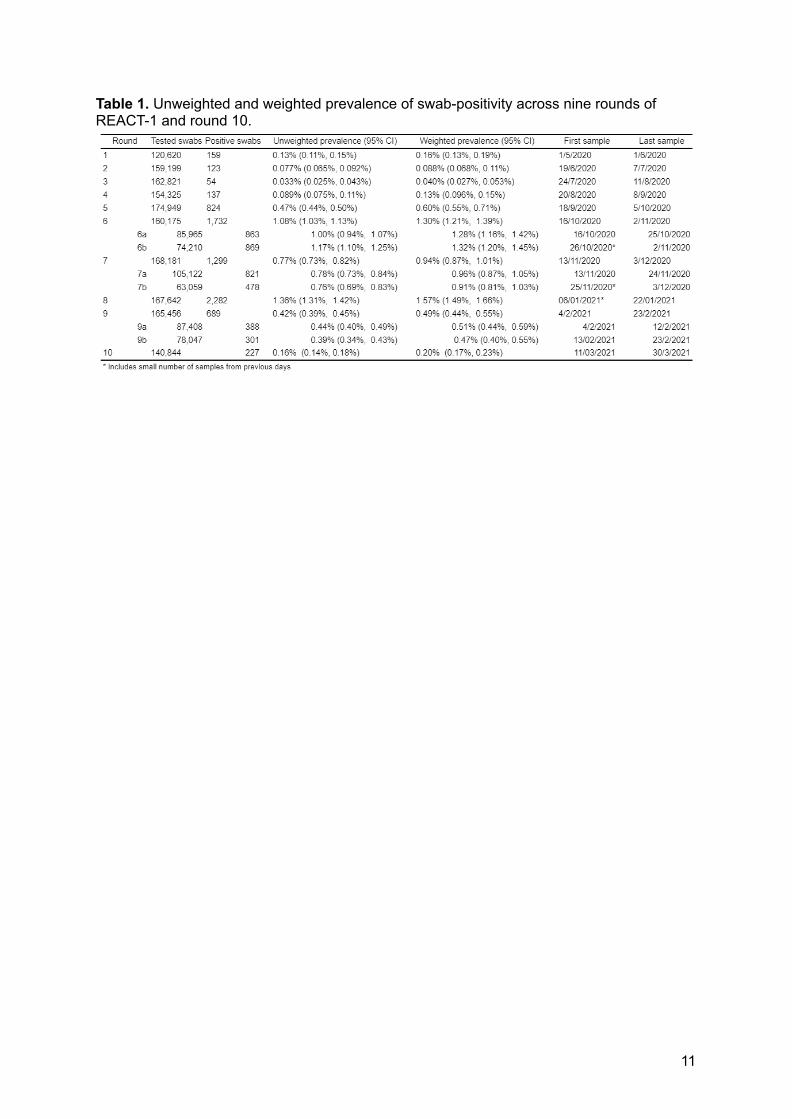
In round 10 we found 227 positives from 140,844 swabs giving an unweighted prevalence of
0.16% (0.14%, 0.18%) and a weighted prevalence of 0.20% (0.17%, 0.23%) (Table 1). This
represents a ~60% reduction from round 9 in which unweighted prevalence was 0.42%
(0.39%, 0.45%) and weighted prevalence was 0.49% (0.44%, 0.55%).
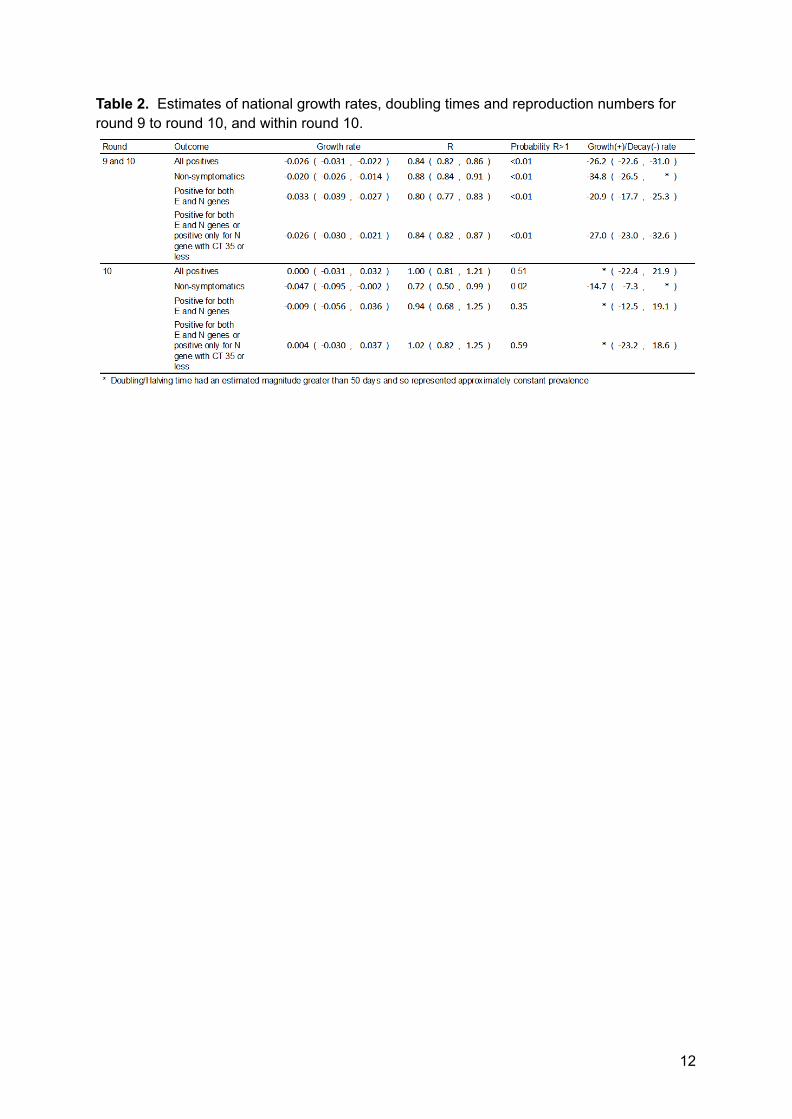
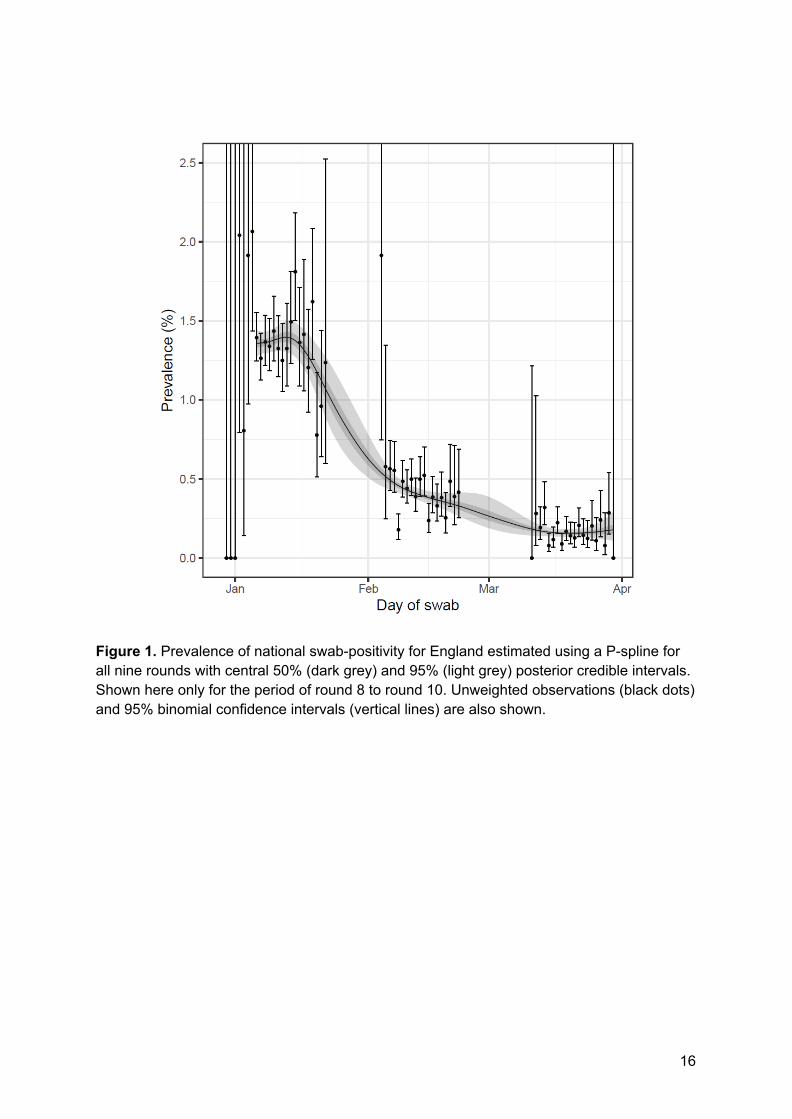
Using a constant growth rate model, on average for England, we found evidence for a
decline over the period of round 9 to 10 (Table 2, Figure 1) with an estimated halving time of
26 (23, 31) days and a corresponding R of 0.84 (0.82, 0.86). Within round 10, we estimate
an R of 1.00 (0.81, 1.21) with 51% probability that R > 1. These results suggest a slow down
in the rate of decline, with prevalence plateauing at around 1 in 500 during round 10 (Figure
1). These results were largely unchanged in sensitivity analyses in which subsets of positive
samples were considered: non-symptomatics, only participants with swabs positive for both
E and N genes, and only those positive for N gene with a CT value of 35 or below. However,
we estimated a lower R of 0.72 (0.50, 0.99) for round 10 based only on the prevalence of
positive swabs taken from non-symptomatic participants (Table 2).
At regional level, R over the period of rounds 9 to 10 ranged from 0.75 (0.68, 0.81) in South
East to 0.95 (0.87, 1.03) in Yorkshire and The Humber. We estimated a 12% probability that
daily hospital admissions and COVID-19 mortality data (deaths within 28 days of a positive
test), with allowance for a suitable discrete-day lag period between infection and either
hospital admission or death and an appropriate scaling parameter.
In sensitivity analyses for the estimation of R, we provide alternative cut-points of cycle
threshold (CT) values for swab-positivity and restrict the analyses only to those who did not
report symptoms in the previous week.
Statistical analyses were carried out in R [14]. We obtained research ethics approval from
the South Central-Berkshire B Research Ethics Committee (IRAS ID: 283787).
References
1. Coronavirus Pandemic (COVID-19). In: Our World in Data [Internet]. [cited 6 Apr 2021].Available: https://ourworldindata.org/
2. UK Government. UK government Covid-19 dashboard. In: UK government Covid-19dashboard [Internet]. Available: https://coronavirus.data.gov.uk/
3. UK Government. Prime Minister sets out roadmap to cautiously ease lockdownrestrictions. In: GOV.UK [Internet]. [cited 3 Feb 2021]. Available:https://www.gov.uk/government/news/prime-minister-sets-out-roadmap-to-cautiously-ease-lockdown-restrictions
4. UK Government. Schools, nurseries and colleges testing: order coronavirus (COVID-19)rapid lateral flow home test kits. In: uk.gov [Internet]. [cited 6 Apr 2021]. Available:https://www.gov.uk/order-coronavirus-rapid-lateral-flow-tests
5. Riley S, Atchison C, Ashby D, Donnelly CA, Barclay W, Cooke G, et al. REal-timeAssessment of Community Transmission (REACT) of SARS-CoV-2 virus: Studyprotocol. Wellcome Open Research. 2020. p. 200.doi:10.12688/wellcomeopenres.16228.1
6. UK Government. Prime Minister announces national lockdown. In: gov.uk [Internet]. 4Jan 2021 [cited 16 Feb 2021]. Available:https://www.gov.uk/government/news/prime-minister-announces-national-lockdown
7. Torjesen I. Covid-19: First doses of vaccines in Scotland led to a substantial fall inhospital admissions. BMJ. 2021;372: n523.
8. Dagan N, Barda N, Kepten E, Miron O, Perchik S, Katz MA, et al. BNT162b2 mRNACovid-19 Vaccine in a Nationwide Mass Vaccination Setting. N Engl J Med. 2021.doi:10.1056/NEJMoa2101765
9. Iacobucci G. Covid-19: Doctors sound alarm over hospital transmissions. BMJ.2020;369: m2013.
10. Kucharski AJ, Klepac P, Conlan AJK, Kissler SM, Tang ML, Fry H, et al. Effectiveness ofisolation, testing, contact tracing, and physical distancing on reducing transmission ofSARS-CoV-2 in different settings: a mathematical modelling study. Lancet Infect Dis.2020;20: 1151–1160.
11. Ferretti L, Wymant C, Kendall M, Zhao L, Nurtay A, Abeler-Dörner L, et al. QuantifyingSARS-CoV-2 transmission suggests epidemic control with digital contact tracing.Science. 2020;368. doi:10.1126/science.abb6936
12. UK Government. Surge testing for new coronavirus (COVID-19) variants. In: gov.uk[Internet]. 2 Oct 2021 [cited 6/ 4/ 2021]. Available:https://www.gov.uk/guidance/surge-testing-for-new-coronavirus-covid-19-variants
13. Lang S, Brezger A. Bayesian P-Splines. J Comput Graph Stat. 2004;13: 183–212.
14. R Core Team. R: A Language and Environment for Statistical Computing. R Foundationfor Statistical Computing; 2020. Available: https://www.R-project.org/
Data availability
Supporting data for tables and figures are available either: in this spreadsheet; or in theinst/extdata directory of this GitHub R package.
Declaration of interests
We declare no competing interests.
Funding
The study was funded by the Department of Health and Social Care in England.
Acknowledgements
SR, CAD acknowledge support: MRC Centre for Global Infectious Disease Analysis,
National Institute for Health Research (NIHR) Health Protection Research Unit (HPRU),
Wellcome Trust (200861/Z/16/Z, 200187/Z/15/Z), and Centres for Disease Control and
Prevention (US, U01CK0005-01-02). GC is supported by an NIHR Professorship. HW
acknowledges support from an NIHR Senior Investigator Award and the Wellcome Trust
(205456/Z/16/Z). PE is Director of the MRC Centre for Environment and Health
(MR/L01341X/1, MR/S019669/1). PE acknowledges support from Health Data Research UK
(HDR UK); the NIHR Imperial Biomedical Research Centre; NIHR HPRUs in Chemical and
Radiation Threats and Hazards, and Environmental Exposures and Health; the British Heart
Foundation Centre for Research Excellence at Imperial College London (RE/18/4/34215);
and the UK Dementia Research Institute at Imperial (MC_PC_17114). We thank The Huo
Family Foundation for their support of our work on COVID-19.
We thank key collaborators on this work – Ipsos MORI: Kelly Beaver, Sam Clemens, Gary
Welch, Nicholas Gilby, Kelly Ward and Kevin Pickering; Institute of Global Health Innovation
at Imperial College: Gianluca Fontana, Sutha Satkunarajah, Didi Thompson and Lenny
Naar; Molecular Diagnostic Unit, Imperial College London: Prof. Graham Taylor; North West
London Pathology and Public Health England for help in calibration of the laboratory
analyses; Patient Experience Research Centre at Imperial College and the REACT Public
Advisory Panel; NHS Digital for access to the NHS register; and the Department of Health
and Social Care for logistic support. SR acknowledges helpful discussion with attendees of
meetings of the UK Government Office for Science (GO-Science) Scientific Pandemic
Influenza – Modelling (SPI-M) committee.
9
Tables and Figures
10
Table 1. Unweighted and weighted prevalence of swab-positivity across nine rounds ofREACT-1 and round 10.
11
Table 2. Estimates of national growth rates, doubling times and reproduction numbers forround 9 to round 10, and within round 10.
12
Table 3. Estimates of regional growth rates, doubling times and reproduction numbers forround 9 to round 10.
13
Table 4a. Unweighted and weighted prevalence of swab-positivity for sex age and region forrounds 10. *We present weighted prevalence if the number of positives in a category is 10 ormore.
14
Table 4b. Unweighted and weighted prevalence of swab-positivity for sex age and region forrounds 9. *We present weighted prevalence if the number of positives in a category is 10 ormore.
15
Figure 1. Prevalence of national swab-positivity for England estimated using a P-spline forall nine rounds with central 50% (dark grey) and 95% (light grey) posterior credible intervals.Shown here only for the period of round 8 to round 10. Unweighted observations (black dots)and 95% binomial confidence intervals (vertical lines) are also shown.
16
Figure 2. Weighted prevalence of swab-positivity by region for rounds 9 and 10. Bars show95% confidence intervals. See Table 4.
17
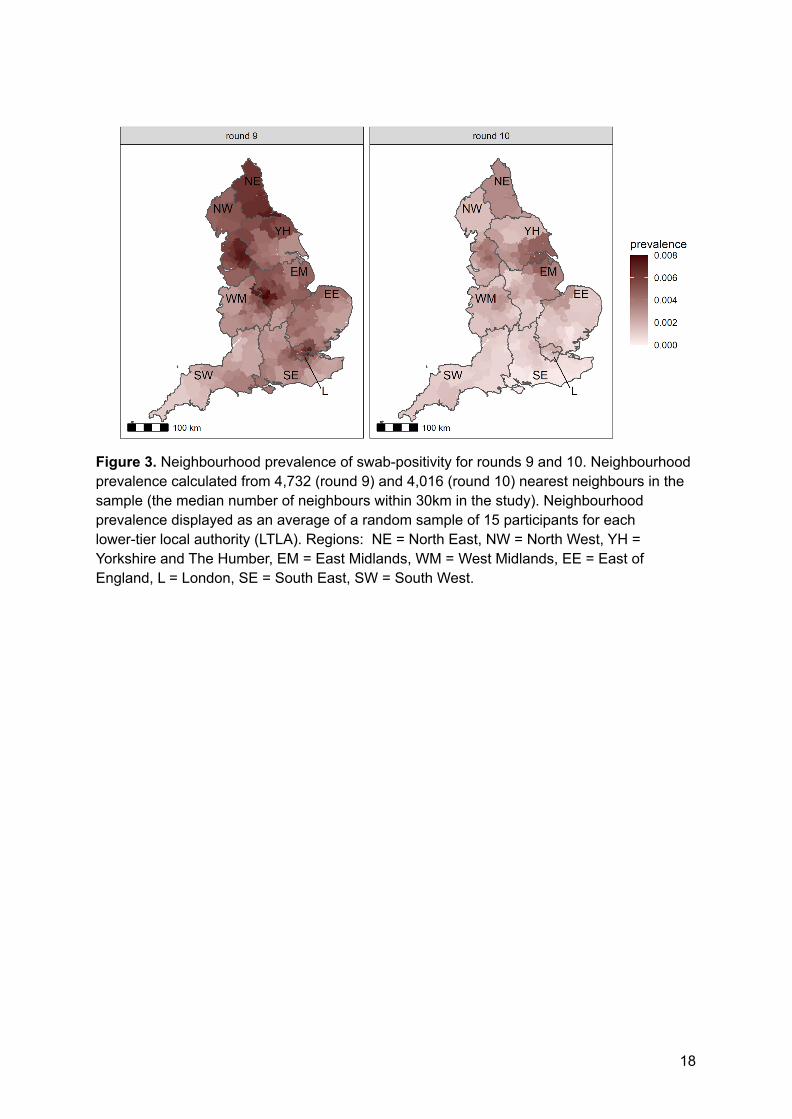
Figure 3. Neighbourhood prevalence of swab-positivity for rounds 9 and 10. Neighbourhoodprevalence calculated from 4,732 (round 9) and 4,016 (round 10) nearest neighbours in thesample (the median number of neighbours within 30km in the study). Neighbourhoodprevalence displayed as an average of a random sample of 15 participants for eachlower-tier local authority (LTLA). Regions: NE = North East, NW = North West, YH =Yorkshire and The Humber, EM = East Midlands, WM = West Midlands, EE = East ofEngland, L = London, SE = South East, SW = South West.
18
Figure 4. Weighted prevalence of swab-positivity by age groups for rounds 9 and 10. Barsshow 95% confidence intervals. See Table 4.
19
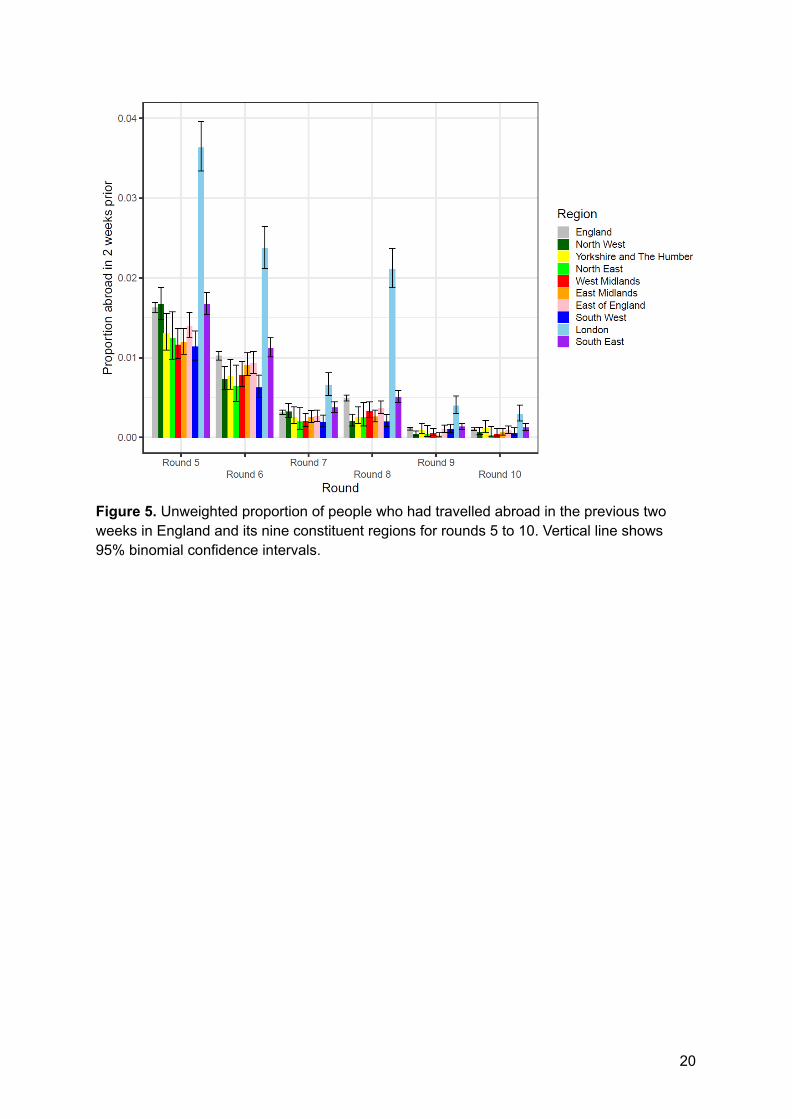
Figure 5. Unweighted proportion of people who had travelled abroad in the previous twoweeks in England and its nine constituent regions for rounds 5 to 10. Vertical line shows95% binomial confidence intervals.
20
Figure 6. Daily hospital admissions in England (solid red line, right hand y-axis) shifted by alag parameter along the x-axis (see below), and daily swab-positivity for all 9 rounds of thestudy (dots with 95% confidence intervals, left hand y-axis) and the P-spline estimate forswab positivity (Solid black line, dark grey shaded area is 50% central credible interval, lightgrey shaded area is 95% central credible interval, left-hand y-axis). Daily hospitaladmissions have been fit to observations from the REACT-1 rounds 1-8 to obtain scaling andlag parameters. These parameter values were estimated using a Bayesian MCMC model:daily_positives(t) ~ Binomial(daily_swab_tests(t), p = daily_admissions(t+lag)*scale). Thediscrete time lag parameter was estimated at 18 (18, 18) days. Note the P-spline is notplotted for the region between round 7 and 8 in which there was a peak in swab-positivitywhile REACT-1 was not active.
21
Figure 7. Daily deaths in England (solid red line, right hand y-axis) shifted by a lagparameter along the x-axis (see below), and daily swab positivity for all 9 rounds of the study(dots with 95% confidence intervals, left hand y-axis) and the P-spline estimate for swabpositivity (Solid black line, dark grey shaded area is 50% central credible interval, light greyshaded area is 95% central credible interval, left-hand y-axis). Daily deaths have been fit toobservations from the REACT-1 rounds 1-8 to obtain scaling and lag parameters. Theseparameter values were estimated using a Bayesian MCMC model: daily_positives(t) ~Binomial(daily_swab_tests(t), p = daily_admissions(t+lag)*scale). The discrete time lagparameter was estimated at 27 (27, 27) days. Note the P-spline is not plotted for the regionbetween round 7 and 8 in which there was a peak in swab-positivity while REACT-1 was notactive.


![BOURBON/RYE $6 [24,600] THE LOUNGE MENU · East Imperial Soda Water / East Imperial Burma Tonic Water / East Imperial Grapefruit Tonic / East Imperial Yuzu Tonic / East Imperial Thai](https://static.documents.pub/doc/80x56/5e6ccd6cbdaeea1277122949/bourbonrye-6-24600-the-lounge-menu-east-imperial-soda-water-east-imperial.jpg)


