Page 1
DISSEMINATION OF ANTIBIOTIC RESISTANT BACTERIA AND PLASMIDS
ENCODING ANTIBIOTIC RESISTANCE GENES IN THE ENVIRONMENT
A Thesis
Submitted to the Faculty of Graduate Studies and Research
In Partial Fulfillment of the Requirements
for the Degree of
Doctor of Philosophy
in Biology
University of Regina
By
Teddie O. Rahube
Regina, Saskatchewan
27 June 2013
©Copyright 2013: T.O. Rahube
Page 2
UNIVERSITY OF REGINA
FACULTY OF GRADUATE STUDIES AND RESEARCH
SUPERVISORY AND EXAMINING COMMITTEE
Teddie Onkabetse Rahube, candidate for the degree of Doctor of Philosophy in Biology, has presented a thesis titled, Dissemination of Antibiotic Resistant Bacteria and Plasmids Encoding Antibiotic Resistance Genes in the Environment, in an oral examination held on June 7, 2013. The following committee members have found the thesis acceptable in form and content, and that the candidate demonstrated satisfactory knowledge of the subject material. External Examiner: Dr. Mueen Aslam, Agriculture and Agri-Food Canada
Supervisor: Dr. Christopher Yost, Department of Biology
Committee Member: Dr. John Stavrinides, Department of Biology
Committee Member: Dr. Paul Levett, Adjunct
Committee Member: Dr. Dena McMartin, Faculty of Engineering & Applied Science
Chair of Defense: Dr. Dongyan Blachford, Faculty of Graduate Studies and Research
Page 3
i
Abstract
Multi-drug resistant (MDR) bacteria (also referred to as superbugs) are classified
among the world’s leading cause of death in humans. The continued emergence and
spread of antibiotic resistance genes (ARGs) among different bacteria in clinical and non-
clinical environments is cause for concern. Identifying and studying important reservoirs
could lead to understanding of persistence, transfer and dissemination of these bacteria
and ARGs from environmental sources to humans. The specific objectives of this study
are to;
a) Investigate the role computer keyboards may play as an environmental reservoir for
community-associated methicillin resistant Staphylococcus aureus (CA-MRSA) using
culture based and molecular tools.
b) Isolate plasmids encoding multiple antibiotic resistance genes from swine manure,
analyze the conjugative mobility, and detect plasmid-specific sequences in the soil
following manure application using PCR method.
c) Characterize antibiotic resistance plasmids and bacterial communities isolated from a
municipal wastewater treatment plant environment using comparative genomics approach
and denaturing gradient gel electrophoresis (DGGE) microbial profiling method.
d) Analyze the functions of the plasmids replication, conjugative mobility and
maintenance genes by in vitro techniques, detect and quantify the plasmid-associated
resistance determinants in the environment upstream and downstream of the wastewater
treatment plant (WWTP) using molecular methods.
Page 4
ii
During the course of this research, I have isolated a CA-MRSA strain (Lum 1)
from one of the computer keyboards surveyed from different high schools in and around
Regina. Lum 1 is characterized by the presence of mecA gene, which codes for resistance
to methicillin, and a spa type t128 found in the CA-MRSA strain lineage CMRSA
7/US400. I have also isolated and characterized five plasmids from swine manure and
WWTP environments, these plasmids carry multiple resistance genes to clinically
relevant antibiotics (macrolides, tetracyclines, beta-lactams, chloramphenicol,
sulfonamides, aminoglycosides, trimethoprim), quaternary ammonium compounds and
heavy metals (mercury, chromium and zinc). Analysis of the plasmids conjugative
mobility and stability have provided insights about the possible persistence and transfer
of ARGs to bacterial communities in the environments receiving waste effluent and
livestock manure. Using molecular PCR tools, I have also detected and quantified the
plasmid sequences and resistance determinants in manure-amended soil and effluent
influenced water ecosystems.
Page 5
iii
ACKNOWLEDGEMENTS
I am sincerely grateful to my supervisor, Dr. Christopher K. Yost, who trusted in
me and believed that I would be successful in a PhD program. I thank you for your
advices and for being simply the best mentor I could ever hope for.
It is a pleasure to thank all those who provided their valuable time and expertise for this
study. To my supervisory committee members, Drs. Paul Levett, John Stavrinides, and
Dena McMartin, I appreciate all the insightful comments during my proposal and thesis
writing. Many thanks to Dr. Paul Levett for providing guidance and resources during my
first year working with MRSA; Dr. John Stavrinides for introducing me to the world of
genomics and bioinformatics; and deepest gratitude is also due to Dr. David Alexander
for his noble help with the sequencing of the plasmids.
Special thanks to all the current and former members of the Yost lab; Tyler Boa
for all the assistance and the fun we had during the summer sampling expeditions; Dr.
Bastien Fremaux for your warm friendship and all the important discussions we had
during the beginning of my Ph.D program. Thank you all Yosties for the time and many
fun moments we shared in the lab and outdoor; I felt more comfortable and inspired by
all the hard work you have dedicated to your respective research.
I would like to convey thanks to all the organizations that provided funding and
support for my research and program; Botswana International University of Science and
Technology (BIUST) task force, the Ministry of Education and Skills Development
(MoESD) in Botswana for my scholarship award; and the Canada Research Chairs
program and Natural Sciences and Engineering Research Council (NSERC) funding for
Dr. Yost. I also thank Terry Hogg and the technical staff at the Canada-Saskatchewan
Irrigation Diversification Center for assistance with soil sample collection; The Regina
Wastewater treatment Plant staff for providing us with water samples; and the University
of Regina (Department of Biology, Faculty of Graduate Studies and Research) for the
teaching assistantships and logistic support.
Page 6
iv
POST DEFENSE ACKNOWLEDGEMENT
I would like to extend my appreciation to the external examiner Dr. Aslam Mueen for
being available at the time of my defense; I appreciate his time and helpful comments.
Page 7
v
DEDICATION
I wish to express my love and sincere gratitude to my family, friends and
colleagues who have showed constant support, encouragement and have kept me smiling
for the duration of my studies; thanks for all the motivations, patience and unconditional
love.
I dedicate this thesis to my mum, Mrs. Basadi G. Rahube, Mum, you have
always been my role model and I thank you for your support, patience and for keeping
me in your daily prayers.
A special dedication to my grandmother, Atsile Marumo, for the many
inspirations; you must be very proud.
Page 8
vi
TABLE OF CONTENTS
ABSTRACT……………………………………………………………………………….i
ACKNOWLEDGEMENTS………………………………………………………………iii
POST DEFENSE ACKNOWLEDGEMENTS…………………………………………..iv
DEDICATION…………………………………………………………………………….v
TABLE OF CONTENTS…………………………………………………………………vi
LIST OF TABLES………………………………………………………………………..xi
LIST OF FIGURES……………………………………………………………………..xiv
LIST OF ABBREVIATIONS, SYMBOLS AND NOMANCLATURE……………….xxi
CHAPTER 1 – GENERAL INTRODUCTION
1.1. Introduction………………………………………………………….………………1
1.2. Hypotheses and Specific objectives………………………………………………...6
1.2. Literature cited…………………………………………………………….……...…8
CHAPTER 2 – ISOLATION AND CHARACTERIZATION OF A COMMUNITY
ASSOCIATED-METHICILLIN RESISTANT STAPHYLOCOCCUS AUREUS FROM
HIGH SCHOOL COMPUTER KEYBOARDS
2.1. Introduction………………………………………………………………………...16
2.2. Materials and Methods …………………………………………………………....17
2.2.1. Specimen Collection
2.2.2. Isolation and Identification of Staphylococcus Colonies
2.2.3. Genomic Profiling of MRSA
2.2.4. Determining survival of Staphylococcus spp. on keyboards
2.2.5. Statistical analysis of keyboard survival
Page 9
vi
2.3. Results………………………………………………………………………………22
2.4. Discussion……………………………………….…………………………….........31
2.5. Conclusion………………………………………………………………………….34
2.6. Literature cited……..………………………………………………………………35
CHAPTER 3 –CHARACTERIZATION OF A MULTIPLE RESISTANCE PLASMID
ISOLATED FROM SWINE MANURE AND ITS DETECTION IN THE SOIL AFTER
MANURE APPLICATION
3.1. Introduction……………………………………………………………….…..........44
3.2. Materials and methods…………………………………………………………….45
3.2.1. Sample preparation, plasmid DNA extraction and resistance
characterization
3.2.2. Plasmid DNA sequencing and bioinformatics analysis
3.2.3. Detection of pMC2 in manure applied soil
3.2.4. Plasmid mobilization
3.3. Results………………………………………………………………………………51
3.3.1. DNA analysis of pMC2
3.3.2. Organization of resistance genes on pMC2
3.3.3. pMC2 replication and mobilization
3.3.4. pMC2 detection in agricultural soil following spread of swine manure
3.4. Discussion…………………………………………………………………………..61
3.5. Conclusion………………………………………………………………………….65
3.6. Literature cited…………………………………………………………………..…65
Page 10
viii
CHAPTER 4- GENOMIC AND FUNCTIONAL ANALYSIS OF ANTIBIOTIC
RESISTANCE PLASMIDS ISOLATED FROM A WASTEWATER TREATMENT
PLANT
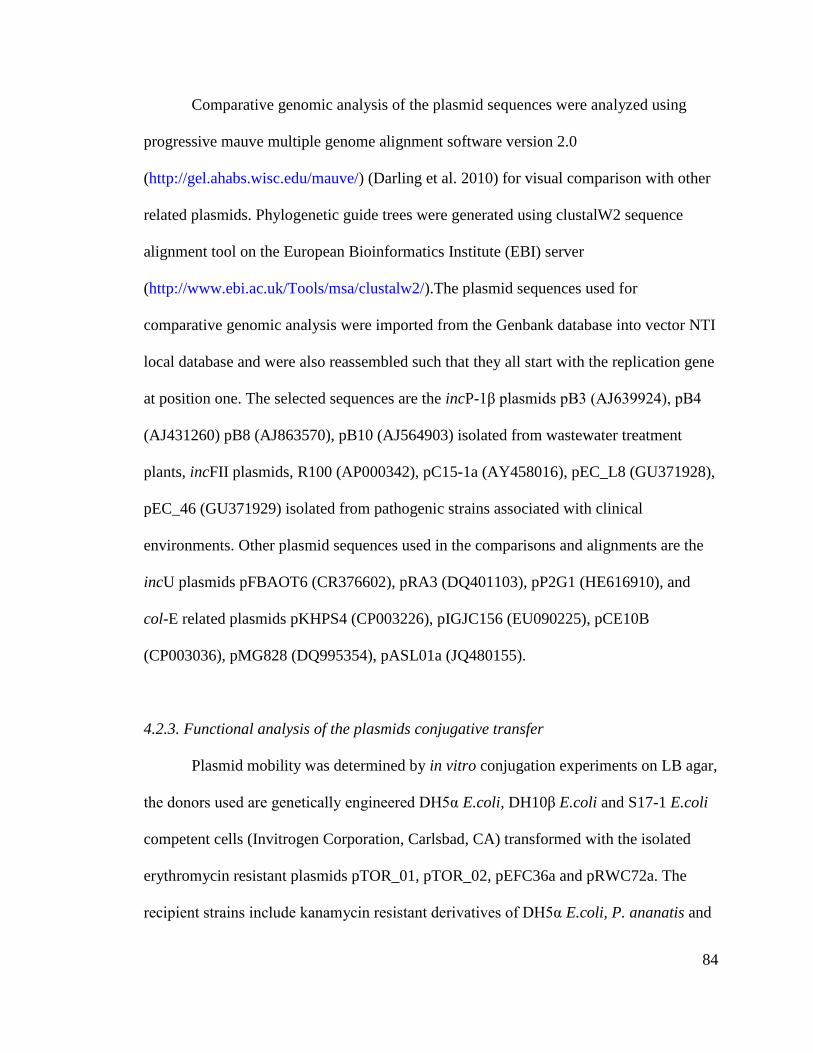
4.1. Introduction………………………………………………………………………...73
4.2. Materials and methods……………………………………………………….……75
4.2.1. Plasmids isolation and DNA sequencing
4.2.2. Comparative genomic analysis and sequence alignments
4.2.3. Functional analysis of the plasmids conjugative transfer
4.2.4. Plasmid stability assays
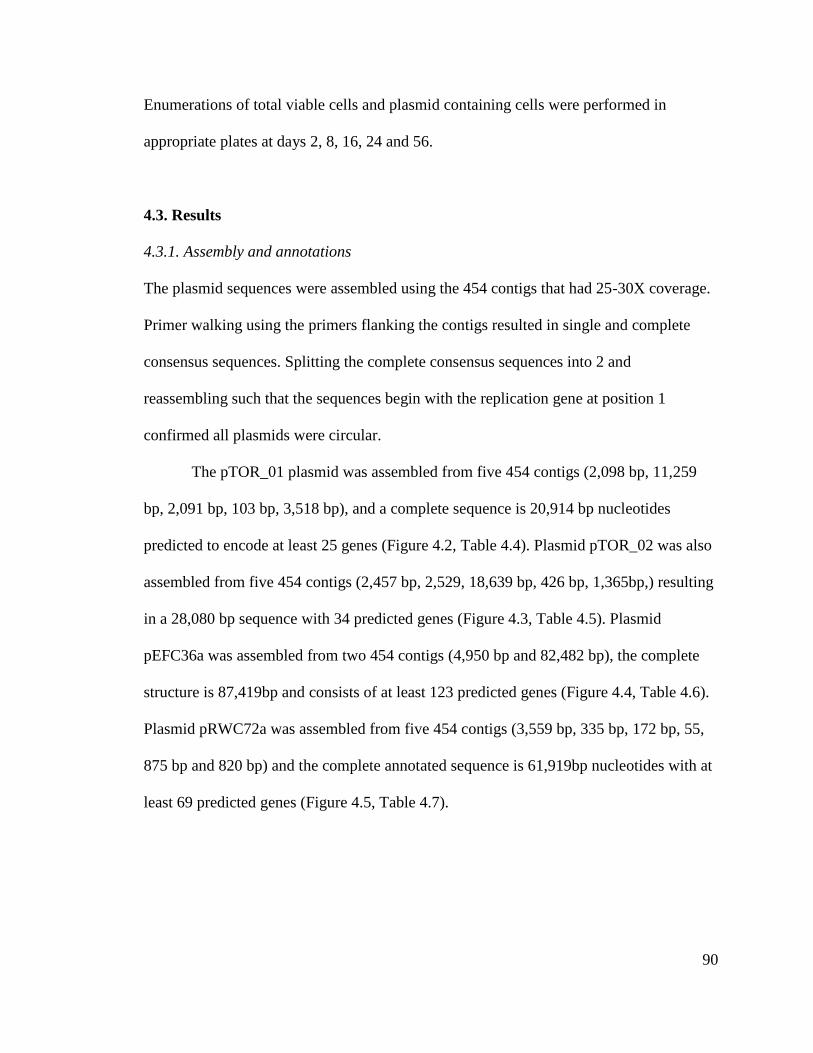
4.3. Results…………………………………………………………………………...….90
4.3.1. Assembly and annotations
4.3.2. Plasmids replication and comparative analyses
4.3.3. Plasmids’ predicted conjugative transfer genes
4.3.4. Plasmid stability and addiction systems
4.3.5. Plasmids’ conjugative transfer in different bacterial species
4.3.6. Plasmid stability in bacteria growing in the absence of antibiotic selection
4.3.7. Characterization of plasmids antibiotic resistance and resistance patterns
4.3.8. Comparative analyses of pTOR_02 and pEFC36a Tn21 multiple resistance
transposons
4.3.9. Analysis of IS elements predicted for pEFC36a Tn21 transposition
4.3.10. Analysis of pRWC72a disrupted class 1 integrase element and resistance
genes
Page 11
ix
4.4. Discussion……………………….………………………………………………135
4.4.1. Wastewater influent provides an environment for plasmid diversification by
recombination of mobile elements
4.4.2. Possible persistence of plasmids in environmental bacterial hosts in the abscence
of antibiotic selection
4.5. Literature cited……………………………………………………………………138
CHAPTER 5 – ANALYSIS, DETECTION AND QUANTIFICATION OF
ANTIBIOTIC RESISTANCE DETERMINANTS FROM THE REGINA
WASTEWATER TREATMENT PLANT IN THE ENVIRONMENT
5.1. Introduction…………………………………………………………………….....151
5.2. Materials and methods………………………………………………………...…153
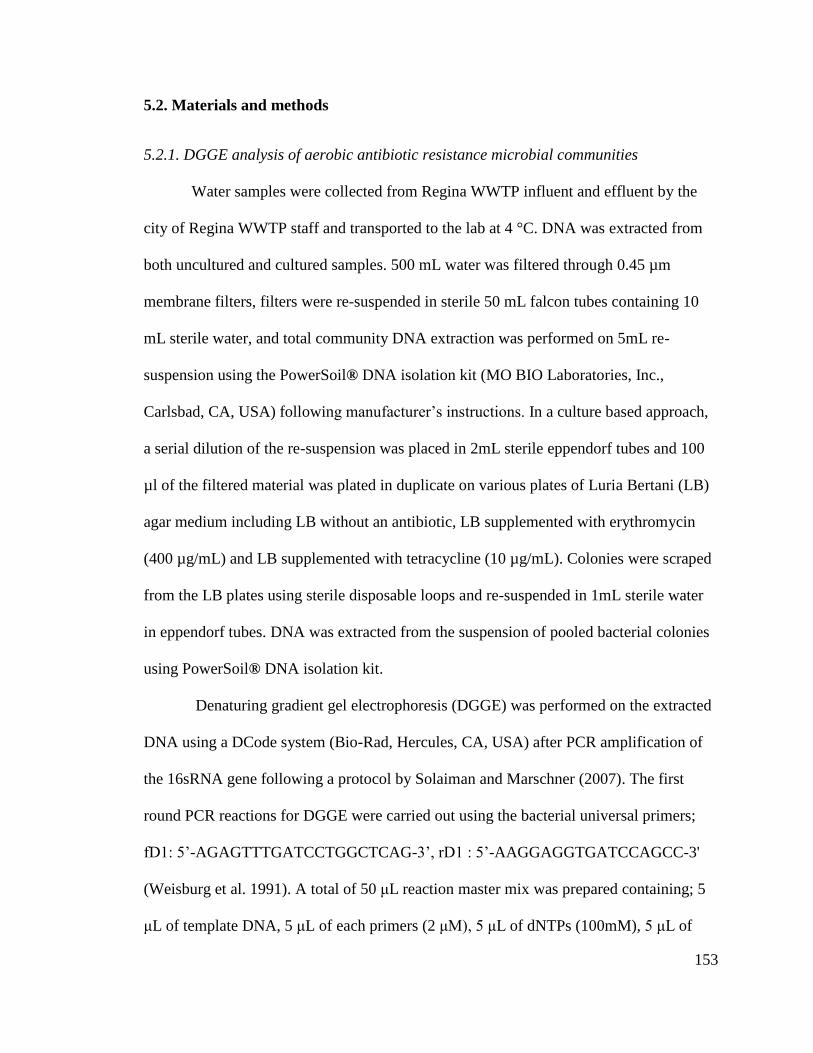
5.2.1. DGGE analysis of aerobic antibiotic resistance microbial communities
5.2.2. Sampling sites and descriptions
5.2.3. Total community DNA and plasmid DNA isolation
5.2.4. PCR amplifications of plasmid replicons and antibiotic resistance genes
5.2.5. Primer designs and descriptions
5.2.6. Quantification of class 1 integrase and bacterial 16s rRNA genes
5.3. Results……………………………………………………………………………..166
5.3.1. Analysis of antibiotic resistant bacterial communities
5.3.2. Detection of plasmid replicons and resistance genes in the environment
5.3.3. Quantification of class 1 integron and bacteria in the environment
5.4. Discussion....……………………………………………………………………....181
5.5. Literature cited……………………………………………………………………185
Page 12
x
CHAPTER 6 – GENERAL SUMMARY
6.1. General conclusion………………………………………………………………..193
6.2. Future directions…………………………………………………………….……196
6.3. Literature cited……………………………………………………………………198
Page 13
xi
LIST OF TABLES
Table Page
CHAPTER 2
Table 2.1: Prevalence of oxacillin resistant bacteria, S. aureus and MRSA on computer
keyboards...........................................................................................................................23
Table 2.2: Antibiotic resistance profile of the CA-MRSA lum-1 isolated from HS#1
computer keyboard.............................................................................................................25
CHAPTER 3
Table 3.1: Description of PCR primer pairs designed for this study.................................49
Table 3.2: A completely annotated 22,102 bp nucleotide sequence of a multiple resistance
and mobilizable plasmid pMC2.........................................................................................53
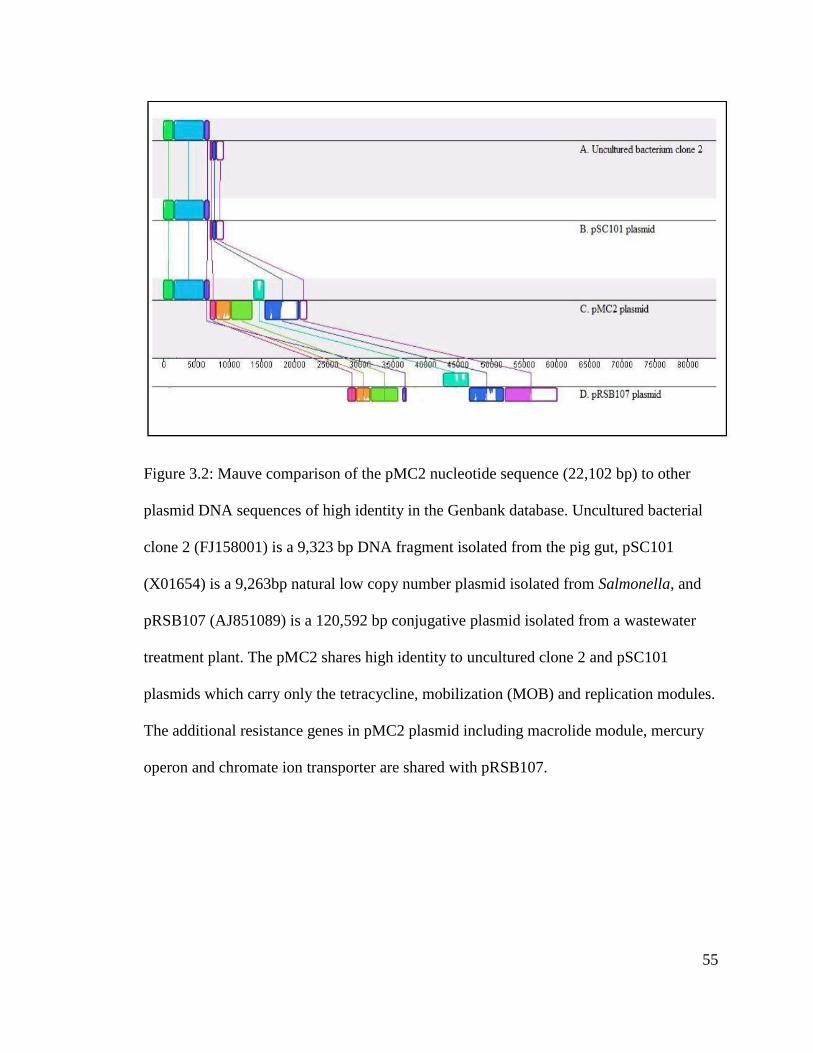
Table 3.3: PCR amplification of target sequences in selected soil DNA samples collected
at different times and locations following addition of the swine manure..........................59
CHAPTER 4
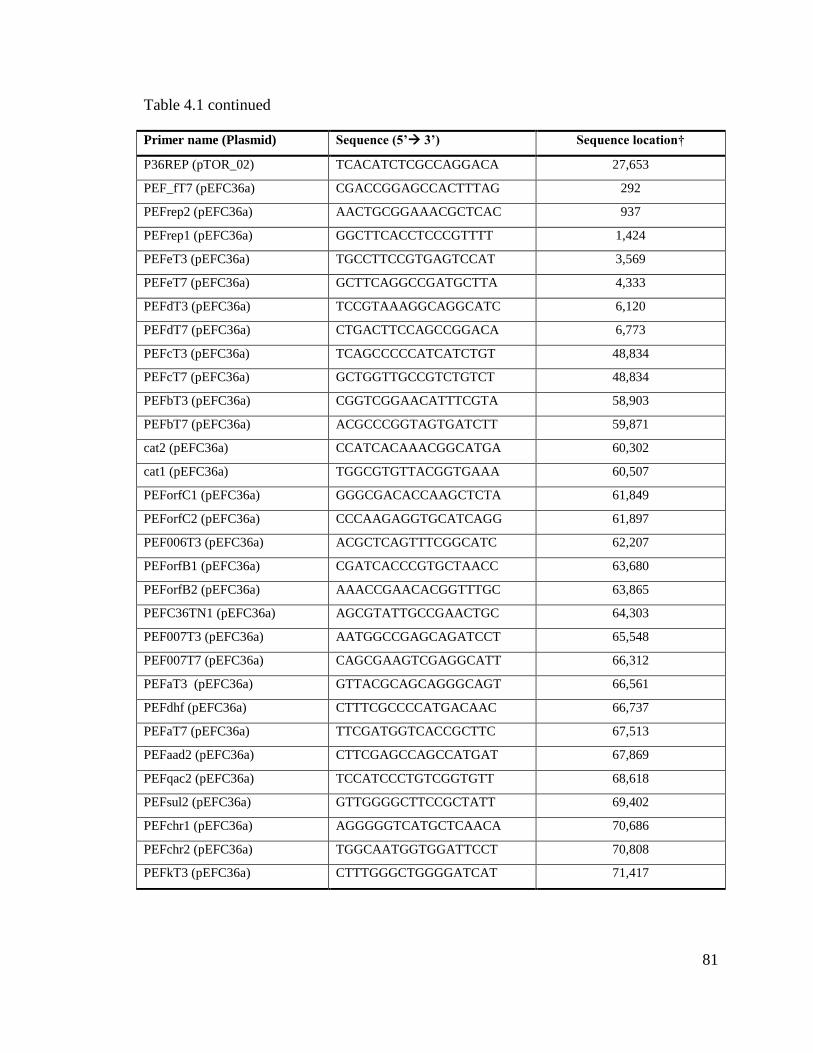
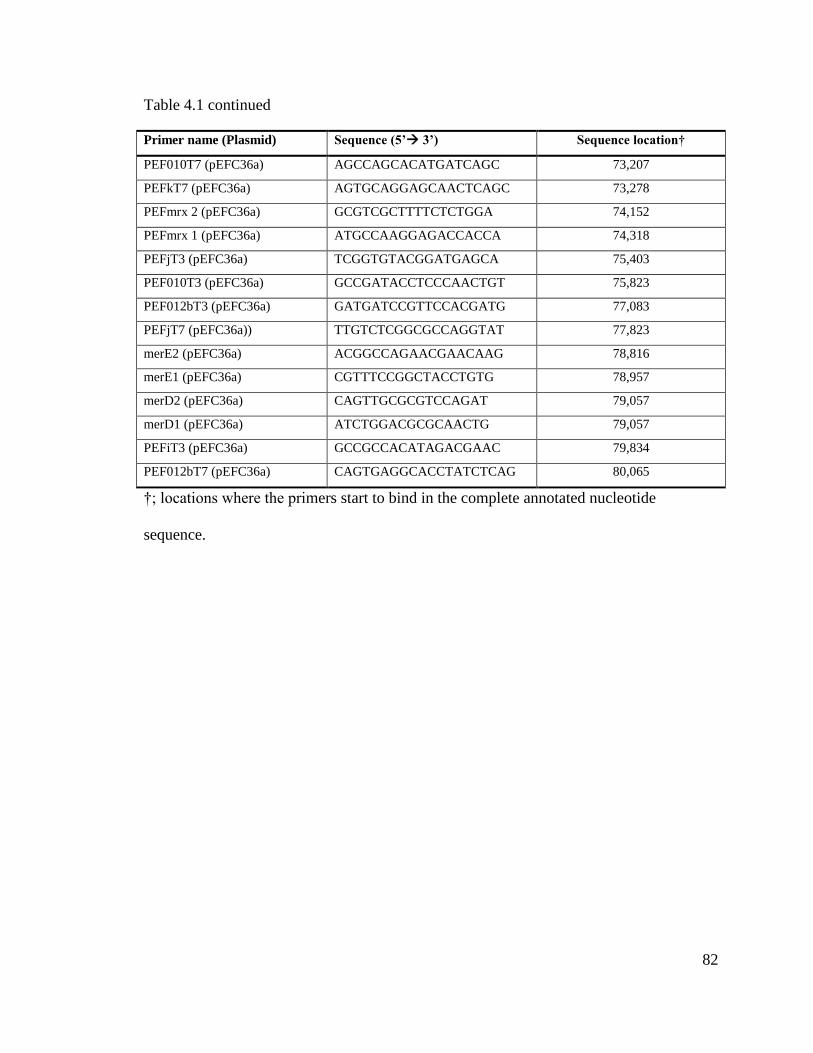
Table 4.1: Primers used for primer walking and mapping the plasmids………………...79
Table 4.2: Characteristics of bacteria and plasmids used in the conjugation study……...86
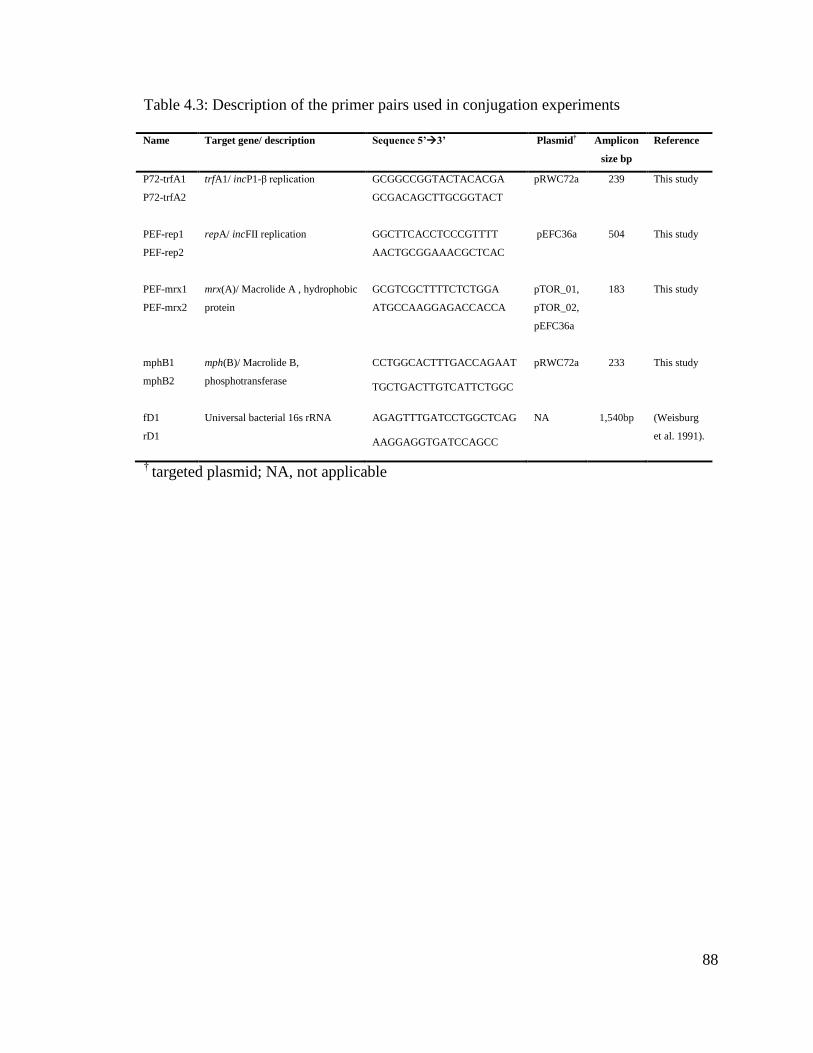
Table 4.3: Description of the primer pairs used in conjugation experiments…………....88
Page 14
xii
Table 4.4: Annotation of plasmid pTOR_01 complete sequence…………...…….……..92
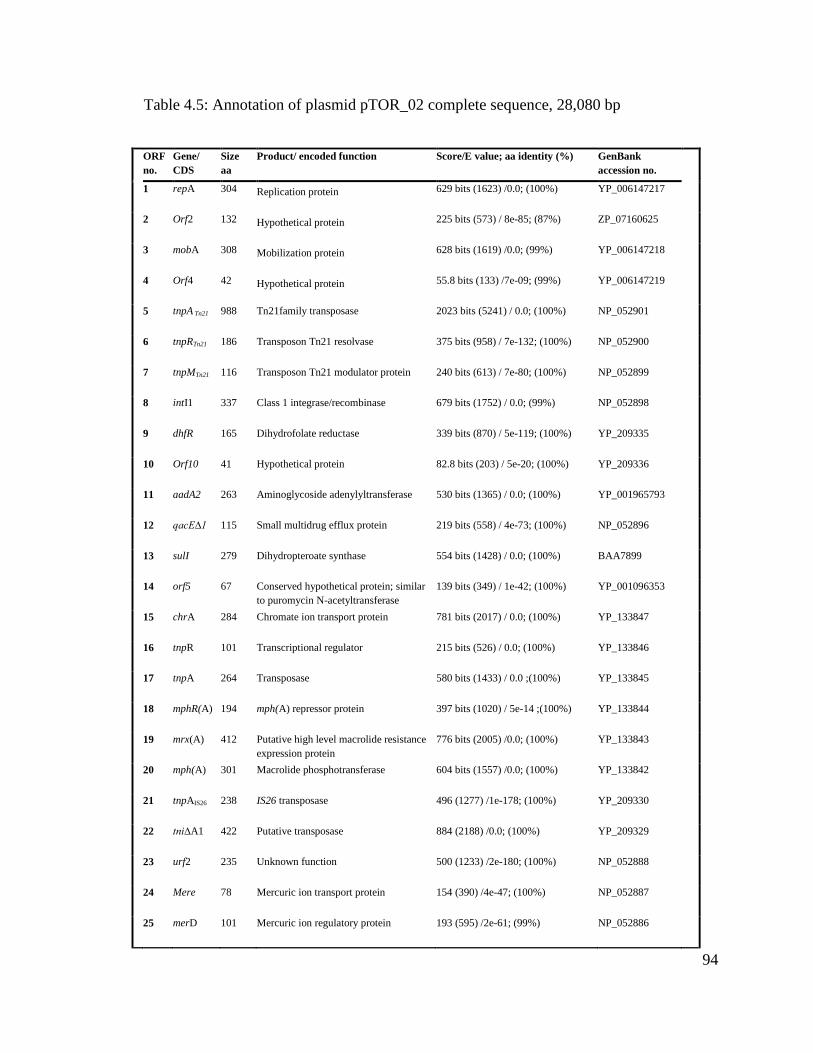
Table 4.5: Annotation of plasmid pTOR_02 complete sequence…………......................94
Table 4.6: Annotation of multiple resistance plasmid pEFC36a complete sequence........97
Table 4.7: Annotation of multiple resistance plasmid pRWC72a complete sequence....103
Table 4.8: Summary characterization and comparison of plasmid backbones and
accessory genes................................................................................................................106
Table 4.9: Frequency of conjugal transfer of the plasmids in various bacteria………...118
Table 4.10: Summary of antibiotic resistance patterns expressed by the different
plasmids…………………………………………………………………………...……128
CHAPTER 5
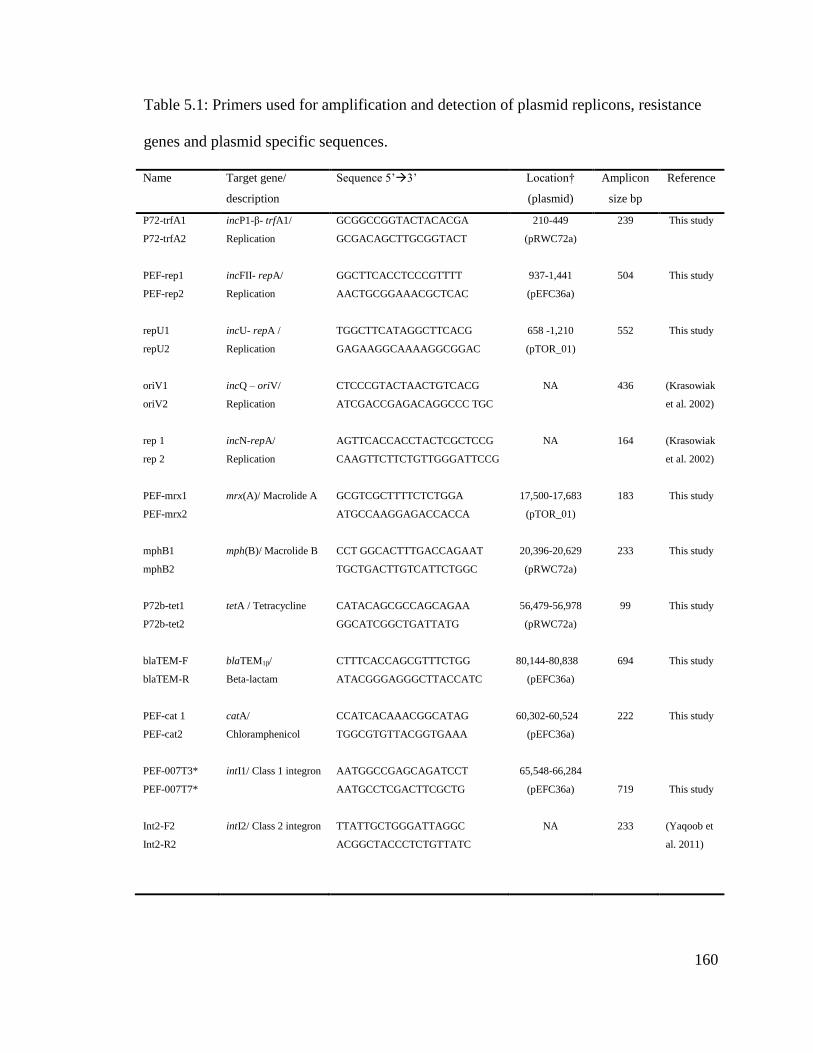
Table 5.1: Primers used for amplification and detection of plasmid replicons, resistance
genes and plasmid specific sequences.............................................................................160
Table 5.2: Quantitative PCR primers and probes for quantification of class 1 integrase
and bacteria 16s rRNA genes……………………………………………………….......165
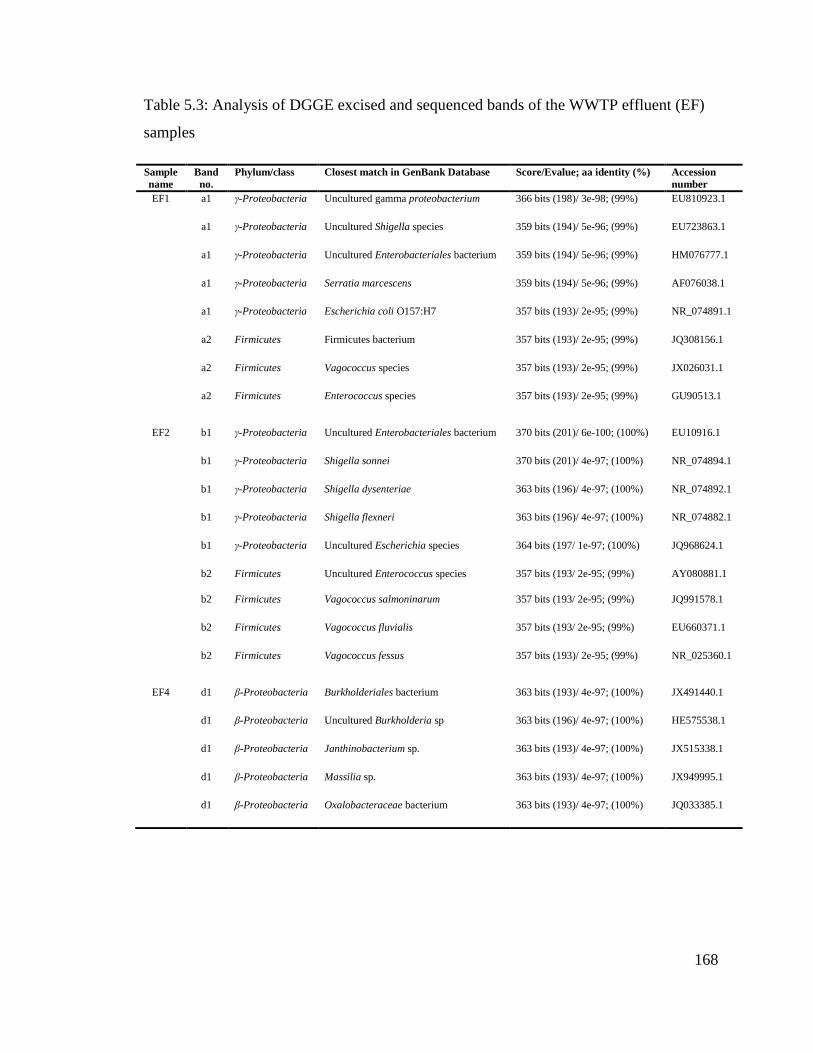
Table 5.3: Analysis of DGGE excised and sequenced bands of the WWTP effluent (EF)
samples.............................................................................................................................168
Table 5.4: Summary showing amplifications of target genes; integrons and antibiotic
resistance genes by PCR at different sites upstream and downstream the WWTP.........170
Page 15
xiii
Table 5.5: Summary showing amplifications of target genes; plasmid replicons and
specific sequences by PCR at different sites upstream and downstream the WWTP.....171
Page 16
xiv
LIST OF FIGURES
Figure Page
CHAPTER 2
Figure 2.1: Gel electrophoresis picture showing detection of MRSA isolate (Lum 1) by
duplex PCR amplification of femB (651 bp) and mecA (310 bp) genes………………...24
Figure 2.2: PFGE fingerprint Comparison between UR-1 (University of Regina isolate)
and the ten Canadian epidemic strains...............................................................................27
Figure 2.3: PFGE fingerprint comparison of UR-1 with related PFGE patterns found in
the Canadian Nosocomial Infections Surveillance Program (CNISP) database................28
Figure 2.4: Survival of Staphylococcus strains on keyboard keys as determined by viable
plate counts........................................................................................................................29
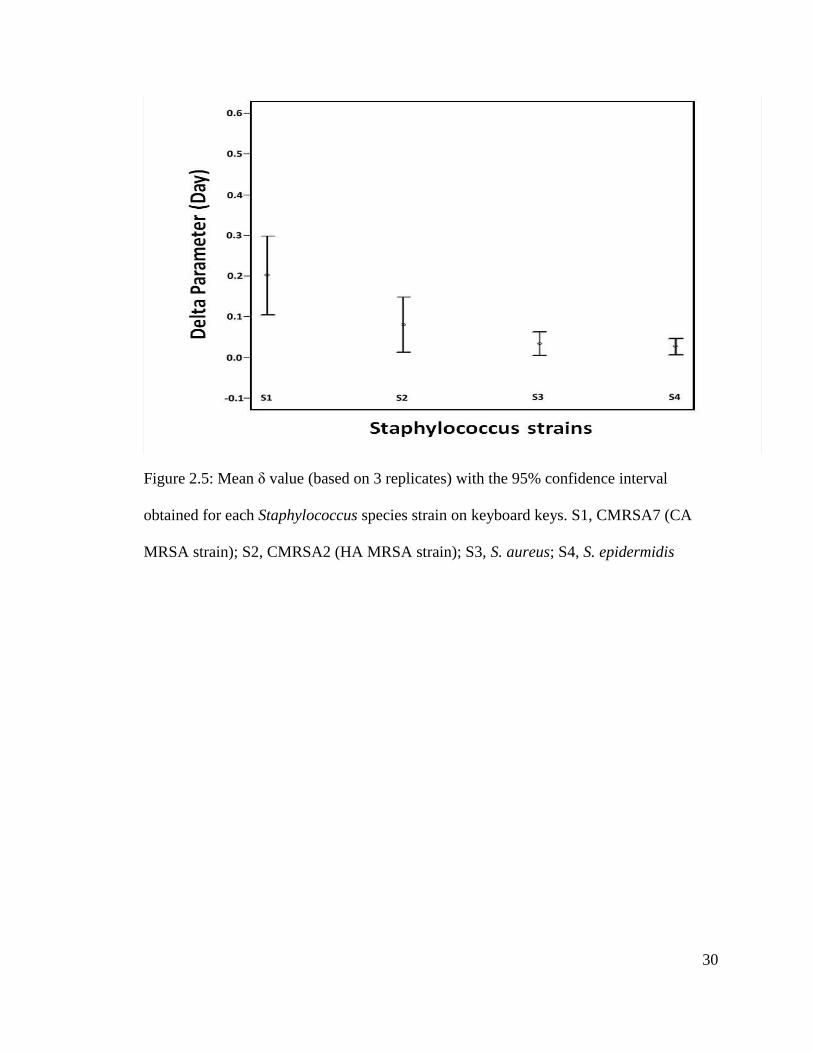
Figure 2.5: Mean δ value (based on 3 replicates) with the 95% confidence interval
obtained for each Staphylococcus species strain on keyboard keys..................................30
CHAPTER 3
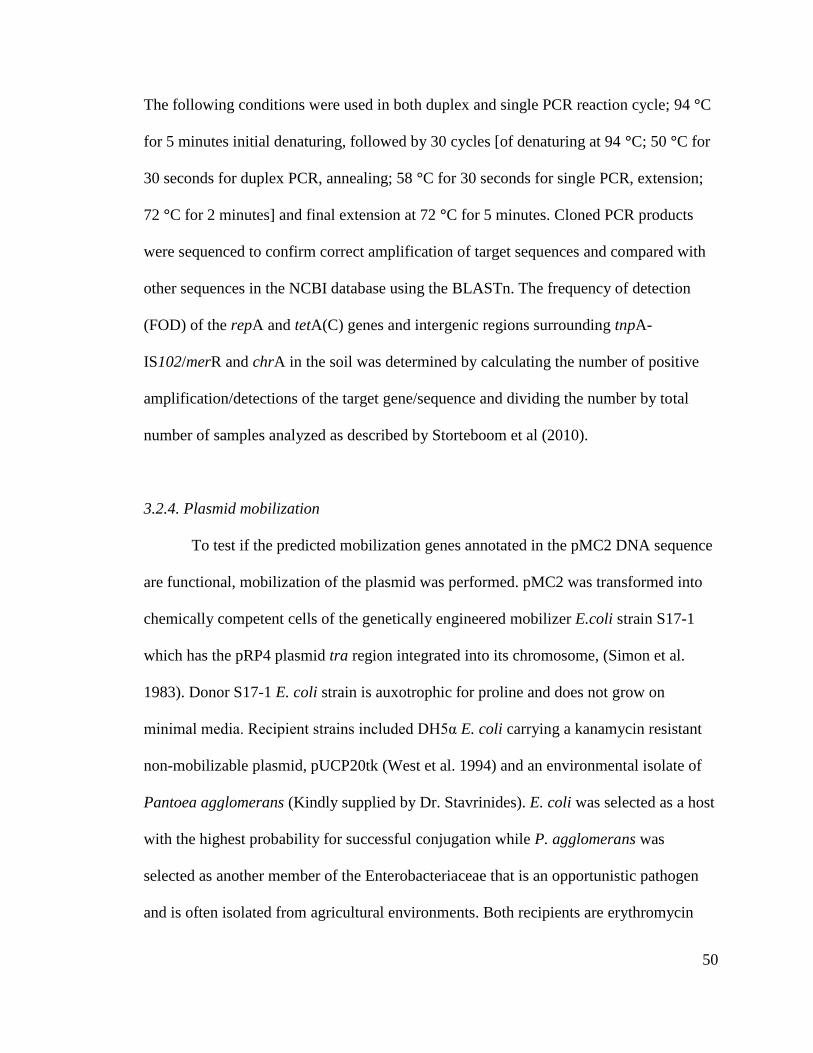
Figure 3.1: A physical map of a mobilizable plasmid pMC2, showing the genetic
organization and structure of the plasmid..........................................................................52
Page 17
xv
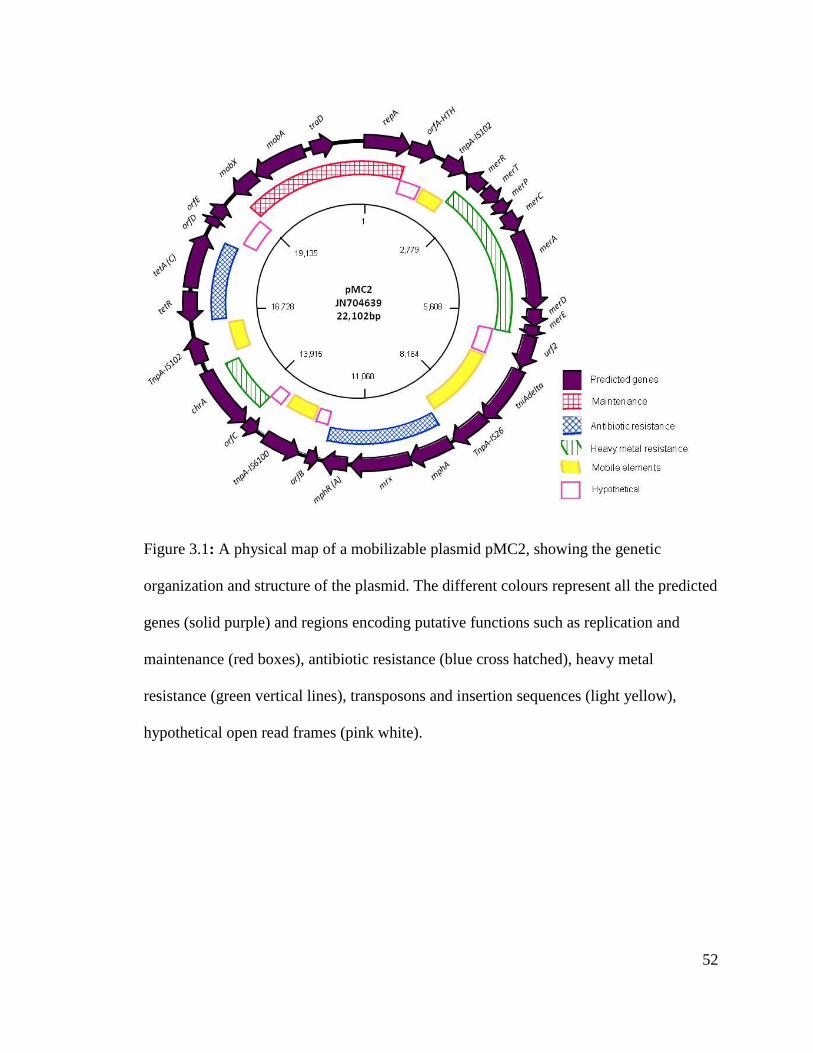
Figure 3.2: Mauve comparison of the pMC2 nucleotide sequence (22,102 bp) to other
plasmid DNA sequences of high identity in the Genbank database..................................55
Figure 3.3: Genetic organization of the pMC2 resistance region and conjugative
mobilization (MOB) region...............................................................................................57
Figure 3.4: Gel electrophoresis picture showing examples from PCR amplification of soil
DNA...................................................................................................................................60
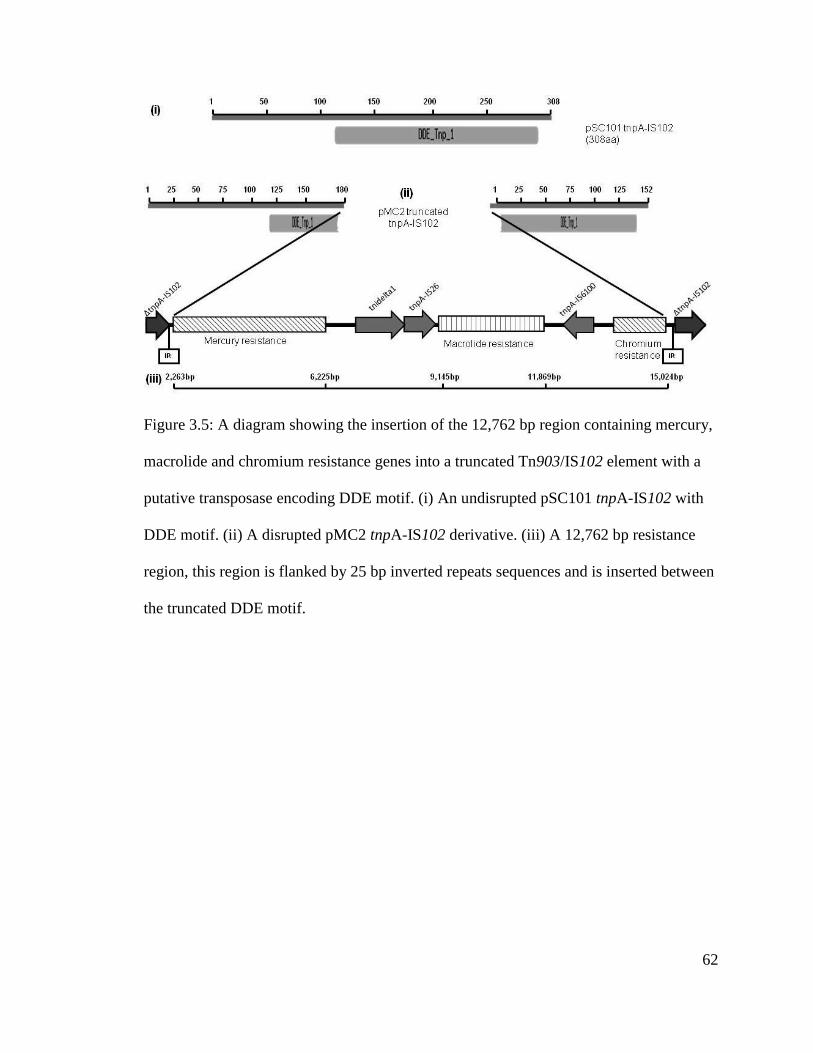
Figure 3.5: A diagram showing the insertion of the 12,762 bp region containing mercury,
macrolide and chromium resistance genes into a truncated Tn903/IS102 element with a
putative transposase encoding DDE motif.........................................................................62
CHAPTER 4
Figure 4.1 (A): Diagram showing a primer walking strategy used in closing the gaps
between the contigs (Grey bars) obtained from 454 sequencing (>25X sequence
coverage). Plasmid pTOR_01 (Top) was assembled from 5 contigs (A; 2,098 bp, B; 11,
259 bp, C; 2,091 bp, D; 103 bp and E; 3,518 bp). Plasmid pTOR_02 (Bottom) was
assembled from 5 contigs (A; 2,457 bp, B; 2,529, C; 18,639 bp, D; 426 bp and E;
1,365bp).............................................................................................................................77
Page 18
xvi
Figure 4.1 (B): Diagram showing a primer walking strategy used in closing the gaps
between the contigs (Grey bars) obtained from 454 sequencing (>25X sequence
coverage). Plasmid pEFC36a (Top) was assembled from two 454 contigs (4,950 bp and
82,482 bp). Plasmid pRWC72a (Bottom) was assembled from five 454 contigs (3,559 bp,
335 bp, 172 bp, 55, 875 bp and 820 bp)............................................................................78
Figure 4.2: Visual map of multiple resistance plasmid (a) pTOR_01 (20,914 bp) isolated
from the WWTP influent showing mosaic features of resistance genes inserted in plasmid
genetic backbones. ............................................................................................................91
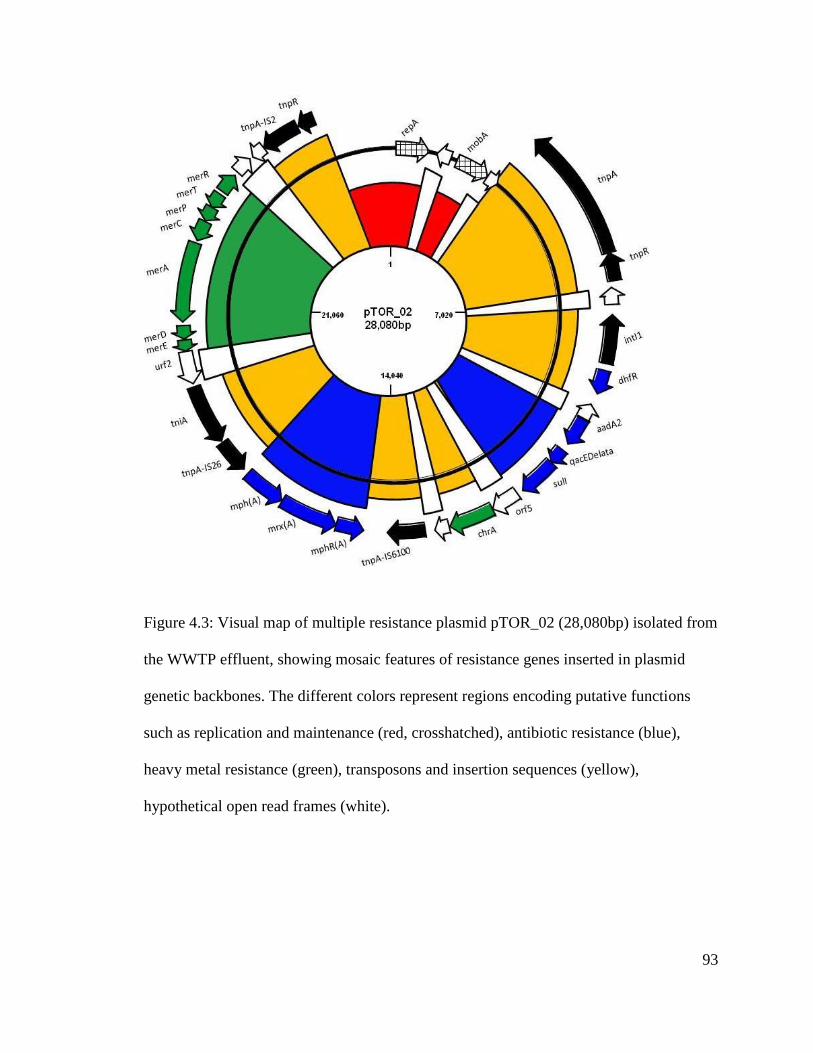
Figure 4.3: Visual map of multiple resistance plasmid pTOR_02 (28,080bp) isolated from
the WWTP effluent, showing mosaic features of resistance genes inserted in plasmid
genetic backbones..............................................................................................................93
Figure 4.4: Visual map of multiple resistance plasmid pEFC36a (87,419bp) isolated from
the WWTP effluent, showing mosaic features of resistance genes inserted in plasmid
genetic backbones..............................................................................................................96
Figure 4.5: Visual map of multiple resistance plasmid pRWC72a (61,919bp), showing
mosaic features of resistance genes inserted in plasmid genetic backbones...................102
Page 19
xvii
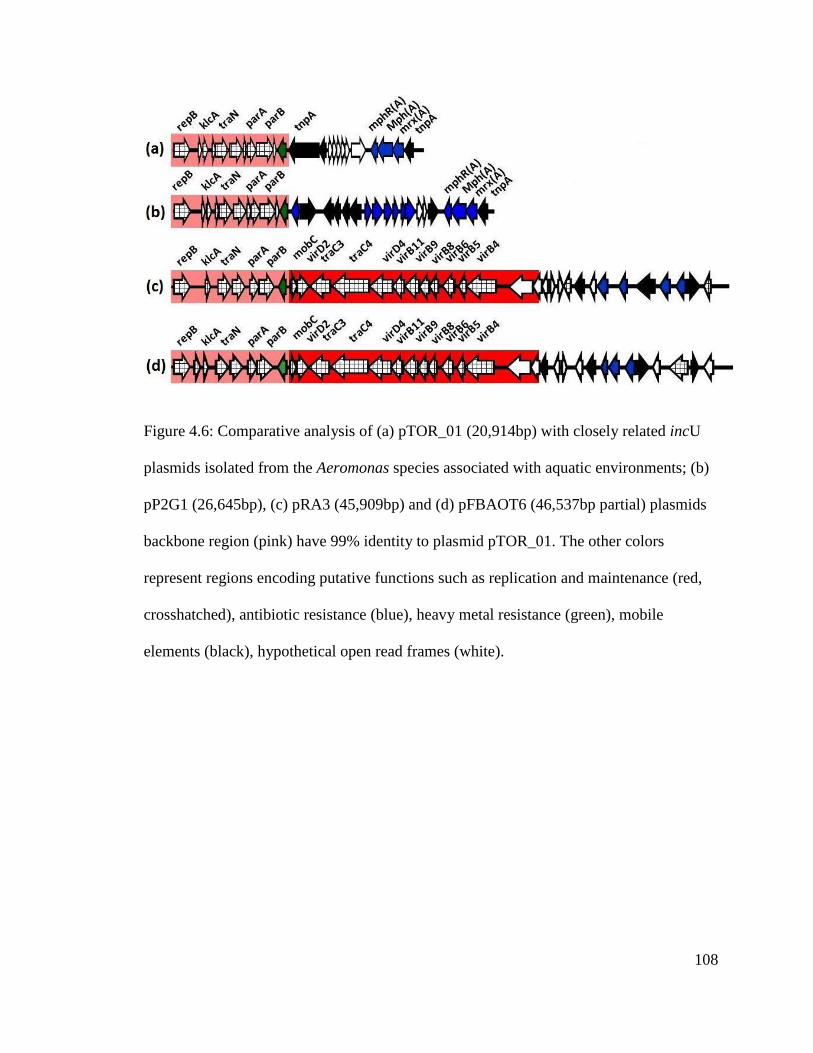
Figure 4.6: Comparative analysis of (a) pTOR_01 (20,914bp) with closely related incU
plasmids isolated from the Aeromonas species associated with aquatic environments; (b)
pP2G1 (26,645bp), (c) pRA3 (45,909bp) and (d) pFBAOT6 (46,537bp partial)............108
Figure 4.7: Comparative analysis of related col-E plasmids (a) pKHPS4 (3,751bp), (b)
pIGJC156 (5,146bp), (c) pCE10B (5,163bp), (d) pMG828 (7,462bp), (e) pASL01a
(27,072bp) isolated from different E.coli strains with (f) pTOR_02 (28,080bp)............110
Figure 4.8: Comparative genomic analysis of pEFC36a by mauve alignment, showing
evolutionary relationships with other incFII plasmids isolated from clinical
environments……………………………………………………………………………111
Figure 4.9: Comparative genomic analysis of pRWC72a by mauve alignment showing
evolutionary relationships with other incP-1β plasmids isolated from the wastewater
treatment plant.................................................................................................................112
Figure 4.10: Conjugation transfer frequencies of plasmids in E.coli and Pantoea
strains…………………………………………………………………………………...119
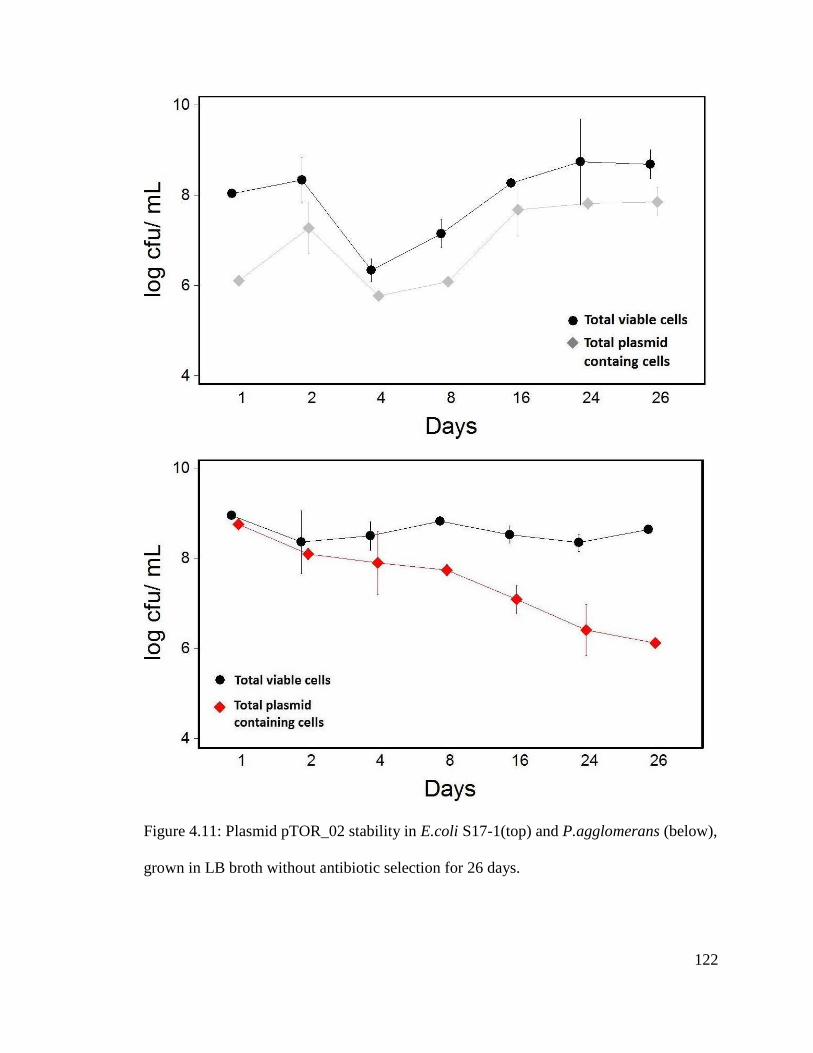
Figure 4.11: Plasmid pTOR_02 stability in E.coli S17-1(top) and P.agglomerans (below),
grown in LB broth without antibiotic selection for 26 days............................................122
Page 20
xviii
Figure 4.12: Plasmid pTOR_01 stability in E. coli S17-1 sub-cultured in LB broth
without antibiotic selection for 26 days...........................................................................123
Figure 4.13: Plasmid pEFC36a stability in E. coli DH5α (top) and P. agglomerans
(below), sub-cultured in LB broth without antibiotic selection for 26 days....................124
Figure 4.14: Plasmid pRWC72a stability in E.coli DH5α (top) and P.agglomerans
(below), sub-cultured in LB broth without antibiotic selection for 26 days....................125
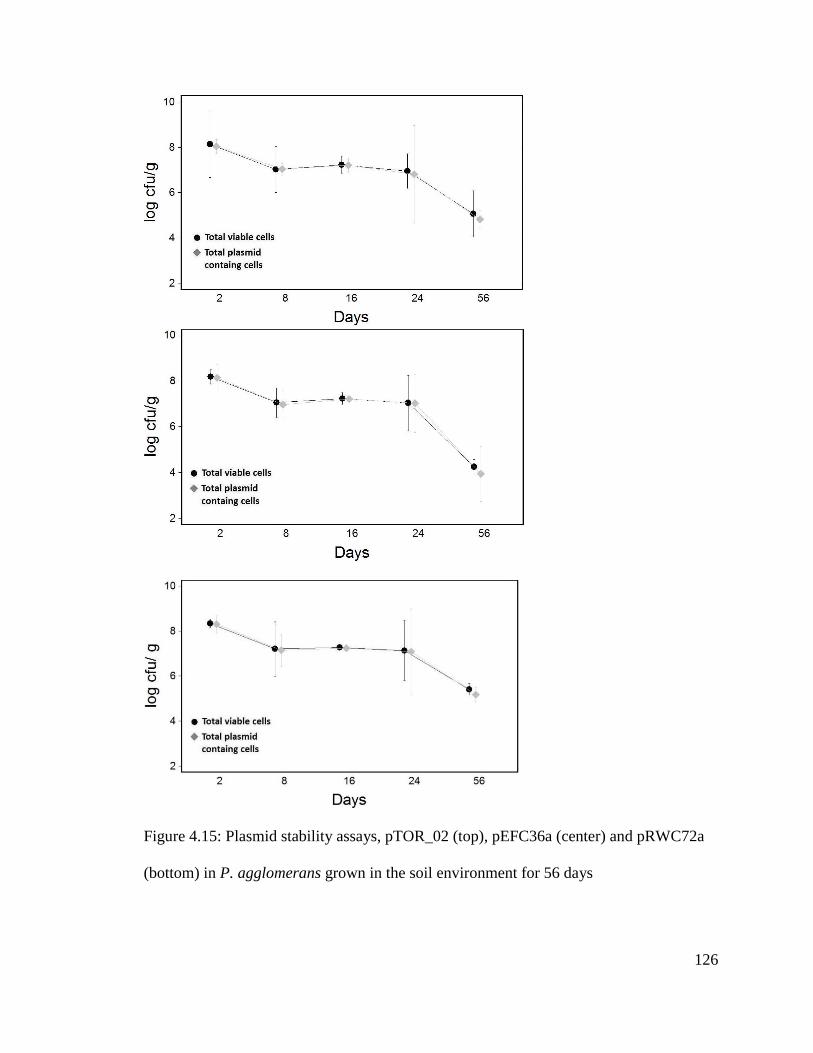
Figure 4.15: Plasmid stability assays, pTOR_02 (top), pEFC36a (center) and pRWC72a
(bottom) in P. agglomerans grown in the soil environment for 56 days.........................126
Figure 4.16: Comparative analysis of the macrolide resistance gene clusters (blue) carried
in mobile elements (black). Plasmid pRSB111(a) isolated from WWTP and pRWC72a
(b) carry similar macrolide B resistance gene cluster. The macrolide A resistance gene
cluster is found in plasmids pMC2 (c) isolated from swine manure, pTOR_02 (d),
pEFC36a (e) and pTOR_01(f)........................................................................................129
Figure 4.17: A comparative analysis by mauve alignment showing similarities in the
Tn21 multiple resistance transposons derivatives from various erythromycin resistance
plasmids; (a) pMC2, (b)pTOR_02, (c) pEFC36a, (d) TnSF1 Shigella flexineri
chromosome.....................................................................................................................131
Page 21
xix
Figure 4.18: A diagram of plasmid pEFC36a Tn21 multiple resistance transposon,
highlighting areas missing the IS elements flanking the region......................................133
CHAPTER 5
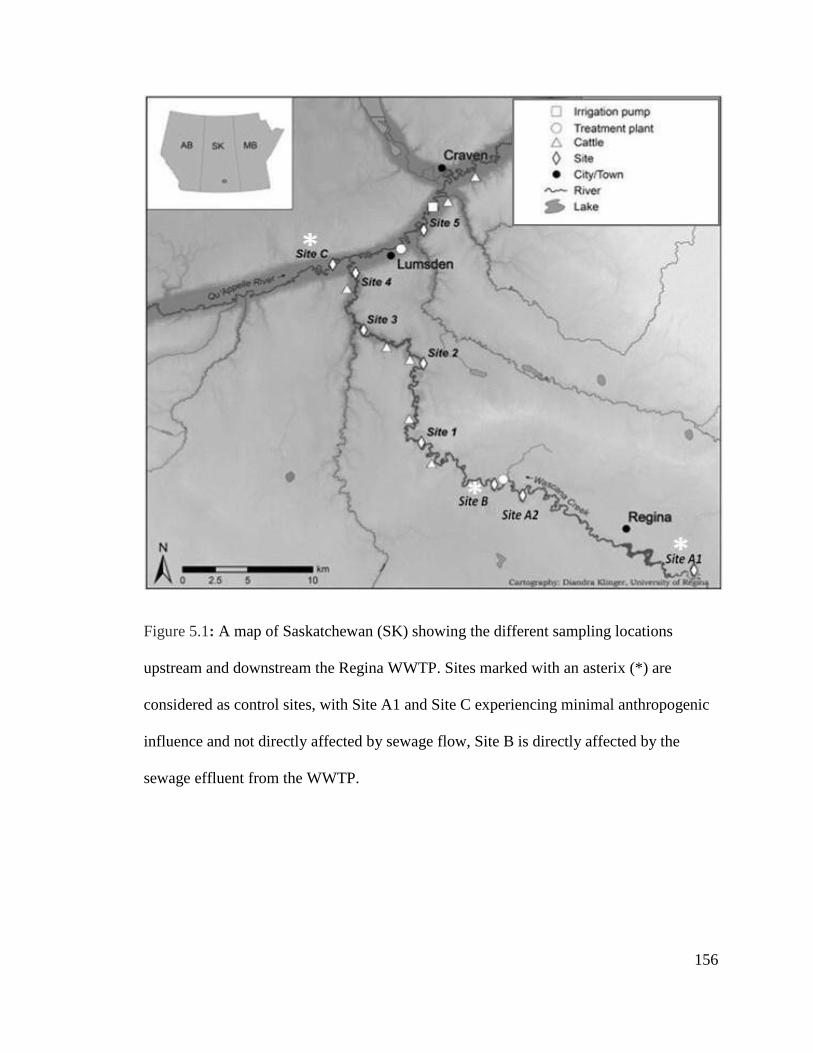
Figure 5.1: A map of Saskatchewan (SK) showing the different sampling locations
upstream and downstream the Regina WWTP................................................................156
Figure 5.2: Diagram showing the primer binding sites at the different regions within the
sequences of plasmids (A) pTOR_01, (B) pEFC36a and (C) pRWC72a........................162
Figure 5.3: Diagram showing the primer binding sites at the different regions within the
sequence of plasmid pEFC36a.........................................................................................163
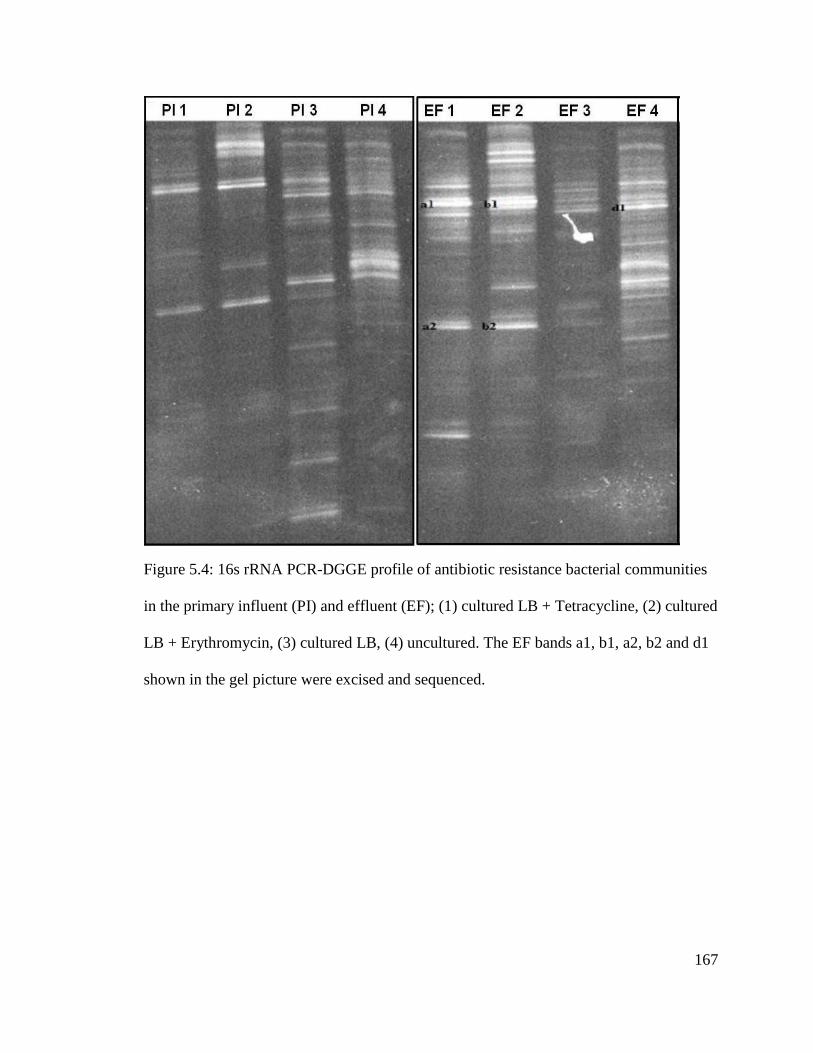
Figure 5.4: 16s rRNA PCR-DGGE profile of antibiotic resistance bacterial communities
in the primary influent (PI) and effluent (EF)..................................................................167
Figure 5.5: Gel electrophoresis picture showing positive amplification of the merR/pemK
region associated with pEFC36a plasmid sequence........................................................172
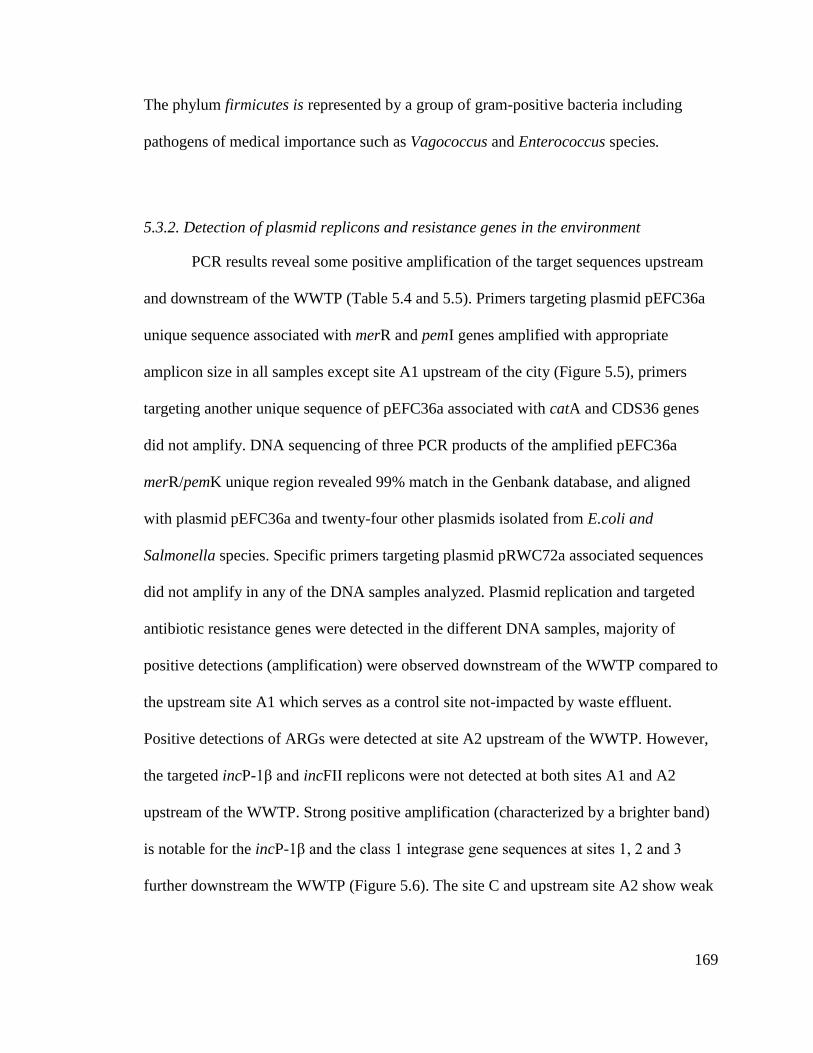
Figure 5.6: Gel electrophoresis picture showing strong positive amplification of the
incP1-β (top) and class 1 integrase (bottom) genes at sites 2 and 3 downstream the
WWTP.............................................................................................................................173
Page 22
xx
Figure 5.7: The Occurrence of plasmids incP-1β, incFII, incU and the class 1 integron
genes upstream and downstream in transformed E. coli competent cells selected for
erythromycin resistance...................................................................................................175
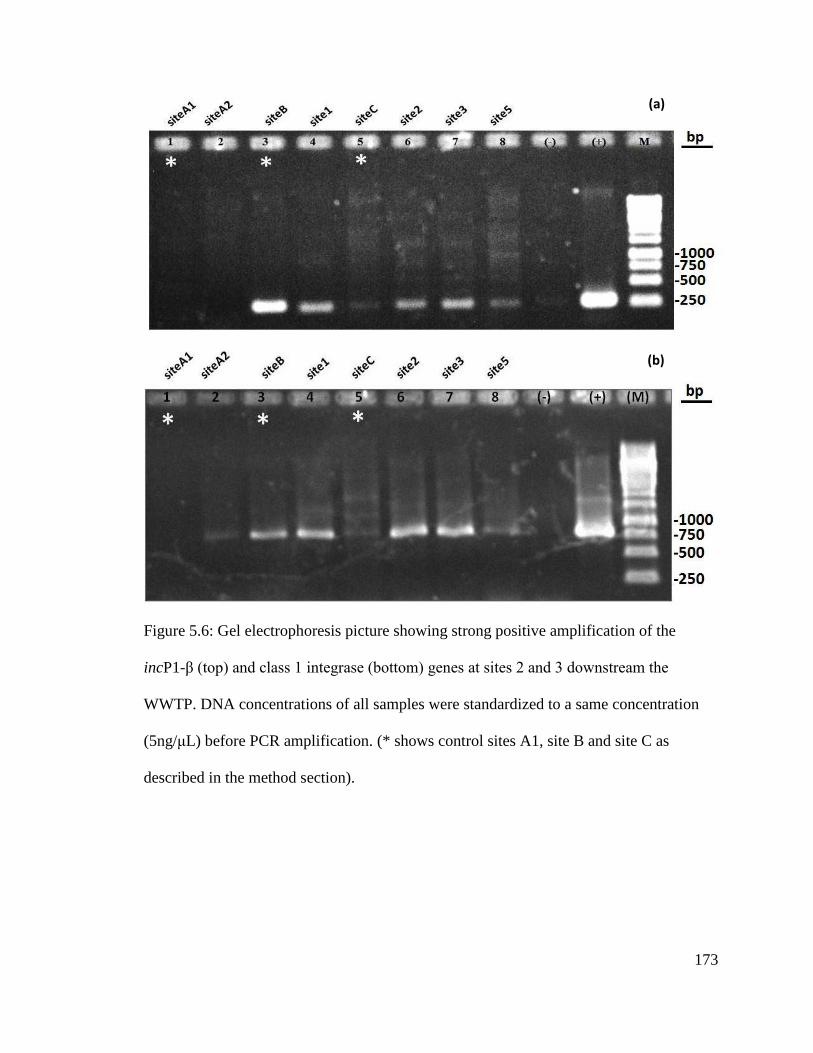
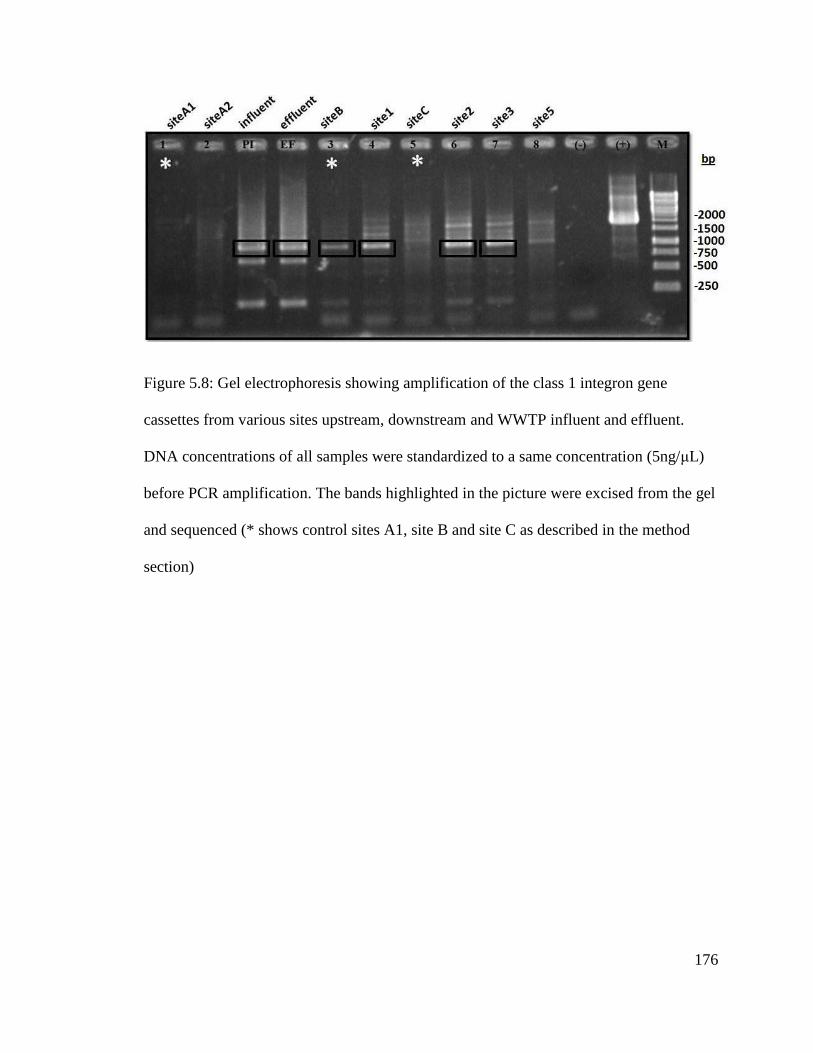
Figure 5.8: Gel electrophoresis showing amplification of the class 1 integron gene
cassettes from various sites upstream, downstream and WWTP influent and effluent...176
Figure 5.9: Average absolute quantification of 16s rRNA and class 1-integrase genes
upstream (site A1, A2 and C) and downstream (site B,1,2,3 and 5) of the WWTP…....178
Figure 5.10: Absolute quantification of the bacterial 16s rRNA and the class 1-integrase
genes at different sites upstream and downstream of the WWTP……………………...179
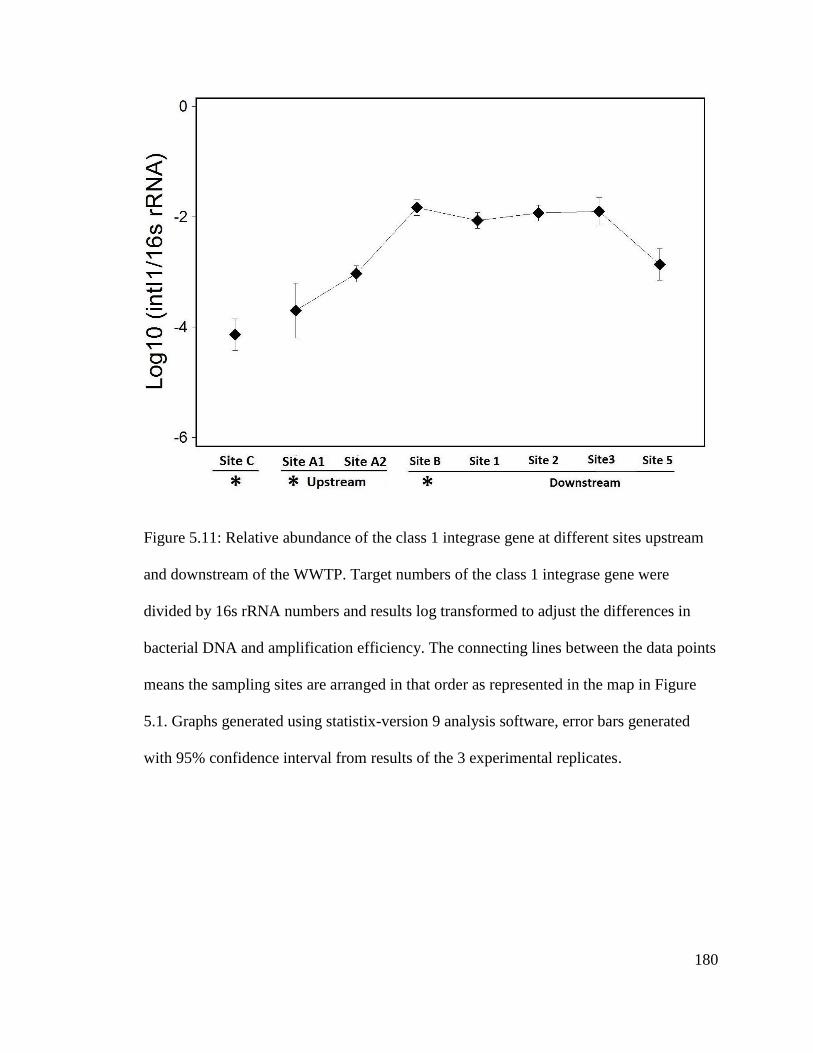
Figure 5.11: Relative abundance of the class 1 integrase gene at different sites upstream
and downstream of the WWTP……………………………...……………………….…180
Page 23
xxi
LIST OF ABBREVIATIONS, SYMBOLS, NOMENCLATURE
ARB antibiotic resistance bacteria
ARG antibiotic resistance gene
ARP antibiotic resistance plasmid
BHR broad host range
bp basepair
CA-MRSA community associated MRSA
CoNS coagulase negative Staphylococcus
DGGE denaturing gradient gel electrophoresis
DNA deoxyribonucleic acid
FOD frequency of detection
HA-MRSA hospital associated MRSA
HGT horizontal gene transfer
HS#1 High school number 1
HS#2 High school number 2
Inc incompatibility
kb kilo base
LB Luria-Bertani
MGE mobile genetic element
mob mobilization gene
MOB core mobilization unit
MRSA methicillin resistant Staphylococcus aureus
Page 24
xxii
MRSE methicillin resistant Staphylococcus epidermidis
MRSH methicillin resistant Staphylococcus haemolyticus.
MWWTP municipal wastewater treatment plant
NHR narrow host range
ORFs open reading frames
PCR polymerase chain reaction
PFGE Pulse field gel electrophoresis
PVL Panton-Valentine Leukocidin
rep replication gene
tra conjugative transfer gene
WWTP wastewater treatment plant
VMM Vincent’s minimal medium
Page 25
1
CHAPTER 1. GENERAL INTRODUCTION
1.1. Introduction
Bacterial infections remain a leading cause of human mortality globally, in part
due to lack of sanitary infrastructure. However, even in regions with adequate sanitary
infrastructure, the emergence of multi-drug resistance in pathogens has created new
problems in healthcare as infections that were easily treated are now difficult to treat.
Many bacteria are implicated in endemics and pandemics such as tuberculosis, influenza,
pneumonia, diarrhea, and frequently cause problems in the compromised patients
undergoing surgery or with HIV/AIDS. These infections and many others linked to high
mortality in human and animals can be associated with multi-drug resistant (MDR)
bacteria (also referred to as superbugs) (Alanis, 2005; Nseir et al., 2006). The common
MDR bacteria include gram-positive bacteria; Staphylococcus aureus, Streptococcus
pneumoniae, Clostridium difficile and Enterococcus species, MDR and extensively-drug
resistant (XDR) Mycobacterium tuberculosis. The MDR gram-negative bacteria include
Acinetobacter baumannii, Vibrio cholerae, Escherichia coli, Pseudomonas aeruginosa,
Klebsiella pneumoniae, Salmonella enterica and Enterobacter species. The world health
organization (WHO), the USA Center for Disease Control (CDC), and several research
laboratories have reported increasing rates of infections caused by MDR bacteria as well
as emergence of new antibiotic resistant pathogens in clinical environments (Pop-Vicas
and D'Agata, 2005; Davies and Davies, 2010; Kim et al., 2011). Multi-drug resistant
bacteria have also been isolated from non-clinical environments such as the human
Page 26
2
community, agriculture, and polluted water ecosytems (Furushita et al. 2005; Huang et al.
2007; Huijsdens et al. 2006; Martinez et al. 2009a).
Evolution of resistance in bacteria is caused by mutation of the existing genes
(also known as vertical evolution) and acquisition of resistance genes carried by mobile
genetic elements (horizontal gene transfer) (Martinez and Baquero 2000; Martinez 2009).
Antibiotic resistance genes encode mechanisms that make it impossible for an antibiotic
to serve its antimicrobial purpose. Different mechanisms of resistance affect different
classes of clinical antibiotics and other antimicrobials. For example, beta-lactams are
destroyed by mechanisms that produce enzyme beta-lactamase, which hydrolyses the
beta-lactam ring. The antimicrobial activity of macrolides, aminoglycosides and
glycopeptides antibiotics is prevented by modification of the antibiotic ribosomal binding
site, thus reducing its binding capacity. Genes encoding efflux pumps that expel the
antibiotic before it reaches the ribosomal target facilitate resistance to tetracyclines,
quinolones and quaternary ammonium compounds. (Davies and Davies 2010; Lupo et al.
2012). A combination of these mechanisms is common and associated with multi-drug
resistance in clinical pathogens (Walsh 2000).
Concurrent to a rise in antibiotic resistant bacterial infections, there has been a
substantial increase in the levels of organic and inorganic pollutants, including antibiotic
residues entering the environment (Moura et al., 2010). Excessive use of antibiotics in
clinical and agricultural settings has been generally acknowledged to promote and select
for antibiotic resistant bacterial populations (Aminov, 2009; Martinez, 2009a, b). The
recently developed Antibiotic Resistance Database (ARDB, http://ardb.cbcb.umd.edu/)
estimates there are over 13000 antibiotic resistance genes (ARGs) identified in greater
Page 27
3
than 600 genomes of antibiotic resistant bacteria (ARB) (Liu and Pop, 2009). Notably,
antibiotic resistance determinants found in potential pathogens comprised only a small
portion of the total ARGs surveyed (Davies and Davies, 2010), which implies that the
major reservoir for ARGs is in non-pathogenic environmental bacteria. This pool of
ARGs was recently termed the environmental antibiotic resistome (D'Costa et al., 2006;
Wright, 2007). In spite of the implications that this reservoir of resistance genes may
provide a pool of AR genes available to clinical pathogenic bacteria, the environmental
resistome has been relatively uncharacterized globally. A link between the environmental
antibiotic resistome and the increasing antibiotic resistance problem in clinical pathogens
seems plausible given the likely contact between clinical opportunistic pathogens, such as
Pseudomonas aeruginosa, Acinetobacter baumannii, Stenotrophomas maltophilia and
environmental microbes (Baquero et al., 2008; Martinez, 2009a, b). It is now established
that ARB and ARGs existed prior to widespread antibiotic use (Hall and Barlow, 2004;
Martinez, 2009a, b; Allen et al., 2010), however, the importance of the non-clinical
environment in the increase of antibiotic resistance to clinical pathogens remains unclear
(Martinez, 2009a; Davies and Davies, 2010). ARGs of clinical importance have been
detected in various environmental non-pathogenic bacteria (Heuer et al., 2002; Riesenfeld
et al., 2004; Ansari et al., 2008; Baquero et al., 2008; Martinez, 2009a, b; Zhang et al.,
2009). In several instances, the soil and water environments yielding significant
populations of antibiotic resistant environmental isolates are from sites impacted by
pollution resulting from a variety of activities, including antibiotics released with
wastewater effluent (Baquero et al., 2008; Martinez, 2009a, b; Allen et al., 2010).
Page 28
4
Antibiotic resistance genes carried in bacterial chromosomes and mobile genetic
elements have been suggested as potential emerging environmental pollutants (Martinez,
2009a). The mobile genetic elements such as plasmids, integrative elements (integrons)
and transposable elements (transposons and insertion sequences) are responsible for
transferring ARGs among different groups of bacteria (Bennett, 2008). Plasmids are extra
chromosomal DNA molecules that are capable of replicating autonomously from the
chromosomal host DNA. Plasmids can be mobile, encoding conjugative transfer genes
for movement between bacteria of the same or different species including commensal and
pathogenic bacteria (Bennett, 2008; Smillie et al., 2010). Plasmids are important vectors
for accumulating and spreading multiple resistance genes in bacterial populations.
Multiple resistance plasmids often contain resistance genes found within integrons,
insertion sequences and transposons, coding for various resistance mechanisms to
antibiotics, heavy metals and quaternary ammonium compounds (Chee-Sanford et al.,
2009; Fajardo et al., 2009; Davies and Davies, 2010). Resistance plasmids are common
among multi-drug resistant clinical pathogens such as Staphylococcus aureus,
Enterococcus species, clostridium difficile, Pseudomonas aeruginosa, Klebsiella
pneumonia, Escherichia coli and Salmonella enterica (Walsh, 2000).
The WHO has also highlighted the movement of MDR pathogenic bacteria from
clinical environment to community environments as a major public health concern. For
example, methicillin resistant Staphylococcus aureus (MRSA) is a well-established
infectious pathogen in the healthcare environments. In the last decade, MRSA has moved
from being predominantly a hospital acquired infection to an increasingly common
community acquired infection resulting in a type of MRSA known today as community
Page 29
5
associated-MRSA (CA-MRSA). This type of MRSA infections were reported in
otherwise healthy individuals who had no recent history of hospitalizations (over the past
year), no evidence of having predisposing risk factors such as medical procedures (e.g.
surgery). CA-MRSA infections have particularly affected athletes in close contact sports
(e.g. football) and farm workers in close proximity to livestock, mainly swine (Nguyen et
al. 2005; Huijsdens et al. 2006; de Neeling et al. 2007). CA-MRSA strains have been
isolated in community environments/public areas such as schools, recreational waters
(Stanforth et al. 2010; Goodwin et al. 2012). Little is known about the origin and
emergence of CA-MRSA strains, the common routes of MRSA transmission in humans
include; direct transmission through contact (person-person), and indirect by contact with
contaminated inanimate objects/ fomites and colonized animals such as farm animals and
pets (Miller and Diep 2008; Desai et al. 2011; Ferreira et al. 2011). MDR bacteria are not
limited locally, but also have capabilities of spreading from one country to another, as
observed in the recent emergence of the New Delhi metallo-betalactamase (NDM-1)
bacterial pathogens encoding resistance to last-line group of antibiotics (carbapenems).
NDM-1 strains have been reported to originate in India circa 2008, and have since spread
to many countries including England, United States and Canada (Hammerum et al. 2010;
Nordmann et al. 2011).
Recent technical advances in molecular microbiology, both culture and non-
culture based techniques and high throughput next-generation DNA sequencing
technology allow for characterization of the antibiotic resistance determinants in
culturable and unculturable bacterial communities found in the environment. In my
research I used a culture based approach to investigate if open-access computer terminals
Page 30
6
located at university and high schools represent a reservoir for community associated-
MRSA, I have also characterized multiple resistance plasmid isolated from swine manure
and a municipal wastewater treatment plant, to investigate the role of urban and
agricultural activities on contributing to dissemination of antibiotic resistance
determinants. Culture-independent and polymerase chain reaction (PCR) approaches
were employed to further investigate the occurrence of resistance determinants in swine
manure-amended soil and water samples from upstream and downstream of the WWTP.
My thesis is divided into six chapters. Each chapter tells a different story while
attempting to address the research questions regarding the reservoirs of antibiotic
resistant pathogens in the environment, and persistence and dissemination of ARB and
plasmid-borne ARGs in the environment.
1.2. Hypotheses and Specific Objectives
MDR bacteria can be found in environmental reservoirs that facilitate their
spread. The spread of CA-MRSA in community environments may be associated with
fomites (inanimate objects) associated with frequent human contact and acting as
reservoirs. Furthermore, anthropogenic activities of waste management in both
agricultural and urban areas are contributing to an increased pool of ARG that are
released into the environment. Antibiotic resistance plasmids (ARPs) present in manure
of antibiotic-fed livestock and WWTPs may represent a threat to public health if they are
readily acquired by opportunistic and pathogenic bacteria. The persistence of ARPs in the
soil and water ecosystems following the application of swine manure in agricultural fields
and the discharge of the wastewater effluent in the environment downstream the WWTP
Page 31
7
may result in possible downstream conjugative transfer and spread among resident
bacteria.
This study investigates the role of computer keyboards as reservoirs of CA-
MRSA contributing to the spread of this pathogen in community environments. In
addition, the study will also provide insights on the evolution of multiple resistance
plasmids isolated from swine manure and WWTPs, their persistence and possible
dissemination in soil and aquatic environments. The specific objectives of the research
are to;
a). Investigate the role computer keyboards may play as an environmental reservoir for
community-associated methicillin resistant Staphylococcus aureus (CA-MRSA) using
culture based and molecular tools.
b). Isolate plasmids encoding multiple antibiotic resistance genes from swine manure,
analyze the conjugative mobility, and detect plasmid-specific sequences in the soil
following manure application using PCR method.
c). Characterize antibiotic resistance plasmids and bacterial communities isolated from a
municipal wastewater treatment plant environment using comparative genomics approach
and denaturing gradient gel electrophoresis (DGGE) microbial profiling method.
d). Analyze the functions of the plasmids replication, conjugative mobility and
maintenance genes by in vitro techniques, detect and quantify the plasmid-associated
resistance determinants in the environment upstream and downstream of the WWTP
using molecular methods.
Page 32
8
1.3. Literature cited
Alanis, A.J. (2005) Resistance to antibiotics: Are we in the post-antibiotic era? Archives
of Medical Research 36, 697-705.
Allen, H.K., Donato, J., Wang, H.H., Cloud-Hansen, K.A., Davies, J., and Handelsman,
J. (2010) Call of the wild: antibiotic resistance genes in natural environments.
Nature Reviews Microbiology 8, 251-259.
Aminov, R.I. (2009) The role of antibiotics and antibiotic resistance in nature.
Environmental Microbiology 11, 2970-2988.
Ansari, M.I., Grohmann, E., and Malik, A. (2008) Conjugative plasmids in multi-resistant
bacterial isolates from Indian soil. Journal of Applied Microbiology 104, 1774-
1781.
Baquero, F., Martinez, J.L., and Canton, R. (2008) Antibiotics and antibiotic resistance in
water environments. Current Opinion in Biotechnology 19, 260-265.
Bennett, P.M. (2008) Plasmid encoded antibiotic resistance: acquisition and transfer of
antibiotic resistance genes in bacteria. British Journal of Pharmacology 153,
S347-S357.
Chee-Sanford, J.C., Mackie, R.I., Koike, S., Krapac, I.G., Lin, Y.F., Yannarell, A.C. et al.
(2009) Fate and transport of antibiotic residues and antibiotic resistance genes
following land application of manure waste. Journal of Environmental Quality 38,
1086-1108.
D'Costa, V.M., McGrann, K.M., Hughes, D.W., and Wright, G.D. (2006) Sampling the
antibiotic resistome. Science 311, 374-377.
Page 33
9
Davies, J., and Davies, D. (2010) Origins and evolution of antibiotic resistance.
Microbiology and Molecular Biology Reviews 74, 417-433.
Desai, R., Pannaraj, P.S., Agopian, J., Sugar, C.A., Liu, G.Y. and Miller, L.G. (2011)
Survival and transmission of community-associated methicillin-resistant
Staphylococcus aureus from fomites. American Journal of Infection Control 39,
219-225.
de Neeling, A.J., van den Broek, M.J.M., Spalburg, E.C., van Santen-Verheuvel, M.G.,
Dam-Deisz, W.D.C., Boshuizen, H.C. et al. (2007) High prevalence of methicillin
resistant Staphylococcus aureus in pigs. Veterinary Microbiology 122, 366-372.
Deurenberg, R.H., and Stobberingh, E.E. (2008) The evolution of Staphylococcus aureus.
Infection, Genetics and Evolution 8, 747-763.
Fajardo, A., Linares, J.F., and Martinez, J.L. (2009) Towards an ecological approach to
antibiotics and antibiotic resistance genes. Clinical Microbiology and Infection
15, 14-16.
Ferreira, J.P., Anderson, K.L., Correa, M.T., Lyman, R., Ruffin, F., Reller, L.B. and
Fowler, V.G., Jr. (2011) Transmission of MRSA between companion animals and
infected human patients presenting to outpatient medical care facilities. PLoS One
6, e26978.
Furushita, M., Okamoto, A., Maeda, T., Ohta, M. and Shiba, T. (2005) Isolation of
multidrug-resistant Stenotrophomonas maltophilia from cultured yellowtail
(Seriola quinqueradiata) from a marine fish farm. Applied and Environmental
Microbiology 71, 5598–5600.
Page 34
10
Goodwin, K.D., McNay, M., Cao, Y., Ebentier, D., Madison, M. and Griffith, J.F. (2012)
A multi-beach study of Staphylococcus aureus, MRSA, and enterococci in
seawater and beach sand. Water Research 46, 4195-207.
Hall, B.G., and Barlow, M. (2004) Evolution of the serine beta-lactamases: past, present
and future. Drug Resistance Updates 7, 111-123.
Hammerum, A.M., Toleman, M.A., Hansen, F., Kristensen, B., Lester, C.H., Walsh, T.R.
and Fuursted, K. (2010) Global spread of New Delhi metallo-beta-lactamase 1.
Lancet Infectious Diseases 10, 829-830.
Heuer, H., Krogerrecklenfort, E., Wellington, E.M.H., Egan, S., van Elsas, J.D., van
Overbeek, L. et al. (2002) Gentamicin resistance genes in environmental bacteria:
prevalence and transfer. FEMS Microbiology Ecology 42, 289-302.
Huang, H., Flynn, N.M., Kim, J.H., Monchaud, C., Morita, M., and Cohen, S.H. (2006)
Comparisons of community-associated methicillin-resistant Staphylococcus
aureus (MRSA) and hospital-associated MSRA infections in Sacramento,
California. Journal of Clinical Microbiology 44, 2423-2427.
Huang, Y.H., Tseng, S.P., Hu, J.M., Tsai, J.C., Hsueh, P.R., and Teng, L.J. (2007) Clonal
spread of SCCmec type IV methicillin-resistant Staphylococcus aureus between
community and hospital. Clinical Microbiology and Infection 13, 717-724.
Huijsdens, X., van Dijke, B., Spalburg, E., van Santen-Verheuvel, M., Heck, M., Pluister,
G., Voss, A., Wannet, W. and de Neeling, A. (2006) Community-acquired MRSA
and pig-farming. Annals of Clinical Microbiology and Antimicrobials 5, 26.
Page 35
11
Kim, H.R., Hwang, S.S., Kim, E.C., Lee, S.M., Yang, S.C., Yoo, C.G. et al. (2011) Risk
factors for multidrug-resistant bacterial infection among patients with
tuberculosis. Journal of Hospital Infection 77, 134-137.
Liu, B., and Pop, M. (2009) ARDB-Antibiotic resistance genes database. Nucleic Acids
Research 37, D443-D447.
Lupo, A., Coyne, S. and Berendonk, T.U. (2012) Origin and evolution of antibiotic
resistance: the common mechanisms of emergence and spread in water bodies.
Frontiers in microbiology 3.
Martinez, J.L. (2009a) Environmental pollution by antibiotics and by antibiotic resistance
determinants. Environmental Pollution 157, 2893-2902.
Martinez, J.L. (2009b) The role of natural environments in the evolution of resistance
traits in pathogenic bacteria. Proceedings of the Royal Society B-Biological
Sciences 276, 2521-2530.
Martinez, J.L. and Baquero, F. (2000) Mutation frequencies and antibiotic resistance.
Antimicrobial Agents and Chemotherapy 44, 1771-1777.
Martinez, J.L., Sanchez, M.B., Martinez-Solano, L., Hernandez, A., Garmendia, L.,
Fajardo, A. and Alvarez-Ortega, C. (2009) Functional role of bacterial multidrug
efflux pumps in microbial natural ecosystems. FEMS Microbiology Reviews 33,
430-449.
Miller, L.G. and Diep, B.A. (2008) Colonization, fomites, and virulence: Rethinking the
pathogenesis of community-associated methicillin-resistant Staphylococcus
aureus infection. Clinical Infectious Diseases 46, 752-760.
Page 36
12
Moura, A., Henriques, I., Smalla, K., and Correia, A. (2010) Wastewater bacterial
communities bring together broad-host range plasmids, integrons and a wide
diversity of uncharacterized gene cassettes. Research in Microbiology 161, 58-66.
Nguyen, D.M., Mascola, L. and Bancroft, E. (2005) Recurring methicillin-resistant
Staphylococcus aureus infections in a football team. Emerging Infectious
Diseases 11, 526-532.
Nordmann, P., Naas, T. and Poirel, L. (2011) Global spread of carbapenemase-producing
enterobacteriaceae. Emerging Infectious Diseases 17, 1791-1798.
Nseir, S., Pompeo, C.D., Cavestri, B., Jozefowicz, E., Nyunga, M., Soubrier, S. et al.
(2006) Multiple-drug-resistant bacteria in patients with severe acute exacerbation
of chronic obstructive pulmonary disease: Prevalence, risk factors, and outcome.
Critical Care Medicine 34, 2959-2966.
Pop-Vicas, A.E., and D'Agata, E.M.C. (2005) The rising influx of multidrug-resistant
Gram-negative bacilli into a tertiary care hospital. Clinical Infectious Diseases 40,
1792-1798.
Rahube, T.O., and Yost, C.K. (2010) Antibiotic resistance plasmids in wastewater
treatment plants and their possible dissemination into the environment. African
Journal of Biotechnology 9, 9183-9190.
Rahube, T.O., and Yost, C.K. (2012) Characterization of a mobile and multiple resistance
plasmid isolated from swine manure and its detection in soil after manure
application. Journal of Applied Microbiology 112, 1123-1133.
Page 37
13
Riesenfeld, C.S., Goodman, R.M., and Handelsman, J. (2004) Uncultured soil bacteria
are a reservoir of new antibiotic resistance genes. Environmental Microbiology 6,
981-989.
Salmond, G.P.C., and Welch, M. (2008) Antibiotic resistance: Adaptive evolution.
Lancet 372, S97-S103.
Smillie, C., Garcillan-Barcia, M.P., Francia, M.V., Rocha, E.P.C., and de la Cruz, F.
(2010) Mobility of plasmids. Microbiology and Molecular Biology Reviews 74,
434-452.
Stanforth, B., Krause, A., Starkey, C., and Ryan, T.J. (2010) Prevalence of community-
associated Methicillin-resistant Staphylococcus aureus in high school wrestling
environments. Journal of Environmental Health 72, 12-16.
Thwaites, G.E., Edgeworth, J.D., Gkrania-Klotsas, E., Kirby, A., Tilley, R., Török, M.E.
et al. (2011) Clinical management of Staphylococcus aureus bacteraemia. The
Lancet Infectious Diseases 11, 208-222.
Tolba, O., Loughrey, A., Goldsmith, C.E., Millar, B.C., Rooney, P.J., and Moore, J.E.
(2008) Survival of epidemic strains of healthcare (HA-MRSA) and community-
associated (CA-MRSA) meticillin-resistant Staphylococcus aureus (MRSA) in
river, sea and swimming pool water. International Journal of Hygiene and
Environmental Health 211, 398-402.
Walsh, C. (2000) Molecular mechanisms that confer antibacterial drug resistance. Nature
406, 775-781.
Wright, G.D. (2007) The antibiotic resistome: The nexus of chemical and genetic
diversity. Nature Reviews Microbiology 5, 175-186.
Page 38
14
Zhang, X.X., Zhang, T., and Fang, H. (2009) Antibiotic resistance genes in water
environment. Applied Microbiology and Biotechnology 82, 397-414.
Page 39
15
CHAPTER 2. ISOLATION AND CHARACTERIZATION OF A COMMUNITY
ASSOCIATED-METHICILLIN RESISTANT STAPHYLOCOCCUS AUREUS FROM
HIGH SCHOOL COMPUTER KEYBOARDS
Portions of this work were previously published as:
‘Prevalence of methicillin-resistant Staphylococci species isolated from computer
keyboards located in secondary and post-secondary schools’
Authors: Tyler T. Boa, Teddie O. Rahube, Bastien Fremaux, Paul N. Levett, and
Christopher K. Yost (2013)
Journal of Environmental Health 75, 50-58
Page 40
16
2.1. Introduction
The occurrence of methicillin-resistant Staphylococcus aureus (MRSA) in
hospitals was first reported in 1961 (Jevons, 1961). Numerous nosocomial MRSA
outbreaks occur annually due to the wide spread prevalence of MRSA within hospitals
(Klein et al., 2007). Recently, highly virulent strains of MRSA have been identified in
individuals with no history of recent hospitalizations, or evidence of having predisposing
risk factors. These strains have been subsequently referred to as community-associated
MRSA (CA-MRSA) and have become a global infectious threat (reviewed in Diep and
Otto, 2008). In the US, 33% of current MRSA infections are due to infections of
community origin (Klevens et al., 2007). Compared to the United States, Australia and
other nations, MRSA rates in Canada have been relatively low. However, they have
increased 16-fold from 1995 to 2005 from 0.46 per 1000 hospital admissions to 7.6 per
1000 hospital admissions (Webster et al., 2007). Two strains have been implicated in the
majority of CA-MRSA infections in Canada: CMRSA 7 (also known as USA 400/MW2)
and CMRSA 10 (also known as USA 300) (Christianson et al, 2007).
Identifying reservoirs for pathogenic antibiotic resistant organisms is an important
step in implementing intervention methods to prevent the spread of infection. Studies
examining routes of transmission of hospital associated MRSA (HA-MRSA) have shown
that hospital keyboards can represent an important reservoir; the incidence of keyboard
contamination by MRSA in these studies ranged from 8% to 42 % (Bures et al., 2000;
Devine et al., 2001; Fellowes et al., 2006; Neely et al., 2005). The high number of users
on computer terminals in public settings like libraries and computer labs at schools
creates an opportunity for the transmission of bacteria (Anderson and Palombo, 2009),
Page 41
17
suggesting these keyboards may also be a potential reservoir for MRSA. Researchers at
the University of Toledo investigated MRSA prevalence on keyboards within a
community setting (Kassem et al., 2007). Twenty-four public access computer keyboards
were sampled and two of the keyboards were found to be contaminated with MRSA. The
presence of MRSA combined with the high volume of traffic on public computer
terminals is a concern and may contribute to the spread of this pathogen in the
community. Using selective and differential media the prevalence of S. aureus and
methicillin resistant staphyloccoci contamination on public access computer terminals at
two secondary schools (grades 10-12) within the Regina area was investigated. The
results for this were compared to a complementary study conducted at the university of
Regina (Boa et al., 2012), which also investigated the prevalence of MRSA and
Staphylococcus species on high traffic and low traffic computer terminals. High traffic
computers were standing terminals located the main entrance of the library and are used
by many individuals for short periods of time where as low traffic computers are sit-down
terminals used for longer periods resulting in fewer users on any given day. Furthermore,
the survival of the different MRSA strains and methicillin sensitive Staphylococci species
on keyboards were also investigated to determine the persistence of these bacteria under
conditions of desiccation.
2.2 Materials and methods
2.2.1. Specimen Collection
Computer keyboards were sampled by high school students at two high schools in
the Regina area on March 5 (HS#1) and March 27 (HS#2), 2009 respectively. A total of
Page 42
18
50 individual keyboards from two computer labs were sampled from HS#1 while 71
individual keyboards were sampled from three computer labs at HS#2. These computer
labs are accessed by the majority of the student population and are in use throughout the
day. Sterile cotton swabs dipped in sterile phosphate buffered saline (Fluka) were passed
over the entire surface of all letter keys, space bar and enter key. Swabs were cut so that
only the cotton swab was placed directly into tryptic soy broth (TSB, Sigma) and
incubated overnight at 37 °C with agitation. A control swab dipped in phosphate buffered
saline and briefly exposed to the air was also incubated in TSB along with the keyboard
samples. Data from a complementary study at the University of Regina library (UR) was
used for comparison. The UR data was kindly supplied by Tyler Boa (Boa et al., 2012).
2.2.2. Isolation and Identification of Staphylococcus Colonies
After incubation, turbid TSB tubes were sub-cultured onto mannitol salt agar
(MSA) medium, a selective medium used to isolate putative Staphylococcus species and
differentiate S. aureus (Chapman, 1943) and incubated for 48h at 37°C. As well, 100 µL
of the turbid TSB culture was inoculated into TSB supplemented with oxacillin (2 mg/L)
and incubated overnight at 37°C with agitation (Jonas et al., 2002) prior to plating onto
MSA and Baird Parker agar (Baird-Parker, 1962; Oxoid). Oxacillin, which is in the same
class of drugs as methicillin, is used since methicillin is no longer commercially
available. Additionally oxacillin maintains its activity during storage better than
methicillin. Colonies arising on MSA and Baird Parker agar exhibiting morphology
appropriate to S. aureus were further characterized using gram-staining, testing for
catalase, and coagulase testing (Pastorex® Staph-Plus kit, Bio-Rad). Catalase and
Page 43
19
coagulase positive isolates were sub-cultured onto MRSAselect medium (Bio-Rad) and
oxacillin screen agar (OSA) medium (BD Diagnostics, ON).
Isolates that grew on OSA and MRSAselect were inoculated onto LB plates and
sent to the Saskatchewan Disease Control Laboratory (Regina, SK) for automated
identification and antibiotic susceptibility testing. Antimicrobial susceptibility testing was
performed using automated instrumentation (MicroScan® WalkAway® plus System,
Siemens Canada Limited, Burlington, ON, Canada). Interpretive criteria for MIC values
were applied as recommended by the Clinical and Laboratory Standards Institute
(Clinical and Laboratory Standards Institute, 2011).
2.2.3. Genomic Profiling of MRSA
MRSA isolates were confirmed by a duplex PCR targeting mecA gene (unique to
methicillin resistant staphylococci) and femB gene specific for Staphyloccocus aureus as
described by Jonas et al., 2002). Primers used for mecA detection were MecA1 (5’-GTA
GAAATGACTGAACGTCCGATAA-3’) and MecA2 (5’-CCAATTCCACATTGTTTC
GGTCTAA-3’) which yields a 310 bp amplicon. Primers for femB detection were FemB1
(5’-TTACAGAGT TAACTGTTACC-3’) AND FemB2 (5’-ATACAAATCCAGCAC
GCTCT-3’) yielding a 651 bp amplicon. A duplex PCR was performed in a 25 µL
reaction mix consisting of 2.5 µL of template DNA, 2.5 μL of each primers (2 μM), 2,5
μL of MgSO4 (20 mM), 2.5 μL of 10X reaction buffer, 0.2 μL of Taq DNA polymerase
(5U/ μL) and 7.3 μL of de-ionized sterile water. The PCR conditions were set as follows;
94 °C for 4 minutes initial denaturing, followed by 30 cycles [of denaturing at 94 °C;
annealing at 58 °C for 45 seconds; extension at 72 °C for 1 minute] and final extension at
Page 44
20
72 °C for 2 minutes. Ten μL of PCR products were run on agarose gel electrophoresis
(0.8 % agarose, 1 X SBS buffer; 164 V for 30 minutes) and stained in ethidium bromide
solution.
Profiling of the MRSA strains also involved S. aureus protein A gene (spa) typing
(Shopsin et al., 1999), detection of Panton-Valentine Leukocidin (PVL) toxin gene,
methicillin resistance mecA gene detection by multiplex PCR as described by McDonald
et al. (MacDonald et al., 2005). Pulse field gel electrophoresis (PFGE) as described by
Mulvey et al. (Mulvey et al., 2001) was used when necessary. The staff at the
Saskatchewan Disease Control Laboratory performed both spa typing and PFGE. Spa
types and PFGE profiles of MRSA isolates were compared to local and national
databases (Saskatchewan Disease Control Laboratory, and Canadian Nosocomial
Infections Surveillance Program) to determine if they were members of known clusters or
match any previously observed clinical strains. Classification based on PFGE profile
followed the recommendation of Tenover, Arbeit & Goering (1997) whereby if the
typical number of fragment differences compared to the outbreak pattern is greater or
equal to seven then they are not related. Indistinguishable, closely related, and possibly
related strains have 0, 2-3, and 4-6 fragment differences form the outbreak pattern,
respectively (Tenover et al., 1997).
2.2.4. Determining survival of Staphylococcus spp. on keyboards
Individual computer keyboard keys were removed from standard keyboards,
cleaned, and autoclaved prior to inoculation with individual Staphylococcus strains.
Staphylococcus species were provided by the Saskatchewan Disease Control Laboratory.
Page 45
21
The HA MRSA was a CMRSA-2 (PVL-) strain while the CA MRSA strain was a
CMRSA -7 (PVL+) strain. Isolates were enriched overnight at 35° C on TSB (with
Oxacillin for MRSA isolates). Cells were adjusted to optical density of 0.9 at 620 nm,
(approximately 5 x 10⁹ cells). Twenty microliters of the cell suspension were inoculated
onto individual keyboard keys. For each strain a total of 36 keys were inoculated,
allowing each sampling day to be conducted in triplicate. A negative control (20 µL
sterile PBS) was also inoculated onto 12 keys. The keys were kept in the laboratory at
ambient temperature and humidity. On a daily basis for a period of 12 days bacteria were
recovered from the keys, in triplicate, by swabbing the entire surface of each key with a
sterile swab moistened in PBS. The swab was cut with a pair of sterile scissors to ensure
no cross contamination and the keyboard key were both placed in a sterile 50 mL tube
containing 5 mL TSB, and the tube was vortexed for one minute in order to recover all
the cells. The bacteria were subsequently enumerated by spread plating serial dilutions
onto TSA medium.
2.2.5. Statistical analysis of keyboard survival
The bacterial counts obtained for each strain were compiled and the Weibull-type
model (Marfart, Couvert, Gaillard & Leguerine, 2002) was used to fit them:
where N represents the bacterial density (CFU per keyboard key) observed at time t (in
days), N0 is the initial bacterial density (in CFU per keyboard key), and δ is the time (in
days) for the first decimal reduction in bacterial cell number. The Model was fitted using
Page 46
22
the nls function of the R software version 2.0.1 (Ihaka & Gentleman, 1996). A one-way
ANOVA test was carried out in order to examine the influence of the different strains on
the δ parameter values. Multiple comparisons of the δ values were then made using
pairwise t-tests (Bonferroni correction).
2.3. Results
The computer keyboards from the two schools experienced different levels of S.
aureus contamination. Higher prevalences of coagulase positive S. aureus were observed
on the HS#1 school keyboards in comparison to HS#2 and the University of Regina
computer keyboards (Table 2.1). The prevalence of oxacillin resistant bacteria
contaminating the keyboards was particularly high in the high schools, although the
prevalence observed in the university library study (Boa et al., 2012) was also relatively
high. MRSA strains were isolated in both surveys, one originating from a single high
traffic keyboard at the University of Regina library and the other from a HS#1 keyboard.
The two MRSA isolates were further characterized using spa typing. The MRSA
isolate from HS#1 (Lum1) has the spa type t128, which is the spa type found in the CA-
MRSA strain lineage CMRSA7, also referred to as USA400, one of the two prominent
community acquired MRSA strains in the USA and Canada (Baba et al., 2002;
Christianson et al., 2007). This lineage and USA300/CMRSA10 are considered clinically
significant and together with the hospital associated MRSA strains, CMRSA 1 to 6 and 9,
they represent over 80% of all reported MRSA infections in Canada (Simmonds et al.,
2008). CA-MRSA strains often carry the genes coding for the PVL toxin (Tenover et al.,
Page 47
23
Table 2.1: Prevalence of oxacillin resistant bacteria, S. aureus and MRSA on computer
keyboards.
Locationa Growth in
TSBb
Growth in TSB
Oxacillinb
Coagulase
positiveb
MRSAc
UR-L¥ 70 (100) 29 (56) 9 (13) 0 (0.0)
UR-H¥ 77 (100) 17 (61) 17 (22) 1 (1.3)
spa=t664
pvl (-)
HS#1 50 (100) 50 (100) 32 (60) 1 (2.0)
spa=t128
pvl (-)
HS#2 71 (100) 66 (92) 27 (38) 0 (0.0)
a Keyboards were sampled as described in the methods section.
b The brackets represent % prevalence.
c The spa type and presence of PVL genes are indicated for each MRSA isolate.
pvl (-) PVL gene not present
UR-H, University of Regina high traffic computers; UR-L, University of Regina low
traffic computers
HS#1, high school 1; HS#2, high school 2
¥ The data were supplied kindly by Tyler Boa
Page 48
24
Figure 2.1: Gel electrophoresis picture showing detection of MRSA isolate (Lum 1) by
duplex PCR amplification of femB (651 bp) and mecA (310 bp) genes.
Page 49
25
Table 2.2: Antibiotic resistance profile of the CA-MRSA lum-1 isolated from HS#1
computer keyboard
Antibiotic Class Antibiotic aMICs
µg/ml UR-1 Lum-1
Penicillins (β-Lactams) Amoxicillin/ Clavulanate ˂ 4/2 R R
Penicillins (β-Lactams) Ampicillin/Sulbactam ≤ 8/4 R R
Penicillins (β-Lactams) Ampicillin ˃ 8 R R
Penicillins (β-Lactams) Oxacillin ˃ 2 R R
Penicillins (β-Lactams) Penicillin ˃ 8 R R
Cephalosporin 1
(β-Lactams)
Cefazolin 16 R R
Cephalosporin 3
(β-Lactams)
Ceftriaxone 32 R R
Aminoglycoside Gentamicin ≤ 1 S S
Dihydrofolate reductase
inhibitor/sulfonamide
Trimethoprim/Sulfa ≤ 2/38 S S
Fluoroquinolone Ciprofloxacin ≤ 1 S S
Fluoroquinolone Gatifloxacin ≤ 2 S S
Fluoroquinolone Levofloxacin ≤ 2 S S
Fluoroquinolone Norfloxacin ≤ 4 S S
Glycopeptide Vancomycin ≤ 2 S S
Lincosamide Clindamycin ≤ 0.25 S S
Macrolide Erythromycin ≤ 0.5 S S
Oxazolidinone Linezolid 2 S S
Rifamycin Rifampin ≤ 1 S S
Streptogramin Quinupristin/
Dalfopristin(Synercid)
≤ 4 S S
Tetracycline Tetracycline ˂ 4/2 S S
a Interpretive criteria for MIC values were applied as recommended by the Clinical and
Laboratory Standards Institute (Clinical and Laboratory Standards Institute, 2011).
R, resistant; S, susceptible
Page 50
26
2008). Lum1 strain isolated in this study tested negative for the presence of the PVL
genes. PCR assay verified the presence of the mecA gene (Figure 2.1). Antibiotic
resistance profiles for lum1 MRSA isolate are shown in Table 2.2. The MRSA isolate
from the University of Regina library (UR-1) has a spa type 664 and has a repeat
succession 07-23-12-12-17-20-17-12-17. This spa type is not present in the
Saskatchewan Disease Control Laboratory (SDCL) or the Canadian Nosocomial
Infection Surveillance Program (CNISP) spa typing databases. However, it is found
within the Ridom SpaServer (Harmsen et al., 2003). Six isolates with this spa type are
present in the database and all were originally isolated in Sweden. Because of the
relatively uncharacterized nature of the isolate, PFGE was performed for further
identification. The UR-1 isolate's PFGE pattern clustered with the CMRSA7 profile,
however it has greater than seven fragment differences compared to its closest related
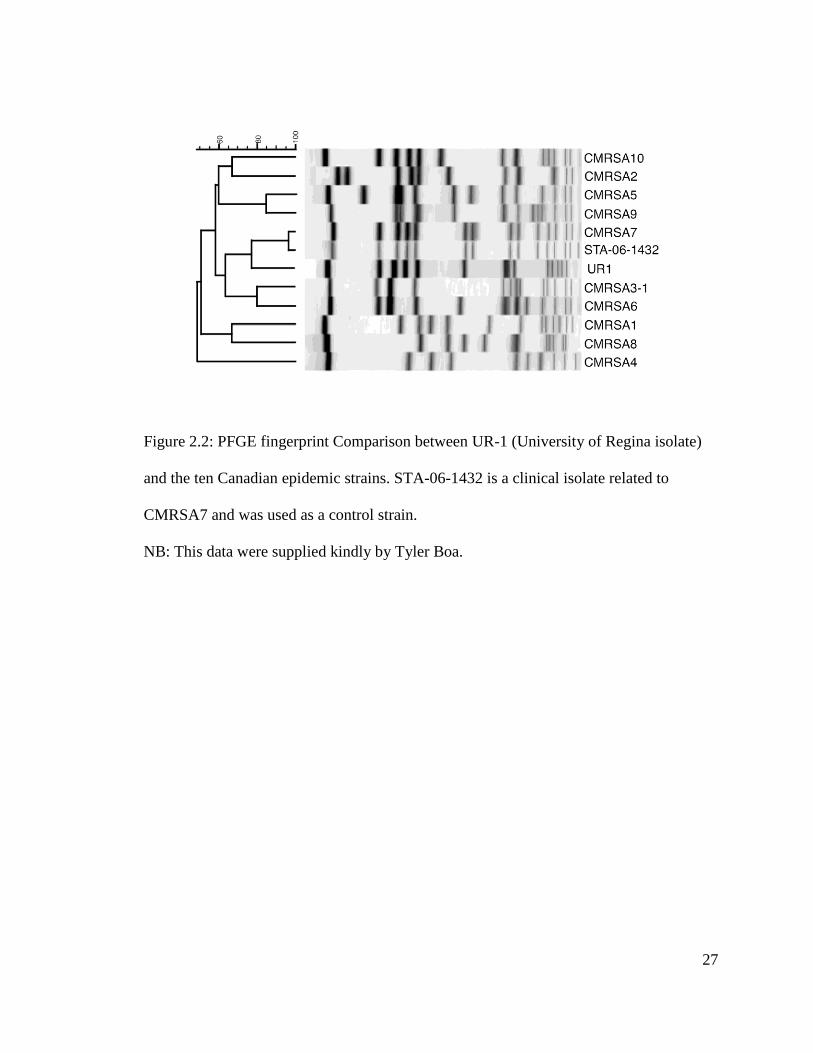
strain. Therefore, UR-1 is a distant relative to CMRSA7 (Figure 2.2 and 2.3).
Furthermore, the PFGE fingerprint of UR-1 did not correspond to any patterns from
MRSA isolates obtained from Saskatchewan patients that were stored in the SDCL
database. The PFGE profile was subsequently compared to the PFGE national database
of the Canadian Nosocomial Infections Surveillance Program (CNISP). The PFGE
pattern of isolate UR-1 did match to three clinical isolates in this database, 02S1336
(isolated in 2002), 06S1154 (isolated in 1995), and N08-00209 (isolated in 2008)
indicating that this strain can be associated with human disease. The strains found in this
cluster are related to the USA700 cluster, which has been found in both community and
nosocomial settings (Tenover et al., 2008).
Page 51
27
Figure 2.2: PFGE fingerprint Comparison between UR-1 (University of Regina isolate)
and the ten Canadian epidemic strains. STA-06-1432 is a clinical isolate related to
CMRSA7 and was used as a control strain.
NB: This data were supplied kindly by Tyler Boa.
Page 52
28
Figure 2.3: PFGE fingerprint comparison of UR-1 with related PFGE patterns found in
the Canadian Nosocomial Infections Surveillance Program (CNISP) database. UR-1
clustered with isolates from the USA700 PFGE pattern.
NB: This data were supplied kindly by Tyler Boa.
Page 53
29
Figure 2.4: Survival of Staphylococcus strains on keyboard keys as determined by viable
plate counts (t= days). S1, CMRSA7(CA MRSA strain); S2, CMRSA2(HA MRSA
strain); S3, S.aureus; S4, S.epidermidis
Page 54
30
Figure 2.5: Mean δ value (based on 3 replicates) with the 95% confidence interval
obtained for each Staphylococcus species strain on keyboard keys. S1, CMRSA7 (CA
MRSA strain); S2, CMRSA2 (HA MRSA strain); S3, S. aureus; S4, S. epidermidis
Page 55
31
To determine the length of time a keyboard may remain contaminated with MRSA the
survival of Staphylococcus strains on keyboards was also investigated. Figure 4 shows
the survival curves for the Staphylococcus spp used in the investigation. A large
percentage of cells were inactivated rapidly during the first day of incubation. However
the rate of die off decreased and persistent recovery of cells was possible after 12 days of
incubation. Considering the 95% confidence interval overlap, there were no significant
difference between the mean δ values for the HA MRSA (S2), S. aureus (S3) and S.
epidermidis (S4) strains (Figure 2.5). This statement was also confirmed by using the
Bonferroni correction test (P > 0.05). However, the CA MRSA (S1) strain had a
significantly higher survival rate when compared to the S. aureus and S. epidermidis
strains (Bonferroni, P < 0.01). The S1 strain has similar genotypic profile as Lum1 isolate
from the HS#1 computer keyboard.
2.4. Discussion
The primary mode of transmission of S. aureus is thought to be direct skin-to-skin
contact (Miller & Diep, 2008). However, computer keyboards have been recognized as
an alternative reservoir for MRSA, within hospital and clinical settings (Fellowes et al.,
2006; Shultz et al., 2003; Wilson et al., 2006). Moreover, recent attention has also
focused on the potential role of public computer keyboard terminals as reservoirs for
pathogens like MRSA (Anderson & Palombo, 2009; Kassem et al., 2007). In this
investigation computer keyboards at educational institutes were selected since these
keyboards receive relatively high volumes of users. The degree of contamination on the
keyboards by S. aureus varied widely between institutes with absolute prevalence ranging
Page 56
32
from 18% to 60%. These ranges are similar to other studies on public keyboard terminals
at universities, for instance Anderson and Palombo (2009) reported prevalence of S.
aureus on multiple-user keyboards ranging from 40 to 60% and Kassem et al. (2007)
reported a prevalence of 21% on multiple-user university keyboards. The keyboards at
the high schools selected for this study were considered high traffic given the large
numbers of students that access these computer labs on a daily basis and this likely
contributes to the high incidence of S. aureus on these terminals. Intuitively it seems
reasonable to expect higher contamination on multiple user keyboards. The results of the
present study and those of Anderson and Palombo (2009) and Kassem et al (2007) and
the U of Regina study (Boa et al., 2012) reinforce the emphasis that should be placed on
disinfection of particularly high traffic computer keyboards, as well as placing hand
sanitizers near high traffic public computer keyboards.. Methicillin resistant S. aureus
was identified at one of the two high schools with an absolute prevalence of 2.0% (1/50).
This is in agreement with the limited data on MRSA prevalence on public computer
terminals, where the incidence of MRSA on computer keyboards from university settings
was 1.3% (1/77) (Boa et al., 2012), 8.3% (2/24) (Kassem et al., 2007). Brooke et al
(2009) did not detect any MRSA isolates from university keyboards (30 samples total).
Lum1 isolate was further characterized for the presence of the Panton-Valentine
leukocidin (PVL) genes. CA-MRSA strains isolated in clinical situations often carry the
genes coding for the PVL toxin. PVL causes tissue necrosis and leukocyte destruction by
forming pores in cellular membranes (Lina et al., 1999), and the pvl genes are commonly
associated with CA-MRSA virulence (Diederen and Kluytmans, 2006; Diep and Otto,
2008; Etienne, 2005). Interestingly, the CA-MRSA strain isolated in this study does not
Page 57
33
possess the genes for PVL. Recent research comparing clinical isolates from the CA-
MRSA USA400 (CMRSA 7) group indicated that only 22.3% of the isolates were PVL
positive and the PVL negative isolates shared similar clinical characteristics and
virulence to the PVL positive isolates; suggesting PVL may not be absolutely necessary
for CA-MRSA virulence (Zhang et al., 2008). UR-1 from the University of Regina is an
uncommon CA-MRSA isolate in the Canada since it did not match any Saskatchewan
Disease Control Laboratory (SDCL) or the Canadian Nosocomial Infection Surveillance
Program (CNISP) spa typing databases. Lum-1 was also characterized for additional
antibiotic resistance phenotypes and had a resistance profile typical of CA-MRSA strains
(Chambers and Deleo, 2009).
The survival of MRSA on keyboards is an important consideration as the duration
of persistence will directly impact the potential risk for transmission of the pathogen to
keyboard users. This study found that artificially innoculated MRSA and methicillin
susceptible Staphylococcus aureus (MSSA) can persist for at least 12 days on keyboards
thereby allowing for possible transmission to multiple users who access a contaminated
keyboard. This is similar to reports of MRSA persisting on laminated tabletops for more
than 12 days (Huang et al., 2006). The slight, but significantly higher survival rate in the
CA MRSA strain is noteworthy and merits further investigation. The high prevalence of
oxacillin resistant bacteria on the keyboards at high schools is also worth noting, some of
these oxacillin resistant bacteria were identified as coagulase negative S. epidermidis and
S. haemolyticus (Boa et al., 2012). Coagulase negative Staphylococci (CoNS) include
multiple species and are generally regarded as only opportunistic pathogens. It may be
speculated that MSSA may gain resistance genes when colonizing environments that
Page 58
34
contain methicillin resistant coagulase negative staphylococci. In fact, it has been
suggested that the Staphylococcus cassette chromosome carrying the mecA gene
(SCCmec elements, which confer methicillin resistance to Staphylococcus species), are
derived from coagulase negative staphylococci (Lindsay and Holden, 2004). However,
the mechanisms for the transfer of SCCmec elements are not well understood and require
further study. Notably MSSA and methicillin resistant coagulase negative staphylococci
(S. epidermidis and S. haemolyticus) were isolated from the same keyboard on separate
sample dates during the University of Regina sampling, and since S. aureus can survive
on keyboards for extended periods of time, it is possible for co-contamination to occur.
The frequency of methicillin resistance in CoNS is notably high and it has been suggested
this may provide a reservoir to propagate methicillin resistance into other Staphylococcus
species including S. aureus (Lindsay and Holden, 2004). A mixed staphylococcal
community of antibiotic resistant genotypes occurring on the keyboards may contribute
to development of newly acquired resistances in CA-MRSA isolates. Therefore, further
studies on the transfer of antibiotic resistance from MR-CoNS to MSSA and MRSA in
the environment are warranted.
2.5. Conclusion
In conclusion, computer terminals in high schools within the Regina area were
found to be contaminated with various staphylococci species, including normal flora,
methicillin-resistant coagulase negative staphylococci and potentially pathogenic MRSA.
Although the prevalence of MRSA was very low, the keyboards still presented a possible
reservoir. Survival of Staphylococcus species were detected up to 12 days post-
Page 59
35
inoculation of computer keyboards. Children have been noted as a population at risk for
infection by CA-MRSA (Adcock et al., 1998) suggesting that further sampling of
computer labs in elementary schools and promoting awareness to personal hygiene
following use of multi-use computer keyboards across all educational institutes may have
merit in helping to control the spread of CA-MRSA. Reducing the risk of transmission
from keyboards may benefit from the routine disinfection of keyboards, particular on
high traffic computers in university and public libraries. Recent technologies have been
developed that have been mainly deployed in hospital settings. For example, the use of
keyboard designs that facilitate effective disinfection with chemical disinfectants have
been considered for hospital settings (Rutala et al., 2008). As well, using ultra violet light
to sanitize keyboards has been tested for eliminating bacterial contamination of
keyboards in a hospital settings although the efficiency of disinfection remains unclear
(Martin et al., 2011; Sweeney and Dancer, 2009 ). In general, increasing public
awareness to the risk of using public facilities and providing anti-microbial hand
sanitizing stations in areas with open access keyboards may help lessen the risk of
transmittance and potential for infections.
2.6. Literature cited
Adcock, P.M., Pastor, P., Medley, F., Patterson, J.E., and Murphy T.V. (1998) Methicillin-
resistant Staphylococcus aureus in two child-care centers. Journal of Infectious
Disease 178, 577–580.
Anderson, G., and Palombo, E.A. (2009) Microbial contamination of computer keyboards
in a university setting. American Journal of Infection Control 37, 507-509.
Page 60
36
Baba, T., Takeuchi, F., Kuroda, M., Yuzawa, H., Aoki, K., Oguchi, A., Nagai, Y., Iwama,
N., Asano, K., Naimi, T., Kuroda, H., Cui, L., Yamamoto, K. & Hiramatsu, K.
(2002). Genome and virulence determinants of high virulence community-
acquired MRSA. Lancet 359, 1819-1827.
Baird-Parker, A.C. (1962) An improved diagnostic and selective medium for isolating
coagulase-positive Staphylococci. Journal of Applied Bacteriolology 25, 12-19.
Barton, M., Hawkes, M., Moore, D., Conly, J., Nicolle, L., Allen, U., Boyd, N., Embree,
J., Van Horne, L., Le Saux, N., Richardson, S., Moore, A., Tran, D., Waters, V.,
Vearncombe, M., Katz, K., Wesse, J.S., Embil, J., Ofner-Agostini, M., and Ford-
Gones, E.L. (2006) Guidelines for the prevention and management of community-
associated methicillin-resistant Staphylococcus aureus: A perspective for
Canadian health care practitioners. Canadian Journal of Infectious Disease
Medicine Microbiolology 117 (Suppl C), 4C–24C.
Boa, T.T., Rahube, T.O., Fremaux, B, Levett, P.N., and Yost, C.K. (2013) Prevalence of
methicillin-resistant Staphylococci species isolated from computer keyboards
located in secondary and post-secondary schools. Journal of Environmental
Health, 71, No. 6
Brooke, J.S., Annand, J.W., Hammer, A., Dembkowski, K., and Shulman, S.T. (2009)
Investigation of bacterial pathogens on 70 frequently used environmental surfaces
in a large urban US university. Journal of Environmental Health 71, 17-22
Bures, S., Fishbain, J.T., Uyehara, C.F.T, Parker J.M., and Berg B.W. (2000) Computer
keyboards and faucet handles as reservoirs of nosocomial pathogens in the
intensive care unit. American Journal of Infectious Control 28, 465–471
Page 61
37
Chambers, H.F., and Deleo, F.R. (2009) Waves of resistance: Staphylococcus aureus in
the antibiotic era. Nature Reviews Microbiology 7, 629-641.
Chapman, G.H. (1943) Determination of the Chromogenic Property of Staphylococci.
Journal of Bacteriolology 45, 405–406.
Christianson, S., Golding, G.R., Campbell, J., and Mulvey, M.R. (2007) Comparative
genomics of Canadian epidemic lineages of methicillin-resistant Staphylococcus
aureus. Journal of Clinical Microbiology 45, 1904-1911.
Devine, J., Cooke, R.P.D., and Wright, E.P. (2001) Is methicillin-resistant Staphylococcus
(MRSA) contamination of ward-based computer terminals a surrogate marker for
nosocomial MRSA transmission and hand washing compliance? Journal of
Hospital Infection 48, 72-75.
Diep, B.A., and Otto, M. (2008) The role of virulence determinants in community-
associated MRSA pathogenesis. Trends in Microbiology, 16, 361-369.
Diederen, B.M.W., and Kluytmans, J.A.J.W. (2006) The emergence of infections with
community-associated methicillin resistant Staphylococcus aureus. Journal of
Infection, 52, 157-168.
Duckworth, G.J., and Jordens, J.Z. (1990) Adherence and survival properties of an
epidemic methicillin-resistant strain of Staphylococcus aureus compared with
those of methicillin sensitive strains. Journal of Medical Microbiology 32, 195-
200.
Etienne, J. (2005) Panton-Valentine leukocidin: A marker of severity for Staphylococcus
aureus infection? Clinical Infectious Diseases 41, 591–593.
Page 62
38
Fellowes, C., Kerstein, K., and Azadian, B.S. (2006) MRSA on tourniquets and
keyboards. Journal of Hospital Infection, 64, 86–88.
Harmsen, D., Claus, H., Witte, W., Rothgänger, J., Claus, H., Turnwald, D., and Vogel, U.
(2003) Typing of methicillin-resistant Staphylococcus aureus in a university
hospital setting using a novel software for spa-repeat determination and database
management. Journal of Clinical Microbiology 41, 5442-5448.
Huang, R., Mehta, S., Weed, D., and Price, C.S. (2006) Methicillin-resistant
Staphylococcus aureus survival on hospital fomites. Infection Control Hospital
Epidemiology 27, 1267-1269.
Ihaka, R.,and Gentleman, R. (1996) R: A language for data analysis and graphics. Journal
of Computational and Graphical Statistics, 5, 299–314.
Jevons, M.P. (1961). Celbenin-resistant Staphylococci. British Medical Journal 1, 124-
125.
Jonas, D., Speck, M., Daschner, F.D., and Grundmann, H. (2002) Rapid PCR-based
identification of methicillin-resistant Staphylococcus aureus from screening
swabs. Journal of Clinical Microbiology 40, 1821-1823.
Kassem, I.I., Siglar, V., and Esseili, M.A. (2007) Public computer surfaces are reservoirs
for methicillin-resistant staphylococci. ISME Journal 1, 265-268.
Klein, E., Smith, D.L., and Laxminarayan, R. (2007) Hospitalizations and deaths caused
by methicillin-resistant Staphylococcus aureus, United States, 1999–2005.
Emerging Infectious Diseases 13, 1840–1846.
Klevens, R.M., Morrison, M.A., Nadle, J., Petit, S., Gershman, K., Ray, S., Harrison,
L.H., Lynfield, R., Dumyati, G., Towners, J.M., Craig, A.S., Zell, E.R., Fosheim,
Page 63
39
G.E., McDougal, L.K., Carey, R.B., and Fridkin, S.K. (2007) Invasive Methicillin-
resistant Staphylococcus aureus infections in the United States. Journal of the
American Medical Association 298, 1763-1771.
Lina, G., Piemont, Y., Godail-Gamot, F., Bes, M., Peter, M-O., Gauduchon, V.,
Vandenesch, F., and Etienne, J. (1999) Involvement of panton-valentine
leukocidin-producing Staphylococcus aureus in primary skin infections and
pneumonia. Clinical Infectious Diseases 29, 1128-1132.
Lindsay, J.A., & Holden, T.G. (2004) Staphylococcus aureus: Superbug, super genome?
Trends in Microbiolology 12, 378-385.
Mafart, P., Couvert, O., Gaillard, S., and Leguerinel, I. (2002) On calculating sterility in
thermal preservation methods: application of the Weibull frequency distribution
model. International Journal of Food Microbiolology, 72, 107– 113.
Martin, E.T., Qin, X., Braden, H., Migita, R., and Zerr, D.M. (2011) Randomized double-
blind crossover trial of ultraviolet light-sanitized keyboards in a pediatric hospital.
American Journal of Infection Control 39, 433-435.
McDonald, R.R., Antonishyn, N.A., Hansen, T., Snook, L.A., Nagle, E., Mulvey, M.R.,
Levett, P.N., and Horsman, G.B. (2005) Development of a triplex real-time PCR
assay for detection of panton-valentine leukocidin toxin genes in clinical isolates
of methicillin-resistant Staphylococcus aureus. Journal of Clinical Microbiolology
43, 6147-6149.
Miller, L.G., and Diep, B.A. (2008) Clinical practice: Colonization, fomites, and
virulence: Rethinking the pathogenesis of community-associated methicillin-
Page 64
40
resistant Staphylococcus aureus infection. Clinical Infectious Diseases 46, 752–
760
Mulvey, M.R., MacDougall, L., Cholin, B., Horsman, G., Fidyk, M., Woods, S., and the
Saskatchewan CA-MRSA Study Group (2005) Community-associated methicillin
resistant Staphylococcus aureus, Canada. Emerging Infectious Diseases 11, 844-
850.
Mulvey, M.R., Chui, L., Ismail, J., Louie, L., Murphy, C., Chang, N., Alfa, M., and the
Canadian committee for the standardization of molecular methods (2001)
Development of a Canadian standardized protocol for sub typing methicillin-
resistant Staphylococcus aureus using pulsed-field gel electrophoresis. Journal of
Clinical Microbiolology 39, 3481-3485.
Neely, A.N., Weber, J.M., Daviau, P., MacGregor, A., Miranda, C., Nell, M., Bush, P., and
Lighter ,D. (2005) Computer equipment used in patient care within a multi-
hospital system: Recommendations for cleaning and disinfection. American
Journal of Infection Control 33, 233–237.
Rutala, W.A., White, M.S., Gergen, M.F., & Weber, D.J. (2006). Bacterial contamination
of keyboards: Efficacy and functional impact of disinfectants. Infection Control
and Hospital Epidemiology 27, 372-377.
Schultz, M., Gill, J., Zubairi, S., Huber, R., and Gordin, F. (2003) Bacterial contamination
of computer keyboards in a teaching hospital. Infection Control and Hospital
Epidemiology 24, 302-303.
Shopsin, B., Gomez, M., Montgomery, S.O., Smith, D.H., Waddington, M., Dodge, D.E.,
Bost ,D.A., Reihman, M, Naidich, S, and Kreiswirth, B.N. (1999) Evaluation of
Page 65
41
protein A gene polymorphic region DNA sequencing for typing of Staphylococcus
aureus strains. Journal of Clinical Microbiology 37, 3556-3563.
Simmonds, K.A., Dover, D.C., Louie, M., and Keays, G. (2008) Epidemiology of
community associated methicillin-resistant Staphylococcus aureus. Canadian
Communicable Disease Reports 34, 8
Sweeney, C.P., and Dancer, S.J. (2009) Can hospital computers be disinfected using a
hand-held UV light source? Journal of Hospital Infections, 72, 92-94.
Tenover, F.C., McAllister, S., Fosheim, G., McDougal, L.K., Carey, R.B., Limbago, B.,
Lonsway, D., Patel, J.B., Kuehnert, M.J., and Gorwitz, R. (2008) Characterization
of Staphylococcus aureus isolates from nasal cultures collected from individuals
in the United States in 2001 to 2004. Journal of Clinical Microbiology, 46, 2837-
2841.
Tenover, F.C., Arbeit, R.D., and Goering, R.V. (1997) How to select and interpret
molecular strain typing methods for epidemiological studies of bacterial
infections: a review for healthcare epidemiologists. Infection Control and
Hospital Epidemiology, 18, 426-39.
Webster, D., Rennie, R.P., Brosnikoff, C.L., Chui, L., and Brown, C. (2007) Methicillin-
resistant Staphylococcus aureus with reduced susceptibility to vancomycin in
Canada. Diagnostic Microbiology and Infectious Disease 57, 177-181.
Wilson, A.P.R., Ostro, P., Magnussen, M., and Cooper, B. (2008) Laboratory and in-use
assessment of methicillin-resistant Staphylococcus aureus contamination of
ergonomic computer keyboards for ward use. American Journal of Infection
Control 36, e19-e25.
Page 66
42
Wilson, A.P.R., Hayman, S., Folan, P., Ostro, P.T., Birkett, A., Batson, S., Singer ,M., and
Bellingan, G. (2006) Computer keyboards and the spread of MRSA. Journal of
Hospital Infection 62, 390-392.
Zhang, K., McClure, J-A., Elsayed, S., Tan, J., and Conly, J.M. (2008) Coexistence of
Panton-Valentine Leukocidin-positive and -negative community-associated
methicillin-resistant Staphylococcus aureus USA400 sibling strains in a large
Canadian health-care region. Journal of Infectious Disease 197, 195-204.
Page 67
43
CHAPTER 3 – GENOMIC CHARACTERIZATION OF A MULTIPLE RESISTANCE
PLASMID ISOLATED FROM SWINE MANURE AND ITS DETECTION IN THE
SOIL AFTER MANURE APPLICATION
Portions of this work were previously published as:
‘Characterization of a mobile and multiple resistance plasmid isolated from swine
manure and its detection in the soil after manure application’
Authors: Teddie O. Rahube and Christopher K. Yost (2012)
Journal of Applied Microbiology 112, 1123-1133
Page 68
44
3.1. Introduction
The observed increase of antibiotic resistance in clinical isolates of bacterial
pathogens is undermining physicians' ability to control invasive bacterial infections
leading to serious consequences for patient health (Nicolau 2011). The increasing use of
antibiotics in clinical and agricultural settings is a possible factor contributing to the
increase of antibiotic resistant bacterial populations (Aminov 2009; Martinez 2009a; b).
Animal husbandry practices have contributed to the intensive use of antibiotics in the
livestock industry for both therapeutic and non-therapeutic purposes such as for growth
promotion (Winckler and Grafe 2001; Peak et al. 2007b; Chee-Sanford et al. 2009;
Kazimierczak et al. 2009). Various studies have documented the abundance of antibiotic
resistant bacteria associated with livestock such as swine, cattle, and chickens
(Wassenaar 2005; Aarestrup et al. 2008; Alexander et al. 2008; da Costa et al. 2011).
Antibiotic resistant bacteria (ARB) and associated antibiotic resistance genes (ARGs)
have also been isolated in agricultural environments such as wastewater lagoons at
animal feedlots and in the manure of antibiotic-fed livestock (Peak et al. 2007a; Binh et
al. 2008; Alexander et al. 2009; Heuer et al. 2009; Alexander et al. 2011; Cessna et al.
2011). An increasing abundance of ARGs may increase the potential for the spread of
these ARGs to human pathogenic bacteria (Ghosh and LaPara 2007). For example, swine
manure has been shown to contain high diversity of bacterial communities, including
opportunistic pathogens, carrying ARGs encoding resistance to a variety of clinically
relevant antibiotic classes (Binh et al. 2008; Heuer et al. 2009; Kazimierczak et al. 2009).
A standard waste management practice is to spread large quantities of swine manure onto
cultivated fields for soil fertilization. Plasmids and other mobile genetic elements
Page 69
45
(MGEs) such as transposons, insertion sequence (IS) elements and integrons may play a
role in facilitating transfer of ARGs among various bacterial species within the microbial
community, including opportunistic pathogens (Bennett 2008; Heuer et al. 2009).
Therefore, the potential release of antibiotic resistance plasmids (ARPs) due to spreading
of swine manure may increase the proliferation of ARB in the environment. Furthermore
transport into ground water and streams may be detrimental if the ARPs are ultimately
mobilized to opportunistic human pathogens residing in the aquatic ecosystems.
Given the potential threats of manure application in releasing bacteria carrying
ARPs into the environment further studies are required to measure the diversity of ARPs
in manure and quantify their fate following application to agricultural fields. In this
investigation a unique multiple antibiotic resistance plasmid was isolated from swine
manure and its detection in soil following application of the manure to an agricultural
field was demonstrated.
3.2. Materials and methods
3.2.1. Sample preparation, plasmid DNA extraction and resistance characterization
Plasmids were isolated from swine manure slurry obtained from a southern
Saskatchewan pork producer; this slurry was later applied as fertilizer onto a research
field at the Canada-Saskatchewan Irrigation Diversification Centre located in Outlook,
Saskatchewan, Canada. Fifty ml of the liquid manure was re-suspended in 500 ml sterile
water, solid particles were allowed to settle for 30-45 minutes and the liquid was filtered
through a 0.45µm membrane filter (Millipore Inc, USA) using vacuum filtration. Filters
were placed in a flask containing 250 mL Luria-Bertani (LB) medium (Sambrook et al.
Page 70
46
1989) supplemented with erythromycin (400 µg/mL) and cultured overnight at 37°C with
agitation. Total plasmid DNA from the culture media was isolated and purified using a
NucleoBond® Xtra Midi prep kit (Macherey Nagel, Duren, Germany) according to
manufacturer’s instructions. DNA yield was estimated using a NanoDrop 1000
spectrophotometer (Thermo Fischer Scientific Inc). Five μl of plasmid DNA (50 ng/μL)
was used to transform high efficiency DH10β E.coli competent cells (Invitrogen,
Carlsbad, CA, USA) with selection on LB agar plates supplemented with 400 μg/mL
erythromycin. The transformed colonies were subsequently tested for antibiotic resistance
in LB plates supplemented with various antibiotic concentrations; erythromycin (400
μg/mL), tetracycline (10 μg/mL), gentamicin (15 μg/mL), streptomycin (100 μg/mL),
kanamycin (50 μg/mL), neomycin (20 μg/mL) ampicillin (100 μg/mL), streptomycin
(100 μg/mL), spectinomycin (100 μg/mL), rifampicin (30 μg/mL). Transformed strains
displaying multiple resistances were selected and stored at -80 °C in LB broth containing
400 μg/mL erythromycin and 10% glycerol. The size of the plasmids were estimated by
Eckhardt gel electrophoresis as described by (Hynes et al. 1985). The pMC2 clone was
selected from the library for further characterization.
3.2.2. Plasmid DNA sequencing and bioinformatics analysis
The plasmid DNA (25 ng/µL) was sequenced using a Roche GS-FLX sequencer-
454 technology at the Public Health Ontario Laboratories (ON, Canada). The sequence
data obtained was imported into Sequencher computer software (GeneCodes®
Corporation, Ann, Arbor, Michigan). Sequence reads and contigs were analyzed using
the basic local alignment search tool (BLAST) (http://www.ncbi.nml.nih.gov/BLAST/).
Page 71
47
A complete consensus sequence was imported into an online computer program
GeneMark heuristic model 2.0 version 2.8 (http://opal.biology.gatech.edu/genemark/) for
gene predictions (Besemer and Borodovsky 1999; Besemer et al. 2001). Amino acid
translated sequences were compared against the conserved domain database (CDD) using
post specific iterative (PSI)) BLAST search tool (Altschul et al. 1997). Primers for
polymerase chain reaction (PCR) and mapping of the plasmid were designed using
Primer 3 (v. 0.4.0) online program (http://frodo.wi.mit.edu/primer3/) (Rozen and
Skaletsky 2000), and oligos were obtained from Sigma-genosys (https://row.sigma-
genosys.eu.com/). Visual gene annotations and a visual map were generated using vector
NTI 10.3.0 computer software (Invitrogen Corporation). Additional protein annotation
and domain predictions were analyzed using Simple Modular Architecture Research Tool
(SMART) program version 3.4, genomic MODE (http://smart.embl-heidelberg.de/)
(Letunic et al. 2009). Complete DNA sequence comparisons with other closely related or
similar plasmid sequences was performed by Mauve multiple genome alignment software
version 2.0 (http://gel.ahabs.wisc.edu/mauve/) (Darling et al. 2010). The complete
annotated nucleotide sequence of the plasmid pMC2 is available in GenBank database
under accession number JN704639.
3.2.3. Detection of pMC2 in manure applied soil
Liquid swine manure was applied to a nine-hectare research field site at the
Canada-Saskatchewan Irrigation Diversification Center (Outlook, Saskatchewan). The
field had never received manure or any organic fertilizers in the last decade (T. Hogg,
Personal Communication). The liquid manure was applied via injection from tanker
Page 72
48
trucks at a rate of approximately 20,000 L/ ha on May 20-21, 2010. The field was
subsequently cultivated with corn. Soil samples were obtained on November 20, 2009,
prior to swine manure application, and at intervals following application until October
2010. Two hundred and fifty gram of soil was collected in triplicate at soil depths of 0-10
cm, 10-20 cm, 20-30 cm, from the four different sites of the field (north east, NE; North
West, NW; South East, SE; South West, SW). The soil samples collected before and
following manure application were from varying depths of 0-10 cm, 10-20 cm, and 20-30
cm. DNA was extracted from the soil using the PowerSoil DNA Isolation Kit and the
manufacturer's protocol (MoBio Laboratories Inc., Carlsbad, CA, USA). DNA
concentration was determined using a Nanodrop spectrophotometer (Thermo Scientific,
ON, Canada) and the DNA samples were stored at -20 ºC. DNA samples used for PCR
detection of various pMC2 markers were selected from samples where total DNA
concentrations were above 5 ng/μL . In total 15 samples after manure application and 5
samples before manure application were selected for PCR analysis. Several primer pairs
were used targeting the pMC2 repA, tetA(C) as well as intergenic regions within the
tnpA-IS102/merR (transposon/ mercury resistance region) and chrA area (chromium
resistance region) (Table 3.1). A duplex PCR reaction was performed using primer pairs;
Rep3-F, Rep4-R, tetA1-F, tetA2-R and primer pairs IS102A-F, merC2-R and chr1-F,
chr3-R were used in single PCR reactions. A total of 25 μL reaction master mix was
prepared containing; 4 μL of template DNA (5 ng/μL), 2.5 μL of primers (3 μM), 2,5 μL,
2.5 μL of dNTPs (100 mM), 2.5 μL of MgSO4 (20 mM), 2.5 μL of 10X reaction buffer,
0.2 μL of Taq DNA polymerase (5U/μL) and 8.8 μL of de-ionized sterile water.
Page 73
49
Table 3.1: Description of PCR primer pairs designed for this study
Primer
name
Target gene/ region Sequence (5’3’) Region**
(nucleotides)
Amplicon
size (bp)
Rep3-R
Rep4-F
repA / replication CCGTCCGTTCTTTCCTTG
GAGGGCAGGAACTGCTGA
21480-142 781
TetA1-F
TetA2-R
tetA / Tetracycline resistance
ACGACCATCAGGGACAGC
GACTTCCGCGTTTCCAGA
17901-18470
569
IS102A-F*
MerC2-R*
tnpA-IS102/ merR mercury resistance
TGTCAGTAAGCGGGCAAAG
CAAGCCTTACGGCAGCAT
2008-2587 579
Chr1-F*
Chr3-R*
chrA/ chromium resistance AGGGGGTCATGCTCAACA
CGCAGTTCATCGTGACAGA
14300-15173 873
* Primers target the intergenic region; ** regions correspond to the pMC2 plasmid
sequence
Page 74
50
The following conditions were used in both duplex and single PCR reaction cycle; 94 °C
for 5 minutes initial denaturing, followed by 30 cycles [of denaturing at 94 °C; 50 °C for
30 seconds for duplex PCR, annealing; 58 °C for 30 seconds for single PCR, extension;
72 °C for 2 minutes] and final extension at 72 °C for 5 minutes. Cloned PCR products
were sequenced to confirm correct amplification of target sequences and compared with
other sequences in the NCBI database using the BLASTn. The frequency of detection
(FOD) of the repA and tetA(C) genes and intergenic regions surrounding tnpA-
IS102/merR and chrA in the soil was determined by calculating the number of positive
amplification/detections of the target gene/sequence and dividing the number by total
number of samples analyzed as described by Storteboom et al (2010).
3.2.4. Plasmid mobilization
To test if the predicted mobilization genes annotated in the pMC2 DNA sequence
are functional, mobilization of the plasmid was performed. pMC2 was transformed into
chemically competent cells of the genetically engineered mobilizer E.coli strain S17-1
which has the pRP4 plasmid tra region integrated into its chromosome, (Simon et al.
1983). Donor S17-1 E. coli strain is auxotrophic for proline and does not grow on
minimal media. Recipient strains included DH5α E. coli carrying a kanamycin resistant
non-mobilizable plasmid, pUCP20tk (West et al. 1994) and an environmental isolate of
Pantoea agglomerans (Kindly supplied by Dr. Stavrinides). E. coli was selected as a host
with the highest probability for successful conjugation while P. agglomerans was
selected as another member of the Enterobacteriaceae that is an opportunistic pathogen
and is often isolated from agricultural environments. Both recipients are erythromycin
Page 75
51
sensitive. For conjugation, one ml of overnight donor and recipient cultures were
centrifuged at 7,000 rpm for three minutes and the pellet was resuspended in 100 μL of
LB broth. 100 μL of donor was mixed with 100 μl recipient and the mixture including
100 μL of controls were spot plated on LB agar plates and incubated overnight at 37 °C.
Colonies were then scraped from LB plates and resuspended in 900 μL sterile water, 100
μL of serial dilutions were plated on LB plates with selectable antibiotic markers. DH5α
E. coli transconjugants were selected on LB supplemented with erythromycin (400
μg/mL) and kanamycin (50 μg/mL), and P. agglomerans transconjugants were selected
on Vincent’s minimal medium (VMM) with 1% mannitol (Vincent, 1970) supplemented
with erythromycin (400 μg/mL). All the transconjugants were confirmed for plasmid
carriage by DNA isolation and subsequent PCR targeting the pMC2 replication and
tetracycline resistance genes. Conjugation transfer frequencies were calculated as the
number of transconjugants per recipient cell (Phornphisutthimas et al. 2007; Soda et al.
2008).
3.3. Results
3.3.1. DNA analysis of pMC2
Roche 454 DNA sequencing and subsequent assembly yielded a single contig
with an average depth of coverage of 25x. PCR reactions were used to confirm the
correct contig assembly and confirm that pMC2 is a circular plasmid. The plasmid length
is 22,102 bp and annotation prediction lists at least 30 genes with functions involved in
antibiotic resistance, heavy metal resistance, replication, conjugative mobility as well as
hypothetical genes of unknown function (Figure 3.1, Table 3.2).
Page 76
52
Figure 3.1: A physical map of a mobilizable plasmid pMC2, showing the genetic
organization and structure of the plasmid. The different colours represent all the predicted
genes (solid purple) and regions encoding putative functions such as replication and
maintenance (red boxes), antibiotic resistance (blue cross hatched), heavy metal
resistance (green vertical lines), transposons and insertion sequences (light yellow),
hypothetical open read frames (pink white).
Page 77
53
Table 3.2: The annotated 22,102 bp nucleotide sequence of a multiple-resistance and
mobilizable plasmid pMC2
ORF
no.
Gene Size
aa
Product/ encoded function Score/Evalue; aa identity (%) GenBank
accession no.
1 repA 316 Putative replication protein 649(1674)/ 0.0; 315/316 (99%) FJ58001
2 orfA 138 Hypothetical protein 282 (721)/ 3e-74; 137/137 (100%) FJ58001
3 tnpA-IS102 114 Tn903 putative transposase 238 (606)/ 7e-61; 114/114 (100%) FJ58001
4 merR 120 Mercuric ion regulatory protein 236 (601)/ 3e-60; 120/120 (100%) AJ851089
5 merT 101 Mercuric ion transport protein 178 (452)/ 5e-43; 101/101 (100%) AJ851089
6 merP 194 Mercuric ion transport protein 300 (768)/ 1e-79; 194/194 (100%) AJ851089
7 merC 150 Mercuric ion transport protein 269 (687)/ 3e-70; 150/150 (100%) AJ851089
8 merA 345 Mercuric ion reductase 679 (1752)/ 0.0; 345/345 (100%) AJ851089
9 merD 68 Mercuric ion regulatory protein 58.9 (141)/ 6e-07; 68/68 (100%) AJ851089
10 mere 305 Unknown 541 (1394)/ 3e-152; 305/305 (100%) AJ851089
11 urf2 92 Conserved hypothetical protein (447) 2e-42/ 92/92 (100%) AJ851089
12 tniAdelta 206 Tn402 transposase 418 (1074)/ 4e-115; 206/206 (100%) AJ851089
13 tnpA-IS26 64 IS26 transposase 133 (334)/ 2e-29; 64/64 (100%) AJ851089
14 mph(A) 301 Macrolide phosphotransferase 537 (1384)/ 5e-151; 301/301 (100%) AJ851089
15 mrx(A) 412 Hydrophobic protein 520 (1338)/ 1e-145; 412/412 (100%) AJ851089
16 mphR(A) 120 Macrolide resistance repressor protein 204 (518)/ 1e-50; 120/120 (100%) AJ851089
17 mphR(A) 40 Macrolide resistance repressor protein 85.5 (210)/ 6e-15; 40/40 (100%) AJ851089
18 orfB 79 Hypothetical protein 102 (255)/ 4e-20; 51/51 (100%) AJ851089
19 tnpA-IS6100 273 IS6100 transposase 540 (1390)/ 9e-152; 273/273 (100%) AJ851089
20 orfC 101 Conserved hypothetical protein 176 (445)/ 4e-42; 101/101 (100%), AJ698325
21 chrA-like 452 Chromate ion transporter 874 (2259)/ 0.0; 420/429 (98%) AJ698325
22 tnpA-IS102 74 Tn903 putative transposase 154 (388)/ 1e-35; 74/74 (100%) AF550679
23 tetR 219 Tetracycline repressor protein 450 (1157)/ 1e-124; 219/219 (100%) AJ639924
24 tetA(C) 292 Tetracycline efflux protein 482 (1240)/ 2e-134; 275/275 (100%) AJ639924
26 orfD 63 Hypothetical protein 129 (323)/ 4e-28; 63/63 (100%) AJ639924
27 orfE 101 Putative phage integrase 202 (515)/ 2e-50; 101/101 (100%) FJ158001
28 mobX 194 putative mobilization protein 360 (925)/ 8e-98; 194/194 (100%) FJ158001
29 mobA 371 putative mobilization protein 695 (1793)/ 0.0; 370/371 (99%) FJ158001
30 traD 155 Conjugative transfer protein 222 (566)/ 3e-56; 155/155 (100%) FJ158001
Abbreviation: aa, amino acid
Page 78
54
A 9,256 bp pMC2 region shares high similarity to pSC101 (genbank accession
number X01654), a 9,239 bp naturally occurring low copy number plasmid originally
described by Cohen and Chang (1977), and DNA sequenced by (Bernardi and Bernardi
1984). pMC2 also shares close sequence identity to a recently described 9,323 bp plasmid
(genbank accession number FJ158001) isolated from a tetracycline resistant bacterial
community sampled from a porcine gut (Kazimierczak et al. 2009). The accessory region
of pMC2 containing mercury and the macrolide resistance modules has a high similarity
to a region in a large 120,592 bp multiple resistance plasmid pRSB107 isolated from a
wastewater treatment plant in Germany (Szczepanowski et al. 2005) (Figure 3.2).
3.3.2. Organization of resistance genes on pMC2
The resistance genes are clustered together with several transposable elements. The
tetR(C),coding for repressor protein and tetA(C), coding for tetracycline efflux protein
(class C) genes responsible for tetracycline resistance(McNicholas et al. 1992), are found
downstream of the tnpA-IS102; a Tn903 transposon associated with insertion sequence
IS102. The macrolide resistance gene cluster comprised of mph(A), mrx(A) and
mphR(A), appears between insertion sequence elements IS26 and IS6100. The putative
heavy metal resistance genes are also found organized in a similar fashion in the pMC2
backbone. The mercury resistance operon consists of a set of genes which code for
mercuric ion regulatory (merR, merD), mercuric ion transport (merP, merT, merC),
mercuric ion reductase (merA) and unknown function (merE) proteins responsible for
narrow-spectrum resistance to inorganic mercury (Schluter et al. 2003; Rojas et al. 2011).
Page 79
55
Figure 3.2: Mauve comparison of the pMC2 nucleotide sequence (22,102 bp) to other
plasmid DNA sequences of high identity in the Genbank database. Uncultured bacterial
clone 2 (FJ158001) is a 9,323 bp DNA fragment isolated from the pig gut, pSC101
(X01654) is a 9,263bp natural low copy number plasmid isolated from Salmonella, and
pRSB107 (AJ851089) is a 120,592 bp conjugative plasmid isolated from a wastewater
treatment plant. The pMC2 shares high identity to uncultured clone 2 and pSC101
plasmids which carry only the tetracycline, mobilization (MOB) and replication modules.
The additional resistance genes in pMC2 plasmid including macrolide module, mercury
operon and chromate ion transporter are shared with pRSB107.
Page 80
56
Downstream of the mercury operon is a conserved hypothetical gene (urf2) associated
with the Tn402 transposon. Another heavy metal resistance gene, chrA, codes for
chromate ion transporter proteins responsible for chromium resistance (Cervantes et al.
1990; Cervantes and Silver 1992). This gene is found upstream of the Tn903/IS102
element, associated with another conserved hypothetical gene (orfC) and insertion
sequence IS6100.
The Tn903/IS102 element is located downstream of repA gene and hypothetical
orfA gene carrying the helix-turn-helix (HTH) DNA binding domain of truncated merR-
like proteins, and upstream of the tetR(C). The Tn903/IS102 element carries a DDE motif
coding for a putative DDE and IS102 transposase. The putative mercury resistance
operon, macrolide resistance gene cluster and the putative chromate resistance gene are
all located within the Tn903/IS102 element, the mercury and the macrolide resistance
modules are both associated with IS26 and have also been identified in the Tn21 multiple
resistance transposons such as the one carried by plasmid pRSB107 (Figure 3.3, a).
3.3.3. pMC2 replication and mobilization
Plasmid pMC2 has a single replication gene repA, and conjugative mobilization
genes mobA, mobX, and traD (also trwB) which represent the core mobilization (MOB)
unit of the pMC2 backbone (Figure 3.3, b). The repA replicon is homologous to the
proteins classified into the rep3 super family of proteins and serves as replication initiator
(Bertini et al. 2010). The mobA gene has been described as an endonuclease which serves
a function as virD2-like DNA relaxase of the type IV secretion system, responsible
Page 81
57
Figure 3.3: Genetic organization of the pMC2 resistance region and conjugative
mobilization (MOB) region. (a) Shows a pMC2 resistance region associated with
Tn903/IS102 element in comparison with pRSB107 Tn21 resistance region. Genes
connected with dotted lines shows 100% similarity at nucleotide level. (b) shows the
MOB unit (mobA, mobX, oriT, traD) and plasmid replication region; origin of
replication (oriC), the promoter (P) and repA replicon. Also shows the protein
annotations predicted and generated by SMART genomic program.
Page 82
58
for cleaving a specific site at the origin of transfer (oriT) initiating plasmid DNA transfer
during conjugation (Smillie et al. 2010). The oriT is predicted to be located downstream
of the mobA gene, and upstream of the traD gene, which encodes the type IV secretion
system coupling protein (T4CP). In vitro conjugation experiments indicated that the
pMC2 plasmid could be mobilized into E.coli DH5α (pUCP20tk) at a very high
frequency of transfer of 6.2 x 10⁻¹
transconjugants per recipient cell, confirming the
functionality of the predicted mob region. The pMC2 plasmid was also mobilized into P
agglomerans at a frequency of transfer of 2.63 x 10⁻⁵
transconjugants per recipient cell.
Plasmid mobilization required tra genes provided by the broad host-range helper plasmid
pRP4.
3.3.4. pMC2 detection in agricultural soil following spread of swine manure
PCR amplicons corresponding to internal regions of the pMC2 repA gene,
tetA(C) gene, and intergenic regions spanning the tnpA-IS102/ merR, and the tnpA-
IS102/chrA, were detected in soil samples following manure spreading. PCR using DNA
isolated from 5 control soil samples, taken before manure application did not yield
detectable amplicons. Analysis of the sequenced PCR products confirmed correct
amplification of target sequences. The majority of detections occurred in the 0-10 cm soil
fractions and in fact only the tetA(C) marker was detected in 3 of the 10-20 cm fraction
soil samples. The tetA (C) gene and repA gene amplicons were detected most frequently
in the soil samples. Notably, amplicons were detected in DNA from soil sampled in both
June and October of 2010 (Table 3.3, Figure 3.4).
Page 83
59
Table 3.3: PCR amplification of target sequences in selected soil DNA samples collected
at different times and locations following addition of the swine manure.
Soil DNA Samples Target gene/region
No Location Depth
(cm)
Date
(DD/MM/YY)
repA tetA IS102/merR chrA
C* NW 0-10 20/11/09
1* NW 0-10 04/06/10 + + + +
2 NE 0-10 10/06/10 +
3 SW 0-10 21/06/10 + +
4 NE 0-10 21/06/10 +
5 SW 0-10 21/06/10 + +
6* NE 0-10 19/10/10 + + + +
NW, North West; SW, South West; NE, North East; +, positive amplification of target
gene/region by PCR
* The gene marker detection from these samples are shown in Figure 3.3
C- Control soil sample, sampled before manure addition
Page 84
60
Figure 3.4: Gel electrophoresis picture showing examples from PCR amplification of soil
DNA by; (a) duplex PCR targeting the repA pMC2 replication region (781 bp amplicon)
and tetA (C) tetracycline gene region (569 bp amplicon), (b) PCR targeting insertion
sequence 102/mercury repressor gene region (579 bp) and (c) region that includes the
chromate resistance gene (chrA) and upstream intergenic region of pMC2 (873 bp). Lane
M; 1kb DNA marker (Fermentas). Lane C1, C2, C3; are positive controls; pMC2 plasmid
DNA, pig manure community DNA1 (uncultured sample), pig manure DNA2 (cultured
sample from LB-erythromycin-tetracycline enrichment broth) respectively. Lane S1; Soil
DNA1 of the soil before manure application collected on 20/11/2009 (negative control).
Lane S2, S3; are DNA extracted from soil samples obtained after manure application
collected on 04/06/2010 and 19/10/2010 respectively. Lane (-); PCR negative control
with no template DNA added.
Page 85
61
3.4. Discussion
Based on DNA sequence analysis, pMC2 may have acquired multiple resistance
genes through insertion of a mobile genetic element. Salmonella plasmid pSC101 and
uncultured bacterium clone 2 from the tetracycline resistome of the pig intestine may
represent a common ancestral backbone with the replication, mobilization and
tetracycline resistance genes. In addition, both plasmids also have a similar Tn903/IS102
element with a DDE motif. The nomenclature is based on the relatedness of previously
described Tn903 kanamycin-resistance transposon and pSC101-IS102 element (Bernardi
and Bemardi 1981; Oka et al. 1981). The DDE domain within the Tn903/IS102 element
in pMC2 has been disrupted by insertion of an additional 12,762 bp resistance region
containing mercury, macrolide and chromium resistance genes (Figure 3.5). The insertion
event resulted in simultaneous acquisition of both the macrolide resistance module and
heavy metal resistance genes. The presence of the transposable elements (IS elements and
transposons) in pMC2 is notable, and given the relatively small size of the plasmid, it can
potentially insert itself into bacterial chromosomes or other plasmids by insertion and
transposition events, which can lead to the development of larger multiple resistance gene
plasmids (Bennett 2008).
Many plasmids conferring resistance to antibiotics have been frequently found in
association with genes coding for resistance to heavy metal (Tennstedt et al. 2003; Stokes
et al. 2006; Moura et al. 2007). This association is not well understood, some studies
have suggested the presence of both antibiotic and metal resistance genes may help in
plasmid maintenance in environments with no antibiotic selection pressure (Schluter et al.
2005; Schluter et al. 2008). For example in environments polluted with mercury,
Page 86
62
Figure 3.5: A diagram showing the insertion of the 12,762 bp region containing mercury,
macrolide and chromium resistance genes into a truncated Tn903/IS102 element with a
putative transposase encoding DDE motif. (i) An undisrupted pSC101 tnpA-IS102 with
DDE motif. (ii) A disrupted pMC2 tnpA-IS102 derivative. (iii) A 12,762 bp resistance
region, this region is flanked by 25 bp inverted repeats sequences and is inserted between
the truncated DDE motif.
Page 87
63
antibiotic resistant bacterial communities carrying such plasmids will be co-selected.
Other heavy metals that have been detected in pig manure slurry and agricultural soils
include As, Cu, Zn, and have been shown to co-select and enhance the spread of
antibiotic resistance genes in microbial populations found in the soil (Bolan et al. 2004;
Marcato et al. 2009; Berg et al. 2010; Heuer et al. 2011). Furthermore, co-selection may
arise from the use of macrolides in swine husbandry, for example tylosin use as a growth
promoter in swine has been implicated with the development of macrolide resistance in
bacteria (Alban et al. 2008; Chen et al. 2010; Juntunen et al. 2011).
Plasmid pMC2 is a mobilizable plasmid with a MOB region that is 99% identical,
at the nucleotide level, to the Salmonella plasmid pSC101 and uncultured bacterium
clone 2 plasmid. The presented experimental data confirmed that pMC2 can be mobilized
in the presence of a conjugative helper plasmid. The mobA and mobX region of pMC2
has been described in plasmid pSC101, mutations in either gene affects mobilization
(Meyer 2000; Becker and Meyer 2003; Meyer 2009). The mobA domain shares similar
functions with the incQ type relaxases (Grohmann et al. 2003), such as those found in
broad host range incQ mobilizable plasmid R1162 (M13380) and RS1010 (M28829). The
MOB unit of these incQ plasmids consists of mobA, mobB and mobC (see (Meyer
(2000); Becker and Meyer (2003) for comparisons). Plasmid pMC2, like pSC101, R1162,
RSF1010 are classified into MOBQ group based on related sequences and functions of the
MOB units, this group is comprised of relatively small mobilizable plasmids ranging up
to 30 kb in size (Garcillán-Barcia et al. 2011). The presence of a functional MOB unit
implies that pMC2 could contribute to the transfer and spread of antibiotic resistance
genes in the environment.
Page 88
64
The detection of pMC2 sequences in soil samples taken in October 2010 are
suggestive that pMC2 can be maintained in bacterial populations within the soil for a
substantial period following its introduction in the soil by manure application in May
2010. The tetracycline resistance gene amplicon was detected at high frequencies and
below the top soil. This is likely due to the fact that the PCR primers are capable of
amplifying tetA(C) genes in DNA from other sources found in the manure in addition to
pMC2. Notably, the tetA(C) marker was not detected in the selected DNA samples
obtained before manure application. Therefore, its higher rate of detection relative to the
pMC2 specific amplicons related to intergenic regions suggests a greater diversity of
DNA elements carrying a tetA(C) gene. This observation is consistent with results from
other studies, for example, several tetracycline resistance genes have been detected by
PCR from lagoon and groundwater close to the pig production facility during a period of
over one year (Koike et al. 2007). Similarly, Storteboom and colleagues (2010) have
observed high FOD of sulphonamide and tetracycline resistance genes in various
environments associated with agricultural practices.
Application of manure to soil has been suggested to contribute significantly to the
release of antibiotic resistant bacteria populations into the soil (Binh et al. 2008; Chee-
Sanford et al. 2009; Heuer et al. 2011). Our results further demonstrate that multiple
antibiotic resistance plasmids are a likely genetic element within these populations and
have the potential to persist and potentially mobilize to native soil bacteria. The fate of
multiple resistance plasmids in the soil after manure application in the field may depend
on a variety of factors. Conditions such as temperature and pH of the soil may play an
important role in survival of plasmid-carrying hosts in the soil. Soil contamination by
Page 89
65
other antimicrobials substances including erythromycin, tetracycline and mercury
residues may also play a role in the maintenance of pMC2 in soil bacterial communities.
3. 5. Conclusion
This study has shown that swine manure is a source of multiple antibiotic
resistance plasmids such as pMC2, these plasmids can be mobilized and potentially
transfer resistance genes to other bacterial species through conjugation mechanisms, and
the presence of mobile elements may further disseminate the genes through transposition.
In addition, multiple resistance plasmids can persist in the soil for a significant time
following introduction into a previously untreated soil environment. This persistence may
allow further environmental spread of bacteria carrying antibiotic resistance plasmids
through transport into water sources from run-off events. Future research should monitor
transport of plasmids like pMC2 from manure spread soils into water and measure their
persistence in aquatic ecosystems using quantitative molecular methods. Accurate
quantification of pMC2 in the soil could help determine the significance of multiple
resistance plasmids as pollutants (Rahube and Yost, 2010) released into the environment
and their potential to spread to human pathogenic bacteria.
3.6. Literature cited
Aarestrup, F.M., Oliver Duran, C. and Burch, D.G.S. (2008) Antimicrobial resistance in
swine production. Animal Health Research Reviews 9, 135-148 M133 - 110.1017
Alexander, T., Yanke, J., Reuter, T., Topp, E., Read, R., Selinger, B. and McAllister, T.
(2011) Longitudinal characterization of antimicrobial resistance genes in feces
Page 90
66
shed from cattle fed different subtherapeutic antibiotics. BMC Microbiology 11,
19.
Alexander, T.W., Reuter, T., Sharma, R., Yanke, L.J., Topp, E. and McAllister, T.A.
(2009) Longitudinal characterization of resistant Escherichia coli in fecal deposits
from cattle fed subtherapeutic levels of antimicrobials. Applied Environmental
Microbiology 75, 7125-7134.
Alexander, T.W., Yanke, L.J., Topp, E., Olson, M.E., Read, R.R., Morck, D.W. and
McAllister, T.A. (2008) Effect of subtherapeutic administration of antibiotics the
prevalence of antibiotic-resistant Escherichia coli bacteria in feedlot cattle.
Applied Environmental Microbiology 74, 4405-4416.
Altschul, S.F., Madden, T.L., Schäffer, A.A., Zhang, J., Zhang, Z., Miller, W. and
Lipman, D.J. (1997) Gapped BLAST and PSI-BLAST: A new generation of
protein database search programs. Nucleic Acids Research 25, 3389-3402.
Aminov, R.I. (2009) The role of antibiotics and antibiotic resistance in nature.
Environmental Microbiology 11, 2970-2988.
Bennett, P.M. (2008) Plasmid encoded antibiotic resistance: acquisition and transfer of
antibiotic resistance genes in bacteria. British Journal of Pharmacology 153,
S347-S357.
Bernardi, A. and Bemardi, F. (1981) Complete sequence of an IS element present in
pSCl0l. Nucleic Acids Research 9, 2905-2911.
Bernardi, A. and Bernardi, F. (1984) Complete sequence of pSC101. Nucleic Acids
Research 12, 9415-9426.
Page 91
67
Bertini, A., Poirel, L., Mugnier, P.D., Villa, L., Nordmann, P. and Carattoli, A. (2010)
Characterization and PCR-based replicon typing of resistance plasmids in
Acinetobacter baumannii. Antimicrobial Agents and Chemotherapy 54, 4168-
4177.
Besemer, J. and Borodovsky, M. (1999) Heuristic approach to deriving models for gene
finding. Nucleic Acids Research 27, 3911-3920.
Besemer, J., Lomsadze, A. and Borodovsky, M. (2001) GeneMarkS: A self-training
method for prediction of gene starts in microbial genomes. Implications for
finding sequence motifs in regulatory regions. Nucleic Acids Research 29, 2607-
2618.
Binh, C.T.T., Heuer, H., Kaupenjohann, M. and Smalla, K. (2008) Piggery manure used
for soil fertilization is a reservoir for transferable antibiotic resistance plasmids.
Fems Microbiology Ecology 66, 25-37.
Cervantes, C., Ohtake, H., Chu, L., Misra, T.K. and Silver, S. (1990) Cloning, nucleotide
sequence, and expression of the chromate resistance determinant of Pseudomonas
aeruginosa plasmid pUM505. The Journal of Bacteriology 172, 287-291.
Cervantes, C. and Silver, S. (1992) Plasmid chromate resistance and chromate reduction.
Plasmid 27, 65-71.
Cessna, A.J., Larney, F.J., Kuchta, S.L., Hao, X., Entz, T., Topp, E. and McAllister, T.A.
(2011) Veterinary antimicrobials in feedlot manure: Dissipation during
composting and effects on composting processes. Journal of Environmental
Quality 40, 188-198.
Page 92
68
Chee-Sanford, J.C., Mackie, R.I., Koike, S., Krapac, I.G., Lin, Y.F., Yannarell, A.C.,
Maxwell, S. and Aminov, R.I. (2009) Fate and transport of antibiotic residues and
antibiotic resistance genes following land application of manure waste. Journal of
Environmental Quality 38, 1086-1108.
da Costa, P.M., Oliveira, M., Ramos, B. and Bernardo, F. (2011) The impact of
antimicrobial use in broiler chickens on growth performance and on the
occurrence of antimicrobial-resistant Escherichia coli. Livestock Science 136,
262-269.
Darling, A.E., Mau, B. and Perna, N.T. (2010) Progressive Mauve: Multiple genome
alignment with gene gain, loss and rearrangement. PLoS One 5, e11147.
Ghosh, S. and LaPara, T.M. (2007) The effects of subtherapeutic antibiotic use in farm
animals on the proliferation and persistence of antibiotic resistance among soil
bacteria. ISME J 1, 191-203.
Heuer, H., Kopmann, C., Binh, C.T.T., Top, E.M. and Smalla, K. (2009) Spreading
antibiotic resistance through spread manure: Characteristics of a novel plasmid
type with low %G plus C content. Environmental Microbiology 11, 937-949.
Hynes, M.F., Simon, R. and Puhler, A. (1985) The development of plasmid-free strains
of agrobacterium-tumefaciens by using incompatibility with a Rhizobium meliloti
plasmid to eliminate pATC58. Plasmid 13, 99-105.
Kazimierczak, K.A., Scott, K.P., Kelly, D. and Aminov, R.I. (2009) Tetracycline
resistome of the organic pig gut. Applied and Environmental Microbiology 75,
1717-1722.
Page 93
69
Letunic, I., Doerks, T. and Bork, P. (2009) SMART 6: Recent updates and new
developments. Nucleic Acids Research 37, D229-D232.
Martinez, J.L. (2009a) Environmental pollution by antibiotics and by antibiotic resistance
determinants. Environmental Pollution 157, 2893-2902.
Martinez, J.L. (2009b) The role of natural environments in the evolution of resistance
traits in pathogenic bacteria. Proceedings of the Royal Society B-Biological
Sciences 276, 2521-2530.
McNicholas, P., Chopra, I. and Rothstein, D.M. (1992) Genetic analysis of the tetA(C)
gene on plasmid pBR322. Journal of Bacteriology 174, 7926-7933.
Nicolau, D.P. (2011) Current challenges in the management of the infected patient.
Current Opinion in Infectious Diseases 24, S1-S10.
Oka, A., Sugisaki, H. and Takanami, M. (1981) Nucleotide sequence of the kanamycin
resistance transposon Tn903. Journal of Molecular Biology 147, 217-226.
Peak, N., Knapp, C.W., Yang, R.K., Hanfelt, M.M., Smith, M.S., Aga, D.S. and Graham,
D.W. (2007a) Abundance of six tetracycline resistance genes in wastewater
lagoons at cattle feedlots with different antibiotic use strategies. Environmental
Microbiology 9, 143-151.
Peak, N., Knapp, C.W., Yang, R.K., Hanfelt, M.M., Smith, M.S., Aga, D.S. and Graham,
D.W. (2007b) Abundance of six tetracycline resistance genes in wastewater
lagoons at cattle feedlots with different antibiotic use strategies. Environmental
Microbiology 9, 143-151.
Page 94
70
Phornphisutthimas, S., Thamchaipenet, A. and Panijpan, B. (2007) Conjugation in
Escherichia coli: A laboratory exercise. Biochemistry and Molecular Biology
Education 35, 440-445.
Rojas, L.A., Yáñez, C., González, M., Lobos, S., Smalla, K. and Seeger, M. (2011)
Characterization of the metabolically modified heavy metal-resistant Cupriavidus
metallidurans strain MSR33 generated for mercury bioremediation. PLoS ONE 6,
e17555.
Rozen, S. and Skaletsky, H. (2000) Primer3 on the WWW for general users and for
biologist programmers. Methods in Molecular Biology (Clifton, NJ) 132, 365-386.
Sambrook, J., Fritsch, E.F. and Maniatis, T. (1989) Molecular cloning a laboratory
manual second edition vols. 1 2 and 3. Cold Spring Harbor Laboratory Press,
Cold Spring Harbor, New York, USA Illus Paper.
Schluter, A., Heuer, H., Szczepanowski, R., Forney, L.J., Thomas, C.M., Puhler, A. and
Top, E.M. (2003) The 64 508 bp IncP-1 beta antibiotic multiresistance plasmid
pB10 isolated from a waste-water treatment plant provides evidence for
recombination between members of different branches of the IncP-1 beta group.
Microbiology-Sgm 149, 3139-3153.
Simon, R., Priefer, U. and Puhler, A. (1983) A broad host range mobilization system for
in vivo genetic engineering: Transposon mutagenesis in Gram negative bacteria.
Nature Biotechnology 1, 784-791.
Smillie, C., Garcillan-Barcia, M.P., Francia, M.V., Rocha, E.P.C. and de la Cruz, F.
(2010) Mobility of Plasmids. Microbiology and Molecular Biology Reviews 74,
434-452.
Page 95
71
Soda, S., Otsuki, H., Inoue, D., Tsutsui, H., Sei, K. and Ike, M. (2008) Transfer of
antibiotic multiresistant plasmid RP4 from Escherichia coli to activated sludge
bacteria. Journal of Bioscience and Bioengineering 106, 292-296.
Storteboom, H., Arabi, M., Davis, J.G., Crimi, B. and Pruden, A. (2010) Identification of
antibiotic resistance gene molecular signatures suitable as tracers of pristine river,
urban, and agricultural sources. Environmental Science and Technology 44, 1947-
1953.
Szczepanowski, R., Braun, S., Riedel, V., Schneiker, S., Krahn, I., Puhler, A. and
Schluter, A. (2005) The 120 592 bp lncF plasmid pRSB107 isolated from a
sewage treatment plant encodes nine different antibiotic resistance determinants,
two iron-acquisition systems and other putative virulence-associated functions.
Microbiology-Sgm 151, 1095-1111.
Wassenaar, T.M. (2005) Use of antimicrobial agents in veterinary medicine and
implications for human health. Critical Reviews in Microbiology 31, 155-169.
West, S.E.H., Schweizer, H.P., Dall, C., Sample, A.K. and Runyen-Janecky, L.J. (1994)
Construction of improved Escherichia-Pseudomonas shuttle vectors derived from
pUC18/19 and sequence of the region required for their replication in
Pseudomonas aeruginosa. Gene 148, 81-86.
Winckler, C. and Grafe, A. (2001) Use of veterinary drugs in intensive animal
production. Journal of Soils and Sediments 1, 66-70.
Page 96
72
CHAPTER 4- GENOMIC AND FUNCTIONAL ANALYSIS OF ANTIBIOTIC
RESISTANCE PLASMIDS ISOLATED FROM A WASTEWATER TREATMENT
PLANT
Page 97
73
4.1. Introduction
Wastewater treatment plants (WWTPs) are potential important reservoirs of
multiple antibiotic resistance genes associated with human pathogens (Schluter et al.
2005; Szczepanowski et al. 2005; Schluter et al. 2007). This is mainly because a WWTP
receives human fecal wastes from households containing gut bacteria including antibiotic
resistant bacteria (ARB). The gastrointestinal microbiota is a primary source of resistant
bacteria shed with human waste (LaPara and Burch 2011). People who orally ingest
antibiotics, will consequently enrich for ARB in the gastrointestinal tract. These ARB and
some antibiotic residues are frequently excreted in urine and feces (Ghosh and LaPara
2007), which are transported to wastewater treatment plants via domestic sewer lines.
The MWWTP is designed mainly for reducing the amount of nutrients such as dissolved
and suspended organic carbon as it adversely affects the BOD (biochemical oxygen
demand), when sewage is released into receiving waters. Nitrogen and phosphorus
released from the MWWTP are also detrimental when released into the environmental
aquatic ecosystems due to the effects of eutrophication (Hu et al. 2012). Compared to the
industrial waste, municipal waste may be regarded as less toxic since it often does not
contain dangerous inorganic chemical pollutants associated with industrial processes.
Nonetheless, the MWWTP frequently receive varying concentrations of bioactive,
clinically significant antibiotics and their residues disposed with human waste products
(Chee-Sanford et al. 2009; Subbiah et al. 2011). Therefore, antibiotic residues, antibiotic
resistance genes (ARGs) and mobile genetic elements associated with the resistant
bacteria from humans can be a substantial constituent of the MWWTP (Le-Minh et al.
2010). Other antimicrobial chemical constituents containing quaternary amines and heavy
Page 98
74
metals include household detergents, disinfectants and personal care products (Miege et
al. 2009; Kemper et al. 2010). Resistance to these antimicrobials may also co-select for
antibiotic resistance in other environments such as soil and water ecosystems (Seiler and
Berendonk 2012).
The municipal wastewater influent is characterized by water, dissolved organic,
inorganic chemical particles and microbial components (Chelme et al. 2008; Chouari et
al. 2010; Yang et al. 2010). The influent undergoes several stages of treatment by
physical, biological and chemical processes, before the treated or final effluent is
discharged into the environment (Meric and Fatta Kassinos 2009; Hu et al. 2012). The
conditions at the primary treatment stage such as depleted oxygen, and chronic exposure
to antibiotic concentrations have been reported to induce mutation pathways in bacteria
through SOS response mechanisms, potentially accelerating bacterial evolution
(Baharoglu et al. 2010; Moore et al. 2010). High nutrient content and density of microbial
communities may further promote high frequency interaction between microbial
communities thereby increasing the exchange of genetic material by horizontal gene
transfer mechanisms (e.g. conjugation, transduction, transformation) (Schluter et al.
2003; Moura et al. 2007; Baharoglu et al. 2010; Moura et al. 2010). Collectively, these
events occurring at the primary stage may result in increasing the genetic diversity of
resistance determinants among bacteria from various sources including human associated
microbiota. Ultimately, this may lead to the development of plasmids and bacterial
chromosomes carrying multiple resistance genes (Slater et al. 2008; Bahl et al. 2009).
Bacteria rapidly acquire multiple resistance by acquisition of mobile elements including
Page 99
75
plasmids (by conjugation), transposons (recombination), and integrons encoding multiple
ARGs (Schluter et al. 2007b).
Multiple resistance plasmids have been isolated and their DNA sequenced from
various countries and wastewater environments associated with antibiotic exposure
(Schluter et al. 2005; Ansari et al. 2008; Bahl et al. 2009; Rahube and Yost 2012).
Multiple resistance plasmids from WWTPs have been isolated from the influent,
activated sludge, as well as the final effluent (Szczepanowski et al. 2008; Szczepanowski
et al. 2009). This chapter details the characterization of novel plasmids isolated from the
Regina, Saskatchewan MWWTP influent and effluent wastewater, as well as
characterizing the functions encoded by these plasmids. Analysis of conjugative mobility
and plasmid stability genes is an important aspect in understanding the potential of these
plasmids to disseminate among environmental bacteria and persist in the environment.
4.2. Materials and methods
4.2.1. Plasmid isolation and DNA sequencing
Wastewater influent (before treatment) and final effluent (after treatment) were
collected from the city of Regina wastewater treatment plant (SK, Canada) by city staff
and transported to the lab at 4 °C. Solid particles were allowed to settle for 30-45 mins
before the liquid was filtered through a 0.45μm membrane filter. Total plasmid DNA was
isolated from bacteria cultured on LB agar media supplemented with erythromycin (400
μg/mL). Colonies were scrapped from the media, enriched on LB broth and DNA
extracted using nucleobond Xtra Midi prep kit (Macherey Nagel, Duren, Germany)
following the manufacturer’s instructions. Five μL of purified plasmid DNA was used to
Page 100
76
transform E.coli DH10β competent cells (Invitrogen, Carlsbad, CA, USA) with selection
on LB agar plates supplemented with 400 μg/mL erythromycin. The transformed colonies
were subsequently tested for antibiotic resistance using LB plates supplemented with
various antibiotic concentrations; erythromycin (400 μg/mL), tetracycline (10 μg/mL),
gentamicin (15 μg/mL), streptomycin (100 μg/mL), kanamycin (50 μg/mL), neomycin
(20 μg/mL) ampicillin (100 μg/mL), streptomycin (100 μg/mL), spectinomycin (100
μg/mL), rifampicin (30 μg/mL). Transformed strains displaying multiple resistances were
selected and stored at -80 °C in LB broth containing 400 μg/mL erythromycin and 10%
glycerol in a 96 well plate. The sizes of the plasmids were estimated by Eckhardt gel
electrophoresis as described by Hynes et al. (1985).
Total plasmid DNA was isolated and purified from the selected transformants,
and ~50ng/uL was sent for next generation 454 DNA sequencing at the DNA Core
Facility at the Ontario Agency for Health Protection and Promotion (ON, Canada). The
plasmid DNA was sequenced using a Roche GS-FLX sequencer. The sequence data
obtained was imported and assembled with Sequencher computer software (GeneCodes®
Corporation, Ann, Arbor, Michigan). A Primer walking strategy used to close the gaps is
shown in Figure 4.1 (A) and (B). Polymerase chain reaction (PCR) cloning and
sequencing were performed in mapping of the plasmid to confirm the correct sizes and
orientation of genes. Short and long PCR methods were used for amplification of short
fragments (less than 2000 bp) and long fragment (2000 bp to 6000 bp) respectively. PCR
reactions were carried out as follows; a total of 25 μL reaction mix was prepared
Page 101
77
Figure 4.1 (A): Diagram showing a primer walking strategy used in closing the gaps
between the contigs (Grey bars) obtained from 454 sequencing (>25X sequence
coverage). Plasmid pTOR_01 (Top) was assembled from 5 contigs (A; 2,098 bp, B; 11,
259 bp, C; 2,091 bp, D; 103 bp and E; 3,518 bp). Plasmid pTOR_02 (Bottom) was
assembled from 5 contigs ( A; 2,457 bp, B; 2,529, C; 18,639 bp, D; 426 bp and E;
1,365bp). The arrows show the direction of the different primers and sequences used to
close the gaps.
Page 102
78
Figure 4.1 (B): Diagram showing a primer walking strategy used in closing the gaps
between the contigs (Grey bars) obtained from 454 sequencing (>25X sequence
coverage). Plasmid pEFC36a (Top) was assembled from two 454 contigs (4,950 bp and
82,482 bp). Plasmid pRWC72a (Bottom) was assembled from five 454 contigs (3,559 bp,
335 bp, 172 bp, 55, 875 bp and 820 bp). The arrows show the direction of the different
primers and sequences used to close the gaps.
Page 103
79
Table 4.1. Primers used for primer walking and mapping the plasmids
Primer name (Plasmid) Sequence (5’ 3’) Sequence location†
repU2 (pTOR_01) GAGAAGCAAAAGGCGGAAC 658
repU1 (pTOR_01) TGGCTTCATAGGCTTCACG 1,192
P72bQ (pTOR_01) GAGGGGTTAGCAGGCGTA 1,444
P72bP (pTOR_01) AGTTGGCCACCTGGTTGA 1,553
P72btraN1 (pTOR_01) CAGGTTATCAGCGAGTCG 4,479
P72bO (pTOR_01) TCGCTGTCGTGTTGCTGT 5,086
P72bJ (pTOR_01) TTTGGCCAGCTTGTCGAT 5,291
P72bI (pTOR_01) GCCAACCAGGACAACCAG 5,309
P72bH (pTOR_01) CCCTGGTTGTCCTGGTTG 5,311
72btrB2 (pTOR_01) CTTAGGCCGGACTCTTTC 5,840
72btrB1 (pTOR_01) CCTGTGATAGGGTGAAGGT 5,982
P72bG (pTOR_01) GGGGACGAACTGACAACG 7,615
P72bF (pTOR_01) CGGCTGTTGCTTGTCCTT 8,071
P72b-Zn1 (pTOR_01) AGATGGCGGATTATGCCA 9,025
P72b-Zn2 (pTOR_01) CGAAATCGCCATGAATCC 9,237
72b-orf1 (pTOR_01) AGGATGACGCAGCAAAGG 13,064
72b-orf2 (pTOR_01) TACCTCGGCCACCTTCAG 13,264
PEFmrx 1 (pTOR_01) GCGTCGCTTTTCTCTGGA 17,500
PEFmrx 2 (pTOR_01) ATGCCAAGGAGACCACCA 17,666
72bmphA1(pTOR_01) TACCTCCCAACTGTACGC 19,167
P72bE (pTOR_01) ACTCCTGAGGGCTTGACG 19,213
repU3 (pTOR_01) GGGCCAAGAATTCCCTTTC 20,503
P36MOB (pTOR_02) ATCCGAAAGCGAGCATTG 2,019
P36MOB2 (pTOR_02) TGCAACATACCGCAATGG 2,675
P36MOB3 (pTOR_02) CGGACGTGCTTGATGTTG 3,296
PEForfC1 (pTOR_02) GGGCGACACCAAGCTCTA 3,371
PEForfC2 (pTOR_02) CCCAAGAGGTGCATCAGG 3,419
PEForfB1 (pTOR_02) CGATCACCCGTGCTAACC 5,202
PEForfB2 (pTOR_02) AAACCGAACACGGTTTGC 5,387
P36TN1 (pTOR_02) AGCGTATTGCCGAACTGC 5,825
PEF007T3 (pTOR_02) AATGGCCGAGCAGATCCT 7,070
Page 104
80
Table 4.1 continued
Primer name (Plasmid) Sequence (5’ 3’) Sequence location†
PEF007T7 (pTOR_02) CAGCGAAGTCGAGGCATT 7,789
PEFaT3 (pTOR_02) GTTACGCAGCAGGGCAGT 8,083
PEFdhf (pTOR_02) CTTTCGCCCCATGACAAC 8,259
PEFaT7 (pTOR_02) TTCGATGGTCACCGCTTC 9,035
PEFaad2 (pTOR_02) CTTCGAGCCAGCCATGAT 9,391
PEFqac2 (pTOR_02) TCCATCCCTGTCGGTGTT 10,140
PEFsul2 (pTOR_02) GTTGGGGCTTCCGCTATT 10,924
chr1 (pTOR_02) AGGGGGTCATGCTCAACA 12,208
chr2 (pTOR_02) TGGCAATGGTGGATTCCT 12,330
PEFkT3 (pTOR_02) CTTTGGGCTGGGGATCAT 12,939
PEFkT7 (pTOR_02) AGTGCAGGAGCAACTCAGC 14,800
PEFmrx2 (pTOR_02) GCGTCGCTTTTCTCTGGA 15,674
PEFmrx1 (pTOR_02) ATGCCAAGGAGACCACCA 15,840
PEFjT3 (pTOR_02) TCGGTGTACGGATGAGCA 16,925
PEF012_T3 (pTOR_02) TCCACGTTCAGTCCTTCCA 18,768
PEFjT7 (pTOR_02) TTGTCTCGGCGCCAGGTAT 19,345
merE2 (pTOR_02) CGTTTCCGGCTACCTGTG 20,338
merE1 (pTOR_02) ACGGCCAGAACGAACAAG 20,479
merD1 (pTOR_02) ATCTGGACGCGCAACTG 20,579
merD2 (pTOR_02) CAGTTGCGCGTCCAGAT 20,579
PEF012_T7d (pTOR_02) GGATGACGGTGCAGGAAC 21,018
PEF_iT3 (pTOR_02) GCCGCCACATAGACGAAC 21,356
PEF_iT7 (pTOR_02) AAGGCGCTATCGTCATCG 21,438
PEF_hT3 (pTOR_02) CTGTACGCTGGCCTTGGT 23,172
PEF_gT3 (pTOR_02) TGCACGAAAGGGGAATGT 24,182
PEF_hT7 (pTOR_02) CGAGAAGATGGCCGACTT 24,119
P36IS4 (pTOR_02) CCCAGCCATTTCCAGCTA 24,550
P36IS3 (pTOR_02) CGGCAGCAAGCCAGTAAT 25,137
P36IS2 (pTOR_02) TGGTATGCCTGCGATCAA 25,747
P36IS1 (pTOR_02) ACTGGCCCCCTGAATCTC 26,403
P36REP2 (pTOR_02) AGCGACTGTAACAACCTCCA 27,040
Page 105
81
Table 4.1 continued
Primer name (Plasmid) Sequence (5’ 3’) Sequence location†
P36REP (pTOR_02) TCACATCTCGCCAGGACA 27,653
PEF_fT7 (pEFC36a) CGACCGGAGCCACTTTAG 292
PEFrep2 (pEFC36a) AACTGCGGAAACGCTCAC 937
PEFrep1 (pEFC36a) GGCTTCACCTCCCGTTTT 1,424
PEFeT3 (pEFC36a) TGCCTTCCGTGAGTCCAT 3,569
PEFeT7 (pEFC36a) GCTTCAGGCCGATGCTTA 4,333
PEFdT3 (pEFC36a) TCCGTAAAGGCAGGCATC 6,120
PEFdT7 (pEFC36a) CTGACTTCCAGCCGGACA 6,773
PEFcT3 (pEFC36a) TCAGCCCCCATCATCTGT 48,834
PEFcT7 (pEFC36a) GCTGGTTGCCGTCTGTCT 48,834
PEFbT3 (pEFC36a) CGGTCGGAACATTTCGTA 58,903
PEFbT7 (pEFC36a) ACGCCCGGTAGTGATCTT 59,871
cat2 (pEFC36a) CCATCACAAACGGCATGA 60,302
cat1 (pEFC36a) TGGCGTGTTACGGTGAAA 60,507
PEForfC1 (pEFC36a) GGGCGACACCAAGCTCTA 61,849
PEForfC2 (pEFC36a) CCCAAGAGGTGCATCAGG 61,897
PEF006T3 (pEFC36a) ACGCTCAGTTTCGGCATC 62,207
PEForfB1 (pEFC36a) CGATCACCCGTGCTAACC 63,680
PEForfB2 (pEFC36a) AAACCGAACACGGTTTGC 63,865
PEFC36TN1 (pEFC36a) AGCGTATTGCCGAACTGC 64,303
PEF007T3 (pEFC36a) AATGGCCGAGCAGATCCT 65,548
PEF007T7 (pEFC36a) CAGCGAAGTCGAGGCATT 66,312
PEFaT3 (pEFC36a) GTTACGCAGCAGGGCAGT 66,561
PEFdhf (pEFC36a) CTTTCGCCCCATGACAAC 66,737
PEFaT7 (pEFC36a) TTCGATGGTCACCGCTTC 67,513
PEFaad2 (pEFC36a) CTTCGAGCCAGCCATGAT 67,869
PEFqac2 (pEFC36a) TCCATCCCTGTCGGTGTT 68,618
PEFsul2 (pEFC36a) GTTGGGGCTTCCGCTATT 69,402
PEFchr1 (pEFC36a) AGGGGGTCATGCTCAACA 70,686
PEFchr2 (pEFC36a) TGGCAATGGTGGATTCCT 70,808
PEFkT3 (pEFC36a) CTTTGGGCTGGGGATCAT 71,417
Page 106
82
Table 4.1 continued
Primer name (Plasmid) Sequence (5’ 3’) Sequence location†
PEF010T7 (pEFC36a) AGCCAGCACATGATCAGC 73,207
PEFkT7 (pEFC36a) AGTGCAGGAGCAACTCAGC 73,278
PEFmrx 2 (pEFC36a) GCGTCGCTTTTCTCTGGA 74,152
PEFmrx 1 (pEFC36a) ATGCCAAGGAGACCACCA 74,318
PEFjT3 (pEFC36a) TCGGTGTACGGATGAGCA 75,403
PEF010T3 (pEFC36a) GCCGATACCTCCCAACTGT 75,823
PEF012bT3 (pEFC36a) GATGATCCGTTCCACGATG 77,083
PEFjT7 (pEFC36a)) TTGTCTCGGCGCCAGGTAT 77,823
merE2 (pEFC36a) ACGGCCAGAACGAACAAG 78,816
merE1 (pEFC36a) CGTTTCCGGCTACCTGTG 78,957
merD2 (pEFC36a) CAGTTGCGCGTCCAGAT 79,057
merD1 (pEFC36a) ATCTGGACGCGCAACTG 79,057
PEFiT3 (pEFC36a) GCCGCCACATAGACGAAC 79,834
PEF012bT7 (pEFC36a) CAGTGAGGCACCTATCTCAG 80,065
†; locations where the primers start to bind in the complete annotated nucleotide
sequence.
Page 107
83
containing; 2 μl of plasmid DNA (10-50 ng/μL), 2.5 μl of each primers (2 μM), 2.5 μL of
dNTPs (100mM), 2.5 μL of MgSO4 (20 mM), 2.5 μL of 10X reaction buffer, 0.2 μL of
Taq DNA polymerase (5U/ μL) and 10.3 μL of de-ionized sterile water. The PCR
conditions ; 94 °C for 5 minutes initial denaturing, followed by 30 cycles [of denaturing
at 94 °C; annealing at 58 °C for 30 seconds; extension at 72 °C for 2 minutes (6 minutes
for long PCR)] and final extension at 72 °C for 5 minutes (6 minutes for long PCR).
Primers for PCR mapping were designed using Primer 3 (v. 0.4.0) online program
(http://frodo.wi.mit.edu/primer3/) (Rozen and Skaletsky 2000), and oligos were obtained
from Sigma-genosys (https://row.sigma-genosys.eu.com/). All primers used for primer
walking and mapping the plasmids are listed on Table 4.1.
4.2.2. Comparative genomic analysis and sequence alignments
The complete consensus sequences were prepared such that the sequence begins
with the replication genes at position one. The sequences were imported into the Rapid
Annotation using Subsystem Technology (RAST) server (Aziz et al. 2008) for gene
predictions. The putative conserved domain analysis of translated open reading frame
(ORF) protein sequences were performed using the PSI-BLAST on NCBI server
(http://www.ncbi.nlm.nih.gov/blast/Blast.cgi). Genbank files of annotated plasmid
sequences were imported from the RAST server into Vector NTI 10.3.0 computer
software (Invitrogen Corporation, Carlsbad, CA) for generation of visual maps. The
annotated nucleotide sequences of the plasmids pTOR_01, pTOR_02, pEFC36a and
pRWC72a are available in the Genbank database under accession numbers JX843237,
JX843238, JX486126, and JX486125 respectively.
Page 108
84
Comparative genomic analysis of the plasmid sequences were analyzed using
progressive mauve multiple genome alignment software version 2.0
(http://gel.ahabs.wisc.edu/mauve/) (Darling et al. 2010) for visual comparison with other
related plasmids. Phylogenetic guide trees were generated using clustalW2 sequence
alignment tool on the European Bioinformatics Institute (EBI) server
(http://www.ebi.ac.uk/Tools/msa/clustalw2/).The plasmid sequences used for
comparative genomic analysis were imported from the Genbank database into vector NTI
local database and were also reassembled such that they all start with the replication gene
at position one. The selected sequences are the incP-1β plasmids pB3 (AJ639924), pB4
(AJ431260) pB8 (AJ863570), pB10 (AJ564903) isolated from wastewater treatment
plants, incFII plasmids, R100 (AP000342), pC15-1a (AY458016), pEC_L8 (GU371928),
pEC_46 (GU371929) isolated from pathogenic strains associated with clinical
environments. Other plasmid sequences used in the comparisons and alignments are the
incU plasmids pFBAOT6 (CR376602), pRA3 (DQ401103), pP2G1 (HE616910), and
col-E related plasmids pKHPS4 (CP003226), pIGJC156 (EU090225), pCE10B
(CP003036), pMG828 (DQ995354), pASL01a (JQ480155).
4.2.3. Functional analysis of the plasmids conjugative transfer
Plasmid mobility was determined by in vitro conjugation experiments on LB agar,
the donors used are genetically engineered DH5α E.coli, DH10β E.coli and S17-1 E.coli
competent cells (Invitrogen Corporation, Carlsbad, CA) transformed with the isolated
erythromycin resistant plasmids pTOR_01, pTOR_02, pEFC36a and pRWC72a. The
recipient strains include kanamycin resistant derivatives of DH5α E.coli, P. ananatis and
Page 109
85
erythromycin sensitive P. agglomerans. Pantoea agglomerans was also used as donor
after successful conjugation, with P. ananatis used as a plasmid recipient in order to
determine transfer frequency between Pantoea species. Pantoea species were selected as
environmental and opportunistic pathogens that are also members of the γ –
Proteobacteria, and they grow very well in Vincent's minimal media (VMM) compared
to other strains within the γ –Proteobacteria (e.g. Klebsiella, Salmonella). Donor E. coli
strains are auxotrophic for proline and do not grow on minimal media. Detailed
characteristic features of the strains and plasmids used in the conjugation experiments are
summarized in Table 4.2. For conjugation, one ml of overnight donor and recipient
cultures were centrifuged at 7,000 rpm for three minutes and the pellet was resuspended
in 100 μL of LB broth. 100 μL of donor was mixed with 100 μL recipient and the mixture
including 100 μL of controls were spot plated on LB agar plates and incubated overnight
at 37 °C. Colonies were then scraped from LB plates and resuspended in 900 μL sterile
water, 100 μL of serial dilutions were plated on appropriate plates with selectable
antibiotic markers. DH5α E. coli and P. ananatis transconjugants were selected on LB
agar plates supplemented with erythromycin (400 μg/mL) and kanamycin (50 μg/mL),
and P. agglomerans transconjugants were selected on VMM with 1% mannitol (Vincent,
1970) supplemented with erythromycin (400 μg/mL).
A conjugation experiment in a simulated soil environment was also performed
using garden soil mixture containing unknown bacterial communities. Five gram of soil
was mixed with 50 mL sterile water in 250 mL sterile flasks, 4 mL of overnight culture of
donor (DH5β E.coli carrying pEFC36a) was centrifuged at 7,000 rpm, the cells were
washed and re-suspended in 200 µL of sterile phosphate buffered saline (PBS, pH 7.4).
Page 110
86
Table 4.2: Characteristics of bacteria and plasmids used in the conjugation study
Strains/ Plasmids Relevant genotype/ antibiotic marker or characteristic Source/ Reference
Strains
E.coli DH5α Tra (-), Ery (S), Tc (S), Amp (S), Cm (S), VMM (-); Laboratory strain Invitrogen
E.coli DH10β Tra (-), Ery (S), Tc (S), Amp (S), Cm (S), VMM (-); Laboratory strain Invitrogen
5565: P. agglomerans Tra (-), Ery (S), Tc (S), Amp (S), Cm (S), VMM (+); Environmental strain J. S (unpublished)
15320: P. ananatis Tra (-), Mob (-), Km (R), VMM (+); Environmental strain J. S (unpublished)
Plasmids
pUCP20tk Tra (-) , Mob (-), Km (R); cloning vector Invitrogen
pTOR_01 TraN, Mob (-), Ery (R); incU multiple resistance plasmid This study
pTOR_02 Tra (-), Mob (+), Ery (R), Tc (R); Col-E related, multiple resistance plasmid This study
pEFC36a Tra (+), Ery (R), Cm (R), Amp (R); incFII multiple resistance plasmid This study
pRWC72a Tra (+), Ery (R), Tet (R), incP-1β multiple resistance plasmid This study
Abbreviations: Tra (+), conjugal transfer genes present; Tra (-), conjugal transfer genes
absent; Mob (+), mobilization gene present; Mob (-), mobilization gene absent; (S),
sensitive to antibiotic; (R), antibiotic resistance gene; Km, kanamycin; Ery,
erythromycin; Tc, tetracycline; Amp, ampicillin; Cm, chloramphenicol; VMM, Vincent’s
minimal medium; VMM (+), growth on VMM; VMM (-), no growth on VMM; J.S, John
Stavrinides.
Page 111
87
One hundred µL was inoculated in 50 mL duplicate soil mixture suspension and
incubated at 30 °C with agitation for 5 days. Transconjugants were subsequently selected
after a serial dilution on VMM-mannitol plates supplemented with combined antibiotics;
erythromycin (400 μg/mL), chloramphenicol (25 μg/mL) and antifungal cycloheximide
(75 μg/mL). Donor cells were selected on LB supplemented with erythromycin and
chloramphenicol, and recipient cells were selected onVMM-mannitol with no antibiotics.
Conjugation transfer frequency was calculated as the number of transconjugants per
donor cells (Phornphisutthimas et al. 2007; Soda et al. 2008).
All the transconjugants in the conjugation experiments were confirmed for
plasmid carriage by PCR amplification of target genes coding for plasmid replication and
the macrolide resistance. Unknown transconjugants in a controlled soil experiment were
identified by amplifying and DNA sequencing the 16s rRNA gene. The template DNA
for PCR was prepared by quickly boiling the colony at 95 °C for 2 mins in 25 μL sterile
water and spinning the sample at high speed for 2 mins. Twenty μL of the supernatant
was used for PCR analysis of plasmid replication, macrolide resistance and 16s rRNA
genes. A total of 25 μL reaction master mix was prepared containing; 2 μL of template
DNA, 2.5 μL of each primers (2 μM), 2.5 μL of dNTPs (100mM), 2.5 μL of MgSO4 (20
mM), 2.5 μL of 10X reaction buffer, 0.2 μL of Taq DNA polymerase (5U/ μL) and 10.3
μL of de-ionized sterile water. The PCR conditions; 95 °C for 4 minutes initial
denaturing, followed by 35 cycles [of denaturing at 95 °C; annealing at 56 °C for 30
seconds; extension at 72 °C for 2.5 minutes] and final extension at 72 °C for 6 minutes.
The primers used for amplification of targets are shown in Table 4. 3.
Page 112
88
Table 4.3: Description of the primer pairs used in conjugation experiments
Name Target gene/ description Sequence 5’3’ Plasmid† Amplicon
size bp
Reference
P72-trfA1
P72-trfA2
trfA1/ incP1-β replication GCGGCCGGTACTACACGA
GCGACAGCTTGCGGTACT
pRWC72a 239 This study
PEF-rep1
PEF-rep2
repA/ incFII replication GGCTTCACCTCCCGTTTT
AACTGCGGAAACGCTCAC
pEFC36a 504 This study
PEF-mrx1
PEF-mrx2
mrx(A)/ Macrolide A , hydrophobic
protein
GCGTCGCTTTTCTCTGGA
ATGCCAAGGAGACCACCA
pTOR_01,
pTOR_02,
pEFC36a
183 This study
mphB1
mphB2
mph(B)/ Macrolide B,
phosphotransferase
CCTGGCACTTTGACCAGAAT
TGCTGACTTGTCATTCTGGC
pRWC72a 233 This study
fD1
rD1
Universal bacterial 16s rRNA AGAGTTTGATCCTGGCTCAG
AAGGAGGTGATCCAGCC
NA 1,540bp (Weisburg
et al. 1991).
† targeted plasmid; NA, not applicable
Page 113
89
4.2.4. Plasmid stability assays
To determine the persistence of plasmids in bacterial cells in the absence of
antibiotic selection, plasmid stability assays were performed in LB broth and in a
controlled soil environment. E. coli (DH5α and S17-1) and P. agglomerans were used as
plasmid hosts for the assessment of plasmid stability. A single colony of bacteria,
containing the plasmid under study, was inoculated in LB broth without antibiotic and
grown overnight (24hrs) at 37°C with agitation. A serial dilution was plated in duplicate
on LB agar and LB agar with appropriate combined antibiotics; erythromycin (400
μg/mL), tetracycline (10 μg/mL), chloramphenicol (25 μg/mL) to enumerate total viable
cells and plasmid containing cells respectively. One hundred μL of the undiluted bacterial
cells were transferred into fresh LB broth without antibiotic on consecutive days for up to
26 days, enumeration of total viable cells and plasmid containing cells was performed at
days 2, 4, 8, 16, 24, and 26.
Plasmid stability in a controlled soil environment was performed using P.
agglomerans as plasmid host. Five mL of overnight culture was washed with phosphate
buffered saline (PBS, pH 7.4) and re-suspended in 5 mL PBS. Two point five mL of the
re-suspension was inoculated in duplicate 250 mL conical flasks each containing 50 g of
autoclaved garden soil. The negative controls soil was treated with 2.5 mL of sterile
water. The soil was mixed well with sterile glass rod and incubated at room temperature
for up to 60 days. The soil was mixed well and moistened with sterile tap water at least
once a week prior to sampling. For enumeration of bacterial cells, 1g of soil was
transferred aseptically into duplicate 50 mL sterile falcon tubes and re-suspended with
9ml PBS. Serial dilutions were performed in sterile glass tubes containing 9 mL PBS.
Page 114
90
Enumerations of total viable cells and plasmid containing cells were performed in
appropriate plates at days 2, 8, 16, 24 and 56.
4.3. Results
4.3.1. Assembly and annotations
The plasmid sequences were assembled using the 454 contigs that had 25-30X coverage.
Primer walking using the primers flanking the contigs resulted in single and complete
consensus sequences. Splitting the complete consensus sequences into 2 and
reassembling such that the sequences begin with the replication gene at position 1
confirmed all plasmids were circular.
The pTOR_01 plasmid was assembled from five 454 contigs (2,098 bp, 11,259
bp, 2,091 bp, 103 bp, 3,518 bp), and a complete sequence is 20,914 bp nucleotides
predicted to encode at least 25 genes (Figure 4.2, Table 4.4). Plasmid pTOR_02 was also
assembled from five 454 contigs (2,457 bp, 2,529, 18,639 bp, 426 bp, 1,365bp,) resulting
in a 28,080 bp sequence with 34 predicted genes (Figure 4.3, Table 4.5). Plasmid
pEFC36a was assembled from two 454 contigs (4,950 bp and 82,482 bp), the complete
structure is 87,419bp and consists of at least 123 predicted genes (Figure 4.4, Table 4.6).
Plasmid pRWC72a was assembled from five 454 contigs (3,559 bp, 335 bp, 172 bp, 55,
875 bp and 820 bp) and the complete annotated sequence is 61,919bp nucleotides with at
least 69 predicted genes (Figure 4.5, Table 4.7).
Page 115
91
Figure 4.2: Visual map of multiple resistance plasmid (a) pTOR_01 (20,914 bp) isolated
from the WWTP influent showing mosaic features of resistance genes inserted in plasmid
genetic backbones. The different colors represent regions encoding putative functions
such as replication and maintenance (red, crosshatched), antibiotic resistance (blue),
heavy metal resistance (green), transposons and insertion sequences (yellow),
hypothetical open read frames (white).
Page 116
92
Table 4.4: Annotation of plasmid pTOR_01 complete sequence, 20,914 bp
ORF
no.
Gene/
CDS
Size
aa
Product/ encoded function Score/E value; aa identity (%) GenBank accession
no.
1 repB 459 Replication initiation protein 947 bits (2449) / 0.0; (100%) YP_067811
2 Orf2 42 Hypothetical protein No significant similarity
3 Orf3 92 Hypothetical protein 172 bits (437) / 6e-54; (100%) YP_067812
4 klcA 141 Antirestriction protein 221 bits (562) / 3e-71; (100%) YP_067813
5 Orf5 51 Hypothetical protein 87 bits (214) / 2e-21; (100%) YP_067814
6 korC 98 Transcriptional repressor protein 150 bits (380) / 5e-45; (100%) YP_067815
7 traN 355 Conjugative transfer protein 543 bits (1398) / 0.0; (100%) YP_067816
8 trfA 347 Transcriptional regulator protein 152 bits (384) / 2e-39; (99%) YP_067817
9 korA Transcriptional repressor protein 205 bits (522) / 4e-66; (100%) YP_067818
10 parA 250 Plasmid partition/ stabilization protein 227 bits (578) / 2e-70; (100%) YP_067819
11 parB 471 Plasmid partition/ stabilization protein 388 bits (996) / 3e-127; (96%) YP_067820
12 Orf12 75 Hypothetical protein 65.5 bits (158) / 2e-12; (100%) YP_001966828
13 mpr 239 Putative zinc metallopeptidase 360 bits (923) / 7e-123; (99%) YP_001966829
14 tnpA 847 Tn3 family transposase 1303 bits (3373) / 0.0; (100%) NP_943128
15 tnpR 200 Tn5501 resolvase 397 bits (1019) / 2e-138; (100%) NP_943127
16 Orf16 118 Hypothetical protein 237 bits (605) / 2e-78; (100%) NP_943126
17 Orf17 111 Hypothetical protein 225 bits (574) / 4e-74; (100%) NP_943125
18 Orf18 111 Hypothetical protein 220 bits (560) / 6e-72; (100%) NP_943124
19 Orf19 108 Hypothetical protein 221 bits (562) / 2e-72; (100%) YP_245478
20 Orf20 126 Hypothetical protein 254 bits (648) / 8e-85; (100%) YP_245477
21 Orf21 399 Hypothetical protein 625 bits (1613) / 0.0; (100%) YP_245475
22 mphR (A )194 Macrolide regulatory protein 397 bits (1020) / 4e-139; (100%) YP_133844
23 mrx(A) 412 Putative high level macrolide resistance
expression protein
776 bits (2005) /0.0; (100%) YP_133843
24 mph(A) 301 Macrolide phosphotransferase 604 bits (1557) /0.0; (100%) YP_133842
25 tnpAIS26 240 IS26 transposase 501 (1289) /2e-178; (100%) YP_001816626
aa, amino acids; CDS, coding sequence ; ORF; open reading frame
Page 117
93
Figure 4.3: Visual map of multiple resistance plasmid pTOR_02 (28,080bp) isolated from
the WWTP effluent, showing mosaic features of resistance genes inserted in plasmid
genetic backbones. The different colors represent regions encoding putative functions
such as replication and maintenance (red, crosshatched), antibiotic resistance (blue),
heavy metal resistance (green), transposons and insertion sequences (yellow),
hypothetical open read frames (white).
Page 118
94
Table 4.5: Annotation of plasmid pTOR_02 complete sequence, 28,080 bp
ORF
no.
Gene/
CDS
Size
aa
Product/ encoded function Score/E value; aa identity (%) GenBank
accession no.
1 repA 304 Replication protein 629 bits (1623) /0.0; (100%) YP_006147217
2 Orf2 132 Hypothetical protein 225 bits (573) / 8e-85; (87%) ZP_07160625
3 mobA 308 Mobilization protein 628 bits (1619) /0.0; (99%) YP_006147218
4 Orf4 42 Hypothetical protein 55.8 bits (133) /7e-09; (99%) YP_006147219
5 tnpA Tn21 988 Tn21family transposase 2023 bits (5241) / 0.0; (100%) NP_052901
6 tnpRTn21 186 Transposon Tn21 resolvase 375 bits (958) / 7e-132; (100%) NP_052900
7 tnpMTn21 116 Transposon Tn21 modulator protein 240 bits (613) / 7e-80; (100%) NP_052899
8 intI1 337 Class 1 integrase/recombinase 679 bits (1752) / 0.0; (99%) NP_052898
9 dhfR 165 Dihydrofolate reductase 339 bits (870) / 5e-119; (100%) YP_209335
10 Orf10 41 Hypothetical protein 82.8 bits (203) / 5e-20; (100%) YP_209336
11 aadA2 263 Aminoglycoside adenylyltransferase 530 bits (1365) / 0.0; (100%) YP_001965793
12 qacE∆1 115 Small multidrug efflux protein 219 bits (558) / 4e-73; (100%) NP_052896
13 sulI 279 Dihydropteroate synthase 554 bits (1428) / 0.0; (100%) BAA7899
14 orf5 67 Conserved hypothetical protein; similar
to puromycin N-acetyltransferase
139 bits (349) / 1e-42; (100%) YP_001096353
15 chrA 284 Chromate ion transport protein 781 bits (2017) / 0.0; (100%) YP_133847
16 tnpR 101 Transcriptional regulator 215 bits (526) / 0.0; (100%) YP_133846
17 tnpA 264 Transposase 580 bits (1433) / 0.0 ;(100%) YP_133845
18 mphR(A) 194 mph(A) repressor protein 397 bits (1020) / 5e-14 ;(100%) YP_133844
19 mrx(A) 412 Putative high level macrolide resistance
expression protein
776 bits (2005) /0.0; (100%) YP_133843
20 mph(A) 301 Macrolide phosphotransferase 604 bits (1557) /0.0; (100%) YP_133842
21 tnpAIS26 238 IS26 transposase 496 (1277) /1e-178; (100%) YP_209330
22 tni∆A1 422 Putative transposase 884 (2188) /0.0; (100%) YP_209329
23 urf2 235 Unknown function 500 (1233) /2e-180; (100%) NP_052888
24 Mere 78 Mercuric ion transport protein 154 (390) /4e-47; (100%) NP_052887
25 merD 101 Mercuric ion regulatory protein 193 (595) /2e-61; (99%) NP_052886
Page 119
95
Table 4.5 continued
ORF
no.
Gene/
CDS
Size
aa
Product/ encoded function Score/E value; aa identity (%) GenBank
accession no.
26 merA 564 Mercuric ion reductase protein 1140 (2950) /0.0; (100%) NP_052885
27 merC 153 Mercuric ion transport protein 307 (786) /6e-105; (100%) YP_001144138
28 merP 103 Mercuric ion transport protein 178 (452) /5e-56; (100%) NP_052883
29 merT 116 Mercuric ion transport protein 227 (478) /2e-74; (100%) NP_052882
30 merR 144 Mercuric ion regulatory protein 295 (754) /2e-100; (100%) NP_052881
31 Orf31 128 Hypothetical protein 264 bits (675) /4e-88; (99%) YP_006147219
32 Orf32 51 Hypothetical protein 104 bits (260) /4e-28; (100%) ZP_10982129
33 tnpAIS2 279 IS2 transposase 583 (1503) /0.0; (100%) NP_EHW38750
34 tnpR IS2 121 IS2 repressor protein 244 (622) /5e-81; (100%) NP_058408
aa, amino acids; CDS, coding sequence ; ORF, open reading frame
Page 120
96
Figure 4.4: Visual map of multiple resistance plasmid pEFC36a (87,419bp) isolated from
the WWTP effluent, showing mosaic features of resistance genes inserted in plasmid
genetic backbones. The different colors represent regions encoding putative functions
such as replication and maintenance (red, crosshatched), antibiotic resistance (blue),
heavy metal resistance (green), transposons and insertion sequences (yellow),
hypothetical open read frames (white).
Page 121
97
Table 4.6: Annotation of multiple resistance plasmid pEFC36a partial sequence, 87,419
bp
ORF
no.
Gene/
CDS
Size
Aa
Product/ descriptive function Score/Evalue; aa identity (%)
GenBank
accession no.
1 repA1 289 Replication initiation protein
RepA1 of the FII replicon
451 bits (1161) / 2e-160; (100%)
YP_003829168
2 repA2 139 Negative regulator of repA1
expression in FII
129 bits (323) / 1e-38; (100%)
NP_085433
3 yihA 196 Unknown function 393 bits (1010) / 2e-139; (100%) YP_190108
4 hha 69 Haemolysin expression
modulating protein
143 bits (361) / 2e-44; (100%) NP_053130
5 yigB 153 Unknown function 315 bits (807) / 6e-110; (100%) NP_052986
6 tnpAIS66 523 IS66 Transposase 3565 bits (9243) / 0.0; (100%) ZP_03044091
7 Orf7 115 Putative IS element transposase
subunit
235 bits (599) / 2e-79; (100%) YP_424826
8 tnpAIS66 161 IS66 Transposase 330 bits (845) / 2e-114; (100%) ZP_03047904
9 yigA 80 Unknown function 157 bits (397) / 5e-134; (99%) YP_190111
10 finO 186 Conjugative transfer fertility
inhibition protein
379 bits (973) / 5e-134; (100%) YP_003829162
11 yieA 286 Unknown function 595 bits (1280) / 0.0; (99%) NP_052983
12 traX 248 Conjugative transfer F pilin F-
pilin acetylation protein
497 bits (1280) / 7e-179; (100%) NP_052982
13 traI Conjugal transfer
nickase/helicase
3565 bits (9243) / 0.0; (100%) YP_003829160
14 traD 726 Conjugal transfer coupling
protein
1468 bits (3800) / 0.0; (99%) AAT85682
15 Orf15 40 Hypothetical protein 84.7 bits (208) / 6e-22; (100%) ZP_07104696
16 traT 276 Conjugal transfer protein 558 bits (1437) / 0.0; (100%) YP_003829158
17 traS 163 Conjugal transfer protein 340 bits (873) / 1e-119; (100%) YP_003829324
18 traG 939 Conjugal transfer protein 1943 bits (5034) / 0.0; (100%) YP_003829156
19 traH 457 Conjugative transfer F pilin
assembly
942 bits (2435) / 0.0; (100%) YP_003829155
20 trbF 141 Conjugal transfer protein 291 bits (746) / 6e-101; (100%) YP_003829279
21 trbJ 93 Conjugal transfer protein 181 bits (458) / 6e-58; (100%) YP_003829278
22 trbB 181 Conjugative transfer F pilin
assembly
372 bits (956) / 1e-131; (100%) YP_003829277
23 traQ 78 Conjugal transfer protein 157 bits (396) / 2e-49; (100%) YP_003829276
24 trbA 112 Conjugal transfer protein 223 bits (567) / 1e-74; (100%) YP_003829275
25 traF 249 Conjugative transfer F pilin
assembly
517 bits (1331) / 0.0; (100%) YP_002456210
26 trbE 86 Conjugal transfer protein 174 bits (435) / 3e-56; (100%) YP_003829274
27 traN 602 Conjugative mating pair
stabilization protein
1256 bits (3249) / 0.0; (100%) YP_003829273
28 trbC 212 Conjugative transfer F pilin
assembly
440 bits (1131) / 2e-157; (100%) YP_003829272
Page 122
98
Table 4.6 continued
ORF
no.
Gene/
CDS
Size
Aa
Product/ descriptive function Score/Evalue; aa identity (%)
GenBank
accession no.
29 yfdA 101 Putative conjugative transfer
protein
210 bits (535) / 5e-70; (100%) YP_003829271
30 traU 330 Conjugative transfer F pilin
assembly
687 bits (1774) / 0.0; (100%) YP_003829270
31 traW 210 Conjugative transfer F pilin
assembly
428 bits (1101) / 7e-153; (100%) NP_061465
32 trbI 101 Conjugal transfer protein 205 bits (521) / 2e-67; (100%) YP_003829268
33 traC 875 Conjugative transfer F pilin
assembly
1821 bits (4717) / 0.0; (99%) YP_003829267
34 yfhA 48 Unknown function 90.9 bits (224) / 3e-24; (94%) ZP_03072222
35 traR 83 Conjugal transfer protein 154 bits (390) / 9e-49; (100%) YP_003108311
36 traV 171 Conjugative transfer F pilin
assembly
347 bits (891) / 4e-122; (100%) YP_003108310
37 trbG 83 Conjugal transfer protein 170 bits (431) / 9e-55; (100%) YP_190137
38 trbD 106 Conjugal transfer protein 218 bits (555) / 5e-73; (100%) YP_003108308
39 traP 194 Conjugal transfer protein 405 bits (1040) / 4e-144; (100%) YP_003108307
40 traB 475 Conjugative transfer F pilin
assembly
967 bits (2500) / 0.0; (100%) YP_003829263
41 traK 242 Conjugative transfer F pilin
assembly
491 bits (1264) / 1e-176; (100%) NP_061456
42 traE 176 Conjugative transfer F pilin
assembly
364 bits (934) / 2e-128; (100%) YP_788064
43 traL 104 Conjugative transfer F pilin
assembly
216 bits (550) / 4e-161; (100%) YP_003829260
44 traA 120 Conjugative transfer F pilin
subunit
243 bits (597) / 6e-79; (100%) YP_003108302
45 traY 60 Conjugative transfer oriT
nicking protein
92.8 bits (229) / 1e-24; (100%) ZP_03035177
46 traJ 228 Conjugative transfer regulator
protein
464 bits (1194) / 2e-166; (100%) YP_003108300
47 traM 127 Conjugative transfer mating
signal transduction protein
259 bits (661) / 2e-88; (100%) YP_003108299
48 geneX 215 X-polypeptide 450 bits (1158) / 4e-161; (100%) YP_003829255
49 Orf49 44 Hypothetical protein 91.7 bits (226) / 2e-23; (100%) YP_003829129
50 yubP 273 Unknown function 99.0 bits (245) / 7e-27; (100%) YP_194835
51 Orf51 46 Hypothetical protein 99.0 bits (245) / 1e-25; (100%) YP_194835
52 yubO 58 Unknown function 116 bits (292) / 2e-32; (100%) YP_003829022
Page 123
99
Table 4.6 continued
ORF
no.
Gene/
CDS
Size
Aa
Product/ descriptive function Score/Evalue; aa identity (%)
GenBank
accession no.
53 Orf53 42 Hypothetical protein 87 bits (214) / 1e-21; (100%) YP_003108285
54 Orf54 53 Hypothetical protein 112 bits (280) / 4e-31; (100%) YP_003829253
55 Orf55 77 Hypothetical protein 153 bits (387) / 9e-47; (100%) YP_002456155
56 Orf56 51 Hypothetical protein 102 bits (254) / 2e-27; (100%) YP_002539356
57 hok 52 Post-segregational killing
protein
109 bits (272) / 8e-30; (100%) YP_003829025
58 Orf58 45 Hypothetical protein 96.7 bits (239) / 8e-30; (100%) YP_003829025
59 psiA 239 Plasmid SOS inhibition protein 485 bits (1249) / 3e-25; (100%) YP_003517669
60 psiB 144 Plasmid SOS inhibition protein 299 bits (766) / 7e-104; (100%) YP_003829249
61 parB 654 ParB-like partitioning protein 1345 bits (3481) / 0.0; (100%) YP_003108289
62 ydcB 77 Unknown function 167 bits (424) / 8e-54; (100%) YP_003108289
63 ssb 175 Single strand DNA binding
protein
358 bits (918) / 1e-123; (100%) YP_003829247
64 Orf64 Hypothetical protein 386 bits (922) / 1e-136; (100%) YP_003829247
65 ydcA 187 Unknown function 380 bits (977) / 1e-134; (100%) YP_003108284
66 ydbA 453 Unknown function 940 bits (2429) / 0.0; (100%) YP_194824
67 Orf67 86 Hypothetical protein 177 bits (449) / 2e-57; (100%) YP_538686
68 Orf68 63 Hypothetical protein 121 bits (320) / 2e-38; (99%) YP_053127
69 ydaB 140 Unknown function 283 bits (723) / 2e-97; (100%) YP_209426
70 klcA 141 Putative antirestriction protein 297 bits (760) / 4e-103; (100%) YP_003829241
80 Orf80 72 Hypothetical protein 119 bits (299) / 6e-35; (100%) ZP_07124409
90 ychA 275 Unknown function 553 bits (1426) / 0.0; (100%) NP_052912
91 ycgB 144 Unknown function 293 bits (751) / 1e-101; (100%) NP_052911
92 yfcA 73 Putative cytoplasmic lprotein 149 bits (377) / 8e-47; (100%) YP_053126
93 ycdA 227 Putative methylase 478 bits (1230) / 6e-172; (100%) NP_052910
94 Orf94 41 Hypothetical protein 88.6 bits (210) / 6e-23; (100%) ZP_03051130
95 stbA 320 Plasmid stable inheritance
protein
659 bits (1699) / 0.0; (100%) NP_052909
96 stbB 117 Plasmid stable inheritance
protein
239 bits (610) / 6e-81; (100%) NP_052908
Page 124
100
Table 4.6 continued
ORF
no.
Gene/
CDS
Size
Aa
Product/ descriptive function Score/Evalue; aa identity (%)
GenBank
accession no.
97 ycdB 93 Unknown function 194 bits (494) / 4e-64; (100%) NP_052907
98 ycdA 78 Unknown function 161 bits (408) / 2e-51; (100%) NP_052906
99 Orf99 218 Hypothetical protein 325 bits (833) / 1e-112; (99%) ADR29902
100 catA 219 Chloramphenicol
acetyltransferase
465 bits (1197) / 4e-167; (100%) NP_052903
101 ybjA 105 Unknown function 200 bits (508) / 6e-66; (100%) ZP_07239947
102 tnpA
Tn21
988 Transposase of Tn21 2023 bits (5241) / 0.0; (100%) NP_052901
103 tnpR
Tn21
186 Transposon Tn21 resolvase 375 bits (958) / 7e-132; (100%) NP_052900
104 tnpM
Tn21
150 Transposon Tn21 modulator
protein
309 bits (792) / 1e-107; (100%) YP_00196359
105 intI1 337 Class 1 integrase/recombinase 679 bits (1752) / 0.0; (99%) NP_052898
106 dhfR 165 Dihydrofolate reductase 339 bits (870) / 5e-119; (100%) YP_209335
107 Orf107 1 Hypothetical protein 87.4 bits (207) / 2e-22; (100%) YP_209336
108 aadA2 263 Aminoglycoside
adenylyltransferase
530 bits (1365) / 0.0; (100%) YP_001965793
109 qacE∆1 115 Small multidrug efflux protein 219 bits (558) / 4e-73; (100%) NP_052896
110 sulI 279 Dihydropteroate synthase 554 bits (1428) / 0.0; (100%) BAA7899
111 orf5 67 Conserved hypothetical protein;
similar to puromycin N-
acetyltransferase
139 bits (349) / 1e-42; (100%) YP_001096353
112 chrA 284 Chromate ion transport protein 781 bits (2017) / 0.0; (100%) YP_133847
113 tnpR 101 Transcriptional regulator 215 bits (526) / 0.0; (100%) YP_133846
114 tnpA 264 Transposase 580 bits (1433) / 0.0;(100%) YP_133845
115 Orf115 62 Hypothetical protein 130 bits (315) / 5e-39; (100%) YP_194906
116 mphR(A 194 mph(A) repressor protein 397 bits (1020) / 5e-14;(100%) YP_133844
117 mrx(A) 412 Putative high level macrolide
resistance expression protein
776 bits (2005) /0.0; (100%) YP_133843
118 mph(A) 301 Macrolide phosphotransferase 604 bits (1557) /0.0; (100%) YP_133842
119 tnpA
IS26
238 IS26 transposase 496 (1277) /1e-178; (100%) YP_209330
120 tni∆A1 422 Putative transposase 884 (2188) /0.0; (100%) YP_209329
Page 125
101
Table 4.6 continued
ORF
no.
Gene/
CDS
Size
Aa
Product/ descriptive function Score/Evalue; aa identity (%)
GenBank
accession no.
121 urf2 235 Unknown function 500 (1233) /2e-180; (100%) NP_052888
122 merE 78 Mercuric ion transport protein 154 (390) /4e-47; (100%) NP_052887
123 merD 120 Mercuric ion regulatory protein 233 (595) /6e-77; (100%) NP_052886
124 merA 176 Mercuric ion reductase protein 342 (878) /2e-118; (100%) AFG21111
125 blaTEM 286 Beta-lactamase protein 591 (1523) /0.0; (100%) NP_052173
126 tnpR
Tn3
185 Transposon Tn3 resolvase
protein
364 (934) /1e-126; (100%) NP_957564
127 tnpA
Tn3
1001 Transposon Tn3 transposase
protein
2057 (5330) /0.0; (100%) YP_247785
128 merR 144 Mercuric ion regulatory protein 295 (574) /2e-100; (100%) NP_052881
129 pemK 110 Programmed cell death toxin
protein
221 (564) /6e-72; (100%) ADL14170
130 pemI 85 Programmed cell death antitoxin
protein
174 (574) /9e-55; (100%) NP_052993
131 tir 217 Transfer inhibition protein 431 (1108) /9e-152; (100%) NP_052992
aa, amino acids; CDS, coding sequence; ORF, open reading frame
Page 126
102
Figure 4.5: Visual map of multiple resistance plasmid pRWC72a (61,919bp), showing
mosaic features of resistance genes inserted in plasmid genetic backbones. The different
colors represent regions encoding putative functions such as replication and maintenance
(red, crosshatched), antibiotic resistance (blue), heavy metal resistance (green),
transposons and insertion sequences (yellow), hypothetical open read frames (white).
Page 127
103
Table 4.7: Annotation of multiple resistance pRWC72a complete sequence, 61,919 bp
ORF
no.
Gene/
CDS
Size
aa
Product/ encoded function Score/Evalue; aa identity (%) GenBank
accession no.
1 trfA 406 Replication protein 842 bits (1696)/ 0.0; (100%) YP_133906
2 ssb 113 Single strand DNA binding protein 233 bits (587)/ 9e-79; (100%) NP_044238
3 trbA 120 Conjugal transfer protein 243 bits (619)/ 3e-81; (100%) YP_133908
4 trbB 321 Conjugal transfer protein 657 bits (1696)/ 0.0; (100%) YP_133909
5 trbC 154 Conjugal transfer protein 302 bits (774)/ 9e-105; (100%) YP_133910
6 trbD 103 Conjugal transfer protein 210 bits (535)/ 5e-70; (100%) NP_857979
7 trbE 852 Conjugal transfer protein 1749 bits (4529)/ 0.0; (100%) YP_133912
8 trbF 260 Conjugal transfer protein 535 bits (1379)/ 0.0; (100%) YP_133913
9 trbG 299 Conjugal transfer protein 615 bits (1586)/ 0.0; (100%) YP_133914
10 trbH 162 Conjugal transfer protein 321 bits (822)/ 8e-112; (100%) YP_133915
11 trbI 473 Conjugal transfer protein 950 bits (2455)/ 0.0; (100%) YP_133916
12 trbJ 254 Conjugal transfer protein 504 bits (1297)/ 0.0; (100%) YP_133917
13 trbK 75 Entry exclusion protein 151 bits (382)/ 2e-47; (99%) YP_133918
14 trbL 445 Conjugal transfer protein 832bits (2149)/ 0.0; (100%) YP_133919
15 trbM 195 Conjugal transfer protein 401bits (404)/ 1e-42; (100%) YP_133920
16 trbN 211 Conjugal transfer protein 431 bits (1109)/ 5e-154; (99%) YP_133921
17 trbO 88 Conjugal transfer protein 173 bits (439)/ 8e-66; (100%) NP_044253
18 trbP 232 Conjugal transfer protein 444 bits (1143)/ 1e-158; (99%) YP_133923
19 upf30.5 48 putative outer membrane protein 269 bits (668)/ 2e-90; (99%) YP_133924
20 upf31.0 84 Putative site-specific DNA-
methyltransferase
458 bits (1179)/ 8e-162; (99%) YP_133925
21 parA 283 Plasmid partition/ stabilization protein 436 bits (1120)/ 3e-154; (100%) YP_133926
22 ∆intI1 33 Integron class 1 integrase 201 bits (510)/ 9e-65; (100%) ZP_04405583
23 tnpA 78 Transposase IS26 487 bits (1253)/ 4e-175; (99%) YP_133841
24 tnpA 38 IS4-like transpoase 219 bits (559)/ 1e-71; (100%) CAJ98573
Page 128
104
Table 4.7 continued
ORF
no.
Gene/
CDS
Size
aa
Product/ encoded function Score/Evalue; aa identity (%) GenBank
accession no.
25 mphR(B) 227 Macrolide regulatory protein 374 bits (960)/ 7e-132; (99%) CAJ98569
26 mph(B) 222 Macrolide phosphotransferase 455 bits (1170)/ 1e-161; (100%) CAJ98570
27 mrx(B)
397
Putative transmembrane transport
protein 747 bits (1929)/ 0.0; (99%)
CAJ98571
28 Orf28 117 Hypothetical protein 244 bits (623)/ 5e-83; (100%) CAJ98572
29 tnpA 40 IS4-like transposase 239 bits (610)/ 3e-79; (100%) CAJ98573
30 ∆tnpA 78 IS26 transposase 763bits (1266)/ 4e-175; (99%) CAP07812
31 ∆intI1 77 Integron class 1 integrase 201 bits (1215)/ 2e-167; (100%) AEA49955
32 qacE∆ 115 Small multi-drug resistance (SMR)
efflux protein 219 bits (559)/ 2e-71; (100%)
NP_052896
33 sulI 288 Dihydropteroate synthase 568 bits (1465)/ 0.0; (100%) YP_002317674
34 orf5 166 Hypothetical protein / Putative
acetyltransferase 250 bits (639)/ 3e-85; (100%)
NP_857993
35 tnpA 264 IS6100 transposase 545 bits (1404)/ 0.0; (100%) YP_133845
36 traC 1448 Conjugal transfer primase protein 2929 bits (7592)/ 0.0; (99%) YP_133940
37 traD 129 Conjugal transfer protein 252 bits (643)/ 1e-85; (100%) YP_858000
38 traE 687 Conjugal transfer DNA topoisomerase protein 1415 bits (3664)/ 0.0; (100%)
YP_358848
39 traF 218 Conjugal transfer peptidase protein 359 bits (922)/ 6e-126; (100%) YP_858002
40 traG 637 Conjugal transfer coupling protein 1321 bits (3419)/ 0.0; (100%) YP_858003
41 traI 746 Conjugal transfer relaxase protein 1516 bits (3925)/ 0.0; (100%) YP_358851
42 traJ 124 Conjugal transfer relaxosome protein 250 bits (639)/ 3e-85; (100%) NP_858006
43 traK 132 Conjugal transfer oriT binding protein 266 bits (680)/ 4e-91; (100%) NP_858007
44 traL 241 Conjugal transfer protein 500 bits (1287)/ 4e-180; (100%) YP_133949
45 tram 146 Conjugal transfer protein 283 bits (725)/ 1e-97; (100%) NP_858009
Page 129
105
Table 4.7 continued
ORF
no.
Gene/
CDS
Size
aa
Product/ encoded function Score/Evalue; aa identity (%) GenBank
accession no.
46 traN 217 Conjugal transfer protein 424 bits (1090)/ 6e-151; (99%) YP_133951
47 traO 115 Conjugal transfer protein 237 bits (604)/ 4e-80; (100%)
NP_858011
48 krfA 343 Transcriptional regulator protein/
Plasmid maintenance 637 bits (1644)/ 0.0; (100%)
YP_358859
49 korB 349 Transcriptional repressor protein/
Plasmid maintenance 701 bits (1808)/ 0.0; (100%)
NP_858013
50 incC1 254 Inclusion membrane protein/ Plasmid
maintenance 520 bits (1338)/ 0.0; (99%)
YP_133956
51 korA 100 Plasmid maintenance 196 bits (499)/ 1e-64; (99%) YP_133957
52 kleF 176 Plasmid maintenance 360 bits (923)/ 8e-127; (100%) YP_358864
53 kleE 109 Plasmid maintenance 211 bits (536)/ 1e-69; (98%) YP_133959
54 kleB 71 Plasmid maintenance 142 bits (357)/ 6e-44; (99%) YP_133960
55 kleA 78 Plasmid maintenance 154 bits (263)/ 2e-48; (97%) YP_133961
56 korC 85 Plasmid maintenance 166 bits (421)/ 3e-53; (98%) YP_133962
57 klcB 401 Plasmid maintenance 765 bits (1976)/ 0.0; (98%) YP_133963
58 klcA 170 Plasmid maintenance 455 bits (734)/ 1e-98; (100%) YP_133964
59 tnpATn21 988 Transposase Tn21 family protein 1958 bits (5073)/ 0.0; (97%) YP_004129070
60 tnpR 185 Resolvase Tn21 family 342 bits (878)/ 1e-119; (81%) YP_003162849
61 tetR 225 Tetracycline repressor protein 455 bits (1171)/ 5e-163; (100%) YP_133837
62 tetA 424 Tetracycline efflux protein 785 bits (2026)/ 0.0; (99%) YP_133836
63 pecM 139 Plasmid maintenance 272 bits (695)/ 5e-90; (100%) YP_758653
64 yacB
95
Putative post-segragational killing
protein (addiction module anti-toxin) 152 bits (385)/ 6e-46; (76%)
NP_942624
65 yacA 96 Putative post-segragational killing
protein (addiction module anti-toxin) 158bits (400)/ 4e-48; (79%)
ZP_08873056
66 Orf66 310 Hypothetical protein 350 bits (897)/ 5e-117; (74%) CAZ15828
aa, amino acids; CDS, coding sequence; ORF, open reading frame
Page 130
106
Table 4.8: Summary characterization and comparison of plasmid backbones and
accessory genes
Plasmid Genetic backbone Accessory
Size
(source)
Replication/
inc group
Mobility Maintenance genes Resistance genes
Tra
genes
(mob
genes)
Trb
genes
Plasmid
addiction
†Regulatory
and stability
Integron Antibiotic Heavy
metal
pTOR_01
20,914bp
(influent)
repB/ incU N None None
predicted
parA/B None mph(A),
mrx(A),
mphR(A)
mpr
pTOR_02
28,080bp
(effluent)
colE related mobA None None
predicted
None intI1,
class1;
dhfrA,
aadA2,
qacE∆1,
sulI, orf5
mph(A),
mrx(A),
mphR(A)
merA,
merD,
merE,
merP,
merT,
merR
pEFC36a
87,419bp
(effluent)
repA1/
incFII
B,C,D,
F,G,H,I
,J,K,L,
M,N,S,
T,U,V,
W, X
A,B,C,
F, I, J,O
pemK,
pemI,
hok, sok
ssb,tir,finO,
psiA/B,
stbA/B
intI1,
class1;
dhfrA,
aadA2,
qacE∆1,
sulI, orf5
mph(A),
mrx(A),
mphR(A),
blaTEM-1β
catA
merA,
merD,
merE,
merR
pRWC72a
61,919bp
(influent)
trfA/
incP-1β
C,D,E,F
,GI,J,K,
L,M
A,B,C,
D,E,F,
G,H,I,J,
K,L,M,
N,O, P
yacA,
yacB
ssb,parA/B,
krfA/B,
incC1,
korB/C,
korA,
kleA/B/C/E,
klcA, krfA
∆intI1,
class1;
qacE∆1,
sulI, orf5
mph(B),
mrx(B),
mphR(B),
tetA, tetR,
None
inc, incompatibility; Tra and Trb, conjugative transfer modules; mob, mobilization; †,
regulatory genes involved in the control and effective functions including plasmid
replication, copy number, incompatibility and conjugative transfer
Page 131
107
The completely sequenced and annotated plasmids represent different plasmid
groups and are characterized by highly conserved backbone sequences coding for
plasmid replication regions, conjugal transfer and maintenance. The accessory regions
inserted within the backbones consist of genes coding for antibiotic, quaternary
ammonium compounds and heavy metal resistance in transposable and integrative mobile
elements. There are also several hypothetical genes, but no putative carbon utillization or
virulence associated genes were identified in the plasmid sequences, Table 4.8.
4.3.2. Plasmids replication and comparative analyses
The pTOR_01 plasmid consists of a repB gene coding for putative replication
functions and a highly conserved genetic backbone associated with broad host range
plasmids in the incU family. Plasmid pTOR_01 backbone (9,415bp) shows highest
similarity (99% identity at nucleotide level) to previously sequenced incU plasmids
pFBAOT6 (84,749bp, circular), pRA3 (45,909bp, circular), pB2G1 (26,645bp, linear) in
Genbank database (Figure 4.6). These plasmids were all isolated from the Aeromonas
species associated with aquatic environments. Plasmid pRA3 was isolated from
Aeromonas hydrophila, plasmid pB2G1 from a multi-drug resistant Aeromonas species
strain isolated from a river in Spain (Marti and Balcázar 2012), and pFBAOT6 was
originally isolated from a strain of Aeromonas caviae from a hospital sewage effluent in
United Kingdom (Rhodes et al. 2000a; Rhodes et al. 2004). The replication gene (repA)
encoded by plasmid pTOR_02 shows 100% amino acid similarity to previously described
colE-related plasmids. The colE type plasmids produce bacteriocin toxins that kill E. coli
and are narrow host range plasmids capable of replicating only in E. coli and closely
Page 132
108
Figure 4.6: Comparative analysis of (a) pTOR_01 (20,914bp) with closely related incU
plasmids isolated from the Aeromonas species associated with aquatic environments; (b)
pP2G1 (26,645bp), (c) pRA3 (45,909bp) and (d) pFBAOT6 (46,537bp partial) plasmids
backbone region (pink) have 99% identity to plasmid pTOR_01. The other colors
represent regions encoding putative functions such as replication and maintenance (red,
crosshatched), antibiotic resistance (blue), heavy metal resistance (green), mobile
elements (black), hypothetical open read frames (white).
Page 133
109
related bacteria (Riley and Wertz 2002). Similar plasmids pKHPS4 (3,751bp), pIGJC156
(5,146bp), pCE10B (5,163bp), pMG828 (7,462bp) isolated from different E. coli strains
possess small circular backbones with no predicted accessory genes that code for any
resistance. Plasmid pTOR_02 shows highest degree of similarity based on size and
inserted accessory region to pASL01a (27,072bp) isolated from E. coli strains in stool
samples in Nigeria. Both have a Tn21 multiple resistance transposons inserted in their
small and similar backbone (Figure 4.7).
Plasmid pEFC36a carries single repFII replication region consisting of repA1
replicon (involved in initiation of replication), and the repA2 located downstream is a
regulatory gene associated with negative regulation of the repA1. Plasmid pEFC36a
incFII backbone shows high sequence similarity to previously sequenced incFII plasmids
R100 (94,281bp), pC15-1a (92,353bp), pEC_L8 (118,525bp) and pEC_L46 (144,871bp)
(Figure 4.8). Plasmid R100 was originally isolated from a clinical Shigella flexneri
(McIntire and Dempsey, 1987), pC15-1a was previously linked to the multi-drug
resistance E. coli outbreak strains in Canada (Boyd et al. 2004) and the latter were
isolated from clinical E. coli isolates recovered from patients with urinary tract infections
(Smet et al. 2010).
Plasmid pRWC72a backbone is defined by a trfA replicon with an origin of
replication (oriV) belonging to the incP-1β incompatibility group. The incP-1β backbone
shows high nucleotide similarity to previously sequenced incP-1β plasmids pB3
(56,167bp), pB4 (79,370bp), pB8 (57,198bp) and pB10 (64,508bp) isolated from a
wastewater treatment plant in Germany (Schluter et al. 2003; Heuer et al. 2004) (Figure
4.9). This group is frequently associated with replication in a broad range of bacterial
Page 134
110
Figure 4.7: Comparative analysis of related col-E plasmids (a) pKHPS4 (3,751bp), (b)
pIGJC156 (5,146bp), (c) pCE10B (5,163bp), (d) pMG828 (7,462bp), (e) pASL01a
(27,072bp) isolated from different E. coli strains with (f) pTOR_02 (28,080bp). The
plasmids backbone regions (pink) have 99% -100% identities to plasmid pTOR_02. The
other colors represent regions encoding putative functions such as replication and
maintenance (red, crosshatched), antibiotic resistance (blue), heavy metal resistance
(green), mobile elements (black), hypothetical open read frames (white).
Page 135
111
Figure 4.8: Comparative genomic analysis of pEFC36a by mauve alignment, showing
evolutionary relationships with other incFII plasmids isolated from clinical environments.
Same color represents regions of highest similarity.
Page 136
112
Figure 4.9: Comparative genomic analysis of pRWC72a by mauve alignment showing
evolutionary relationships with other incP-1β plasmids isolated from the wastewater
treatment plant. Same color represents regions of highest similarity.
Page 137
113
species, in fact incP-1β plasmids are often regarded as the most promiscuous, particularly
in the enterobacteriaceae family (Suzuki et al. 2010). Plasmids replicons determine
incompatibility groups, whereby plasmids belonging to the same inc group (same origin
of replication) do not co-exist in the same bacterial cell (Velappan et al. 2007).
4.3.3. Plasmids' predicted conjugative transfer genes
Plasmids pEFC36a and pRWC72a carry sets of genes associated with conjugative
DNA transfer suggesting self-transfer by conjugation. The pEFC36a sequence reveals a
32,407 bp F-transfer region that has a 99% nucleotide identity to the pEC_L8 plasmid.
This region is comprised of 24 tra and 8 trb genes located downstream of the replication
region. Plasmid pRWC72a is comprised of a 16,316bp region consisting of 16
contiguously clustered trb genes (trbA-trbQ) constituting a highly conserved incP-1β
genetic backbone with 100% nucleotide identity to plasmid pB3. Another set of 12 tra
genes are found in a 15,098bp region starting with traC and ending with traM
downstream of the inserted accessory region. The trb and tra genes are essential for
conjugation, encode proteins with collective functions in processing of the sex pilus,
inner and outer membrane associated plasmid transfer proteins, energy provisions for
structural assembly and plasmid DNA transfer (Li et al. 1999; de la Cruz et al. 2010).
Most of these genes encode accessory and regulatory proteins associated with origin of
transfer (oriT), a site for conjugal transfer initiation and expression of conjugative tra
operon (de la Cruz et al. 2010; Frost and Koraimann 2010). Genes traC (DNA primase
and virB4 homolog) traI, traJ, traK, traM are the main components of the relaxosome
complex, these genes are involved in the type IV secretion system (T4SS) that involves
Page 138
114
events characterized by cleaving of a specific sites at the oriT to allow initiation of
plasmid DNA replication (Schluter et al. 2007a; Smillie et al. 2010). The traG gene is a
virD4 homolog, encode a T4SS coupling protein that is involved in functions constituting
to the formation of the sex pili and transfer of plasmid DNA (Smillie et al. 2010). Other
tra genes have no specific known functions but are important in conjugal transfer
efficiency (Schluter et al. 2007a).
Plasmid pTOR_01 and pTOR_02 do not carry sets of tra and trb genes suggesting
that they cannot initiate their own transfer. Plasmid pTOR_01 backbone has a single traN
gene associated with conjugal transfer, but without a complete set of tra genes or
mobilization genes the plasmid cannot be transferred under normal circumstances
suggesting pTOR_01 is a non-mobile plasmid. TraN gene alone is not sufficient for
transfer, however its function has been shown to stabilize mating pairs during
conjugation (Klimke and Frost 1998). Unlike plasmid pTOR_01, pTOR_02 carries a
single mobilization gene (mobA) downstream of the repA gene. The mobA gene is
required for plasmid transfer, however it requires a self-transmissible plasmid like
pEFC36a or pRWC72a which supply tra and trb apparatus for sex pili formation between
bacterial cells.
The ssb gene is also found in plasmids pEFC36a and pRWC72a, this gene codes
for a single stranded binding protein said to be involved in destabilizing the double helix.
The ssb sequence is reported to be conserved in many self-transmissible plasmids and
plays a role in the establishment of newly transferred plasmids in the recipients (Frost et
al., 1994). There are several other genes found in pEFC36a involved in plasmid stability
and inheritance, stb operon located downstream of the pEFC36a par operon has since
Page 139
115
been described in the incFII plasmids, it consists of two-tandem genes stbA and stbB that
encode trans-acting stability proteins A and B respectively (Tabuchi et al. 1992). The
psiA and psiB genes are also found within the pEFC36a backbone downstream the
transfer module, these genes encode the plasmid SOS inhibition proteins that works as
anti-SOS mechanisms that inhibit the SOS response induced by the host, to ensure
conjugal transfer takes place efficiently without host SOS response (Norman et al. 2009;
Baharoglu et al. 2010). The psiB has been implicated to play an important role
particularly in narrow host range plasmids such as incFI, incFII, incI, incK and incN,
linked to promotion of conjugative transfer and resistance development through integron
activation (Baharoglu et al. 2010). Plasmid pEFC36a also carries regulatory genes finO
located downstream of the replication module, finO is common in incF plasmids and
encode a fertility inhibition protein that plays a role in regulation of traJ during
conjugation (Vanbiesen and Frost 1994; Nuk et al. 2011). Located upstream the
replication module is a transfer inhibition gene, tir that codes for a regulatory mechanism
for plasmid transfer (Szczepanowski et al. 2005).
4.3.4. Plasmids stability and addiction systems
Mechanisms that ensure plasmids are stably maintained in the bacterial
populations are a fundamental component of the multimer resolution system (MRS);
which ensures distribution of plasmid monomers into both bacterial daughter cells after
cell division. Plasmid pTOR_01, pEFC36a and pRWC72a carry genes encoding the
active partitioning systems par, consisting of parA and parB. These partition genes have
Page 140
116
functions that ensure faithful distribution of plasmids during host cell division (Sergueev
et al. 2005).
Plasmid pRWC72a contain regulatory genes coding for four global repressor
proteins; korA, korB, korC and trbA that are involved in general plasmid biology
including plasmid replication, copy number, incompatibility and conjugative transfer.
The kle genes, kle A, B, E genes are found in pRWC72a backbone located downstream of
the tra module. These regulatory genes are common in large (and incP) plasmids with
low copy number and are important for encoding functions that ensures plasmid survival
in ecological niches and results in the inheritance of resistance determinants by various
hosts (Tabuchi et al. 1992; Sergueev et al. 2005; Schluter et al. 2007a). Plasmid
pTOR_01 also has korA and korC homologs in addition to other plasmid maintenance
genes krfA and klcA. The kfrA and trfB genes are also found within pRWC72a backbone
and have functions associated with plasmid stability and inheritance.
A post-segregation killing (PSK) mechanism is predicted in the pEFC36a
plasmid. The hok/sok mechanism is a well studied plasmid addiction system involving
killing of the host cell that contains no plasmid after cell division/segregation, first
described in the E. coli plasmid R1 (Thisted and Gerdes 1992). The hok gene (host
killing) mediates the killing effect while another gene sok encodes antisense RNA that
blocks translation of the hok mRNA and counteracts the killing effect (Norman et al.
2009). The pem region (consisting of two genes pemI, pemK ) located upstream of the
pEFC36a repA1 gene is another plasmid addiction system, which has also been described
in plasmid R100 (Tsuchimoto et al. 1988; Tsuchimoto et al. 1992). The host-killing factor
is encoded by pemK and regulated or inhibited by pemI. These plasmid addiction systems
Page 141
117
are common and employed by large low copy number plasmids to ensure plasmids
remain established in the bacterial population (Tschäpe 1994). A similar plasmid
addiction mechanism has also been predicted in pRWC72a plasmid, the genes yacA and
yacB located upstream of the replication gene encode a putative host killing toxin that
kills the bacterial host during plasmid curing and anti-toxin that prevents host death
thereby restricting plasmid curing from the population.
4.3.5. Plasmid conjugative transfer in different bacterial species
Plasmids pEFC36a and pRWC72a were confirmed by conjugation experiments to
have functional conjugative self-transfer modules, both plasmids were able to transfer
from DH5α E. coli host bacterium to a recipient DH5α E. coli. A high transfer frequency
of 4.4 x 10⁻¹
was observed for pEFC36a. The pRWC72a plasmid was transferred at a
frequency of 9.7 x 10⁻²
transconjugants per donor cells (Table 4.9). The results suggest
that both plasmids are self-transmissible since they can transfer without any helper
plasmid. The conjugative transfer genes encoded by both plasmids facilitate the transfer
from donor cells to recipient cells. Both plasmids pEFC36a and pRWC72a were also able
to transfer to P. agglomerans, at lower frequencies of 2.4 x 10⁻⁵
and 3.6 x 10⁻⁶
respectively, further suggesting plasmids can be transferred between different bacterial
species. Frequency of transfer increased for both plasmids when they transferred between
P. agglomerans and P. ananatis. Plasmids pEFC36a and pRWC72a were transferred
from P. agglomerans to P. ananatis at higher frequencies of 1.6 x 10⁻³
and 3.7 x 10⁻⁴
respectively.
Page 142
118
Table 4.9: Frequency of conjugal transfer of the plasmids in various bacteria
Donor (plasmid) Recipient (plasmid) Transfer
frequency†
A E.coli DH5α (pTOR_01) E.coli DH5α (pUCP20tk) 0.0
E.coli DH5α (pTOR_02) E.coli DH5α (pUCP20tk) 0.0
E.coli DH5α (pEFC36a) E.coli DH5α (pUCP20tk) 4.4 x 10⁻¹
E.coli DH5α (pRWC72a) E.coli DH5α (pUCP20tk) 9.7 x 10⁻²
B E.coli S17-1 (pTOR_01) E.coli DH5α (pUCP20tk) 0.0
E.coli S17-1 (pTOR_02)
E.coli DH5α (pUCP20tk) 3.9 x 10⁻⁵
C E.coli DH5α (pEFC36a; pTOR_02) E.coli DH5α (pUCP20tk) 6.3 x 10⁻⁵
D E.coli S17-1 (pTOR_01) 5565: P. agglomerans 0.0
E.coli S17-1 (pTOR_02) 5565: P. agglomerans 1.5 x 10⁻⁶
E.coli DH5α (pEFC36a) 5565 P. agglomerans 2.4 x 10⁻⁵
E.coli DH5α (pRWC72a)
5565 P. agglomerans 3.6 x 10⁻⁶
E 5565 P. agglomerans (pEFC36a) 15320 P. ananatis 1.6 x 10⁻³
5565 P. agglomerans (pEFC72a)
15320 P. ananatis 3.7 x 10⁻⁴
F E.coli DH10β (pEFC36a) Mixed soil bacteria; Pseudomonas spp 2.3 x 10⁻³
†; Number of transconjugants per donor cells
Page 143
119
Figure 4.10: Conjugation transfer frequencies of plasmids in E.coli and Pantoea strains
Page 144
120
These results in fact show that conjugative transfer may occur at higher frequencies
between closely related bacteria as similarly observed between E. coli bacteria (Figure
4.10).
Plasmid pTOR_01 could not be transferred between E. coli cells, as predicted,
conjugative transfer and mobilization experiments have confirmed that plasmid
pTOR_01 (lacking mobilization and transfer genes) is non-mobile. Plasmid pTOR_02
was successfully transferred from S17-1 E. coli (a helper strain that has the pRP4 plasmid
tra region integrated into its chromosome) to both E. coli DH5α and environmental strain
of Pantoea, suggesting pTOR_02 carries functional mobilization genes. The transfer
frequencies were 3.9 x 10⁻⁵
and 1.5 x 10⁻⁷
transconjugants/donor cells in E. coli and P.
agglomerans respectively (Table 4.9).
In a simulated soil experiment, plasmid pEFC36a was also shown to transfer to
bacteria in the soil at high frequency of 2.3 x 10⁻³
. Four unknown transconjugants
selected for 16s rRNA sequencing were compared to bacterial sequences on Genbank
database using a BLASTn program, and showed homology to Pseudomonas species.
PCR amplification of the pEFC36a replication and the macrolide resistance genes
confirmed that the Pseudomonas soil isolates have acquired the plasmid pEFC36a.
4.3.6. Plasmid stability in bacteria growing in the absence of antibiotic selection
The stability assay results show consistent plasmid maintenance in both E. coli
and P. agglomerans with the exemption of plasmid pTOR_02, which has no predicted
plasmid maintenance genes. The pTOR_02 stability in both E. coli and P. agglomerans
Page 145
121
shows reduction in plasmid containing cells in comparison to total viable cells (Figure
4.11). Reduction in plasmid containing cells is observed in the strain of Pantoea, showing
continued plasmid loss from day 1 up to day 26. In E. coli, even though there is a
difference between total viable cells and plasmid containing cells, reduction in plasmid
containing cells is not significant. The E. coli (pTOR_02) stability results may be
affected by conjugative mobilization taking place at the same time in the broth due the
presence of transfer helper genes in the S17-1 E. coli host strain used for this study. The
results for plasmid pTOR_01 (a non-mobile plasmid) stability in S17-1 E. coli shows no
reduction in plasmid containing cells (Figure 4.12). Similarly, pEFC36a and pRWC72a
(both self-transmissible plasmids) plasmid stability assays in both E. coli and P.
agglomerans show no reduction in plasmid containing cells (Figure 4.13 and 4.14),
suggesting that the plasmids pTOR_01, pEFC36a and pRWC72a have effective plasmid
maintenance genes, which were predicted in the plasmid sequences.
The results from a controlled soil experiment did not show any difference between total
viable cells and plasmid containing cells in the assayed plasmids pTOR_02, pEFC36a
and pRWC72a (Figure 4.15). All the graphs show reduction in cell numbers from day 2
to day 56, the soil conditions may not be favorable for the growth of P. agglomerans.
Factors that may affect the growth of P. agglomerans in the given soil environment
could be the lack of sufficient nutrients, and stressful environmental conditions and
competition from indigenous soil microflora.
Page 146
122
Figure 4.11: Plasmid pTOR_02 stability in E.coli S17-1(top) and P.agglomerans (below),
grown in LB broth without antibiotic selection for 26 days.
Page 147
123
Figure 4.12: Plasmid pTOR_01 stability in E. coli S17-1 sub-cultured in LB broth
without antibiotic selection for 26 days.
Page 148
124
Figure 4.13: Plasmid pEFC36a stability in E. coli DH5α (top) and P. agglomerans
(below), sub-cultured in LB broth without antibiotic selection for 26 days.
Page 149
125
Figure 4.14: Plasmid pRWC72a stability in E. coli DH5α (top) and P. agglomerans
(below), sub-cultured in LB broth without antibiotic selection for 26 days.
Page 150
126
Figure 4.15: Plasmid stability assays, pTOR_02 (top), pEFC36a (center) and pRWC72a
(bottom) in P. agglomerans grown in the soil environment for 56 days
Page 151
127
4.3.7. Characterization of antibiotic resistance and resistance patterns
The four plasmids express high-level resistance to erythromycin but vary in
resistance patterns to other antibiotics (Table 4.10). Two variants of the macrolide
resistance operon are found in the sequenced plasmids, comprised of genes that code for
a macrolide 2’ phosphotransferase (mph), hydrophobic protein (mrx) and a transcriptional
regulator (mphR). These genes are collectively involved in high-level resistance to the
macrolide class of antibiotics which include erythromycin, clarithromycin, azithromycin
and tylosin (Szczepanowski et al. 2007). The two macrolide resistance clusters differ at
nucleotide sequence level and in genetic arrangement (Figure 4.16), but did not show any
difference in resistance to high levels of erythromycin. The variant A is designated as
mph(A), mrx(A), mphR(A) in that order, and it has been described in many previously
sequenced plasmids. The macrolide A cluster is found in plasmids pTOR_01, pTOR_02
and pEFC36a and is associated with transposable elements. The second macrolide
resistance cluster B in pRWC72a consists of the order of genes mphR(B) ,mph(B)
mrx(B), to date, this macrolide gene cluster has only been found in a single multiple
resistance plasmid pRSB111 (Genbank: AM260957) isolated from a WWTP in Germany
(Szczepanowski et al. 2007). Two copies of insertion sequence elements (IS4 and IS26)
associated with the class 1 integron system flank the macrolide B cluster in pRWC72a.
Page 152
128
Table 4.10: Summary of antibiotic resistance patterns expressed by the different plasmids
Antibiotic Plasmid
Predicted antibiotic resistance genes and
their phenotypic traits
Concentrations
tested†
Resistance
phenotype
Erythromycin
pTOR_01
pTOR_02
pEFC36a
pRWC72a
mph, mrx, mphR: Macrolide resistance
200-8000 μg/mL
(R)
Tetracycline pRWC72a tetA, tetR: Tetracycline resistance 10 μg/mL (R)
Ampicillin pEFC36a blaTEM-1β: Beta lactams resistance 100 μg/mL (R)
Chloramphenicol pEFC36a
catA: Chloramphenicol resistance 25 μg/mL (R)
Streptomycin
Spectinomycin
Gentamicin
Kanamycin
Neomycin
pTOR_02
pEFC36a
aadA2: Aminoglycosides resistance
100 μg/mL
100 μg/ml
50 μg/mL
20 μg/mL
50 μg/mL
(R)
(R)
(S)
(S)
(S)
†plasmid resistance expressed in E.coli host grown on LB broth supplemented with a
given concentration; (R), Resistant; (S), Sensitive.
Page 153
129
Figure 4.16: Comparative analysis of the macrolide resistance gene clusters (blue) carried
in mobile elements (black). Plasmid pRSB111(a) isolated from WWTP and pRWC72a
(b) carry similar macrolide B resistance gene cluster. The macrolide A resistance gene
cluster is found in plasmids pMC2 (c) isolated from swine manure, pTOR_02 (d),
pEFC36a (e) and pTOR_01(f). The dotted line indicates the change in gene order
between the mphR groups.
Page 154
130
4.3.8. Comparative analyses of plasmid pTOR_02 and pEFC36a Tn21 multiple
resistance transposons
The backbones of plasmids pTOR_02 and pEFC36a reveal an insertion of a large
multiple resistance and highly conserved accessory region consisting of resistance genes
clustered together within transposable elements belonging to the Tn21/Tn3 family. The
Tn21 multiple resistance transposons have been frequently found in both plasmids and
bacterial chromosomes (Figure 4.17). The plasmid pTOR_02 Tn21 multiple resistance
transposon is a 23,575bp region inserted in a small mobilizable plasmid backbone. It
consist of an undisrupted class 1 integron, intI1 gene coding for an integrase upstream
and resistance gene in cassettes; dhfR, aadA2 for resistance to a trimethroprim and
aminoglycosides respectively inserted between the highly 5’ conserved integrase gene
and the 3’ conserved downstream segment consisting of qacEdelta, sul1 and orf5. The
macrolide resistance operon is located within this Tn21 transposon flanked by IS6100
upstream and IS26 downstream. The chromium resistance gene (chrA) is also found
between the macrolide and the class 1-integron genes. Downstream of the macrolide
resistance gene cluster is another conserved region consisting several genes for putative
mercury resistance; urf2 (unknown function), merE, merC, merP, merT coding for
mercuric ion transport, merA(reductase), and merD, merR, (regulatory proteins).
Plasmid pEFC36a contains a similar 25,517bp accessory region with slight
difference due to deletion of the mercuric ion transport genes (merC, merP, merT) and
insertion of a beta- lactamase encoding gene (blaTEM1β for resistance to beta-lactams)
associated with merA gene and located upstream of the Tn21 transcriptional regulator
(tnpR). The chloramphenicol resistance gene, catA is found upstream of the Tn21
Page 155
131
Figure 4.17: A comparative analysis by mauve alignment showing similarities in the
Tn21 multiple resistance transposons derivatives from various erythromycin resistance
plasmids; (a) pMC2, (b) pTOR_02, (c) pEFC36a, (d) TnSF1 Shigella flexineri
chromosome.
Page 156
132
transposase located between hypothetical genes. The chrA codes for a chromium ion
transport mechanism (for chromium resistance) is located downstream the sulI1 gene
cassette of the class 1 integron system. Located downstream of the macrolide A-
resistance operon are the mercury resistance genes that encode mercuric regulatory
proteins (merR, merD), reductase (merA), merE and the conserved urf2 gene (unknown
functions) of the Tn21 transposon.
4.3.9. Analysis of IS elements predicted for pEFC36a Tn21 transposition
Plasmid pEFC36a is most closely related to plasmid R100 in terms of backbone
and accessory genes. Both plasmids also carry almost similar resistance region
comprising of the Tn21 multiple resistance transposon and the adjacent chloramphenicol
resistance gene. In plasmid R100 this resistance region is flanked by IS1 family insertion
elements. The IS1 elements are very common in related plasmids and widely distributed
among members of the enterobacteriacease chromosomes such as E. coli and Shigella
species (Rhodes et al. 2000b). In silico analysis of plasmid pEFC36a's similar resistance
region appeared to be missing IS1 elements or any insertion sequences that could be
associated with the translocation of the chloramphenicol resistance gene or the entire
resistance region. Figure 18 shows a diagram of the multi-resistance region of pEFC36a,
highlighting areas missing the IS elements and regions for PCR primers designed for
confirmation of its absence. IS1 is about 768 bp, amplification using target primers could
not reveal the presence of these elements. DNA sequencing of the PCR products
confirmed the region is in fact missing the IS elements. Plasmid TOR_02 which carries a
Page 157
133
Figure 4.18: A diagram of plasmid pEFC36a Tn21 multiple resistance transposon,
highlighting areas missing the IS elements flanking the region. P1-P8 are the different
primers that were designed to confirm the absence of the IS elements.
Page 158
134
similar Tn21 multi-resistance region contains a single IS2 element downstream of the
merR. IS2 elements are also widely distributed in E.coli and Shigella species.
4.3.10. Analysis of plasmid pRWC72a disrupted class 1 integrase and resistance genes
The class 1 integron system is often characterized by an integrase gene (intI1),
conserved segments of gene cassettes and resistance genes qacEΔ1, sulI and orf5. The
role of the intI1 integrase gene is for excision and integration of resistance genes in
cassettes by recombination mechanism (Bennett 2008; Gillings et al. 2008; Zhang et al.
2009). The qacEΔ1 gene codes for a putative small multi-drug resistance (SMR) efflux
pump responsible for resistance to quaternary ammonium compounds, sulI code for
dihydropteroate synthase (for sulphonamides resistance) and orf5 is a hypothetical gene
assumed to code for puromycin acetyltransferase (for putative puromycin resistance). The
intI1 integrase gene in pRWC72a has been disrupted by insertion of mobile elements
carrying the macrolide (B)-resistance gene cluster. The insertion of additional resistance
genes in the integron gene cassettes by recombination may not be possible in pRWC72a
due to the disruption in the intI1 gene.
Plasmid pRWC72a carries tetracycline resistance genes, which are also associated
with a Tn21 family transposon consisting of an identical transposase (tnpA) and
transcriptional regulator tnpR. The tetracycline resistance operon consist of a tetA gene
that codes for the tetracycline efflux protein and tetR gene that codes for a transcriptional
regulator, are found downstream of the tnpR. Plasmid pRWC72a also consists of the Tn3
transposon family associated with the mpr gene located downstream of parB. The mpR
gene product is a zinc metalloproteinase for putative zinc resistance (Picão et al. 2008).
Page 159
135
4.4. Discussion
4.4.1. Wastewater influent provides an environment for plasmid diversification by
recombination of mobile elements
The method used for isolating the plasmids targeted erythromycin resistant
plasmids, therefore it is not surprising that all the characterized plasmids carry the
macrolide resistance gene cluster responsible for high level resistance to erythromycin. In
addition, the plasmids carry other resistance genes for resistance to other antibiotics and
toxic chemical compounds. The pRWC72a sequence data provide some insights on the
diversification of multiple resistance plasmids in WWTP environments, based on
comparative genomic analysis, the pB3 plasmid sequence provided the closest and highly
similar incP-1β ancestral backbone to pRWC72a. The insertion of the macrolide B-
resistance gene in the pRWC72a backbone is notable, pRWC72a is the second plasmid to
be reported carrying the macrolide-B gene cluster after plasmid pRSB111
(Szczepanowski et al. 2007) (also isolated from a WWTP). This acquisition resulted in
additional resistance to erythromycin, which is not encoded by the related plasmids pB3,
pB4, pB8 and pB10 (Schluter et al. 2003; Tauch et al. 2003; Heuer et al. 2004; Schluter
et al. 2007). The incP-1β backbone associated with these plasmids are reported to be
ubiquitous in polluted aquatic and soil environments (Thorsted et al. 1998; Smalla et al.
2006; Sen et al. 2011), and have been isolated in clinical situations as well (Jobanputra
and Datta 1974; Kamachi et al. 2006). The close evolutionary relationship of plasmid
pEFC36a to plasmids isolated from clinical bacteria and pathogenic isolates R100,
pC15_1a, pEC_L8 and pEC_L46 make it tempting to speculate that pEFC36a plasmid
may have a clinical connection, and this is supported by presence of resistance genes to
Page 160
136
beta-lactams, chloramphenicol and the trimethroprim associated with class 1 integron.
These antibiotics are widely used in clinical settings for human therapy. A bacterium
carrying the plasmid pEFC36a may have been introduced into the WWTP through the
feces of a human host.
Acquisition of the genes in integrative elements may occur within the WWTP,
integrative elements carrying antibiotic resistance gene cassettes such as the class 1
integron are mobilized by transposons when the integron is found within a transposon.
The Tn21 family of transposons are frequently found associated with multiple resistance
plasmids and may play a prominent role in mobilization of multiple resistance genes
across different plasmids and bacterial chromosomes, particularly when it carries an
integron capable of accumulating gene cassettes.
4.4.2. Possible persistence of plasmids in environmental bacterial hosts in the absence of
antibiotic selection
The conjugation and stability assays confirmed that the plasmids carrying
functional predicted genes for conjugative mobilization (pTOR_02), self-transfer
(pEFC36a, pRWC72a) and effective stability modules (pTOR_01, pEFC36a, pRWC72a)
are well suited for persistence in bacterial hosts. The presence of tra and mob genes
facilitate successful in vivo conjugal transfer and determine the transfer frequencies to
recipient bacteria (Meyer 2000; Lawley et al. 2002; Meyer 2009; Harajly et al. 2010;
Wang et al. 2012). Plasmid mobility is very important in the evolution and dissemination
of multiple resistance in bacteria found in the different environments, and it is directly
involved in the current increase in multi-drug resistance within hospital settings (Smillie
Page 161
137
et al. 2010). Plasmid stability is also facilitated by the plasmid replication in addition to
the plasmid maintenance genes, plasmid addiction systems have been linked to stable
maintenance and dissemination successes in incFII (narrow host range plasmids) (Mnif et
al. 2010). Plasmid pEFC36a (incFII plasmid) encode two different addiction systems in
addition to other plasmid stability genes, it is not clear what advantage these addiction
mechanisms have on pEFC36a in comparison to other plasmids. The stability in E. coli
and P.agglomerans appeared to be equally the same for all the 3 plasmids assayed. Based
on the results it is possible that these antibiotic resistance plasmids could persist in the
environment without antibiotic selection.
In the simulated soil experiments, the soil chemical composition was not known,
and many factors may be playing a role in stable maintenance and transfer of the
plasmids in bacteria growing in the soil. The presence of low-level antimicrobials
residues have been reported to play a role in both promoting horizontal gene transfer and
overall maintenance of plasmids in bacterial populations (Lupo et al. 2012). Additionally,
the plasmids that carry addiction and active partitioning genes would survive well
without antibiotic selective pressure. Although P. agglomerans decreased in numbers
during incubation in the soil, the results have shown no difference between total viable
cells and plasmid containing cells which indicates the cells remaining were maintaining
the plasmids.. The results from conjugal transfer of plasmid pEFC36a from laboratory E.
coli into indigenous Pseudomonas species in the soil are notable , and suggest potential
transfer of plasmids between bacteria introduced by anthropogenic activities (such as
irrigation using WWTP effluent) and environmental soil bacteria. The conclusion based
Page 162
138
on these results suggest that plasmids can persist and disseminate antibiotic resistance
genes in natural environments (i.e. soil) if the host can also survive in the soil.
4.5. Literature cited
Ansari, M.I., Grohmann, E. and Malik, A. (2008) Conjugative plasmids in multi-resistant
bacterial isolates from Indian soil. Journal of Applied Microbiology 104, 1774-1781.
Aziz, R.K., Bartels, D., Best, A.A., DeJongh, M., Disz, T., Edwards, R.A., Formsma, K., Gerdes,
S., Glass, E.M., Kubal, M., Meyer, F., Olsen, G.J., Olson, R., Osterman, A.L., Overbeek,
R.A., McNeil, L.K., Paarmann, D., Paczian, T., Parrello, B., Pusch, G.D., Reich, C.,
Stevens, R., Vassieva, O., Vonstein, V., Wilke, A. and Zagnitko, O. (2008) The RAST
server: Rapid annotations using subsystems technology. BMC Genomics 9. 75
Baharoglu, Z., Bikard, D. and Mazel, D. (2010) Conjugative DNA transfer induces the bacterial
SOS response and promotes antibiotic resistance development through integron
activation. PloS Genetics 6
Bahl, M.I., Burmolle, M., Meisner, A., Hansen, L.H. and Sorensen, S.J. (2009) All IncP-1
plasmid subgroups, including the novel epsilon subgroup, are prevalent in the influent of
a Danish wastewater treatment plant. Plasmid 62, 134-139.
Bennett, P.M. (2008) Plasmid encoded antibiotic resistance: acquisition and transfer of antibiotic
resistance genes in bacteria. British Journal of Pharmacology 153, S347-S357.
Boyd, D.A., Tyler, S., Christianson, S., McGeer, A., Muller, M.P., Willey, B.M., Bryce, E.,
Gardam, M., Nordmann, P., and Mulvey, M.R. (2004) Complete nucleotide sequence of a
92-kilobase plasmid harboring the CTX-M-15 extended-spectrum beta-lactamase
Page 163
139
involved in an outbreak in long-term care facilities in Toronto, Canada. Antimicrobial
Agents and Chemotherapy 48, 3758-3764.
Carattoli, A. (2009) Resistance plasmid families in Enterobacteriaceae. Antimicrobial Agents and
Chemotherapy 53, 2227-2238.
Carattoli, A. (2011) Plasmids in Gram negatives: Molecular typing of resistance plasmids.
International Journal of Medical Microbiology 301, 654-658.
Chee-Sanford, J.C., Mackie, R.I., Koike, S., Krapac, I.G., Lin, Y.F., Yannarell, A.C., Maxwell,
S. and Aminov, R.I. (2009) Fate and transport of antibiotic residues and antibiotic
resistance genes following land application of manure waste. Journal of Environmental
Quality 38, 1086-1108.
Chelme, S., Fonseca, P., Mercado, R., Alarcon, N. and Sanchez, O. (2008) Macromolecular
composition and anaerobic degradation of the sludge produced in a sequencing batch
reactor. Electronic Journal of Biotechnology 11, 95-101.
Chouari, R., Le Paslier, D., Daegelen, P., Dauga, C., Weissenbach, J. and Sghir, A. (2010)
Molecular analyses of the microbial community composition of an anoxic basin of a
municipal wastewater treatment plant reveal a novel lineage of Proteobacteria. Microbial
Ecology 60, 272-281.
de la Cruz, F., Frost, L.S., Meyer, R.J. and Zechner, E.L. (2010) Conjugative DNA metabolism
in Gram-negative bacteria. FEMS Microbiology Reviews 34, 18-40.
Frost, L.S. and Koraimann, G. (2010) Regulation of bacterial conjugation: Balancing opportunity
with adversity. Future Microbiology 5, 1057-1071.
Page 164
140
Ghosh, S. and LaPara, T.M. (2007) The effects of sub-therapeutic antibiotic use in farm animals
on the proliferation and persistence of antibiotic resistance among soil bacteria. ISME
Journal 1, 191-203.
Gillings, M., Boucher, Y., Labbate, M., Holmes, A., Krishnan, S., Holley, M. and Stokes, H.W.
(2008) The evolution of class 1 integrons and the rise of antibiotic resistance. Journal of
Bacteriology 190, 5095-5100.
Harajly, M., Khairallah, M.-T., Corkill, J., Araj, G. and Matar, G. (2010) Frequency of
conjugative transfer of plasmid-encoded ISEcp1 - blaCTX-M-15 and aac(6')-lb-cr genes
in Enterobacteriaceae at a tertiary care center in Lebanon: Role of transferases. Annals of
Clinical Microbiology and Antimicrobials 9, 19.
Hesham, A.E.-L., Qi, R. and Yang, M. (2011) Comparison of bacterial community structures in
two systems of a sewage treatment plant using PCR-DGGE analysis. Journal of
Environmental Sciences-China 23, 2049-2054
Heuer, H., Szczepanowski, R., Schneiker, S., Puhler, A., Top, E.M. and Schluter, A. (2004) The
complete sequences of plasmids pB2 and pB3 provide evidence for a recent ancestor of
the IncP-1 beta group without any accessory genes. Microbiology-Sgm 150, 3591-3599.
Hu, Z., Houweling, D. and Dold, P. (2012) Biological nutrient removal in municipal wastewater
treatment: New directions in sustainability. Journal of Environmental Engineering-Asce
138, 307–317.
Jobanput.Rs and Datta, N. (1974) Trimethoprim R-factors in enterobacteria from clinical
specimens. Journal of Medical Microbiology 7, 169-177.
Page 165
141
Kamachi, K., Sota, M., Tamai, Y., Nagata, N., Konda, T., Inoue, T., Top, E.M. and Arakawa, Y.
(2006) Plasmid pBP136 from Bordetella pertussis represents an ancestral form of IncP-1
beta plasmids without accessory mobile elements. Microbiology-Sgm 152, 3477-3484.
Kemper, J.M., Walse, S.S. and Mitch, W.A. (2010) Quaternary amines as nitrosamine
precursors: A role for consumer products? Environmental Science and Technology 44,
1224–1231.
Klimke, W.A. and Frost, L.S. (1998) Genetic analysis of the role of the transfer gene, traN, of
the F and R100-1 plasmids in mating pair stabilization during conjugation. Journal of
Bacteriology 180, 4036-4043.
Kulinska, A., Czeredys, M., Hayes, F. and Jagura-Burdzy, G. (2008) Genomic and functional
characterization of the modular broad host range RA3 plasmid, the archetype of the IncU
group. Applied and Environmental Microbiology 74, 4119-4132.
LaPara, T. and Burch, T. (2011) Municipal wastewater as a reservoir of antibiotic resistance.
Antimicrobial Resistance in the Environment, John Wiley and Sons, Inc. 241-250
Lawley, T.D., Gilmour, M.W., Gunton, J.E., Standeven, L.J. and Taylor, D.E. (2002) Functional
and mutational analysis of conjugative transfer region 1 (Tra1) from the IncHI1 plasmid
R27. Journal of Bacteriology 184, 2173-2180.
Le-Minh, N., Khan, S.J., Drewes, J.E. and Stuetz, R.M. (2010) Fate of antibiotics during
municipal water recycling treatment processes. Water Research 44, 4295-323.
Li, P.L., Hwang, I., Miyagi, H., True, H. and Farrand, S.K. (1999) Essential components of the
Ti plasmid trb system, a type IV macromolecular transporter. Journal of Bacteriology
181, 5033–5041.
Page 166
142
Liu, X.., Zhang, Y., Yang, M., Wang, Z.Y. and LV, W.Z. (2007) Analysis of bacterial
community structures in two sewage treatment plants with different sludge properties and
treatment performance by nested PCR-DGGE method. Journal of Environmental
Sciences-China 19, 60-66
Lupo, A., Coyne, S. and Berendonk, T.U. (2012) Origin and evolution of antibiotic resistance:
The common mechanisms of emergence and spread in water bodies. Frontiers in
microbiology 3, 18.
Marti, E. and Balcázar, J.L. (2012) Multidrug resistance-encoding plasmid from Aeromonas
species strain P2G1. Clinical Microbiology and Infection 18, E366-E368.
Meric, S. and Fatta Kassinos, D. (2009) Water treatment, municipal. Encyclopedia of
Microbiology Oxford: Academic Press 587-599.
Meyer, R. (2000) Identification of the mob genes of plasmid pSC101 and characterization of a
hybrid pSC101-R1162 system for conjugal mobilization. The Journal of Bacteriology
182, 4875-4881.
Meyer, R. (2009) Replication and conjugative mobilization of broad host-range IncQ plasmids.
Plasmid 62, 57-70.
Miege, C., Choubert, J.M., Ribeiro, L., Eusebe, M. and Coquery, M. (2009) Fate of
pharmaceuticals and personal care products in wastewater treatment plants: Conception
of a database and first results. Environmental Pollution 157, 1721-1726.
Mnif, B., Vimont, S., Boyd, A., Bourit, E., Picard, B., Branger, C., Denamur, E. and Arlet, G.
(2010) Molecular characterization of addiction systems of plasmids encoding extended-
spectrum β-lactamases in Escherichia coli. Journal of Antimicrobial Chemotherapy 65,
1599-1603
Page 167
143
Moore, J.E., Rao, J.R., Moore, P.J.A., Millar, B.C., Goldsmith, C.E., Loughrey, A. and Rooney,
P.J. (2010) Determination of total antibiotic resistance in waterborne bacteria in rivers
and streams in Northern Ireland: Can antibiotic resistant bacteria be an indicator of
ecological change? Aquatic Ecology 44, 349-358.
Moura, A., Henriques, I., Ribeiro, R. and Correia, A. (2007) Prevalence and characterization of
integrons from bacteria isolated from a slaughter house wastewater treatment plant.
Journal of Antimicrobial Chemotherapy 60, 1243-1250.
Moura, A., Henriques, I., Smalla, K. and Correia, A. (2010) Wastewater bacterial communities
bring together broad host range plasmids, integrons and a wide diversity of
uncharacterized gene cassettes. Research in Microbiology 161, 58-66.
Norman, A., Hansen, L.H. and Sorensen, S.J. (2009) Conjugative plasmids: Vessels of the
communal gene pool. Philosophical Transactions of the Royal Society B-Biological
Sciences 364, 2275-2289.
Nuk, M.R., Reisner, A., Neuwirth, M., Schilcher, K., Arnold, R., Jehl, A., Rattei, T. and
Zechner, E.L. (2011) Functional analysis of the finO distal region of plasmid R1. Plasmid
65, 159-168.
Picão, R.C., Poirel, L., Demarta, A., Silva, C.S.F., Corvaglia, A.R., Petrini, O. and Nordmann, P.
(2008) Plasmid-mediated quinolone resistance in Aeromonas allosaccharophila
recovered from a Swiss lake. Journal of Antimicrobial Chemotherapy 62, 948-950.
Rahube, T.O. and Yost, C.K. (2012) Characterization of a mobile and multiple resistance
plasmid isolated from swine manure and its detection in soil after manure application.
Journal of Applied Microbiology 112, 1123-1133.
Page 168
144
Rhodes, G., Huys, G., Swings, J., McGann, P., Hiney, M., Smith, P. and Pickup, R.W. (2000a)
Distribution of oxytetracycline resistance plasmids between Aeromonads in hospital and
aquaculture environments: Implication of Tn1721 in dissemination of the tetracycline
resistance determinant tetA. Applied and Environmental Microbiology 66, 3883-3890.
Rhodes, G., Parkhill, J., Bird, C., Ambrose, K., Jones, M.C., Huys, G., Swings, J. and Pickup,
R.W. (2004) Complete nucleotide sequence of the conjugative tetracycline resistance
plasmid pFBAOT6, a member of a group of IncU plasmids with global ubiquity. Applied
and Environmental Microbiology 70, 7497-7510.
Rhodes, G., Saunders, J.R. and Pickup, R.W. (2000b) Detection and distribution of insertion
sequence 1 (IS1)-containing bacteria in the freshwater environment. FEMS Microbiology
Ecology 34, 81-90.
Riley, M.A. and Wertz, J.E. (2002) Bacteriocins: Evolution, ecology, and application. Annual
Review of Microbiology 56, 117-137.
Schluter, A., Heuer, H., Szczepanowski, R., Forney, L.J., Thomas, C.M., Puhler, A. and Top,
E.M. (2003) The 64 508 bp IncP-1 beta antibiotic multiresistance plasmid pB10 isolated
from a wastewater treatment plant provides evidence for recombination between
members of different branches of the IncP-1 beta group. Microbiology-Sgm 149, 3139-
3153.
Schluter, A., Szczepanowski, R., Puhler, A. and Top, E.M. (2007a) Genomics of IncP-1
antibiotic resistance plasmids isolated from wastewater treatment plants provides
evidence for a widely accessible drug resistance gene pool. FEMS Microbiology Reviews
31, 449-477.
Page 169
145
Schluter, A., Szczepanowski, R., Tennstedt, T., Heuer, H., Top, E.M. and Puhler, A. (2005)
Genomics of resistance plasmids isolated from wastewater treatment plants. Plasmid 53,
40-41.
Schluter, A., Szuepanowski, R., Kurz, N., Schneiker, S., Krahn, I. and Puhler, A. (2007b)
Erythromycin resistance-conferring plasmid pRSB105, isolated from a sewage treatment
plant, harbors a new macrolide resistance determinant, an integron-containing Tn402-like
element, and a large region of unknown function. Applied and Environmental
Microbiology 73, 1952-1960.
Sen, D., Van der Auwera, G.A., Rogers, L.M., Thomas, C.M., Brown, C.J. and Top, E.M. (2011)
Broad-Host-Range Plasmids from agricultural soils have IncP-1 backbones with diverse
accessory genes. Applied and Environmental Microbiology 77, 7975-7983.
Sergueev, K., Dabrazhynetskaya, A. and Austin, S. (2005) Plasmid partition system of the P1
par family from the pWR100 virulence plasmid of Shigella flexneri. The Journal of
Bacteriology 187, 3369-3373.
Slater, F.R., Bailey, M.J., Tett, A.J. and Turner, S.L. (2008) Progress towards understanding the
fate of plasmids in bacterial communities. FEMS Microbiology Ecology 66, 3-13.
Smalla, K., Haines, A.S., Jones, K., Kroegerrecklenfort, E., Heuer, H., Schloter, M. and Thomas,
C.M. (2006) Increased abundance of IncP-1 beta plasmids and mercury resistance genes
in mercury-polluted river sediments: First discovery of IncP-1 beta plasmids with a
complex mer transposon as the sole accessory element. Applied and Environmental
Microbiology 72, 7253–7259.
Smet, A., Van Nieuwerburgh, F., Vandekerckhove, T.T.M., Martel, A., Deforce, D., Butaye, P.
and Haesebrouck, F. (2010) Complete nucleotide sequence of CTX-M-15-plasmids from
Page 170
146
clinical Escherichia coli isolates: Insertional events of transposons and insertion
sequences. PloS One 5. e11202.
Smillie, C., Garcillan-Barcia, M.P., Francia, M.V., Rocha, E.P.C. and de la Cruz, F. (2010)
Mobility of plasmids. Microbiology and Molecular Biology Reviews 74, 434-452.
Subbiah, M., Mitchell, S.M., Ullman, J.L. and Call, D.R. (2011) Beta-lactams and florfenicol
antibiotics remain bioactive in soils while ciprofloxacin, neomycin, and tetracycline are
neutralized. Applied and Environmental Microbiology 77.
Suzuki, H., Yano, H., Brown, C.J. and Top, E.M. (2010) Predicting plasmid promiscuity based
on genomic signature. Journal of Bacteriology 192, 6045-6055.
Schluter, A., Heuer, H., Szczepanowski, R., Forney, L.J., Thomas, C.M., Puhler, A. and Top,
E.M. (2003) The 64 508 bp IncP-1 beta antibiotic multiresistance plasmid pB10 isolated
from a wastewater treatment plant provides evidence for recombination between
members of different branches of the IncP-1 beta group. Microbiology-Sgm 149, 3139-
3153.
Schluter, A., Szczepanowski, R., Puhler, A. and Top, E.M. (2007) Genomics of IncP-1 antibiotic
resistance plasmids isolated from wastewater treatment plants provides evidence for a
widely accessible drug resistance gene pool. FEMS Microbiology Reviews 31, 449-477.
Schluter, A., Szczepanowski, R., Tennstedt, T., Heuer, H., Top, E.M. and Puehler, A. (2005)
Genomics of resistance plasmids isolated from wastewater treatment plants. Plasmid 53,
40-41.
Seiler, C. and Berendonk, T.U. (2012) Heavy metal driven co-selection of antibiotic resistance in
soil and water bodies impacted by agriculture and aquaculture. Frontiers in Microbiology
3, 399.
Page 171
147
Smillie, C., Garcillan-Barcia, M.P., Francia, M.V., Rocha, E.P.C. and de la Cruz, F. (2010)
Mobility of Plasmids. Microbiology and Molecular Biology Reviews 74, 434-452.
Szczepanowski, R., Bekel, T., Goesmann, A., Krause, L., Kromeke, H., Kaiser, O., Eichler, W.,
Puhler, A. and Schluter, A. (2008) Insight into the plasmid metagenome of wastewater
treatment plant bacteria showing reduced susceptibility to antimicrobial drugs analysed
by the 454-pyrosequencing technology. Journal of Biotechnology 136, 54-64.
Szczepanowski, R., Braun, S., Riedel, V., Schneiker, S., Krahn, I., Puhler, A. and Schluter, A.
(2005) The 120 592 bp lncF plasmid pRSB107 isolated from a sewage treatment plant
encodes nine different anti biotic-resistance determinants, two iron-acquisition systems
and other putative virulence-associated functions. Microbiology-Sgm 151, 1095-1111.
Szczepanowski, R., Krahn, I., Bohn, N., Puhler, A. and Schluter, A. (2007) Novel macrolide
resistance module carried by the IncP-1 beta resistance plasmid pRSB111, isolated from
a wastewater treatment plant. Antimicrobial Agents and Chemotherapy 51, 673-678.
Szczepanowski, R., Linke, B., Krahn, I., Gartemann, K.H., Gutzkow, T., Eichler, W., Puhler, A.
and Schluter, A. (2009) Detection of 140 clinically relevant antibiotic resistance genes in
the plasmid metagenome of wastewater treatment plant bacteria showing reduced
susceptibility to selected antibiotics. Microbiology-Sgm 155, 2306-2319.
Tabuchi, A., Min, Y.N., Womble, D.D. and Rownd, R.H. (1992) Autoregulation of the stability
operon of IncFII plasmid NR1. The Journal of Bacteriology 174, 7629-7634.
Tennstedt, T., Szczepanowski, R., Krahn, I., Puhler, A. and Schluter, A. (2005) Sequence of the
68,869 bp IncP-1 alpha plasmid pTB11 from a waste-water treatment plant reveals a
highly conserved backbone, a Tn402-like integron and other transposable elements.
Plasmid 53, 218-238.
Page 172
148
Tauch, A., Schluter, A., Bischoff, N., Goesmann, A., Meyer, F. and Puhler, A. (2003) The
79,370-bp conjugative plasmid pB4 consists of an IncP-1 beta backbone loaded with a
chromate resistance transposon, the strA-strB streptomycin resistance gene pair, the
oxacillinase gene bla(NPS-1), and a tripartite antibiotic efflux system of the resistance-
nodulation-division family. Molecular Genetics and Genomics 268, 570-584.
Thisted, T. and Gerdes, K. (1992) Mechanism of post-segregational killing by the hok/sok
system of plasmid R1 : Sok antisense RNA regulates hok gene expression indirectly
through the overlapping mok gene. Journal of Molecular Biology 223, 41-54.
Thorsted, P.A., Macartney, D.P., Akhtar, P., Haines, A.S., Ali, N., Davidson, P., Stafford, T.,
Pocklington, M.J., Pansegrau, W., Wilkins, B.M., Lanka, E. and Thomas, C.N. (1998)
Complete sequence of the IncP beta plasmid R751: Implications for evolution and
organisation of the IncP backbone. Journal of Molecular Biology 282, 969-990
Tschäpe, H. (1994) The spread of plasmids as a function of bacterial adaptability. FEMS
Microbiology Ecology 15, 23-31.
Tsuchimoto, S., Nishimura, Y. and Ohtsubo, E. (1992) The stable maintenance system pem of
plasmid R100: Degradation of PemI protein may allow PemK protein to inhibit cell
growth. The Journal of Bacteriology 174, 4205-4211.
Tsuchimoto, S., Ohtsubo, H. and Ohtsubo, E. (1988) Two genes, pemK and pemI, responsible for
stable maintenance of resistance plasmid R100. The Journal of Bacteriology 170, 1461-
1466.
Vanbiesen, T. and Frost, L.S. (1994) The finO protein of IncF plasmids binds finP antisense
RNA and its target, traJ messenger-RNA, and promotes duplex formation. Molecular
Microbiology 14, 427-436.
Page 173
149
Velappan, N., Sblattero, D., Chasteen, L., Pavlik, P. and Bradbury, A.R.M. (2007) Plasmid
incompatibility: More compatible than previously thought? Protein Engineering Design
and Selection 20, 309-313.
Waiser, M.J., Humphries, D., Tumber, V. and Holm, J. (2011) Effluent-dominated streams. Part
2: Presence and possible effects of pharmaceuticals and personal care products in
Wascana creek, Saskatchewan, Canada. Environmental Toxicology and Chemistry 30,
508-519.
Wang, T., Chen, Z., Cheng, Q., Zhou, M., Tian, X., Xie, P., Zhong, L., Shen, M. and Qin, Z.
(2012) Characterization of replication and conjugation of plasmid pWTY27 from a
widely distributed Streptomyces species. BMC Microbiology 12, 253.
Weisburg, W.G., Barns, S.M., Pelletier, D.A. and Lane, D.J. (1991) 16s ribosomal DNA
amplification for phylogenetic study. Journal of Bacteriology 173, 697-703.
Yang, S.C., He, Y.L., Liu, Y.H., Chou, C., Zhang, P.X. and Wang, D.Q. (2010) Effect of
wastewater composition on the calcium carbonate precipitation in upflow anaerobic
sludge blanket reactors. Frontiers of Environmental Science and Engineering in China 4,
142-149.
Zhang, X.-X., Zhang, T., Zhang, M., Fang, H. and Cheng, S.-P. (2009) Characterization and
quantification of class 1 integrons and associated gene cassettes in sewage treatment
plants. Applied Microbiology and Biotechnology 82, 1169-1177.
Page 174
150
CHAPTER 5 – ANALYSIS, DETECTION AND QUANTIFICATION OF
ANTIBIOTIC RESISTANCE DETERMINANTS FROM THE REGINA
WASTEWATER TREATMENT PLANT IN THE ENVIRONMENT
Page 175
151
5.1. Introduction
Dissemination of antibiotic resistance determinants in the environment is
increasingly recognized as a potential public health concern and has recently drawn
attention due to the continuing rise in multiple resistant pathogenic bacteria in hospital
environments. Wastewater treatment plant (WWTP) effluent is a potential source of
antibiotic resistant bacteria (ARB) and resistance plasmids that are released into
watersheds through rivers and creeks ultimately reaching geographically distant areas
such as lakes and coastal waters (Pruden et al. 2006; Zhang et al. 2009; Storteboom et al.
2010; Czekalski et al. 2012). Furthermore, antibiotic resistance plasmids (ARPs) may be
introduced into the environment through irrigation using wastewater treatment plant
(WWTP) effluent and application of activated sludges in agricultural soils as fertilizer
(Chee-Sanford et al. 2009; Zhang et al. 2010). The introduction of ARPs to such
environments may be considered undesirable if they enter pristine ecosystems, persist for
a long time and are acquired by human pathogens. An increase in the fraction of resistant
microbes above a baseline value, caused by introduction of antibiotic resistance genes
(ARGs) in pristine, isolated or extreme environments could be described as evidence of
pollution (Pruden et al. 2006; Martinez 2009a). Dissemination of ARPs from WWTP
bacteria to environmental microorganisms depends on the persistence of these plasmids
in the environments they are released into, that is, plasmids have to replicate in order to
be transferred into recipient bacteria. These ARPs do not always carry only ARGs, other
accessory genes such as heavy metal resistance genes are vital to the bacterial host where
such a phenotype is required, e.g. in mercury polluted environments (Tauch et al. 2003;
Szczepanowski et al. 2005; Schluter et al. 2007a). Therefore, ARPs may be transferred
Page 176
152
and stably maintained in environments with no antibiotic selection pressures (Sorensen et
al. 2005; Schluter et al. 2007b; Allen et al. 2010). Although plasmid curing has been
demonstrated in vitro (Sorensen et al. 2005), this may not be the case in vivo due to other
environmental challenges the host bacteria may encounter and hence maintain the ARPs
for other functions such as resistance to heavy metals and other toxic chemicals. Studies
have shown the existence of plasmids encoding both antibiotic and heavy metal
resistance genes, these plasmids have been observed in environmental bacteria and can be
transferred to human pathogens (D'Costa et al. 2006; Wright 2007; Martinez 2009a; b;
Forsberg et al. 2012). Contact between the environmental microorganisms with human-
associated microbiota may play a role in the emergence of multiple-resistance in human
pathogens (Baquero et al. 2008; Bahl et al. 2009; Martinez 2009a; b; Forsberg et al.
2012). The previous chapter focused on characterizing plasmids from the WWTP
environments and their conjugative transfer and stability functions. This chapter
investigates the antibiotic resistant microbial communities found in the WWTP influent
and effluent released into the environment, in addition to investigate the occurrence of
ARPs, class 1 integrons and various ARGs downstream of the WWTP, in comparison
with the upstream environment not impacted by the sewage effluent from the Regina
WWTP.
Page 177
153
5.2. Materials and methods
5.2.1. DGGE analysis of aerobic antibiotic resistance microbial communities
Water samples were collected from Regina WWTP influent and effluent by the
city of Regina WWTP staff and transported to the lab at 4 °C. DNA was extracted from
both uncultured and cultured samples. 500 mL water was filtered through 0.45 µm
membrane filters, filters were re-suspended in sterile 50 mL falcon tubes containing 10
mL sterile water, and total community DNA extraction was performed on 5mL re-
suspension using the PowerSoil® DNA isolation kit (MO BIO Laboratories, Inc.,
Carlsbad, CA, USA) following manufacturer’s instructions. In a culture based approach,
a serial dilution of the re-suspension was placed in 2mL sterile eppendorf tubes and 100
µl of the filtered material was plated in duplicate on various plates of Luria Bertani (LB)
agar medium including LB without an antibiotic, LB supplemented with erythromycin
(400 µg/mL) and LB supplemented with tetracycline (10 µg/mL). Colonies were scraped
from the LB plates using sterile disposable loops and re-suspended in 1mL sterile water
in eppendorf tubes. DNA was extracted from the suspension of pooled bacterial colonies
using PowerSoil® DNA isolation kit.
Denaturing gradient gel electrophoresis (DGGE) was performed on the extracted
DNA using a DCode system (Bio-Rad, Hercules, CA, USA) after PCR amplification of
the 16sRNA gene following a protocol by Solaiman and Marschner (2007). The first
round PCR reactions for DGGE were carried out using the bacterial universal primers;
fD1: 5’-AGAGTTTGATCCTGGCTCAG-3’, rD1 : 5’-AAGGAGGTGATCCAGCC-3'
(Weisburg et al. 1991). A total of 50 μL reaction master mix was prepared containing; 5
μL of template DNA, 5 μL of each primers (2 μM), 5 μL of dNTPs (100mM), 5 μL of
Page 178
154
MgSO4 (20 mM), 5 μL of 10X reaction buffer, 0.5 μL of BSA, 0.5 μL of Taq DNA
polymerase (5U/ μL) and 19 μL of de-ionized sterile water. The PCR conditions; 95 °C
for 4 minutes initial denaturing, followed by 35 cycles [of denaturing at 95 °C; annealing
at 56 °C for 30 seconds; extension at 72 °C for 2.5 minutes] and final extension at 72 °C
for 6 minutes. Two μL of the first round PCR product was used as template for the
second round PCR amplification with primers with GC clamp; F 341: 5'-CGCCCGCCG
CGCGCGGCGGGCGGGGCGGGGGCACGGGGGGCCTACGGGAGGCAGCAG-3'
and R 534: 5’-ATTACCGCGGGTGCTGG-3'. The forward primer (F 341) has at its 5'
end an additional 40-nucleotide GC-rich sequence (GC clamp) (Muyzer et al. 1993). A
total of 50 μl reaction mater mix was also prepared containing; 2 μL of template DNA, 5
μL of each primers (2 μM), 5 μL of dNTPs, 5 μL of MgSO4 (20 mM), 5 μL of 10X
reaction buffer, 0.4 μL of Taq DNA polymerase (5U/ μL) and 22.5 μL of de-ionized
sterile water. The PCR conditions were similar to first round PCR but with 29 cycles and
10 mins final extension. Twenty μL of the second round PCR products were subjected to
DGGE with 35% and 70% low and high denaturing gradient respectively. The gel was
stained in standard ethidium bromide solution, notable bright bands in the gel were
excised from the effluent sample, gel purified with QIAEXII ® gel extraction kit
(QIAGEN Sciences, Maryland, USA) and cloned into TOPO ( TA/TOPO vector,
Invitrogen ). Several clones were sequenced to identify the bacterial phyla representing
the PCR amplicons from the effluent sample.
Page 179
155
5.2.2. Sampling sites and descriptions
Water samples were collected from 8 different sites located upstream and
downstream of Regina WWTP on 24-25 July 2012. Figure 5.1 shows a map indicating
the different sampling locations. The Richardson site A1 located upstream of the city of
Regina was considered a control site with minimal anthropogenic influence and not
impacted by sewage effluent. Another site not directly impacted by sewage effluent is site
A2 in the Wascana Creek site located downstream of the city of Regina and 400 m
upstream of the Regina WWTP. Wascana Creek site B is located 100m downstream from
the sewage discharge pump; this site is directly impacted by the WWTP effluent. Sites C
is another site which is not impacted by the sewage flow from the WWTP. Site C is
located in the Qu’ Appelle River upstream from the entry of Wascana Creek sites 1, 2, 3
and Qu’ Appelle River site 5 are located downstream of the WWTP and have been
reported for the presence of erythromycin and other antibiotics (Waiser et al. 2011).
These sites have also been previously investigated for the detection of E. coli and fecal
Bacteroides as indicators of fecal pollution (Fremaux et al., 2009a, 2009b; Tambalo et al.,
2012).
5.2.3. Total community DNA and plasmid DNA isolation
A 1L water sample from each site (collected in the middle and riverbank) was
filtered through a 0.45 µm membrane filter and filter papers re-suspended in 12 mL
sterile water. The re-suspension was separated into 3 equal volumes (4 mL each) and
total community DNA was extracted in triplicate using the Powersoil DNA isolation kit
as per manufacturer’s instructions. Isolated DNA concentrations were estimated by a
Page 180
156
Figure 5.1: A map of Saskatchewan (SK) showing the different sampling locations
upstream and downstream the Regina WWTP. Sites marked with an asterix (*) are
considered as control sites, with Site A1 and Site C experiencing minimal anthropogenic
influence and not directly affected by sewage flow, Site B is directly affected by the
sewage effluent from the WWTP.
Page 181
157
NanoDrop 1000 spectrophotometer (Thermo Fischer Scientific Inc) and stored at -20 °C
prior to PCR analysis.
Plasmid DNA was also isolated from 500 mL water samples collected from site
A2 (400 m upstream) and site 1 downstream of the WWTP. Total plasmid DNA was
isolated from bacterial populations grown on LB agar plates supplemented with 400
μg/mL erythromycin. Colonies were scrapped from the agar plate, re-suspended in 300
mL LB broth with erythromycin and incubated overnight at 37°C with agitation. Three
hundred mL of overnight bacterial cells were pelleted at 6,000 rpm for 30 mins. The
supernatant was discarded and total plasmid DNA was extracted using a NucleoBond®
Xtra Midi prep kit (Macherey Nagel, Duren, Germany) according to manufacturer’s
instructions. Plasmid DNA was used to transform high efficiency DH5α E. coli
competent cells (Invitrogen, Carlsbad, CA, USA) with selection on LB supplemented
with erythromycin (400 μg/mL). The transformed colonies were analyzed for different
antibiotic resistance phenotypes in LB agar plates supplemented with various antibiotic
concentrations; erythromycin (400 μg/mL), tetracycline (10 μg/mL), gentamicin (15
μg/mL), kanamycin (50 μg/mL), neomycin (20 μg/mL) ampicillin (100 μg/mL),
streptomycin (100 μg/mL), spectinomycin (100 μg/mL), and rifampicin (30
μg/mL).Various colonies transformed with plasmids were sub-cultured into a 96 well
plate containing LB broth with 10% glycerol and stored at – 80 °C. DNA was
subsequently isolated from selected E. coli clones from the glycerol stock library. The
colonies were sub-cultured by tooth picking into LB agar plate supplemented with
erythromycin, DNA was isolated by quickly boiling the colony at 95 °C for 2 mins in 25
μL sterile water and spinning the sample at high speed for 2 mins. Twenty μL of the
Page 182
158
supernatant was stored at -20 °C prior to PCR analysis of plasmid replicons and antibiotic
resistance genes.
5.2.4. PCR amplifications of plasmid replicons and antibiotic resistance genes
DNA from transformed E. coli colonies and total environmental DNA from the 8
sites upstream and downstream of the WWTP were examined by PCR for presence of
plasmid associated genetic markers; plasmid replicons, class1 integrase gene cassettes,
and antibiotic resistance genes. DNA samples from the 8 sites were all standardized to 5
ng/μL concentration prior to PCR analysis. PCR reactions were carried out as follows; a
total of 25 μL reaction mix was prepared containing; 4 μL of template DNA (5 ng/μL),
2.5 μL of each primers (2 μM), 2,5 μL of MgSO4 (20 mM), 2.5 μL of 10X reaction
buffer, 0.2 μL of Taq DNA polymerase (5U/ μL) and 10.8 μL of de-ionized sterile water.
The PCR conditions; 94 °C for 5 minutes initial denaturing, followed by 30 cycles [of
denaturing at 94 °C; annealing at 58 °C for 30 seconds; extension at 72 °C for 2 minutes]
and final extension at 72 °C for 5 minutes. Several PCR products were excised from the
gel, cloned with pGEM®-T easy (Invitrogen) and DNA sequenced to confirm identity of
amplified target sequences.
5.2.5. Primer designs and descriptions
The primers designed and used for this study targeted the different sequence
regions within the plasmids’ replication genes, antibiotic resistance genes, class 1
integron and gene cassettes, and sequences unique to plasmids pEFC36a and pRWC72a
(Table 5.1, Figure 5.2 and 5.3). Plasmids pRWC72a and pEFC36a were isolated from
Page 183
159
WWTP influent and effluent respectively, both plasmids are characterized by unique
sequences associated with insertion of multiple resistance genes in highly conserved
incP-1β and incFII plasmid genetic backbones. Plasmid pEFC36a class 1 integron
element has two ARGs inserted between the 5’ conserved segment (5’CS) and the 3’
conserved segment (3’CS) and plasmid pRWC72a has no genes inserted due to the
disrupted class 1 integrase gene (refer to chapter 4). Primers 5’CS and 3’CS are
associated with the class 1 integron gene cassettes and bind in both plasmids resulting in
different sized amplicons. Primers PEF007T3 and PEF007T7 target the class 1 integrase
gene at the 5’ conserved segment and result in a 719 bp amplicon in plasmid pEFC36a
(Figure 5.2, B), the same primers do not amplify the integrase gene in plasmid pRWC72a
due to disruption and insertion of the macrolide resistance gene cluster B. PEF007T3 is a
forward primer flanking the ∆intI1 at position 17,847 and P72b-mphRB1 is a reverse
primer flanking the mphR(B) gene at position 19,165 in pRWC72a sequence, these
primer pair amplifies the unique sequence in pRWC72a consisting of the IS26 and IS4
(Figure 5.2, C). Figure 5.3 is a diagram of plasmid pEFC36a region with the Tn21
multiple resistance transposon described in the previous chapter (Chapter 4, Figure 4.18)
showing the regions in pEFC36a sequence missing the IS1 element that is common in
related plasmids. The primer pairs (PEF-bT3 and PEF-catA1, PEF-gT3 and PEF-gT7)
amplifies both regions with the missing IS1 element, which provides a unique sequence
to plasmid pEFC36a.
Page 184
160
Table 5.1: Primers used for amplification and detection of plasmid replicons, resistance
genes and plasmid specific sequences.
Name Target gene/
description
Sequence 5’3’ Location†
(plasmid)
Amplicon
size bp
Reference
P72-trfA1
P72-trfA2
incP1-β- trfA1/
Replication
GCGGCCGGTACTACACGA
GCGACAGCTTGCGGTACT
210-449
(pRWC72a)
239 This study
PEF-rep1
PEF-rep2
incFII- repA/
Replication
GGCTTCACCTCCCGTTTT
AACTGCGGAAACGCTCAC
937-1,441
(pEFC36a)
504 This study
repU1
repU2
incU- repA /
Replication
TGGCTTCATAGGCTTCACG
GAGAAGGCAAAAGGCGGAC
658 -1,210
(pTOR_01)
552 This study
oriV1
oriV2
incQ – oriV/
Replication
CTCCCGTACTAACTGTCACG
ATCGACCGAGACAGGCCC TGC
NA 436 (Krasowiak
et al. 2002)
rep 1
rep 2
incN-repA/
Replication
AGTTCACCACCTACTCGCTCCG
CAAGTTCTTCTGTTGGGATTCCG
NA 164 (Krasowiak
et al. 2002)
PEF-mrx1
PEF-mrx2
mrx(A)/ Macrolide A GCGTCGCTTTTCTCTGGA
ATGCCAAGGAGACCACCA
17,500-17,683
(pTOR_01)
183 This study
mphB1
mphB2
mph(B)/ Macrolide B CCT GGCACTTTGACCAGAAT
TGCTGACTTGTCATTCTGGC
20,396-20,629
(pRWC72a)
233 This study
P72b-tet1
P72b-tet2
tetA / Tetracycline CATACAGCGCCAGCAGAA
GGCATCGGCTGATTATG
56,479-56,978
(pRWC72a)
99 This study
blaTEM-F
blaTEM-R
blaTEM1β/
Beta-lactam
CTTTCACCAGCGTTTCTGG
ATACGGGAGGGCTTACCATC
80,144-80,838
(pEFC36a)
694 This study
PEF-cat 1
PEF-cat2
catA/
Chloramphenicol
CCATCACAAACGGCATAG
TGGCGTGTTACGGTGAAA
60,302-60,524
(pEFC36a)
222 This study
PEF-007T3*
PEF-007T7*
intI1/ Class 1 integron AATGGCCGAGCAGATCCT
AATGCCTCGACTTCGCTG
65,548-66,284
(pEFC36a)
719
This study
Int2-F2
Int2-R2
intI2/ Class 2 integron TTATTGCTGGGATTAGGC
ACGGCTACCCTCTGTTATC
NA 233 (Yaqoob et
al. 2011)
Page 185
161
Table 5.1 continued
Name Target gene/
description
Sequence 5’3’ Location†
(plasmid)
Amplicon
size bp
Reference
3‘CS*
5’CS*
GC/ Class 1 integron-
gene cassettes
TCAGGTCAAGTCTGCTT
GGCATCCAAGCAGCAAG
66,497-68,409
(pEFC36a)
Variable Levesque et
al. 1995
PEF-007T3*
P72b-mphRB1
‡ ∆intI1/mphR(B) AATGGCCGAGCAGATCCT
GCATCAAGGACGGTATTG
17,847-19,165
(pRWC72a)
1,318 This study
PEF-bT3
PEF-cat1
§ catA /CDS36 CGGTCGGAACATTTCGTA
TCATGCCGTTGTGATGG
58,903-60,524
(pEFC36a)
1,621 This study
PEF-gT3
PEF-gT7
§ merR/ pemI TGCACGAAAGGGGAATGT
ACAATCAGCCGGCCATTA
85,367-86,322
(pEFC36a)
955 This study
†, regions correspond to the plasmid sequence; §, The primers amplify a region specific
to pEFC36a sequence; ‡, The primers amplify a region unique to pRWC72a sequence;
*,Primers that bind in both pEFC36a and pRWC72a sequences (refer to Figure 5.2); GC,
gene cassette; NA, not applicable
Page 186
162
Figure 5.2: Diagram showing the primer binding sites at the different regions within the
sequences of plasmids (A) pTOR_01, (B) pEFC36a and (C) pRWC72a. Arrows above
the annotated sequences represent the location and direction of primers designed.
(*) represent the primers that bind in both pEFC36a and pRWC72a sequences
Page 187
163
Figure 5.3: Diagram showing the primer binding sites at the different regions within the
sequence of plasmid pEFC36a. Arrows above the annotated sequence represent the
location and direction of primers designed. NB: The primer pairs shown here amplify
unique regions within plasmid pEFC36a sequence missing the IS elements as described
in Chapter 4, Figure 4.18).
Page 188
164
5.2.6. Quantification of the class 1 integron and bacterial 16s rRNA genes
Quantitative real-time PCR (Bio-rad) was used to quantify the class 1 integrase
intI1, and universal 16s rRNA gene fragments in DNA samples from the 8 previously
described sites. The amplified gene fragments of appropriate size (class 1 integrase and
16s rRNA) were cloned into pGEM®-T easy and used to prepare qPCR standards
ranging from 101
to 109 copies of cloned targets. The template DNA was standardized to
a same concentration of 5µg/ mL prior to absolute quantification of both target genes.
The qPCR reactions for class 1 integrase were run in triplicate samples in a 25 uL volume
containing the following; 4 μL DNA template (1 μL + 3 μL sterile H2O for the standards,
101 to 10
7 and 4 μL sterile H2O for the blank), 1 μL of primer pairs (10 μM), 0.5 μL of
probe (10 μM), 0.5 μL BSA, 12.5 uL of iQ supermix (Bio-rad) and 5.5 μL of sterile PCR
grade water. The qPCR reactions for the universal 16s rRNA were also performed in
triplicate as follows; 1 μL DNA template, 2 μL of primer pairs (10 μM), 1.25 μL of probe
(10 μM), 12.5 uL of iQ supermix (Bio-rad) and 6.25 μL of sterile PCR grade water. The
PCR conditions for quantification of the intI1 were as follows; initial denaturing for 10
mins at 95 °C and 45 cycles of denaturing at 95 °C for 30 s and annealing at 60°C for 1
min. For 16s rRNA gene quantification of all bacteria the conditions were as follows;
initial denaturing for 15 mins at 95°C and 40 cycles of denaturing at 95°C for 15 s and
annealing at 60°C for 1.5 mins. Primers and probes used for qPCR analysis are shown in
Table 5.2.
Page 189
165
Table 5.2: Quantitative PCR primers and probes for quantification of class 1 integrase
and bacteria 16s rRNA genes
Primers/
probe
Sequence 5’3’ Target/
Description
Amplicon
size (bp)
Reference
intI1- LC1
intI1- LC5
intI1- probe
GCCTTGATGTTACCCGAGAG
GATCGGTCGAATGCGTGT
(6-FAM)-ATTCCTGGCCGTGG TTCTGGGTTTT-(BHQ1)
Class 1 integrase 196 (Barraud et
al. 2010)
1369F
1492R
TM1389F
CGGTGAATACGTTCYCGG
GGWTACCTTGTTACGACT
(FAM)-CTTGTACACACCGCC CGTC-(BHQ1)
16s rRNA gene 124 (Suzuki et al. 2000;
Czekalski
et al. 2012)
Page 190
166
5.3. Results
5.3.1. Analysis of the antibiotic resistant bacterial communities
The 16s rRNA-DGGE profile reveals a high diversity of unculturable and
culturable antibiotic resistant bacterial communities in the wastewater samples. There
appears to be more diversity in the effluent samples which shows more bands compared
to the influent, each sample reveal a different pattern and number of bands separated
during DGGE (Figure 5.4). The DGGE bands represented in the effluent samples selected
for tetracycline (EF 1) and erythromycin (EF 2) also show more diversity and dominance
compared to one with no antibiotic selection (EF 3). Considering the bright bands,
selected bands a1, b1 appear in both EF 1 and EF 2 samples, and may represent similar
dominant group of tetracycline and erythromycin resistant bacteria respectively, band d1
slightly lower than a1 and b1 represent an uncultured dominant bacterial group related to
a1 and b1. Bands a2 and b2 differ significantly to a1 and b1, based on their migration to
the bottom of the gel they represent a higher % GC content (compared to a1 and a2)
dominant and related antibiotic resistant bacterial groups in EF1 and EF2 samples.
Analysis of DGGE excised and sequenced bands provides information on the identities of
the bacteria from some of the dominant bands observed in the DGGE gel from the
effluent sample. These are characterized by the phyla Proteobacteria and Firmicutes. The
phylum Proteobacteria is represented by a large group of gram-negative bacteria, which
comprises the majority of clinically significant pathogens in the sub-group γ
Proteobacteria such as Escherichia, Shigella, and Serratia species, and the β
Proteobacteria such as Burkholderia, Janthinobacterium and Massilia species (Table
5.3).
Page 191
167
Figure 5.4: 16s rRNA PCR-DGGE profile of antibiotic resistance bacterial communities
in the primary influent (PI) and effluent (EF); (1) cultured LB + Tetracycline, (2) cultured
LB + Erythromycin, (3) cultured LB, (4) uncultured. The EF bands a1, b1, a2, b2 and d1
shown in the gel picture were excised and sequenced.
Page 192
168
Table 5.3: Analysis of DGGE excised and sequenced bands of the WWTP effluent (EF)
samples
Sample
name
Band
no.
Phylum/class Closest match in GenBank Database Score/Evalue; aa identity (%) Accession
number
EF1 a1 γ-Proteobacteria Uncultured gamma proteobacterium 366 bits (198)/ 3e-98; (99%) EU810923.1
a1 γ-Proteobacteria Uncultured Shigella species 359 bits (194)/ 5e-96; (99%) EU723863.1
a1 γ-Proteobacteria Uncultured Enterobacteriales bacterium 359 bits (194)/ 5e-96; (99%) HM076777.1
a1 γ-Proteobacteria Serratia marcescens 359 bits (194)/ 5e-96; (99%) AF076038.1
a1 γ-Proteobacteria Escherichia coli O157:H7 357 bits (193)/ 2e-95; (99%) NR_074891.1
a2 Firmicutes Firmicutes bacterium 357 bits (193)/ 2e-95; (99%) JQ308156.1
a2 Firmicutes Vagococcus species 357 bits (193)/ 2e-95; (99%) JX026031.1
a2 Firmicutes Enterococcus species 357 bits (193)/ 2e-95; (99%) GU90513.1
EF2 b1 γ-Proteobacteria Uncultured Enterobacteriales bacterium 370 bits (201)/ 6e-100; (100%) EU10916.1
b1 γ-Proteobacteria Shigella sonnei 370 bits (201)/ 4e-97; (100%) NR_074894.1
b1 γ-Proteobacteria Shigella dysenteriae 363 bits (196)/ 4e-97; (100%) NR_074892.1
b1 γ-Proteobacteria Shigella flexneri 363 bits (196)/ 4e-97; (100%) NR_074882.1
b1 γ-Proteobacteria Uncultured Escherichia species 364 bits (197/ 1e-97; (100%) JQ968624.1
b2 Firmicutes Uncultured Enterococcus species 357 bits (193/ 2e-95; (99%) AY080881.1
b2 Firmicutes Vagococcus salmoninarum 357 bits (193/ 2e-95; (99%) JQ991578.1
b2 Firmicutes Vagococcus fluvialis 357 bits (193/ 2e-95; (99%) EU660371.1
b2 Firmicutes Vagococcus fessus 357 bits (193)/ 2e-95; (99%) NR_025360.1
EF4 d1 β-Proteobacteria Burkholderiales bacterium 363 bits (193)/ 4e-97; (100%) JX491440.1
d1 β-Proteobacteria Uncultured Burkholderia sp 363 bits (196)/ 4e-97; (100%) HE575538.1
d1 β-Proteobacteria Janthinobacterium sp. 363 bits (193)/ 4e-97; (100%) JX515338.1
d1 β-Proteobacteria Massilia sp. 363 bits (193)/ 4e-97; (100%) JX949995.1
d1 β-Proteobacteria Oxalobacteraceae bacterium 363 bits (193)/ 4e-97; (100%) JQ033385.1
Page 193
169
The phylum firmicutes is represented by a group of gram-positive bacteria including
pathogens of medical importance such as Vagococcus and Enterococcus species.
5.3.2. Detection of plasmid replicons and resistance genes in the environment
PCR results reveal some positive amplification of the target sequences upstream
and downstream of the WWTP (Table 5.4 and 5.5). Primers targeting plasmid pEFC36a
unique sequence associated with merR and pemI genes amplified with appropriate
amplicon size in all samples except site A1 upstream of the city (Figure 5.5), primers
targeting another unique sequence of pEFC36a associated with catA and CDS36 genes
did not amplify. DNA sequencing of three PCR products of the amplified pEFC36a
merR/pemK unique region revealed 99% match in the Genbank database, and aligned
with plasmid pEFC36a and twenty-four other plasmids isolated from E.coli and
Salmonella species. Specific primers targeting plasmid pRWC72a associated sequences
did not amplify in any of the DNA samples analyzed. Plasmid replication and targeted
antibiotic resistance genes were detected in the different DNA samples, majority of
positive detections (amplification) were observed downstream of the WWTP compared to
the upstream site A1 which serves as a control site not-impacted by waste effluent.
Positive detections of ARGs were detected at site A2 upstream of the WWTP. However,
the targeted incP-1β and incFII replicons were not detected at both sites A1 and A2
upstream of the WWTP. Strong positive amplification (characterized by a brighter band)
is notable for the incP-1β and the class 1 integrase gene sequences at sites 1, 2 and 3
further downstream the WWTP (Figure 5.6). The site C and upstream site A2 show weak
Page 194
170
Table 5.4: Summary showing amplifications of target genes; integrons and antibiotic
resistance genes by PCR at different sites upstream and downstream the WWTP
Sample
Description Targeted genes/ sequences†
intI1 intI1
GC
intI2 mrx
(A)
mph
(B)
blaTEM catA tetA
SITE
A1*
Richardson ,
upstream city
- - - - - - - +
SITE
A2
Wascana Creek,
400m upstream
WWTP
+ - - + + + + +
SITE
B*
Wascana Creek,
100m
downstream
WWTP
+ + - + + + + +
SITE 1 Wascana Creek,
downstream
WWTP
+ + - + + + + +
SITE 2 Wascana Creek,
downstream
WWTP
+ + - + - + - +
SITE 3 Wascana Creek,
downstream
WWTP
+ + - + - + - +
SITE
C*
Qu’Appelle
river,
+ + - + - + - +
SITE 5 Qu’Appelle
river,,
downstream
WWTP
+ + - + - + - +
*; Control sites as described in the methods section, †; the target genes correspond to the
primer pairs described in table 2, intI1 GC; class 1 integron gene cassettes.
Page 195
171
Table 5.5: Summary showing amplifications of target genes; plasmid replicons and
specific sequences by PCR at different sites upstream and downstream the WWTP
Sample
Description Targeted replicons / sequences/†
trfA/
incP-1β
repA2/
incFII
repA/
incU
oriV/
incQ
repA/
incN
‡catA/
CDS36
‡merR/
pemI
§∆intI1/
mphR (B)
SITE
A1*
Richardson ,
upstream city
- - - - - - - -
SITE
A2
Wascana
Creek, 400m
upstream
WWTP
- - - - - - + -
SITE
B*
Wascana
Creek, 100m
downstream
WWTP
+ + + - - + + -
SITE 1 Wascana
Creek,
downstream
WWTP
+ + + - - - + -
SITE 2 Wascana
Creek,
downstream
WWTP
+ - - - - - + -
SITE 3 Wascana
Creek,
downstream
WWTP
+ - - - - - + -
SITE
C*
Qu’Appelle
river,
+ - - - - - + -
SITE 5 Qu’Appelle
river,,
downstream
WWTP
+ - - - - - + -
*; Control sites as described in the methods section, †; the target genes correspond to the
primer pairs described in table 2. ‡; pEFC36a plasmid-unique sequence, §; pRWC72a
plasmid-unique sequence.
Page 196
172
Figure 5.5: Gel electrophoresis picture showing positive amplification of the merR/pemK
region associated with pEFC36a plasmid sequence. (* shows control sites A1, site B and
site C as described in the method section)
Page 197
173
Figure 5.6: Gel electrophoresis picture showing strong positive amplification of the
incP1-β (top) and class 1 integrase (bottom) genes at sites 2 and 3 downstream the
WWTP. DNA concentrations of all samples were standardized to a same concentration
(5ng/μL) before PCR amplification. (* shows control sites A1, site B and site C as
described in the method section).
(b)
(a)
Page 198
174
amplification (characterized by a dull band in comparison to the positive control) of some
of the targeted sequences. Strong positive amplifications were observed in DNA samples
from Site B that is immediately downstream of the WWTP and considered a site under
substantial influence of wastewater effluent. Captured erythromycin resistant plasmids in
E. coli competent cells from site 1 downstream reveal (23/32) 71.9% and (32/32) 100%
occurrence of incP-1β plasmid replication gene and class 1 integrase gene respectively in
a total of 32 selected transformants. Site A2 upstream revealed only (5/32) 15.6% and
(29/32) 90.6% occurrence of the incP-1β and integrase gene respectively. Replicons for
incFII and incU plasmids were detected at (11/32) 34.4% and (4/32) 12.5% respectively
only at site 1 downstream and not at site A2 upstream (Figure 5.7). Some of the E.coli
transformants may have captured more than one type of plasmid which was shown by the
detection of different replicons in the same transformant. Other targeted genes for incQ,
incN plasmids and class 2 integrons were not detected in all DNA analyzed by PCR.
PCR amplification of the class 1 integron gene cassettes reveals variable bands
representing the putative resistance genes inserted in the gene cassettes. Figure 5.8
highlights the same sized bands from the influent and effluent samples, these bands also
appear to persist in the downstream sample sites B, 1, 2 and 3. DNA sequencing of the
bands reveals a 896 bp sequence showing 99% identity to integron gene cassette
sequences from an uncultured bacterium (accession number FJ820158) and an
Aeromonas species (accession numbers DQ465220, AF327731) in Genbank respectively.
The sequence contain 2 open reading frames for the qacE2 gene which codes for an
efflux protein associated with resistance to the quaternary ammonium compounds and a
hypothetical gene of unknown function.
Page 199
175
Figure 5.7: The Occurrence of plasmids incP-1β, incFII, incU and the class 1 integron
genes upstream and downstream in transformed E. coli competent cells selected for
erythromycin resistance.
Page 200
176
Figure 5.8: Gel electrophoresis showing amplification of the class 1 integron gene
cassettes from various sites upstream, downstream and WWTP influent and effluent.
DNA concentrations of all samples were standardized to a same concentration (5ng/μL)
before PCR amplification. The bands highlighted in the picture were excised from the gel
and sequenced (* shows control sites A1, site B and site C as described in the method
section)
Page 201
177
5.3.3. Quantification of the class 1 integrase in the environment
The quantitative PCR results show a difference in the class 1 integrase gene copy
numbers in environmental DNA samples isolated from the upstream sites A1, A2 (and
control site C) and downstream sites (B, 1, 2, 3, 5) by at least 2 orders of magnitude
(Figure 5.9). Upstream sites show low copy numbers compared to downstream sites,
considering the 95% confidence interval overlap and two-sample T-Test analysis, the
results show a significant difference between the means of class 1 integrase gene copies
upstream and downstream (P < 0.05). There was no significant difference in the means of
16s rRNA gene copies. Comparison between the absolute numbers of the quantified
bacterial 16s rRNA and the class 1 integrase genes shows the increasing trend in the class
1 integrase copy numbers from site A1 to site 5 while the bacterial 16sRNA gene copy
number appear to be constant across all the sites (Figure 5.10). The relative abundance of
the class 1 integrase genes per bacterial 16s rRNA genes was determined. The results are
consistent with the previous, showing an increase in the class 1 integrase gene across the
sampling sites (Figure 5.11). Site B, located immediately downstream of the WWTP
shows the highest relative abundance. There is a decline in the integrase copy numbers at
site 5, which is located further downstream from the WWTP. These observations may
suggest that the WWTP contribute to increased levels of the class 1 integron in the
downstream environment.
Page 202
178
Figure 5.9: Average absolute quantification of 16s rRNA and class 1-integrase genes
upstream (site A1, A2 and C) and downstream (site B, 1,2,3 and 5) of the WWTP. The
DNA concentrations of all samples were standardized to a same concentration (5 ng/μL)
before absolute quantification. Box and whiskers plots generated using statistix-version 9
analysis software, with 95% confidence interval.
Page 203
179
Figure 5.10: Absolute quantification of the bacterial 16s rRNA and the class 1-integrase
genes at different sites upstream and downstream of the WWTP. Box plots generated
using statistix-version 9 analysis software, with 95% confidence interval from results of
the 3 experimental replicates.
Page 204
180
Figure 5.11: Relative abundance of the class 1 integrase gene at different sites upstream
and downstream of the WWTP. Target numbers of the class 1 integrase gene were
divided by 16s rRNA numbers and results log transformed to adjust the differences in
bacterial DNA and amplification efficiency. The connecting lines between the data points
means the sampling sites are arranged in that order as represented in the map in Figure
5.1. Graphs generated using statistix-version 9 analysis software, error bars generated
with 95% confidence interval from results of the 3 experimental replicates.
Page 205
181
5.4. Discussion
The phyla Proteobacteria are frequently reported among the dominant
populations in wastewater effluent (Liu et al. 2007; Hesham et al. 2011), the analysis of
DGGE excised bands is consistent with these previous studies of bacterial community
profiling in WWTPs. The DGGE results may suggest population enrichment or
proliferation of the proteobacteria populations during the treatment process as shown by
more bright bands in the effluent compared to the influent sample analysis. The antibiotic
resistant bacterial communities leaving the WWTP through the effluent is quite diverse as
indicated by the DGGE profile, this diversity is important to note as it may increase
chances of horizontal gene transfer among related bacteria found in the downstream
environment. DGGE approach was successful in documenting the diversity between
dominant bacterial communities that grew in the presence of antibiotics and those
growing without antibiotic selection. New approaches, such as deep sequencing of the
16s rRNA using next generation DNA sequencing could provide more insights of the
diversity of microbial communities leaving the WWTP.
This study has also shown the presence and abundance of ARGs downstream of
the WWTP in comparison to upstream sites. Detections of ARGs at site A2 upstream of
the WWTP may suggest other possible sources of ARGs downstream of the city, which
may be linked to other anthropogenic activities that result in pollution of the water into
the Wascana Creek. ARGs detected at site A1 upstream of the city may be associated
with bacteria in the natural environment e.g. antibiotic producers, but were infrequently
detected compared to downstream environments, which are characterized by high-level
detection of ARGs, may suggest the influence of the WWTP effluent. Quantitative PCR
Page 206
182
results provided the basis for comparison between upstream and downstream sites, high
copy numbers of resistance determinants in relation to total bacteria were expected in the
environments downstream of the WWTP compared to upstream environments. Moving
further downstream of the WWTP into the Qu’Appelle River, the levels of ARGs seem to
decline, site C upstream in the Qu’Appelle River is not impacted by the sewage flow
from the WWTP and has shown relatively low levels of the class 1 integrase gene
compared to the sites downstream of the WWTP. The level of detection of plasmid
resistance determinants and quantification of the class 1 integron upstream and
downstream of the WWTP suggest that resistance genes are accumulating in the
downstream environment because of the release of the sewage effluent in to the Wascana
creek.
Isolation of functional plasmids such as pEFC36a in the effluent support evidence
that multiple resistance plasmids are not eliminated during the wastewater treatment
process and may pose a threat if they can be transferred to opportunistic pathogens
outside the WWTP. Several studies have also isolated different plasmids from bacterial
populations in the effluent wastewater (Rhodes et al. 2004; Tennstedt et al. 2005;
Szczepanowski et al. 2009). The incFII replication genes were only detected in
erythromycin resistance plasmids trapped using E. coli competent cells from the
downstream water sample. The incFII plasmids have been reported to transfer and
replicate only within the enterobacteriaceae family which consist of many clinically
relevant gram-negative pathogens (Carattoli 2009; 2011). IncP-1β plasmid replication
gene was detected at all sites downstream of the WWTP, and the results from the
captured plasmids in E. coli further showed high occurrence of these replicons compared
Page 207
183
to other plasmids including incU and incFII. The incP-1β plasmids such as pRWC72a are
known to be promiscuous and can transfer at high frequency and replicate in broad range
of bacteria. Other studies have also shown the prevalence of broad host range multiple
resistance plasmids (the incP group in particular) in the wastewater and receiving streams
(Moura et al. 2010). The PCR detections of the incP-1β replicon downstream further
support research findings that broad host range plasmids are able to persist in bacterial
communities in the environment. These plasmids can help disseminate the multiple and
clinically relevant resistance genes including the class 1 integron genes, which have also
been shown to persist downstream in the environment (Picao et al. 2008; Gillings et al.
2009; Pignato et al. 2009). Plasmid pEFC36a and pRWC72a may have been present at
undetectable levels since the specific primers targeting unique DNA regions did not
amplify in the DNA samples. In addition, the WWTP environment contributes to the
diversity and mosaics of plasmids with assorted accessory genes which make it difficult
to detect any singular specific plasmid overtime. Nevertheless, the detection and
capturing of closely related and plasmids bearing similar replication gene suggests the
presence and possible persistence of related plasmids coming out of the WWTP into the
environment. Primers that amplify the merR and pemI genes may only suggest the
presence of plasmids with a sequence partially similar to pEFC36a, but not exactly
identical. This plasmid sequence was detectable at all sites except site A1 upstream of the
city, and may suggest possible persistence in the environment. In addition, the WWTPs
seem to be favoring particular bacterial populations that carry certain type of plasmids
belonging to the same family. These plasmid families, such as the incP are very important
Page 208
184
in the dissemination of antibiotic resistance since they are often associated with multiple
resistance genes and are frequently released with the effluent.
Increased levels of bacteria carrying multiple resistance plasmids downstream of
the WWTP results in contamination of surface waters. High levels of these multiple
resistant bacteria may also accumulate in lakes and sediments, making these
environments potential reservoirs with increased risks for further dissemination of
resistance determinants to other bacteria in downstream environments (Czekalski et al.
2012). The persistence and dissemination of these multiple resistant bacteria in the
environment to pathogenic bacteria is becoming increasingly evident. Soil bacteria in
particular represent an important reservoir for gene exchange and transfer to pathogenic
bacteria. A recent study has provided evidence of horizontal gene transfer of ARGs
between environmental bacteria and clinical bacteria (Forsberg et al. 2012). Our study
supports this evidence based on functional mobility and stability of the plasmids in
bacteria (refer to chapter 4), as well as the detection of broad host range incP-1β
plasmids, class 1 integrons and clinically relevant ARGs in the environment downstream
of the WWTP.
Clinically relevant antibiotics have also been detected in the environment
downstream of the WWTPs including the Wascana Creek downstream the Regina
wastewater treatment plant (Waiser et al. 2011). The persistence of antibiotic residues
even at low concentrations have been shown to promote plasmid maintenance and
horizontal mobility of plasmids among different bacterial populations in the environment
(Knapp et al. 2008; Storteboom et al. 2010). In conclusion, our study has provided some
Page 209
185
insights on the release of ARG and plasmids from the WWTP to further downstream
environments.
5.5. Literature cited
Allen, H.K., Donato, J., Wang, H.H., Cloud-Hansen, K.A., Davies, J. and Handelsman, J.
(2010) Call of the wild: Antibiotic resistance genes in natural environments.
Nature Reviews Microbiology 8, 251-259.
Ansari, M.I., Grohmann, E. and Malik, A. (2008) Conjugative plasmids in multi-resistant
bacterial isolates from Indian soil. Journal of Applied Microbiology 104, 1774-
1781.
Bahl, M.I., Burmolle, M., Meisner, A., Hansen, L.H. and Sorensen, S.J. (2009) All IncP-
1 plasmid subgroups, including the novel epsilon subgroup, are prevalent in the
influent of a Danish wastewater treatment plant. Plasmid 62, 134-139.
Baquero, F., Martinez, J.L. and Canton, R. (2008) Antibiotics and antibiotic resistance in
water environments. Current Opinion in Biotechnology 19, 260-265.
Barraud, O., Baclet, M.C., Denis, F. and Ploy, M.C. (2010) Quantitative multiplex real-
time PCR for detecting class 1, 2 and 3 integrons. Journal of Antimicrobial
Chemotherapy 65, 1642-1645.
Binh, C.T.T., Heuer, H., Kaupenjohann, M. and Smalla, K. (2008) Piggery manure used
for soil fertilization is a reservoir for transferable antibiotic resistance plasmids.
FEMS Microbiology Ecology 66, 25-37.
Bonemann, G., Stiens, M., Puhler, A. and Schluter, A. (2006) Mobilizable IncQ-related
plasmid carrying a new quinolone resistance gene, qnrS2, isolated from the
Page 210
186
bacterial community of a wastewater treatment plant. Antimicrobial Agents and
Chemotherapy 50, 3075-3080.
Chee-Sanford, J.C., Mackie, R.I., Koike, S., Krapac, I.G., Lin, Y.F., Yannarell, A.C.,
Maxwell, S. and Aminov, R.I. (2009) Fate and transport of antibiotic residues and
antibiotic resistance genes following land application of manure waste. Journal of
Environmental Quality 38, 1086-1108.
Czekalski, N., Berthold, T., Caucci, S., Egli, A. and Burgmann, H. (2012) Increased
levels of multiresistant bacteria and resistance genes after wastewater treatment
and their dissemination into Lake Geneva, Switzerland. Frontiers in Microbiology
3, 106-106.
D'Costa, V.M., McGrann, K.M., Hughes, D.W. and Wright, G.D. (2006) Sampling the
antibiotic resistome. Science 311, 374-377.
Forsberg, K.J., Reyes, A., Wang, B., Selleck, E.M., Sommer, M.O.A. and Dantas, G.
(2012) The shared antibiotic resistome of soil bacteria and human pathogens.
Science 337, 1107-1111.
Gillings, M.R., Holley, M.P. and Stokes, H.W. (2009) Evidence for dynamic exchange of
qac gene cassettes between class 1 integrons and other integrons in freshwater
biofilms. FEMS Microbiology Letters 296, 282-288.
Fremaux, B., Boa, T., Chaykowski, A., Kasichayanula, S., Gritzfeld, J., Braul, L., Yost,
C.K. (2009a) Assessment of the microbial quality of irrigation water in a prairie
watershed. Journal of Applied Microbiology 106, 442-454.
Page 211
187
Fremaux, B., Gritzfeld, J., Boa, T., Yost, C.K., (2009b). Evaluation of host-specific
Bacteroidales 16S rRNA gene markers as a complementary tool for detecting
fecal pollution in a prairie watershed. Water Research 43, 4838-4849.
Heuer, H., Szczepanowski, R., Schneiker, S., Puhler, A., Top, E.M. and Schluter, A.
(2004) The complete sequences of plasmids pB2 and pB3 provide evidence for a
recent ancestor of the IncP-1 beta group without any accessory genes.
Microbiology-Sgm 150, 3591-3599.
Knapp, C.W., Engemann, C.A., Hanson, M.L., Keen, P.L., Hall, K.J. and Graham, D.W.
(2008) Indirect evidence of transposon-mediated selection of antibiotic resistance
genes in aquatic systems at low-level oxytetracycline exposures. Environmental
Science and Technology 42, 5348-5353.
Krasowiak, R., Smalla, K., Sokolov, S., Kosheleva, I., Sevastyanovich, Y., Titok, M. and
Thomas, C.M. (2002) PCR primers for detection and characterisation of IncP-9
plasmids. FEMS Microbiology Ecology 42, 217-225.
Layton, A., McKay, L., Williams, D., Garrett, V., Gentry, R. and Sayler, G. (2006)
Development of Bacteroides 16S rRNA gene TaqMan-based real-time PCR
assays for estimation of total, human, and bovine fecal pollution in water. Applied
and Environmental Microbiology 72.
Levesque C, Piche L, Larose C, Roy PH (1995) PCR mapping of integrons reveals
several novel combinations of resistance genes. Antimicrobial Agents and
Chemotherapy 39. 185-191
Malik, A., Celik, E.K., Bohn, C., Bockelmann, U., Knobel, K. and Grohmann, E. (2008)
Detection of conjugative plasmids and antibiotic resistance genes in
Page 212
188
anthropogenic soils from Germany and India. FEMS Microbiology Letters 279,
207-216.
Martinez, J.L. (2009a) Environmental pollution by antibiotics and by antibiotic resistance
determinants. Environmental Pollution 157, 2893-2902.
Martinez, J.L. (2009b) The role of natural environments in the evolution of resistance
traits in pathogenic bacteria. Proceedings of the Royal Society B-Biological
Sciences 276, 2521-2530.
Moura, A., Henriques, I., Smalla, K. and Correia, A. (2010) Wastewater bacterial
communities bring together broad-host range plasmids, integrons and a wide
diversity of uncharacterized gene cassettes. Research in Microbiology 161, 58-66.
Muyzer, G., Dewaal, E.C. and Uitterlinden, A.G. (1993) Profiling of complex microbial
populations by denaturing gradient gel-electrophoresis analysis of polymerase
chain reaction amplified genes coding for 16s ribosomal RNA. Applied and
Environmental Microbiology 59, 695-700.
Picao, R.C., Poirel, L., Demarta, A., Ferreira Silva, C.S., Rita Corvaglia, A., Petrini, O.
and Nordmann, P. (2008) Plasmid-mediated quinolone resistance in Aeromonas
allosaccharophila recovered from a Swiss lake. Journal of Antimicrobial
Chemotherapy 62, 948-950.
Pignato, S., Coniglio, M.A., Faro, G., Weill, F.X. and Giammanco, G. (2009) Plasmid-
mediated multiple antibiotic resistance of Escherichia coli in crude and treated
wastewater used in agriculture. Journal of Water and Health 7, 251-258.
Page 213
189
Pruden, A., Pei, R., Storteboom, H. and Carlson, K.H. (2006) Antibiotic resistance genes
as emerging contaminants: Studies in northern Colorado. Environmental Science
and Technology 40, 7445-7450.
Schluter, A., Szczepanowski, R., Puhler, A. and Top, E.M. (2007a) Genomics of IncP-1
antibiotic resistance plasmids isolated from wastewater treatment plants provides
evidence for a widely accessible drug resistance gene pool. FEMS Microbiology
Reviews 31, 449-477.
Schluter, A., Szuepanowski, R., Kurz, N., Schneiker, S., Krahn, I. and Puhler, A. (2007b)
Erythromycin resistance-conferring plasmid pRSB105, isolated from a sewage
treatment plant, harbors a new macrolide resistance determinant, an integron-
containing Tn402-like element, and a large region of unknown function. Applied
and Environmental Microbiology 73, 1952-1960.
Solaiman, Z. and Marschner, R. (2007) DGGE and RISA protocols for microbial
community analysis in soil. Soil Biology, 167-180.
Sorensen, S.J., Bailey, M., Hansen, L.H., Kroer, N. and Wuertz, S. (2005) Studying
plasmid horizontal transfer in situ: A critical review. Nature Reviews
Microbiology 3, 700-710.
Storteboom, H., Arabi, M., Davis, J.G., Crimi, B. and Pruden, A. (2010) Identification of
Antibiotic resistance gene molecular signatures suitable as tracers of pristine
river, urban, and agricultural sources. Environmental Science and Technology 44,
1947-1953.
Page 214
190
Suzuki, M.T., Taylor, L.T. and DeLong, E.F. (2000) Quantitative analysis of small
subunit rRNA genes in mixed microbial populations via 5 '-nuclease assays.
Applied and Environmental Microbiology 66. 4605-4614.
Szczepanowski, R., Braun, S., Riedel, V., Schneiker, S., Krahn, I., Puhler, A. and
Schluter, A. (2005) The 120 592 bp IncF plasmid pRSB107 isolated from a
sewage treatment plant encodes nine different antibiotic-resistance determinants,
two iron-acquisition systems and other putative virulence-associated functions.
Microbiology-Sgm 151, 1095-1111.
Szczepanowski, R., Krahn, I., Bohn, N., Puhler, A. and Schluter, A. (2007) Novel
macrolide resistance module carried by the IncP-1 beta resistance plasmid
pRSB111, isolated from a wastewater treatment plant. Antimicrobial Agents and
Chemotherapy 51, 673-678.
Szczepanowski, R., Linke, B., Krahn, I., Gartemann, K.H., Gutzkow, T., Eichler, W.,
Puhler, A. and Schluter, A. (2009) Detection of 140 clinically relevant antibiotic-
resistance genes in the plasmid metagenome of wastewater treatment plant
bacteria showing reduced susceptibility to selected antibiotics. Microbiology-Sgm
155, 2306-2319.
Tambalo, D.D., Fremaux, B., Boa, T. and Yost, C.K. (2012) Persistence of host-
associated Bacteroidales gene markers and their quantitative detection in an urban
and agricultural mixed prairie watershed. Water Research 46, 2891-2904.
Tauch, A., Schluter, A., Bischoff, N., Goesmann, A., Meyer, F. and Puhler, A. (2003)
The 79,370-bp conjugative plasmid pB4 consists of an IncP-1 beta backbone
loaded with a chromate resistance transposon, the strA-strB streptomycin
Page 215
191
resistance gene pair, the oxacillinase gene bla(NPS-1), and a tripartite antibiotic
efflux system of the resistance nodulation-division family. Molecular Genetics
and Genomics 268, 570-584.
Tennstedt, T., Szczepanowski, R., Krahn, I., Puhler, A. and Schluter, A. (2005) Sequence
of the 68,869 bp IncP-1 alpha plasmid pTB11 from a wastewater treatment plant
reveals a highly conserved backbone, a Tn402-like integron and other
transposable elements. Plasmid 53, 218-238.
Waiser, M.J., Humphries, D., Tumber, V. and Holm, J. (2011) Effluent-dominated
streams. Part 2: Presence and possible effects of pharmaceuticals and personal
care products in Wascana Creek, Saskatchewan, Canada. Environmental
Toxicology and Chemistry 30, 508-519.
Weisburg, W.G., Barns, S.M., Pelletier, D.A. and Lane, D.J. (1991) 16s ribosomal DNA
amplification for phylogenetic study. Journal of Bacteriology 173, 697-703.
Wright, G.D. (2007) The antibiotic resistome: the nexus of chemical and genetic
diversity. Nature Reviews Microbiology 5, 175-186.
Yaqoob, M., Wang, L., Fang, T. and Lu, C.-P. (2011) Occurrence and transmission of
class 1 and 2 integrons among phenotypic highly ampicillin-resistant avian
Escherichia coli isolates from Pakistan. World Journal of Microbiology and
Biotechnology 27, 2041-2050.
Zhang, D., Chen, Y.G., Zhao, Y.X. and Zhu, X.Y. (2010) New sludge pretreatment
method to improve methane production in waste activated sludge digestion.
Environmental Science and Technology 44, 4802-4808.
Page 216
192
Zhang, X.X., Zhang, T. and Fang, H. (2009) Antibiotic resistance genes in water
environment. Applied Microbiology and Biotechnology 82, 397-414.
Page 217
193
CHAPTER 6- GENERAL SUMMARY
6.1. General conclusion
Dissemination of antibiotic resistant bacteria and plasmids encoding antibiotic
resistance genes into the environment may impact human health by contributing to the
decrease of effective use of antibiotic therapy in the future. This work has demonstrated
the possible spread of community acquired methicillin resistant Staphylococcus aureus
(CA-MRSA) through computer keyboards in schools and/public places. The distantly
related CA-MRSA strains were isolated from high schools and university computer
keyboards. The CA-MRSA isolate Lum1 (from a high school) is one of the two
predominant strains associated with outbreaks in community environments, and has been
reported in Saskatchewan. UR-1 (from university library) did not match any MRSA
isolates known in Saskatchewan region based on PFGE fingerprinting, this distinction
further demonstrates the extent of dissemination of common strains as well as new strains
with unknown origins. High risk of transmission of CA-MRSA and other pathogenic
resistant bacteria through computer keyboards may still exist at learning institutions due
to high frequency usage of computers, both high school and university students remain
risk groups in the acquisition of MRSA. Fomites play an important role in the survival
and transmission of pathogenic bacteria, a recent study has in fact demonstrated the
transmissibility of CA-MRSA through non-porous fomites and implications in the CA-
MRSA outbreaks (Desai et al. 2011). Incidence and prevalence of community acquired
infections today may suggest efforts in the control and prevention strategies not
improving given the knowledge and awareness of potential reservoirs.
Page 218
194
This work has also attempted to answer the questions on diversity, persistence and
dissemination of antibiotic resistance plasmids through DNA sequencing, conjugation
and stability experiments. Sequencing of five plasmids recovered from swine manure and
WWTP has provided insights about the evolution of antibiotic resistance plasmids in
different non-clinical environments. Comparative analysis of plasmid pMC2 from swine
manure has shown that the plasmid may have acquired the macrolide resistance gene due
to the use of macrolide class of antibiotics in pig husbandry, mercury and chromium
resistance genes were also acquired at the same time through insertion of a large mobile
element carrying multiple resistance genes. Analysis of four plasmids (pTOR_01,
pTOR_02, pEFC36a and pRWC72a) from the WWTP further showed plasmid
diversification by recombination of mobile elements in various plasmid genetic
backbones. Functional analysis of the stability and conjugative transfer modules carried
by these plasmids provided insights on their possible persistence in bacterial hosts in soil
environments. The study of the movement of resistance plasmids into the downstream
environment merits continued sustained investigation, given the detrimental potential of
multiple antibiotic resistance plasmids being acquired by opportunistic human pathogens.
Perhaps recognizing ARPs as emerging pollutants will lead to more research and further
understanding of the role of WWTPs in the evolution of antibiotic resistance plasmids
and the dissemination of plasmid-borne ARGs in the environment and ultimately into
human pathogens.
Currently, the significance of antibiotic resistance plasmids entering the
environment is not clear, in part, due to a paucity of monitoring data. There is a need for
greater assessment of antibiotic resistance plasmid diversity and persistence in the
Page 219
195
environment following their introduction by anthropogenic activities such as release of
wastewater effluent, or application of activated sludges and manure as fertilizer. The
current molecular advancements in detection of nucleic acids in the environment will
greatly facilitate future studies. Metagenomics (or environmental genomics) has emerged
as a powerful tool available for environmental microbiology research. Total community
DNA (or metagenome) is extracted directly from various environmental samples such as
soil and water thereby bypassing the need for culture techniques (Handelsman 2004;
Riesenfeld et al. 2004). Plasmids can readily be isolated directly from environmental
samples, plasmid metagenomes have been recently characterized from wastewater
environments (Schluter et al. 2008; Szczepanowski et al. 2008; Szczepanowski et al.
2009). High throughput DNA sequencing technologies, such as 454 sequencing (Jones
2010) make it possible to obtain the whole genome sequence data of environmentally
isolated plasmids in a short time, and at a reasonable cost. Complete sequencing of
plasmids provide useful information of the plasmid-backbone sequences encoding for
various genes e.g. plasmid core genes such as those involved in plasmid replication,
conjugative transfer, and unique genes and accessory genes for resistance to antibiotics
(Binh et al. 2008). This sequence data is made easily accessible in GenBank database
(http://www.ncbi.nlm.nih.gov/) allowing classification and comparisons with other
isolated plasmids from various sources using various bioinformatics tools.
Considering our knowledge to the problems ARPs may pose to the public health
when released into the environment through manure application and WWTP effluent
discharge, Technologies have been developed to improve the WWTP infrastructure and
new methods adopted for the better management of livestock waste. Investigations should
Page 220
196
continue to determine the efficacy of these new technologies or methods in reducing the
amount of ARB and ARPs before being released into downstream environments.
6.2. Future directions
The studies of persistence and transfer of ARPs in situ are still inadequate, direct
in situ studies of the dissemination of antibiotic resistance are under-appreciated. More
studies on HGT of plasmids during residence in WWTPs and after leaving the WWTP
could provide new insights into the evolution of these plasmids and their spread in new
environments. Sorensen et al. (2005) have provided a critical review for studying plasmid
HGT in situ, and this could be applied to research on antibiotic resistance plasmids
entering the environment. Using advanced molecular and environmental microbiology
methods and tools will help to address these questions concerning the fate and
distribution of antibiotic resistance plasmids originating from the swine manure and
WWTP entering the environment.
Use of in-situ molecular detection methods may be useful in future studies to
understand the spread of ARPs among bacterial communities in WWTPs. Fluorescence in
situ hybridization (FISH) is a common technique originally developed in pathology for
clinical diagnosis (Levsky and Singer, 2003). This approach applies the principle of
hybridization involving the penetration of a fluorescent-labeled sequence-specific nucleic
acid probe into fixed cells, followed by specific binding to the complementary sequences
of the target nucleic acid. It allows rapid simultaneous detection and visualization of
target genes while they are structurally intact with the associated organism or particle
(Bottari et al. 2006; Ormeci and Linden 2008). FISH may become a more accurate and
Page 221
197
sensitive approach in predicting the populations carrying specific antibiotic resistance
plasmids in contaminated environments. This method could become useful in
environmental microbiology despite the technical challenges associated with processing
environmental samples for FISH. According to Ormeci and Linden (2008), wastewater
associated samples present challenges such as high background fluorescence caused by
organic and inorganic particles. However, FISH has been used in the detection of ARGs
in bacterial pathogens (Russmann et al. 2001; Werner et al. 2007; Laflamme et al. 2009).
With reference to wastewater environments, FISH has been applied to detect and analyze
bacterial communities in activated sludge and biofilm systems (Wagner and Loy 2002;
Aktan and Salih 2006). The future usage of FISH in environmental microbiology is yet to
be appreciated. There have also been improvements in overcoming technical limitations
due to complex environmental matrices (Ormeci and Linden 2008; Zhang et al. 2009),
FISH could be a preferred method, particularly in monitoring the dissemination of
antibiotic resistance plasmids from WWTPs. Furthermore, new innovative approaches
inspired by current technology such as high-throughput DNA microarray (another DNA
hybridization technique) are being developed specifically for the detection of ARB and
plasmid mediated ARGs in clinical and environmental isolates (Frye et al. 2006; Chee-
Sanford et al. 2009; Walsh et al. 2010), this could greatly facilitate future monitoring
studies. These advances in molecular-based genomics and in situ methods could lead to
development of standard tracking tools for assessing the spread of antibiotic resistance
plasmids from WWTPs and other complex environmental samples.
Page 222
198
6.4. Literature cited
Aktan, S. and Salih, B.A. (2006) Fluorescent in situ hybridization (FISH) for the
detection of bacterial community in activated sludge from textile factories.
Environmental Technology 27, 63-69.
Binh, C.T.T., Heuer, H., Kaupenjohann, M. and Smalla, K. (2008) Piggery manure used
for soil fertilization is a reservoir for transferable antibiotic resistance plasmids.
FEMS Microbiology Ecology 66, 25-37.
Bottari, B., Ercolini, D., Gatti, M. and Neviani, E. (2006) Application of FISH
technology for microbiological analysis: Current state and prospects. Applied
Microbiology and Biotechnology 73, 485-494.
Chee-Sanford, J.C., Mackie, R.I., Koike, S., Krapac, I.G., Lin, Y.F., Yannarell, A.C.,
Maxwell, S. and Aminov, R.I. (2009) Fate and transport of antibiotic residues and
antibiotic resistance genes following land application of manure waste. Journal of
Environmental Quality 38, 1086-1108.
Desai, R., Pannaraj, P.S., Agopian, J., Sugar, C.A., Liu, G.Y. and Miller, L.G. (2011)
Survival and transmission of community-associated methicillin-resistant
Staphylococcus aureus from fomites. American Journal of Infection Control 39,
219-225.
Frye, J.G., Jesse, T., Long, F., Rondeau, G., Porwollik, S., McClelland, M., Jackson,
C.R., Englen, M. and Fedorka-Cray, P.J. (2006) DNA microarray detection of
antimicrobial resistance genes in diverse bacteria. International Journal of
Antimicrobial Agents 27, 138-151.
Page 223
199
Handelsman, J. (2004) Metagenomics: Application of genomics to uncultured
microorganisms. Microbiology and Molecular Biology Reviews 68, 669-685.
Jones, W.J. (2010) High-throughput sequencing and metagenomics. Estuaries and Coasts
33, 944-952.
Laflamme, C., Gendron, L., Turgeon, N., Filion, G., Ho, J. and Duchaine, C. (2009) In
situ detection of antibiotic resistance elements in single Bacillus cereus spores.
Systematic and Applied Microbiology 32, 323-333.
Ormeci, B. and Linden, K.G. (2008) Development of a fluorescence in situ hybridization
protocol for the identification of microorganisms associated with wastewater
particles and flocs. Journal of Environmental Science and Health Part A-
Toxic/Hazardous Substances and Environmental Engineering 43, 1484-1488.
Riesenfeld, C.S., Goodman, R.M. and Handelsman, J. (2004) Uncultured soil bacteria are
a reservoir of new antibiotic resistance genes. Environmental Microbiology 6,
981-989.
Russmann, H., Adler, K., Haas, R., Gebert, B., Koletzko, S. and Heesemann, J. (2001)
Rapid and accurate determination of genotypic clarithromycin resistance in
cultured Helicobacter pylori by fluorescent in situ hybridization. Journal of
Clinical Microbiology 39, 4142-4144.
Schluter, A., Krause, L., Szczepanowski, R., Goesmann, A. and Puhler, A. (2008)
Genetic diversity and composition of a plasmid metagenome from a wastewater
treatment plant. Journal of Biotechnology 136, 65-76.
Szczepanowski, R., Bekel, T., Goesmann, A., Krause, L., Kromeke, H., Kaiser, O.,
Eichler, W., Puhler, A. and Schluter, A. (2008) Insight into the plasmid
Page 224
200
metagenome of wastewater treatment plant bacteria showing reduced
susceptibility to antimicrobial drugs analysed by the 454-pyrosequencing
technology. Journal of Biotechnology 136, 54-64.
Szczepanowski, R., Linke, B., Krahn, I., Gartemann, K.H., Gutzkow, T., Eichler, W.,
Puhler, A. and Schluter, A. (2009) Detection of 140 clinically relevant antibiotic-
resistance genes in the plasmid metagenome of wastewater treatment plant
bacteria showing reduced susceptibility to selected antibiotics. Microbiology-Sgm
155, 2306-231
Wagner, M. and Loy, A. (2002) Bacterial community composition and function in
sewage treatment systems. Current Opinion in Biotechnology 13, 218-227.
Walsh, F., Cooke, N.M., Smith, S.G., Moran, G.P., Cooke, F.J., Ivens, A., Wain, J. and
Rogers, T.R. (2010) Comparison of two DNA microarrays for detection of
plasmid-mediated antimicrobial resistance and virulence factor genes in clinical
isolates of Enterobacteriaceae and non-Enterobacteriaceae. International Journal
of Antimicrobial Agents 35, 593-598.
Werner, G., Essig, A., Bartel, M., Wellinghausen, N., Klare, I., Witte, W. and Poppert, S.
(2007) Detection of resistance to linezolid in Enterococcus species by
fluorescence in situ hybridisation using locked nucleic acid probes. International
Journal of Antimicrobial Agents 29, S457-S458.
Zhang, X.X., Zhang, T. and Fang, H. (2009) Antibiotic resistance genes in water
environment. Applied Microbiology and Biotechnology 82, 397-414.