Dissertation zur Erlangung des Doktorgrades der Fakultät für Chemie und Pharmazie der Ludwig-Maximilians-Universität München Novel roles of miRNA-27a and miRNA-200c in breast cancer treatment and metastasis Bojan Ljepoja aus Trostberg, Deutschland 2019
Transcript
Dissertation zur Erlangung des Doktorgrades
der Fakultät für Chemie und Pharmazie
der Ludwig-Maximilians-Universität München
Novel roles of miRNA-27a and miRNA-200c in breast cancer
treatment and metastasis
Bojan Ljepoja
aus
Trostberg, Deutschland
2019
Erklärung
Diese Dissertation wurde im Sinne von § 7 der Promotionsordnung vom 28.
November 2011 von Herrn Prof. Dr. Ernst Wagner betreut.
Eidesstattliche Versicherung
Diese Dissertation wurde eigenständig und ohne unerlaubte Hilfe
erarbeitet.
München, 16.05.2019
Bojan Ljepoja
Dissertation eingereicht am: 16.05.2019
1. Gutachter: Prof. Dr. Ernst Wagner
2. Gutachter: Prof. Dr. Stefan Zahler
Mündliche Prüfung am: 11.07.2019
“ I shall endeavour still further to prosecute this inquiry,
an inquiry I trust not merely speculative, but of sufficient moment to inspire the pleasing hope
of its becoming essentially beneficial to mankind.
2.3.1. Induction of tamoxifen resistance leads to repression of ERα and miRNA-27a expression . 9
2.3.2. The interplay of miRNA-27a and ERα in a positive feedback loop ...................................... 10
2.3.3. Overexpression of miRNA-27a induces sensitivity towards SERM treatment in vitro ......... 13
2.3.4. MiRNA-27a is a putative prognostic marker for endocrine therapies in metastatic ER+
breast cancer ......................................................................................................................................... 15
More than 25 years ago, first observations of the small RNA lin-4 were made in
C. elegans. Much to the surprise of the researchers around Lee RC in the Ambros
group, the RNA was not coding for any protein. Furthermore, the authors even found
that lin-4 performed transcriptional regulation on another gene, lin-14 by suppressing
its expression via complementary antisense RNA interaction1. While those findings
were received with high interest in the early 1990’s, the magnitude and importance for
today’s biology were not clear at that time. It was not until the early 2000’s that those
small, non-coding RNAs were regarded as their own class of regulatory RNAs and due
to their size of around 22 nucleotides were termed microRNAs (miRNAs)2. Today, it is
generally understood that miRNAs are involved in multiple cellular processes in plants
as well as animals 3,4.
Figure 1 – Biogenesis and function of miRNAs
a) Adapted from Lodish et al. and Gebert et al. 4,5, miRNAs undergo extensive processing, shortening the length of the primary transcript from step to step. b) Adapted from Peter et al.6, the complex multi-layered network of miRNA based translational regulation
In short, the biogenesis of miRNAs is based on the nuclear transcription of miRNA
genes by RNA polymerase II, resulting in the primary transcripts, pri-miRNAs. This
RNA segments are often polycistronic units and can contain multiple miRNA hairpin
structures. A protein complex, consisting of the RNAse III endonuclease Drosha, as
1. Introduction
Dissertation - Bojan Ljepoja | 2 |
well as the microprocessor complex subunit DGCR8, is able to recognize the hairpin-
motifs and generates 60-70 nt stem-loop structures, the pre-miRNA.
After those stem-loops are transported to the cytosol, facilitated by Ran-GTP and
Exportin, further processing is applied: The protein complex, consisting of Dicer, a
RNAse III endonuclease, and the RNA-binding co-factor TRBP, cleaves the pre-
miRNA. The resulting RNA of 22 nt length is the mature miRNA, a duplex consisting of
the miRNA and its complementary strand, often referred to as miRNA* (“star-strand”).
The miRNA*, or sometimes also called “passenger strand”, undergoes RNA
degradation, as the thermodynamically favored single stranded miRNA is loaded into
the RISC (Figure 1a) 4,5.
With the Argonaut proteins (Ago), the miRNA-RISC recognizes target mRNAs based
on sequence complementarity of the “seed region”, located in the 3’ UTR of the mRNA.
Thus, miRNA regulation of protein expression is based on anti-sense matching of only
about eight bases, nucleotides two to seven of the miRNA’s 5’ end, to the mRNA seed
region. While a perfect match of bases is common in plants3, it is highly uncommon in
animals. The partial matching of only about seven or even six bases can cause
translational repression, following different thermodynamic rules of anti-sense binding,
like e.g. “Wobble hypothesis” 7.
Altogether, miRNAs have added a new level of complexity to translational regulation
of protein expression: While one miRNA can target multiple mRNAs, one single mRNA
can also be the target of many different miRNAs 6 (Figure 1b).
Since the first studies of Lee et al., more than 80,000 publications with the search term
“miRNA” were registered in NCBIs database Pubmed.gov
(https://www.ncbi.nlm.nih.gov) until early 2019, showing the vast increase of interest
and therefore knowledge in this field.
1.2. miRNAs in breast cancer
Breast cancer is one of the leading causes of cancer deaths worldwide 8. According to
the American cancer association, in 2018 more than 260,000 women were estimated
to be newly diagnosed with breast cancer, and almost 41,000 deaths will have
occurred 9. MiRNAs play a major role in the development and persistence of breast
cancer 10,11. While breast cancers are a group of highly heterogeneous tumors, often
classified by their status of hormone receptors 12,13, miRNAs seem to play an
as well as decreased ERα protein expression (Figure 3c). The transcriptional activity
of ERα was assessed via an ERE (estrogen-receptor-response element) luciferase
2. MiRNA-27a sensitizes breast cancer cells to SERMs
Dissertation - Bojan Ljepoja | 10 |
reporter assay which indicated a significant loss of relative signaling of about 40% in
the TAM6 cells (p < 0.05) compared to wildtype MCF7 (Figure 3d). Interestingly, the
resistant TAM6 cells showed also a decreased expression of miR-27a (Figure 3e).
Figure 3 - Induction of tamoxifen resistance leads to repression of ERα and miR-27a expression
a) A Molecular Evolution Assay of 6 cycles tamoxifen (TAM) treatment resulted in resistant MCF7 cells, the TAM6 cells, with increased resistance to 20µM TAM (p < 0.001) as well as an increased IC50 value. b) ESR1 mRNA levels are significantly decreased by approximately 50% in the resistant cells, as shown by RT-qPCR (p < 0.05), c) as well as western-blot for protein levels, GAPDH was used as housekeeper. d) The relative luciferase signal of the ERE-reporter is significantly decreased in the resistant cells (p < 0.05). e) Expression of miR-27a is decreased to 50% in the the resistant TAM6 cells compared to MCF7 wildtype (p < 0.05).
2.3.2. The interplay of miRNA-27a and ERα in a positive feedback loop
To investigate whether miR-27a’s is able to regulate the expression of ERα, basal
miRNA expression was analyzed in two Luminal A breast cancer cell lines, T47D and
MCF7. Both cell lines showed expression of miR-27a. In MCF7 the miR-27a levels
were six times higher than in T47D cells (Figure 4a). Nevertheless, ectopic
overexpression of miR-27a showed a further increase of ERα mRNA (ESR1) in MCF7
and T47D of 20% to 50%, respectively (Figure 4b), and a 1.3 and 2-fold increase in
protein levels (Figure 4c). The ERE-reporter assay revealed a 40-50% increase in
luciferase signal, indicating increased transcriptional activity of ERα (Figure 4d). These
findings were supported by an immunofluorescence staining (Figure 4e), which
showed that upon stimulation with estradiol the ERα localization into the nucleus is
stronger after miR-27a overexpression compared to controls.
2. MiRNA-27a sensitizes breast cancer cells to SERMs
Dissertation - Bojan Ljepoja | 11 |
Of note, also the reintroduction of miR-27a into the low-expressing tamoxifen resistant
TAM6 cells reactivated ERα expression and signaling as shown by a significantly
increased ERE-luc signal of more than 50% compared to controls (p < 0.05, Figure 4f).
Figure 4 - The effect of miR-27a on ER-alpha signaling in luminal A breast cancer
a) Expression of miR-27a in the two luminal A breast cancer cell lines, MCF7 and T47D. b) Overexpression of miR-27a significantly increased expression of ESR1 mRNA in MCF7 and T47D (p < 0.01), b) ERα protein, as well as c) luciferase signal of the ERE-reporter compared to scrambled control (p < 0.05). e) Immunofluorescence staining of ERα and DAPI showed increased localization of ERα to the nucleus in miR-27a overexpressing cells which were stimulated with estradiol (ES). f) Re-expression of miR-27a in TAM6 cells significantly increased the relative luciferase signal of the ERE-reporter compared to scrambled control (p < 0.05).
To investigate a possible regulation of miR-27a expression by ERα activity, MCF7 cells
were depleted of estrogen stimulation in estradiol- and phenol red free media or
stimulated with estradiol for 48 h. The miR-27a expression was analyzed and as shown
in Figure 5a, after the depletion of estrogen stimulation, the miR-27a expression was
significantly decreased (p < 0.001) compared to control. Additionally, stimulation with
estradiol showed a slight but not significant increase of miR-27a in MCF7 cells.
2. MiRNA-27a sensitizes breast cancer cells to SERMs
Dissertation - Bojan Ljepoja | 12 |
To further investigate the correlation, a stable MCF7 cell line with inducible expression
of a short hairpin inhibitor of ERα mRNA, MCF7 shER, was generated. Upon induction
with doxycycline for 48 h, the cells showed decreasing ERα protein of one third
compared to uninduced control (Figure 5b). Long-term depletion of ERα by induction
of the shER for 29 days compared to a scrambled hairpin control, showed a stable
effect of 20% reduction of ESR1 mRNA (Figure 5c). Importantly, the ERα knock-down
resulted also in a highly significant decrease in miR-27a expression of 30%
(Figure 5d). These findings indicate a mutual influence of miR-27a and ERα expression
in a positive feedback loop. Thus, a genomic analysis of the miR-27a locus was
performed, investigating possible regulation mechanisms based on ERα transcriptional
effects. Two different modes of transcriptional regulation were considered: Direct
regulation of ERα via binding to known ERE structures located upstream of the miR-
27a locus, or indirect influence by predicted binding of other transcription factors, which
are known to be regulated by ERα. Figure 5e shows the possible bindings and
interactions in the promotor (-500/-1 bp) and the enhancer region (-30,000/-1 bp) of
miR-27a: Two putative ERE sites were found, one in the proximal promotor with a
match of 11/13 bases to the consensus sequence, and one in the distant enhancer
with 12/13 matching bases. Additionally, a site for JUN in the promotor, as well as the
co-transcription factors of ERα AP-2αA and C/EBPβ in the enhancer, were predicted
with high stringency44,45. This analysis indicated a high probability of transcriptional
regulation of miR-27a by ERα, consolidating the hypothesis of an important function of
both miR-27a and ERα in the development of resistance to tamoxifen treatment.
2. MiRNA-27a sensitizes breast cancer cells to SERMs
Dissertation - Bojan Ljepoja | 13 |
Figure 5 - The effect of ERα signaling on miR-27a expression
a) MCF7 cells that were depleted of estrogen-stimulation, showed significantly decreased expression of miR-27a (p < 0.001). b) Induction of shER-expressing MCF7 cells with 5µg/ml doxycycline for 48h decreased protein levels of ERα 30%. c) Long-term induction of shER for 4 and 29 days, significantly decreased ESR1 mRNA (p < 0.01), as well as d) the expression of miR-27a. e) Schematic overview of the promotor and enhancer region of the miR-27a locus. An analysis of possible transcription-factor interactions revealed three interaction partners of ERα, possibly controlling miR-27a transcription.
2.3.3. Overexpression of miRNA-27a induces sensitivity towards SERM
treatment in vitro
While formation of resistance to tamoxifen is correlated to loss of miR-27a, the reverse
setting of miR-27a overexpression in luminal A cell lines was of interest. In order to
analyze the sensitivity towards the treatment, MCF7 and T47D were transfected with
miR-27a mimics and subsequently treated with different SERMs: Tamoxifen, its active
metabolite endoxifen as well as toremifene. As shown in Figure 6a-c, miR-27a
sensitized MCF7 cells to all tested SERM treatments. To investigate whether the
changes in viability induced by tamoxifen, as determined by ATP-content, were not
only based on changes in metabolic activity, an annexin V assay was performed to
determine ratios of induced cell death. Viability is regarded as the percentage of cells
with negative annexin as well as propidium iodide stainings. In line with the ATP-
measurements, MCF7 with an overexpression of miR-27a showed increased
sensitivity towards tamoxifen treatment (Figure 6d)
Replication of this experiment with another luminal A cell line, T47D, showed similar
results for tamoxifen, endoxifen and toremifen compared to controls (Figure 6e-g). Also
2. MiRNA-27a sensitizes breast cancer cells to SERMs
Dissertation - Bojan Ljepoja | 14 |
the rescue of miR-27a expression in the tamoxifen resistant and miR-27a-low TAM6
cells re-sensitized the cells towards tamoxifen treatment, as seen by a significant
decrease in viability after the treatments, compared to control (Figure 6h). Further
validation with the annexin V assay showed that these effects are based on apoptosis
and cell death, rather than diminished metabolism (Figure 6i).
Together, these data showed a sensitizing effect of miR-27a to SERM treatments in
both tested luminal A cell lines, as well as a re-sensitizing effect in tamoxifen resistant
cells.
Figure 6 - Effect of miR-27a overexpression on resistance to SERMs
MCF7 cells with miR-27a overexpression showed significantly increased sensitivity towards treatments with the different SERMs as shown as viability measurement by ATP content, compared to scrambled control (Ctrl): a) 16µM tamoxifen (TAM), b) 12.5µM endoxifen (Endo) and c) 30µM toremifen. d) An annexin V-FITC assay of TAM treated MCF7 cells showed a decreased number of viable cells after miR-27a overexpression. T47D cells with overexpression of miR-27a with e) 12.5µM TAM, f) 10µM Endo, g) 22.5µM TOR showed significantly decreased viability, compared to scramble control. h) The resistant TAM6 cells were significantly re-sensitized to TAM treatment by overexpression of miR-27a shown as viability by ATP content, i) as also by Annexin measurements. All experiments were compared and normalized to a scrambled control transfection (** p < 0.01, *** p < 0.001, ****p < 0.0001)
2. MiRNA-27a sensitizes breast cancer cells to SERMs
Dissertation - Bojan Ljepoja | 15 |
2.3.4. MiRNA-27a is a putative prognostic marker for endocrine therapies in
metastatic ER+ breast cancer
As validation of the in vitro results, the impact of miR-27a expression on the survival of
patients with ER-positive tumors which underwent endocrine treatment was evaluated.
An analysis of patient data derived from the METABRIC cohort was performed utilizing
the tool “miR power” (http://www.kmplot.com) by Lanczky et al. 46. In this analysis,
patients were grouped according to their ER expression, as determined by
immunohistochemistry and their status of node invasion. Patient groups with ER-
positive tumors were narrowed down to the cohort which underwent endocrine
treatment exclusively, while no further limitations were set in groups with ER-negative
tumors in regard of the therapy.
As shown in Figure 7, patients with ER-positive tumors and high miR-27a expression
had beneficial overall survival (OS) of about 20 months and a lower risk of events,
compared to the low expressing group (N=726, HR 0.87 (0.6-1.08), p=0.15; not
significant). The corresponding Kaplan-Meier curves show the biggest difference
between the two groups during 100-150 months of follow up, corresponding to the
usual follow-up care for breast cancer patients. In contrast, ER-negative breast cancer
patients with high miR-27a expression were at approximately one third higher risk and
had a 1.5 years lower median OS than the low expressing cohort (N=266, HR 1.33
(0.84-2.09), p=0.22). Further differentiation of the ER-positive group to a subgroup
which is determined as luminal A, the relative risk additionally decreased to 0.61 (0.39-
0.94) with p=0.025 (see supplemental Figure S3).
By further differentiation of the dataset, patients with more aggressive luminal A cancer
were investigated. Those groups were constricted to subgroups with positive lymph
node status, indicating a higher metastatic ability of the tumor and higher tumor burden
of the patients. In this setting, the data showed highly significant difference in the
ER-positive group towards a beneficial effect of high miR-27a in the OS. Patients with
low miR-27a expression had an approximately 50 months shorter survival, therefore
decreasing the risk in the high miR-27a to 0.65 (0.47-0.9; p=0.0083). Likewise, the
comparison in ER-negative patients showed the reverse picture: High miR-27a
expression lead to a significant decrease in OS of about 50 months with a two-fold
increased relative risk (HR 2.02, (1.09-0.023), p=0.023). Here, in the luminal A
subgroup (see supplemental Figure S3) high miR-27a lead to significantly increased
OS of about 40 months and 0.51 (0.31-0.85) relative risk (p=0.0083). Similar results
2. MiRNA-27a sensitizes breast cancer cells to SERMs
Dissertation - Bojan Ljepoja | 16 |
were seen in another cohort of luminal A patients with early breast cancer, which
underwent tamoxifen treatment, as analyzed with the MIRUMIR tool 47 (supplementary
Figure S4).
These findings showed that miR-27a expression was high in aggressive tumors and
was detrimental for patients with ER-negative breast cancer, but in the setting of ER-
positive tumors that were treated with endocrine therapies high miR-27a levels were
an indication for a good response to the treatment and increased survival rates.
Figure 7 - Clinical data shows potential of miR-27a as prognostic marker for endocrine therapies
ER+ and ER+ metastatic breast cancer
2. MiRNA-27a sensitizes breast cancer cells to SERMs
Dissertation - Bojan Ljepoja | 17 |
2.4. Discussion
While luminal A breast cancer is regarded as the one subtype with best prognosis and
well established treatment options, current epidemiologic data suggest a need for
better follow-up care of the disease, as evidently mortality of these patients is
increasing after 5 years31. Different approaches are made to counteract bad long-term
outcomes. Often SERM treatments are prolonged for a time of up to 10 years and
longer or switched for different treatments with drugs of other therapeutic classes,
usually aromatase inhibitors 31,48. Many of these approaches are associated to the
same adverse effects as SERM treatment, i.e. cardiovascular disease and the
substantially increased risk of secondary cancers like endometrial carcinoma 49.
Hence, physicians are inclined to often discontinue therapies early to balance these
risks. Still, the number of relapsing patients with therapy resistant tumors is high and
therefore there is an urgent need for personalized treatment options to maximize
efficacy of therapies while decreasing the adverse effects. MiRNAs are a class of
potential markers, which show fine-tuned expression patterns in tissues, as well as
offer the possibility to analyze their expression directly from blood samples as
circulating miRNAs39.
MiR-27 plays an ambivalent role in cancer. On the one hand, it is known to increase
proliferation and metastasis in patients22, in some cases even assumed to regulate
chemoresistance 50. This aspect makes it an interesting marker for numerous cancer
types, like colon and esophageal cancer and also certain types of breast cancer, in
order to adjust treatments and therapy regimes accordingly 22,23,50. In the analysis of
the METABRIC datasets, two cohorts of patients with ER-negative tumors, which
consequently did not receive endocrine treatments, showed significantly worse
outcomes for patients with high miR-27a expression. This result is in line with the
discussed role of miR-27a as oncomir, inducing negative effects on patient survival.
On the other hand, the in silico analysis of both the METABRIC and MIRUMIR datasets
revealed that miR-27a expression is a predictor of beneficial breast cancer patient
survival, in a defined subgroup of ER-positive tumors treated with endocrine agents.
Multiple explanations can be considered for this ambivalence. First, due to the positive
bidirectional feedback loop between miR-27a and ERα, the miR-27a expression may
function as a surrogate marker for the ERα expression. MiR-27a was described to
upregulate ERα expression, as observed in the current study and was previously
reported, based on miR-27a inhibition of ZBTB10 and resulting increase of the
2. MiRNA-27a sensitizes breast cancer cells to SERMs
Dissertation - Bojan Ljepoja | 18 |
expression of the sp-protein family42. In this case, higher levels of ERα, based on
increased miR-27a expression, could increase the susceptibility for SERMs and
therefore improve the eradication of the tumor. While an increase of drug targets is
often discussed as resistance mechanism, different studies suggest that SERM
antitumor effects are based not only on inhibition of the estrogen signaling, but
additionally on induction of maspin or of oxidative stress, which result of interaction
with the receptor 51,52. Therefore, an increased number of SERM targets could correlate
with the induced damage in the tumor.
Additionally, our data showed that stimulation with or the deprivation of estradiol, as
well as a direct knock-down of ERα, showed identically directed impact on miR-27a
expression, as was also reported in a genomic expression study previously 53. The in
silico analysis of the promotor and enhancer region revealed multiple potential sites of
transcriptional regulation of miR-27a via ERα, e.g. by direct translational effects based
on EREs or upregulated transcription factor activity downstream of the ER-signaling
pathway, like JUN.
Thus, high miR-27a levels may act as surrogate read-out for a high ERα translational
activity in the tumor, likely with crucial cancer promoting effects due to ERα’s role in
cell cycle and proliferation54. This could explain the higher impact on cancer cell
survival resulting from ERα inhibition.
Both of these discussed mechanisms do not contradict miR-27a’s role as oncomiR, as
increase of ER-activity leads to higher proliferation and metabolic activity in the cells54.
In fact, the in vitro viability data suggest that treatments with tamoxifen and toremifen
are significantly more effective in eradicating these potentially more aggressive tumors,
underlined by the finding that the beneficial prognostic effect of miR-27a is highest for
ER-positive tumors which spread to lymph nodes.
Besides acting as predictor for an enhanced response to SERM treatments, the
observed loss of miR-27a may also function as indicator of resistance to the therapy,
as observed in the TAM6 cells. Treatment with TAM for six rounds in the course of
multiple weeks, caused the formation of a considerable resistance, accompanied by
the loss of miR-27a, as was also demonstrated by Ye et al 55, showing increased miR-
27a expression after generation of TAM resistant cells.
Many mechanisms are discussed for resistance development to tamoxifen. One
obvious effect which may account for up to 17-28% of acquired resistance56, may be
the loss of ERα, rendering the cancer cells independent of estrogen, based on CpG
2. MiRNA-27a sensitizes breast cancer cells to SERMs
Dissertation - Bojan Ljepoja | 19 |
island methylation of the ER-promotor57. As no analysis of methylation patterns was
performed on the TAM6 cells, it is possible that partial methylation of the ESR1
promotor occurred and therefore affected changes in ERα and miR-27a expression.
In addition, the occurrence of mutations of the ER-gene were reported, which are not
influencing the ERα expression, but were observed to have no estrogen mediated
translational activity while appearing as ER-positive in immunohistological stainings 58.
In this case, miR-27a may be a valuable indicator of functional ERα expression, as ER-
positive tumors with low miR-27a expression might inherit a less functional ERα
translational activity and thus decreased response to SERMs.
Taken together, miR-27a expression correlates with functional ERα expression and
may therefore act as surrogate read-out for a frequent resistance mechanism.
MiRNA screening can play an important part in improving patient outcomes by enabling
tailored treatments and personalized medicines for cancer. A screening of different
miRNAs, including miR-27a in blood plasma of breast cancer patients was performed
previously 59. In the study of Jurkovicova et al. miR-27a was shown to be one of the
modified miRNAs in the analysis of plasma samples from the patients. The data
indicates that miR-27a expression may be used as marker for invasive breast cancers
or carcinomas in situ. Further studies need to be conducted to prove whether miR-27a
expression is a prognostic marker for therapeutic response also in blood plasma.
Taken together, our data suggests and encourages further studies of miR-27a as
marker for SERM response in the clinics. Patients with ER-positive tumors with high
miR-27a expression currently already receive suitable treatment with adjuvant
tamoxifen, if treated according to the guidelines13. However, patients in the same
setting with miR-27a low tumors may display resistance to the treatment, either initially
or due to acquired resistance in the long-term. These patients would benefit most of
an analysis of miR-27a levels.
Acknowledgments
The authors thank the German Research Foundation (DFG) for financial support (SFB
1032 project B4). JGR thanks the Mexican government for receiving a scholarship
(CONACyT number 207973). AS thanks Hanns-Seidel Stiftung for receiving a
scholarship.
The authors thank Florian Lengauer and Nicoletta Bruno for preliminary experiments.
The authors declare no competing financial interests.
2. MiRNA-27a sensitizes breast cancer cells to SERMs
a) The miR-200c gene is located at chromosome 12p13, TALENs were designed to target miR-200c 3p drosha processing site. b) Genomic DNA was extracted from MCtrl and M1, M2 and M3 clones, afterwards the miR-200c gene was amplified by PCR to perform sequencing of the miR-200c loci; MCtrl shows a heterozygous mutation while M1, M2 and M3 show various indels in proximity of the miR-200c 3p drosha processing site on both alleles. c) MCF7, MCtrl, M1, M2 and M3 miR-200c expression levels were analyzed by quantitative RT-PCR. Expression of miRNAs is shown as mean of three independent experiments ± SD .ns: no statistical difference, p>0.05, one-way ANOVA post hoc Bonferroni.
3.3.2. Unchanged expression of miR-200 family members
To investigate possible compensation effects of the knock out, we analyzed the
expression levels of the other miR-200c family members. The genomic loci are
comprised of two genomic clusters, one located at chromosome 1p36 including miR-
200a, miR-200b and miR-429, and chromosome 12p13 containing miR-200c and miR-
14126. MiR-200c shares the same seed region with miRs 200b and 429 (Figure 9a).
Subsequently, a qPCR analysis of the expression of all family members was
performed.
This data showed that miR-200c is the family member with highest expression in
MCF7. Further analysis revealed that no family member was compensating for the loss
of miR-200c by an increase of expression and no general upregulation of all family
members was observed (p>0.05) compared to the control group (MCF7 and MCtrl).
Of note, also the expression levels of miR-141 remained similar, i.e. not influenced by
the KO of miR-200c, despite the localization in the same polycistronic unit (Figure 9b).
3. A proteomic analysis of an in vitro knock-out of miRNA-200c
Dissertation - Bojan Ljepoja | 30 |
The knock-out of a miRNA is fundamentally different to its short term inhibition, giving
the cells more time to compensate the loss of miR-200c. Therefore, late compensatory
mechanisms were ruled out by re-evaluation of the expression of miR-200c family
members at a late cell passage number. Compared to earlier passages, the data
showed no remarkable changes in the different clones over time (p=0.896, Figure 9c).
The slight increase of miR-141 is not significant.
Figure 9 - Expression of miR-200 family members among the KO clones.
a) The miR-200 family is distributed on two chromosomes; miR-200b, miR-200a and miR-429 are located on chromosome 1p36.33 and miR-200c and miR-141 are located on chromosome 12p13.31. miRs with the same seed region are colored in tones of orange or blue respectively. b) MCF7, MCtrl, M1, M2 and M3 were analyzed for miR-200c, miR-141, miR-200a, miR-200b and miR-429 relative expression levels by quantitative RT-PCR. c) Cells from passage 10 and passage 23 were compared regarding their miR-200c, miR-141, miR-200a, miR-200b and miR-429 relative expression levels via quantitative RT-PCR. Expression of miRNAs is shown as mean ± SD of three independent replicas. ns means no statistical difference, p>0.05, three way ANOVA post hoc Bonferroni.
3. A proteomic analysis of an in vitro knock-out of miRNA-200c
Dissertation - Bojan Ljepoja | 31 |
3.3.3. Proteomic analysis of three individual KO clones results in 26 novel
targets
To evaluate the effect of the miR-200c KO on a wide range of proteins, a proteomic
approach was chosen (
Figure 10a):
All clones (M1, M2, M3, MCtrl), as well as wild-type MCF7 cells were harvested in three
replicas (A/B/C), and subsequently, proteomic data analysis was performed, resulting
in a set of 1736 identified proteins. For the following analysis, we chose to narrow the
set down to proteins that were identified in every single measurement.
This filtering resulted in a subset of 675 proteins. On this subset, a principal component
analysis (PCA) was performed to investigate the similarity of the clones and replicas.
Figure 10b shows a general trend of grouping of the replicas (with exception of MCtrl C)
as well as a closer relation between the KO-clones M1, M2 and M3 and the controls
MCF7 and MCtrl, respectively. A similar behavior is seen in a cluster analysis, as
shown in the Supplement S 1. For statistical evaluation of differentially expressed
proteins a Volcano plot analysis was performed (
Figure 10c), comparing the expression of the KO-clones M1, M2 and M3 (KO) to the
controls MCF7 and MCtrl (Ctrl). This analysis revealed nine proteins with significant
changes in regulation as shown in Table 1.
To investigate effects on single-clone level, a further T-test with the same parameters
was performed, comparing each KO-Clone (M1, M2 or M3) to the grouped controls
(e.g. M1 vs. MCtrl and MCF7). The analysis revealed 17 significant hits, as shown in
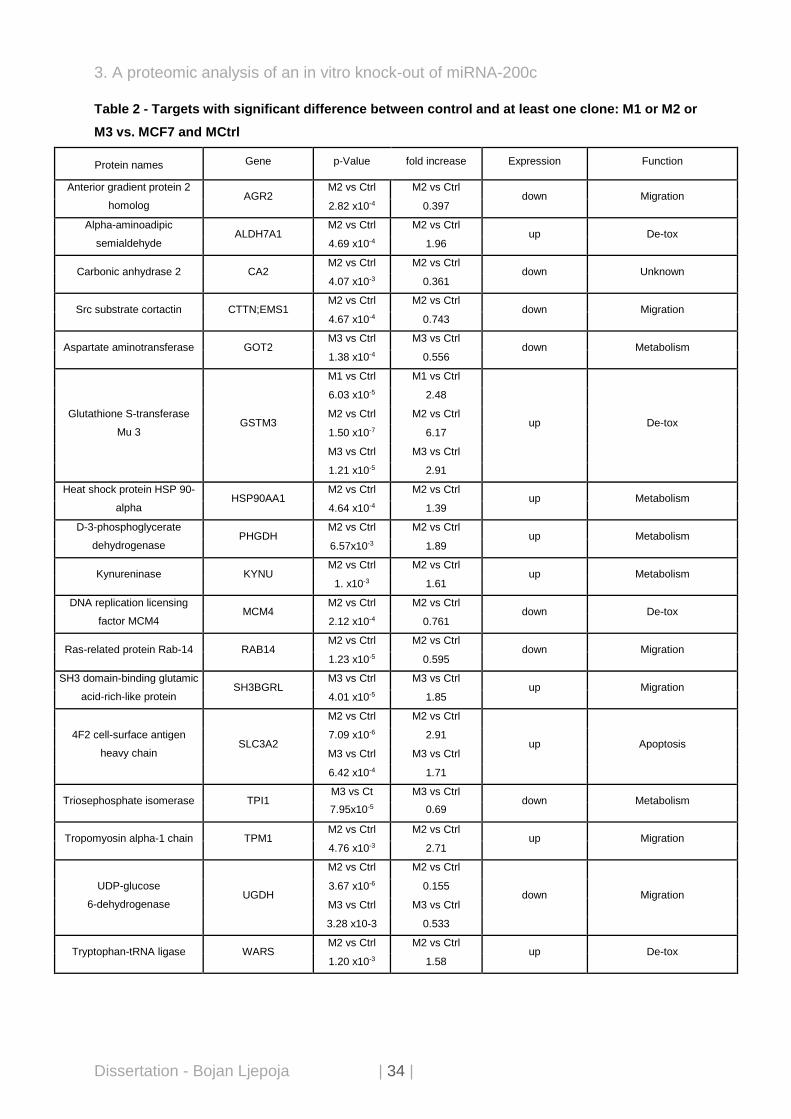
Figure S2 and summarized in Table 2. Here, M2 is pointed out as most diverse from
the controls with 14 proteins being differentially expressed, while the two other clones
show only statistical difference in one or six proteins for M1 and M3, respectively
(Supplement S 2).
Next, to further analyze targets which may have had changes in expression in
response to the miR-200c KO but have not been detected in the previous analysis, we
searched for proteins that were not detected in the KO-group, but were found in the
control-group (found at least 3 times in Ctrl, not at all in the KO). These proteins were
termed “OFF”. Vice versa, “ON” proteins display no expression in the control-group but
are expressed in the KO-group (at least 5 times in KO, but not in Ctrl). Table 3 lists the
three targets gaining expression after knock-out (ON) and the two proteins losing
expression (OFF).
3. A proteomic analysis of an in vitro knock-out of miRNA-200c
Dissertation - Bojan Ljepoja | 32 |
The 26 targets shown in Table 1, 2 and 3 were grouped according to their main function
as stated by the Uniprot-Database89. As shown in
Figure 10d, more than half of the proteins are found in migratory processes and
metabolism (45% and 17% respectively), while other functions are detoxification (10%)
and apoptosis (11%), with remaining 17% of proteins, with no known function.
3. A proteomic analysis of an in vitro knock-out of miRNA-200c
Dissertation - Bojan Ljepoja | 33 |
Table 1 - Targets with significant difference between both groups – M1 and M2 and M3 vs MCF7
and MCtrl
Protein Gene p-Value fold change Expression Function
Anterior gradient protein 2
homolog AGR2 6.36x10⁻³ 0.59 down Migration
Filamin-A FLNA 4.32x10⁻⁵ 1.31 up Migration
Filamin-B FLNB 1.20x10⁻⁵ 1.41 up Migration
Glutathione S-transferase
Mu 3 GSTM3 1.43x10⁻⁵ 3.54 up De-Tox
Pyridoxal kinase PDXK 2.27 x10⁻³ 0.53 down Metabolism
4F2 cell-surface antigen
heavy chain SLC3A2 1.25 x10⁻⁴ 2.00 up Apoptosis
Spectrin alpha chain, non-
erythrocytic 1 SPTAN1 3.26 x10⁻⁴ 0.73 down Migration
Tropomyosin alpha-1 chain TPM1 3.74 x10⁻³ 1.93 up Migration
UDP-glucose 6-
dehydrogenase UGDH 7.10 x10⁻³ 0.39 down Migration
3. A proteomic analysis of an in vitro knock-out of miRNA-200c
Dissertation - Bojan Ljepoja | 34 |
Table 2 - Targets with significant difference between control and at least one clone: M1 or M2 or
M3 vs. MCF7 and MCtrl
Protein names Gene p-Value fold increase Expression Function
Anterior gradient protein 2
homolog AGR2
M2 vs Ctrl M2 vs Ctrl down Migration
2.82 x10⁻⁴ 0.397
Alpha-aminoadipic
semialdehyde
dehydrogenase
ALDH7A1 M2 vs Ctrl M2 vs Ctrl
up De-tox 4.69 x10⁻⁴ 1.96
Carbonic anhydrase 2 CA2 M2 vs Ctrl M2 vs Ctrl
down Unknown 4.07 x10⁻³ 0.361
Src substrate cortactin CTTN;EMS1 M2 vs Ctrl M2 vs Ctrl
down Migration 4.67 x10⁻⁴ 0.743
Aspartate aminotransferase GOT2 M3 vs Ctrl M3 vs Ctrl
down Metabolism 1.38 x10⁻⁴ 0.556
Glutathione S-transferase
Mu 3 GSTM3
M1 vs Ctrl M1 vs Ctrl
up De-tox
6.03 x10⁻⁵ 2.48
M2 vs Ctrl M2 vs Ctrl
1.50 x10⁻⁷ 6.17
M3 vs Ctrl M3 vs Ctrl
1.21 x10⁻⁵ 2.91
Heat shock protein HSP 90-
alpha HSP90AA1
M2 vs Ctrl M2 vs Ctrl up Metabolism
4.64 x10⁻⁴ 1.39
D-3-phosphoglycerate
dehydrogenase PHGDH
M2 vs Ctrl M2 vs Ctrl up Metabolism
6.57x10⁻³ 1.89
Kynureninase KYNU M2 vs Ctrl M2 vs Ctrl
up Metabolism 1. x10-3 1.61
DNA replication licensing
factor MCM4 MCM4
M2 vs Ctrl M2 vs Ctrl down De-tox
2.12 x10⁻⁴ 0.761
Ras-related protein Rab-14 RAB14 M2 vs Ctrl M2 vs Ctrl
down Migration 1.23 x10⁻⁵ 0.595
SH3 domain-binding glutamic
acid-rich-like protein SH3BGRL
M3 vs Ctrl M3 vs Ctrl up Migration
4.01 x10⁻⁵ 1.85
4F2 cell-surface antigen
heavy chain SLC3A2
M2 vs Ctrl M2 vs Ctrl
up Apoptosis 7.09 x10⁻⁶ 2.91
M3 vs Ctrl M3 vs Ctrl
6.42 x10⁻⁴ 1.71
Triosephosphate isomerase TPI1 M3 vs Ct M3 vs Ctrl
down Metabolism 7.95x10⁻⁵ 0.69
Tropomyosin alpha-1 chain TPM1 M2 vs Ctrl M2 vs Ctrl
up Migration 4.76 x10⁻³ 2.71
UDP-glucose
6-dehydrogenase UGDH
M2 vs Ctrl M2 vs Ctrl
down Migration 3.67 x10⁻⁶ 0.155
M3 vs Ctrl M3 vs Ctrl
3.28 x10⁻³ 0.533
Tryptophan-tRNA ligase WARS M2 vs Ctrl M2 vs Ctrl
up De-tox 1.20 x10⁻³ 1.58
3. A proteomic analysis of an in vitro knock-out of miRNA-200c
Dissertation - Bojan Ljepoja | 35 |
Table 3 - Targets detected in just one of the groups: M1 and M2 and M3 OR MCF7 and MCtrl
Protein Gene Expression Function
N-acetylserotonin O-
methyltransferase-like protein ASMTL ON Unknown
Serine/threonine-protein
phosphatase PP1-gamma
catalytic subunit
PPP1CC OFF Unknown
Apoptosis-associated speck-like
protein containing a CARD PYCARD OFF Apoptosis
Regulator of microtubule dynamics
protein 1 RMDN1 ON Migration
Adseverin SCIN ON Migration
Figure 10 - Proteomic analysis of three different KO clones (next page)
a) Schematic overview of the experimental procedure to generate three different clones. Each clone was measured in independent replicas b) Principal component analysis of the measurements, KOs are shown in red, Ctrls in blue c) Volcano plot analysis of grouped controls: (MCF7 WT A/B/C and MCtrl A/B/C) vs. (M1 A/B/C and M2 A/B/C and M3 A/B/C), N=675 with 250 randomizations, FDR 0.05 and S0 of 0.1 d) Percentage of main functional pathways of targets in Tables 1, 2 and 3, as derived from the Uniprot-Database e) Analysis for possible seed-interaction of miR-200c with the targets of Tables 1,2 and 3 and further analysis of not-directly regulated targets for binding of transcription factors with predicted miR-200c regulation, see also Supplemental Table S 3: f) Validation of mRNA expression with grouped statistical analysis (M1 and M2 and M3 vs MCF7 WT and MCtrl, N= 9 (KO) / 6 (Ctrl)) for the anterior gradient protein 2 homolog, aldehyde dehydrogenase 7 family member A1, filamin A and B, glutathione S-transferase M3 and adseverin, *p<0.05 ***p<0.001 **** p< 0.0001
3. A proteomic analysis of an in vitro knock-out of miRNA-200c
Dissertation - Bojan Ljepoja | 36 |
3. A proteomic analysis of an in vitro knock-out of miRNA-200c
Dissertation - Bojan Ljepoja | 37 |
3.3.4. Analysis of targets for miRNA-200c regulation
To evaluate whether the targets are directly regulated by miR-200c, the genes were
analyzed for binding sites with the TargetScan database. One fifth of the proteins
harbor a potential targeting site (8mer or 7mer-m8/A1 seed-region match) in their
3'UTR. For the remaining 21 genes, a possible promotor binding site of miR-200c
regulated transcription factors was investigated. This analysis revealed that 62 % of
the genes without binding site may be indirectly regulated by miR-200c: The promotor
region of these genes contains at least one putative binding site for a transcription
factor which is potentially regulated by miR-200c (
Figure 10e and Supplemental Table S 3).
Further, we measured whether the differential protein-levels resulted from changes of
the mRNA levels. Therefore, we compared mRNA levels of the single clones to their
proteomic data each each (see Supplement S 3). For six targets alterations n protein
abundance were reflected at the mRNA level (
Figure 10f).
AGR2, the anterior gradient protein 2 homolog, was found to be statistically significant
differentially expressed in the proteomic analysis in Table1. The mRNA expression
correlates with the protein expression from the proteomic approach and the grouped
analysis, i.e. M1 and M2 and M3 vs MCF7 WT and MCtrl, showed an almost four-fold
increase with a highly significant difference between KO and Ctrls respectively
(p<0.0001). Furthermore, aldehyde dehydrogenase 7 family member A1, ALDH7A1’s
protein expression changed significantly in a part of the clones, but on mRNA it shows
highly significant (p<0.0001) increased expression of 43%. Additionally, Filamins FLNA
and FLNB were found to be significantly changed on protein level (Table 1). Again, on
mRNA level both filamins show a significant (p=0.0004 / p=0.0003) increase of 44%
and 59% in FLNA and FLNB respectively. Glutathione S-transferase Mu3 shows an
increase in the mRNA expression compared to the controls (p=0.138). SCIN, adseverin
protein from the “ON” target list (Table 3), also showed a four-fold increase in the KO
compared to the controls (p=0.0004). Taken together in these six cases, the mRNA-
measurements are indicating a regulation of these targets on mRNA level.
3. A proteomic analysis of an in vitro knock-out of miRNA-200c
Dissertation - Bojan Ljepoja | 38 |
3.3.5. The KO of miRNA-200c results in changes in cellular processes and
pathways
For a broader analysis of changes in biological processes and pathways, the original
dataset was filtered for proteins that appeared at least three times in at least one group
(i.e. three times in KO or Ctrl), this resulted in a new subset of 1243 proteins. Missing
values were replaced by the imputation algorithm of Perseus. After a two tailed t-test
comparing KO to Ctrl, all proteins with p<0.05 were analyzed with the DAVID functional
gene annotation tool90,91 with the GoTerm BP (Biological Processes) database (N=118,
Figure 11a).
The majority of functional annotations was categorized to BP1 cellular process (92),
metabolic processes (72) and cellular component biogenesis (26). A detailed view on
the processes is showing the top most frequent sub-classifications according to the
number of attributed genes in GoTerm BP FAT. Prominent processes involve
intracellular transport, translation and oxidation reduction as well as macromolecular
complex assembly and subunit organization. These findings indicate a broad influence
of miR-200c on essential processes.
Moreover, a Gene-Set Enrichment Analysis of the whole dataset after imputation
(N=1243) was performed against GO and KEGG databases. The global Enrichment
Score (ES) histogram revealed that miR-200c knock-out resulted mainly in the
inactivation of pathways, as shown by an accumulation of negative ES (Figure 11b).
For depicting exemplary pathways, we chose KEGG pathway annotations. Enriched
pathways (Supplemental Table S 1) contain mainly metabolic processes like oxidative
phosphorylation citrate cycle and glycolysis, or cytoskeletal organsiation as shown in
changes in focal adhesion (Figure 11c). Negative pathway enrichment was observed
in adherens junctions and tight junctions, regulation of actin skeleton as well as other
metabolic pathways like purine metabolism and decrease in the cell cycle (Figure 11d
and Supplemental Table S 1). Heatmap analysis of the GSEA (Supplement S 4 and
Supplement S 5) show a high occurrence of table 1 and 2 targets in all these pathways.
Taken together, the GSEA findings indicate an increase in metabolic pathways, which
also may increase de-toxification in the cells as well as numerous de-regulations in
cell-cell contacts and cytoskeletal organization, which may lead to increased
metastatic potential.
3. A proteomic analysis of an in vitro knock-out of miRNA-200c
Dissertation - Bojan Ljepoja | 39 |
Figure 11 - Bioinformatic analysis of the proteomic dataset
a) Targets for DAVID 6.7 analysis with the GOterm BP database were chosen from whole dataset for every protein with p<0.05 after student’s t-test KO vs Ctrl b) Distribution of ES Scores in a GSEA of KO vs Ctrl with Gene Ontology (c5.all.v5.2) and KEGG (c2.cp.kegg.v5.2) reference database c) GSEA Enrichment-Plot analysis of the whole dataset shows two exemplary KEGG pathways. Oxidative phosphorylation and focal adhesion showing overexpression while d) cell cycle and regulation of actin cytoskeleton are being down regulated
3. A proteomic analysis of an in vitro knock-out of miRNA-200c
Dissertation - Bojan Ljepoja | 40 |
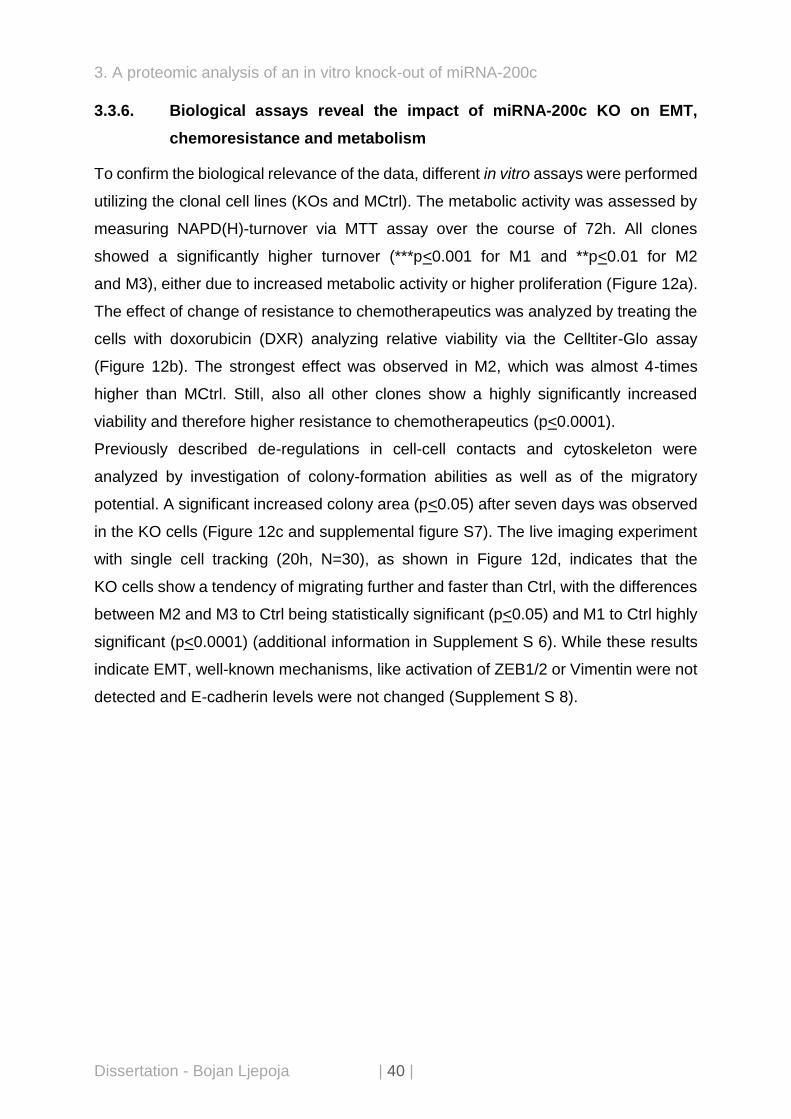
3.3.6. Biological assays reveal the impact of miRNA-200c KO on EMT,
chemoresistance and metabolism
To confirm the biological relevance of the data, different in vitro assays were performed
utilizing the clonal cell lines (KOs and MCtrl). The metabolic activity was assessed by
measuring NAPD(H)-turnover via MTT assay over the course of 72h. All clones
showed a significantly higher turnover (***p<0.001 for M1 and **p<0.01 for M2
and M3), either due to increased metabolic activity or higher proliferation (Figure 12a).
The effect of change of resistance to chemotherapeutics was analyzed by treating the
cells with doxorubicin (DXR) analyzing relative viability via the Celltiter-Glo assay
(Figure 12b). The strongest effect was observed in M2, which was almost 4-times
higher than MCtrl. Still, also all other clones show a highly significantly increased
viability and therefore higher resistance to chemotherapeutics (p<0.0001).
Previously described de-regulations in cell-cell contacts and cytoskeleton were
analyzed by investigation of colony-formation abilities as well as of the migratory
potential. A significant increased colony area (p<0.05) after seven days was observed
in the KO cells (Figure 12c and supplemental figure S7). The live imaging experiment
with single cell tracking (20h, N=30), as shown in Figure 12d, indicates that the
KO cells show a tendency of migrating further and faster than Ctrl, with the differences
between M2 and M3 to Ctrl being statistically significant (p<0.05) and M1 to Ctrl highly
significant (p<0.0001) (additional information in Supplement S 6). While these results
indicate EMT, well-known mechanisms, like activation of ZEB1/2 or Vimentin were not
detected and E-cadherin levels were not changed (Supplement S 8).
3. A proteomic analysis of an in vitro knock-out of miRNA-200c
Dissertation - Bojan Ljepoja | 41 |
Figure 12 – Biological data to validate predicted phenotype
a) Analysis of relative increase of metabolic activity via MTT-Assay, normalized to each starting point , ***p<0.001 for M1 and **p<0.01 for M2 and M3 compared to MCtrl, N=4, two-way ANOVA with Dunnett’s multiple comparison b) Treatment with 1 µM doxorubicine for 48h and analysis of viability as by CTG assay , N=6, ****p<0.0001 compared to Ctrl, two-way ANOVA with Bonferroni’s multiple comparison) c) Analysis of colony forming abilities via the clonogenic assay shows a significantly higher colony area in the KOs after seven days of incubation, student’s t-test, p<0.05, N=3/9, images in Supplement S 7d) Single cell tracking measurement for evaluation of migratory potential, displayed as accumulative distance after 20 h, N=30, ****p<0.0001, *p<0.05 compared to MCtrl, one-way ANOVA with Dunnett’s multiple comparison after outlier test, velocity displayed in S6).
Figure 13 - Summary of important pathways and biological phenotypes, with targets from Tables
1-3 matched to the known functions
3. A proteomic analysis of an in vitro knock-out of miRNA-200c
Dissertation - Bojan Ljepoja | 42 |
Taken together, our results show that miR-200c plays a crucial role in cancer
progression, by modulating the protein expression leading to a change of fundamental
physiological properties, i.e. increasing metabolism and proliferation, the induction of
EMT and enabling cell migration as well as increasing chemoresistance (Figure 13).
3. A proteomic analysis of an in vitro knock-out of miRNA-200c
Dissertation - Bojan Ljepoja | 43 |
3.4. Discussion
Recent publications on the role of miR-200c in cancer progression and metastasis28,74
point towards a multilayered and complex interplay92, also involving other numerous
pathways like angiogenesis and therapy resistance72,93. These facts emphasize the
need to utilize more comprehensive tools like genomics and proteomics, as key to
generate novel insights. With the genomic knock-out, followed by proteome analysis,
we chose two state-of-the-art techniques to investigate new modes of action of
miR-200c.
While knock-outs of protein coding genes are quite common, the genetic disruption of
non-coding regulatory RNAs is still rarely reported. CRISPR/Cas9 is probably the most
frequently utilized genome-editing technology at this time, nevertheless this tool’s main
disadvantage lies in the tendency to off-target cleavage29,84. Also, the need of a
PAM-sequence may impede certain knock-out strategies, especially when site-specific
mutations are necessary. While different modifications were performed to enhance
Cas9’s specificity, like the conversion to the Cas9n nickase-mutant or rational design
of the nuclease87,94, TALENs offer high specificity from the beginning, as was also
demonstrated by successful use in a first human patient95. Therefore, in our experiment
we chose to utilize TALENs, allowing us to specifically target the miRNA’s drosha
processing site30,88. The genetic disruption in the drosha site minimizes the risk of
inducing a mutation in the seed region, which could lead to the generation of a new,
artificial miRNA with unpredictable off-targets. Kim et al. provided the pre-designed
TALENs-plasmids, and previously showed that a mutations of the drosha processing
site leads to a decrease in miR-expression. Further, the group was able to verify the
KO-strategy for miR-200c by demonstrating effects of the miR-200c KO in the
Her2-positive SK-BR-3 cell line, like an increase of the miRNA’s seed-targets via a
motif enrichment analysis and decreased proliferation88.
In our work, we were able to generate mutations in both alleles of miR-200c in three
independent clones, namely M1, M2 and M3, as well as one clone with a heterozygous
mutation, i.e. MCtrl. As miR-200c family members share most of their sequence and
were reported to have similar functions72,73, and as the knock-out of a gene can induce
compensation effects96, it was necessary to analyze the expression of the family
members after the knock-out of miR-200c. The measurements emphasize the general
importance of miR-200c among its family members in this cell line, as the levels are
about 20-fold higher than the average miR-200c-family members. No significant
3. A proteomic analysis of an in vitro knock-out of miRNA-200c
Dissertation - Bojan Ljepoja | 44 |
transcriptional compensation of any other family member was observed. In MCtrl the
compensation of the loss of one-allele could be based on a higher transcription rate of
the polycistronic unit, which would result in higher levels of miR-141. However, the
observed increase in miR-141 expression is not significantly higher and does not
correlate with the increase needed for the compensation of the loss of one allele of
miR-200c needed. These findings together suggest a different compensatory
mechanism in MCtrl, like inhibited degradation or changes in the miRNA processing of
miRNA-200c. Still, it is not clear whether the basal expression levels of miR-200b and
miR-429, which share the same seed region as miR-200c, could suffice for the
regulation of certain targets and pathways.
Only few miRNA-knock-outs, especially with TALENs, were described before97 98, but
the subsequent target analysis has been mainly based on genomic approaches. The
protein expression profile analysis therefore may reveal important novel information
about the regulation network of miRNA-200c. In the proteomic approach, three
knock-out clones were analyzed and compared to both: the wild-type cells as well as
MCtrl with a heterozygous mutation. The later was chosen, as the expression level of
miR-200c was not significantly changed, and the clone went through the same
procedures as the miR-200c KOs. Therefore, it served as an appropriate control, to
rule out expression changes based solely on selection and introduction of TALENs
proteins.
The PCA underlines the similarity of MCtrl to the wild type, prompting us to regard both
as control groups. Moreover, a clustering analysis shows a close correlation between
the replicas, as well as a tendency towards grouping the KO clones close together.
This indicates that the knock-out of miR-200c does not lead to dramatic changes in the
proteome, but to a surgical change in key elements and pathways, which are important
for tumorigenesis.
For a comprehensive overview of changed expression patterns, we utilized two
independent bioinformatic methods. While the DAVID analysis is based on p-value
pre-filtered set of proteins, analyzing gene ontology annotations on a broad level, the
GSEA-Tool generates results due to a list-walk enrichment scoring analysis. Both
analyses showed similar results, while used for a different purpose. One aim was to
investigate pathways that are attributed to miR-200c expression and are involved in
previously described physiological processes in cancer, like change in metabolic
processes, EMT99,100 and resistance to chemotherapeutics27. The DAVID Analysis
3. A proteomic analysis of an in vitro knock-out of miRNA-200c
Dissertation - Bojan Ljepoja | 45 |
enabled a global understanding of process-changes attributed to a small set of
differentially regulated proteins, revealing changes in metabolism and cellular
organization in general. With the GSEA, we were able to analyze certain crucial
pathways in cancer in detail, revealing changes in cancer progression and metastasis.
This is shown by enrichments in pathways increasing metabolic activity, loss of cell
cycle regulation and actin cytoskeleton as well as cell-cell contacts. These findings,
based on changes of protein expression were successfully correlated to phenotypes
of the cells after the KO. After eradication of miR-200c expression, the cells showed
increased migration, which could be attributed to changes in focal adhesion and
cellular interaction. Also, increased NADP(H) turnover, as measurement of
proliferation and metabolic activity is observed in the KO clones, which may also
contribute to the increased resistance to doxorubicine treatment. The latter can also
be caused by an increase of detoxification and the evasion of apoptosis.
While we do see changes in pathways and targets involved in cell motility and
morphology as well as a changed phenotype towards more migratory cells, common
EMT markers like vimentin were not found and E-cadherin expression was unchanged.
Epithelial MCF7 cells express low levels of ZEB1/2, as was confirmed previously101.
Our data suggests that the miR-200c KO as such does not lead to an activation of
ZEB1/2 and eventually to a decrease of E-cadherin. This may be due to the poised
chromatin structures102 and not due to a persistent down-regulation via miR-200c. Our
data suggests that miR-200c has additional effects on the cytoskeletal organization
besides the ZEB1/2 axis, as was also proposed before 103.
In more detail, the analysis of 675 proteins showed significant differential expression
in 21 proteins in total, nine of those to a high extend in all three biological replicas.
None of the obtained targets shown in Tables 1-3 was published to be regulated by
miR-200c before. Comparing a list of confirmed miR-200c targets72 to our whole
proteomics dataset, we found only 1 of 37 to be present, i.e. PRDX2. This protein
displayed no significant differential expression in our analysis. The lack of prominent
miR-200c targets in our tables may be based on different cell line models, as well as
different analytical and experimental approaches used in the studies. Our proteomic
approach as method does not allow gathering information of the whole proteome. Still,
in this case the analysis of protein expression compared to a transcriptomic method
may be beneficial, due to mainly translational changes which are expected after a
miRNA KO. Nevertheless, on the basis of our data, it cannot be excluded that certain
3. A proteomic analysis of an in vitro knock-out of miRNA-200c
Dissertation - Bojan Ljepoja | 46 |
family members may facilitate the regulation of certain proteins, without changing their
own expression. Even low expression of miRNAs may be enough to regulate
translation, especially for low abundant proteins which often cannot be detected
appropriately in proteomics approaches.
The regulatory mechanisms of miR200c seems to be different in our model cell line
MCF7. MCF7 cells show high expression of miR-200c and as miRNA-inhibition is not
very common this cell line model is not frequently used in miR-200c research.
Consequently, most published miR-200c targets were unraveled in other cellular
systems. Additionally, the KO of an inhibitor leads to different results than the
addition/overexpression of it, which was performed in the majority of the published
studies. In a KO only physiologically direct targets and corresponding downstream
effects become obvious while other inhibitory mechanisms (e.g. DNA methylation) are
not affected in our settings and thus these potential miR-targets display no altered
expression.
Moreover, we were analyzing a KO which is a longterm effect and might display
different changes than those observed in transient overexpression or inhibition models.
Transient experiments additionally may lack compensatory mechanisms.
While transient inhibition of miR-200c has revealed several functions in breast cancer,
the long-term disruption of the gene may be more similar to the setting in a tumor.
Of note, it was shown that miR-200c expression can be lost due to locus methylation,
leading to more aggressive breast cancer phenotypes104. With our approach we were
able to discover novel targets which are truly governed by miR-200c in MCF7 cells and
might play crucial roles in normal cellular settings.
Based on the information from the GO-Database, these targets were allocated to their
main biological function: Most of the proteins play a role in cellular processes involving
the cytoskeleton, metabolism and detoxification. This supports previous studies of
miR-200c’s function in EMT, proliferation and chemoresistance27,28,99,100, while
All clones were seeded triplicates in a concentration of 5000 cells / well in four identical
96-well plates. The cells were treated with 10µl of 5 mg/ml MTT (Sigma Aldrich) at the
timepoints 0h (about 2h after seeding) and 24h, 48h and 72h later respectively. The
plates were incubated for 2h at 37°C and stored at -80°C over night. Afterwards100µl
DMSO (Sigma Aldrich) were added and incubated for 37°C for 30mins, while shaking.
Measurements were performed with the Spark 10M (TECAN).
Live cell imaging and 2D migration
Live Cell Imaging was performed using a Nikon Eclipse Ti Inverted Microscope (Nikon,
Düsseldorf, Germany). Cells were kept under constant 37°C, 5% CO2 and 80%
humidity by the heating and incubation system from Ibidi (Martinsried, Germany).
Imaging was performed with the 10x phase contrast objective. For the 2D migration
experiments 8-well slides (Ibidi, Martinsried, Germany) were coated with 50 µg/ml
fibronectin for 1 h, afterwards cells were seeded in a density of 25x103/well, and were
allowed to attach to the coated surface for 2 h. Cell Displacement was imaged every
10 min over 20 h in all settings. For analysis of movement, single cells were tracked
manually using ImageJ Manual Tracking Plugin. Acquired trajectories in 2D were
3. A proteomic analysis of an in vitro knock-out of miRNA-200c
Dissertation - Bojan Ljepoja | 53 |
further analyzed for mean velocity using Ibidi Chemotaxis and migration tool,
afterwards an outlier-analysis was performed by the Identify outliers tool of Prism
GaphPad.
Clonogenic assay
1000 cells were seeded in a 6-well plate (TPP, Switzerland), and grown for 7 days,
fixed and stained with paraformaldehyde (PFA) containing crystal violet (Sigma).
Survival colony were analysed by ImageJ ColonyArea
Doxorubicine resistance
All clones were seeded in a concentration of 5000 cells per well in 96 well plates. 24h
after seeding, cells were treated with 1 µM Doxorubicine for 48h (Sigma Aldrich, stock
10mM in DMSO). Analysis of viability was performed via Celltiter-Glo assay (Promega)
and normalized to DMSO control.
Statistical analysis
Results are expressed as the mean ± SD of at least three biological replicas, if not
stated otherwise. Software GraphPad Prism v6 and SigmaPlot 11 were utilized for the
analysis of the data. For analysis of miR-200c expression (only one variable and more
than two groups), the One Way Analysis of Variance test was used, followed by the
two tailed Bonferroni´s multiple comparison test, with DF = 4. For analysis of all family
members (two variables and more than two groups per variable), the Two Way
Analysis of Variance test was used, followed by two tailed Bonferroni´s multiple
comparison test with DF = 16. For analysis of family expression between early and late
passage (three variables and more than two groups per variable) we used the Three
Way Analysis of Variance test, followed by two tailed Bonferroni´s multiple comparison
test, with DF = 12
Data availability
The data that support the findings of this study are available from the corresponding
author upon reasonable request.
3. A proteomic analysis of an in vitro knock-out of miRNA-200c
Dissertation - Bojan Ljepoja | 54 |
3.6. Supplemental information
Supplement S 1
Clustering analysis of the measurements after vertical and horizontal z-score normalization
Supplement S 2
Venn-diagramm with results of the vulcano blot analysis of M1 or M2 or M3 vs (MCF7 and MCtrl) each N=675 with 250 randomizations, FDR 0.05 and S0 of 0.1 as shown in Table 2
3. A proteomic analysis of an in vitro knock-out of miRNA-200c
Dissertation - Bojan Ljepoja | 55 |
Supplement S 3
Detailed results of Figure 10F, with mRNA measurements compared to the protein expression data for each clone
3. A proteomic analysis of an in vitro knock-out of miRNA-200c
Dissertation - Bojan Ljepoja | 56 |
Supplement S 4
Heatmaps corresponding to the Enrichment blots in Figure 11c
Supplement S 5
Heatmaps corresponding to the Enrichment blots in Figure 11d
3. A proteomic analysis of an in vitro knock-out of miRNA-200c
Dissertation - Bojan Ljepoja | 57 |
Supplement S 6
Evaluation of migration data in Figure 12b (N=30, *p<0.05, one-way ANOVA with post-hoc Bonferroni’s multiple comparison)
Supplement S 7
Clonogenic assay – imaging of colonies, as evaluated in the pooled analysis in Figure 12d
Supplement S 8
qPCR measurements of E-Cadherin mRNA levels in Ctrl vs KOs shows no significant difference
3. A proteomic analysis of an in vitro knock-out of miRNA-200c
Dissertation - Bojan Ljepoja | 58 |
Supplemental Table S 1 15 / 32 gene sets are enriched in phenotype KO
NAME SIZE ES NES NOM p-val FDR q-val FWER p-val RANK AT
3. A proteomic analysis of an in vitro knock-out of miRNA-200c
Dissertation - Bojan Ljepoja | 59 |
Supplemental Table S 3 Overview of predicted transcription-factor binding sites
Dissertation - Bojan Ljepoja | 60 |
4. Inducible miRNA-200c decreases motility of breast cancer cells
and reduces filamin A
The following sections are directly adapted from the original manuscript.
Inducible microRNA-200c decreases motility of breast cancer cells and
reduces filamin A
Bojan Ljepoja1, Christoph Schreiber2, Florian A. Gegenfurtner3, Jonathan García-
Roman1, Stefan Zahler3, Joachim O. Rädler2, Ernst Wagner1, Andreas Roidl1*
In Submission
1Pharmaceutical Biotechnology, Department of Pharmacy, Ludwig-Maximilians-
Universität München, Munich, Germany
2Faculty of Physics and Center for NanoScience, Ludwig-Maximilians-Universität
München, Munich, Germany
3Pharmaceutical Biology, Department of Pharmacy, Ludwig-Maximilians-Universität
München, Munich, Germany
Contributions:
BL performed the experiments and wrote the paper. CS performed the 1D migration
assays and wrote the paper. FAG performed the imaging experiments and wrote the
paper. JGR generated the TRIPZ-constructs and performed the transcription factor
analysis. SZ, JOR and EW provided conceptual advice. AR conceived the study and
wrote the manuscript. All authors commented on the manuscript and conclusions of
this work.
4. Inducible miR-200c decreases motility of breast cancer cells and reduces filamin A
Dissertation - Bojan Ljepoja | 61 |
4.1. Abstract
Cancer progression and metastases are frequently related to changes of cell motility.
Amongst others, the microRNA-200c (miR-200c) was shown to maintain the epithelial
state of cells and to hamper migration. Here, we describe two miR-200c inducible
breast cancer cell lines, derived from miR-200c knock-out MCF7 cells as well as from
the miR-200c-negative MDA-MB-231 cells and report on the emerging phenotypic
effects after miR-200s induction. miRNA-200c expression appears to cause. The
induction of miR-200c expression seems to effect a rapid reduction of cell motility, as
determined by 1D microlane migration assays. Sustained expression of miR200c leads
to a changed morphology and reveals a novel mechanism by which miR-200c
interferes with cytoskeletal components. We find that filamin A expression is
attenuated by miRNA-200c induced downregulation of the transcription factors c-Jun
and MRTF/SRF.This potentially novel pathway that is independent of the prominent
ZEB axis could lead to a broader understanding of the role that miR200c plays in
cancer metastasis.
4. Inducible miR-200c decreases motility of breast cancer cells and reduces filamin A
Dissertation - Bojan Ljepoja | 62 |
4.2. Introduction
Metastasis, i.e. the nesting of tumor cells in adjacent tissues and even distant organs,
is one of the most malicious aspects of cancer, causing nine out of ten cancer
deaths 126. While primary tumors often can be treated well, the uncontrollable spread
of cancer cells remains a major challenge in most clinical settings. One prevalent
example for risks of metastatic cancers are tumors of the breast, which show a clear
association between metastasis and survival of patients 127,128. While the primary
breast carcinomas show rather good resectability due to their location, the cancer often
has reached distant organs before the primary tumor was detected. Progress in
understanding the disease has been made by identifying certain subtypes of breast
tumor cells which inherit particularly high metastatic potentials 129. However, current
studies show a rise in incidence of metastatic breast cancer 130. Therefore, still more
and deeper insights into the key regulators of migratory and metastatic processes are
needed.
Epithelial to mesenchymal transition (EMT) is often regarded as one of the most
important steps in the initiation of migration and thus the onset of invasion and
metastasis of tumors 131-133. While EMT can be influenced by multiple cellular
processes, RNA interference by microRNAs (miRNAs) was shown to be a direct and
important regulatory mechanism 63.
In general, miRNAs are small, non-coding RNAs, influencing the translation of multiple
fundamental cellular processes like metabolism, proliferation and cellular organization.
Even small changes in miRNA expression patterns can have tremendous impact on
the cell fate and can prompt towards various malignancies or even be the root cause
of those 65,69,70. One miRNA family with important implications in cancer is the miR-200
family, consisting of miR-200a, miR-200b, miR-141, miR-429 and miR-200c. While all
members have demonstrated effects in the regulation of cancer processes, miR-200c
is the family member which unifies well investigated associations in the most important
cancer pathways, like the inhibition of chemoresistance27,134,135, regulation of metabolic
activity28,67,72 and also in epithelial-to-mesenchymal transition (EMT) and thus
potentially cancer cell metastasis 26,27,72,74,92,99.
MiR-200c’s role in the regulation of EMT is based on its stabilizing effect on the
expression of E-cadherin by preventing the inhibition of E-cadherin by ZEB1 and ZEB2
(Zinc finger E-box-binding homeobox members1 and 2). Previous studies have shown
that the introduction or re-expression of miR-200c in vitro reverses the mesenchymal
4. Inducible miR-200c decreases motility of breast cancer cells and reduces filamin A
Dissertation - Bojan Ljepoja | 63 |
phenotype of cancer cells, i.e. leading to EMT reversion, termed MET (mesenchymal
to epithelial transition) 74,99.
Although EMT may be one of the main pathways of metastasis induced by the loss of
miR-200c, the metastatic capabilities of tumor cells also rely on multiple other
mechanisms. Interestingly, miR-200c was shown to influence other migratory
pathways, for example by regulation of fibronectin secretion and moesin expression or
by targeting the SRF-regulating proteins FHOD1 and PPM1F 26,100,103.
To further investigate the function of miR-200c as regulator of both, ZEB-dependent
as well as independent mechanisms, we generated a genomic knock-out (KO) of
miR-200c in MCF7 breast cancer cells in our previous work 136. The resulting KO
phenotype showed increased migration, even of the epithelial and usually
low-migrating MCF7 cells. A pooled proteomic analysis revealed a number of common
differentially regulated proteins, half of which are attributed to the regulation of
migratory processes. From this set of proteins, novel players were chosen for further
investigation. One protein of particular interest was Filamin A, a member of the filamins
protein family that are known building blocks of the cytoskeleton and involved in many
cellular and migratory processes 137. Filamins, and especially filamin A, function as
important actin filament crosslinkers, thereby facilitating actin-actin interactions, but
also actin-connections to membrane bound proteins and intracellular signaling
macromolecules 137,138 and previous studies described the role of filamin A in the
regulation of cell migration 139. However, a systematic study of miRNA-200 mediated
expression of filamin A and concomitant changes in migration has not yet been carried
out.
In this study, we generated two different inducible miR-200c breast cancer cell line
models, derived from mesenchymal MDA-MB-231 cells or the miR-200c knock-out of
the epithelial MCF7 cells, respectively. By doxycycline induction, we investigated the
effect of increased miR-200c expression on morphological changes and motility. We
used a micro-pattern based 1D migration assay, as described previously by Schreiber
et al. 140 to get a multiparameter quantification of cell motility. We also found strong
indications of a regulatory network of miR-200c and FLNA in both breast carcinoma
models. This pathway, which is independent of the ZEB-expression of the cells, may
point towards an important further function of miR-200c in impeding cancer metastasis.
4. Inducible miR-200c decreases motility of breast cancer cells and reduces filamin A
Dissertation - Bojan Ljepoja | 64 |
4.3. Results
4.3.1. The migratory potential of MDA-MB-231 cells decreases after
miRNA-200c induction
To investigate the effect of miRNA-200c induction on the metastatic potential of cells,
we performed an in-depth analysis of single cell migration.
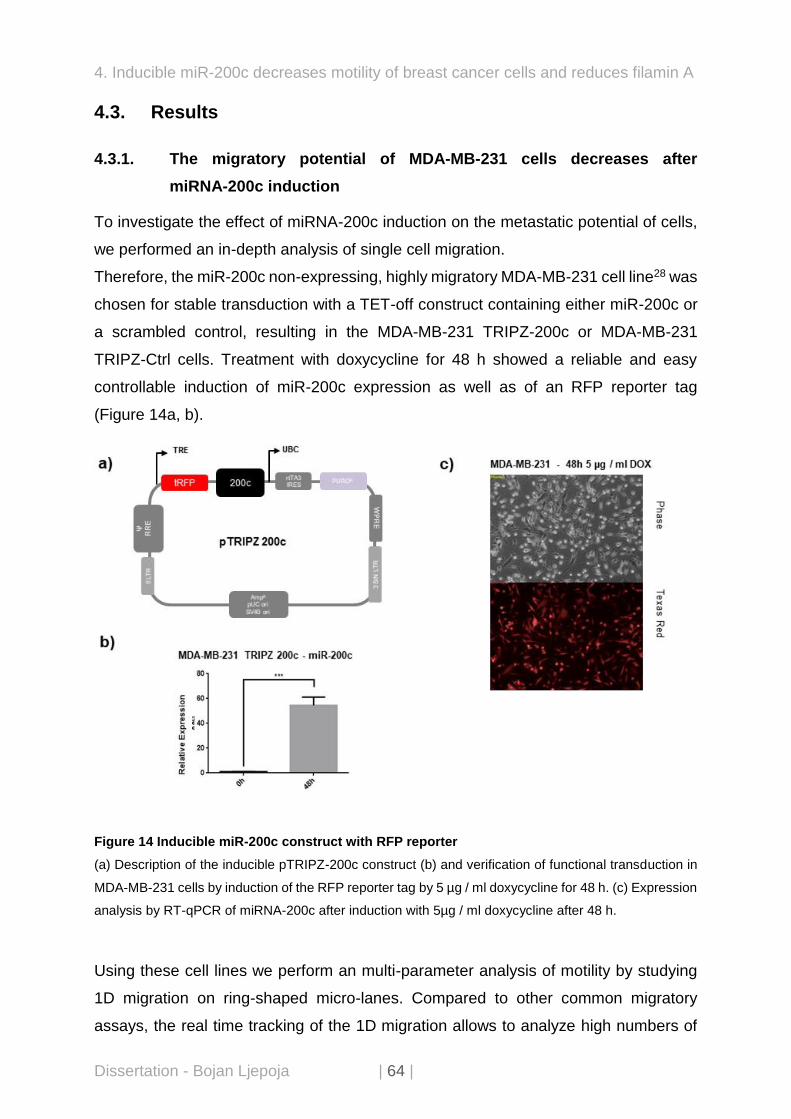
Therefore, the miR-200c non-expressing, highly migratory MDA-MB-231 cell line28 was
chosen for stable transduction with a TET-off construct containing either miR-200c or
a scrambled control, resulting in the MDA-MB-231 TRIPZ-200c or MDA-MB-231
TRIPZ-Ctrl cells. Treatment with doxycycline for 48 h showed a reliable and easy
controllable induction of miR-200c expression as well as of an RFP reporter tag
(Figure 14a, b).
Figure 14 Inducible miR-200c construct with RFP reporter
(a) Description of the inducible pTRIPZ-200c construct (b) and verification of functional transduction in
MDA-MB-231 cells by induction of the RFP reporter tag by 5 µg / ml doxycycline for 48 h. (c) Expression
analysis by RT-qPCR of miRNA-200c after induction with 5µg / ml doxycycline after 48 h.
Using these cell lines we perform an multi-parameter analysis of motility by studying
1D migration on ring-shaped micro-lanes. Compared to other common migratory
assays, the real time tracking of the 1D migration allows to analyze high numbers of
4. Inducible miR-200c decreases motility of breast cancer cells and reduces filamin A
Dissertation - Bojan Ljepoja | 65 |
cells and to assess a migratory fingerprint, i.e. cell velocity, cell persistence, cell resting
times, cell run times and the run fraction, at the single cell and population level.
For this purpose, cells were seeded on arrays of fibronectin-coated ring micropatterns
and were observed using time-lapse microscopy (Figure 15 a, b). We found that the
1D cell motion is divided into distinct run states, where cells move persistently in one
direction, and rest states with no or random wiggling motion140 (Figure 15c). This two
state analysis results in characteristic parameters quantifying cell motility (Figure 2d).
By discriminating between run and rest states we make sure that the velocity is only
evaluated when cells are actually migrating (𝑣run). Furthermore, we analyze the typical
lifetime of run and rest states 𝜏run and 𝜏rest, which are exponentially distributed. This
allows distinguishing between the stability of the run state, given by 𝜏run and the ability
of cells to establish polarization indicated by 𝜏rest. For a comprehensive overview of
the different motility parameters, spider-plots were generated (Figure 15e, f). As
expected, the doxycycline induction in the MDA MB-231 TRIPZ-Ctrl cells showed no
significant effects compared to the uninduced cells, while miR-200c induction distinctly
changed the migratory behavior of the cells. The run velocity and the typical duration
of a run state were significantly decreased whereas the typical duration of a rest state
was increasing. The strongest effect was observable in the fraction of time that cells
spent in the run state, 𝑃run, which decreased by a factor of three. Thus, induction of
miR-200c expression affects the polarization of cells leading to longer rest states and
a decreased persistence of the run states. To show that the decrease of persistence
of the cell motion was also visible without the division into run and rest states we
evaluated the persistence path q, which is given by the effective maximum
displacement of a cell divided by the actual length of the trajectory, as described in
Maiuri et al. 141. The described effects are visualized in a sample of a Ctrl vs a miR-200c
induced cell, as shown in the supplemental movie 1 (SM1). On single cell level, a broad
distribution of run velocities and a huge variance in the fraction of time spent in the run
state was observed (Figure 15g). With increasing miR-200c expression, the distribution
narrowed, and the average velocity was decreasing as well as the time cells spent in
run states. Furthermore, the fraction of cells that remained in the rest states for the
time of the whole experiment increased by almost a factor of three.
Taken together, our data show that the induced miR-200c expression resulted in a
reduced motility in all five migratory parameters and, hence, an overall decreased
migratory potential. The observed process must be independent of the well
4. Inducible miR-200c decreases motility of breast cancer cells and reduces filamin A
Dissertation - Bojan Ljepoja | 66 |
investigated miR-200c and ZEB1/2 induced EMT mechanisms 99; due to the fact that
MDA-MB-231 cells are not expressing E-cadherin 101,142,143.Our findings therefore
suggest a novel mode of miR-200c acting on migration.
Figure 15 - miR-200c induction decreases migration of MDA-MB-231 cells as shown in the 1D
migration assay (description next page)
4. Inducible miR-200c decreases motility of breast cancer cells and reduces filamin A
Dissertation - Bojan Ljepoja | 67 |
(a) Phase contrast images of a MDA-MB 231 cell migrating on a ring shaped micro-lane. The ring is coated with fibronectin (edges marked in white) the surrounding is passivated with PEG. The scale bar is 20 µm. (b) Array of ring shaped micro lanes. Only rings that are occupied by one single cell are evaluated. (ring diameter 150 µm) (c) Angular position of one exemplary cell over time with classification into run and rest states. (d) Drawing of a cell track. Cell motion can be separated in run states with ballistic motion and rest states with random motion. The characteristic duration of run and rest states τ_run ,τ_rest as well as the velocity in the run state v_run are evaluated. (e, f) Multi-parameter analysis of cell motility of cell populations. Motility of cells is measured 48h after induction with 5 µg / ml doxycycline (red). For MDA-MB-231 TRPZ-200c cells (f) a clear reduction of cell motility can be seen in all of the 5 parameters compared to no induction (grey). For MDA-MB-231 TRPZ-Ctrl cells (h) no big effects on motility are observed with adding doxycycline. N is the number of cells analyzed. (g) Single cell analysis of P_run and v_run for the data shown in e, f) where each dot represents a single cell. One cell population is spread over a large range of velocities and fraction of time in the run state. Induction of miR 200c is causing a shift to slower velocities and less time spent in the rest state. (error bars in g and h indicate standard errors exept for τ_run ,τ_rest where it’s CI of 99% of the fit)
4. Inducible miR-200c decreases motility of breast cancer cells and reduces filamin A
Dissertation - Bojan Ljepoja | 68 |
4.3.2. MiRNA-200c induction changes the 3D morphology
As a decrease in migration often correlates with changes of the cytoskeleton, we
investigated how miR-200c affects the cellular morphology. Hence,
immunofluorescence imaging and analysis of the cellular shape was performed. Figure
16a shows a comparison of the actin-structure of MDA-MB-231 with either the Ctrl or
the miR-200c construct stimulated with doxycycline for 72 h. While the TRIPZ-Ctrl cells
maintained their mesenchymal, spindle-like shape, the miR-200c induction changed
the cellular profile towards rounder, uniformly dilated cells as seen in the significant
difference of the ratio of widest vs. longest spread of the cell. The three-dimensional
shape of the cells was investigated by taking z stacks of confocal images of actin and
filamin. Figure 16b and c show the 3D images with color coding for hight. In line with
the previous results, the TRIPZ-Ctrl cells retained their spindle-like structure, after 72h
and 168h of doxycycline stimulation. The miR-200c induction caused a gradual
transition towards rounder and morphologically flatter cells over time, eventually
resulting in evenly flat “pancake” like shape. For better visualization, these effects are
presented in a 3D rendering animation of the stacks, shown in the supplemental
movies (SM2 Ctrl and SM3 miR-200c). These results together show a strong effect of
miR-200c induction on the cellular shape.
4. Inducible miR-200c decreases motility of breast cancer cells and reduces filamin A
Dissertation - Bojan Ljepoja | 69 |
Figure 16 - Overexpression of miR-200c induced fast morphological changes in MDA-MB-231
cells
(a) Fluorescence staining of the cytoskeleton by Phalloidin (red) and nuclei (blue) in MDA-MB-231 decreased spindle-like phenotype after induction miR-200c, as shown by significant changes in the shape factors (N= 30; error bars are SD; *** p > 0.001). (b,c) Renderings of stacked immunofluorescence images of MDA-MB-231 showed decreased mesenchymal shape in 3D after induction of miR-200c for (b) 72 h as well as (c) further increased effects after 168 h compared to included controls. (d) Distribution of filamin A in a central cross section after induction with miR-200c for 72 h and 168 h as compared to induced control
4. Inducible miR-200c decreases motility of breast cancer cells and reduces filamin A
Dissertation - Bojan Ljepoja | 70 |
4.3.3. Changed expression of FLNA is observed after a miRNA-200c knock-
out and overexpression
A proteomic analysis of a genomic knock out (KO) of miR-200c in MCF7 breast cancer
cells was previously reported by our group 136. There, we showed that more than 50%
of all differentially expressed proteins were affiliated to migratory processes (Figure
17a). Out of these proteins, filamin A was one of the prominent and promising targets
and therefore chosen for further analysis in this study. To study the biological effect of
miR-200c on FLNA the inducible MDA-MB-231 TRIPZ-200c or TRIPZ-Ctrl cells were
utilized. In line with studies of the MCF7-200c-KO cells the inverse effects regarding
filamin A expression were observed after induction of miR-200c. Here, the mRNA
levels of FLNA decreased to 30% and protein expression to 40% compared to
doxycycline stimulated TRIPZ-Ctrl cells (Figure 17b, c). Additionally, an
immunofluorescence staining of filamin A was performed in both cell line models. i.e
the MCF7-200c-KO and the MDA-MB-231 TRIPZ-200c. The KO of miR-200c in MCF7
resulted in increased cellular expression of filamin A (Figure 17d), while induction of
miR-200c in MDA-MB-231 TRIPZ-200c cells resulted in decreased filamin A protein
expression (Figure 17e). Taken together, miR-200c expression showed an indirect
proportional relation to filamin A protein as well as mRNA in two complementary breast
cancer cell line models.
Figure 17 miR-200c regulates migration associated genes such as filamin A (next page)
(a) A proteomic analysis of a TALENs knock-out (KO) of miR-200c in MCF7 cells revealed a set of proteins with differential expression, of which 50% are involved in migratory processes and are shown in the table. (RT qPCR showed that after adding 5 µg / ml doxycycline for 48 h the expression of FLNA mRNA (b) as well as filamin A protein(c)(normalized to tubulin) decreased significantly in MDA-MB 231 TRIPZ 200c cells. (d) Immunofluorescence staining of filamin A (green) and DAPI (blue) in MCF7 Ctrl and KO 200c showed significantly increased relative intensity of filamin A, in contrast to (e) the MDA-MB-231 cells which showed a strong decrease in filamin A intensity after induction of miR-200c (all N=3; error bars indicate standard deviation SD; * p < 0.05, ** p < 0.01, *** p < 0.001, **** p > 0.0001)
4. Inducible miR-200c decreases motility of breast cancer cells and reduces filamin A
Dissertation - Bojan Ljepoja | 71 |
4. Inducible miR-200c decreases motility of breast cancer cells and reduces filamin A
Dissertation - Bojan Ljepoja | 72 |
4.3.4. MiRNA-200c is regulating FLNA expression via JUN and MRTF-SRF
To further investigate the mechanism of miR-200c dependent regulation of FLNA, a
rescue of miR-200c expression in the MCF7-200c-KO cells was performed, by stably
introducing the inducible TRIPZ-200c plasmid. As expected, the induction successfully
re-expressed miR-200c and consequently decreased FLNA mRNA (Figure 18a, b).
As no miR-200c binding site was predicted in silico in the FLNA 3’UTR, other regulatory
mechanisms were investigated. First, a promotor analysis was performed, in order to
determine transcription factors (TFs) which are potentially regulating FLNA expression
and contain an in silico predicted miR-200c binding-site (Figure 18c). Four of those
TFs were identified by RT-qPCR screening after miR-200c induction in MDA-MB-231
cells (Supplement S 9), but a reproducible decrease in expression of these TF was
solely detected for JUN (Figure 18d). This result was confirmed in the miR-200c
inducible MCF7 KO cells (Figure 18e).
To investigate the effect of JUN on FLNA expression, a siRNA knockdown of JUN was
performed in wild type MDA-MB-231 as well as in MCF7 cells and compared to
scrambled control siRNA. In both cases, the reduction of JUN mRNA also decreased
FLNA mRNA expression (Figure 18f, g), with stronger relative effects in MCF7 cells
than in MDA-MB-231.
Thus, we suggest JUN as a direct target of miR-200c and as putative regulator of FLNA
expression.
Another possibility of miR-200c regulating FLNA is via SRF and MRTF. It was shown
previously that miR-200c regulates SRF and MRTF103, and also a regulation of FLNA
by SRF was predicted in previous studies 144. Thus, we tested the hypothesis that miR-
200c is able to regulate FLNA via the MRTF/SRF axis by transiently introducing
pgl4.34, a luciferase reporter for MRTF-dependent SRF activation, into both miR-200c
inducible cellular systems. Here, a decrease in luciferase signal upon miR-200c
expression was observed in both, MDA-MB-231 and MCF7 cells, compared to their
respective doxycycline treated controls (Figure 18h, i). These results suggest a
regulatory relation between miR-200c and FLNA based on the two different
mechanisms, i.e. via transcriptional repression of filamin A through reduced JUN and
the regulation by MRTF/SRF (Figure 18j).
4. Inducible miR-200c decreases motility of breast cancer cells and reduces filamin A
Dissertation - Bojan Ljepoja | 73 |
Figure 18 - Filamin A is regulated by miR-200c by repression of JUN as well as SRF-MRTF (next
page)
(a) After introduction of the TRIPZ-200c construct into MCF7 200c KO cells, miR-200c was re-expressed by 48 h of DOX induction and showed (b) significantly decreased FLNA expression. (c) In silico analysis of the FLNA promotor revealed 6 transcription factors which have a potential miR-200c binding site. (d) The expression of JUN was significantly decreased 48 h after induction of miR-200c in MDA-MB-231 as well as (e) re-expression in MCF7 compared to the respective TRIPZ-Ctrl cell line. (f, g) Decreased expression of FLNA was verified in MDA-MB-231 and MCF7 after transient transfection with siRNA against JUN (siJUN), compared to scrambled siRNA control (h, i) Induction of miR-200c for 48 h decreased the luciferase signal of a MRT-SRF reporter construct in MDA-MB-231 TRIPZ-200c as well as MCF7 TRIPZ-200c compared to their respective TRIPZ-Ctrl. (j) An alternative mechanism of miR-200c regulation of FLNA is based on reducing the MRT dependent SRF activation as well as the transcription factor jun. (all N=3; error bars are SD; * p < 0.05, ** p < 0.01, *** p < 0.001, **** p > 0.0001)
4. Inducible miR-200c decreases motility of breast cancer cells and reduces filamin A
Dissertation - Bojan Ljepoja | 74 |
4. Inducible miR-200c decreases motility of breast cancer cells and reduces filamin A
Dissertation - Bojan Ljepoja | 75 |
4.4. Discussion
miR-200c is a well-established player in different types of cancer, often described as
guardian over multiple cancer promoting pathways like metabolic activity and
proliferation28,67,72, resistance to chemotherapeutics 27,134,135 , and inhibition of
migration and EMT 26,72,74,92,99.
In different clinical studies the miR-200c expression correlated with decreasing spread
of tumors and better treatability of some cancers, as shown in different studies for
patients with breast cancer26,77,82. In the current literature, miR-200c’s effect on
metastasis is mainly attributed to the process of EMT, based on preventing ZEB1/2
mediated inhibition of E-cadherin expression and thereby inhibiting the transition of
epithelial cells to the mesenchymal phenotype74,99,104. Still, miRNA-200c has shown
effects on migration of cell lines, which do not express the genetic axis of
ZEB-mediated E-cadherin regulation. One issue in the investigation of additional
migratory effects of miR-200c lies in distinguishing novel functions from effects based
on the prominent ZEB/E-cadherin axis. Therefore, our approach has based on the
utilization of two different breast cancer cell lines (MCF7 and MDA-MB-231) which, due
to epigenetic predispositions101,142,143, ensure absence of ZEB/E-cadherin based
effects. Proteomic analysis of a genomic miR-200c KO in MCF7, a high miR-200c
expressing epithelial cell line28 emphasized the importance of miR-200c in migratory
processes 136.
In this study, we show the influence of miR-200c on migration based on two “gain of
function” cell line models. First, mesenchymal and migratory MDA-MB-231 cells, which
lack expression of miR-200c as well as E-cadherin, were transduced with a doxycycline
inducible miR-200c expression construct (TRIPZ-200c). This approach ensured to
minimize negative effects of transfections on the one hand, and on the other hand
allowed for the efficient expression of miR-200c on a long-term scale, rendering the
observation of slower processes in cellular remodeling possible. Furthermore, with the
same construct, an inducible rescue of the miR-200c expression was performed in the
MCF7 miR-200c KO cells.
The induction of miR-200c caused evident changes in the morphology of MDA-MB-231
cells, resulting in extensive remodeling of the cellular architecture as observed already
after three days and even further increased after seven days. The resulting flat
“pancake” shaped cells appeared to have highly decreased cellular stiffness as well as
a lack of distinctive polarization that is commonly seen in spindle-like cells. Similar
4. Inducible miR-200c decreases motility of breast cancer cells and reduces filamin A
Dissertation - Bojan Ljepoja | 76 |
observations of morphological or “spreading defects” were reported after a FLNA
knock-down and were attributed to a deficiency in actin-crosslinking 139,145.
In contrast to the rather slow full EMT, the effects on speed and run-times of the cells
were observed already 48 h hours after miR-200c induction, indicating a direct
connection of this axis to the cellular motility. The long-term stimulation showed a
change in modality which may be similar to EMT, but a complete transition to an
epithelial “cobblestone” phenotype was not observed, possibly due to the lack of
development of cellular adhesions by E-cadherin.
Furthermore, the 1D migration assay revealed decreased motility after miR-200c
expression by showing changes of all measured parameters the decreased migratory
capabilities of miR-200c high expressing cells show to be not based mainly on the
absolute velocity, but more on the cells’ inability of polarizing and retaining polarization,
as seen by the higher number of cells in temporary rest states or being completely
immobile.
Our previously published proteomic analysis of a genomic miR-200c KO in MCF7
disclosed multiple changes in the expression of regulators of migratory processes, of
which the effect on filamins A was most prominent 136. Filamin A is supposed to affect
cell motility based on multiple pathways, like the induction of changes in the structure
and stiffness of the cell as direct building block in the system145 or shifts in intracellular
signaling146 and resulting in alteration of different mechanisms important for migration,
like the actin-treadmill and formation of focal adhesions147,148 38. This important role of
filamin A as a capable regulator of cellular migration makes it interesting to investigate
how miR-200c regulates filamin A. Especially as we found that induced miR-200c
expression resulted in decreased expression of FLNA in both cell systems.
The investigation of the underlying mechanism of FLNA suppression was performed
with two in silico analyses: The first was not yielding any predicted binding site of
miR-200c in the FLNA 3’ UTR, while the other resulted in six potential miR-200c
controlled transcription factors. Of the transcription factors, only JUN showed constant
repression to miR-200c expression, which is in line with previous studies that identified
JUN as potential miR-200c target 149. JUN expression is necessary for the formation
of the AP-1 complex together with c-Fos. Previously, the AP-1 complex was shown to
promote tumorigenesis, cancer progression and also regulating cell morphology and
migration 150-152. Our experiments verified JUN promoting FLNA transcription as well
as inhibition of JUN by miR-200c’s, resulting in decreased FLNA expression.
4. Inducible miR-200c decreases motility of breast cancer cells and reduces filamin A
Dissertation - Bojan Ljepoja | 77 |
A recent study by Jurmeister et al. indicated one further possible regulatory
mechanism. They found that miR-200c was inhibiting the MRTF dependent activation
of SRF103. SRF is a known transcription factor of multiple immediate early genes,
including c-fos153, and therefore an important regulator of cell growth, differentiation
and also migration154,155 FLNA was previously144 identified as a target of SRF.
Consistently a decreased MRTF-dependent SRF activation was observed after
miR-200c induction, indicating an additional axis of miR-200c based regulation of
FLNA expression. Furthermore, increased c-Fos expression due to SRF stimulation
may also promote the additionally observed JUN-based axis, by providing additional
partners for the assembly of the AP-1 complex. Further, FLNA was shown to promote
the activity of SRF 156 which may further increase the investigated effects due to this
positive feedback loop.
Our data reveal a potential novel route of miR-200c regulating migration, independent
of ZEB1/2. The inhibition of cytoskeletal components via miR-200c, like filamin A as
shown here, support the role of miR-200c in maintaining the epithelial state and
inhibiting metastasis as possibly important in a wider variety of cancer cells.
4. Inducible miR-200c decreases motility of breast cancer cells and reduces filamin A
Dissertation - Bojan Ljepoja | 78 |
4.5. Materials and methods
Puromycin dihydrochloride and doxorubicin hydrochloride were obtained from Sigma
(cat. P8833, D1515).
The MCF7 miR-200c KO cells were grown at 37 °C and 5 % CO2 in high glucose DMEM
Confocal images and 3D stacks were acquired using a Leica TCS SP8 SMD
microscope equipped with a 40x HC PL APO oil objective. Pinhole size was adjusted
4. Inducible miR-200c decreases motility of breast cancer cells and reduces filamin A
Dissertation - Bojan Ljepoja | 80 |
to 1.0 airy units and sequential scanning was performed at 400 Hz. 405nm, 488nm and
561nm laser lines were used for excitation.
For immunofluorescence staining, cells were fixed for 10 min with 4% EM grade
formaldehyde. After 5 min washing with PBS, samples were permeabilized for 10 min
with 0.5% TX-100 in PBS. Unspecific binding was blocked by 30 min incubation with
5% BSA (Sigma) at RT. Cells were then incubated overnight (4 °C) with the primary
antibody for filamin A diluted according to the manufacturer’s instructions (1:400,
Thermo Fisher, MA5-11705). After 3 x 10 min washing with PBS, samples were
incubated with secondary antibodies (1:500, AF488 goat-anti-mouse AB_2534069),
rhodamine phalloidin (1:300, Sigma-Aldrich) and DAPI (0.5 µg/ml, Sigma-Aldrich) for
1 hour at RT, washed again 3 x 10 min with PBS. All stainings were performed in
ibiTreat 8 well µ-slides (ibidi GmbH) coated with fibronectin (Corning). Total
fluorescence intensities and nuclear shape factors were quantified using ImageJ v1.52.
Z-plane scaled 3D stacks were rendered using the Leica LAS X software platform.
For the knockdown of JUN, a siRNA was used and compared to a negative control
(Silencer Select, Thermo Fisher, assay s7659 and control 4390843). Cells were
transfected with the K2 transfection reagent (Biontex) according to the manufacturer’s
recommendations.
For analysis of SRF/MRTF signaling, the pgl4.34 Plasmid (Promega, 9PIE135) was
used. Transfection was performed in 6-well with cells grown to 80% confluence with
K2 transfection reagent (Biontex, Germany) according to the manufacturer’s
instructions, into cells stimulated with 5µg/ml doxycycline for 24h. Luciferase
measurement was performed 24h after transfection, as described previously28.
Detailed description of production of the stamps and measurements are published in
Schreiber et al. 140 and further described in the supplemental methods.
The motility parameters are defined as:
𝒗𝐫𝐮𝐧: The run velocity is defined as the mean over the tangential velocity for time points
when cells are in the run state 𝑣𝑟𝑢𝑛 = ⟨|𝑣𝑡𝑎𝑛𝑔|⟩.
4. Inducible miR-200c decreases motility of breast cancer cells and reduces filamin A
Dissertation - Bojan Ljepoja | 81 |
𝝉𝐫𝐮𝐧 , 𝝉𝐫𝐞𝐬𝐭: To evaluate the persistence times of run and rest states 𝜏run and 𝜏rest, the
survival function 𝑆(𝑡) = P(𝑇 > 𝑡) is calculated. 𝜏run and 𝜏rest are determined by fitting
log(𝑆(𝑡)) by the function 𝑓(𝑡) = −1
𝜏 𝑡 + 𝑐 evaluated at 𝑡 ∈ [2; 16 ]ℎ. Very small times
are excluded because defiations from an exponential behavior are observed here. To
reduce the effects of the limited time window, only states that start at least 16 h before
the end of the corresponding cell track are evaluated, while the fitting range for 𝑆(𝑡)
ends at 16 h. The error range given is the 99% confidence interval for the fit.
𝑷𝐫𝐮𝐧: The fraction of time cells spend in the run state is defined as the time cells are
in the run state divided by the total time of the trajectories.
q: The persistence parameter q is defined as the maximum distance between two
points of a cell trajectory divided by the total path length of the trajectory. This is
averaged over all cells 𝑞 = ⟨max(𝜑)−min(𝜑)
∑ |𝜑𝑖|𝑖⟩
Results are expressed as the mean ± SD of at least three biological replicas and
analyzed using a two-sided student’s t-test, if not stated otherwise. Software GraphPad
Prism v6 and SigmaPlot 11 were utilized for the analysis of the data.
The data that support the findings of this study are available from the corresponding
author upon reasonable request.
The authors thank the German Research Foundation (DFG) for financial support of
SFB 1032 projects B01 (JOR), B04 (EW) and B08 (SZ), and Cluster of Excellence NIM
(JOR, EW). JGR thanks the Mexican government for receiving a scholarship
(CONACyT number 207973). The authors declare no competing financial interests.
The authors declare that they have no conflict of interest.
BL performed the experiments and wrote the paper. CS performed the 1D migration
assays and wrote the paper. FAG performed the imaging experiments and wrote the
paper. JGR generated the TRIPZ-constructs and performed the transcription factor
4. Inducible miR-200c decreases motility of breast cancer cells and reduces filamin A
Dissertation - Bojan Ljepoja | 82 |
analysis. SZ, JOR and EW provided conceptual advice. AR conceived the study and
wrote the manuscript. All authors commented on the manuscript and conclusions of
this work.
4. Inducible miR-200c decreases motility of breast cancer cells and reduces filamin A
Dissertation - Bojan Ljepoja | 83 |
4.6. Supplements
4.6.1. Supplemental methods
Micropatterning / 1D Migration
Production of stamps:
To a master for stamp preparation, silicon wafers were coated with TI Prime adhesion
promoter and AZ40XT (MicroChemicals) photo-resist. Desired areas were exposed to
UV light using laser direct imaging (Protolaser LDI, LPKF). The photoresist was then
developed (AZ 826 MIF, MicroChemicals) and silanized (Trichloro(1H,1H,2H,2H-
perfluoro-octyl)silane, Sigma-Aldrich). To create the stamp, polydimethylsiloxane
(PDMS) monomer and crosslinker (DC 184 elastomer kit, Dow Corning) were mixed in
a 10:1 ratio, poured onto the stamp master, degassed in a desiccator, and cured
overnight at 50°C.
Microcontact printing:
Microcontact printing was used to produce fibronectin-coated ring-shaped lanes.
PDMS stamps were treated with UV light (PSD-UV, novascan) for 5 min. Then the
stamps were incubated for 45 min in a solution containing 40 µg/ml fibronectin (Yo
proteins) and 10 µg/ml fibronectin labeled with Alexa Fluor 647 (Alexa Fluor NHS Ester,
Thermo Fisher Scientific) dissolved in ultrapure water. Next, stamps were washed with
ultrapure water, dried and placed on a petri dish (µ-Dish, Ibidi) which had been
activated with UV light for 15 min. A droplet of a 2 mg/ml poly-L-lysine-grafted
polyethylene glycol (PLL-PEG) (2 kDa PEG chains, SuSoS) solution (dissolved in a
solution of 10 mM HEPES and 150 mM NaCl was placed at the edge of the stamps
and drawn into the spaces between surface and stamp by capillary action. Stamps
were removed and a glass coverslip was placed on the dish surface to ensure complete
coverage of the surface with PEG solution. After a 30-min incubation, the coverslip was
removed, and the surface was washed three times with phosphate-buffered saline
(PBS) and stored in PBS until cells were seeded.
Cell Culture
MDA-MB-231 breast cancer cells were cultured in L15 medium (sigma aldrich)
containing 10% TET system approved fetal calf serum (FCS) (Clontech). Cells were
incubated at 37°C in a humidified atmosphere. For cell motility measurements, cells
were cultured in medium containing 0 or 5 µg/ml Doxycycline for 44h. Then, about
10,000 cells were seeded per dish (µ-Dish, Ibidi). After 3 h, cell medium was replaced
4. Inducible miR-200c decreases motility of breast cancer cells and reduces filamin A
Dissertation - Bojan Ljepoja | 84 |
with fresh medium containing 25 nM Hoechst 33342 dye (Invitrogen) and
measurements were started within 1 hour.
Time-Lapse Microscopy
Scanning time-lapse measurements were performed using an automated inverted
microscope (Nikon Ti) equipped with a 10x objective, a LED lamp (Spectra X,
lumencor) and a sCMOS camera (pco.edge 4.2, pco). Cells were maintained at 37°C
and a humidified atmosphere using a heating chamber (okolab). Phase-contrast and
fluorescent images were automatically acquired every 10 min.
Cell Tracking
Cell tracking was performed using the image-processing software ImageJ. Isolated
cells confined in the ring-shaped lanes were identified by eye. Fluorescence images of
the nuclei were preprocessed by applying a bandpass filter and a threshold for
fluorescence intensity, and the centers of mass of the stained nuclei were identified.
Cell tracking was stopped in the case of cell division or when cells spanned over the
middle part of the ring pattern. Cell tracks shorter than 20 h, as well as tracks of dying
or non-moving cells were excluded from further analysis.
Data Analysis
Two-state analysis of tracks:
Track analysis was performed in MATLAB (Mathworks). A circle was fitted to cell
position data to find the center of the ring-shaped lane. Switching to polar coordinates,
the tangential component of the cell velocity was evaluated as), where indicates the
azimuthal cell position at time i and R indicates the mean radius of the micropattern (R
= 65 µm). To distinguish run from rest states, a iterative change-point analysis in
combination with a classification of cell dynamics in the time intervals between change-
points was applied. Change-points were identified when they exceeded a confidence
level for the existence of change-points that was calculated via bootstrap analysis of
the cumulative sum of the angular velocity. For all intervals between change points this
was repeated until no more change-points were found. The resulting intervals were
classified into run and rest states by analyzing the mean square displacement. Details
are published in Schreiber et al.[cite]
The run velocity is defined as the mean over the tangential velocity for time points
when cells are in the run state .
To evaluate the persistence times of run and rest states and the survival function is
calculated. and are determined by fitting by the function evaluated at . Very small
4. Inducible miR-200c decreases motility of breast cancer cells and reduces filamin A
Dissertation - Bojan Ljepoja | 85 |
times are excluded because deviations from an exponential behavior are observed
here. To reduce the effects of the limited time window, only states that start at least 16
h before the end of the corresponding cell track are evaluated, while the fitting range
for ends at 16 h. The error range given is the 99% confidence interval for the fit.
The fraction of time cells spend in the run state is defined as the time cells are in the
run state divided by the total time of the trajectories.
q: The persistence parameter q is defined as the maximum distance between two
points of a cell trajectory divided by the total path length of the trajectory. This is
averaged over all cells
4.6.2. Supplemental figures
Supplement S 9
Analysis of different potential transcription factors for FLNA was performed after miR-200c induction. The graphs show the RT-qPCR results at different time points, with no consistent effect for any factor but JUN
4.6.3. Supplemental movies
The supplemental movies be viewed at in the online version of the publication or on https://www.cup.lmu.de/pb/aks/ewagner/projects/
1 Lee, R. C., Feinbaum, R. L. & Ambros, V. The C. elegans heterochronic gene lin-4 encodes small RNAs with antisense complementarity to lin-14. Cell 75, 843-854 (1993).
2 Lee, R. C. & Ambros, V. An extensive class of small RNAs in Caenorhabditis elegans. Science 294, 862-864, doi:10.1126/science.1065329 (2001).
3 Bartel, D. P. MicroRNAs: genomics, biogenesis, mechanism, and function. Cell 116, 281-297 (2004).
4 Gebert, L. F. R. & MacRae, I. J. Regulation of microRNA function in animals. Nature reviews. Molecular cell biology 20, 21-37, doi:10.1038/s41580-018-0045-7 (2019).
5 Lodish, H. F., Zhou, B., Liu, G. & Chen, C. Z. Micromanagement of the immune system by microRNAs. Nat Rev Immunol 8, 120-130, doi:10.1038/nri2252 (2008).
6 Peter, M. E. Targeting of mRNAs by multiple miRNAs: the next step. Oncogene 29, 2161-2164, doi:10.1038/onc.2010.59 (2010).
7 Elefant, N., Altuvia, Y. & Margalit, H. A wide repertoire of miRNA binding sites: prediction and functional implications. Bioinformatics 27, 3093-3101, doi:10.1093/bioinformatics/btr534 (2011).
8 Ferlay, J. et al. Cancer incidence and mortality worldwide: sources, methods and major patterns in GLOBOCAN 2012. Int J Cancer 136, E359-386, doi:10.1002/ijc.29210 (2015).
9 American Cancer Society. v. (The Society, Atlanta, Ga.). 10 O'Bryan, S., Dong, S., Mathis, J. M. & Alahari, S. K. The roles of oncogenic miRNAs and their
therapeutic importance in breast cancer. European journal of cancer 72, 1-11, doi:10.1016/j.ejca.2016.11.004 (2017).
11 Teoh, S. L. & Das, S. The Role of MicroRNAs in Diagnosis, Prognosis, Metastasis and Resistant Cases in Breast Cancer. Curr Pharm Des 23, 1845-1859, doi:10.2174/1381612822666161027120043 (2017).
12 Blows, F. M. et al. Subtyping of breast cancer by immunohistochemistry to investigate a relationship between subtype and short and long term survival: a collaborative analysis of data for 10,159 cases from 12 studies. PLoS Med 7, e1000279, doi:10.1371/journal.pmed.1000279 (2010).
13 Senkus, E. et al. Primary breast cancer: ESMO Clinical Practice Guidelines for diagnosis, treatment and follow-up. Annals of oncology : official journal of the European Society for Medical Oncology / ESMO 26 Suppl 5, v8-30, doi:10.1093/annonc/mdv298 (2015).
14 Svoronos, A. A., Engelman, D. M. & Slack, F. J. OncomiR or Tumor Suppressor? The Duplicity of MicroRNAs in Cancer. Cancer research 76, 3666-3670, doi:10.1158/0008-5472.CAN-16-0359 (2016).
15 Lin, S. & Gregory, R. I. MicroRNA biogenesis pathways in cancer. Nat Rev Cancer 15, 321-333, doi:10.1038/nrc3932 (2015).
16 Kim, S. Y. et al. miR-27a is a negative regulator of adipocyte differentiation via suppressing PPARgamma expression. Biochemical and biophysical research communications 392, 323-328, doi:10.1016/j.bbrc.2010.01.012 (2010).
17 Alvarez, M. L., Khosroheidari, M., Eddy, E. & Done, S. C. MicroRNA-27a decreases the level and efficiency of the LDL receptor and contributes to the dysregulation of cholesterol homeostasis. Atherosclerosis 242, 595-604, doi:10.1016/j.atherosclerosis.2015.08.023 (2015).
18 Sala Frigerio, C. et al. Reduced expression of hsa-miR-27a-3p in CSF of patients with Alzheimer disease. Neurology 81, 2103-2106, doi:10.1212/01.wnl.0000437306.37850.22 (2013).
19 Chen, X., Huang, Z., Chen, D., Yang, T. & Liu, G. Role of microRNA-27a in myoblast differentiation. Cell biology international 38, 266-271, doi:10.1002/cbin.10192 (2014).
7. References and indices
Dissertation - Bojan Ljepoja | 93 |
20 Tang, W. et al. miR-27a regulates endothelial differentiation of breast cancer stem like cells. Oncogene 33, 2629-2638, doi:10.1038/onc.2013.214 (2014).
21 Vimalraj, S., Miranda, P. J., Ramyakrishna, B. & Selvamurugan, N. Regulation of breast cancer and bone metastasis by microRNAs. Disease markers 35, 369-387, doi:10.1155/2013/451248 (2013).
22 Pan, W., Wang, H., Jianwei, R. & Ye, Z. MicroRNA-27a promotes proliferation, migration and invasion by targeting MAP2K4 in human osteosarcoma cells. Cellular physiology and biochemistry : international journal of experimental cellular physiology, biochemistry, and pharmacology 33, 402-412, doi:10.1159/000356679 (2014).
23 Ba, S., Xuan, Y., Long, Z. W., Chen, H. Y. & Zheng, S. S. MicroRNA-27a Promotes the Proliferation and Invasiveness of Colon Cancer Cells by Targeting SFRP1 through the Wnt/beta-Catenin Signaling Pathway. Cellular physiology and biochemistry : international journal of experimental cellular physiology, biochemistry, and pharmacology 42, 1920-1933, doi:10.1159/000479610 (2017).
24 Chae, D. K. et al. MIR-27a regulates the TGF-beta signaling pathway by targeting SMAD2 and SMAD4 in lung cancer. Mol Carcinog 56, 1992-1998, doi:10.1002/mc.22655 (2017).
25 Ljepoja, B., Garcia-Roman, J., Sommer, A. K., Wagner, E. & Roidl, A. MiRNA-27a sensitizes breast cancer cells to treatment with Selective Estrogen Receptor Modulators. Breast 43, 31-38, doi:10.1016/j.breast.2018.10.007 (2019).
26 Mutlu, M. et al. miR-200c: a versatile watchdog in cancer progression, EMT, and drug resistance. J Mol Med (Berl), doi:10.1007/s00109-016-1420-5 (2016).
27 Kopp, F., Oak, P. S., Wagner, E. & Roidl, A. miR-200c sensitizes breast cancer cells to doxorubicin treatment by decreasing TrkB and Bmi1 expression. PloS one 7, e50469, doi:10.1371/journal.pone.0050469 (2012).
28 Kopp, F., Wagner, E. & Roidl, A. The proto-oncogene KRAS is targeted by miR-200c. Oncotarget 5, 185-195 (2014).
29 Boettcher, M. & McManus, M. T. Choosing the Right Tool for the Job: RNAi, TALEN, or CRISPR. Mol Cell 58, 575-585, doi:10.1016/j.molcel.2015.04.028 (2015).
30 Joung, J. K. & Sander, J. D. TALENs: a widely applicable technology for targeted genome editing. Nature reviews. Molecular cell biology 14, 49-55, doi:10.1038/nrm3486 (2013).
31 Davies, C. et al. Long-term effects of continuing adjuvant tamoxifen to 10 years versus stopping at 5 years after diagnosis of oestrogen receptor-positive breast cancer: ATLAS, a randomised trial. Lancet 381, 805-816, doi:10.1016/S0140-6736(12)61963-1 (2013).
32 Ring, A. & Dowsett, M. Mechanisms of tamoxifen resistance. Endocr Relat Cancer 11, 643-658, doi:10.1677/erc.1.00776 (2004).
33 Burstein, H. J. et al. Adjuvant endocrine therapy for women with hormone receptor-positive breast cancer: american society of clinical oncology clinical practice guideline focused update. J Clin Oncol 32, 2255-2269, doi:10.1200/JCO.2013.54.2258 (2014).
34 Guo, Y. et al. Prognostic and clinicopathological value of GATA binding protein 3 in breast cancer: A systematic review and meta-analysis. PloS one 12, e0174843, doi:10.1371/journal.pone.0174843 (2017).
35 Curtis, C. et al. The genomic and transcriptomic architecture of 2,000 breast tumours reveals novel subgroups. Nature 486, 346-352, doi:10.1038/nature10983 (2012).
36 Takaku, M. et al. GATA3 zinc finger 2 mutations reprogram the breast cancer transcriptional network. Nat Commun 9, 1059, doi:10.1038/s41467-018-03478-4 (2018).
37 Oualla, K. et al. Novel therapeutic strategies in the treatment of triple-negative breast cancer. Ther Adv Med Oncol 9, 493-511, doi:10.1177/1758834017711380 (2017).
38 Early Breast Cancer Trialists' Collaborative, G. et al. Relevance of breast cancer hormone receptors and other factors to the efficacy of adjuvant tamoxifen: patient-level meta-analysis of randomised trials. Lancet 378, 771-784, doi:10.1016/S0140-6736(11)60993-8 (2011).
39 Hamam, R. et al. Circulating microRNAs in breast cancer: novel diagnostic and prognostic biomarkers. Cell Death Dis 8, e3045, doi:10.1038/cddis.2017.440 (2017).
7. References and indices
Dissertation - Bojan Ljepoja | 94 |
40 Tang, W. et al. MiR-27 as a prognostic marker for breast cancer progression and patient survival. PloS one 7, e51702, doi:10.1371/journal.pone.0051702 (2012).
41 Quan, J. et al. MicroRNA-23a/24-2/27a as a potential diagnostic biomarker for cancer: A systematic review and meta-analysis. Mol Clin Oncol 8, 159-169, doi:10.3892/mco.2017.1492 (2018).
42 Li, X. et al. MicroRNA-27a Indirectly Regulates Estrogen Receptor {alpha} Expression and Hormone Responsiveness in MCF-7 Breast Cancer Cells. Endocrinology 151, 2462-2473, doi:10.1210/en.2009-1150 (2010).
43 Sommer, A. K. et al. Salinomycin co-treatment enhances tamoxifen cytotoxicity in luminal A breast tumor cells by facilitating lysosomal degradation of receptor tyrosine kinases. Oncotarget 7, 50461-50476, doi:10.18632/oncotarget.10459 (2016).
44 Flach, K. D. & Zwart, W. The first decade of estrogen receptor cistromics in breast cancer. J Endocrinol 229, R43-56, doi:10.1530/JOE-16-0003 (2016).
45 Welboren, W. J., Sweep, F. C., Span, P. N. & Stunnenberg, H. G. Genomic actions of estrogen receptor alpha: what are the targets and how are they regulated? Endocr Relat Cancer 16, 1073-1089, doi:10.1677/ERC-09-0086 (2009).
46 Lanczky, A. et al. miRpower: a web-tool to validate survival-associated miRNAs utilizing expression data from 2178 breast cancer patients. Breast Cancer Res Treat 160, 439-446, doi:10.1007/s10549-016-4013-7 (2016).
47 Antonov, A. V., Knight, R. A., Melino, G., Barlev, N. A. & Tsvetkov, P. O. MIRUMIR: an online tool to test microRNAs as biomarkers to predict survival in cancer using multiple clinical data sets. Cell death and differentiation 20, 367, doi:10.1038/cdd.2012.137 (2013).
48 Dowsett, M. et al. Meta-analysis of breast cancer outcomes in adjuvant trials of aromatase inhibitors versus tamoxifen. J Clin Oncol 28, 509-518, doi:10.1200/JCO.2009.23.1274 (2010).
49 Katase, K., Sugiyama, Y., Hasumi, K., Yoshimoto, M. & Kasumi, F. The incidence of subsequent endometrial carcinoma with tamoxifen use in patients with primary breast carcinoma. Cancer 82, 1698-1703 (1998).
50 Zhou, S. et al. miR-27a regulates the sensitivity of breast cancer cells to cisplatin treatment via BAK-SMAC/DIABLO-XIAP axis. Tumour Biol 37, 6837-6845, doi:10.1007/s13277-015-4500-1 (2016).
51 Bekele, R. T. et al. Oxidative stress contributes to the tamoxifen-induced killing of breast cancer cells: implications for tamoxifen therapy and resistance. Sci Rep 6, 21164, doi:10.1038/srep21164 (2016).
52 Liu, Z., Shi, H. Y., Nawaz, Z. & Zhang, M. Tamoxifen induces the expression of maspin through estrogen receptor-alpha. Cancer Lett 209, 55-65, doi:10.1016/j.canlet.2003.11.018 (2004).
53 Klinge, C. M. Estrogen Regulation of MicroRNA Expression. Curr Genomics 10, 169-183, doi:10.2174/138920209788185289 (2009).
54 Frasor, J. et al. Profiling of estrogen up- and down-regulated gene expression in human breast cancer cells: insights into gene networks and pathways underlying estrogenic control of proliferation and cell phenotype. Endocrinology 144, 4562-4574, doi:10.1210/en.2003-0567 (2003).
55 Ye, P. et al. Differential microRNA expression profiles in tamoxifen-resistant human breast cancer cell lines induced by two methods. Oncol Lett 15, 3532-3539, doi:10.3892/ol.2018.7768 (2018).
56 Viedma-Rodriguez, R. et al. Mechanisms associated with resistance to tamoxifen in estrogen receptor-positive breast cancer (review). Oncol Rep 32, 3-15, doi:10.3892/or.2014.3190 (2014).
57 Parl, F. F. Multiple mechanisms of estrogen receptor gene repression contribute to ER-negative breast cancer. Pharmacogenomics J 3, 251-253, doi:10.1038/sj.tpj.6500201 (2003).
58 Mahfoudi, A., Roulet, E., Dauvois, S., Parker, M. G. & Wahli, W. Specific mutations in the estrogen receptor change the properties of antiestrogens to full agonists. Proc Natl Acad Sci U S A 92, 4206-4210 (1995).
7. References and indices
Dissertation - Bojan Ljepoja | 95 |
59 Jurkovicova, D. et al. Down-regulation of traditional oncomiRs in plasma of breast cancer patients. Oncotarget 8, 77369-77384, doi:10.18632/oncotarget.20484 (2017).
60 Kopp, F. et al. Salinomycin treatment reduces metastatic tumor burden by hampering cancer cell migration. Mol Cancer 13, 16, doi:10.1186/1476-4598-13-16 (2014).
61 Broos, S. et al. PhysBinder: Improving the prediction of transcription factor binding sites by flexible inclusion of biophysical properties. Nucleic Acids Res 41, W531-534, doi:10.1093/nar/gkt288 (2013).
62 Gruber, C. J., Gruber, D. M., Gruber, I. M., Wieser, F. & Huber, J. C. Anatomy of the estrogen response element. Trends Endocrinol Metab 15, 73-78, doi:10.1016/j.tem.2004.01.008 (2004).
63 Brodersen, P. & Voinnet, O. Revisiting the principles of microRNA target recognition and mode of action. Nature reviews. Molecular cell biology 10, 141-148, doi:10.1038/nrm2619 (2009).
64 Wightman, B., Ha, I. & Ruvkun, G. Posttranscriptional regulation of the heterochronic gene lin-14 by lin-4 mediates temporal pattern formation in C. elegans. Cell 75, 855-862 (1993).
65 Baumjohann, D. & Ansel, K. M. MicroRNA-mediated regulation of T helper cell differentiation and plasticity. Nature reviews. Immunology 13, 666-678, doi:10.1038/nri3494 (2013).
66 Gangaraju, V. K. & Lin, H. MicroRNAs: key regulators of stem cells. Nature reviews. Molecular cell biology 10, 116-125, doi:10.1038/nrm2621 (2009).
67 Rottiers, V. & Naar, A. M. MicroRNAs in metabolism and metabolic disorders. Nature reviews. Molecular cell biology 13, 239-250, doi:10.1038/nrm3313 (2012).
68 Small, E. M. & Olson, E. N. Pervasive roles of microRNAs in cardiovascular biology. Nature 469, 336-342, doi:10.1038/nature09783 (2011).
69 Ameres, S. L. & Zamore, P. D. Diversifying microRNA sequence and function. Nature reviews. Molecular cell biology 14, 475-488, doi:10.1038/nrm3611 (2013).
70 Filios, S. R. & Shalev, A. beta-Cell MicroRNAs: Small but Powerful. Diabetes 64, 3631-3644, doi:10.2337/db15-0831 (2015).
71 Cortez, M. A. et al. MicroRNAs in body fluids--the mix of hormones and biomarkers. Nature reviews. Clinical oncology 8, 467-477, doi:10.1038/nrclinonc.2011.76 (2011).
72 Humphries, B. & Yang, C. The microRNA-200 family: small molecules with novel roles in cancer development, progression and therapy. Oncotarget 6, 6472-6498, doi:10.18632/oncotarget.3052 (2015).
73 Muralidhar, G. G. & Barbolina, M. V. The miR-200 Family: Versatile Players in Epithelial Ovarian Cancer. International journal of molecular sciences 16, 16833-16847, doi:10.3390/ijms160816833 (2015).
74 Perdigao-Henriques, R. et al. miR-200 promotes the mesenchymal to epithelial transition by suppressing multiple members of the Zeb2 and Snail1 transcriptional repressor complexes. Oncogene 35, 158-172, doi:10.1038/onc.2015.69 (2016).
75 Dykxhoorn, D. M. et al. miR-200 enhances mouse breast cancer cell colonization to form distant metastases. PloS one 4, e7181, doi:10.1371/journal.pone.0007181 (2009).
76 Le, M. T. et al. miR-200-containing extracellular vesicles promote breast cancer cell metastasis. The Journal of clinical investigation 124, 5109-5128, doi:10.1172/JCI75695 (2014).
77 Kumar, S., Nag, A. & Mandal, C. C. A Comprehensive Review on miR-200c, A Promising Cancer Biomarker with Therapeutic Potential. Current drug targets 16, 1381-1403 (2015).
78 Hamano, R. et al. Overexpression of miR-200c induces chemoresistance in esophageal cancers mediated through activation of the Akt signaling pathway. Clinical cancer research : an official journal of the American Association for Cancer Research 17, 3029-3038, doi:10.1158/1078-0432.CCR-10-2532 (2011).
79 Huang, H. N. et al. miR-200c and GATA binding protein 4 regulate human embryonic stem cell renewal and differentiation. Stem cell research 12, 338-353, doi:10.1016/j.scr.2013.11.009 (2014).
80 Liu, S. et al. miR-200c/Bmi1 axis and epithelial-mesenchymal transition contribute to acquired resistance to BRAF inhibitor treatment. Pigment cell & melanoma research 28, 431-441, doi:10.1111/pcmr.12379 (2015).
7. References and indices
Dissertation - Bojan Ljepoja | 96 |
81 Chang, I. et al. Loss of miR-200c up-regulates CYP1B1 and confers docetaxel resistance in renal cell carcinoma. Oncotarget 6, 7774-7787, doi:10.18632/oncotarget.3484 (2015).
82 Chang, J. T., Wang, F., Chapin, W. & Huang, R. S. Identification of MicroRNAs as Breast Cancer Prognosis Markers through the Cancer Genome Atlas. PloS one 11, e0168284, doi:10.1371/journal.pone.0168284 (2016).
83 Markou, A. et al. Direct Comparison of Metastasis-Related miRNAs Expression Levels in Circulating Tumor Cells, Corresponding Plasma, and Primary Tumors of Breast Cancer Patients. Clin Chem 62, 1002-1011, doi:10.1373/clinchem.2015.253716 (2016).
84 Zhang, F., Wen, Y. & Guo, X. CRISPR/Cas9 for genome editing: progress, implications and challenges. Hum Mol Genet 23, R40-46, doi:10.1093/hmg/ddu125 (2014).
85 Zu, Y. et al. TALEN-mediated precise genome modification by homologous recombination in zebrafish. Nat Methods 10, 329-331, doi:10.1038/nmeth.2374 (2013).
86 Hsu, P. D., Lander, E. S. & Zhang, F. Development and applications of CRISPR-Cas9 for genome engineering. Cell 157, 1262-1278, doi:10.1016/j.cell.2014.05.010 (2014).
87 Ran, F. A. et al. Double nicking by RNA-guided CRISPR Cas9 for enhanced genome editing specificity. Cell 154, 1380-1389, doi:10.1016/j.cell.2013.08.021 (2013).
88 Kim, Y. K. et al. TALEN-based knockout library for human microRNAs. Nature structural & molecular biology 20, 1458-1464, doi:10.1038/nsmb.2701 (2013).
89 UniProt, C. UniProt: a hub for protein information. Nucleic Acids Res 43, D204-212, doi:10.1093/nar/gku989 (2015).
90 Huang da, W., Sherman, B. T. & Lempicki, R. A. Systematic and integrative analysis of large gene lists using DAVID bioinformatics resources. Nat Protoc 4, 44-57, doi:10.1038/nprot.2008.211 (2009).
91 Huang da, W., Sherman, B. T. & Lempicki, R. A. Bioinformatics enrichment tools: paths toward the comprehensive functional analysis of large gene lists. Nucleic Acids Res 37, 1-13, doi:10.1093/nar/gkn923 (2009).
92 Senfter, D., Madlener, S., Krupitza, G. & Mader, R. M. The microRNA-200 family: still much to discover. Biomol Concepts 7, 311-319, doi:10.1515/bmc-2016-0020 (2016).
93 Pecot, C. V. et al. Tumour angiogenesis regulation by the miR-200 family. Nat Commun 4, 2427, doi:10.1038/ncomms3427 (2013).
94 Slaymaker, I. M. et al. Rationally engineered Cas9 nucleases with improved specificity. Science 351, 84-88, doi:10.1126/science.aad5227 (2016).
95 Reardon, S. Leukaemia success heralds wave of gene-editing therapies. Nature 527, 146-147, doi:10.1038/nature.2015.18737 (2015).
96 Rossi, A. et al. Genetic compensation induced by deleterious mutations but not gene knockdowns. Nature 524, 230-233, doi:10.1038/nature14580 (2015).
97 Chen, B. et al. Disruption of microRNA-21 by TALEN leads to diminished cell transformation and increased expression of cell-environment interaction genes. Cancer Lett 356, 506-516, doi:10.1016/j.canlet.2014.09.034 (2015).
98 Jeong, G., Lim, Y. H., Kim, N. J., Wee, G. & Kim, Y. K. Knockout of miR-221 and miR-222 reveals common and specific targets for paralogous miRNAs. RNA Biol, 1-9, doi:10.1080/15476286.2016.1269994 (2016).
99 Gregory, P. A. et al. The miR-200 family and miR-205 regulate epithelial to mesenchymal transition by targeting ZEB1 and SIP1. Nature cell biology 10, 593-601, doi:10.1038/ncb1722 (2008).
100 Howe, E. N., Cochrane, D. R. & Richer, J. K. Targets of miR-200c mediate suppression of cell motility and anoikis resistance. Breast Cancer Res 13, R45, doi:10.1186/bcr2867 (2011).
101 Sinh, N. D., Endo, K., Miyazawa, K. & Saitoh, M. Ets1 and ESE1 reciprocally regulate expression of ZEB1/ZEB2, dependent on ERK1/2 activity, in breast cancer cells. Cancer Sci 108, 952-960, doi:10.1111/cas.13214 (2017).
102 Chaffer, C. L. et al. Poised chromatin at the ZEB1 promoter enables breast cancer cell plasticity and enhances tumorigenicity. Cell 154, 61-74, doi:10.1016/j.cell.2013.06.005 (2013).
7. References and indices
Dissertation - Bojan Ljepoja | 97 |
103 Jurmeister, S. et al. MicroRNA-200c represses migration and invasion of breast cancer cells by targeting actin-regulatory proteins FHOD1 and PPM1F. Mol Cell Biol 32, 633-651, doi:10.1128/MCB.06212-11 (2012).
104 Damiano, V. et al. Epigenetic silencing of miR-200c in breast cancer is associated with aggressiveness and is modulated by ZEB1. Genes Chromosomes Cancer 56, 147-158, doi:10.1002/gcc.22422 (2017).
105 Zhou, A. X. et al. Filamin a mediates HGF/c-MET signaling in tumor cell migration. Int J Cancer 128, 839-846, doi:10.1002/ijc.25417 (2011).
106 Zhong, Z. et al. Cyclin D1/cyclin-dependent kinase 4 interacts with filamin A and affects the migration and invasion potential of breast cancer cells. Cancer Res 70, 2105-2114, doi:10.1158/0008-5472.CAN-08-1108 (2010).
107 Zhao, P. et al. Filamin A (FLNA) modulates chemosensitivity to docetaxel in triple-negative breast cancer through the MAPK/ERK pathway. Tumour Biol 37, 5107-5115, doi:10.1007/s13277-015-4357-3 (2016).
108 Brychtova, V., Mohtar, A., Vojtesek, B. & Hupp, T. R. Mechanisms of anterior gradient-2 regulation and function in cancer. Semin Cancer Biol 33, 16-24, doi:10.1016/j.semcancer.2015.04.005 (2015).
109 Hrstka, R. et al. The pro-metastatic protein anterior gradient-2 predicts poor prognosis in tamoxifen-treated breast cancers. Oncogene 29, 4838-4847, doi:10.1038/onc.2010.228 (2010).
110 Gray, T. A., Alsamman, K., Murray, E., Sims, A. H. & Hupp, T. R. Engineering a synthetic cell panel to identify signalling components reprogrammed by the cell growth regulator anterior gradient-2. Mol Biosyst 10, 1409-1425, doi:10.1039/c4mb00113c (2014).
111 Vitello, E. A. et al. Cancer-secreted AGR2 induces programmed cell death in normal cells. Oncotarget 7, 49425-49434, doi:10.18632/oncotarget.9921 (2016).
112 Hayes, J. D., Flanagan, J. U. & Jowsey, I. R. Glutathione transferases. Annu Rev Pharmacol Toxicol 45, 51-88, doi:10.1146/annurev.pharmtox.45.120403.095857 (2005).
113 Li, S. et al. Overcoming resistance to cisplatin by inhibition of glutathione S-transferases (GSTs) with ethacraplatin micelles in vitro and in vivo. Biomaterials 144, 119-129, doi:10.1016/j.biomaterials.2017.08.021 (2017).
114 Liu, H., Shi, D., Liu, T., Yu, Z. & Zhou, C. Lentivirus-mediated silencing of SCIN inhibits proliferation of human lung carcinoma cells. Gene 554, 32-39, doi:10.1016/j.gene.2014.10.013 (2015).
115 Wang, X. et al. Screening miRNAs for early diagnosis of colorectal cancer by small RNA deep sequencing and evaluation in a Chinese patient population. OncoTargets and therapy 9, 1159-1166, doi:10.2147/OTT.S100427 (2016).
116 Miura, N. et al. Adseverin: a novel cisplatin-resistant marker in the human bladder cancer cell line HT1376 identified by quantitative proteomic analysis. Mol Oncol 6, 311-322, doi:10.1016/j.molonc.2011.12.002 (2012).
117 Brocker, C., Cantore, M., Failli, P. & Vasiliou, V. Aldehyde dehydrogenase 7A1 (ALDH7A1) attenuates reactive aldehyde and oxidative stress induced cytotoxicity. Chem Biol Interact 191, 269-277, doi:10.1016/j.cbi.2011.02.016 (2011).
118 Benchekroun, M. N., Sinha, B. K. & Robert, J. Doxorubicin-induced oxygen free radical formation in sensitive and doxorubicin-resistant variants of rat glioblastoma cell lines [corrected and republished erratum originally printed in FEBS Lett 1993 May 17;322(3):295-8]. FEBS Lett 326, 302-305 (1993).
119 Rivankar, S. An overview of doxorubicin formulations in cancer therapy. Journal of cancer research and therapeutics 10, 853-858, doi:10.4103/0973-1482.139267 (2014).
120 Hsu, P. D. et al. DNA targeting specificity of RNA-guided Cas9 nucleases. Nat Biotechnol 31, 827-832, doi:10.1038/nbt.2647 (2013).
7. References and indices
Dissertation - Bojan Ljepoja | 98 |
121 Peltier, H. J. & Latham, G. J. Normalization of microRNA expression levels in quantitative RT-PCR assays: identification of suitable reference RNA targets in normal and cancerous human solid tissues. RNA 14, 844-852, doi:10.1261/rna.939908 (2008).
122 Tyanova, S. et al. Visualization of LC-MS/MS proteomics data in MaxQuant. Proteomics 15, 1453-1456, doi:10.1002/pmic.201400449 (2015).
123 Cox, J. & Mann, M. MaxQuant enables high peptide identification rates, individualized p.p.b.-range mass accuracies and proteome-wide protein quantification. Nat Biotechnol 26, 1367-1372, doi:10.1038/nbt.1511 (2008).
124 Tyanova, S. et al. The Perseus computational platform for comprehensive analysis of (prote)omics data. Nature methods 13, 731-740, doi:10.1038/nmeth.3901 (2016).
125 Agarwal, V., Bell, G. W., Nam, J. W. & Bartel, D. P. Predicting effective microRNA target sites in mammalian mRNAs. Elife 4, doi:10.7554/eLife.05005 (2015).
126 Riggi, N., Aguet, M. & Stamenkovic, I. Cancer Metastasis: A Reappraisal of Its Underlying Mechanisms and Their Relevance to Treatment. Annu Rev Pathol 13, 117-140, doi:10.1146/annurev-pathol-020117-044127 (2018).
127 DeSantis, C. E. et al. International Variation in Female Breast Cancer Incidence and Mortality Rates. Cancer Epidemiol Biomarkers Prev 24, 1495-1506, doi:10.1158/1055-9965.EPI-15-0535 (2015).
128 DeSantis, C. E., Ma, J., Goding Sauer, A., Newman, L. A. & Jemal, A. Breast cancer statistics, 2017, racial disparity in mortality by state. CA Cancer J Clin 67, 439-448, doi:10.3322/caac.21412 (2017).
129 Soni, A. et al. Breast cancer subtypes predispose the site of distant metastases. Am J Clin Pathol 143, 471-478, doi:10.1309/AJCPYO5FSV3UPEXS (2015).
130 Mariotto, A. B., Etzioni, R., Hurlbert, M., Penberthy, L. & Mayer, M. Estimation of the Number of Women Living with Metastatic Breast Cancer in the United States. Cancer Epidemiol Biomarkers Prev 26, 809-815, doi:10.1158/1055-9965.EPI-16-0889 (2017).
131 Campbell, K. & Casanova, J. A common framework for EMT and collective cell migration. Development 143, 4291-4300, doi:10.1242/dev.139071 (2016).
132 Schaeffer, D., Somarelli, J. A., Hanna, G., Palmer, G. M. & Garcia-Blanco, M. A. Cellular migration and invasion uncoupled: increased migration is not an inexorable consequence of epithelial-to-mesenchymal transition. Mol Cell Biol 34, 3486-3499, doi:10.1128/MCB.00694-14 (2014).
133 Son, H. & Moon, A. Epithelial-mesenchymal Transition and Cell Invasion. Toxicol Res 26, 245-252, doi:10.5487/TR.2010.26.4.245 (2010).
134 Ma, J., Dong, C. & Ji, C. MicroRNA and drug resistance. Cancer gene therapy 17, 523-531, doi:10.1038/cgt.2010.18 (2010).
135 Pogribny, I. P. et al. Alterations of microRNAs and their targets are associated with acquired resistance of MCF-7 breast cancer cells to cisplatin. Int J Cancer 127, 1785-1794, doi:10.1002/ijc.25191 (2010).
136 Ljepoja, B. et al. A proteomic analysis of an in vitro knock-out of miR-200c. Sci Rep 8, 6927, doi:10.1038/s41598-018-25240-y (2018).
137 Nakamura, F., Stossel, T. P. & Hartwig, J. H. The filamins: organizers of cell structure and function. Cell Adh Migr 5, 160-169 (2011).
138 Stossel, T. P. et al. Filamins as integrators of cell mechanics and signalling. Nature reviews. Molecular cell biology 2, 138-145, doi:10.1038/35052082 (2001).
139 Baldassarre, M. et al. Filamins regulate cell spreading and initiation of cell migration. PloS one 4, e7830, doi:10.1371/journal.pone.0007830 (2009).
140 Schreiber, C., Segerer, F. J., Wagner, E., Roidl, A. & Radler, J. O. Ring-Shaped Microlanes and Chemical Barriers as a Platform for Probing Single-Cell Migration. Sci Rep 6, 26858, doi:10.1038/srep26858 (2016).
141 Maiuri, P. et al. The first World Cell Race. Curr. Biol. 22, R673-R675, doi:http://dx.doi.org/10.1016/j.cub.2012.07.052 (2012).
142 Lombaerts, M. et al. E-cadherin transcriptional downregulation by promoter methylation but not mutation is related to epithelial-to-mesenchymal transition in breast cancer cell lines. Br J Cancer 94, 661-671, doi:10.1038/sj.bjc.6602996 (2006).
143 Chao, Y. L., Shepard, C. R. & Wells, A. Breast carcinoma cells re-express E-cadherin during mesenchymal to epithelial reverting transition. Mol Cancer 9, 179, doi:10.1186/1476-4598-9-179 (2010).
144 Sun, Q. et al. Defining the mammalian CArGome. Genome Res 16, 197-207, doi:10.1101/gr.4108706 (2006).
145 Kasza, K. E. et al. Filamin A is essential for active cell stiffening but not passive stiffening under external force. Biophys J 96, 4326-4335, doi:10.1016/j.bpj.2009.02.035 (2009).
146 Savoy, R. M. & Ghosh, P. M. The dual role of filamin A in cancer: can't live with (too much of) it, can't live without it. Endocr Relat Cancer 20, R341-356, doi:10.1530/ERC-13-0364 (2013).
147 Flanagan, L. A. et al. Filamin A, the Arp2/3 complex, and the morphology and function of cortical actin filaments in human melanoma cells. J Cell Biol 155, 511-517, doi:10.1083/jcb.200105148 (2001).
148 Truong, T., Shams, H. & Mofrad, M. R. Mechanisms of integrin and filamin binding and their interplay with talin during early focal adhesion formation. Integr Biol (Camb) 7, 1285-1296, doi:10.1039/c5ib00133a (2015).
149 Guo, J. et al. Reduced miR-200b and miR-200c expression contributes to abnormal hepatic lipid accumulation by stimulating JUN expression and activating the transcription of srebp1. Oncotarget 7, 36207-36219, doi:10.18632/oncotarget.9183 (2016).
150 Verde, P., Casalino, L., Talotta, F., Yaniv, M. & Weitzman, J. B. Deciphering AP-1 function in tumorigenesis: fra-ternizing on target promoters. Cell Cycle 6, 2633-2639, doi:10.4161/cc.6.21.4850 (2007).
151 Shaulian, E. AP-1--The Jun proteins: Oncogenes or tumor suppressors in disguise? Cell Signal 22, 894-899, doi:10.1016/j.cellsig.2009.12.008 (2010).
152 Xia, Y. & Karin, M. The control of cell motility and epithelial morphogenesis by Jun kinases. Trends Cell Biol 14, 94-101, doi:10.1016/j.tcb.2003.12.005 (2004).
153 Norman, C., Runswick, M., Pollock, R. & Treisman, R. Isolation and properties of cDNA clones encoding SRF, a transcription factor that binds to the c-fos serum response element. Cell 55, 989-1003 (1988).
154 Schwartz, B. et al. SRF is essential for mesodermal cell migration during elongation of the embryonic body axis. Mech Dev 133, 23-35, doi:10.1016/j.mod.2014.07.001 (2014).
155 Hermann, M. R. et al. Integrins synergise to induce expression of the MRTF-A-SRF target gene ISG15 for promoting cancer cell invasion. J Cell Sci 129, 1391-1403, doi:10.1242/jcs.177592 (2016).
156 Kircher, P. et al. Filamin A interacts with the coactivator MKL1 to promote the activity of the transcription factor SRF and cell migration. Sci Signal 8, ra112, doi:10.1126/scisignal.aad2959 (2015).
157 Ljepoja, B. MiRNA-27a as a novel biomarker for tamoxifen treatment in luminal A breast cancer. Master Thesis (2014).
158 Muller, K., Klein, P. M., Heissig, P., Roidl, A. & Wagner, E. EGF receptor targeted lipo-oligocation polyplexes for antitumoral siRNA and miRNA delivery. Nanotechnology 27, 464001, doi:10.1088/0957-4484/27/46/464001 (2016).
159 Alvarez-Erviti, L. et al. Delivery of siRNA to the mouse brain by systemic injection of targeted exosomes. Nature biotechnology 29, 341-345, doi:10.1038/nbt.1807 (2011).
160 Lachelt, U. & Wagner, E. Nucleic Acid Therapeutics Using Polyplexes: A Journey of 50 Years (and Beyond). Chem Rev 115, 11043-11078, doi:10.1021/cr5006793 (2015).
7. References and indices
Dissertation - Bojan Ljepoja | 100 |
7.2. Index of figures
Figure 1 – Biogenesis and function of miRNAs .......................................................... 1
Figure 2 – miRNA-200c as “watchdog of cancer progression” ................................... 4
Figure 3 - Induction of tamoxifen resistance leads to repression of ERα and miR-27a