Distortion and residual stress measurements of induction hardened AISI 4340 discs J. Yi a , M. Gharghouri b , P. Bocher c , M. Medraj a, * a Department of Mechanical Engineering, Concordia University, 1455 de Maisonneuve Blvd. W. Montreal, Quebec H3G 1M8, Canada b National Research Council Canada, Canadian Neutron Beam Centre, Chalk River Laboratories, Chalk River, Ontario K0J 1J0, Canada c Department of Mechanical Engineering, ETS, 1100 rue Notre-Dame West, Montreal, Quebec H3C 1K3, Canada highlights Residual stress profiles of induction hardened 4340 steel were obtained using neutron diffraction. Effects of induction hardening parameters on hardening depth and distortions were examined. Effects of initial hardness on hardening depth and distortions were examined. d 0 Depth distribution was investigated by neutron diffraction technique. The variation in d 0 can significantly affect the residual stress results. article info Article history: Received 21 December 2012 Received in revised form 15 May 2013 Accepted 4 July 2013 Keywords: Metals Heat treatment Neutron scattering and diffraction X-ray scattering Residual stress abstract 10 Induction hardened discs with two initial hardness levels were used for exploring the influences of the variation of initial hardness as well as induction hardening (IH) recipes on the heat treatment dis- tortions and hardening depth. The results show that for the same initial hardness, the larger the energy input, the higher the distortion size as well as the hardening depth. For a given induction hardening recipe, the increase in initial hardness leads to a deeper hardening depth but a smaller distortion. One disc was selected for the residual stress investigation in three orthogonal directions by neutron diffraction (ND). The corresponding stress-free lattice spacing d 0 was measured from the same material using both ND and X-ray diffraction (XRD) methods. The ND results show that the variation of d 0 in the hardened layer is significant and should be taken into account for stress calculation. However, regarding the core region, the d 0 value measured by XRD is more reliable. Accordingly, a combination of the ND- measured d 0 profiles in the hardened layer and the XRD-measured d 0 value in the core was adopted for the determination of residual stress distributions. Ó 2013 Elsevier B.V. All rights reserved. 1. Introduction High performance mechanical components used for aerospace applications require high strength, high hardness and satisfactory toughness. In order to meet these requirements, a variety of heat treatments, especially surface hardening techniques, are employed. In recent years, induction hardening (IH) has attracted considerable attention because it provides significant improvements in fatigue strength of the mechanical parts. Moreover, IH treatment can be performed very quickly and it is an environmentally friendly process. In IH, the work-piece is first heated quickly using an oscillating electromagnetic field, and then quenched to room temperature [1]. Only material at the surface of the work-piece undergoes phase transformation, resulting in a hardened surface layer. The core ma- terial maintains a high toughness. The treatment results in compres- sive stresses at the surface, balanced by tensile stresses in the bulk of the component, which results in improved fatigue performance. In the past ten years, many researchers have studied the cor- relation between IH process parameters and the resulting residual stress distributions [2,3]. The distortions associated with the IH treatment have also been studied [4]. X-ray diffraction (XRD) and neutron diffraction (ND) are non- destructive techniques [5,6] widely used in residual stress examina- tion. XRD is a powerful tool for near-surface (10 mm [7]) stress measurement, but its low penetration depth makes it hard to deter- mine the residual stress profile in the bulk. By alternately removing * Corresponding author. Tel.: þ1 514 848 2424x3146. E-mail address: [email protected](M. Medraj). Contents lists available at SciVerse ScienceDirect Materials Chemistry and Physics journal homepage: www.elsevier.com/locate/matchemphys 0254-0584/$ e see front matter Ó 2013 Elsevier B.V. All rights reserved. http://dx.doi.org/10.1016/j.matchemphys.2013.07.012 Materials Chemistry and Physics xxx (2013) 1e11 Please cite this article in press as: J. Yi, et al., Distortion and residual stress measurements of induction hardened AISI 4340 discs, Materials Chemistry and Physics (2013), http://dx.doi.org/10.1016/j.matchemphys.2013.07.012
Distortion and residual stress measurements of induction hardenedAISI 4340 discs
J. Yi a, M. Gharghouri b, P. Bocher c, M. Medraj a,*aDepartment of Mechanical Engineering, Concordia University, 1455 de Maisonneuve Blvd. W. Montreal, Quebec H3G 1M8, CanadabNational Research Council Canada, Canadian Neutron Beam Centre, Chalk River Laboratories, Chalk River, Ontario K0J 1J0, CanadacDepartment of Mechanical Engineering, ETS, 1100 rue Notre-Dame West, Montreal, Quebec H3C 1K3, Canada
h i g h l i g h t s
� Residual stress profiles of induction hardened 4340 steel were obtained using neutron diffraction.� Effects of induction hardening parameters on hardening depth and distortions were examined.� Effects of initial hardness on hardening depth and distortions were examined.� d0 Depth distribution was investigated by neutron diffraction technique.� The variation in d0 can significantly affect the residual stress results.
a r t i c l e i n f o
Article history:Received 21 December 2012Received in revised form15 May 2013Accepted 4 July 2013
Keywords:MetalsHeat treatmentNeutron scattering and diffractionX-ray scatteringResidual stress
0254-0584/$ e see front matter � 2013 Elsevier B.V.http://dx.doi.org/10.1016/j.matchemphys.2013.07.012
Please cite this article in press as: J. Yi, et aChemistry and Physics (2013), http://dx.doi.
a b s t r a c t
10 Induction hardened discs with two initial hardness levels were used for exploring the influences ofthe variation of initial hardness as well as induction hardening (IH) recipes on the heat treatment dis-tortions and hardening depth. The results show that for the same initial hardness, the larger the energyinput, the higher the distortion size as well as the hardening depth. For a given induction hardeningrecipe, the increase in initial hardness leads to a deeper hardening depth but a smaller distortion. Onedisc was selected for the residual stress investigation in three orthogonal directions by neutrondiffraction (ND). The corresponding stress-free lattice spacing d0 was measured from the same materialusing both ND and X-ray diffraction (XRD) methods. The ND results show that the variation of d0 in thehardened layer is significant and should be taken into account for stress calculation. However, regardingthe core region, the d0 value measured by XRD is more reliable. Accordingly, a combination of the ND-measured d0 profiles in the hardened layer and the XRD-measured d0 value in the core was adoptedfor the determination of residual stress distributions.
� 2013 Elsevier B.V. All rights reserved.
1. Introduction
High performance mechanical components used for aerospaceapplications require high strength, high hardness and satisfactorytoughness. In order to meet these requirements, a variety of heattreatments, especially surface hardening techniques, are employed.In recent years, induction hardening (IH) has attracted considerableattention because it provides significant improvements in fatiguestrength of the mechanical parts. Moreover, IH treatment can beperformed very quickly and it is an environmentally friendlyprocess.
6.edraj).
All rights reserved.
l., Distortion and residual strorg/10.1016/j.matchemphys.2
In IH, the work-piece is first heated quickly using an oscillatingelectromagnetic field, and then quenched to room temperature [1].Only material at the surface of the work-piece undergoes phasetransformation, resulting in a hardened surface layer. The core ma-terial maintains a high toughness. The treatment results in compres-sive stresses at the surface, balanced by tensile stresses in the bulk ofthe component, which results in improved fatigue performance.
In the past ten years, many researchers have studied the cor-relation between IH process parameters and the resulting residualstress distributions [2,3]. The distortions associated with the IHtreatment have also been studied [4].
X-ray diffraction (XRD) and neutron diffraction (ND) are non-destructive techniques [5,6] widely used in residual stress examina-tion. XRD is a powerful tool for near-surface (�10 mm [7]) stressmeasurement, but its low penetration depth makes it hard to deter-mine the residual stress profile in the bulk. By alternately removing
ess measurements of induction hardened AISI 4340 discs, Materials013.07.012
Table 1Chemical composition of steel AISI 4340 [15].
Element Content (wt %)
C 0.38e0.43Cr 0.70e0.90Mn 0.60e0.80Mo 0.20e0.30Ni 1.65e2.00P 0.040maxSi 0.20e0.35S 0.040maxFe Balance
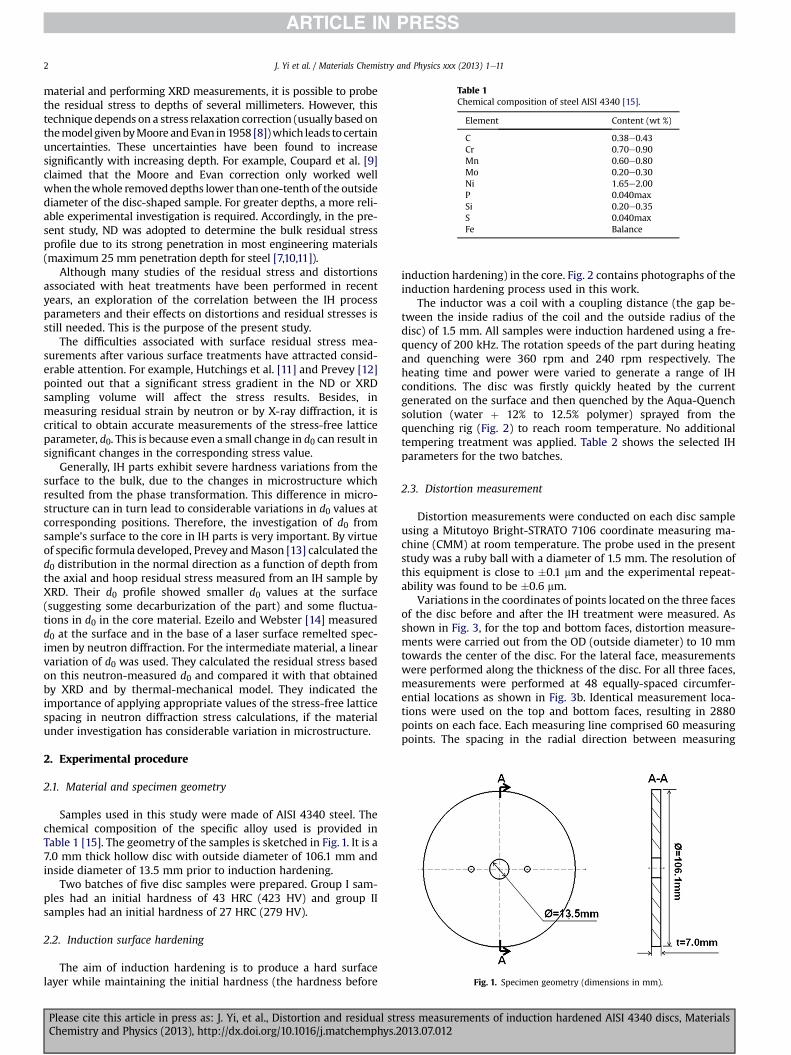
Fig. 1. Specimen geometry (dimensions in mm).
J. Yi et al. / Materials Chemistry and Physics xxx (2013) 1e112
material and performing XRD measurements, it is possible to probethe residual stress to depths of several millimeters. However, thistechniquedepends on a stress relaxation correction (usually based onthemodel givenbyMoore andEvan in1958 [8])which leads to certainuncertainties. These uncertainties have been found to increasesignificantly with increasing depth. For example, Coupard et al. [9]claimed that the Moore and Evan correction only worked wellwhen thewhole removeddepths lower than one-tenth of the outsidediameter of the disc-shaped sample. For greater depths, a more reli-able experimental investigation is required. Accordingly, in the pre-sent study, ND was adopted to determine the bulk residual stressprofile due to its strong penetration in most engineering materials(maximum 25 mm penetration depth for steel [7,10,11]).
Although many studies of the residual stress and distortionsassociated with heat treatments have been performed in recentyears, an exploration of the correlation between the IH processparameters and their effects on distortions and residual stresses isstill needed. This is the purpose of the present study.
The difficulties associated with surface residual stress mea-surements after various surface treatments have attracted consid-erable attention. For example, Hutchings et al. [11] and Prevey [12]pointed out that a significant stress gradient in the ND or XRDsampling volume will affect the stress results. Besides, inmeasuring residual strain by neutron or by X-ray diffraction, it iscritical to obtain accurate measurements of the stress-free latticeparameter, d0. This is because even a small change in d0 can result insignificant changes in the corresponding stress value.
Generally, IH parts exhibit severe hardness variations from thesurface to the bulk, due to the changes in microstructure whichresulted from the phase transformation. This difference in micro-structure can in turn lead to considerable variations in d0 values atcorresponding positions. Therefore, the investigation of d0 fromsample’s surface to the core in IH parts is very important. By virtueof specific formula developed, Prevey andMason [13] calculated thed0 distribution in the normal direction as a function of depth fromthe axial and hoop residual stress measured from an IH sample byXRD. Their d0 profile showed smaller d0 values at the surface(suggesting some decarburization of the part) and some fluctua-tions in d0 in the core material. Ezeilo and Webster [14] measuredd0 at the surface and in the base of a laser surface remelted spec-imen by neutron diffraction. For the intermediate material, a linearvariation of d0 was used. They calculated the residual stress basedon this neutron-measured d0 and compared it with that obtainedby XRD and by thermal-mechanical model. They indicated theimportance of applying appropriate values of the stress-free latticespacing in neutron diffraction stress calculations, if the materialunder investigation has considerable variation in microstructure.
2. Experimental procedure
2.1. Material and specimen geometry
Samples used in this study were made of AISI 4340 steel. Thechemical composition of the specific alloy used is provided inTable 1 [15]. The geometry of the samples is sketched in Fig. 1. It is a7.0 mm thick hollow disc with outside diameter of 106.1 mm andinside diameter of 13.5 mm prior to induction hardening.
Two batches of five disc samples were prepared. Group I sam-ples had an initial hardness of 43 HRC (423 HV) and group IIsamples had an initial hardness of 27 HRC (279 HV).
2.2. Induction surface hardening
The aim of induction hardening is to produce a hard surfacelayer while maintaining the initial hardness (the hardness before
Please cite this article in press as: J. Yi, et al., Distortion and residual strChemistry and Physics (2013), http://dx.doi.org/10.1016/j.matchemphys.2
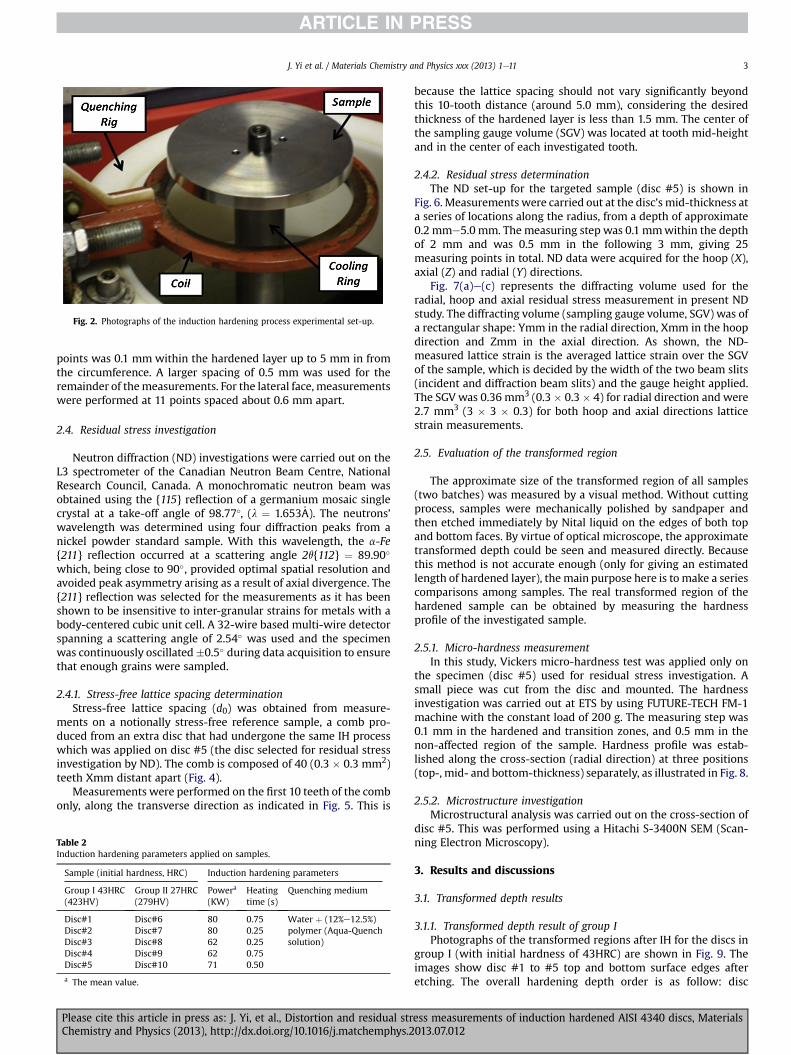
induction hardening) in the core. Fig. 2 contains photographs of theinduction hardening process used in this work.
The inductor was a coil with a coupling distance (the gap be-tween the inside radius of the coil and the outside radius of thedisc) of 1.5 mm. All samples were induction hardened using a fre-quency of 200 kHz. The rotation speeds of the part during heatingand quenching were 360 rpm and 240 rpm respectively. Theheating time and power were varied to generate a range of IHconditions. The disc was firstly quickly heated by the currentgenerated on the surface and then quenched by the Aqua-Quenchsolution (water þ 12% to 12.5% polymer) sprayed from thequenching rig (Fig. 2) to reach room temperature. No additionaltempering treatment was applied. Table 2 shows the selected IHparameters for the two batches.
2.3. Distortion measurement
Distortion measurements were conducted on each disc sampleusing a Mitutoyo Bright-STRATO 7106 coordinate measuring ma-chine (CMM) at room temperature. The probe used in the presentstudy was a ruby ball with a diameter of 1.5 mm. The resolution ofthis equipment is close to �0.1 mm and the experimental repeat-ability was found to be �0.6 mm.
Variations in the coordinates of points located on the three facesof the disc before and after the IH treatment were measured. Asshown in Fig. 3, for the top and bottom faces, distortion measure-ments were carried out from the OD (outside diameter) to 10 mmtowards the center of the disc. For the lateral face, measurementswere performed along the thickness of the disc. For all three faces,measurements were performed at 48 equally-spaced circumfer-ential locations as shown in Fig. 3b. Identical measurement loca-tions were used on the top and bottom faces, resulting in 2880points on each face. Each measuring line comprised 60 measuringpoints. The spacing in the radial direction between measuring
ess measurements of induction hardened AISI 4340 discs, Materials013.07.012
Fig. 2. Photographs of the induction hardening process experimental set-up.
J. Yi et al. / Materials Chemistry and Physics xxx (2013) 1e11 3
points was 0.1 mm within the hardened layer up to 5 mm in fromthe circumference. A larger spacing of 0.5 mm was used for theremainder of themeasurements. For the lateral face, measurementswere performed at 11 points spaced about 0.6 mm apart.
2.4. Residual stress investigation
Neutron diffraction (ND) investigations were carried out on theL3 spectrometer of the Canadian Neutron Beam Centre, NationalResearch Council, Canada. A monochromatic neutron beam wasobtained using the {115} reflection of a germanium mosaic singlecrystal at a take-off angle of 98.77�, (l ¼ 1.653�A). The neutrons’wavelength was determined using four diffraction peaks from anickel powder standard sample. With this wavelength, the a-Fe{211} reflection occurred at a scattering angle 2q{112} ¼ 89.90�
which, being close to 90�, provided optimal spatial resolution andavoided peak asymmetry arising as a result of axial divergence. The{211} reflection was selected for the measurements as it has beenshown to be insensitive to inter-granular strains for metals with abody-centered cubic unit cell. A 32-wire based multi-wire detectorspanning a scattering angle of 2.54� was used and the specimenwas continuously oscillated�0.5� during data acquisition to ensurethat enough grains were sampled.
2.4.1. Stress-free lattice spacing determinationStress-free lattice spacing (d0) was obtained from measure-
ments on a notionally stress-free reference sample, a comb pro-duced from an extra disc that had undergone the same IH processwhich was applied on disc #5 (the disc selected for residual stressinvestigation by ND). The comb is composed of 40 (0.3 � 0.3 mm2)teeth Xmm distant apart (Fig. 4).
Measurements were performed on the first 10 teeth of the combonly, along the transverse direction as indicated in Fig. 5. This is
Table 2Induction hardening parameters applied on samples.
Please cite this article in press as: J. Yi, et al., Distortion and residual strChemistry and Physics (2013), http://dx.doi.org/10.1016/j.matchemphys.2
because the lattice spacing should not vary significantly beyondthis 10-tooth distance (around 5.0 mm), considering the desiredthickness of the hardened layer is less than 1.5 mm. The center ofthe sampling gauge volume (SGV) was located at tooth mid-heightand in the center of each investigated tooth.
2.4.2. Residual stress determinationThe ND set-up for the targeted sample (disc #5) is shown in
Fig. 6. Measurements were carried out at the disc’s mid-thickness ata series of locations along the radius, from a depth of approximate0.2 mme5.0 mm. The measuring step was 0.1 mmwithin the depthof 2 mm and was 0.5 mm in the following 3 mm, giving 25measuring points in total. ND data were acquired for the hoop (X),axial (Z) and radial (Y) directions.
Fig. 7(a)e(c) represents the diffracting volume used for theradial, hoop and axial residual stress measurement in present NDstudy. The diffracting volume (sampling gauge volume, SGV) was ofa rectangular shape: Ymm in the radial direction, Xmm in the hoopdirection and Zmm in the axial direction. As shown, the ND-measured lattice strain is the averaged lattice strain over the SGVof the sample, which is decided by the width of the two beam slits(incident and diffraction beam slits) and the gauge height applied.The SGV was 0.36 mm3 (0.3 � 0.3 � 4) for radial direction and were2.7 mm3 (3 � 3 � 0.3) for both hoop and axial directions latticestrain measurements.
2.5. Evaluation of the transformed region
The approximate size of the transformed region of all samples(two batches) was measured by a visual method. Without cuttingprocess, samples were mechanically polished by sandpaper andthen etched immediately by Nital liquid on the edges of both topand bottom faces. By virtue of optical microscope, the approximatetransformed depth could be seen and measured directly. Becausethis method is not accurate enough (only for giving an estimatedlength of hardened layer), the main purpose here is to make a seriescomparisons among samples. The real transformed region of thehardened sample can be obtained by measuring the hardnessprofile of the investigated sample.
2.5.1. Micro-hardness measurementIn this study, Vickers micro-hardness test was applied only on
the specimen (disc #5) used for residual stress investigation. Asmall piece was cut from the disc and mounted. The hardnessinvestigation was carried out at ETS by using FUTURE-TECH FM-1machine with the constant load of 200 g. The measuring step was0.1 mm in the hardened and transition zones, and 0.5 mm in thenon-affected region of the sample. Hardness profile was estab-lished along the cross-section (radial direction) at three positions(top-, mid- and bottom-thickness) separately, as illustrated in Fig. 8.
2.5.2. Microstructure investigationMicrostructural analysis was carried out on the cross-section of
disc #5. This was performed using a Hitachi S-3400N SEM (Scan-ning Electron Microscopy).
3. Results and discussions
3.1. Transformed depth results
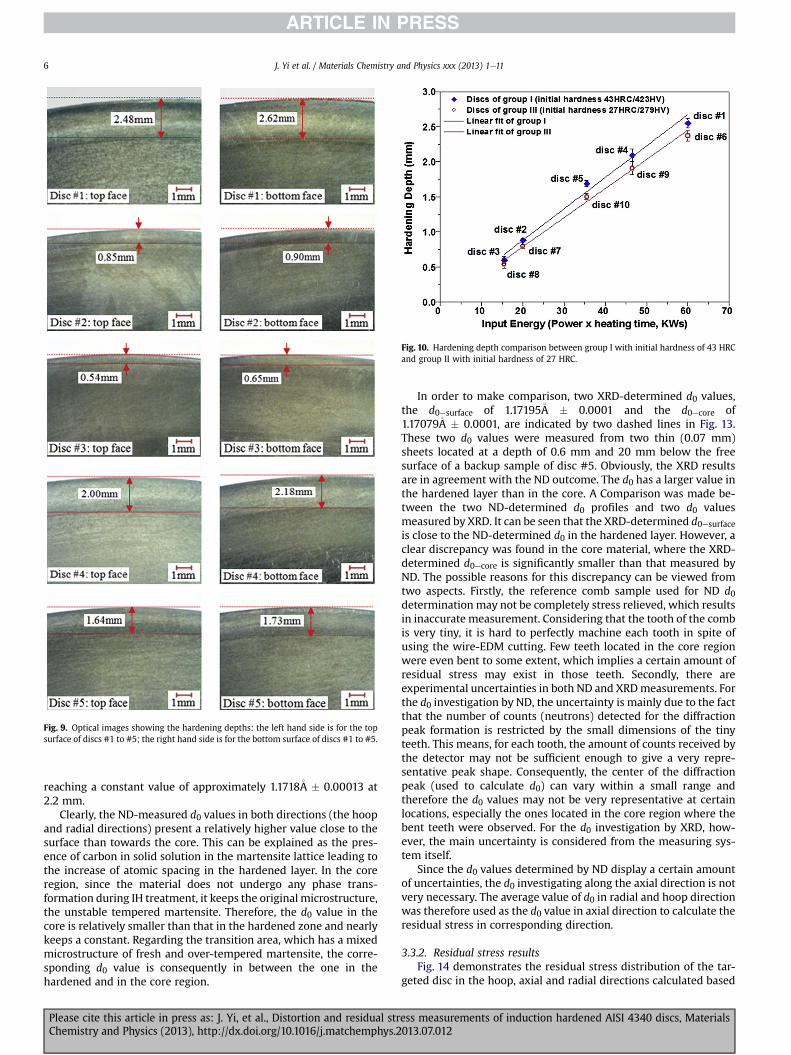
3.1.1. Transformed depth result of group IPhotographs of the transformed regions after IH for the discs in
group I (with initial hardness of 43HRC) are shown in Fig. 9. Theimages show disc #1 to #5 top and bottom surface edges afteretching. The overall hardening depth order is as follow: disc
ess measurements of induction hardened AISI 4340 discs, Materials013.07.012
Fig. 3. (a) A photograph of a typical induction hardened sample and (b) schematic diagram of measuring points distributions on each face.
J. Yi et al. / Materials Chemistry and Physics xxx (2013) 1e114
#1 > disc #4 > disc #5 > disc #2 > disc #3 which follows the levelof energy input (Table 2) (i.e. longer heating time and/or largerinput power). Moreover, it should be noted that all five discs in thisgroup display a similar discrepancy in hardening depth betweenthe top and bottom faces (see Fig. 9). The hardening depth onbottom face is slightly larger than the top one for all cases. Althoughsuch discrepancy is relatively small and therefore the hardeningdepth on the top and bottom faces can be seen as similar, thepossible reasons for this discrepancy need to be discussed. Firstly,this hardening depth difference probably suggests that the discsample was not perfectly centered in the coil before performing theIH processe the disc may be positioned a little higher whichmakesless intense of the magnetic field at the bottom face. On the otherhand, this discrepancy may indicate a non-perfect-flat coil surface.Similar results were obtained for the other group (group II) of discs.
3.1.2. Transformed depth comparison between groups I and IIA comparison of the hardening depths for groups I and II is
shown in Fig. 10. It is clearly shows that for the same IH recipe, discswith a higher initial hardness of 43 HRC (423 HV) display a greaterhardening depth. The results suggest that in order to obtain thesame induction hardening depth, steel samples with a lower initialhardness require more heat input than do steels with a higherinitial hardness. This could be due to the fact that for a givencomposition, the lower hardness steel has a relatively higheraustenite transformation temperature according to the relevantphase transformation diagram [16]. The graph in Fig. 10 also showsthat the hardening depth increases linearly with increasing inputenergy.
3.2. Distortion results
3.2.1. Distortion results of group IOnly distortion results for group I (initial hardness of 43 HRC
(423 HV)) will be discussed here. Similar trends were observed in
Fig. 4. The stress-free reference comb sample photograph taken after wire-EDM.
Please cite this article in press as: J. Yi, et al., Distortion and residual strChemistry and Physics (2013), http://dx.doi.org/10.1016/j.matchemphys.2
group II. Fig. 11(a)e(e) illustrates the dimensional changes of discs#1 to #5 in the axial (left column) and radial (right column) di-rections. The average hardened depth (HDavg) measured from thetop and bottom faces of the corresponding disc are also included forreference. The origin of the coordinate axes was located at thebottom surface of the disc and therefore Z ¼ 0 mm and Z ¼ 7 mm(approximately) represent the bottom and the top surfaces,respectively, as illustrated in Fig. 8.
The DZ profiles on the top and bottom surfaces are approxi-mately symmetric for all samples. The axial distortion patterns arealmost the same on these two faces for every disc. For all of thediscs, the region close to the disc center shows no significant axialdistortion (DZ). In contrast, near the periphery of the disc, thedistortion becomes significant, showing a convex pattern, as if thematerials had undergone some expansion. This could be partly dueto the phase transformation at the surface hardened layer due tothe induction hardening. If comparing the size (maximum of ab-solute DZ) and range of axial distortions among these five discs, itcan be found that the axial distortion sequence yields: disc#1 > disc #4 > disc #5 > disc #2 � disc #3. It is not surprising tonote that disc #1 has the largest while disc #3 has the smallestdistortion, since they correspond to the strongest (longest heatingtimewith highest input power) and weakest (shortest heating timewith smallest input power) IH recipes, respectively.
For the radial distortion (DR) profiles, disc #1 has a differentradial distortion profile from the other discs and distinctly large
Fig. 5. ND set-up of comb sample for unstressed parameter d0 investigations.
ess measurements of induction hardened AISI 4340 discs, Materials013.07.012
Fig. 7. SGV determinations in (a) radial, (b) hoop and (c) axial directions.
Fig. 8. Schematic sketch of the micro-hardness measurement path at three differentthickness positions of the disc.
Fig. 6. ND set-up for radial residual strain measurement of the disc.
J. Yi et al. / Materials Chemistry and Physics xxx (2013) 1e11 5
radial distortion, with DR in the range from approximately�0.06 mm to 0.10 mm. It displays two noticeable protuberancepatterns at each side. This is consistent with its extraordinary largeaxial distortions measured on top and bottom faces. In fact, duringthe induction heating step of disc #1, obvious sparks were observedon the edge of the disc, which suggests the input energy is largeenough to melt the sample at the edge. Therefore, the particularshape of the axial and radial distortions of disc #1 can be attributedto the strongest IH recipe applied. As for the other four discs, theradial distortion profiles demonstrate a similar convex pattern overthe whole disc thickness (Z), with the maximum radius nearby themid-thickness of the disc and the minimum radius at the upper orlower part of the lateral face display as shown in Fig. 11(b)e(e).
3.2.2. Distortion comparison between group I and IIDistortion as a function of input energy is plotted for both
groups of samples in Fig. 12. Samples from both groups show asimilar trend but distortions for group I are systematically higherthan for group II. Therefore, it can be concluded that, under thesame IH treatment, samples with lower initial hardness undergomore distortion than those with higher hardness. This result is incontrast to the hardening depth observation between these twogroups, where the discs with 27 HRC (279 HV) initial hardnessdemonstrated smaller hardening depth than those with 43 HRC(423 HV). If distortions were only due to the transformation pro-cess, one would expect that the more regions transformed, thelarger the resulting distortions. However, the comparison betweenthe results from group I and group II showa different tendency. Thismeans the phase transformation during the IH treatment is not theonly factor that can affect the distortion results.
3.3. Residual stress results
3.3.1. Stress-free lattice spacing d0 resultsFig. 13 shows the stress-free lattice spacing d0 profiles in the
hoop and radial directions measured by ND on the reference(comb) sample. It is compared with the two d0 values in radial di-rection measured from two thin (0.07 mm) layers of a similarsample by XRD.
The ND-measured d0 in the hoop direction firstly demonstratesan increase near the surface, reaching a maximum of1.1729�A � 0.00016 followed by a diminishment with increasingdepth through the hardened case and finally approaching a con-stant value of approximately 1.1715�A � 0.00009 at a depth ofaround 2.0 mm. For the ND-measured d0 in the radial direction,there is only a small variation in the stress-free lattice spacing nearthe surface followed by a smooth decrease towards the center and
Please cite this article in press as: J. Yi, et al., Distortion and residual stress measurements of induction hardened AISI 4340 discs, MaterialsChemistry and Physics (2013), http://dx.doi.org/10.1016/j.matchemphys.2013.07.012
Fig. 10. Hardening depth comparison between group I with initial hardness of 43 HRCand group II with initial hardness of 27 HRC.
Fig. 9. Optical images showing the hardening depths: the left hand side is for the topsurface of discs #1 to #5; the right hand side is for the bottom surface of discs #1 to #5.
J. Yi et al. / Materials Chemistry and Physics xxx (2013) 1e116
reaching a constant value of approximately 1.1718�A � 0.00013 at2.2 mm.
Clearly, the ND-measured d0 values in both directions (the hoopand radial directions) present a relatively higher value close to thesurface than towards the core. This can be explained as the pres-ence of carbon in solid solution in the martensite lattice leading tothe increase of atomic spacing in the hardened layer. In the coreregion, since the material does not undergo any phase trans-formation during IH treatment, it keeps the original microstructure,the unstable tempered martensite. Therefore, the d0 value in thecore is relatively smaller than that in the hardened zone and nearlykeeps a constant. Regarding the transition area, which has a mixedmicrostructure of fresh and over-tempered martensite, the corre-sponding d0 value is consequently in between the one in thehardened and in the core region.
Please cite this article in press as: J. Yi, et al., Distortion and residual strChemistry and Physics (2013), http://dx.doi.org/10.1016/j.matchemphys.2
In order to make comparison, two XRD-determined d0 values,the d0esurface of 1.17195�A � 0.0001 and the d0ecore of1.17079�A � 0.0001, are indicated by two dashed lines in Fig. 13.These two d0 values were measured from two thin (0.07 mm)sheets located at a depth of 0.6 mm and 20 mm below the freesurface of a backup sample of disc #5. Obviously, the XRD resultsare in agreement with the ND outcome. The d0 has a larger value inthe hardened layer than in the core. A Comparison was made be-tween the two ND-determined d0 profiles and two d0 valuesmeasured by XRD. It can be seen that the XRD-determined d0esurfaceis close to the ND-determined d0 in the hardened layer. However, aclear discrepancy was found in the core material, where the XRD-determined d0ecore is significantly smaller than that measured byND. The possible reasons for this discrepancy can be viewed fromtwo aspects. Firstly, the reference comb sample used for ND d0determination may not be completely stress relieved, which resultsin inaccurate measurement. Considering that the tooth of the combis very tiny, it is hard to perfectly machine each tooth in spite ofusing the wire-EDM cutting. Few teeth located in the core regionwere even bent to some extent, which implies a certain amount ofresidual stress may exist in those teeth. Secondly, there areexperimental uncertainties in both ND and XRDmeasurements. Forthe d0 investigation by ND, the uncertainty is mainly due to the factthat the number of counts (neutrons) detected for the diffractionpeak formation is restricted by the small dimensions of the tinyteeth. This means, for each tooth, the amount of counts received bythe detector may not be sufficient enough to give a very repre-sentative peak shape. Consequently, the center of the diffractionpeak (used to calculate d0) can vary within a small range andtherefore the d0 values may not be very representative at certainlocations, especially the ones located in the core region where thebent teeth were observed. For the d0 investigation by XRD, how-ever, the main uncertainty is considered from the measuring sys-tem itself.
Since the d0 values determined by ND display a certain amountof uncertainties, the d0 investigating along the axial direction is notvery necessary. The average value of d0 in radial and hoop directionwas therefore used as the d0 value in axial direction to calculate theresidual stress in corresponding direction.
3.3.2. Residual stress resultsFig. 14 demonstrates the residual stress distribution of the tar-
geted disc in the hoop, axial and radial directions calculated based
ess measurements of induction hardened AISI 4340 discs, Materials013.07.012
Fig. 11. IH distortion results of group I: (a) to (e) represent the axial distortion DZ (the left column) on the top/bottom face along radius of disc #1 to #5, and the radial distortion DR(the right column) on the lateral face along thickness of disc #1 to #5.
J. Yi et al. / Materials Chemistry and Physics xxx (2013) 1e11 7
Please cite this article in press as: J. Yi, et al., Distortion and residual stress measurements of induction hardened AISI 4340 discs, MaterialsChemistry and Physics (2013), http://dx.doi.org/10.1016/j.matchemphys.2013.07.012
Fig. 12. Comparison between group I and II: distortions as a function of input energy. Fig. 14. Residual stress distribution in three directions calculated based on ND-measured d0.
J. Yi et al. / Materials Chemistry and Physics xxx (2013) 1e118
on the ND-measured d0 profiles. Hoop and radial stresses wereobtained from d0 profiles in hoop and radial directions,respectively.
As can be seen from Fig. 14, a compressive residual stress field inthe hoop and axial directions exists in the area close to the surface.This is similar to the work of Coupard et al. [9] and Hornbach et al.[17]. A reversal into tensile stress happens at the radial depth of1.2 mm from the surface in hoop direction and 1.5 mm in axialdirection. The maximum compressive stress in the hoop and axialdirections are of the order of �1120 MPa, and they are observed atthe same radial position (w0.65mm) from the surface. Amaximumtensile stress is found in hoop direction with an approximate valueof 930MPa. On the other hand, the axial stress is much smaller only250 MPa. It implies that the hoop direction of the disc encounteredthe most critical stress condition (largest tensile stress), which isconsistent with the most heat-treated cylindrical samples reportedin the literature [18,19].
In addition, the radial stress is generally expected to be zero atthe surface and the remaining radial (pseudo-normal) stresses areexpected to be low due to the force balance requirement [20]considering the geometry of the sample. It is supported by litera-ture which the heat-treated radial stress profiles show an almostconstant value close to zero or only showing a slight variation overthe whole radial direction [21]. In the present ND study, the radialstress is found to be compressive at the surface and demonstrates
Fig. 13. {112} Radial and hoop stress-free lattice spacing (d0) distributions along discradius, determined from the comb specimen.
Please cite this article in press as: J. Yi, et al., Distortion and residual strChemistry and Physics (2013), http://dx.doi.org/10.1016/j.matchemphys.2
considerable variations along the radial positions within 2 mmfrom the surface. This finding is somewhat puzzling and is incontradiction with the relevant results obtained by Coupard et al.[9] and Prevey et al. [13]. Only Hornbach et al. [17] reported largevariation in radial residual stress for induction hardened gear usingXRD. Nevertheless, this obvious variation in radial direction can besomewhat related to the noticeable experimental errors and un-certainties observed in d0 measurements (Fig. 13). Since the resid-ual stress calculation is based on the reference d0 value, the largerthe possible error and uncertainty, the higher the effects on theresidual stress value. Moreover, the ND experiment itself hascertain uncertainties [11], especially at the region where phasetransformation occurred (i.e. the near-surface area in the presentstudy).
It is interesting to see that after 2.5 mm from the surface, thethree stress profiles gradually merge and nearly coincide at theradial depth of around 5.0 mm at �250 MPa. It probably insinuatesthe beginning of the non-affected core region of the sample.However, the three component residual stresses should be allapproaching to zero in the core material according to the principleof surface hardening stress distribution [22], which has beenproved by numerous experimental works (e.g. the radial residualstress depth profile measured by ND [23] and XRD [24]). Therefore,the present constant stress value of about �250 MPa in the coreshould also be considered as an error which could be attributed tothe corresponding uncertainty and errors existed in stress-free d0measurement such as being not 100% stress-free specimens.
If one uses the d0esurface and d0ecore measured by XRD to re-calculate the residual stress in these three directions, the overallprofiles have shifted up and the results become more balanced inthe core material (Fig. 15).
This observation is easy to be understood from Fig. 13 becausethe two XRD-determined d0 values are relatively smaller than thatobtained by ND, therefore the corresponding stress profiles inFig. 15 move upwards. However, comparing Fig. 15 with Fig. 14 interms of core region, it seems that at the depth relatively far fromthe surface the d0ecore measured by XRD may be closer to the realstress-free lattice spacing of the sample. The most reasonableexplanation for this could be that the d0ecore measured by XRD onthe thin layer is more reliable than the d0 values obtained by ND(considering the significant uncertainty and error of d0 measure-ments in the core region). Nevertheless, in terms of surface andphase transition areas, although the uncertainty of ND is relativelylarge, the d0 profiles obtained by ND are more reliable. Since d0values should vary with the distance due to the phase
ess measurements of induction hardened AISI 4340 discs, Materials013.07.012
Fig. 15. Residual stress distribution in three directions calculated based on d0esurfaceand d0ecore measured by XRD.
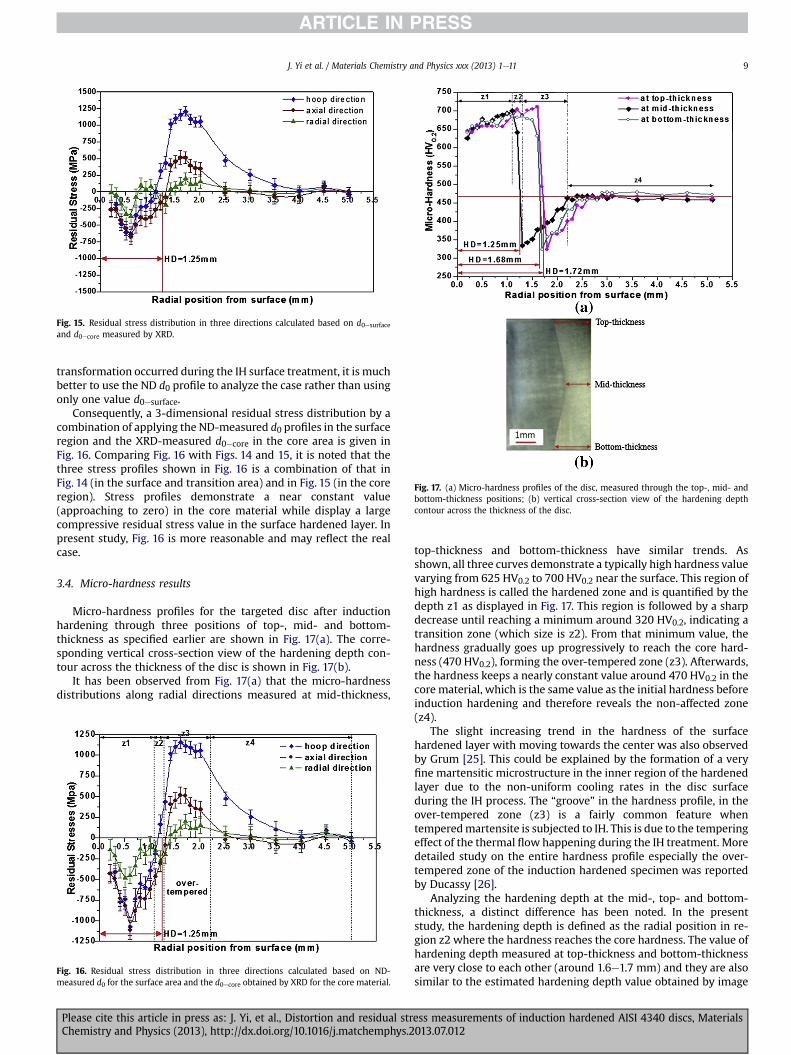
Fig. 17. (a) Micro-hardness profiles of the disc, measured through the top-, mid- andbottom-thickness positions; (b) vertical cross-section view of the hardening depthcontour across the thickness of the disc.
J. Yi et al. / Materials Chemistry and Physics xxx (2013) 1e11 9
transformation occurred during the IH surface treatment, it is muchbetter to use the ND d0 profile to analyze the case rather than usingonly one value d0esurface.
Consequently, a 3-dimensional residual stress distribution by acombination of applying the ND-measured d0 profiles in the surfaceregion and the XRD-measured d0ecore in the core area is given inFig. 16. Comparing Fig. 16 with Figs. 14 and 15, it is noted that thethree stress profiles shown in Fig. 16 is a combination of that inFig. 14 (in the surface and transition area) and in Fig. 15 (in the coreregion). Stress profiles demonstrate a near constant value(approaching to zero) in the core material while display a largecompressive residual stress value in the surface hardened layer. Inpresent study, Fig. 16 is more reasonable and may reflect the realcase.
3.4. Micro-hardness results
Micro-hardness profiles for the targeted disc after inductionhardening through three positions of top-, mid- and bottom-thickness as specified earlier are shown in Fig. 17(a). The corre-sponding vertical cross-section view of the hardening depth con-tour across the thickness of the disc is shown in Fig. 17(b).
It has been observed from Fig. 17(a) that the micro-hardnessdistributions along radial directions measured at mid-thickness,
Fig. 16. Residual stress distribution in three directions calculated based on ND-measured d0 for the surface area and the d0ecore obtained by XRD for the core material.
Please cite this article in press as: J. Yi, et al., Distortion and residual strChemistry and Physics (2013), http://dx.doi.org/10.1016/j.matchemphys.2
top-thickness and bottom-thickness have similar trends. Asshown, all three curves demonstrate a typically high hardness valuevarying from 625 HV0.2 to 700 HV0.2 near the surface. This region ofhigh hardness is called the hardened zone and is quantified by thedepth z1 as displayed in Fig. 17. This region is followed by a sharpdecrease until reaching a minimum around 320 HV0.2, indicating atransition zone (which size is z2). From that minimum value, thehardness gradually goes up progressively to reach the core hard-ness (470 HV0.2), forming the over-tempered zone (z3). Afterwards,the hardness keeps a nearly constant value around 470 HV0.2 in thecore material, which is the same value as the initial hardness beforeinduction hardening and therefore reveals the non-affected zone(z4).
The slight increasing trend in the hardness of the surfacehardened layer with moving towards the center was also observedby Grum [25]. This could be explained by the formation of a veryfine martensitic microstructure in the inner region of the hardenedlayer due to the non-uniform cooling rates in the disc surfaceduring the IH process. The “groove” in the hardness profile, in theover-tempered zone (z3) is a fairly common feature whentemperedmartensite is subjected to IH. This is due to the temperingeffect of the thermal flow happening during the IH treatment. Moredetailed study on the entire hardness profile especially the over-tempered zone of the induction hardened specimen was reportedby Ducassy [26].
Analyzing the hardening depth at the mid-, top- and bottom-thickness, a distinct difference has been noted. In the presentstudy, the hardening depth is defined as the radial position in re-gion z2 where the hardness reaches the core hardness. The value ofhardening depth measured at top-thickness and bottom-thicknessare very close to each other (around 1.6e1.7 mm) and they are alsosimilar to the estimated hardening depth value obtained by image
ess measurements of induction hardened AISI 4340 discs, Materials013.07.012
Fig. 18. Fe{112} diffraction peak FWHM distributions along radius.
J. Yi et al. / Materials Chemistry and Physics xxx (2013) 1e1110
analysis (as described in Section 2.5, using optical microscopy). InFig. 17(b), the red arrows indicate the hardening depth at the top-,mid- and bottom-thickness of the disc. However, they are obviouslylarger than the mid-thickness hardening depth, which is only1.2 mm, leading to a clear and characteristic hardened case profilehas been exposed with a convex shape towards the lateral face(Fig. 17(a)). This variation in the hardening depth at different po-sitions has been viewed as a result of the edge effect caused by theconcentration of the magnetic field at the disc edges [27].
If one compares the residual stress profile with the hardnessprofile (Fig. 17(a)), a sharp transition area can be observed in both
Fig. 19. Microstructures over the cross-section of disc #5: (a) hardened region
Please cite this article in press as: J. Yi, et al., Distortion and residual strChemistry and Physics (2013), http://dx.doi.org/10.1016/j.matchemphys.2
profiles at a similar location, suggesting that the tendency ofcompressive residual stress profile is in accord with the trend of thecorresponding hardness profile. This finding is further supportedby the work of Grum [25] stating that a steeper reduction inhardness may contribute a sharp change of residual stress. More-over, with respect to the radial positions after 2.5 mm, both thehardness distribution and the three residual stress profiles show aconsistent trend. They actually approach to a nearly constant valuetowards the core around the same depth value (3 mm).
3.5. Full width half maximum (FWHM) results
The FWHM profile of the Fe{112} Ka1 diffraction peak is illus-trated in Fig. 18. The relevant hardness curve is also given for betterexplanation. As seen, the overall FWHM profile in the hoop, axialand radial directions are quite similar. The only noticeable differ-ence in peakwidth among them appears within the hardened layer.Regarding the transition zone and core material region, the threeFWHM curves are very close to each other even overlapping atmany radial positions. Besides, all the three FWHM profiles displaya visible variation in the hardened region up to a radial deptharound 1.0 mm below the surface, and such variations could berelated to the likewise hardness fluctuation in surface hardenedregion, suggesting the inhomogeneous microstructure generated inthe surface layer, possibly caused by the dislocations in the hard-ened layer.
Moreover, after the hardened region, the peak width declinesquickly towards the center until reaching a minimum value around0.6� at a radial depth of 1.5 mm, approximately. This is closelyfollowed by a gradual increase to approach a nearly constant valueof 1.0�, revealing the core material zone. The remarkable troughappeared in the FWHM curve is consistent with the similar groove
ess measurements of induction hardened AISI 4340 discs, Materials013.07.012
J. Yi et al. / Materials Chemistry and Physics xxx (2013) 1e11 11
pattern found in the hardness profile (Fig. 17(a)), which could beseen as the material over-tempering nature taking place at the endof the hardened region.
3.6. Microstructure results
The corresponding SEM microstructural analysis of the cross-section of disc #5 is given in Fig. 19. Fig. 19(a)e(d) represents themicrostructure of hardened zone (z1), transition zone or otherwisecalled hardness loss zone (z2), over-tempered zone (z3) and non-affected core zone (z4).
It can be seen from Fig. 19(a) that the microstructure in thehardened zone is completely hard martensite. This is because theheating temperature in this area is above Ac3 and based on the fastcooling, the microstructure can be completely transformed fromaustenite to martensite. A mixed microstructure of hard martensiteand over-tempered martensite is observed in Fig. 19(b), since thetemperature in the transition zone is between Ac1 and Ac3.Fig. 19(c) displays a completely over-tempered martensite micro-structure. In this region, the corresponding temperature is still high(due to the heat flow effect), but without reaching the critical pointAc1, the material is only tempered without being austenitized. Itfinally transforms to a more stable state (i.e., ferrite with dispersedcarbides) which is associated with a loss of hardness, as can be seenfrom the groove in the hardness profile in Fig. 17(a). Fig. 19(d)displays the microstructure of the core of the disc. It is composedof the initial microstructure (the quenched and temperedmartensite) of the sample without being affected by the IH treat-ment. Also, one may observe directly from Fig. 19(c) that the over-tempered martensite microstructure seems to be more disorderedcompared with that in the hardened and core region.
Moreover, since the tempered martensite has larger grain sizethan the quenched one, it can be understood that the grain size inthe over-tempered region is larger than that in the core area andfollowed by the hardened zone. Therefore, the FWHM plot dem-onstrates a drop from surface to core and has a groove in the over-tempered zone, considering the Scherrer formula (FWHM w 1/d)[11].
4. Conclusions
The present study shows that both the IH parameters (heatingtime and input power) and the initial hardness affect the distortionand hardening depth of the samples. Under the same initial hard-ness, increasing IH parameters (heating time or input power) in-crease both the hardening depth and distortions of the disc.However, under the same IH parameters, increasing the initialhardness of the disc increases the hardening depth as it decreasesthe distortions of the disc.
Due to the severe variations of the hardness at the surface of a IHpart, the knowledge of d0 depth distribution is necessary and it cansignificantly affect the residual stress results. A variation of 0.001�Ain d0 in hardened layer can result a difference in residual stressaround 200 MPa in the same region. Both ND- and XRD-measuredd0 results display a visible difference in d0 values between hardenedlayer and core material. Therefore, it is more reasonable to apply
Please cite this article in press as: J. Yi, et al., Distortion and residual strChemistry and Physics (2013), http://dx.doi.org/10.1016/j.matchemphys.2
ND-measured d0 profile to calculate the residual stress near thesurface than using a constant d0esurface value measured by XRD.However, for the core material, the XRD-measured d0ecore is morereliable. The final residual stress distributions are constructedbased on the combination of ND and XRD d0 results.
Acknowledgment
The authors thank Benjamin Larregain from helping with theinduction hardening treatments and Antoine Faure for the devel-opment of the distortion measurement procedure on present andMajid Hoseini for his help in d0 measurements by XRD.
References
[1] R.E. Haimbaugh, Practical Induction Heat Treating, ASM International, Mate-rials Park, OH, 2001, pp. 5e18.
[2] H. Kristoffersen, P. Vomacka, Mater. Des. 22 (2001) 637e644.[3] D.H. Xu, Z.B. Kuang, J. Eng. Mat. Tech. 118 (1996) 571e575.[4] K.A. Young, Machining-induced Residual Stress and Distortion of Thin Parts.
Ph.D. dissertation, Washington University, Saint Louis, MO, May 2005.[5] C.O. Ruud, NDT Int. 15 (1982) 15e23.[6] M.E. Hilley (Ed.), SAE, vol. 784, 1971, pp. 21e24.[7] O. Kirstein, V. Luzin, A. Brule, H. Nguyen, D. Tawfik, Adv. Mater. Res. 41e42
(2008) 439e444.[8] M.G. Moore, W.P. Ewans, SAE Trans. 66 (1958) 340.[9] D. Coupard, T. Palin-luc, P. Bristiel, V. Ji, C. Dumas, Mater. Sci. Eng. A 487
(2008) 328e339.[10] G.A. Webster, in: M.T. Hutchings, A.D. Krawitz (Eds.), Measurement of Re-
sidual and Applied Stress Using Neutron Diffraction, NATO ASI Series E,Kluwer Academic Publishers, Dordrecht, Netherlands, 1992, pp. 21e36.
[11] M.T. Hutchings, P.J. Withers, T.M. Holden, T. Lorentzen, Introduction to theCharacterization of Residual Stress by Neutron Diffraction, Taylor & Francis,Boca Raton, FL, 2005.
[12] P.S. Prevey, in: C. Ruud (Ed.), Practical Applications of Residual Stress Tech-nology, ASM, Materials Park, OH, 1991, pp. 47e54.
[13] P.S. Prevey, P.W. Mason, in: C. Ruud (Ed.), Practical Application of ResidualStress Technology, ASM, Materials Park, OH, 1991, pp. 77e81.
[14] A.N. Ezeilo, G.A. Webster, P.J. Webster, M. Roth, W.J. Muster, in: Proceeding of2nd European Conf. on Adv. Materials and Processes, Euromat 91, Cambridge,1991, pp. 389e394.
[16] C.A. Siebert, D.V. Doane, D.H. Breen, The Hardenability of Steel: Concepts,Metallurgical Influences, and Industrial Applications, ASM, Materials Park,1977, pp. 162e178.
[17] D.J. Hornbach, P.S. Prevey, P.W. Mason, in: Proceeding of the 1st Int. Conf. onInduction Hardened Gears and Critical Components Gear Research Institute,Indianapolis, IN, 1995, pp. 69e76.
[18] M.B. Prime, V.C. Prantil, P. Rangaswamy, F.P. Garcia, Mater. Sci. Forum 347e349 (2000) 223e228.
[19] G.E. Totten, N.I. Kobasko, L.C.F. Canale, in: MECOM 2005-VIII CongresoArgentino de Mecanica Computacional, Buenos Aires, Argentina, 2005, pp.1041e1058.
[20] A. Payzant, S. Spooner, X.J. Zhu, C.R. Hubbard, in: ASME Pressure Vessels andPiping Conference, MTL, Canada, 1996, pp. 21e26.
[21] G. Albertini, et al., Physica B 276e278 (2000) 925e926.[22] P.J. Withers, H.K.D.H. Bhadeshia, Mater. Sci. Technol. 17 (2001) 355e365.[23] M.A. Wells, B.H.- Morales, J.H. Root, E.B. Hawbolt, Physica B 241e243 (1998)
1274e1276.[24] P.M.C.L. Pacheco, M.A. Savi, A.F. Camarão, J. Strain Anal. 36 (2001) 507e512.[25] J. Grum, J. Mater. Process. Technol. 114 (2001) 212e226.[26] C. Ducassy, Prediction de la durete et de la profondeur de la zone de sur-revenu
lors d’une chauffe rapide par induction d’un acier 4340 trempe revenu. M. Ing.Thesis, Ecole de Technologie Superieure, Montreal, QC, Canada, 2010.
[27] N. Barka, A. Chebak, J. Brousseau, Study of edge effect of 4340 steel specimenheated by induction process using axi-symmetric simulation, in: Proceedingsof the Progress in Electromagnetics Research Symposium, Marrakesh, Morocco,Mar, 2011, pp. 1207e1203.
ess measurements of induction hardened AISI 4340 discs, Materials013.07.012