Page 1
Effect of Spray Quenching Rate on Distortion and Residual Stresses during Induction
Hardening of a Full-Float truck Axle
Effect of Spray Quenching Rate on Distortion and Residual Stresses during Induction
Hardening of a Full-Float truck Axle
Zhichao (Charlie) Li, and B. Lynn Ferguson DANTE SOFTWARE, Cleveland, OH 44130, USA
Valentin Nemkov, Robert Goldstein, and John JackowskiFluxtrol, Inc. 1399 Atlantic Blvd, Auburn Hills, MI 28326, USA
Greg FettDana Corporation, 3939 Technology Drive, Maumee, OH43537,
USA
ASM HTS 2013, 27th Conference and Exposition15 September – 18 September 2013, Indianapolis, Indiana, USA
Page 2
IntroductionIntroduction
Induction hardening involves multiple phenomena, including: electromagnetic, thermal, metallurgical, stress and deformation.
Flux software (electromagnetic and thermal capabilities) is coupled with DANTE (thermal, phase transformation, stress and distortion capabilities).
Case chosen for study is a full-float axle, dimensions typical for axles manufactured and hardened by Dana Corporation.
This study is a follow-up of the work presented at HES 2013, Padua, Italy.
Effect of spray quenching rate on residual stresses and distortion.
Slide 2
Page 3
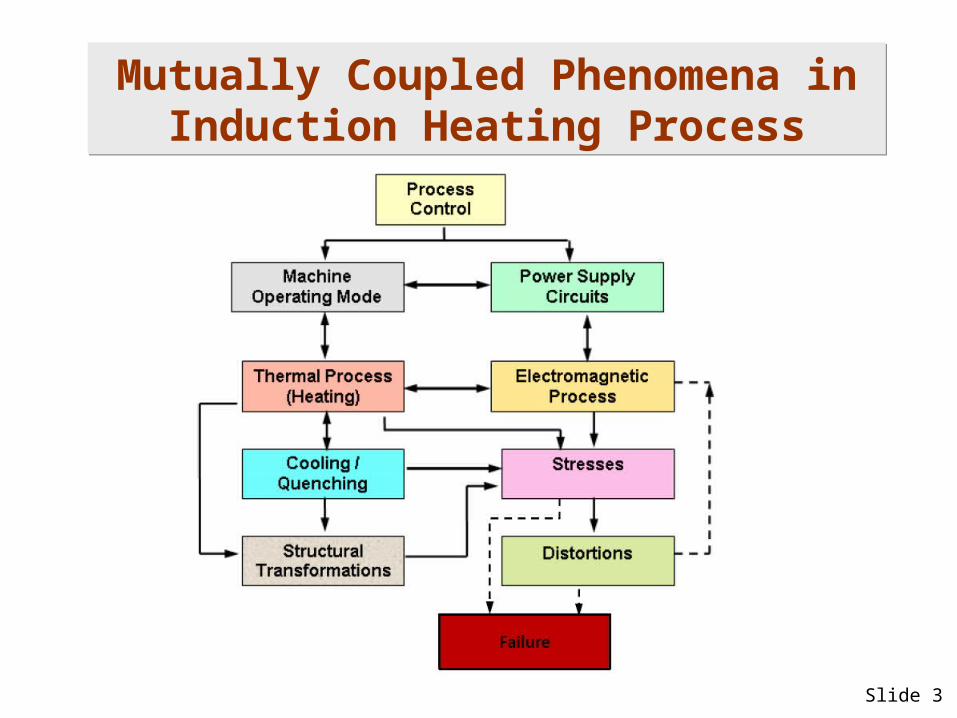
Mutually Coupled Phenomena in Induction Heating Process
Mutually Coupled Phenomena in Induction Heating Process
Slide 3
Page 4
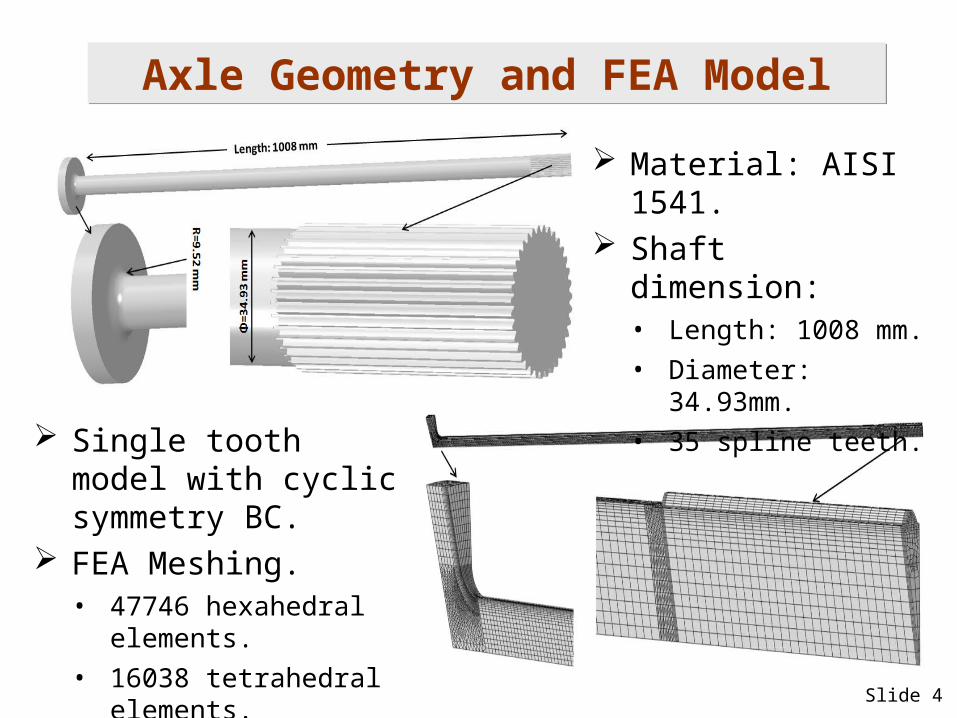
Axle Geometry and FEA ModelAxle Geometry and FEA Model
Slide 4
Material: AISI 1541. Shaft dimension:
• Length: 1008 mm.
• Diameter: 34.93mm.
• 35 spline teeth.
Single tooth model with cyclic symmetry BC.
FEA Meshing.• 47746 hexahedral
elements.
• 16038 tetrahedral elements.
Page 5
Phase TransformationPhase Transformation
Slide 5Material: AISI 1541
Diffusive transformation
Martensitic transformation
Page 6
Two-Turn Inductor Coil Design and Flux2d Modeling
Two-Turn Inductor Coil Design and Flux2d Modeling
Slide 6
Full assembly of a two-turn axle scan coil with quench body
Fillet area of axle modelled with Flux 2D, mesh elements
Page 7
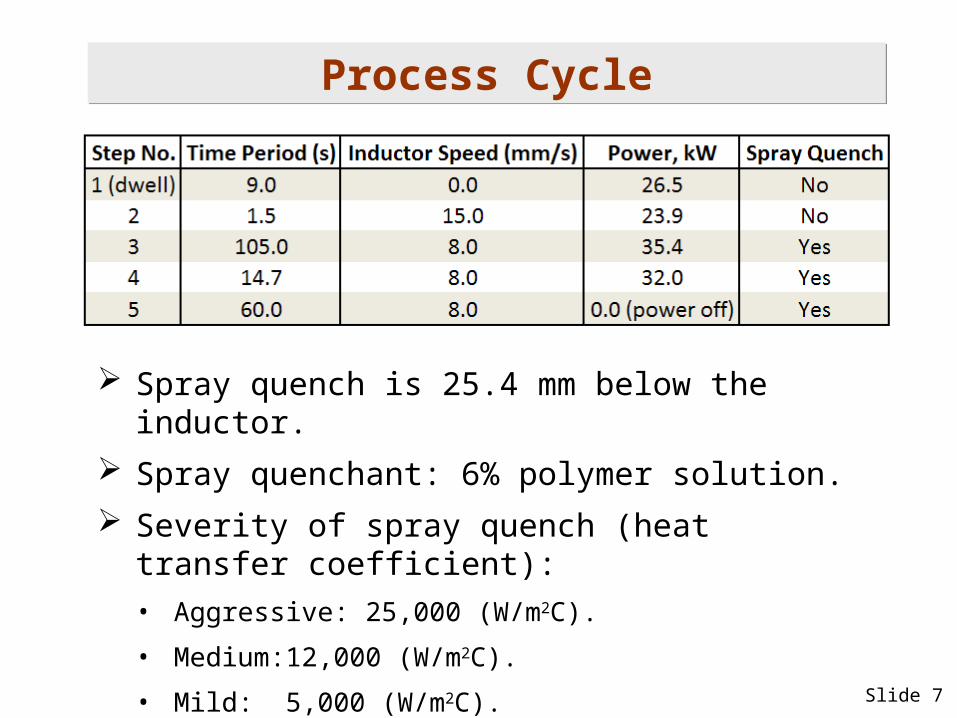
Process CycleProcess Cycle
Slide 7
Spray quench is 25.4 mm below the inductor.
Spray quenchant: 6% polymer solution.
Severity of spray quench (heat transfer coefficient):
• Aggressive: 25,000 (W/m2C).
• Medium:12,000 (W/m2C).
• Mild: 5,000 (W/m2C).
Page 8
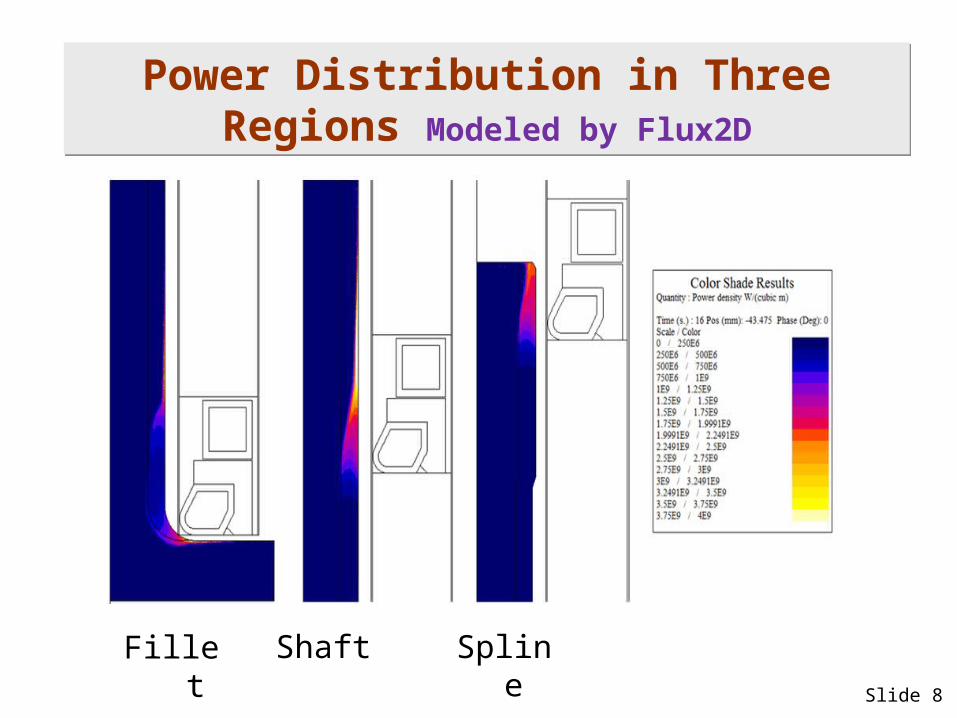
Power Distribution in Three Regions Modeled by Flux2D
Power Distribution in Three Regions Modeled by Flux2D
Slide 8
Fillet Shaft Spline
Page 9
Power Mapping from Flux2D to DANTEPower Mapping from Flux2D to DANTE
Slide 9
Temperature Predicted by Flux2D
Temperature Predicted by DANTE
Good agreement on the temperature distributions predicted by Flux2D and DANTE.• The power mapping from Flux2D to DANTE is valid.
Page 10
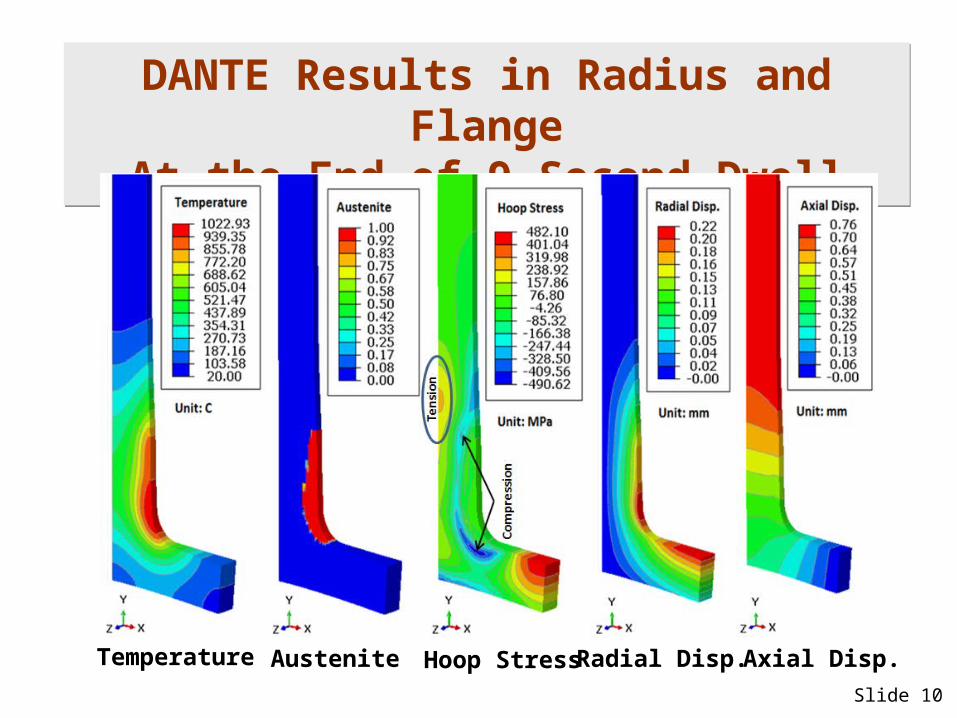
DANTE Results in Radius and FlangeAt the End of 9 Second Dwell
DANTE Results in Radius and FlangeAt the End of 9 Second Dwell
Slide 10
Temperature Austenite Hoop Stress Radial Disp. Axial Disp.
Page 11
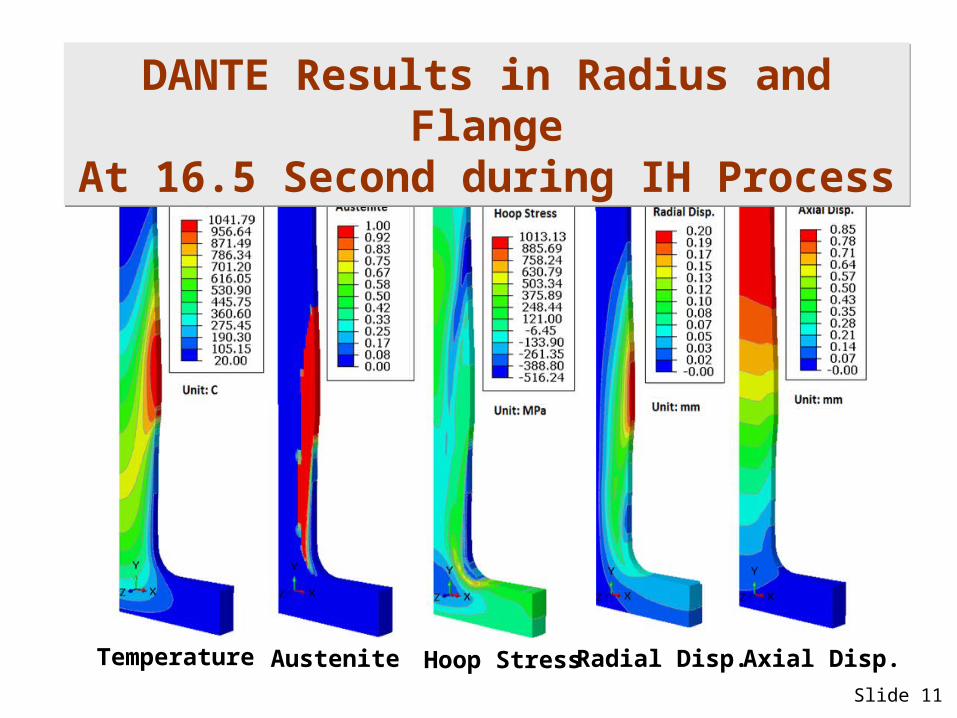
DANTE Results in Radius and FlangeAt 16.5 Second during IH Process
DANTE Results in Radius and FlangeAt 16.5 Second during IH Process
Slide 11
Temperature Austenite Hoop Stress Radial Disp. Axial Disp.
Page 12
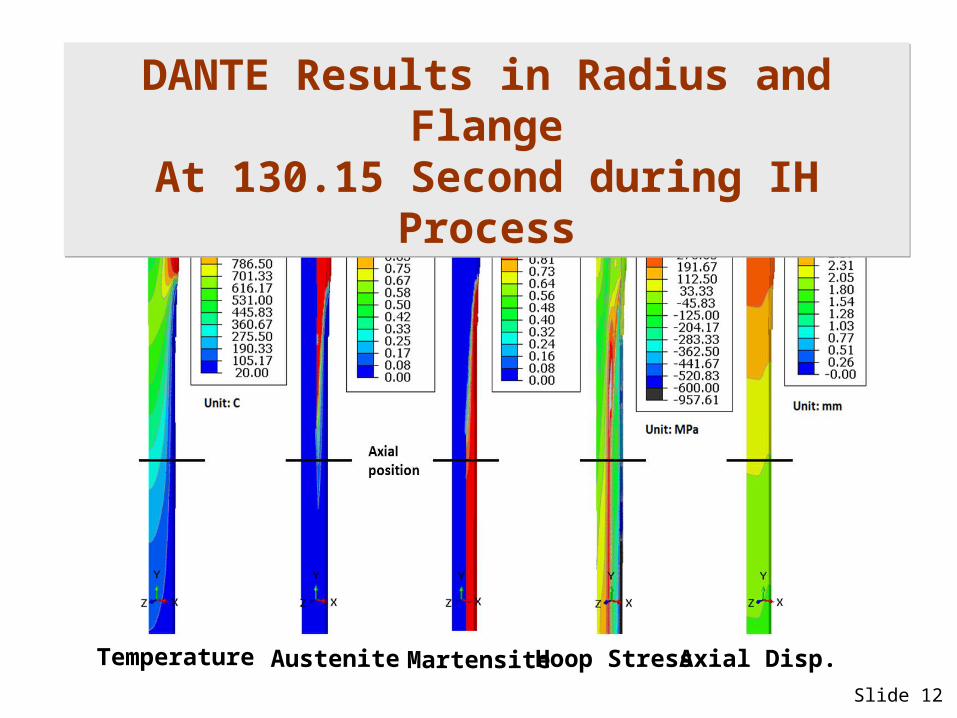
DANTE Results in Radius and FlangeAt 130.15 Second during IH Process
DANTE Results in Radius and FlangeAt 130.15 Second during IH Process
Slide 12
Temperature Austenite Hoop StressMartensite Axial Disp.
Page 13
13
Animation: IH Process HTC=12,000 W/m2C Animation: IH Process HTC=12,000 W/m2C
Page 14
14
Animation: IH Process HTC=5,000 W/m2C Animation: IH Process HTC=5,000 W/m2C
Page 15
15
Animation: IH Process HTC=25,000 W/m2C Animation: IH Process HTC=25,000 W/m2C
Page 16
Axial Residual StressesEffect of Spray Quenching Rate
Axial Residual StressesEffect of Spray Quenching Rate
Slide 16
Unit: MPa
Page 17
Hoop Residual StressesEffect of Spray Quenching Rate
Hoop Residual StressesEffect of Spray Quenching Rate
Slide 17
Unit: MPa
Page 18
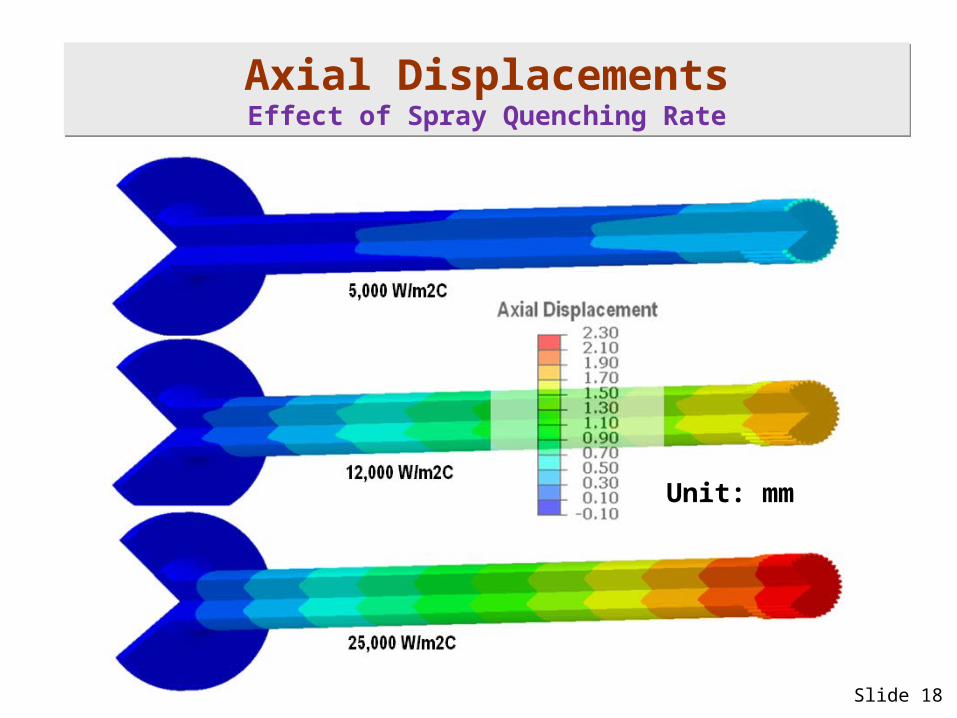
Axial DisplacementsEffect of Spray Quenching RateAxial DisplacementsEffect of Spray Quenching Rate
Slide 18
Unit: mm
Page 19
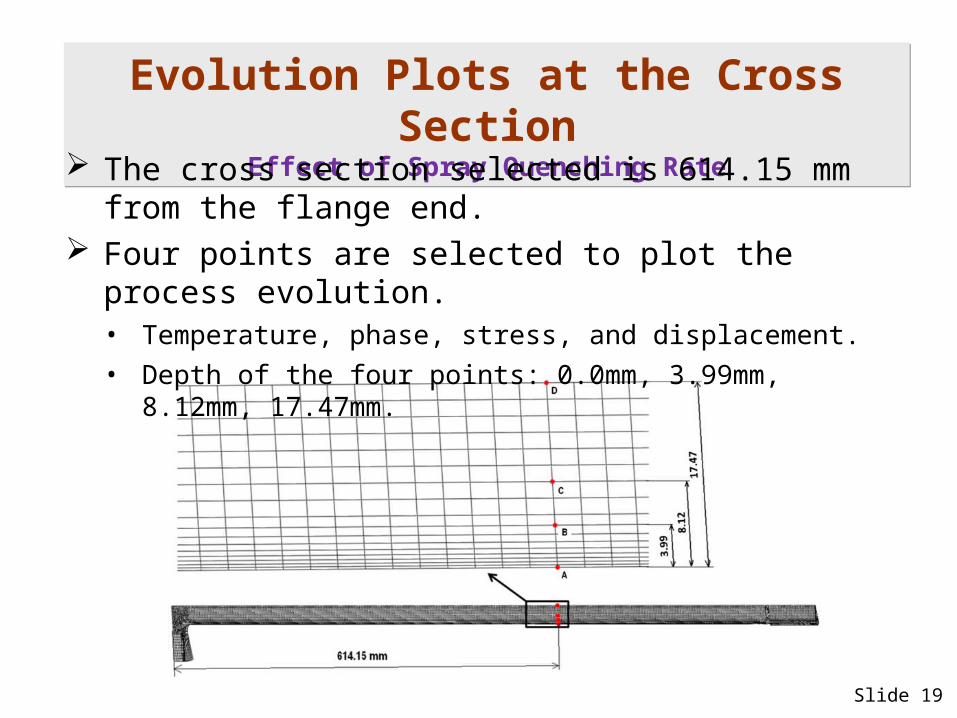
Evolution Plots at the Cross SectionEffect of Spray Quenching Rate
Evolution Plots at the Cross SectionEffect of Spray Quenching Rate
Slide 19
The cross section selected is 614.15 mm from the flange end.
Four points are selected to plot the process evolution. • Temperature, phase, stress, and displacement.
• Depth of the four points: 0.0mm, 3.99mm, 8.12mm, 17.47mm.
Page 20
20
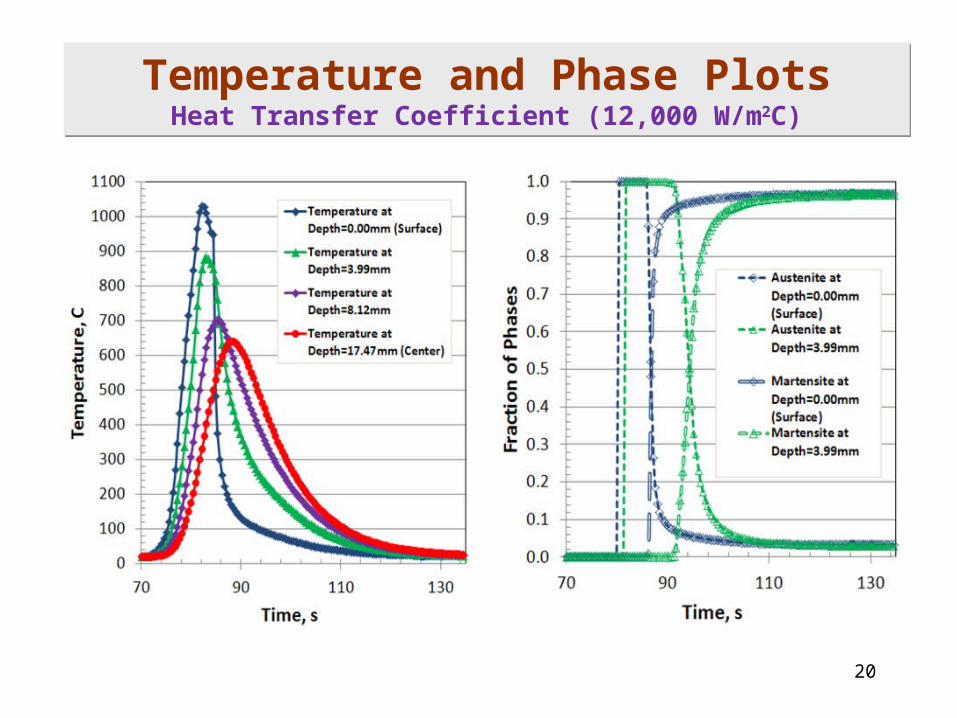
Temperature and Phase PlotsHeat Transfer Coefficient (12,000 W/m2C)
Temperature and Phase PlotsHeat Transfer Coefficient (12,000 W/m2C)
Page 21
21
Axial Stress and Displacement PlotsHeat Transfer Coefficient (12,000 W/m2C)
Axial Stress and Displacement PlotsHeat Transfer Coefficient (12,000 W/m2C)
Page 22
22
Temperature and Phase PlotsEffect of Cooling Rate
Temperature and Phase PlotsEffect of Cooling Rate
Page 23
23
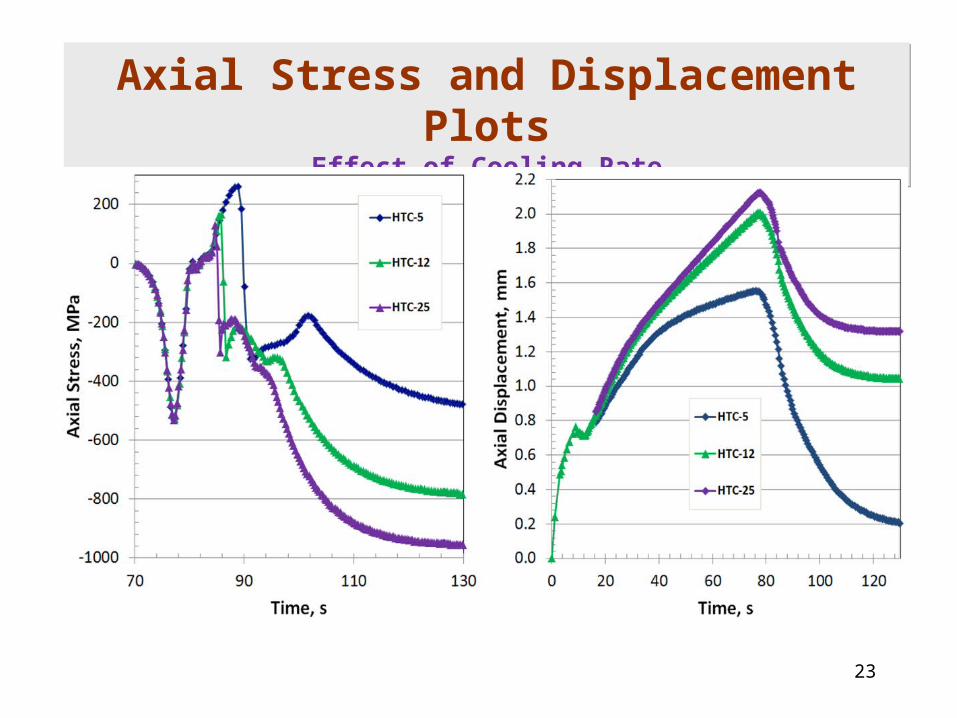
Axial Stress and Displacement PlotsEffect of Cooling Rate
Axial Stress and Displacement PlotsEffect of Cooling Rate
Page 24
24
SummarySummary
Electromagnetic modeling by Flux and thermal/stress modeling by DANTE were successfully coupled.
The effect of spray quenching severity on residual stresses and distortion are predicted.
Higher spray rate increases the magnitudes of surface compression, core tension, as well as the length growth.
The modelling procedure developed in this study is promising for design optimization, in-process failure prevention, and service property prediction.
Next step: tempering process modeling; loading model with residual stresses; comparing with low cycle and high cycle fatigue life experiments.


![[Unlocked] - kobayashi-tools.comkobayashi-tools.com/en/wp-content/themes/kobayashi... · Hardening process of metallic çeat;treatment It receives the oi quenching, the tempering,](https://static.documents.pub/doc/80x56/5f0292cd7e708231d404ef93/unlocked-kobayashi-toolscomkobayashi-toolscomenwp-contentthemeskobayashi.jpg)
