Economic Research Institute for ASEAN and East Asia DISTRIBUTED ENERGY SYSTEM IN SOUTHEAST ASIA By Han Phoumin, Shigeru Kimura, Saleh Abdurrahman, Jiraporn Sirikum, Lana Rose A. Manaligod, and Zaharin Zulkifli
Transcript
Economic Research Institute for ASEAN and East Asia
DISTRIBUTED ENERGY SYSTEM IN SOUTHEAST ASIA
ByHan Phoumin, Shigeru Kimura, Saleh Abdurrahman, Jiraporn Sirikum, Lana Rose A. Manaligod, and Zaharin Zulkifli
All rights reserved. No part of this publication may be reproduced, stored in a retrieval system, or transmitted in any form by any means electronic or mechanical without prior written notice to and permission from ERIA.
The findings, interpretations, and conclusions expressed herein do not necessarily reflect the views and policies of the Economic Research Institute for ASEAN and East Asia, its Governing Board, Academic Advisory Council, or the institutions and governments they represent.
The findings, interpretations, conclusions, and views expressed in their respective chapters are entirely those of the author/s and do not necessarily reflect the views and policies of the Economic Research Institute for ASEAN and East Asia, its Governing Board, Academic Advisory Council, or the institutions and governments they represent. Any error in content or citation in the respective chapters is the sole responsibility of the author/s.
Material in this publication may be freely quoted or reprinted with proper acknowledgement.
This report was prepared by the Working Group for Distributed Energy System (DES) in ASEAN under the Energy Project of the Economic Research Institute for ASEAN and East Asia (ERIA). Members of the Working Group, who were selected from ASEAN, discussed and agreed to certain key assumptions of DES as a basis for writing this report. This aimed to harmonise the forecasting techniques of the future growth of DES. Therefore, the projections presented here should not be viewed as official national projections of participating countries.
Cover Art by Artmosphere Design.
Book Design by Chrestella Budyanto.
National Library of Indonesia Cataloguing-in-Publication DataISBN: 978-602-5460-04-3
The recent economic growth in East Asia Summit (EAS) participating countries, especially the emerging ones, has led to a rapid rise in energy demand. Although these countries have been introducing energy supply infrastructures such as power plants, some of them are still faced with instability and high cost of energy supply as well as high emissions of greenhouse gases (GHGs). DES can solve these challenges due to the increasing availability of small power generation and intelligent grid technologies. It is necessary to assess what role DESs can play so that ASEAN participating countries could utilise these systems. The energy ministers, during the 9th EAS Energy Ministers Meeting, welcomed the DES as they realised the role of DES in enhancing electricity access and providing solutions to energy problems for the well-being of both investors and consumers.
The ASEAN primary energy supply is projected to increase almost threefold from 592 Mtoe in 2013 to 1,697 Mtoe in 2040 (Han and Kimura, 2016). This pattern of increasing energy demand threatens energy security, especially the provision of energy access, affordable prices, and stable energy supply sources. The idea of transboundary grids is being promoted in the ASEAN Power Grid (APG). The APG is expected to contribute significantly to maximising ASEAN’s benefits from avoiding power generation cost; however, transboundary grids are expensive and it may take years to realise the connectivity. DESs, however, can overcome cost constraints that typically inhibit the development of large capital projects and transmission and distribution lines. Thus, this study discusses the opportunities for DES in the ASEAN region to support and foster the convergence of the ASEAN Economic Community and sustainable economic growth by providing affordable, reliable, and better energy sources with less GHG emissions through DES application.
Preface and Acknowledgement
This study is a joint effort of Working Group members from selected ASEAN member states. It took a long time to agree on a definition and the assumptions of DES. The estimated future potential of DES for ASEAN as well as some selected ASEAN Member States is in line with the policy interests of ASEAN’s energy security. We would like to acknowledge the support of everyone involved, and thank all those the authors of this study met and interviewed to obtain country data and information.
Special thanks go to Stefan Wesiak, chief editor and publication director of ERIA, and his team of editors and publishing staff for their help in editing the report and preparing it for publication.
The Authors
ContentsExecutive Summary 1 Chapter 1 Introduction and Methodology 5
Chapter 2 The Potential of Distributed Energy System from 14 Renewable Energy in ASEAN Chapter 3 Distributed Energy system in Indonesia 35 Chapter 4 Distributed Energy System in Malaysia 82 Chapter 5 Distributed Energy System in the Philippines 106 Chapter 6 Distributed Energy System in Thailand 139 Chapter 7 Conclusions and Policy Implications 155 References 160
11
Executive Summary
The recent economic growth in East Asia Summit (EAS) participating countries, especially emerging ones, has driven energy demand to rapidly rise. Although these countries have been introducing energy supply infrastructures such as power plants, some of them still face instability, high cost of energy supply, and high emission of greenhouse gases (GHGs). For example, islands, mountainous areas, and other remote off-grid areas mainly rely on diesel power and other energy sources, where high energy costs and reduced GHG emissions are the big challenge. Industrial and commercial zones of emerging countries of the Association of Southeast Asian Nations (ASEAN) are sometimes faced with unstable energy supply. This is likely to prevent companies from investing and providing goods and services. Distributed Energy Systems (DESs) can solve these challenges due to the increasing availability of small power generation and intelligent grid technologies. It is necessary to find what role DESs can play so that ASEAN participating countries could utilise these systems. The energy ministers, during the 9th EAS Energy Ministers Meeting, welcomed the DES study as they realised the role of DES in enhancing electricity access and providing solutions to energy problems for the well-being of both investors and consumers.
The DES concept is not new, and it has been applied since the start of power generation in the late 18th century when Thomas Edison built the first power plant to provide electrical and mechanical power at or near the point of use (Brandon, 2014). Now, the DES concept and application have been widely used to respond to increasing energy demand. The flexibility of DES at multiple locations makes it economically and technically viable, attracting many industrial, commercial, and residential units. Most widely installed DESs can be found in mountainous, island, and remote areas and in economic zones with microgrids because of their scale and flexibility.
Globally DES has gained popularity to provide secure, reliable, and affordable energy to customers. The wave of decentralised energy systems through DES applications is gaining market share because of their lower capital cost, thus making energy affordable in many parts of the world. The technological development of small and distributed generators from all types of energy sources (diesel, gas, coal slurry, wind, solar, geothermal, and mini-hydropower) has become more effective and less costly today
2 Distributed Energy System in Southeast Asia
than they were a decade ago. DES creates a decentralised power system through which distributed generators meet local power demand. Because they are small and have lower capital requirements, they can be built and made operational faster with less risk than large power plants.
The ASEAN primary energy supply is projected to increase by almost threefold from 592 Mtoe in 2013 to 1,697 Mtoe in 2040 (Han and Kimura, 2016). This pattern of increasing energy demand threatens energy security, especially the provision of energy access, affordable price, and stable energy supply sources. The idea of transboundary grids is being promoted in the ASEAN Power Grid (APG). The APG is expected to significantly maximise ASEAN’s benefit from avoiding power generation costs; however, they are expensive and it may take years to realise the connectivity. In contrast, DES can overcome cost constraints that typically inhibit the development of large capital projects and transmission and distribution lines.
Thus, this study will map out the current situation of DES in selected ASEAN Member States, and discuss the opportunities for DES in the ASEAN region to support and foster the convergence of the ASEAN Economic Community and sustainable economic growth by providing affordable, reliable, and better energy sources with less GHG emissions.
Chapter 1 introduces DES and discusses the methodology of DES in ASEAN. Chapter 2 estimates the potential of ASEAN’s DES from renewable energy. Chapters 3 to 6 are studies of Indonesia, Malaysia, the Philippines, and Thailand on DES and policies. The book is the first of its kind to come up with DES in ASEAN and in specific countries. The findings are as follows:
ASEAN
The estimated power generation from combined renewable energy such as wind, solar photovoltaic, geothermal, hydropower, and biomass in ASEAN will increase significantly from the business-as-usual scenario (BAU) to the alternative policy scenario (APS), thus implying investment opportunities in this sector. Investment opportunities in BAU by 2040 for combined solar, wind, biomass, hydropower, and geothermal total about US$34 billion, and in the APS, about US$56 billion. Amongst DES-related renewable investment, that for solar and geothermal power is expected to double from BAU to the APS. Investment in wind power will increase more than threefold to meet the expected generation output by 2040. The introduction of DES application also implies reduced CO2 emissions of about 46.1–64.6 million metric tons from BAU to the APS, respectively.
3Executive Summary
Indonesia
DES can be implemented in regions like Indonesia where supply of grid-connected electricity is not available or not economically viable. It can also support electrification in a faster way rather than wait for grid-connected supply. DES is cost competitive compared to current diesel power plants. As DES projects use local energy resources, and are not necessarily technology intensive, these projects may also increase the involvement of local people in the construction and maintenance of the system, which may create jobs in the region.
As the potential of DES is huge in Indonesia, its development project can be even faster with the participation of local governments, for example, in providing lands for free for the site of the DES project. To optimise the development of DES projects and ensure their sustainability, government support – such as tax incentives, availability of low interest loan with longer tenor, and streamlined licensing process – is needed. Good electricity tariff for DES that considers the production costs and reasonable margins is also needed.
Malaysia
The implementation of DES is very important for the security of supply especially in remote areas where the connectivity is far from the grid. To ensure the stability of electricity supply without any disruption, equipment and other requirements for electricity generation should be properly installed and completed. It is costlier to install the transmission or distribution line to the national grid from remote areas. Using existing natural resources, such as biomass or biogas, DES can also reduce GHG emissions.
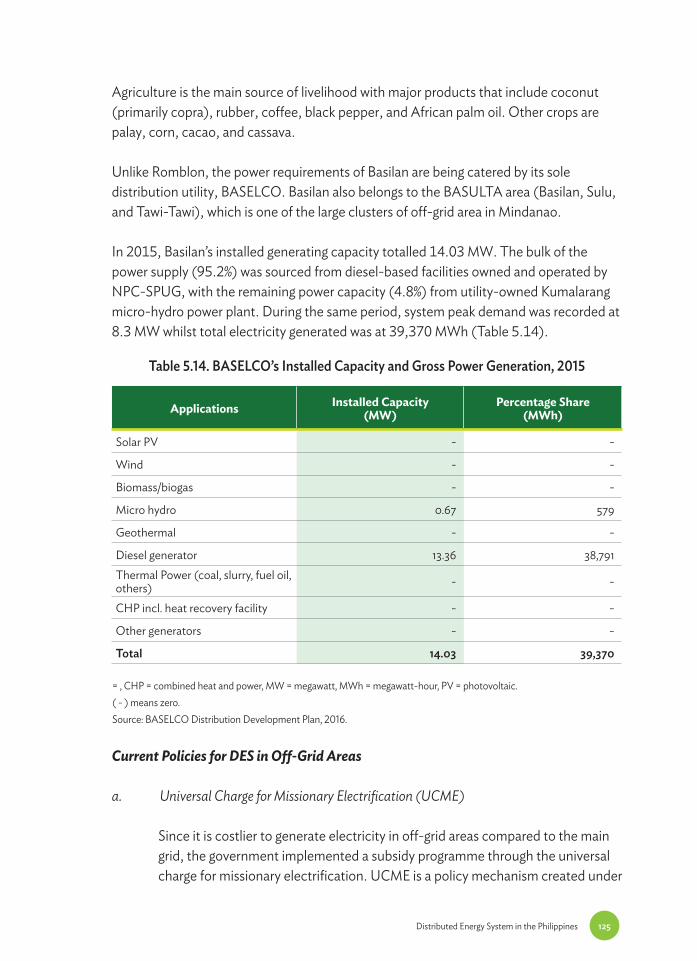
Through DES, a 100% electrification rate in rural areas can be achieved. Providing this basic amenity will help generate income for the economy. DES will also boost tourism on several islands of Malaysia. With some remote islands in the country located far from the national grid system, the implementation of DES will be a great solution. Public and private funds are needed to ensure the success of DES’ implementation. Government can offer attractive incentives to attract local and international investors.
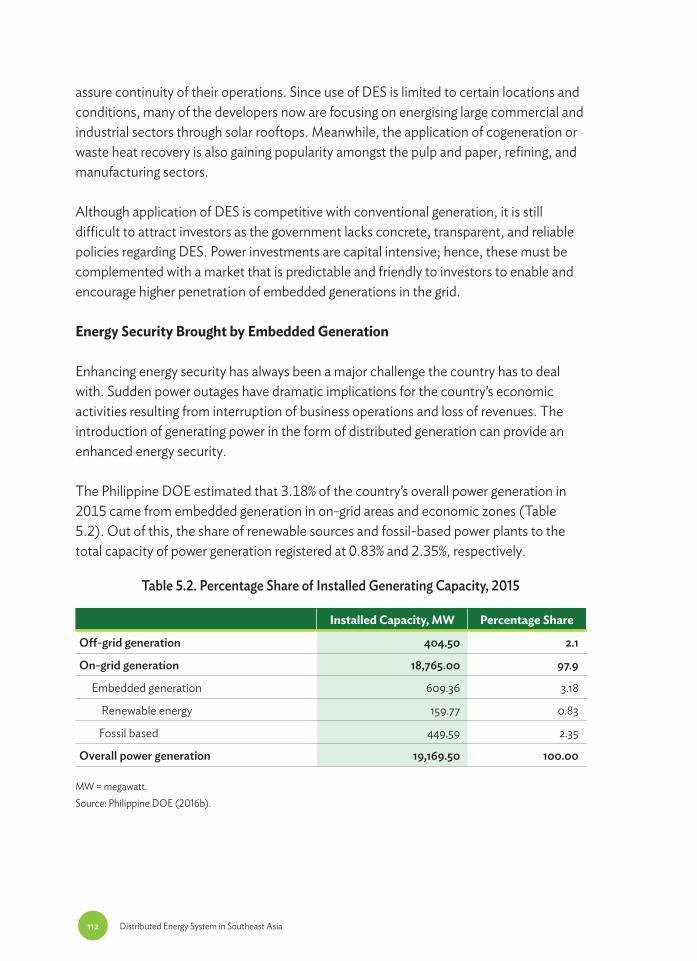
Philippines
Evidently, the underlying principles of DES present substantial potentials that correspond to the current setting of the Philippine electric power industry, either through on-site embedded generation or stand-alone off-grid systems. As the
4 Distributed Energy System in Southeast Asia
government aspires to bring inclusive economic development to the grassroots level, the concept of DES applications undeniably has an integral role in ensuring the security of energy supply in the flourishing economic and industrial zones of the country, and, more importantly, in the remote communities.
Government has recognised that the deployment of DES applications is an alternative platform to complement centralised and decentralised electrification initiatives. Harnessing the full potential of the cleaner set of fuels such as renewables is admittedly an effective mitigating measure to drastically reduce GHG emissions. This in the long run is foreseen to counter the adverse impacts of climate change. To take full advantage of this benefit, the country should pursue the development and increased use of indigenous renewable energy sources that are abundant in rural locations. However, strong policy support and mechanisms from the government are imperative.
Fundamentally, DES applications are intended to provide an affordable and reasonable source of electricity. But because the private sector lacks confidence to invest in the off-grid generation business, the national government assumes the responsibility of bringing the necessary electricity services to spur local economic development. To sustain the operations of DES in off-grid communities, government subsidises the costs of generating power. In turn, DESs have become costly compared to grid-connected power systems.
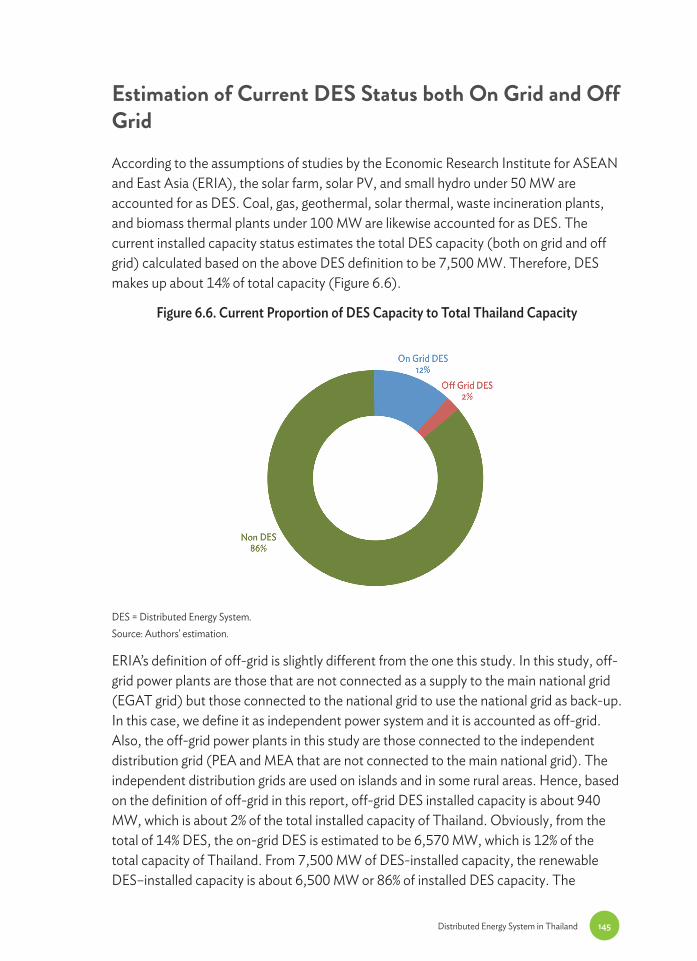
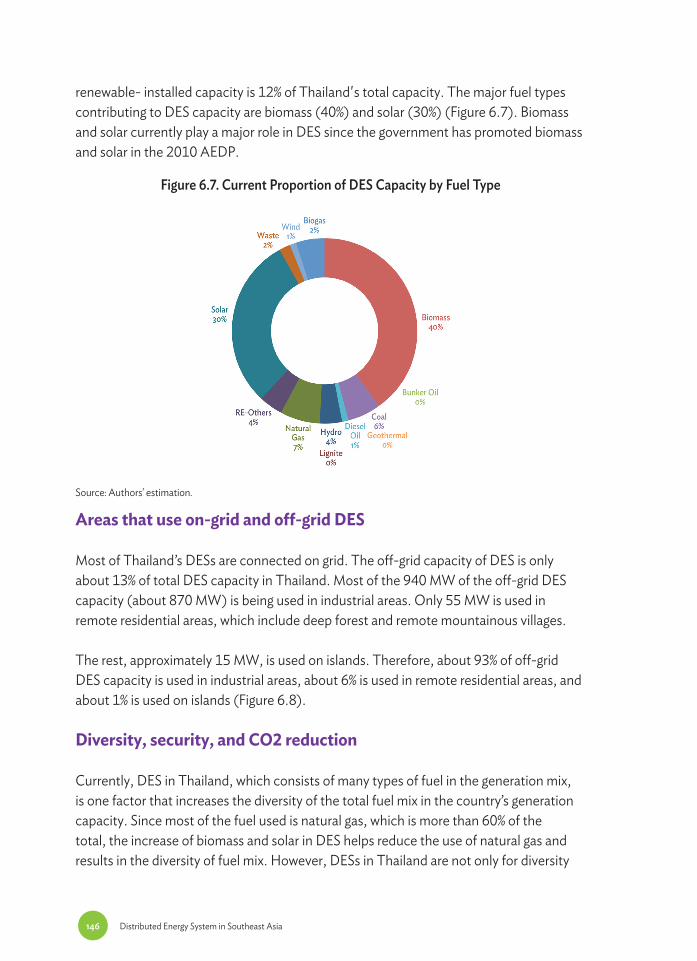
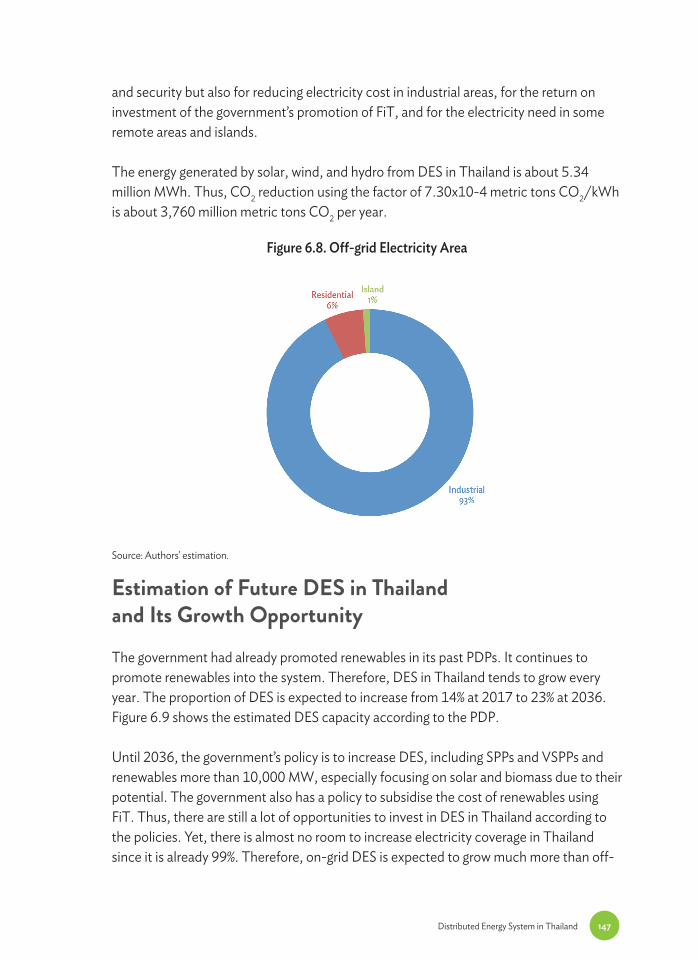
Thailand
DESs in Thailand are mainly used in the private industrial section and investment according to the Thai government’s policy on subsidy. DESs in Thailand mainly promote solar and biomass. The on-grid DES of the country is expected to grow in the near future. Per the current policy on DES, about 10,000 MW of DES growth is expected. However, off-grid DES demand could skyrocket were the price of the self-generated electricity to be lower than that of retailed electricity.
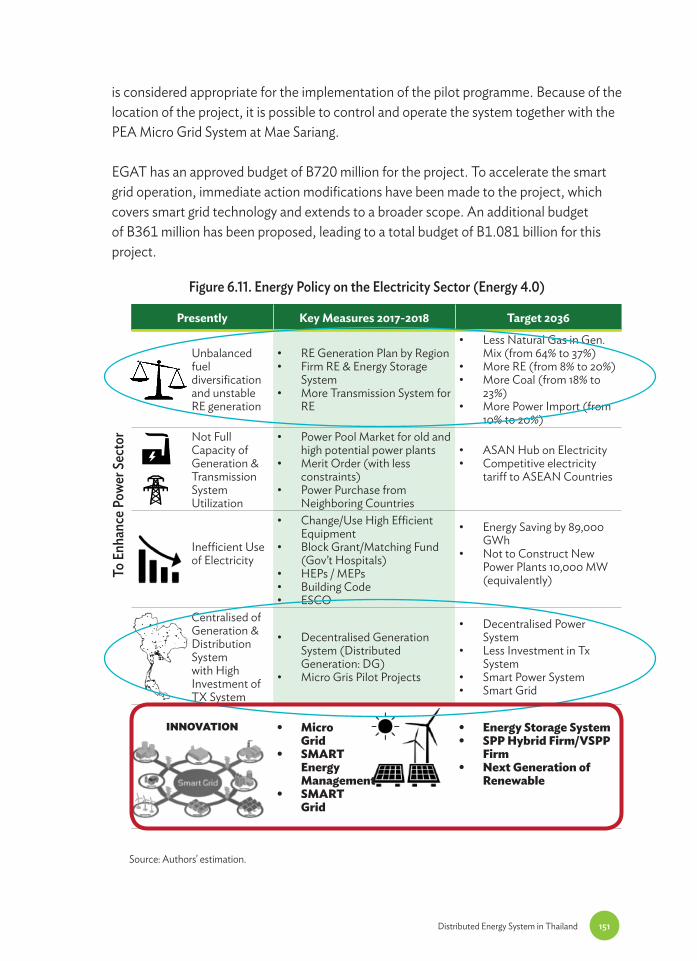
The new Cabinet provided the direction of Energy 4.0. To accommodate the government’s policy, the Ministry of Energy has placed the Energy 4.0 policy focused on the Thailand Integrated Energy Blueprint to drive energy innovation and to continue the desire of King Rama IX to strengthen families and communities. To enhance the power sector, the Ministry of Energy has set policies related to DES in two areas: for places where unbalanced fuel diversification and unstable renewable generation occurred, and for places where centralised generation and distribution systems are faced with high investment in the transmission system.
55
Chapter 1Introduction and Methodology of Distributed Energy System
Background and Objective
The recent economic growth in East Asia Summit (EAS) participating countries, especially emerging ones, has driven energy demand to rapidly rise. Although these countries have been introducing energy supply infrastructures such as power plants, some of them are still faced with instability, high cost of energy supply, and high emissions of greenhouse gases (GHGs). For example, islands, mountainous, and other remote off-grid areas mainly rely on diesel power and other energy sources, where high energy costs and reduced GHGs emissions are the big challenge. In the emerging countries of ASEAN, industrial and commercial zones, which contribute to economic growth, are sometimes faced with unstable energy supply; this will likely prevent companies from investing and providing goods and services. Distributed energy systems (DESs) can solve these challenges due to the increasing availability of small power generation and intelligent grid technologies. It is necessary to find what role DESs can play so that ASEAN participating countries could utilise these systems. The energy ministers, during the 9th EAS Energy Ministers Meeting, welcomed the DES study as they realised the role of DES in enhancing electricity access and providing solutions to energy problems for the well-being of both investors and consumers.
The DES concept is not new, and it has been applied since the start of power generation in the late 18th century when Thomas Edison built the first power plant to provide electrical and mechanical power at or near the point of use (Brandon, 2014). Now the DES concept and application have been widely used to respond to increasing energy demand. The flexibility of DES at multiple locations makes it economically and technically viable, attracting many industrial, commercial, and residential units. Most widely installed DESs can be found in mountainous, island, and remote areas and economic zones with microgrids because of their scale and flexibility.
Globally DES has gained popularity to provide secure, reliable, and affordable energy to customers. The wave of decentralised energy systems through DES applications is
6 Distributed Energy System in Southeast Asia
gaining market share because of their lower capital cost, thus making energy affordable in many parts of the world. The technological development of small and distributed generators from all types of energy sources (diesel, gas, coal slurry, wind, solar, geothermal, and mini-hydropower) has become more effective and less costly today than they were a decade ago. DES creates a decentralised power system through which distributed generators meet local power demand. Because they are small and have lower capital requirements, they can be built and made operational faster with less risk than large power plants.
The ASEAN primary energy supply is projected to increase by almost threefold from 592 Mtoe in 2013 to 1,697 Mtoe in 2040 (Kimura and Han, 2016). This pattern of increasing energy demand threatens energy security, especially the provision of energy access, affordable price, and stable energy supply sources. The idea of transboundary grids is being promoted in the ASEAN Power Grid (APG). The APG is expected to significantly maximise ASEAN’s benefit from avoiding power generation costs; however, they are expensive and it may take years to realise the connectivity. DESs, however, can overcome cost constraints that typically inhibit the development of large capital projects and transmission and distribution lines.
Thus, this study will map out the current situation of DES in selected ASEAN member states and discuss the opportunities for DES in the ASEAN region to support and foster the convergence of the ASEAN Economic Community and sustainable economic growth by providing affordable, reliable, and better energy sources with less GHG emissions.
Hypotheses of the Study
This study tries to understand the overall status and policies of DESs in selected ASEAN countries through a literature survey and information exchange with relevant parties, such as meetings of the ASEAN Renewable Energy Sub-Sector Network, Energy Research Institute Network, Japan–ASEAN Capacity Building Programme, and other conferences. The study focuses on the following key questions:
• Status of DESs, including - what kind of DESs have been introduced, and - how much energy they have supplied.
• Existing policies to promote introduction of the systems, such as - strategies, master plans, and roadmaps;
7Introduction and Methodology of Distributed Energy System
- incentives/subsidies for renewable energy through the introduction of various policy instruments; - government-led model projects; and - small power producers (SPP) programmes.
• Analysis of the outcomes of the policies: - what kinds of DESs the policies have promoted; - how much energy they have supplied; and - what kind of impacts the introduction has had on stable supply of energy, electricity tariff, environment, and others on the communities and on the country.
The study developed questionnaires to address the above hypotheses that are critical in understanding the status, policies, and potentials of DESs in the ASEAN region. Since information on DES in each ASEAN country is difficult to capture, this study relies on various information from the power development plan, or any energy master plan of country studies.
Methodology of the Study
This study considered DES as a flexible energy system. It is small yet effective in responding to the growing energy demand. DES could offer an off-grid energy system for economic zones and isolated and remote areas. For urban areas, it could offer a smart energy system that could be integrated into the national grid system.
Generally, DES refers to two classes of technologies. First are the renewable energy sources, which include biomass, solar, and hydro, with generating capacities scaled from a few kilowatts to as much as 10 megawatts (MW). Renewable energy technologies can either be integrated into local distribution grids or as ‘stand-alone’ systems in areas where extension of transmission lines is not economically viable. Second, DES is an on-site generation system and usually refers to industrial cogeneration or combined heat and power (CHP) systems that are fired by gas or coal slurry. Cogeneration allows consumers to save much of the fuel and cost of generating electricity and heat by using one facility, instead of a power plant to make electricity and boilers to make heat.
To define DES, the working group of the DES study set up by ERIA considers the scope of the installed capacity of distributed generations by type of fuel as follows:
8 Distributed Energy System in Southeast Asia
• Solar farm, solar PV, small hydro is the development of solar and hydroelectric power on a scale serving a small community or industrial plant. The definition of solar farm and a small hydro project varies but a generating capacity of 1–10 MW is generally acceptable, which aligns to the concept of distributed generation.• However, small and mini thermal power plants are generally in the form of small and very small power producers (SPPs and VSPPs) in ASEAN countries. Generally, coal, gas, nuclear, geothermal, solar thermal electric, waste incineration plants, and biomass-fuelled thermal power plants are DESs if they have capacities of less than 100 MW.
Given the limited availability of data on DES in ASEAN member states, it is very crucial to roll out questionnaires (see Annex 1) designed to capture information gaps on DES. The Ministry of Economy, Trade and Industry of Japan commissioned the Economic Research Institute of ASEAN and East Asia (ERIA) to carry out this important study.
Thus, ERIA formed a working group to collect data and information through questionnaires distributed to selected ASEAN member states. The working group consisted of representatives from Cambodia, Indonesia, Malaysia, Philippines, and Thailand.
ERIA also designed the reporting template for each selected researcher to write for respective DES’s situation and analysis of their countries (See Designed Questionnaire for Distributed Energy System, p. 5 ).
Scope of the Study
The regional and country reports • highlight the merits of DES of each country studied;• classify several patterns in the country case study (site survey) such as industry zone and off grid (islands) and study the economy of DES, energy security brought by DES, reduction of carbon dioxide (CO2) by DES, and cost–benefit analysis of grid and off-grid systems; and• elucidate the feasibility of installing DES in ASEAN.
9Introduction and Methodology of Distributed Energy System
Designed Questionnaire for Distributed Energy System
Definition of DES: this study also considers the installed capacity of distributed generations by type of fuels as follows:
- Solar farm, solar PV, small hydro refer to the development of solar and hydroelectric power on a scale serving a small community or industrial plant. The definition of a solar farm and a small hydro project varies, but a generating capacity of 1 to 10 megawatts (MW) is generally acceptable, which aligns to the concept of distributed generation.
- However, the small and mini thermal power plants are generally in the form of small and very small power producers (SPPs and VSPPs) in ASEAN countries. Generally, coal, gas, nuclear, geothermal, solar thermal electric, waste incineration plants, and biomass-fuelled thermal power plants, are DESs if they have capacities of less than 100 MW.
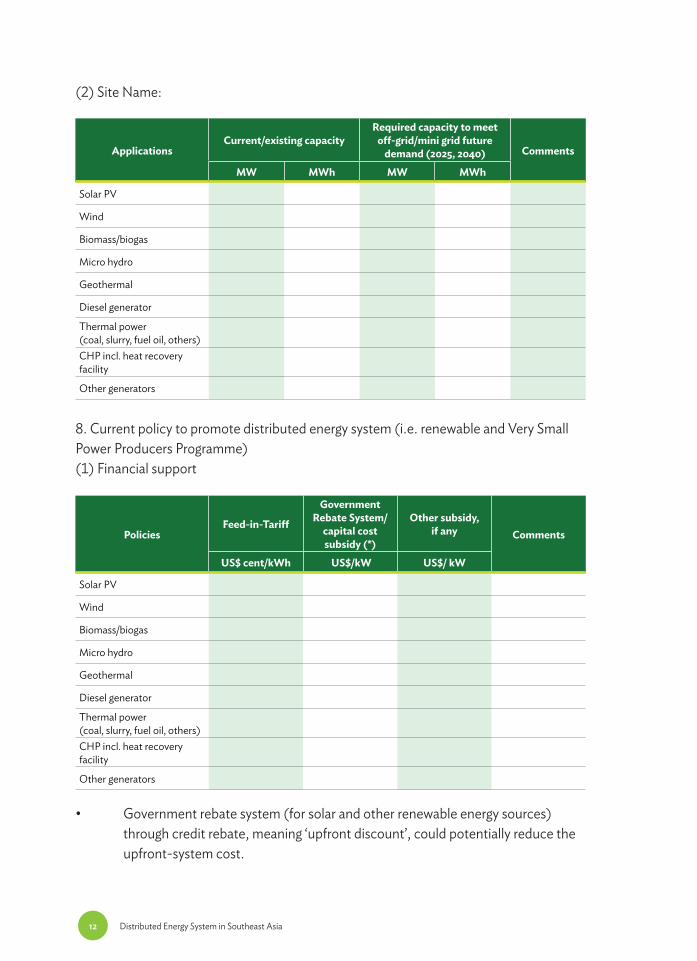
1. Country Name:2. Energy access/Electrification rate: % (percent) Year: (year of the data)3. Current average off-grid/mini-grid electricity tariff: cent/kWh4. What kind of distributed energy system (off-grid energy system)?
ApplicationsCurrent/existing capacity
Required capacity to meet off-grid/mini grid future
• Government rebate system (for solar and other renewable energy sources) through credit rebate, meaning ‘upfront discount’, could potentially reduce the upfront-system cost.
13Introduction and Methodology of Distributed Energy System
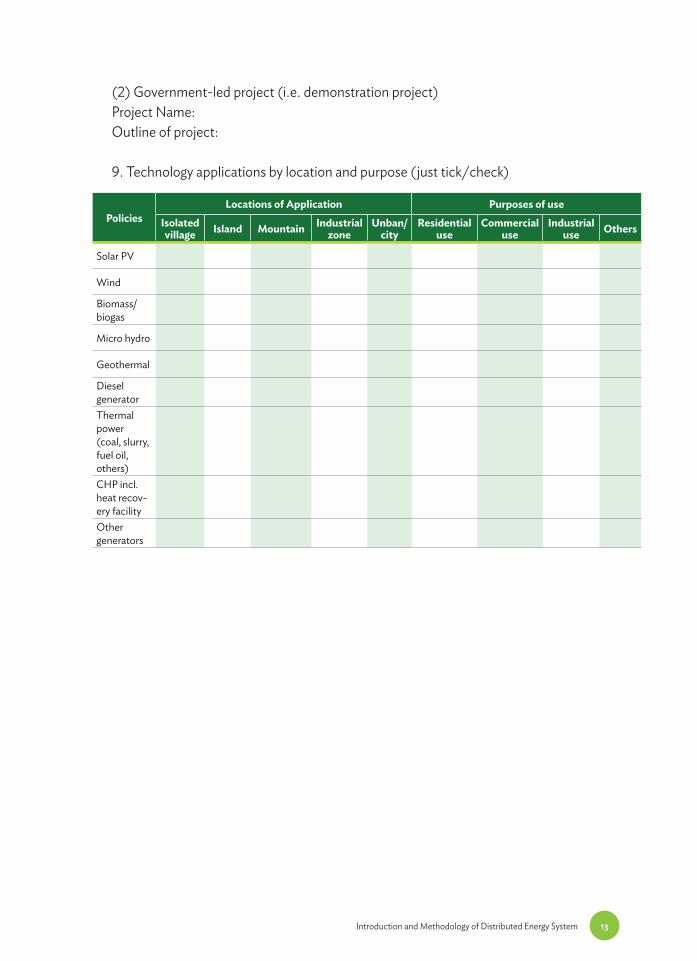
(2) Government-led project (i.e. demonstration project)Project Name:Outline of project:
9. Technology applications by location and purpose (just tick/check)
Chapter 2The Potential of Distributed Energy System from Renewable Energy in ASEAN
Introduction
The Distributed Energy System (DES) is a decentralised power system where electric power is produced and consumed locally at or near the point of use. DES involves the distributed power technologies, which can be stationary (typical of electrical applications) or mobile (as in marine and locomotive applications). There is no universal consensus on or standard definition of DES. DESs stand in contrast to central power stations that supply electricity from a centralised location, often far from users. Electricity from central power stations is transmitted via transmission and distribution lines to end users. Central power systems do not supply mechanical power and are always stationary and land based.
This is a study on the overall status and policies of DESs in selected ASEAN countries. It uses literature surveys and information exchange through meetings with relevant parties, such as the ASEAN Renewable Energy Sub-Sector Network, Energy Research Institute Network, Japan–ASEAN Capacity Building Programme, and other conferences. The study focuses on the following key questions:
- status of introduction of DESs, including what kind of DESs have been introduced, and- how much energy they have supplied;
• Existing policies to promote introduction of the systems, such as- strategies, master plans, and roadmaps;- incentives/subsidies for renewable energy through the introduction of various policy instruments;- government-led model projects; and- small-power producers (SPPs) programmes;
15The Potential of Distributed Energy System from Renewable Energy in ASEAN
• Analysis of the outcomes of the policies:- What kind of DESs the policies have promoted;- How much energy they have supplied; and- What kind of impacts the introduction has had on stable energy supply, electricity tariff, environment, etc. in the country communities.
The study team developed questionnaires to address the above hypotheses. This is critical in understanding the status, policies, and potentials of DES in the ASEAN region. Since DES information in each ASEAN country is difficult to obtain, this study also relies on various information from the power development plan or any energy master plan of countries. Using the current data from the Energy Outlook and Energy Saving Potential in the EAS region, the study estimated the generation output of DES-related energy sources in ASEAN, particularly the renewable sources such as solar, wind, biomass, hydropower, and geothermal.
Key Drivers of Distributed Energy System
Energy access
The ASEAN region has seen spectacular growth over the past 2 decades, and its growth has lifted hundreds of millions of people out of poverty. Energy demand has grown 2.5 times since 1990 and is expected to triple by 2035. Yet about 130 million people in ASEAN countries still lack access to electricity and therefore have yet to enjoy the health, social, and economic benefits (ACE, 2013). As the ASEAN Community declared in end 2015, the lack of power and energy access could threaten the region’s economic growth and economic transition. Energy is largely linked with economic opportunities. The expansion of energy infrastructure projects is slow, and affects the potential of industrial development and growth. In ASEAN countries, small and very small power producers (SPPs and VSSPs) are playing a significant role in supply electricity gap and in meeting growing electricity demand. However, economic zones are also increasing to promote economic growth in ASEAN Member States. As often, the electricity supply in the economic zones are in the form of DES as auto-electricity producers. In some cases, the auto-producers also supply surplus electricity to the grid or nearby area. In rural areas of developing countries, schools and clinics operate with zero or little power. Therefore, DES has been recognised as a decentralised electricity system to meet end-use demand more effectively, and to serve areas where grid expansion is not economically viable. This situation is observed in Cambodia, Lao PDR, Myanmar, and some remote islands of Indonesia.
16 Distributed Energy System in Southeast Asia
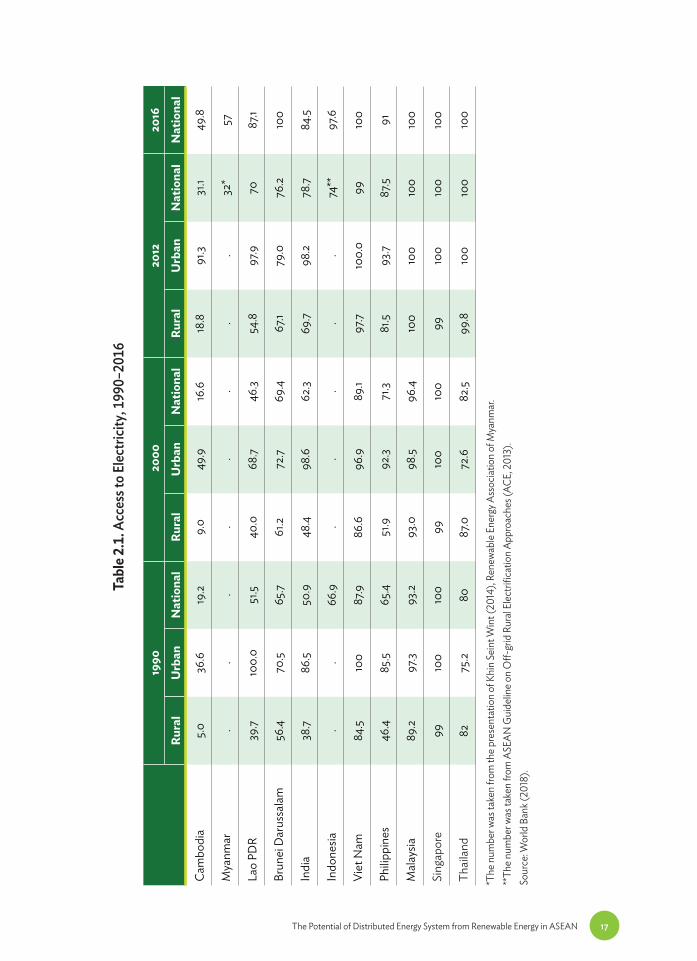
Table 2.1 shows electricity access in the ASEAN region. It also informs the progress of electricity access in urban and rural areas from 1990 to 2012, and only aggregate at the national level in 2016. While tremendous progress of 100% energy access has been observed in Australia, China, Japan, Republic of Korea, Malaysia, New Zealand, Singapore, Thailand, and Viet Nam, some countries in Southeast Asia have struggled to improve energy access of their population.
The rural areas of Cambodia and Myanmar still have very low access to electricity (Table 2.1). Only 31.1% of Cambodia’s population and 32% of Myanmar’s have access to electricity. While this rate is higher for major cities, large parts of rural Cambodia and Myanmar have very low or no electricity at all. India also harbours a large population without access to electricity.
Increasing energy access requires investment in infrastructure for grid expansion and off-grid electricity system. For both on-grid and off-grid systems, DES can be well used depending on the context and the development of the energy market in the country and the region.
Increasing energy demand
The key drivers of energy consumption in the EAS region are population, gross domestic product (GDP), growth of the transport sector as result of improved per capita GDP, and policies affecting the universal coverage of electricity access. The predicted primary energy supply and final energy demand almost doubled from 2013 to 2040 (Figures 2.1 and 2.2).
Increase of final energy consumption. Final energy consumption is projected to increase from 431 Mtoe in 2013 to 1,191 Mtoe in 2040. By sector, industry and transport energy demand is projected to grow most rapidly, increasing by 4.9% and 4.1% per year, respectively, because of industry expansion and motorisation driven by increasing disposable incomes in ASEAN Member States. The demand of commercial and residential (‘Others’) sector will grow 2.5% per year. Figure 2.1 shows final energy consumption by sector under the business-as-usual (BAU) scenario in ASEAN in 2013–2040.
Increase of primary energy supply. The above drivers have influenced the increase of estimated energy supply to meet final energy consumption by 2040. The ASEAN primary energy supply – the total primary energy supply of all energy sources – is projected to increase from 592 Mtoe in 2013 to 1,697 Mtoe in 2040 (Figure 2.2).
17The Potential of Distributed Energy System from Renewable Energy in ASEAN
Tabl
e 2.1
. Acc
ess t
o Elec
tricit
y, 19
90–2
016
1990
200
020
1220
16
Rura
l U
rban
Nat
iona
lRu
ral
Urb
anN
atio
nal
Rura
l U
rban
Nat
iona
lN
atio
nal
Cam
bodi
a5.0
36.6
19.2
9.0
49.9
16.6
18.8
91.3
31.1
49.8
Mya
nmar
..
..
..
..
32*
57
Lao
PDR
39.7
100.
051
.540
.068
.746
.354
.897
.970
87.1
Brun
ei D
arus
sala
m56
.470
.565
.761
.272
.769
.467
.179
.076
.210
0
Indi
a38
.786
.550
.948
.498
.662
.369
.798
.278
.784
.5
Indo
nesia
..
66.9
..
..
.74
**97
.6
Viet
Nam
84.5
100
87.9
86.6
96.9
89.1
97.7
100.
099
100
Philip
pine
s46
.485
.565
.451
.992
.371
.381
.593
.787
.591
Mal
aysia
89.2
97.3
93.2
93.0
98.5
96.4
100
100
100
100
Sing
apor
e99
100
100
9910
010
099
100
100
100
Thai
land
8275
.280
87.0
72.6
82.5
99.8
100
100
100
*The
num
ber w
as ta
ken
from
the p
rese
ntat
ion
of K
hin
Sein
t Win
t (20
14),
Rene
wabl
e Ene
rgy A
ssoc
iatio
n of
Mya
nmar
.**
The n
umbe
r was
take
n fro
m A
SEAN
Gui
delin
e on
Off-
grid
Rur
al El
ectri
ficat
ion
Appr
oach
es (A
CE, 2
013)
.So
urce
: Wor
ld B
ank (
2018
).
18 Distributed Energy System in Southeast Asia
BAU = business as usual scenario. Source: Author’s calculation.
BAU = business as usual scenario. Source: Author’s calculation.
Figure 2.1. ASEAN’s Final Energy Demand by Sector (2013 to 2040), BAU
Figure 2.2. ASEAN’s Primary Energy Suppl by Energy Sources (2013 to 2040), BAU
300
250
200
150
100
50
0
Milli
on To
n of O
il Equ
ivalen
t
Industry Transportation Others Non-Energy
2013 2025 2040
600
500
400
300
200
100
0
Milli
on To
n of O
il Equ
ivalen
t
Coal
Biofuel Electricity
Oil Natural Gas Nuclear Hydro Geothermal Others
Biomass Solar, Wind, Ocean
2013
19The Potential of Distributed Energy System from Renewable Energy in ASEAN
Oil continues to have the largest share of primary energy supply but its share is forecast to drop to 34.5% in 2040 from 36.6% in 2013. Coal is predicted to have the fastest growth rate at 5.7% per year in 2013–2040, and its share will increase from 16% to 25% during the same period. Coal will be the second-largest share after oil. Natural gas is predicted to grow at 4.4% per year in 2013–2040. Its share will increase from 21.5% to 23.8% during the same period. Hydropower, geothermal, wind, and solar energy will see some increase of their share as well, although small.
Amongst the fossil sources of energy, natural gas is projected to see the fastest growth in 2013–2040, increasing at an annual average rate of 3.7%. Its share in the total will consequently increase from 9.1% (equivalent to 499 Mtoe) in 2013 to 12.7% (equivalent to 1,339 Mtoe) in 2035. Nuclear energy is also projected to increase at a rapid rate of 6.4% per year on average and its share is forecast to increase from 1.5% in 2013 to 4.3% in 2040. This is due to the assumed resumption of nuclear power generation in Japan, the expansion of power generation capacity in China and India, and the introduction of this energy source in Viet Nam.
Estimates of Energy Supply, Needed Investment, and CO2 Emission Reduction from the Application of DES
Estimates of energy supply from DES Application. DES uses renewable energy sources such as biomass, wind power, small hydro, solar power, biogas, geothermal power, and other thermal plants with small capacity. However, DES estimates here are only for renewable energy sources. DES plays an important role in the electric power distribution system. The shift in preference towards green energy is one major factor that encourages the demand for DESs across the globe. Moreover, the opportunity in developing nations and development of eco-friendly DESs are the key opportunities for the growth of the market.
The global DES market is categorised into off-grid and on-grid segments. The DES market is estimated to increase because of the adoption of financial incentive schemes worldwide to promote clean energy as emphasised in COP21 (Conference of the Parties) and Nationally Determined Contributions (NDC) commitments. DES is also predicted to significantly increase in the ASEAN region to meet energy demand (Table 2.2). All ASEAN countries are expected to have increased solar, wind, and biomass from 26,927 GWh (BAU case) to 44,731 GWh (APS case) by 2040. Hydropower and geothermal outputs are also expected to increase in countries with resource potential.
20 Distributed Energy System in Southeast Asia
Tabl
e 2.2
. Est
imat
es of
Off-
grid
DES
Gen
erat
ion
Out
put (
MW
h) in
ASE
AN
(sol
ar, w
ind,
bio
mas
s, hy
dro a
nd ge
othe
rmal
)
EAS
Regi
onBA
U v
s APS
Gen
erat
ion
outp
ut (G
Wh)
201
3G
ener
atio
n ou
tput
(GW
h) 2
040
Sola
r, w
ind,
bi
omas
sH
ydro
pow
erG
eoth
erm
alSo
lar,
win
d,
biom
ass
Hyd
ropo
wer
Geo
ther
mal
Cam
bodi
aBA
U1.4
500
11.6
1,650
0A
PS25
.61,1
970
Mya
nmar
BAU
044
30
918
2,137
350
APS
2,36
31,4
9735
0
Lao
PDR
BAU
077
50
02,
528
0A
PS0
2,39
70
Brun
ei D
arus
sala
mBA
U0.
340
09
00
APS
175
1.45
0
Indo
nesia
BAU
5484
61,8
8212
,890
4,38
015
,295
APS
13,9
055,
475
18,9
21
Viet
Nam
BAU
26.4
2,84
70
160.
86,
231
0A
PS12
,353
6,55
00
Philip
pine
sBA
U59
.850
019
2110
3373
83,0
28A
PS19
521,5
756,
668
Mal
aysia
BAU
150
529
083
91,6
000
APS
2,96
71,6
950
Sing
apor
eBA
U27
40
01,2
920
0A
PS1,7
100
0
Thai
land
BAU
1,671
287
09,
773
740
0A
PS9,
277
792
0
Tota
lBA
U2,
240
6,28
13,
804
26,9
2720
,008
18,6
73A
PS44
,731
21,18
225
,941
DES
= D
istrib
uted
Ene
rgy S
yste
m; A
SEAN
= A
ssoc
iatio
n of
Sou
thea
st A
sian
Nat
ions
; MW
h =
meg
awat
t-ho
ur, A
PS =
alte
rnat
ive p
olicy
scen
ario
, BAU
= b
usin
ess-
as-u
sual
scen
ario
, GW
h =
gigaw
att-
hour
.N
ote:
Vario
us as
sum
ptio
ns w
ere m
ade t
o ca
lculat
e the
futu
re p
oten
tial o
ff-gr
id fo
r sol
ar, w
ind,
bio
mas
s, hy
dro,
and
geot
herm
al en
ergy
.So
urce
: Aut
hors
’ calc
ulat
ion.
21The Potential of Distributed Energy System from Renewable Energy in ASEAN
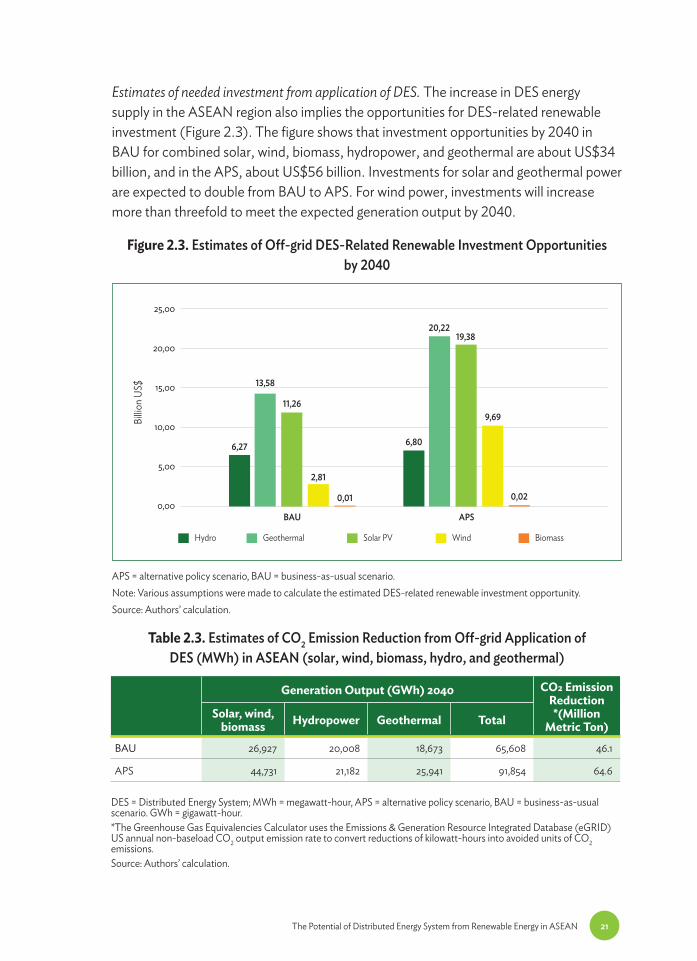
Estimates of needed investment from application of DES. The increase in DES energy supply in the ASEAN region also implies the opportunities for DES-related renewable investment (Figure 2.3). The figure shows that investment opportunities by 2040 in BAU for combined solar, wind, biomass, hydropower, and geothermal are about US$34 billion, and in the APS, about US$56 billion. Investments for solar and geothermal power are expected to double from BAU to APS. For wind power, investments will increase more than threefold to meet the expected generation output by 2040.
APS = alternative policy scenario, BAU = business-as-usual scenario.Note: Various assumptions were made to calculate the estimated DES-related renewable investment opportunity.Source: Authors’ calculation.
Figure 2.3. Estimates of Off-grid DES-Related Renewable Investment Opportunitiesby 2040
25,00
20,00
15,00
10,00
5,00
0,00
Billio
n US$
Hydro Geothermal
6,27 6,80
19,38
9,69
0,02
13,58
20,22
11,26
2,81
0,01
Solar PV Wind Biomass
BAU APS
Table 2.3. Estimates of CO2 Emission Reduction from Off-grid Application of DES (MWh) in ASEAN (solar, wind, biomass, hydro, and geothermal)
Generation Output (GWh) 2040 CO2 Emission Reduction *(Million
Metric Ton)Solar, wind,
biomass Hydropower Geothermal Total
BAU 26,927 20,008 18,673 65,608 46.1
APS 44,731 21,182 25,941 91,854 64.6
DES = Distributed Energy System; MWh = megawatt-hour, APS = alternative policy scenario, BAU = business-as-usual scenario. GWh = gigawatt-hour.*The Greenhouse Gas Equivalencies Calculator uses the Emissions & Generation Resource Integrated Database (eGRID) US annual non-baseload CO2 output emission rate to convert reductions of kilowatt-hours into avoided units of CO2 emissions. Source: Authors’ calculation.
22 Distributed Energy System in Southeast Asia
Estimates of CO2 emission reduction from the application of DES. The increase in DES-related renewable energy supply in the ASEAN region will strongly reduce CO2 emission in the region. Estimates show reduced CO2 emission – of about 46.1 million metric tons in BAU, and 64.6 million metric tons in the APS – from the application of solar, wind, biomass, geothermal, and hydropower (Table 2.3). The method of calculating CO2 emission reduction is referred to as the Greenhouse Gas Equivalencies; it uses the emission factor of 7.03 × 10⁻⁴ metric tons CO2/kWh (EPA, 2016).
Potential System Cost of Generating Electricity and the Need for an Enabling Policy Framework to Promote DES in ASEAN
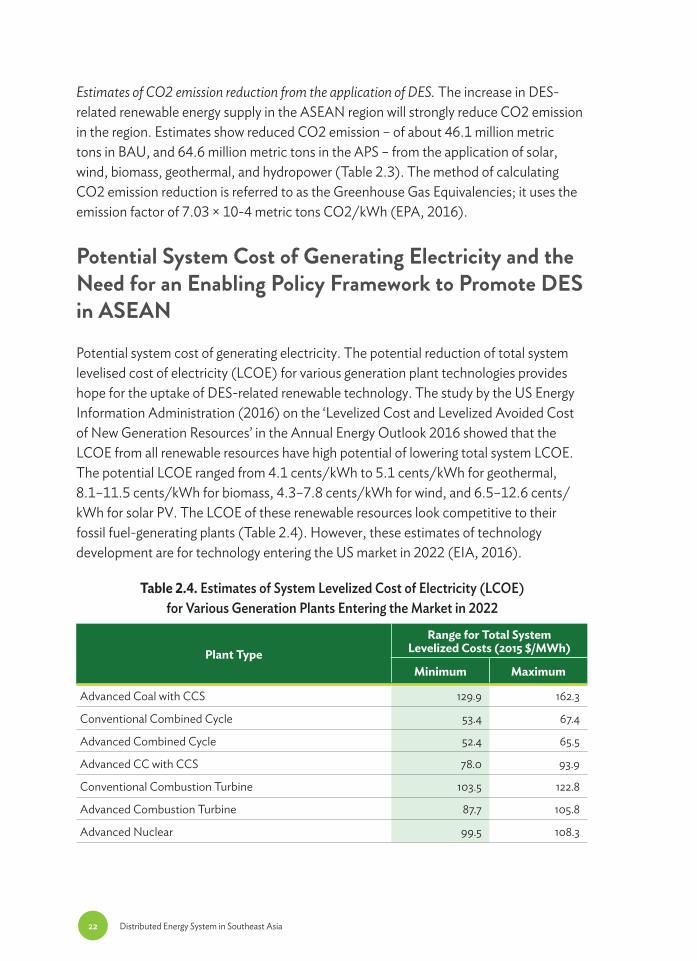
Potential system cost of generating electricity. The potential reduction of total system levelised cost of electricity (LCOE) for various generation plant technologies provides hope for the uptake of DES-related renewable technology. The study by the US Energy Information Administration (2016) on the ‘Levelized Cost and Levelized Avoided Cost of New Generation Resources’ in the Annual Energy Outlook 2016 showed that the LCOE from all renewable resources have high potential of lowering total system LCOE. The potential LCOE ranged from 4.1 cents/kWh to 5.1 cents/kWh for geothermal, 8.1–11.5 cents/kWh for biomass, 4.3–7.8 cents/kWh for wind, and 6.5–12.6 cents/kWh for solar PV. The LCOE of these renewable resources look competitive to their fossil fuel-generating plants (Table 2.4). However, these estimates of technology development are for technology entering the US market in 2022 (EIA, 2016).
Table 2.4. Estimates of System Levelized Cost of Electricity (LCOE) for Various Generation Plants Entering the Market in 2022
Plant TypeRange for Total System
Levelized Costs (2015 $/MWh)
Minimum Maximum
Advanced Coal with CCS 129.9 162.3
Conventional Combined Cycle 53.4 67.4
Advanced Combined Cycle 52.4 65.5
Advanced CC with CCS 78.0 93.9
Conventional Combustion Turbine 103.5 122.8
Advanced Combustion Turbine 87.7 105.8
Advanced Nuclear 99.5 108.3
23The Potential of Distributed Energy System from Renewable Energy in ASEAN
The need for enabling policy framework to promote DES. Although DES is mainly a decentralised energy resources system, the policy framework promoting it is related to renewable energy policies, and it has always been the most important driver of DES deployment. An enabling policy framework provides a long-term government commitment and credible targets. The framework involves policy, fiscal, and financial attractiveness for investment in DES and renewable energy. The enabling policy frameworks used so far are the following:
• National policy design aims to provide a trajectory for future energy mix. This includes renewable energy target; renewable energy law or strategy; biomass and biofuels law or programme; solar heating, solar power, wind, and geothermal law or programme.
• Fiscal incentives aim to reduce upfront costs by introducing fiscal policy instruments such as tax exemptions (value added, fuel, income, import and export, and local taxes); introduction of carbon tax; and accelerated depreciation.
• Grid access aims to give project developers confidence through grid access priority and transmission discount policy if the production of electricity is from renewables.
• Regulatory instruments provide incentives for investing in renewables through the implementation of energy policies such as feed-in tariff (FiT), feed-in premium, auction, net metering, and quota.
• Finance reduces risk for investors through the implementation of currency hedging, dedicated fund, eligible fund, or guarantees.
Table 2.5. Renewable Target in ASEAN Member States
Country Renewable Target Policy Instruments
Brunei Darussalam 10% RE share in power generation by 2035* Need to be developed
Cambodia More than 2 GW of hydropower by 2020 Permits and tax incentives are in place
Indonesia 23% NRE share in energy mix in 2025 Feed-in-tariff
Lao PDR 30% RE share of total energy consumptions by 2025*
Permits and tax incentives are in place
Malaysia 4 GW RE installed capacity by 2030* Feed-in-tariff and capital subsidies
Myanmar 15%–20% RE share in installed capacity by 2030* Need to be developed
Philippines 15 GW installed capacity in 2030 Feed-in-tariff, capital subsidies, tax incentives, and RPS
Singapore 350 MW installed capacity of solar by 2020
Feed-in-tariff, permits, and tax incentives
Thailand 30% AE share in total energy consumption by 2036*
Feed-in-tariff, permits, and tax incentives
Viet Nam 27 GW RE installation in 2030* Feed-in-tariff, permits, and tax incentives
* large hydropower is excluded.GW = gigawatt, NRE = non-renewable energy, RE = renewable energy.Source: ACE (2016).
• Other policies aim to help and target energy access in remote areas through the promotion of renewable energy in social housing, rural access programmes, cookstove programmes, and other energy access activities by non-governmental organisations, and communities.
The above policy frameworks need to be reinforced and applied to suit the context in each country if DES and renewable energy are to be promoted as the future energy mix. Various policy instruments are being promoted in ASEAN. At the regional level, ASEAN has targeted 23% share of the renewable energy in the primary energy supply by year 2025. ASEAN Member States also set up the renewable targets in each country and developed various instruments to promote renewable energy (Table 2.5).
Some ASEAN countries have developed detailed policy instruments to ensure the targets are achieved through the implementation of various projects and programmes. Nonetheless, some countries are also far behind in terms of policy design and implementation.
25The Potential of Distributed Energy System from Renewable Energy in ASEAN
The case study of Thailand on the review of policies to promote DES provides a snapshot and stock-taking in terms of policy design in promoting DES and renewable energy. Other ASEAN countries may learn from this case study and develop their own policy to fit the political and social contexts.
Case study on enabling policy framework: Thailand’s DES-related energy development planning
Thailand is the only country in Southeast Asia with a comprehensive long-term energy development plan. Key energy policy documents are laid out in the new Power Development Plan known as (PDP 2015–2036), the Alternative Energy Development Plan (AEDP, 2012–2021), and the Energy Efficiency Development Plan (EEDP, 2011–2030). The new PDP 2015–2036 highlights energy security of power supply and transmission and distribution systems in response to the demand for electricity. It also seeks the best energy mix, avoiding too much reliance on gas as a source of power generation. The new PDP also aims to reduce CO2 emissions by promoting electricity production from renewable energy sources and to promote energy efficiency.
The Government of Thailand has continuously promoted private sector investment in the generation business through bid solicitations to buy power from large-scale independent power producers (IPPs) and small power producers (SPPs), with the Electricity Generating Authority of Thailand (EGAT) being the single buyer of bulk electricity. This is done under the terms and regulations set by the Energy Regulatory Commission to ensure the best interests of public consumers, optimisation of energy resources, and fairness to all. For DES-related renewable energy, Thailand has set a 30% share of renewables in total final energy consumption by 2036 (AEDP 2015–2036). In absolute terms, renewable consumption is targeted at 39,388 Ktoe out of total final consumption of 131,000 Ktoe by 2036. Thailand has been introducing FiT to promote renewable energy by type of energy source (Table 2.6).
The Department of Alternative Energy Development and Efficiency (DEDE) of Thailand also developed the Energy Saving Company (ESCO) fund to cope with risk and to encourage investment in renewable-focused ventures. In addition, the fund pools capital was set up with contribution from Thailand’s Energy Conservation and Promotion Fund and private investors. The ESCO fund aims to support access to low-cost equipment leasing. As of the time of writing, the ESCO fund has invested 6.1 billion baht (B) – B510 million from the government and the rest from private sources) – in 54 separate projects accounting for total energy savings of B1.1 billion (DEDE, 2016).
26 Distributed Energy System in Southeast Asia
Tabl
e 2.6
. Fee
d-in
-Tar
iff R
ate b
y Typ
e of R
enew
able
Ener
gy So
urce
in T
haila
nd
Capa
city
(MW
)
FiT
(TH
B/kW
h)Pe
riod
of
Subs
idy
(Yea
r)
FiT
Prem
ium
(TH
B/kW
h)
FiT(
f)Fi
T(v)
,201
7Fi
T(1)
Biof
uel P
roje
ct(8
yea
rs)
Proj
ect i
n So
uthe
rn
Terr
itory
Are
a (t
hrou
ghou
t Pro
ject
Pe
riod)
1) M
SW (H
ybrid
Man
agem
ent)
Ex
istin
g Cap
acity
≤ 1
MW
3.13
3.21
6.34
200.
700.
50
Ex
istin
g Cap
acity
> 1–
3 MW
2.61
3.21
5.82
200.
700.
50
Ex
istin
g Cap
acity
> 3
MW
2.39
2.69
5.08
200.
700.
50
2) M
SW (S
anita
ry L
andfi
ll)5.6
0-
5.60
10-
0.50
3) B
iom
ass
Ex
istin
g Cap
acity
≤ 1
MW
3.13
2.21
5.34
200.
500.
50
Ex
istin
g Cap
acity
> 1–
3 MW
2.61
2.21
4.82
200.
400.
50
Ex
istin
g Cap
acity
> 3
MW
2.39
1.85
4.24
200.
300.
50
4) B
ioga
s (W
aste
Wat
er/S
ewag
e)3.7
6-
3.76
200.
500.
50
5) B
ioga
s (En
ergy
Cro
p)2.7
92.
555.3
420
0.50
0.50
6) H
ydro
pow
er
Ex
istin
g Cap
acity
≤ 2
00 kW
4.90
-4.
9020
-0.
50
7) W
ind
6.06
-6.
0620
-0.
50
kW =
kilo
watt,
kWh
= kil
owat
t-ho
ur, M
SW =
, MW
= m
egaw
att,
THB
= Th
ai Ba
ht.
Not
e: Fi
T(f)
is Fi
T fix
rate
thro
ugho
ut th
e pro
ject;
FiT(
v) is
FiT
varia
ble r
ate a
djus
ted
by in
flatio
n st
anda
rd; F
iT(i)
=FiT
(f)+
FiT(
v, i-1
) * (1
+Cor
e Infl
atio
n(i-
1))+
FiT
Prem
ium
.So
urce
: Min
istry
of E
nerg
y (20
16).
27The Potential of Distributed Energy System from Renewable Energy in ASEAN
Most DES-related schemes in Thailand are in VSPPs. Thailand's VSPP regulations were approved by its government in 2002. These regulations allow small community-owned or small entrepreneur-owned renewable energy generation to connect to the grid and sell excess electricity to utilities. In December 2006, the government announced important changes in VSPP regulations that allow each generator to export up to 10 MW to the grid and offer FiT subsidies for renewable electricity production. The VSPP programme is now also open to efficient fossil-fuel combined heat and power (CHP). Currently, the share of DES or the combined VSPP and SPP to the generation mix is only about 5.4% (Figure 2.4 and Table 2.7).
EGAT = Electricity Generating Authority of Thailand, MW = megawatt, RE = renewable energy,SPP = small power producer, VSPP = very small power producer.Source: Ministry of Energy (2015).
Figure 2.4. Status of Installed Capacity by Energy Type (as of 2014)
Thailand Power System 37,612 MW
- EGAT System 34,668 MW
- SPP Non-Firm (RE, Cogeneration) 915 MW
- VSPP (RE, Cogeneration) 2,209 MW
EGAT System(34,668 MW)
Thermal7,538 MW
21.7%
Renewable5,876 MW
16.9%
Gas turbine,Diesel
124 MW0.4%
Malaysia300 MW
0.9%
Domestic Hydro3,444 MW
9.9%
Imported Hydro2,105 MW
6.1%
Biomass & Others318 MW
0.9%
Combined Cycle20,839 MW
60.1%
Congen288 MW
Biomass246 MW
Solar175 MW
Wind180 MW
Hydro12 MW
Residue14 MW
Contract Capacity of Non-Firm SPP
Contract Capacity of VSPP
SPP Non-Firm(915 MW)
VSPP(2,090 MW)
Congen, Diesel
47 MW
Biomass705 MW
Biogas188 MW
Solar824 MW
Wind11 MW
Hydro58 MW
Waste12 MW
Residue5 MW
28 Distributed Energy System in Southeast Asia
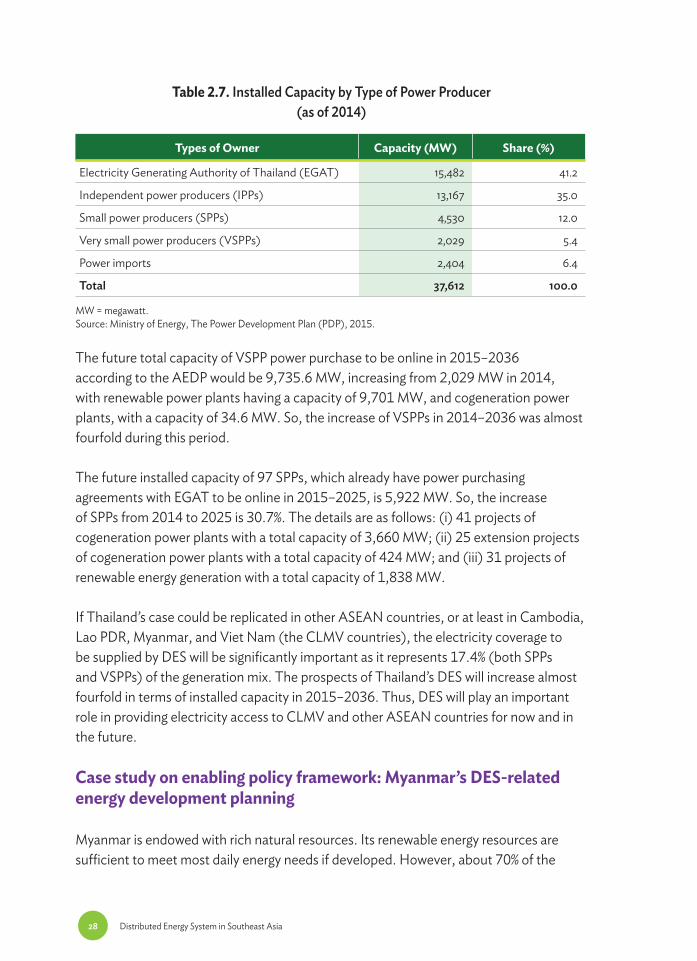
Table 2.7. Installed Capacity by Type of Power Producer (as of 2014)
Types of Owner Capacity (MW) Share (%)
Electricity Generating Authority of Thailand (EGAT) 15,482 41.2
Independent power producers (IPPs) 13,167 35.0
Small power producers (SPPs) 4,530 12.0
Very small power producers (VSPPs) 2,029 5.4
Power imports 2,404 6.4
Total 37,612 100.0
MW = megawatt.Source: Ministry of Energy, The Power Development Plan (PDP), 2015.
The future total capacity of VSPP power purchase to be online in 2015–2036 according to the AEDP would be 9,735.6 MW, increasing from 2,029 MW in 2014, with renewable power plants having a capacity of 9,701 MW, and cogeneration power plants, with a capacity of 34.6 MW. So, the increase of VSPPs in 2014–2036 was almost fourfold during this period.
The future installed capacity of 97 SPPs, which already have power purchasing agreements with EGAT to be online in 2015–2025, is 5,922 MW. So, the increase of SPPs from 2014 to 2025 is 30.7%. The details are as follows: (i) 41 projects of cogeneration power plants with a total capacity of 3,660 MW; (ii) 25 extension projects of cogeneration power plants with a total capacity of 424 MW; and (iii) 31 projects of renewable energy generation with a total capacity of 1,838 MW.
If Thailand’s case could be replicated in other ASEAN countries, or at least in Cambodia, Lao PDR, Myanmar, and Viet Nam (the CLMV countries), the electricity coverage to be supplied by DES will be significantly important as it represents 17.4% (both SPPs and VSPPs) of the generation mix. The prospects of Thailand’s DES will increase almost fourfold in terms of installed capacity in 2015–2036. Thus, DES will play an important role in providing electricity access to CLMV and other ASEAN countries for now and in the future.
Case study on enabling policy framework: Myanmar’s DES-related energy development planning
Myanmar is endowed with rich natural resources. Its renewable energy resources are sufficient to meet most daily energy needs if developed. However, about 70% of the
29The Potential of Distributed Energy System from Renewable Energy in ASEAN
population and 84% of rural households lacked grid electricity access in 2014 (World Bank, 2015). Off-grid schemes are rare and typically provide high-cost, low-reliability power service for a few hours per day. Myanmar is the largest country in mainland Southeast Asia but has one of the lowest population densities of the region. This imposes a diseconomy of scale for conventional centralised electricity grid development and expansion. Electrification varies widely between urban and rural areas. Although about 27% of the 64,346 villages are electrified, the national power grid covers only 7% of the total villages (Tin Ngwe, 2014). Considering the broad distribution of abundant renewable energy resources such as biomass, hydropower, solar, and wind, Myanmar can potentially accelerate on- and off-grid electrification with renewable energy, delivering universal electricity access much quicker than conventional centralised generation and grid expansion.
The Government’s National Electrification Plan (NEP) 2015, developed with World Bank technical assistance, aims to electrify 7.2 million households and to achieve universal access to electricity by 2030. The plan calls for investments of US$5.8 billion over the next 15 years to extend the distribution grid and electrify off-grid areas. The government has also developed a complementary Energy Master Plan with the assistance of the Asian Development Bank and a Power Sector Master Plan (for generation and transmission sub-sectors) with the assistance of the Japan International Cooperation Agency.
Given decades of closed economy, the energy sector’s institutional and regulatory frameworks have been fragmented, particularly in rural electrification. The Ministry of Energy is responsible for overall energy policy, while the Ministry of Electric Power leads power sector development. The rural off-grid electrification falls under the Department of Rural Development in the Ministry of Livestock, Fisheries and Rural Development. Myanmar has undertaken reform in all sectors, including the energy sector, after the 2015 national election. Major energy-related master plans in Myanmar include the following:
• NEP 2015 highlighted universal electricity access by 2030, or 7.2 million new connections. The plan uses a two-pronged approach: rapid extension of the national grid, coupled with off-grid electricity, including modern solar home systems and mini-grids. The first phase of the plan calls for 1.7 million households to be connected to electricity by 2020 and an investment of about US$700 million. The plan started off with $400 million in funds from the World Bank’s International Development Association, out of which US$80 million would be used for off-grid electrification. Total grid investment is estimated at as much as US$ 6 billion.
30 Distributed Energy System in Southeast Asia
• The Power Sector Master Plan 2013–2030 highlighted the strategies to ensure a sustainable, affordable, and secure supply of energy for Myanmar over the longer term. The plan also aims to develop a mix of energy sources to provide a stable and reliable energy supply through to 2030, in which coal-fired power generation would see its share increase from 2% in 2015 to 20% in 2030. By 2030, it targets the following primary energy mix: 33% biomass, 22% oil, 20% coal, 13% gas, 11% hydro, and 1% renewable energy. The plan estimates Myanmar’s total energy sector needs to amount to US$30 billion–US$40 billion over the next 15 to 20 years,
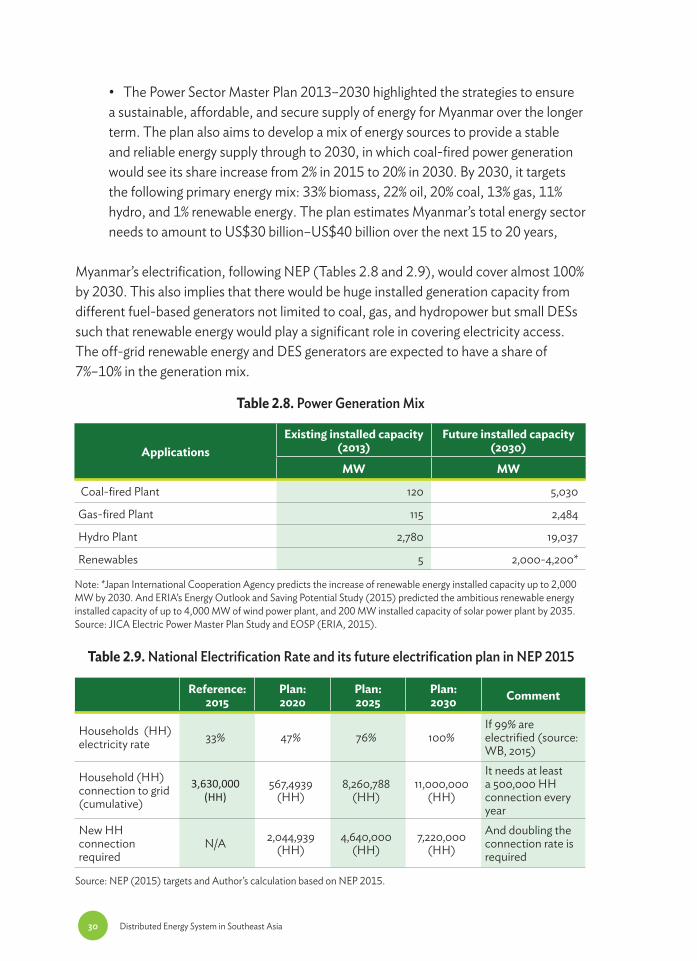
Myanmar’s electrification, following NEP (Tables 2.8 and 2.9), would cover almost 100% by 2030. This also implies that there would be huge installed generation capacity from different fuel-based generators not limited to coal, gas, and hydropower but small DESs such that renewable energy would play a significant role in covering electricity access. The off-grid renewable energy and DES generators are expected to have a share of 7%–10% in the generation mix.
Table 2.8. Power Generation Mix
Table 2.9. National Electrification Rate and its future electrification plan in NEP 2015
ApplicationsExisting installed capacity
(2013)Future installed capacity
(2030)
MW MW
Coal-fired Plant 120 5,030
Gas-fired Plant 115 2,484
Hydro Plant 2,780 19,037
Renewables 5 2,000-4,200*
Reference: 2015
Plan:2020
Plan:2025
Plan:2030 Comment
Households (HH) electricity rate 33% 47% 76% 100%
If 99% are electrified (source: WB, 2015)
Household (HH) connection to grid (cumulative)
3,630,000 (HH)
567,4939 (HH)
8,260,788 (HH)
11,000,000 (HH)
It needs at least a 500,000 HH connection every year
New HH connection required
N/A 2,044,939 (HH)
4,640,000 (HH)
7,220,000 (HH)
And doubling the connection rate is required
Note: *Japan International Cooperation Agency predicts the increase of renewable energy installed capacity up to 2,000 MW by 2030. And ERIA’s Energy Outlook and Saving Potential Study (2015) predicted the ambitious renewable energy installed capacity of up to 4,000 MW of wind power plant, and 200 MW installed capacity of solar power plant by 2035.Source: JICA Electric Power Master Plan Study and EOSP (ERIA, 2015).
Source: NEP (2015) targets and Author’s calculation based on NEP 2015.
31The Potential of Distributed Energy System from Renewable Energy in ASEAN
Currently, about 7.2 million households have yet to connect to modern electricity sources. NEP 2015 mainly addresses this issue to cover the 100% electrification in Myanmar. NEP also recognises the need of DES for off-grid electricity. About half a million new connections will be needed every year to meet the full coverage of electricity. This is an enormous task and will require huge investment and coordination. Perhaps, it would be realistic if the plan mentions DES for not only the off-grid but its role in providing an effective energy system in Myanmar.
Myanmar’s enabling policy framework
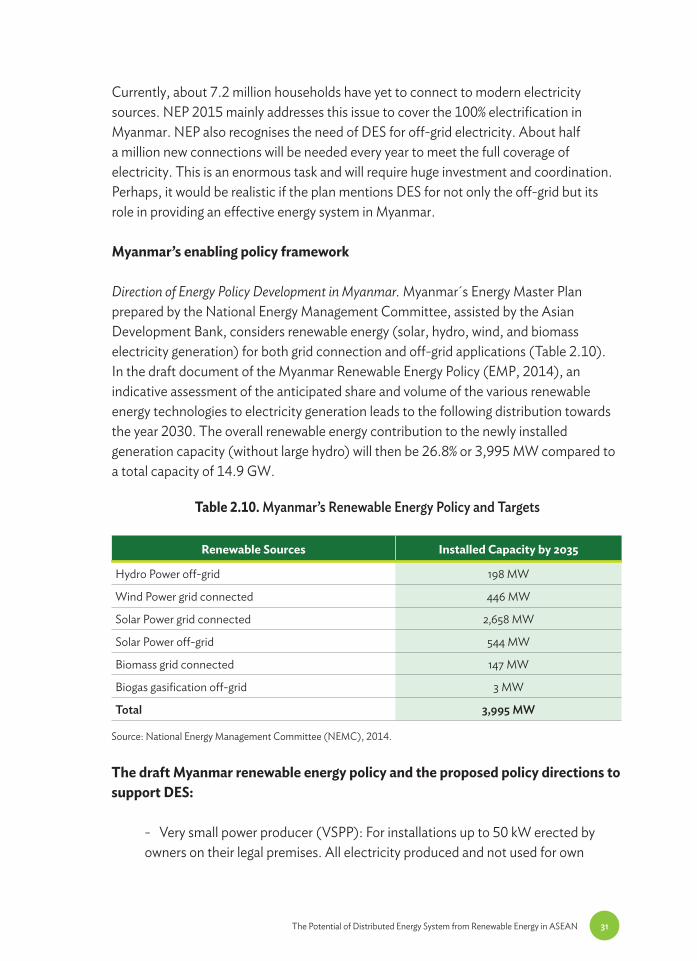
Direction of Energy Policy Development in Myanmar. Myanmar´s Energy Master Plan prepared by the National Energy Management Committee, assisted by the Asian Development Bank, considers renewable energy (solar, hydro, wind, and biomass electricity generation) for both grid connection and off-grid applications (Table 2.10). In the draft document of the Myanmar Renewable Energy Policy (EMP, 2014), an indicative assessment of the anticipated share and volume of the various renewable energy technologies to electricity generation leads to the following distribution towards the year 2030. The overall renewable energy contribution to the newly installed generation capacity (without large hydro) will then be 26.8% or 3,995 MW compared to a total capacity of 14.9 GW.
Table 2.10. Myanmar’s Renewable Energy Policy and Targets
Renewable Sources Installed Capacity by 2035
Hydro Power off-grid 198 MW
Wind Power grid connected 446 MW
Solar Power grid connected 2,658 MW
Solar Power off-grid 544 MW
Biomass grid connected 147 MW
Biogas gasification off-grid 3 MW
Total 3,995 MW
Source: National Energy Management Committee (NEMC), 2014.
The draft Myanmar renewable energy policy and the proposed policy directions to support DES:
- Very small power producer (VSPP): For installations up to 50 kW erected by owners on their legal premises. All electricity produced and not used for own
32 Distributed Energy System in Southeast Asia
consumption or that of neighbours can be freely fed to the grid. The responsible grid operator should issue a permit within 2 months from application, if applicable standard generation equipment is demonstrated. Connection by the grid operator should be completed within 1 month from the ‘ready for commissioning’ notice by the owner. Investment for the generator shall be tax deductible.
- Small power producer (SPP): For installations from 50 kW up to 1,000 kW erected by owners on their legal premises. All electricity produced and not used for own consumption or that of neighbours shall be metered and purchased by the responsible grid operator, who should issue a permit within 3 months from application, if applicable standard of the generation equipment is demonstrated. Connection by the grid operator will be completed within 1 month from the owner’s notice that it is ready for commissioning. Generators of this size could affect grid performance. The Government of Myanmar would take a liberal view on these installations as long as these are below 10% of the national generation. However, it may impose regulations for power management and power purchase. Applicable standards of the generation equipment, therefore, include an adjustable power factor and a facility for remote power management (gradual shutdown) by the grid operator. The power purchase agreement will compensate for losses caused by such shutdown. Renewable energy–based generation shall be preferred to conventional generation.
- Independent power producer (IPP): For installations from 1 MW up erected by owners on their legal premises, the electricity produced and not used for own consumption or that of neighbours shall be metered and purchased by the responsible grid operator, who should issue a permit within 3 months from application, if applicable standards of the generation equipment are demonstrated. The generation equipment needs to have adjustable power factor and power management facility. The power purchase agreement will be negotiated by the Government of Myanmar based on tendering a concession, where the bidder with lowest FiT shall be preferred. The government will tender for concessions of 200 MW annually to be installed in different parts of the country to benefit from the favourable effects of distributed generation.
- Power purchase by application of a FiT shall be valid for 20 years from the date of first connection. With due notice, the government reserves the right to adjust the tariff for additional generators to account for lower costs and efficiency gains. Likewise, tariff bonus can be granted for feed-in at peak hours. Tariff shall never be reduced retroactively. FiT shall be determined in consideration of the real
33The Potential of Distributed Energy System from Renewable Energy in ASEAN
generation cost and in recognition of the macro-economic effect on electricity prices. Tariff shall encourage self-consumption. For the benefit of planning, a uniform tariff of 150K/kWh shall be proposed. Variations may be established for generators of different size and technology. The government published FiT for the next period in due time, beginning in 2014. The RET owner shall bear the cost of connection and lines to the next suitable connection point if so required.
- To facilitate long-term financing for renewable energy investments, a financing window at development banks shall be made available. Generation equipment may be considered as collateral with its marketable value. The Government of Myanmar shall provide a financing volume at interest reflecting government rates. Taxing of income from private renewable energy generation shall be equal to the taxing of public generation.
- Off-grid renewable energy applications find their dominant use in rural electrification. While the government considers countrywide grid electrification the goal, it will strongly encourage renewable energy solutions to achieve rural electrification targets as swiftly and efficiently as possible. These solutions shall include local power generation from hydro energy, solar radiation, and biomass, depending on the economic and operational preferences. Both the public and the private sectors shall be entrusted with the implementation in the form of energy service providers and they will cooperate in planning and operation. The cost shall be borne jointly by the Government of Myanmar and the users. Knowing the important role of Myanmar communities in rural electrification, the government will enable villages to sustainably operate and maintain energy systems. To lessen the burden for rural citizens, the government shall apply the tool of a connection premium to public and private developers.
- The government shall publish an off-grid electrification support regulation, describing duties and eligibilities of energy service providers and consumers, procedures, and standards applicable as well as funding and time frame available.
- New electricity connections in clusters of at least 20 households shall be built, operated, and maintained for the long term by operators, who may be village committees or private entrepreneurs. Operators will seek to connect a maximum number of households for best efficiency but are free to determine connection priority. Renewable energy installations providing at least 200 Wh daily all
34 Distributed Energy System in Southeast Asia
year round shall be eligible for a connection premium of K150,000 per newly connected household. For the remaining cost, each newly connected household shall contribute in lump or loan. Operation and maintenance (O&M) shall be organised at the village level and a sufficient O&M fee shall be collected from users.
- The government is aware that currently numerous rural generation systems exist for which the upgrading, repair, or conversion into hybrid generation using renewable energy technology will be the least cost alternative. For these the same connection premium of K150,000 per newly connected household providing at least 200 Wh/d from renewable energy all days all year shall apply.
- In case the national grid will eventually be connected, the continued operation of the renewable energy supply system as a valuable and reliable resource shall be assured. The system operator shall ensure that the existing system will not interfere with grid standards like voltage and frequency, shall act as retailer of the grid electricity, and shall retain the operation and maintenance fees applied before connection.
3535
Chapter 3Distributed Energy System in Indonesia
Introduction
Indonesia experienced a high energy growth of about 5% in the last couple of years due to industrialisation and population growth. This growth varies in different regions, but provinces outside Java – Sumatera, Kalimantan, and Sulawesi – are experiencing higher growth. These regions have diverse energy sources in terms of quality and quantity for both fossil and renewable types of primary energy.
In 2016, total installed capacity in Indonesia was 59,656 MW, 41% of which was powered by state-owned company PT PLN, and the remainder by independent power producers (IPPs) (13,781 MW); PPU (2,434 MW); and IO non-oil (2,392 MW). Electrification ratio is 92% and consumption is 956 KWh/capita. Indonesia has set a target of 2,500 kWh/capita by 2025 (RUEN); 2,764 kWh/capita (RUKN); and 3,347 kWh by 2034 (RUKN). Almost all installed capacity is on grid, whether in large or smaller system; however, some small portion of scale off-grid renewable energy is also included in the calculation.
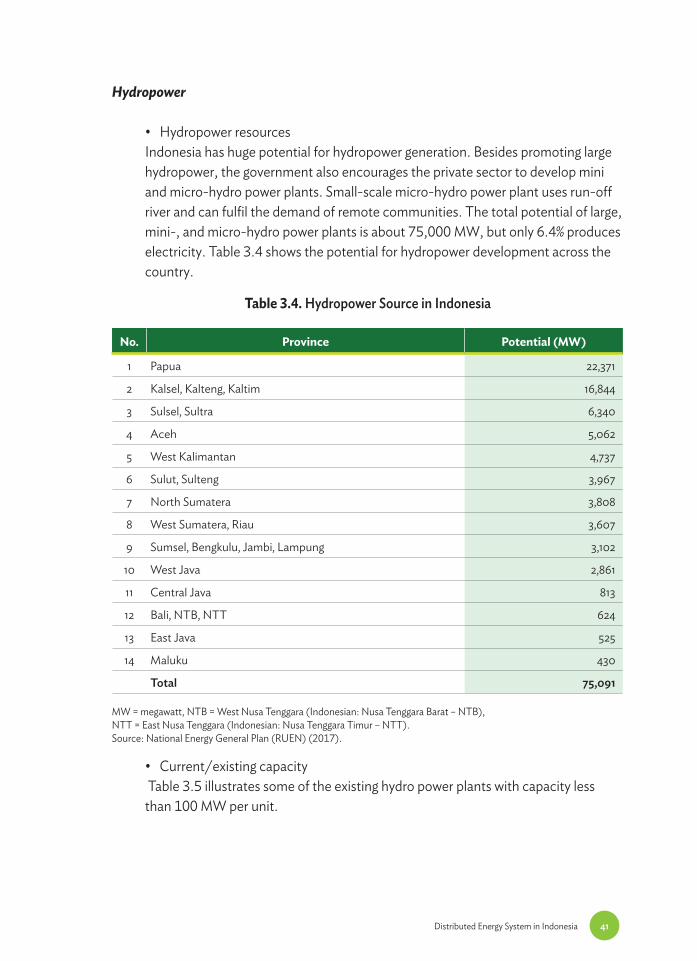
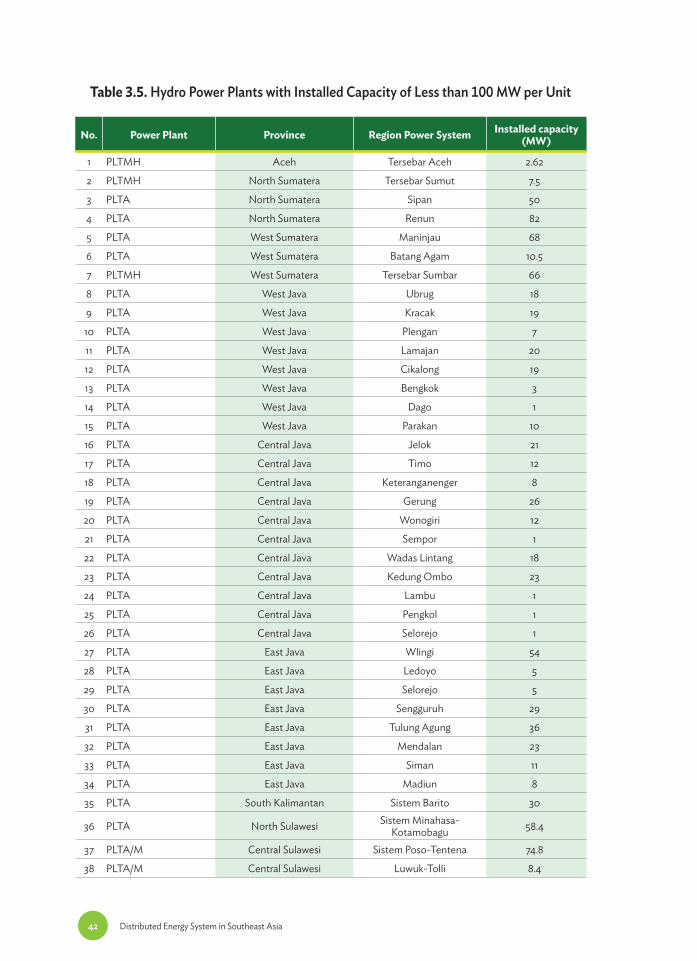
Given the nature of Indonesia’s geography, distributed on- and off-grid electricity system is promoted through a series of policies, including the development of small-scale renewable energy, especially micro hydro and solar photovoltaic (PV). The private sector can develop its own integrated generation and distribution activities in remote areas using renewable energy, which may or may not be subsidised.
Methodology
Questionnaires
• Using questionnaires (Chapter 1), the type of distributed energy system (DES) is categorised based on energy sources: geothermal, hydro/micro hydro, solar PV, biomass, coal, diesel, and gas. The data fields are current/existing capacity and required capacity to meet off-grid/mini grid future demand by 2025.
36 Distributed Energy System in Southeast Asia
Estimation method of future DES capacity
• Terminology and categorisation of DES is based on the definition by the Economic Research Institute for ASEAN and East Asia (ERIA). • DES is any type of power plant with an installed capacity of less than 100 MW either on grid or off grid. It is a decentralised power system producing electric power that is consumed locally at or near the point of use. • Off-grid DES is a stand-alone generation without national grid connection. Off- grid DES includes stand-alone micro-grid and off-grid generators. • This study considers the installed capacity of DES by type of fuel, as follows:
- Solar PV, small hydro of installed capacity 0–50 MW; - Coal, gas, geothermal, solar thermal, electric, waste incineration plants, and biomass-fuelled thermal power plants, of installed capacity less than 100 MW.
• Current data about DES condition comes from the Ministry of Energy and Mineral Resources (MEMR) and PLN. The data is processed based on the regional distribution and type of power plant. The projection of future DES capacity comes from several long-term planning documents including the Electricity Power Supply Business Plan (RUPTL) prepared by state-owned company PLN approved by the MEMR, RUEN (prepared by the government and approved by the National Energy Council), and RUKN (prepared and published by the MEMR).• Estimation of DES (total on grid and off grid)
Estimation is based on the definition of DES - Solar PV, small hydro of installed capacity 0–50 MW;- Coal, gas, geothermal, solar thermal electric, waste incineration plants, and biomass-fuelled thermal power plants, of installed capacity less than 100 MW
• Estimation of DES (total on grid and off grid) using RUPTL, RUEN, and RUKN.
Current Situation of Distributed Energy System
Current installed capacity by type of energy source
Geothermal
• Geothermal resources
37Distributed Energy System in Indonesia
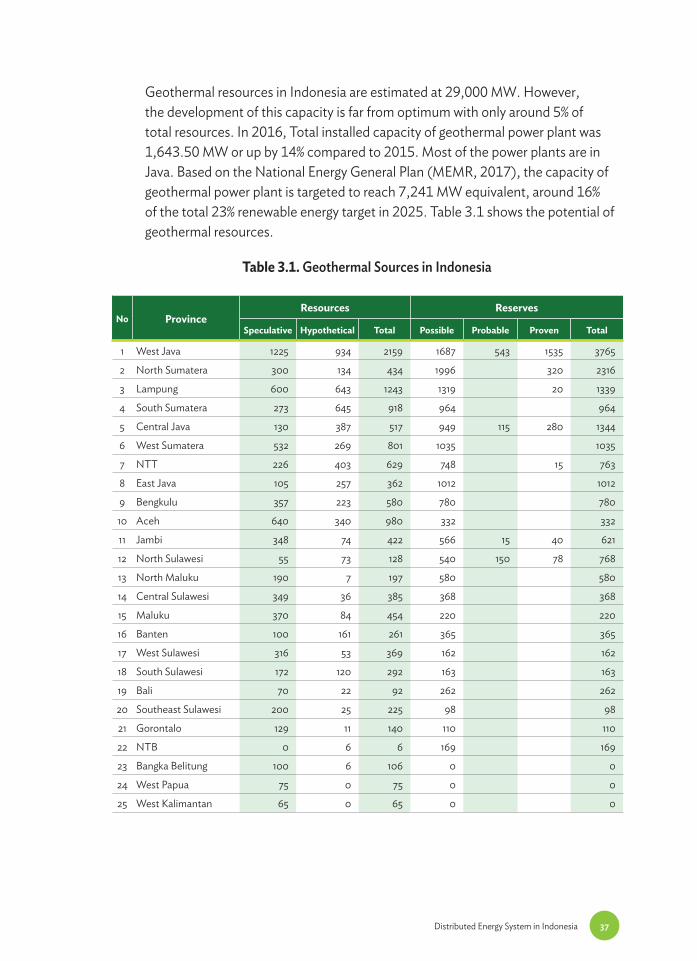
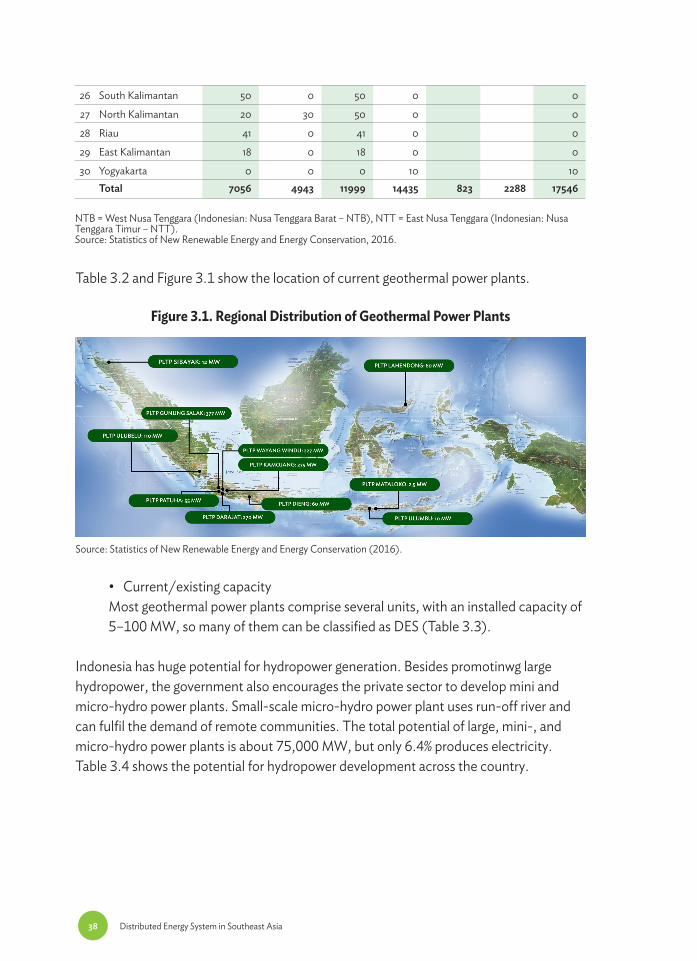
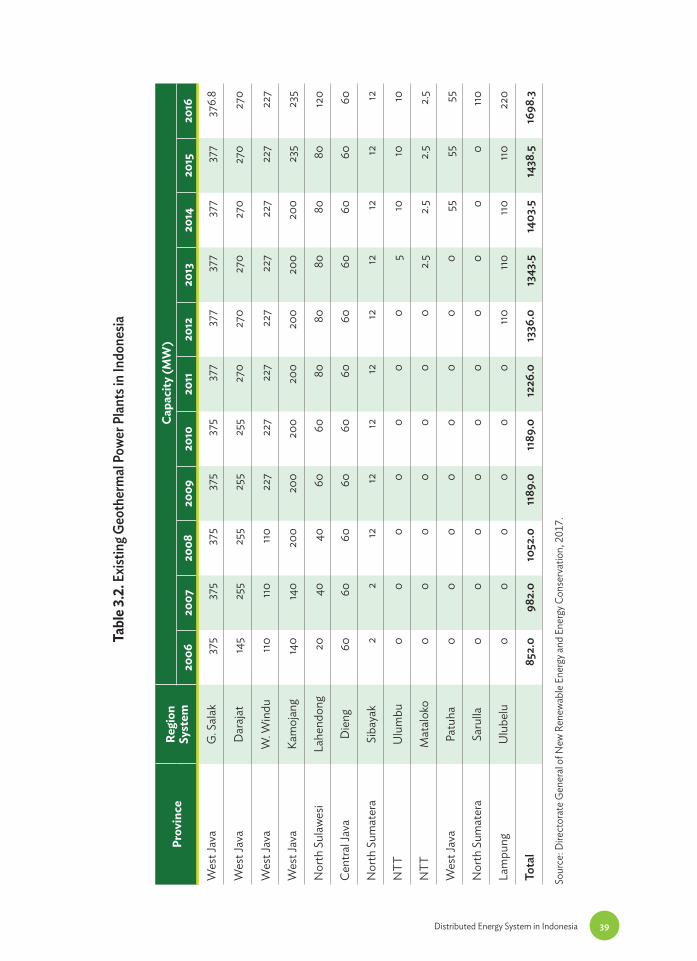
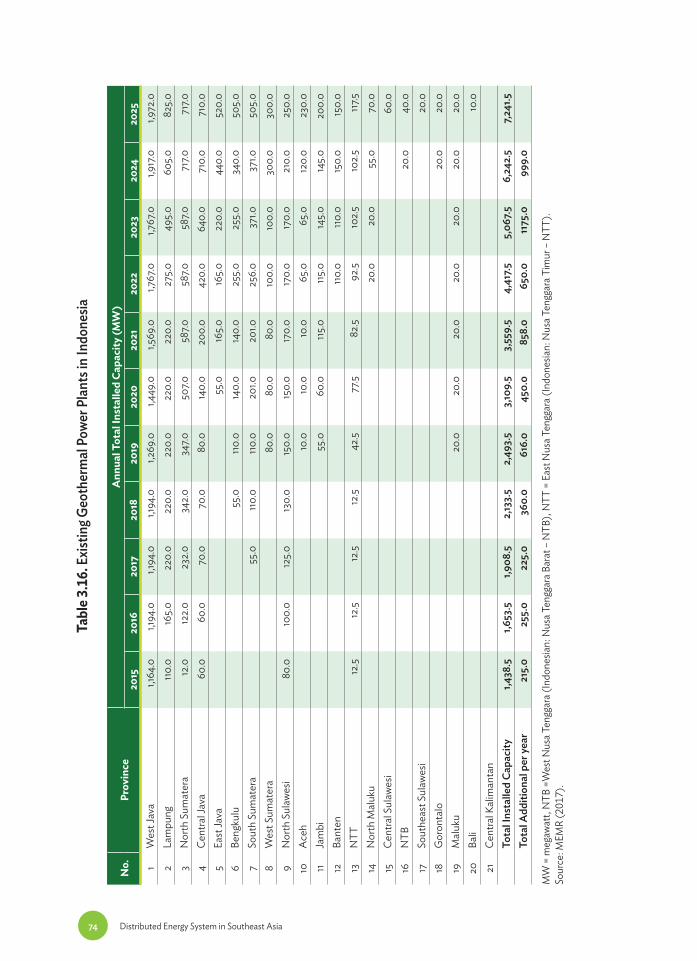
Geothermal resources in Indonesia are estimated at 29,000 MW. However, the development of this capacity is far from optimum with only around 5% of total resources. In 2016, Total installed capacity of geothermal power plant was 1,643.50 MW or up by 14% compared to 2015. Most of the power plants are in Java. Based on the National Energy General Plan (MEMR, 2017), the capacity of geothermal power plant is targeted to reach 7,241 MW equivalent, around 16% of the total 23% renewable energy target in 2025. Table 3.1 shows the potential of geothermal resources.
Table 3.1. Geothermal Sources in Indonesia
No ProvinceResources Reserves
Speculative Hypothetical Total Possible Probable Proven Total
1 West Java 1225 934 2159 1687 543 1535 3765
2 North Sumatera 300 134 434 1996 320 2316
3 Lampung 600 643 1243 1319 20 1339
4 South Sumatera 273 645 918 964 964
5 Central Java 130 387 517 949 115 280 1344
6 West Sumatera 532 269 801 1035 1035
7 NTT 226 403 629 748 15 763
8 East Java 105 257 362 1012 1012
9 Bengkulu 357 223 580 780 780
10 Aceh 640 340 980 332 332
11 Jambi 348 74 422 566 15 40 621
12 North Sulawesi 55 73 128 540 150 78 768
13 North Maluku 190 7 197 580 580
14 Central Sulawesi 349 36 385 368 368
15 Maluku 370 84 454 220 220
16 Banten 100 161 261 365 365
17 West Sulawesi 316 53 369 162 162
18 South Sulawesi 172 120 292 163 163
19 Bali 70 22 92 262 262
20 Southeast Sulawesi 200 25 225 98 98
21 Gorontalo 129 11 140 110 110
22 NTB 0 6 6 169 169
23 Bangka Belitung 100 6 106 0 0
24 West Papua 75 0 75 0 0
25 West Kalimantan 65 0 65 0 0
38 Distributed Energy System in Southeast Asia
Table 3.2 and Figure 3.1 show the location of current geothermal power plants.
Figure 3.1. Regional Distribution of Geothermal Power Plants
Source: Statistics of New Renewable Energy and Energy Conservation (2016).
• Current/existing capacityMost geothermal power plants comprise several units, with an installed capacity of 5–100 MW, so many of them can be classified as DES (Table 3.3).
Indonesia has huge potential for hydropower generation. Besides promotinwg large hydropower, the government also encourages the private sector to develop mini and micro-hydro power plants. Small-scale micro-hydro power plant uses run-off river and can fulfil the demand of remote communities. The total potential of large, mini-, and micro-hydro power plants is about 75,000 MW, but only 6.4% produces electricity. Table 3.4 shows the potential for hydropower development across the country.
NTB = West Nusa Tenggara (Indonesian: Nusa Tenggara Barat – NTB), NTT = East Nusa Tenggara (Indonesian: Nusa Tenggara Timur – NTT).Source: Statistics of New Renewable Energy and Energy Conservation, 2016.
Table 3.3. Geothermal Power Plants with Installed Capacity of Less than 100 MW per Unit
No. Province PLTP Turbine Capacity Capacity each unit (MW)
Total Capacity (MW)
1 Sibayak – SinabungNorth Sumatera
Sibayak (monobloc 2 12
1 x 5 MW 5
1 X 5 MW 52 Cibeureum – Parabakti,
West JavaSalak 1 x 60 MW 60 376.8
1 x 60 MW 60
1 x 60 MW 60
1 x 65.6 MW 65.6
1 x 65.6 MW 65.6
1 x 65.6 MW 65.63 Pangalengan, West Java Patuha 1 x 55 MW 55 55
Kamojang 1 x30 MW 30 235
1 x 55 MW 55
1 X 55 MW 55
1 x 60 MW 60
1 x 35 MW 35Darajat 1 x 55 MW 55 149
1 x 94 MW 944 Dataran Tinggi Dieng,
Central JavaDieng 1 x 60 MW 60 60
5 Lahendong – Tompaso,North Sulawesi
Lahendong 1 x 20 MW 20 120
1 x 20 MW 20
1 x 20 MW 20
1 x 20 MW 20
1 x 20 MW 20
1 x 20 MW 206 Waypanas – Lampung Ulubelu 1 x 55 MW 55 220
1 x 55 MW 55
1 x 55 MW 55
1 x 55 MW 557 Ulumbu - NTT Ulumbu 1 x 2.5 MW 2.5 10
1 x 2.5 MW 2.5
1 x 2.5 MW 2.5
1 x 2.5 MW 2.58 Mataloko - NTT Mataloko 1 x 2.5 MW 2.5 2.5
Total 1240.3
MW = megawatt, NTT = East Nusa Tenggara (Indonesian: Nusa Tenggara Timur – NTT), PLTP = Indonesia Power, monobloc = type of turbine rotor construction.Source: Statistics of New Renewable Energy and Energy Conservation, 2016.
41Distributed Energy System in Indonesia
Hydropower
• Hydropower resourcesIndonesia has huge potential for hydropower generation. Besides promoting large hydropower, the government also encourages the private sector to develop mini and micro-hydro power plants. Small-scale micro-hydro power plant uses run-off river and can fulfil the demand of remote communities. The total potential of large, mini-, and micro-hydro power plants is about 75,000 MW, but only 6.4% produces electricity. Table 3.4 shows the potential for hydropower development across the country.
Table 3.4. Hydropower Source in Indonesia
No. Province Potential (MW)
1 Papua 22,371
2 Kalsel, Kalteng, Kaltim 16,844
3 Sulsel, Sultra 6,340
4 Aceh 5,062
5 West Kalimantan 4,737
6 Sulut, Sulteng 3,967
7 North Sumatera 3,808
8 West Sumatera, Riau 3,607
9 Sumsel, Bengkulu, Jambi, Lampung 3,102
10 West Java 2,861
11 Central Java 813
12 Bali, NTB, NTT 624
13 East Java 525
14 Maluku 430
Total 75,091
MW = megawatt, NTB = West Nusa Tenggara (Indonesian: Nusa Tenggara Barat – NTB), NTT = East Nusa Tenggara (Indonesian: Nusa Tenggara Timur – NTT). Source: National Energy General Plan (RUEN) (2017).
• Current/existing capacity Table 3.5 illustrates some of the existing hydro power plants with capacity less than 100 MW per unit.
42 Distributed Energy System in Southeast Asia
Table 3.5. Hydro Power Plants with Installed Capacity of Less than 100 MW per Unit
No. Power Plant Province Region Power System Installed capacity(MW)
1 PLTMH Aceh Tersebar Aceh 2.62
2 PLTMH North Sumatera Tersebar Sumut 7.5
3 PLTA North Sumatera Sipan 50
4 PLTA North Sumatera Renun 82
5 PLTA West Sumatera Maninjau 68
6 PLTA West Sumatera Batang Agam 10.5
7 PLTMH West Sumatera Tersebar Sumbar 66
8 PLTA West Java Ubrug 18
9 PLTA West Java Kracak 19
10 PLTA West Java Plengan 7
11 PLTA West Java Lamajan 20
12 PLTA West Java Cikalong 19
13 PLTA West Java Bengkok 3
14 PLTA West Java Dago 1
15 PLTA West Java Parakan 10
16 PLTA Central Java Jelok 21
17 PLTA Central Java Timo 12
18 PLTA Central Java Keteranganenger 8
19 PLTA Central Java Gerung 26
20 PLTA Central Java Wonogiri 12
21 PLTA Central Java Sempor 1
22 PLTA Central Java Wadas Lintang 18
23 PLTA Central Java Kedung Ombo 23
24 PLTA Central Java Lambu 1
25 PLTA Central Java Pengkol 1
26 PLTA Central Java Selorejo 1
27 PLTA East Java Wlingi 54
28 PLTA East Java Ledoyo 5
29 PLTA East Java Selorejo 5
30 PLTA East Java Sengguruh 29
31 PLTA East Java Tulung Agung 36
32 PLTA East Java Mendalan 23
33 PLTA East Java Siman 11
34 PLTA East Java Madiun 8
35 PLTA South Kalimantan Sistem Barito 30
36 PLTA North Sulawesi Sistem Minahasa-Kotamobagu 58.4
37 PLTA/M Central Sulawesi Sistem Poso-Tentena 74.8
38 PLTA/M Central Sulawesi Luwuk-Tolli 8.4
43Distributed Energy System in Indonesia
39 PLTA/M Central Sulawesi Ampana-Bunta 3.3
40 PLTA/M Central Sulawesi Toli-toli 1.6
41 PLTA/M Central Sulawesi Moutong-Kotaraya 2
42 PLTA/M Central Sulawesi Kolonedale 3
43 PLTA/M Central Sulawesi Bungku 2
44 PLTMH Gorontalo Gorontalo 3
45 PLTA South Sulawesi Bakaru 1 63
46 PLTA South Sulawesi Bakaru 2 63
47 PLTA South Sulawesi Bili Bili 20
48 PLTMH South Sulawesi Sawitto 1.6
49 PLTMH South Sulawesi Balla Mamasa 0.7
50 PLTMH South Sulawesi Kalukku Mamuju 1.4
51 PLTMH South Sulawesi Bonehau Mamasa 4
52 PLTMH South Sulawesi Budong-budong Mamuju 2
53 PLTMH South Sulawesi Tangka Manipi Sinjai 10
54 PLTMH South Sulawesi Simbuang Luwu 3
55 PLTMH South Sulawesi Siteba Palopo 7.5
56 PLTMH South Sulawesi Malea Tator 14
57 PLTMH South Sulawesi Ranteballa Palopo 2.4
58 PLTMH South Sulawesi Bungin Enrekang 3
59 PLTA South Sulawesi Poso 1 65
60 PLTA South Sulawesi Poso 2 65
61 PLTA South Sulawesi Poso 3 65
62 PLTMH South Sulawesi Saluanoa Luwu 2
63 PLTA South Sulawesi Malili(PT Vale Excess Power) 10.7
• Micro-hydro resourcesMini/micro hydro is one of the potential sources to be developed in many parts of the country. Its estimated potential is 19,385 MW (Table 3.6).
44 Distributed Energy System in Southeast Asia
MW = megawatt, NTB =West Nusa Tenggara (Indonesian: Nusa Tenggara Barat – NTB), NTT = East Nusa Tenggara (Indonesian: Nusa Tenggara Timur – NTT).Source: Author.
Table 3.6. Mini and Micro Hydro Potential in Indonesia
No. Province Potential (MW)
1 East Kalimantan 3,562
2 Central Kalimantan 3,313
3 Aceh 1,538
4 West Sumatera 1,353
5 North Sumatera 1,204
6 East Java 1,142
7 Central Java 1,044
8 North Kalimantan 943
9 South Sulawesi 762
10 West Java 647
11 Papua 615
12 South Sumatera 448
13 Jambi 447
14 Central Sulawesi 370
15 Lampung 352
16 Southeast Sulawesi 301
No. Province Potential (MW)
17 Riau 284
18 Maluku 190
19 South Kalimantan 158
20 West Kalimantan 124
21 Gorontalo 117
22 North Sulawesi 111
23 Bengkulu 108
24 NTT 95
25 Banten 72
26 NTB 31
27 North Maluku 24
28 Bali 15
29 West Sulawesi 7
30 DI Yogyakarta 5
31 West Papua 3
Total 19,385
• Current/existing capacityTable 3.7 shows the existing micro hydro power plants with capacity less than 100 MW per unit.
Table 3.7. Micro Hydropower Plant with Installed Capacity of Less than 100 MW per Unit
No. Province Region System Installed capacity (MW)
1 Gorontalo Gorontalo 0.0372
2 West Java Ciamis 0.0244
3 Central Kalimantan Gunung Mas 0.3290
4 NTT Ngada 0.0260
5 NTB Lombok 0.0300
6 North Sulawesi Sangihe 0.0141
7 North Sumatera Samosir 0.0312
45Distributed Energy System in Indonesia
39 West Papua Manokwari 0.0450
40 NTB Sumbawa 0.3000
41 Gorontalo Gorontalo 0.0300
42 South Sumatera Muara Enim 0.0200
43 Papua Jayapura 0.0230
44 West Sumatera Solok 0.0130
45 North Sumatera Tapanuli Selatan 0.0250
46 Southeast Sulawesi Buton Utara 0.0120
47 NTT Manggarai Timur 0.0500
MW = megawatt, NTB =West Nusa Tenggara (Indonesian: Nusa Tenggara Barat – NTB), NTT = East Nusa Tenggara (Indonesian: Nusa Tenggara Timur – NTT).Source: MEMR (2015).
8 Central Sulawesi Lamantoli Morowali 0.0206
9 NTT Manggarai Timur 0.0800
10 NTT Rote Tengah 0.0200
11 NTT Sumba Tengah 0.0120
12 Papua Pegunungan Bintang 0.0300
13 NTB Lombok Timur 0.0200
14 NTT Timor Tengah Selatan 0.0500
15 Papua Pegunungan Bintang 0.0400
16 Papua Teluk Bintuni 0.0084
17 Gorontalo Gorontalo Utara 0.0180
18 South Sumatera Oku Selatan 0.0230
19 NTT Timor Tengah Selatan 0.0350
20 West Kalimantan Kapuas Hulu 0.4000
21 West Papua Sorong Selatan 0.2850
22 West Sumatera Pasaman Barat 0.0160
23 Papua Yalimo 0.0500
24 West Sulawesi Mamasa 0.1200
25 West Papua Maybrat 0.2660
26 Lampung Lampung Barat 0.0800
27 Riau Kampar 0.0080
28 East Java Situbondo 0.0150
29 Gorontalo Bone Bolango 0.0400
30 Gorontalo Gorontalo Utara 0.0200
31 Papua Pegunungan Bintang 0.0350
32 Jambi Sarolangun 0.0180
33 Central Kalimantan Lamandau 0.0160
34 Southeast Sulawesi Konawe Utara 0.0160
35 South Sulawesi Luwu Utara 0.0400
36 West Kalimantan Landak 0.0500
37 Maluku Seram Bagian Barat 0.0300
38 West Sumatera Kep. Mentawai 0.0250
46 Distributed Energy System in Southeast Asia
Solar power
• Solar power resourcesThe potential of solar power in Indonesia is estimated at 207,888 MW, with West Kalimantan having the largest potential at 20.113 MW (Table 3.8). The development of solar power is still very limited at about 0,08 GWp (80 MWp) consisting of stand-alone solar PV located in remote areas and some on-grid larger capacity up to 5 MW that has been installed in Kupang, East Nusa Tenggara. In 2025, solar power is expected to reach 6,500 MW. Table 3.8 shows the potential of solar power.
MW = megawatt, NTB =West Nusa Tenggara (Indonesian: Nusa Tenggara Barat – NTB), NTT = East Nusa Tenggara (Indonesian: Nusa Tenggara Timur – NTT) Source: MEMR (2017).
Table 3.8. Solar Power Potential in Indonesia
No. Province Potential (MW)
1 West Kalimantan 20,113
2 South Sumatera 17,233
3 East Kalimantan 13,479
4 North Sumatera 11,851
5 East Java 10,335
6 NTB 9,931
7 West Java 9,099
8 Jambi 8,847
9 Central Java 8,753
10 Central Kalimantan 8,459
11 Aceh 7,881
12 Riau Islands 7,763
13 South Sulawesi 7,588
14 NTT 7,272
15 West Papua 6,307
16 Central Sulawesi 6,187
17 South Kalimantan 6,031
18 West Sumatera 5,898
No. Province Potential (MW)
19 North Kalimantan 4,643
20 Southeast Sulawesi 3,917
21 Bengkulu 3,475
22 North Maluku 3,036
23 Bangka Belitung 2,810
24 Banten 2,461
25 Lampung 2,238
26 North Sulawesi 2,113
27 Papua 2,035
28 Maluku 2,020
29 West Sulawesi 1,677
30 Bali 1,254
31 Gorontalo 1,218
32 DI Yogyakarta 996
33 Riau 753
34 DKI Jakarta 225
Total 207,898
• Current/existing capacityTable 3.9 shows the existing solar power plants with capacity less than 100 MW per unit.
47Distributed Energy System in Indonesia
Table 3.9. Solar Power Plants with Installed Capacity of Less than 100 MW per Unit
No. Province Region Power System Installed capacity (MW)
1 West Sumatera Kep. Mentawai 0.01
2 West Kalimantan Kayong Utara 0.01
3 Southeast Sulawesi Buton Utara 0.01
4 NTT Belu 0.005
5 NTT Kupang 0.01
6 NTT Manggarai Barat 0.01
7 NTT Rote Ndao 0.005
8 Papua Nabire 0.01
9 Papua Tolikara 0.075
10 West Sumatera Sijunjung 0.015
11 West Sumatera Solok 0.015
12 West Sumatera Pasaman 0.015
13 West Sumatera Pasaman Barat 0.03
14 Riau Kep. Meranti 0.015
15 Riau Kep. Meranti 0.015
16 Riau Rokan Hulu 0.015
17 Riau Indragiri Hilir 0.015
18 Riau Kuantan Singingi 0.015
19 Riau Bengkalis 0.015
20 Jambi Tanjung Jabung Timur 0.015
21 Jambi Bungo 0.015
22 Jambi Sarolangun 0.015
23 Jambi Batanghari 0.015
24 South Sumatera Banyuasin 0.03
25 South Sumatera Banyuasin 0.03
26 South Sumatera Banyuasin 0.015
27 South Sumatera Ogan Komering Ilir 0.03
28 Bengkulu Seluma 0.015
29 Bengkulu Kaur 0.015
30 Bengkulu Kaur 0.015
31 Bengkulu Kaur 0.015
32 Bengkulu Kaur 0.015
33 Bangka Belitung Bangka Selatan 0.015
34 Bangka Belitung Bangka Selatan 0.015
35 Bangka Belitung Bangka Barat 0.015
36 Bangka Belitung Belitung Timur 0.015
37 Bangka Belitung Bangka Barat 0.015
38 DKI Jakarta Kep. Seribu 0.015
39 Banten Serang 0.03
48 Distributed Energy System in Southeast Asia
40 West Java Cianjur 0.015
41 West Java Cianjur 0.015
42 West Java Cianjur 0.015
43 Central Java Banyumas 0.015
44 Central Java Banjarnegara 0.015
45 Central Java Blora 0.015
46 Yogyakarta Cirebon 0.015
47 Yogyakarta Gunung Kidul 0.015
48 East Java Sumenep 0.015
49 East Java Jombang 0.015
50 East Java Bojonegoro 0.015
51 Bali Bangli 1
52 Bali Karangasem 1
53 Bali Karangasem 0.015
54 Bali Bangli 0.015
55 Bali Bangli 0.015
56 Bali Bangli 0.015
57 Bali Bangli 0.015
58 Bali Klungkung 0.015
59 NTB Sumbawa 1
60 NTB Lombok Timur 0.015
61 NTB Sumbawa 0.015
62 NTB Lombok Barat 0.015
63 NTB Lombok Tengah 0.015
64 NTB Bima 0.015
65 NTT Timor Tengah Selatan 0.015
66 NTT Rote Ndao 0.015
67 NTT Belu 0.015
68 NTT Belu 0.015
69 NTT Belu 0.015
70 West Kalimantan Ketapang 0.015
71 West Kalimantan Sanggau 0.015
72 West Kalimantan Landak 0.015
73 West Kalimantan Kapuas Hulu 0.015
74 Central Kalimantan Katingan 0.015
75 Central Kalimantan Lamandau 0.015
76 Central Kalimantan Murung Raya 0.015
77 Central Kalimantan Seruyan 0.015
78 Central Kalimantan Barito Timur 0.015
79 Central Kalimantan Barito Utara 0.015
49Distributed Energy System in Indonesia
80 Central Sulawesi Sigi 0.015
81 Central Sulawesi Donggala 0.015
82 Central Sulawesi Toli-toli 0.015
83 Central Sulawesi Parigi Moutong 0.015
84 Southeast Sulawesi Kolaka Utara 0.015
85 Southeast Sulawesi Buton 0.03
86 Southeast Sulawesi Kolaka 0.03
87 Southeast Sulawesi Bombana 0.015
88 Southeast Sulawesi Bau-bau 0.015
89 Gorontalo Gorontalo 0.015
90 Gorontalo Bone Bolango 0.015
91 Gorontalo Pohuwato 0.015
92 Gorontalo Gorontalo Utara 0.015
93 West Sulawesi Majene 0.015
94 West Sulawesi Mamuju Utara 0.015
95 West Sulawesi Majene 0.015
96 West Sulawesi Mamuju Utara 0.015
97 West Sulawesi Mamasa 0.015
98 Maluku Maluku Barat Daya 0.015
99 Maluku Maluku Tenggara 0.015
100 Maluku Maluku Tenggara Barat 0.015
101 Maluku Maluku Tenggara Barat 0.015
102 Maluku Maluku Tenggara Barat 0.015
103 Maluku Maluku Tenggara Barat 0.015
104 Maluku Utara Halmahera Tengah 0.015
105 Maluku Utara Kep. Sula 0.015
106 Maluku Utara Halmahera Timur 0.015
107 Maluku Utara Halmahera Utara 0.015
108 West Papua Sorong 0.015
109 West Papua Kota Sorong 0.015
110 West Papua Manokwari 0.015
111 West Papua Kaimana 0.015
112 West Papua Sorong Selatan 0.015
113 West Papua Sorong Selatan 0.015
114 West Papua Sorong Selatan 0.015
115 West Papua Sorong Selatan 0.015
116 Papua Keerom 0.015
117 Papua Keerom 0.015
118 Papua Keerom 0.015
119 Papua Yalimo 0.015
50 Distributed Energy System in Southeast Asia
120 Papua Yalimo 0.015
121 Papua Yalimo 0.015
122 Papua Peg. Bintang 0.015
123 North Sumatera Nias Selatan 0.01
124 North Sumatera Nias Barat 0.005
125 West Sumatera Kep. Mentawai 0.005
126 South Sumatera OKU Selatan 0.002
127 Bangka Belitung Bangka Selatan 0.003
128 Lampung Mesuji 0.005
129 West Kalimantan Sekadau 0.023
130 West Kalimantan Melawi 0.005
131 Central Kalimantan Gunung Mas 0.005
132 Central Kalimantan Seruyan 0.005
133 NTT Alor 0.004
134 NTT Belu 0.007
135 NTT Manggarai 0.0075
136 NTT Sumba Barat 0.006
137 NTT Sumba Timur 0.005
138 NTT Timor Tengah Utara 0.015
139 NTT Manggarai Barat 0.01
140 NTT Nagekeo 0.005
141 NTT Sumba Barat Daya 0.005
142 NTT Sumba Tengah 0.005
143 NTT Sabu Raijua 0.005
144 Maluku Kep. Aru 0.005
145 Papua Paniai 0.05
146 Papua Yahukimo 0.015
147 Papua Peg. Bintang 0.015
148 Papua Yalimo 0.05
149 Papua Intan Jaya 0.05
150 West Papua Sorong Selatan 0.01
151 West Papua Maybrat 0.03
152 West Papua Tambrauw 0.015
153 Aceh Singkil 0.015
154 Aceh Simeulue (2) 0.015
155 Aceh Simeuleu 0.015
156 Aceh Simeuleu 0.015
157 Aceh Singkil 0.015
158 North Sumatera Tapanuli Utara 0.015
159 North Sumatera Tapanuli Selatan 0.02
51Distributed Energy System in Indonesia
160 North Sumatera Tapanuli Tengah 0.015
161 North Sumatera Mandailing Natal 0.02
162 North Sumatera Nias Selatan 0.015
163 North Sumatera Nias Utara 0.02
164 West Sumatera Pasaman 0.015
165 West Sumatera Sijunjung 0.015
166 Riau Kep. Meranti 0.02
167 Riau Indragiri Hilir 0.015
168 Jambi Tanjung Jabung Barat 0.02
169 Jambi Tebo 0.015
170 Jambi Muaro Jambi 0.015
171 Jambi Batang Hari 0.015
172 South Sumatera Banyuasin 0.015
173 South Sumatera Banyuasin 0.015
174 South Sumatera Banyuasin 0.015
175 Bangka Belitung Belitung Timur 0.015
176 Bangka Belitung Bangka Selatan 0.015
177 Bangka Belitung Bangka Barat 0.015
178 Lampung Pesawaran 0.025
179 Lampung Mesuji 0.015
180 Lampung Mesuji 0.015
181 Lampung Mesuji 0.015
182 Lampung Mesuji 0.015
183 Lampung Tangamus 0.02
184 Lampung Tangamus 0.02
185 Lampung Lampung Utara 0.02
186 Kep. Riau Bintan 0.02
187 Kep. Riau Bintan 0.015
188 Kep. Riau Natuna 0.015
189 Kep. Riau Lingga 0.015
190 Banten Serang 0.025
191 West Java Bogor 0.015
192 Central Java Jepara 0.025
193 Central Java Tegal 0.02
194 East Java Ponorogo 0.015
195 East Java Bangkalan 0.02
196 East Java Sumenep 0.02
197 Bali Karangasem 0.015
198 Bali Karangasem 0.015
199 NTB Lombok Utara 0.02
52 Distributed Energy System in Southeast Asia
200 NTB Lombok Tengah 0.015
201 NTB Lombok Barat 0.015
202 NTB Bima 0.015
203 NTT Kupang 0.015
204 NTT Rote Ndao 0.015
205 NTT Sabu Raijua 0.015
206 West Kalimantan Landak 0.015
207 West Kalimantan Ketapang 0.015
208 West Kalimantan Kapuas Hulu 0.015
209 Central Kalimantan Kotawaringin Timur 0.025
210 Central Kalimantan Katingan 0.015
211 South Kalimantan Hulu Sungai Tengah 0.015
212 South Kalimantan Tapin 0.025
213 South Kalimantan Tabalong 0.015
214 South Kalimantan Tabalong 0.015
215 South Kalimantan Hulu Sungai Selatan 0.015
216 South Kalimantan Kotabaru 0.015
217 South Kalimantan Kotabaru 0.015
218 East Kalimantan Paser 0.015
219 East Kalimantan Kutai Barat 0.015
220 East Kalimantan Kutai Barat 0.015
221 East Kalimantan Malinau 0.015
222 East Kalimantan Nunukan 0.015
223 North Sulawesi Kep. Siau Tagulandong Biaro 0.015
224 North Sulawesi Kep. Siau Tagulandong Biaro 0.015
225 North Sulawesi Kep. Sangihe 0.015
226 North Sulawesi Kep. Sangihe 0.015
227 South Sulawesi Pangkep 0.015
228 South Sulawesi - 0.015
229 South Sulawesi Luwu Timur 0.015
230 South Sulawesi Pinrang 0.025
231 South Sulawesi Kep. Selayar 0.015
232 South Sulawesi Takalar 0.015
233 Southeast Sulawesi Buton Utara 0.015
234 Southeast Sulawesi Konawe Utara 0.02
235 Southeast Sulawesi Wakatobi 0.02
236 Maluku Utara Halmahera Selatan 0.015
237 Gorontalo Bone Bolango 0.015
238 Gorontalo Pohuwato 0.015
239 Gorontalo Gorontalo Utara 0.015
53Distributed Energy System in Indonesia
240 Gorontalo Gorontalo Utara 0.025
241 West Sulawesi Polewali Mandar 0.015
242 West Sulawesi Mamuju 0.015
243 West Sulawesi Mamuju 0.015
244 West Sulawesi Mamuju Utara 0.02
245 West Papua Raja Ampat 0.015
246 West Papua Tambraw 0.025
247 West Papua Tambraw 0.015
248 West Papua Tambraw 0.015
249 West Papua Tambraw 0.015
250 West Papua Tambraw 0.025
251 Bangka Belitung Bangka 1
252 South Sulawesi Pangkajene Kepulauan 1
253 North Sumatera Kuantan Singingi 0.1
254 Riau Nias 0.05
255 Lampung Lampung Barat 0.075
256 South Sumatera Banyuasin 0.15
257 East Java Sumenep 0.05
258 East Kalimantan Kutai Barat 0.1
259 NTT Timor Tengah Selatan 0.03
260 NTT Sumba Tengah 0.05
261 NTB Sumbawa 0.03
262 West Papua Kaimana 0.075
263 Papua Mappi 0.05
264 Papua Kep. Yapen 0.15
265 Papua Tolikara 0.05
266 Papua Tolikara 0.05
267 Papua Tolikara 0.05
268 Papua Tolikara 0.05
269 Papua Mamberamo Raya 0.15
270 Papua Mamberamo Raya 0.05
271 Papua Mamberamo Raya 0.075
272 Papua Mamberamo Raya 0.15
273 Papua Mamberamo Raya 0.1
274 North Sumatera Nias 0.005
275 South Sumatera Musi Rawas 0.04
276 South Sumatera Ogan Komering Ulu Selatan 0.135
277 East Java Bangkalan 0.015
278 East Java Bangkalan 0.0075
279 East Java Bondowoso 0.03
54 Distributed Energy System in Southeast Asia
280 East Java Sumenep 0.026
281 Central Kalimantan Gunung Mas 0.018
282 North Sulawesi Bolaang Mongondow Utara 0.015
283 Gorontalo Boalemo 0.015
284 Gorontalo Pohuwato 0.015
285 Gorontalo Pohuwato 0.007
286 Gorontalo Gorontalo Utara 0.03
287 South Sulawesi Sinjai 0.015
288 Southeast Sulawesi Konawe Selatan 0.015
289 Bali Bangli 0.0075
290 NTB Sumbawa 0.015
291 NTB Sumbawa Barat 0.015
292 NTT Belu 0.01
293 NTT Sumba Timur 0.015
294 NTT Sumba Tengah 0.005
295 Maluku Utara Pulau Morotai 0.015
296 Papua Jayawijaya 0.015
297 Papua Pegunungan Bintang 0.015
298 West Papua Tambrauw 0.015
299 North Sumatera Tapanuli Selatan 0.015
300 North Sumatera Tapanuli Tengah 0.015
301 North Sumatera Karo 0.02
302 North Sumatera Tapanuli Selatan 0.02
303 Riau Rokan Hulu 0.015
304 Riau Bengkalis 0.02
305 Riau Siak 0.05
306 Riau Pelalawan 0.075
307 Jambi Tanjung Jabung Barat 0.02
308 South Sumatera Banyuasin 0.015
309 South Sumatera Ogan Ilir 0.03
310 Lampung Mesuji 0.015
311 Lampung Tangamus 0.03
312 Lampung Pesawaran 0.03
313 Lampung Tanggamus 0.05
314 Lampung Tanggamus 0.03
315 Lampung Tanggamus 0.03
316 Kep. Riau Natuna 0.03
317 Kep. Riau Natuna 0.02
318 Kep. Riau Bintan 0.015
319 Bangka Belitung Belitung 0.015
55Distributed Energy System in Indonesia
320 Bangka Belitung Bangka Tengah 0.015
321 Central Java Tegal 0.015
322 Central Java Jepara 0.075
323 East Java Pamekasan 0.015
324 East Java Pamekasan 0.015
325 Bali Karangasem 0.02
326 NTB Lombok Timur 0.03
327 NTB Lombok Utara 0.03
328 NTB Sumbawa 0.015
329 NTB Bima 0.05
330 West Kalimantan Landak 0.02
331 South Kalimantan Kotabaru 0.02
332 South Kalimantan Hulu Sungai Tengah 0.015
333 North Kalimantan Nunukan 0.03
334 East Kalimantan Kutai Kertanegara 0.03
335 East Kalimantan Penajam Paser Utara 0.015
336 East Kalimantan Penajam Paser Utara 0.015
337 East Kalimantan Penajam Paser Utara 0.015
338 East Kalimantan Penajam Paser Utara 0.015
339 South Sulawesi Luwu Utara 0.03
340 South Sulawesi Luwu Timur 0.015
341 South Sulawesi Pangkajene Kepulauan 0.02
342 Southeast Sulawesi Muna 0.015
343 Southeast Sulawesi Konawe Selatan 0.015
344 Gorontalo Gorontalo Utara 0.02
345 West Sulawesi Polewali Mandar 0.015
346 Maluku Utara Halmahera Timur 0.015
347 Maluku Utara Halmahera Timur 0.015
348 West Papua Sorong 0.015
349 West Kalimantan Bengkayang 0.03
350 West Kalimantan Sintang 0.02
351 West Kalimantan Sintang 0.015
352 West Kalimantan Kapuas Hulu 0.015
353 West Kalimantan Kapuas Hulu 0.015
354 West Kalimantan Kapuas Hulu 0.015
355 North Kalimantan Nunukan 0.03
356 North Kalimantan Nunukan 0.05
357 North Kalimantan Nunukan 0.05
358 East Kalimantan Mahakam Ulu 0.05
359 East Kalimantan Mahakam Ulu 0.05
56 Distributed Energy System in Southeast Asia
360 NTT Kupang 0.02
361 North Sumatera Nias Selatan 0.05
362 Kep. Riau Natuna 0.05
363 Bengkulu Bengkulu Utara 0.05
364 East Kalimantan Berau 0.05
365 East Kalimantan Nunukan 0.05
366 NTT Alor 0.03
367 Central Sulawesi Toli-toli 0.03
368 North Sulawesi Minahasa Utara 0.05
369 North Sulawesi Kep. Sangihe 0.05
370 North Sulawesi Kep. Talaud 0.03
371 North Sulawesi Kep. Sangihe 0.03
372 North Sulawesi Kep. Talaud 0.05
373 Maluku Maluku Tenggara Barat 0.1
374 Maluku Kep. Aru 0.03
375 Maluku Maluku Barat Daya 0.03
376 Maluku Maluku Barat Daya 0.03
377 Maluku Maluku Barat Daya 0.05
378 Maluku Maluku Barat Daya 0.05
379 Maluku Maluku Barat Daya 0.03
380 Maluku Maluku Barat Daya 0.05
381 Maluku Maluku Tenggara Barat 0.05
382 Papua Sarmi 0.03
383 Papua Supiori 0.03
384 Papua Supiori 0.05
385 Papua Merauke 0.05
386 Aceh Simeuleu 0.015
387 North Sumatera Nias 0.005
388 North Sumatera Nias 0.008
389 North Sumatera Nias Selatan 0.02
390 North Sumatera Nias Barat 0.005
391 North Sumatera Nias Barat 0.005
392 South Sumatera Ogan Komering Ulu Selatan 0.005
393 South Sumatera Ogan Komering Ulu Selatan 0.005
394 South Sumatera Ogan Komering Ulu Selatan 0.004
395 Yogyakarta Gunung Kidul 0.015
396 East Java Bangkalan 0.01
397 East Java Bondowoso 0.005
398 Central Kalimantan Katingan 0.02
399 Central Kalimantan Seruyan 0.005
57Distributed Energy System in Indonesia
400 Central Kalimantan Seruyan 0.01
401 South Sulawesi Sinjai 0.015
402 Southeast Sulawesi Kolaka 0.015
403 Southeast Sulawesi Konawe Selatan 0.015
404 Southeast Sulawesi Buton Utara 0.008
405 NTB Dompu 0.015
406 NTB Sumbawa Barat 0.015
407 NTB Lombok Utara 0.01
408 NTT Belu 0.01
409 NTT Sumba Tengah 0.005
410 Maluku Maluku Barat Daya 0.023
411 Maluku Utara Morotai 0.015
MW = megawatt, NTB =West Nusa Tenggara (Indonesian: Nusa Tenggara Barat – NTB),NTT = East Nusa Tenggara (Indonesian: Nusa Tenggara Timur – NTT).Source: Statistics of New Renewable Energy and Energy Conservation, 2015
Bioenergy
• Bioenergy resourcesIndonesia is endowed with various types of bioenergy that can be developed. The potential of biomass or biofuel is equivalent to 32,653 MW (Table 3.10). Indonesia uses around 1,671 MW of bioenergy, or about 5.1% of its potential reserves.
Table 3.10. Bioenergy Sources in Indonesia
No. ProvincePotential (MW)
Biomass/Biofuel Biogas Total
1 Riau 4,157.4 37.7 4,195.1
2 East Java 2,851.3 569.6 3,420.9
3 North Sumatera 2,796.1 115.5 2,911.6
4 West Java 1,979.8 574.3 2,554.1
5 Central Java 1,884.1 348.4 2,232.5
6 South Sumatera 2,061.4 71.2 2,132.6
7 Jambi 1,821.0 18.9 1,839.9
8 Central Kalimantan 1,486.7 12.2 1,498.9
9 Lampung 1,407.6 84.5 1,492.1
10 West Kalimantan 1,279.3 28.9 1,308.2
11 South Kalimantan 1,266.3 23.6 1,289.9
12 Aceh 1,136.6 37.7 1,174.3
13 East/North Kalimantan 946.6 17.7 964.3
58 Distributed Energy System in Southeast Asia
14 South Sulawesi 890.3 69.1 959.4
15 West Sumatera 923.1 34.7 957.8
16 Bengkulu 633.0 11.8 644.8
17 Banten 346.5 118.6 465.1
18 NTB 341.3 52.8 394.1
19 Central Sulawesi 307.4 19.5 326.9
20 NTT 192.5 48.0 240.5
21 DI Yogyakarta 183.1 41.1 224.2
22 Bangka Belitung 217.7 5.4 223.1
23 West Sulawesi 197.8 8.1 205.9
24 Bali 146.9 44.7 191.6
25 North Sulawesi 150.2 13.8 164.0
26 Southeast Sulawesi 132.8 17.7 150.5
27 Gorontalo 119.1 11.5 130.6
28 DKI Jakarta 0.5 126.1 126.6
29 Papua 81.4 15.1 96.5
30 West Papua 50.8 4.1 54.9
31 West Maluku 27.5 7.0 34.5
32 Maluku 23.6 9.0 32.6
33 Riau Islands 11.6 4.3 15.9
Total 30,051.3 2,602.6 32,653.9
* Administratively, DKI Jakarta is divided into four city administrations (City Administration of South Jakarta, East Jakarta, Central Jakarta, West Jakarta, and North Jakarta), and one administrative regency (Thousand Islands or Kepulauan Seribu). MW = megawatt, NTB = West Nusa Tenggara (Indonesian: Nusa Tenggara Barat – NTB), NTT = East Nusa Tenggara (Indonesian: Nusa Tenggara Timur – NTT).Source: MEMR (2017).
• Current/existing capacityTable 3.11 shows some of the existing bioenergy power plant – biomass, biogas, and municipal solid waste – with a capacity of less than 100 MW per unit.
Coal
• Coal resourcesThe total national coal produced in 2015 was 461.6 million tons, of which 79.3% or 365.8 million tons were exported and only 20.7% or 95.8 million tons used domestically, particularly for power plants, making Indonesia he largest coal exporter. Coal sources potential in 2015 was 120.5 billion tons, coal reserves was 32.4 billion tons, and production was 393 million tons.
59Distributed Energy System in Indonesia
Table 3.11. Bioenergy Power Plants with Installed Capacity of Less than 100 MW per Unit
No. Province Type Installed capacity(MW) On/Off grid
54 HSD PLTD Lampung PLTD Tersebar Lampung (Sewa) 0
55 HSD PLTD Lampung Tarahan 23.2
56 HSD PLTG Lampung Tarahan (G) 16.2
57 HSD PLTD Lampung Tarahan (Sewa) 23.2
58 HSD PLTD Lampung PLTD Tersebar Lampung 1.2
59 HSD PLTD Lampung PLTD Tersebar Lampung (Sewa) 0
60 HSD PLTG DKI Jakarta Priok 52
61 BBM PLTD Jambi Pelabuhan Dagang 6.4
62 BBM PLTD Jambi Sungai Lokan 1.2
63 BBM PLTD Jambi Mendahara Tengah 0.4
64 BBM PLTD Jambi Kuala Tungkal 3.5
65 BBM PLTD Jambi Batang Asai 0.8
66 BBM PLTD Jambi Sarolangun 3
67 BBM PLTG Central Java Cilacap 55
68 BBM PLTG East Java Gilitimur 40
63Distributed Energy System in Indonesia
69 BBM PLTG Bali Pemaron 98
70 BBM PLTD Bali Pesanggaran 0
71 BBM PLTD Bali Pesanggaran BOO 10
72 BBM PLTD Bali Pesanggaran BOT 51
73 BBM/Hydro PLTD/M West Kalimantan Bengkayang 4
74 BBM PLTD West Kalimantan Ngabang 9
75 BBM/Hydro PLTD West Kalimantan Sanggau 24
76 BBM PLTD West Kalimantan Sekadau 12
77 BBM PLTD West Kalimantan Sintang 22
78 BBM PLTD West Kalimantan Putussibau 7
79 BBM PLTD West Kalimantan Nangapinoh 8
80 BBM PLTD West Kalimantan Ketapang 31
81 BBM PLTD West Kalimantan Sistem Isolated 70
82 BBM PLTG South Kalimantan Sistem Barito 21
83 BBM PLTD South Kalimantan Sistem Barito 87.11
84 BBM PLTD South Kalimantan Sistem Barito (Sewa) 74.5
85 BBM PLTD South Kalimantan Sistem Kotabaru 5.4
86 BBM PLTD South Kalimantan Sistem Kotabaru (Sewa) 10
87 BBM PLTD South Kalimantan Sistem ULD Isolated Tersebar 14.4
88 BBM PLTD Central Kalimantan Sistem Barito 32.4
89 BBM PLTD Central Kalimantan Sistem Barito (Sewa) 41.5
90 BBM PLTD Central Kalimantan Sistem Pangkalan Bun 12.82
91 BBM PLTD Central Kalimantan Sistem Pangkalan Bun (Swasta Sewa) 13.4
92 BBM PLTD Central Kalimantan Sistem Buntok 5.58
93 BBM PLTD Central Kalimantan Sistem Buntok (Sewa) 7
94 BBM PLTD Central Kalimantan Sistem Muara Taweh 3.53
95 BBM PLTD Central Kalimantan Sistem Muara Taweh (Sewa) 7.5
96 BBM PLTD Central Kalimantan Sistem Kuala Pambuang 1.8
97 BBM PLTD Central Kalimantan Sistem Kuala Pambuang (Sewa) 4
98 BBM PLTD Central Kalimantan Sistem Nanga Bulik 2.5
99 BBM PLTD Central Kalimantan Sistem Nanga Bulik (Sewa) 2
100 BBM PLTD Central Kalimantan Sistem Kuala Kurun 2.07
101 BBM PLTD Central Kalimantan Sistem Kuala Kurun (Sewa) 3
102 BBM PLTD Central Kalimantan Sistem Puruk Cahu 1.5
103 BBM PLTD Central Kalimantan Sistem Puruk Cahu (Sewa) 4
104 BBM PLTD Central Kalimantan Sistem Sukamara 1
105 BBM PLTD Central Kalimantan Sistem Sukamara (Sewa) 2
64 Distributed Energy System in Southeast Asia
106 BBM PLTD Central Kalimantan Sistem ULD Isolated Tersebar 19.7
107 BBM/Gas PLTD/MG East Kalimantan Sistem Petung 21.2
108 BBM PLTD East Kalimantan Sistem Tanah Grogot 17.2
109 BBM PLTD East Kalimantan Sistem Melak 24.7
110 BBM PLTD East Kalimantan Sistem Sangatta 19.7
111 BBM PLTD North Kalimantan Sistem Bulungan 18.9
112 BBM/Gas PLTD/MG North Kalimantan Sistem Nunukan 24.7
113 BBM PLTD North Kalimantan Sistem Malinau 13.1
114 BBM PLTD North Kalimantan Sistem Tidung Pale 3.4
115 BBM/Gas PLTD/MG North Kalimantan Sistem Bunyu 4
116 BBM/Solar PLTD/S North Kalimantan Sistem Sebatik 5.3
117 BBM PLTD North Sulawesi Tahuna 11.4
118 BBM PLTD North Sulawesi Talaud 6.3
119 BBM PLTD North Sulawesi Siau/Ondong 4.9
120 BBM PLTD North Sulawesi Lirung 3.9
121 BBM PLTD North Sulawesi Tagulandang 3.7
122 BBM PLTD North Sulawesi Molibagu 5.2
123 BBM PLTD North Sulawesi Tahuna (isolated tersebar) 3.4
124 BBM PLTD North Sulawesi Manado (isolated tersebar) 4
125 BBM PLTD Central Sulawesi Sistem Palu-Parigi 91
126 BBM PLTD Central Sulawesi Sistem Poso-Tentena 6
127 BBM PLTD Central Sulawesi Luwuk-Tolli 25.2
128 BBM PLTD Central Sulawesi Ampana-Bunta 9.8
129 BBM PLTD Central Sulawesi Toli-toli 14.5
130 BBM PLTD Central Sulawesi Moutong-Kotaraya 12.3
131 BBM PLTD Central Sulawesi Kolonedale 5.9
132 BBM PLTD Central Sulawesi Bungku 7.5
133 BBM PLTD Central Sulawesi Banggai 4.8
134 BBM PLTD Central Sulawesi Leok 11.2
135 BBM PLTD Central Sulawesi Bangkir 4.2
136 BBM PLTD Central Sulawesi Palu (isolated tersebar) 5
137 BBM PLTD Central Sulawesi Luwuk (isolated tersebar) 15.4
138 BBM PLTD Central Sulawesi Toli-toli (isolated tersebar) 3.3
139 BBM PLTD Gorontalo Gorontalo 59.6
140 BBM PLTG South Sulawesi Westcan 14.4
141 BBM PLTG South Sulawesi Altshom 1 21.3
65Distributed Energy System in Indonesia
142 BBM PLTG South Sulawesi Altshom 2 20.1
143 BBM PLTG South Sulawesi GE 1 33.4
144 BBM PLTG South Sulawesi GE 2 33.4
145 BBM PLTD South Sulawesi Mitsubishi 1 12.6
146 BBM PLTD South Sulawesi Mitsubishi 2 12.6
147 BBM PLTD South Sulawesi SWD 1 12.4
148 BBM PLTD South Sulawesi SWD 2 12.4
149 BBM PLTD South Sulawesi Suppa 62.2
150 BBM PLTD South Sulawesi Tallasa (Sewa) 80
151 BBM PLTD South Sulawesi Tallo Lama (Sewa) 20
152 BBM PLTD South Sulawesi Sewatama Masamba (Sewa) 5
153 BBM PLTD South Sulawesi Selayar 8.8
154 BBM PLTD Southeast Sulawesi Lambuya 16.5
155 BBM/Hydro PLTD/M Southeast Sulawesi Kolaka 25.1
156 BBM PLTD Southeast Sulawesi Raha 11.8
157 BBM/Hydro PLTD/M Southeast Sulawesi Bau-Bau 47.4
158 BBM PLTD Southeast Sulawesi Wangi-Wangi 5.9
159 BBM/Hydro PLTD/M Southeast Sulawesi Lasusua 10.1
160 BBM PLTD Southeast Sulawesi Bombana 7.6
161 BBM PLTD Southeast Sulawesi Ereke 3.4
162 BBM PLTD West Sulawesi Pasang Kayu 8.41
163 BBM PLTD Maluku Hative Kecil 21.5
164 BBM PLTD Maluku Hative Kecil (Sewa) 20
165 BBM PLTD Maluku Poka 20.8
166 BBM PLTD Maluku Poka (Sewa) 26
167 BBM PLTD Maluku Masohi 4.7
168 BBM PLTD Maluku Masohi (Sewa) 6
169 BBM PLTD Maluku Waipia 0.4
170 BBM PLTD Maluku Liang 0
171 BBM PLTD Maluku Liang (Sewa) 1
172 BBM PLTD Maluku Kairatu 1.3
173 BBM PLTD Maluku Kairatu (Sewa) 4
174 BBM PLTD Maluku Piru 1.5
175 BBM PLTD Maluku Piru (Sewa) 2
176 BBM PLTD Maluku Namlea 4.6
177 BBM PLTD Maluku Namlea (Sewa) 5
178 BBM PLTD Maluku Mako 1.3
179 BBM PLTD Maluku Mako (Sewa) 2
66 Distributed Energy System in Southeast Asia
180 BBM PLTD Maluku Saparua 3.2
181 BBM PLTD Maluku Langgur 9.8
182 BBM PLTD Maluku Sistem Tual (Sewa) 4
183 BBM PLTD Maluku Saumlaki 7
184 BBM PLTD Maluku Sistem Saumlaki (Sewa) 1.5
185 BBM PLTD Maluku Dobo 2.5
186 BBM PLTD Maluku Sistem Dobo (Sewa) 1.5
187 BBM PLTD Maluku Utara Kayu Merah 11.6
188 BBM PLTD Maluku Utara Kayu Merah (Sewa) 14
189 BBM PLTD Maluku Utara Soa Siu 4.9
190 BBM PLTD Maluku Utara Soa Siu (Sewa) 10
191 BBM PLTD Maluku Utara Tobelo 6.8
192 BBM PLTD Maluku Utara Tobelo (Sewa) 4
193 BBM PLTD Maluku Utara Malifut 3.2
194 BBM PLTD Maluku Utara Jailolo-Sidangoli 4.6
195 BBM PLTD Maluku Utara Jailolo (Sewa) 3
196 BBM PLTD Maluku Utara Sofifi 3
197 BBM PLTD Maluku Utara Sofifi (Sewa) 3.2
198 BBM PLTD Maluku Utara Payahe 0.4
199 BBM PLTD Maluku Utara Bacan 3.2
200 BBM PLTD Maluku Utara Sistem Bacan (Sewa) 3
201 BBM PLTD Maluku Utara Sanana 2.4
202 BBM PLTD Maluku Utara Sistem Sanana (Sewa) 4
203 BBM PLTD Maluku Utara Daruba 7.3
204 BBM PLTD Papua Genyem 14.7
205 BBM PLTD/M Papua Wamena 7.3
206 BBM PLTD Papua Timika 28.8
207 BBM PLTD Papua Biak 21
208 BBM PLTD Papua Serui 8.4
209 BBM PLTD Papua Merauke 17.7
210 BBM PLTD Papua Nabire 34.5
211 BBM/Solar PLTD/S Papua Lisdes tersebar 13.9
212 BBM/Gas PLTD/G West Papua Sorong 52.8
213 BBM/Hydro PLTD/M West Papua Fak Fak 9.4
214 BBM PLTD West Papua Teminabuan 3.2
215 BBM PLTD West Papua Kaimana 8.7
67Distributed Energy System in Indonesia
216 BBM PLTD West Papua Manokwari 31.5
217 BBM PLTD West Papua Bintuni 12.2
218 BBM/Solar PLTD/S West Papua Lisdes tersebar 11.9
219 BBM/Hydro PLTD/M NTB Sumbawa 49.61
220 BBM PLTD NTB Bima 50.72
221 BBM PLTD NTB Sebotok 0.12
222 BBM PLTD NTB Labuhan Haji 0.1
223 BBM PLTD NTB Lebin 0.37
224 BBM PLTD NTB Bugis Medang 0.21
225 BBM PLTD NTB Klawis 0.13
226 BBM PLTD NTB Lunyuk 1.88
227 BBM PLTD NTB Lantung 0.47
228 BBM PLTD NTB Bajo Pulau 0.22
229 BBM PLTD NTB Nggelu 0.07
230 BBM PLTD NTB Pekat 0.62
231 BBM PLTD NTT Sistem Seba, Oesao 2.2
232 BBM PLTD NTT Sistem Soe 7
233 BBM PLTD NTT Sistem Kefamananu 7.1
234 BBM PLTD NTT Sistem Atambua 14.1
235 BBM PLTD NTT Sistem Betun 4.1
236 BBM PLTD NTT Sistem Kalabahi 6.1
237 BBM PLTD NTT Sistem Rote Ndao 4.9
238 BBM/Coal/Hydro PLTD/U/M NTT Sistem Ende 18.4
239 BBM PLTD NTT Sistem Wolowaru 2.2
240 BBM PLTD NTT Sistem Aesesa 3.2
241 BBM/Solar/Hydro PLTD/S/MH NTT Sistem Bajawa 12.7
242 BBM/Solar/Hydro PLTD/S/MH NTT Sistem Ruteng 20.7
243 BBM PLTD NTT Sistem Labuhan Bajo 6.5
244 BBM PLTD NTT Sistem Maumere 14.7
245 BBM PLTD NTT Sistem Larantuka 6.7
246 BBM PLTD NTT Sistem Adonara 5.1
247 BBM/Solar PLTD/S NTT Sistem Lembata 5.5
248 BBM PLTD NTT Sistem Waingapu 8.2
249 BBM/Solar/Hydro PLTD/S/MH NTT Sistem Waikabubak-
Waitabula 10.4
250 BBM/Solar PLTD/S NTT Gab isolated area Kupang 8.7
68 Distributed Energy System in Southeast Asia
251 BBM PLTD NTT Gab isolated area FBB 8.8
252 BBM/Solar PLTD/S NTT Gab isolated area FBT 4.6
253 BBM/Hydro PLTD/MH NTT Gab isolated area Sumba 0.8
254 MFO PLTD South Sumatera PT Asta Kramasan Energi (Sewa) 65
255 IDO PLTD Jambi PLTD Tersebar S2JB 0.9
256 IDO PLTD South Sumatera Sungai Juaro 25
BBM = fuel and oil, HSD = high-speed diesel, MFO = marine fuel oil ,NTT = East Nusa Tenggara (Indonesian: Nusa Tenggara Timur – NTT), PLTD = Pembangkit Listrik Tenaga Diesel, PLTG = Pembangkit Listrik Tenaga Gas. Source: MEMR (2016a).
Merits of DES
DES is a good option to fulfil electricity demand of regions consisting of many islands like Indonesia. It has several advantages such as cost competitiveness and its role in optimising local content.
Economy of DES by industrial zone, island, and/or off grid
DES projects, such as micro hydro or solar, when installed in remote areas, will ease the logistics issue of supplying fuel to remote locations. This can result in a more competitive cost of production when compared to diesel power plants. DES installed in a grid-connected system, such as geothermal and hydro, will help reduce distribution losses.
A case study of a micro-hydro power plant in a remote area in East Java shows that the net present value (NPV) of the total production of 101,478 MWh per year, with a 7% interest rate, is 4,2 billion rupiah with payback period of 8 years and return on investment (ROI) of 2.07%.
Another study on solar PV in Nias island in North Sumatera evaluated the saving that can be obtained using solar PV when compared to diesel power plants. The size of solar panel of 200Wp (200 watt peak), with total 9,800 panel (1.27 m2 each), electricity production is 2.81 GWh/year. With the solar PV’s lifetime of 25 years, interest rate of 7.5% per year, the cost of production is 2,475 rupiah/kWh. The study shows that savings from the use of diesel power plants would be about 759 kilolitre/year.
69Distributed Energy System in Indonesia
Energy security brought by DES
• Geothermal power plantIn 2016, the total capacity of geothermal power plants was 1,698.3 MW. This included that of DES geothermal power plants, which is about 1,240.3 MW (73.03% of overall capacity) (Figure 3.2).
Source: Ministry of Energy and Mineral Resources, 2016
The use of renewable energy will reduce the dependence on fossil fuels and, hence, reduce greenhouse gas (GHG) emission. Based on Indonesia Energy Outlook 2016, if the target on renewable energy and energy intensity could be achieved, reduced emission in 2030 would be 402 million tons of CO2, thus meeting the government target. In the case of geothermal where the share of geothermal capacity less than 100 MW (categorised as DES) is dominant, the contribution from DES will also be substantial in reducing GHG emission.
The method of calculating CO2 emission reduction is referred to as the Greenhouse Gas Equivalencies, which uses the emission factor of 7.03 x 10⁻⁴ metric tons CO2/kWh (US EPA, 2016).
70 Distributed Energy System in Southeast Asia
Cost–benefit analysis between on grid and off grid
The following section compares the cost of providing electricity to remote, mountainous, and island areas (using average national grid cost) and that of off grid (system cost).
Case Study: Sumba Island
Based on Ministerial Decree No 3051 K/30/MEM/2015 on Sumba Island, an iconic ‘Island of Renewables’, the Government of Indonesia, in collaboration with local governments, non-governmental organisations, Hivos in Indonesia, and international donors such as the Asian Development Bank and the Norwegian Embassy, established a programme aimed ‘to create access to alternative renewable energy which will enable gender-balanced economic well-being to all’. The programme’s report in Least-Cost Electrification Plan for the Iconic Island states on the levelised cost of electricity (LCOE) based on a base scenario of 10–20 MW storage hydro and pumped storage scenario of 10 MW Storage Hydro is shown in Table 3.14.
Table 3.14. LCOE Comparison on the Sumba Iconic Island
Base Scenario – 20 MW Storage Hydro
Base Scenario – 10 MW Storage Hydro
Pumped Storage Scenario – 10 MW
Storage HydroDiesel Only
Solar power 10 MW Wind power 10 MW, Micro-hydro PP 4.5 MW, Hydro (storage) 20 MW, Biomass 10 MW,Diesel 49.3 MW
Solar power 10 MW,Wind power 10 MW,Micro-hydro PP 4.5 MW, Hydro (storage) 20 MW, Biomass 10 MW,Diesel 49.3 MW
Solar power 30 MW, Wind power 20 MW,Micro-hydro PP 4.5 MW,Hydro (storage) 10 MW, Pumped storage 18 MW, Biomass 10 MW, Diesel 49.3 MW
LCOE: Total generating systems on busbars, including current generatorsbut excluding network costs
LCOE = levelised cost of electricity, kWh = kilowatt-hour, MW = megawatt, PP = power plant.Source: The Government of Indonesia and ADB (2014).
Case study
Based on the characteristics of power plant locations, such as island, remote, and mountainous areas and economic zones, three provinces were selected for the case study: Sumatera Barat (West Sumatera), Jambi, and Kepulauan Riau (Riau Island). West Sumatera has some projects on solar PV, biogas, micro hydro, and geothermal with capacities in line with DES classification. The same is the case for Jambi and Riau islands. Table 3.15 details the current situation and required additional capacities to meet demand.
71Distributed Energy System in Indonesia
Table 3.15. Case Study of DES Power Plants in Some Provinces
Model case(s) of introduction of DES (off-grid energy system)
(1) Site Name West Sumatera Province
ApplicationsCurrent/existing
capacityRequired capacity to meet
off-grid/mini grid future demand (2025)
MW MW
Solar PV
Wind
Biomass/biogas 10.0
Micro hydro 66.0 300.2
Geothermal 205.0
Diesel generator 2.9
Thermal power (coal, slurry, fuel oil, others)
CHP (incl. heat recovery facility)
Other generators
(2) Site Name Jambi Province
ApplicationsCurrent/existing
capacityRequired capacity to meet
off-grid/mini grid future demand (2025)
MW MW
Solar PV
Wind
Biomass/biogas 25.0
Micro hydro 20.7
Geothermal 110.0
Diesel generator
Thermal power (coal, slurry, fuel oil, others)
CHP (incl. heat recovery facility)
Other generators (gas) 1,186.8 205.0
(3) Site Name Kepulauan Riau (Special Economic Zone)
Indonesia issued Presidential Decree No. 22 of 2017 on National Energy General Plan (RUEN), which details the country’s National Energy Policy. It presents the existing energy condition, target, and measures to achieve the targets: (i) energy consumption per capita to increase to 1.4 toe/capita in 2025 from its current level of 0.4 toe/capita; (ii) on energy mix, 23% renewable energy and reduced share of oil to less than 25% by 2025; and (iii) 2,500 kWh/capita of electricity consumption by 2025 from its current level of below 1,000 kWh/capita.
The government also issued several policies to accelerate the development of energy infrastructure, including lighting remote areas with small-scale renewable energy, which match the criteria of DES.
a. Ministerial Regulation No. 38 of 2016 on Acceleration of Electrification on Less Developed Villages, Remote and Boundary Areas and Small Island Through Small-Scale Electricity Supply
This regulation allows the private sector (non-PLN) to generate electricity and build transmission lines with less than 50 MW capacities using renewable energy. The governor proposes the business area to the minister and offers the area to non-PLN entities (local state-owned and private companies and cooperatives).The proposed area can be classified as either subsidy or non-subsidy based.
b. Ministerial Regulation No. 11 of 2017 on the Utilisation of Gas for Power PlantThis regulation allows the use of wellhead power plants to make the price more competitive. The use of wellhead gas for power plants can be a direct offer or general tender.
Biomass/biogas 4.8 1.0
Micro hydro
Geothermal
Diesel generator 406.7
Thermal power (coal, slurry, fuel oil, others) 44.0 47.0
CHP (incl. heat recovery facility)
Other generators (gas) 220.0
73Distributed Energy System in Indonesia
c. Ministerial Regulation No. 50 of 2017 on the Utilisation of Renewable Energy Sources for Electricity Supply
This regulation allows PT PLN (Persero) as buyer and the private sector as seller to negotiate the electricity price from renewable energy sources, the mechanism of buying electricity using direct elections, and the build-own-operate-transfer scheme.
Future Development of DES
Based on Government Regulation 79 of 2014 on National Energy Policy, by 2025, renewable energy shall be at least 23% (92.3 Mtoe), oil at most 25%, and gas at least 23% of national energy mix. According to the DES definition, DES is flexible for island, mountainous, and remote areas and economic zones. DES also supports the use of renewable energy resources (geothermal, solar PV, micro hydro, and biomass) to meet future energy demand.
Future installed capacity by type of energy sources
Geothermal
Table 3.16 shows the future development of geothermal.
Hydropower
In 2025, the target for large-scale hydropower is 17,986 MW while for mini/micro-hydro, around 3,000 MW. Tables 3.17 and 3.18 show the future development plan of hydropower and mini/micro hydro based on the National Energy General Plan.
Solar power
Table 3.19 shows the projection of solar power development.
Bioenergy
Table 3.20 shows the projection of bioenergy development until 2025.
74 Distributed Energy System in Southeast Asia
Tabl
e 3.1
6. Ex
istin
g Geo
ther
mal
Powe
r Plan
ts in
Indo
nesia
No.
Prov
ince
Ann
ual T
otal
Inst
alle
d Ca
paci
ty (M
W)
2015
2016
2017
2018
2019
2020
2021
2022
2023
2024
2025
1W
est J
ava
1,164
.01,1
94.0
1,194
.01,1
94.0
1,269
.01,4
49.0
1,569
.01,7
67.0
1,767
.01,9
17.0
1,972
.02
Lam
pung
110.0
165.0
220.
022
0.0
220.
022
0.0
220.
027
5.049
5.060
5.082
5.03
Nor
th S
umat
era
12.0
122.
023
2.0
342.
034
7.050
7.058
7.058
7.058
7.071
7.071
7.04
Cent
ral J
ava
60.0
60.0
70.0
70.0
80.0
140.
020
0.0
420.
064
0.0
710.
071
0.0
5Ea
st Ja
va55
.016
5.016
5.022
0.0
440.
052
0.0
6Be
ngku
lu55
.0110
.014
0.0
140.
025
5.025
5.034
0.0
505.0
7So
uth
Sum
ater
a55
.0110
.0110
.020
1.020
1.025
6.0
371.0
371.0
505.0
8W
est S
umat
era
80.0
80.0
80.0
100.
010
0.0
300.
030
0.0
9N
orth
Sul
awes
i80
.010
0.0
125.0
130.
015
0.0
150.
017
0.0
170.
017
0.0
210.
025
0.0
10A
ceh
10.0
10.0
10.0
65.0
65.0
120.
023
0.0
11Ja
mbi
55.0
60.0
115.0
115.0
145.0
145.0
200.
012
Bant
en110
.0110
.015
0.0
150.
013
NTT
12.5
12.5
12.5
12.5
42.5
77.5
82.5
92.5
102.
510
2.5
117.5
14N
orth
Mal
uku
20.0
20.0
55.0
70.0
15Ce
ntra
l Sul
awes
i60
.016
NTB
20.0
40.0
17So
uthe
ast S
ulaw
esi
20.0
18G
oron
talo
20.0
20.0
19M
aluk
u20
.020
.020
.020
.020
.020
.020
.020
Bali
10.0
21Ce
ntra
l Kal
iman
tan
Tota
l Ins
talle
d Ca
paci
ty1,4
38.5
1,653
.51,9
08.5
2,13
3.5
2,49
3.5
3,10
9.5
3,55
9.5
4,41
7.55,
067.5
6,24
2.5
7,241
.5To
tal A
dditi
onal
per
year
215.
025
5.0
225.
036
0.0
616.
045
0.0
858.
065
0.0
1175
.099
9.0
MW
= m
egaw
att,
NTB
=W
est N
usa T
engg
ara (
Indo
nesia
n: N
usa T
engg
ara B
arat
– N
TB),
NTT
= E
ast N
usa T
engg
ara (
Indo
nesia
n: N
usa T
engg
ara T
imur
– N
TT).
Sour
ce: M
EMR
(201
7).
75Distributed Energy System in Indonesia
Tabl
e 3.1
7. P
rojec
tion
of H
ydro
powe
r Dev
elopm
ent (
2015
–202
5)
No.
Prov
ince
Ann
ual T
otal
Inst
alle
d Ca
paci
ty (M
W)
2015
2016
2017
2018
2019
2020
2021
2022
2023
2024
2025
1W
est J
ava
1,99
1.9
1,9
91.9
2,
038.
9
2,0
38.9
2,14
8.9
2
,148.
9
2,14
8.9
2
,148.
9
2,14
8.9
2
,148.
9
3,11
6.6
2So
uth
Sula
wes
i52
1.6
521.6
5
21.6
52
1.6
521.6
56
9.1
803
.6
965
.6
1,
586.
6
2,0
51.6
2,4
12.6
3
Nor
th S
umat
era
922.
5
9
67.5
967
.5
9
67.5
1,
204.
0
1,21
1.5
1,
211.5
1,24
1.5
1,
916.
5
1,9
16.5
2
,269
.8
4Pa
pua
3.9
3
.9
3.9
3.
9
3.9
3.
9
3.9
3.
9
2
7.9
4
7.9
2
,208
.9
5A
ceh
2.4
2
.4
1
2.4
110.
4
12
8.4
128.
4
18
7.4
187.4
31
8.4
318
.4
1
,573.4
6
NTT
- -
- -
-
1
0.0
16.
5
1
6.5
16.
5
16.5
929
.9
7W
est S
ulaw
esi
- -
- -
- -
-
2
8.0
56.
0 20
6.0
847
.8
8Ce
ntra
l Jav
a30
6.8
306.
8
3
06.8
30
6.8
306.
8
30
6.8
306.
8
30
6.8
306.
8
6
56.8
6
67.1
9Ea
st K
alim
anta
n -
- -
- -
- -
- -
275
.0
605.0
10
East
Java
293.2
2
93.2
2
93.2
2
93.2
2
93.2
2
93.2
2
93.2
4
30.2
4
30.2
4
30.2
4
30.2
11
Cent
ral S
ulaw
esi
195.0
19
5.0
195
.0
195.0
19
5.0
265
.0
265
.0
265
.0
265
.0
345
.0
425
.0
12W
est S
umat
era
254.
2
2
54.2
2
54.2
2
54.2
2
54.2
2
54.2
2
54.2
30
6.2
306.
2
3
95.2
3
95.2
13
Jam
bi -
- -
- -
- -
175.0
35
0.0
350
.0
370
.7 14
Wes
t Pap
ua2.
0
2.0
2.
0
2.0
2.0
2.0
2.0
2.0
2
2.0
2
2.0
358
.1 15
Beng
kulu
248.
0
2
48.0
2
48.0
2
69.0
2
69.0
2
69.0
2
69.0
2
96.5
321.5
3
21.5
348
.5 16
Wes
t Kal
iman
tan
2.2
2
.2
2.2
2
.2
2
.2
2
.2
2
.2
2
.2
2
.2
2.2
243
.5 17
Nor
th K
alim
anta
n -
- -
- -
- -
- -
110
.0
220
.0
18So
uthe
ast S
ulaw
esi
1.6
1
.6
1.6
1.
6
1.6
1.
6
1.6
1.
6
14
6.6
182
.6
182
.6
19So
uth
Kalim
anta
n30
.0
30.
0 30
.0
30.
0
3
0.0
30.
0
3
0.0
30.
0
3
0.0
30
.0
9
5.0
20N
orth
Sul
awes
i51
.4
51.4
51.4
5
1.4
51.4
6
3.4
93.4
9
3.4
93.4
93.4
93.4
21
Lam
pung
- -
-
5
6.0
56.
0
5
6.0
56.
0
8
3.0
83.0
83.0
83.0
22
Riau
- -
- -
- -
- -
- -
7
6.4
23N
TB -
- -
- -
- -
-
1
2.0
18
.0
18
.0
24M
aluk
u -
- -
- -
- -
-
1
6.0
16
.0
16
.0
Tota
l Ins
talle
d Ca
paci
ty4,
826.
7
4,8
71.7
4,
928.
7
5,10
3.7
5
,468
.2
5
,615
.2
5
,945
.2
6
,583
.7
8
,455
.7
10,0
36.7
17,9
86.7
To
tal A
dditi
onal
per
year
-
4
5.0
57.0
17
5.0
364.
5
14
7.0
330.
0
6
38.5
1,87
2.0
1
,581
.0
7,950
.0
- = m
issin
g dat
a , M
W =
meg
awat
t, N
TB =
Wes
t Nus
a Ten
ggar
a (In
done
sian:
Nus
a Ten
ggar
a Bar
at –
NTB
), N
TT =
Eas
t Nus
a Ten
ggar
a (In
done
sian:
Nus
a Ten
ggar
a Tim
ur –
NTT
).So
urce
: MEM
R (2
017)
.
76 Distributed Energy System in Southeast Asia
Tabl
e 3.1
8. P
rojec
tion
of M
ini/
Micr
o Hyd
ro D
evelo
pmen
t (20
15–2
025)
No.
Prov
ince
Ann
ual T
otal
Inst
alle
d Ca
paci
ty (M
W)
2015
2016
2017
2018
2019
2020
2021
2022
2023
2024
2025
1N
orth
Sum
ater
a23
.9
40.8
4
8.9
93.9
15
0.8
160.
8 1
70.8
2
36.3
236
.3 2
89.8
3
52.0
2Ce
ntra
l Kal
iman
tan
0.5
0.5
0.5
28.
9 2
8.9
59.
5 9
3.3
122
.3 1
64.8
1
99.5
243
.9
3W
est J
ava
18.
3 23
.3 4
8.3
91.3
113
.8
132.1
1
67.6
1
78.1
195
.3 2
19.7
237
.4
4Ea
st K
alim
anta
n 0
.7 0.
8
0.8
13.4
1
3.4
32.7
7
1.5
97.8
14
4.9
173
.9
173
.9
5N
TT 4
.1
5.2
5.6
2
3.6
25
.2
46
.7
66.4
85.7
111.
0 1
34.9
1
63.5
6W
est S
umat
era
18.8
2
0.1
37.8
3
7.8
77.8
9
1.2
91.2
11
1.8
117.8
1
42.5
142
.5
7A
ceh
1.1
1
.1
1.1
9.3
11.
5 2
1.8
44.
6 8
1.7
88
.5 1
07.7
132.
4
8Pa
pua
3.5
3
.7
8.4
13.6
2
7.4
28.
5
4
6.5
61.4
8
4.0
101
.5
1
24.5
9So
uth
Sula
wes
i39
.1
3
9.4
48.6
6
8.9
97.3
10
7.3
107.3
10
9.0
109.
0
1
22.3
122
.3
10Ce
ntra
l Jav
a4.
7
8.3
9.2
9
.2
16.
2
2
5.3
25.3
3
9.0
47.8
91
.9
119
.0
11W
est S
ulaw
esi
5.0
5
.1
5.1
1
3.3
13.3
2
7.3
43.2
5
6.7
76.
6
92
.6
113
.4
12Be
ngku
lu 0
.7 0.
7 0
.7 0
.7
0.7
0.
7
7.4
13
.4
29
.4
34
.4
9
5.4
13Ce
ntra
l Sul
awes
i42
.3
4
2.3
43.5
43.5
7
4.6
74.
6
7
4.6
76.
0
7
6.0
90.0
90
.0
14So
uthe
ast S
ulaw
esi
2.9
2
.9
7.7
7.7
12.7
1
4.0
29.
4
4
0.1
58.
8
70
.7
88
.0
15Ja
mbi
0.3
0.3
0.
3
4.4
4
.4
11.4
27.4
3
7.9
57
.3
68.7
86
.0
16M
aluk
u
-
-
-
3
.3 3
7.1
42
.1 4
2.1
42.1
50.7
6
0.7
76.
2
17N
TB 13
.2
13.3
13.3
14.6
3
2.0
32.
0 3
2.0
32.
3
49.
0
58.7
73
.6
18N
orth
Mal
uku
-
-
-
3.
2
3.2
8
.7
2
2.5
31.2
4
7.8
57
.2
7
1.8
19Ea
st Ja
va 1
.7 1
.7 1
.7
1.7
1
.7
4.5
4
.5
8.9
37.1
49.
2 6
3.0
77Distributed Energy System in Indonesia
20G
oron
talo
4.0
4
.1 4
.1 4
.1
6.1
6
.1 1
6.4
24
.1
40.6
48.2
61.7
21Ba
nten
0.1
4.3
15.3
15.3
16.
8 2
1.8
34
.8
4
3.3
43
.3
58.3
58
.3
22La
mpu
ng 0
.6
0.6
0
.6
0.6
0.6
0.6
10
.1
31.8
35.1
41
.2
54
.4
23So
uth
Sum
ater
a1.3
1.3
1.3
2
.7
2.7
2
.7
2
0.2
30.
2
3
0.2
36.2
52
.4
24W
est K
alim
anta
n0.
9
0.9
1.0
2.3
17.5
1
7.5
17.5
1
7.5
29.
7 34
.7 46
.2
25Ri
au
0.2
0.
2
0.2
0.2
0.2
0.2
0.2
2.4
20.
5
22.
9
33.8
26N
orth
Kal
iman
tan
-
0.1
0.1
0
.1
0.1
0
.1
0.1
0
.1
1
4.4
14
.4
28.4
27N
orth
Sul
awes
i8.
2
8.2
8.
2
8.7
16.
4
1
6.4
19.
7
1
9.7
19.
7
26.
1
26.
1
28So
uth
Kalim
anta
n0.
1
0.1
0.1
0
.1
0.1
0
.1
0.1
0
.1
1
5.1
16
.3 25
.8
29Ba
li
-
-
-
1.4
1.4
1.4
1
.4
7
.3
7.3
23
.5 2
3.5
30W
est P
apua
1.0
1
.0
1.0
2
.0
11.0
1
1.0
11.
0
11.0
11.
1
11.5
19
.8
31Yo
gyak
arta
0.2
0
.2
0.2
0
.2
0.
2
0.8
0.8
0.8
0.8
0.8
0.8
Tota
l Ins
talle
d Ca
paci
ty19
7.4
230
.5
313.
6 52
0.0
815
.1 99
9.9
1,
299.
9
1,65
0.0
2
,049
.9
2,50
0.0
3,00
0.0
Tota
l Add
ition
al p
er ye
ar -
33.
1 83
.2
206
.3
295
.1
18
4.9
300.
0 35
0.0
400.
0 45
0.0
500.
0
- = M
issin
g dat
a, M
W =
meg
awat
t, N
TB =
Wes
t Nus
a Ten
ggar
a (In
done
sian:
Nus
a Ten
ggar
a Bar
at –
NTB
), N
TT =
Eas
t Nus
a Ten
ggar
a (In
done
sian:
Nus
a Ten
ggar
a Tim
ur –
NTT
).So
urce
: MEM
R (2
017)
.
78 Distributed Energy System in Southeast Asia
Tabl
e 3.1
9. P
rojec
tion
of So
lar P
ower
Dev
elopm
ent (
2015
–202
5)
No.
Prov
ince
Ann
ual T
otal
Inst
alle
d Ca
paci
ty (M
W)
2015
2016
2017
2018
2019
2020
2021
2022
2023
2024
2025
1N
TT4.
214
.215
.015
.020
.340
.596
.815
9.6
238.
032
0.7
414.
9
2W
est K
alim
anta
n1.3
1.31.6
15.1
24.3
43.8
88.3
140.
920
9.2
282.
436
6.4
3G
oron
talo
0.7
4.7
9.7
9.7
19.7
19.7
35.7
65.4
128.
821
8.6
343.3
4So
uth
Sum
ater
a1.1
1.11.1
12.8
20.0
35.8
71.7
114.1
169.
322
8.5
296.
6
5N
TB4.
74.
925
.290
.290
.290
.290
.2112
.316
7.222
5.4
292.
0
6W
est S
ulaw
esi
0.5
0.5
0.5
2.4
9.8
23.3
60.5
100.
715
0.4
202.
626
1.8
7Ja
mbi
1.01.0
3.07.1
13.6
27.1
60.7
98.6
146.
719
7.925
6.3
8Ea
st K
alim
anta
n1.6
1.92.
08.
415
.327
.756
.189
.313
2.5
178.
923
2.1
9N
orth
Sum
ater
a16
.017
.757
.757
.757
.757
.757
.786
.212
8.0
176.
222
4.1
10Ce
ntra
l Sul
awes
i1.4
1.411.
411.
431
.431
.452
.786
.212
8.4
173.1
224.
1
11Ce
ntra
l Kal
iman
tan
0.8
1.11.1
6.7
13.4
23.7
52.5
85.0
126.
517
0.6
221.1
12Pa
pua
7.88.
219
.419
.439
.439
.450
.784
.212
5.716
9.3
218.
8
13So
uthe
ast S
ulaw
esi
1.92.
49.
69.
610
.521
.649
.781
.912
2.116
4.6
212.
9
14A
ceh
0.8
0.8
2.8
6.2
12.7
22.5
50.2
81.3
121.0
163.2
211.4
15N
orth
Mal
uku
4.5
4.6
9.6
9.6
9.7
18.9
47.3
78.3
116.8
157.3
203.5
16Ce
ntra
l Jav
a0.
40.
40.
46.
712
.322
.144
.671
.710
6.6
143.8
186.
4
17Ea
st Ja
va0.
50.
63.4
7.713
.223
.144
.971
.710
6.4
143.6
186.
4
18So
uth
Sula
wes
i3.9
7.08.
18.
111.
521
.243
.870
.810
5.214
2.0
184.
0
19M
aluk
u5.0
5.310
.315
.315
.317
.641
.969
.610
3.813
9.9
180.
8
20W
est P
apua
1.84.
14.
15.0
15.0
19.0
39.8
64.6
96.1
129.
516
7.8
21W
est J
ava
0.3
0.3
0.4
6.8
11.5
20.2
39.3
62.7
93.1
125.6
163.0
22So
uth
Kalim
anta
n1.9
3.93.9
4.8
9.7
18.1
38.0
61.5
91.5
123.5
160.
0
23Be
ngku
lu0.
60.
70.
73.1
8.2
16.5
37.3
61.2
91.3
123.0
159.
2
79Distributed Energy System in Indonesia
24W
est S
umat
era
1.72.
02.
94.
69.
317
.235
.958
.186
.4116
.615
1.0
25La
mpu
ng1.3
1.61.6
2.16.
513
.531
.351
.677
.010
3.813
4.3
26Ri
au Is
land
s1.1
1.11.1
5.89.
516
.531
.550
.274
.410
0.5
130.
4
27N
orth
Sul
awes
i3.8
3.83.8
3.85.6
11.5
26.5
43.7
65.1
87.8
113.6
28Ba
ngka
Bel
itung
1.61.6
3.63.6
5.911.
725
.942
.463
.285
.2110
.3
29Ba
li4.
47.5
8.2
8.2
8.2
108.
210
8.2
108.
210
8.2
108.
210
8.2
30N
orth
Kal
iman
tan
0.4
0.6
0.6
3.66.
612
.024
.339
.158
.178
.510
1.7
31Ba
nten
0.2
0.2
0.3
2.15.1
10.0
22.2
36.3
54.0
72.9
94.3
32Ri
au0.
91.0
1.01.0
4.1
9.0
21.8
36.2
54.1
72.8
94.2
33D
I Yog
yaka
rta0.
10.
10.
11.1
3.78.
018
.931
.346
.863
.081
.5
34Ja
karta
0.2
0.2
0.3
0.3
0.7
1.43.2
5.37.9
10.7
13.8
Tota
l Ins
talle
d Ca
paci
ty78
.410
7.822
4.5
375
550
900
1600
2500
3700
5000
6500
Tota
l Add
ition
al p
er ye
ar-
29.3
116.
615
0.5
175.
035
0.0
700.
090
0.0
1200
.013
00.0
1500
.0
- = m
issin
g dat
a, D
I = S
pecia
l Reg
ion
of Y
ogya
karta
, MW
= m
egaw
att,
NTB
=W
est N
usa T
engg
ara (
Indo
nesia
n: N
usa T
engg
ara B
arat
– N
TB),
NTT
= E
ast N
usa T
engg
ara (
Indo
nesia
n: N
usa
Teng
gara
Tim
ur –
NTT
) .So
urce
: MEM
R (2
017)
.
80 Distributed Energy System in Southeast Asia
Tabl
e 3.2
0. P
rojec
tion
of B
ioen
ergy
Dev
elopm
ent (
2015
–202
5)
No.
Prov
ince
Ann
ual T
otal
Inst
alle
d Ca
paci
ty (M
W)
2015
2016
2017
2018
2019
2020
2021
2022
2023
2024
2025
1Ri
au17
9.4
183.4
193.4
195.
419
5.4
195.
419
5.4
220.
726
0.9
306.
835
9.0
2N
TT38
.839
.843
.881
.0110
.513
6.9
161.4
190.
222
4.0
263.3
308.
1
3Ea
st Ja
va14
5.4
145.
414
5.4
145.
414
5.4
145.
414
5.4
172.
520
4.7
240.
928
1.9
4N
orth
Sum
ater
a12
6.0
174.
517
4.5
176.
517
6.5
176.
517
6.5
176.
519
2.2
226.
126
4.5
5Ja
mbi
88.4
104.
410
4.4
104.
410
4.4
108.
913
2.2
157.1
185.5
218.
125
5.2
6W
est S
ulaw
esi
30.0
30.0
31.0
41.2
75.3
100.
712
0.3
142.
316
7.919
7.323
0.9
7Ce
ntra
l Jav
a98
.598
.598
.598
.598
.598
.5111
.313
4.5
159.
618
7.821
9.8
8So
uth
Sum
ater
a94
.698
.610
1.110
1.110
1.110
1.1110
.013
2.715
7.418
5.221
6.7
9W
est J
ava
109.
312
1.812
1.812
1.812
1.812
1.812
1.813
1.715
7.018
4.9
216.
4
10Ce
ntra
l Kal
iman
tan
71.7
72.7
72.7
82.7
82.7
84.2
105.0
125.8
148.
917
5.120
4.9
11La
mpu
ng70
.670
.670
.670
.670
.679
.510
0.2
120.
414
2.6
167.7
196.
3
12W
est K
alim
anta
n63
.963
.985
.910
5.910
5.910
5.910
5.9117
.613
9.2
163.8
191.7
13A
ceh
58.2
71.2
81.0
82.5
82.5
82.5
92.2
110.9
131.3
154.
418
0.8
14W
est P
apua
10.2
10.2
10.2
10.8
49.8
75.5
92.0
109.
512
9.3
152.
017
7.9
15N
TB31
.131
.132
.132
.146
.574
.691
.610
9.3
129.
215
1.917
7.8
16So
uth
Kalim
anta
n60
.466
.866
.866
.866
.866
.881
.999
.6118
.413
9.4
163.1
17So
uthe
ast S
ulaw
esi
20.8
20.8
20.8
20.8
38.0
65.5
81.1
97.0
114.7
134.
915
7.9
18Ce
ntra
l Sul
awes
i26
.526
.526
.526
.533
.663
.178
.994
.6112
.013
1.815
4.2
19N
orth
Mal
uku
16.2
16.2
16.2
16.2
35.7
62.6
77.8
93.0
110.1
129.
415
1.5
20Be
ngku
lu36
.842
.842
.842
.842
.858
.274
.890
.410
7.312
6.2
147.7
21So
uth
Sula
wes
i47
.347
.357
.357
.357
.357
.372
.588
.510
5.212
3.814
4.9
22M
aluk
u15
.215
.221
.221
.230
.558
.172
.887
.410
3.512
1.714
2.4
23G
oron
talo
17.8
23.8
23.8
29.8
29.8
53.6
68.3
82.3
97.6
114.8
134.
3
81Distributed Energy System in Indonesia
24W
est S
umat
era
46.1
46.1
47.1
47.1
47.1
47.6
66.2
81.6
97.4
114.7
134.
2
25Ea
st K
alim
anta
n45
.246
.258
.367
.867
.867
.867
.867
.867
.876
.789
.8
26N
orth
Sul
awes
i14
.514
.514
.514
.514
.528
.943
.254
.264
.976
.589
.6
27Ba
nten
24.8
24.8
24.8
24.8
24.8
24.8
41.2
53.2
64.1
75.7
88.6
28Pa
pua
21.2
21.2
21.2
31.2
31.2
31.2
41.8
52.4
62.8
74.1
86.7
29Ba
ngka
Bel
itung
15.9
25.7
25.7
65.7
65.7
65.7
65.7
65.7
65.7
70.7
82.7
30D
I Yog
yaka
rta15
.415
.415
.415
.415
.420
.235
.746
.356
.066
.177
.3
31N
orth
Kal
iman
tan
--
--
-9.
029
.842
.151
.861
.471
.8
32Ba
li11.
712
.112
.112
.112
.112
.119
.229
.737
.344
.351
.8
33Ri
au Is
land
s13
.014
.014
.014
.014
.014
.014
.016
.222
.126
.631
.1
34D
KI Ja
karta
6.2
6.2
6.2
6.2
6.2
6.2
6.2
6.2
11.8
15.8
18.4
Tota
l Ins
talle
d Ca
paci
ty16
7118
01.7
1881
2030
2200
2500
2900
3400
4000
4700
5500
Tota
l Add
ition
al p
er ye
ar-
130.
679
.414
9.0
170.
030
0.0
400.
050
0.0
600.
070
0.0
800.
0
* Adm
inist
rativ
ely,
DKI
Jaka
rta is
divi
ded
into
four
city
adm
inist
ratio
ns (C
ity A
dmin
istra
tion
of S
outh
Jaka
rta, E
ast J
akar
ta, C
entra
l Jak
arta
, Wes
t Jak
arta
, and
Nor
th Ja
karta
) and
one
Ad
min
istra
tive R
egen
cy (T
hous
and
Islan
ds o
r Kep
ulau
an S
erib
u).
- = m
issin
g dat
a , D
I = S
pecia
l Reg
ion
of Y
ogya
karta
, MW
= m
egaw
att,
NTB
= W
est N
usa T
engg
ara (
Indo
nesia
n: N
usa T
engg
ara B
arat
– N
TB),
NTT
= E
ast N
usa T
engg
ara (
Indo
nesia
n: N
usa
Teng
gara
Tim
ur –
NTT
).So
urce
: MEM
R (2
017)
.
Chapter 4Distributed Energy System in Malaysia
Introduction
Off-grid power generation is meant to supply remote or rural areas, where grid connection is almost impossible in terms of cost and geography, such as island, aboriginal villages, and areas where nature preservation is a concern. Harnessing abundant renewable energy sources using versatile hybrid power systems can offer the best, least-cost alternative solution for extending modern energy services to remote and isolated communities.
The Tenth Malaysia Plan (2011–2015) prioritised rural development to enhance inclusivity as the nation progressed towards becoming an advanced inclusive nation. Rural development focused on uplifting the well-being of the rural community and stimulating economic activities based on land and natural resources. It also emphasised providing rural basic infrastructure, which resulted in the increase of rural water and electricity supply as well as nationwide road coverage. The coverage of rural roads expanded by 11.7% from 45,905 kilometres (km) in 2009 to 51,262 km in 2014. In Sarawak, 250 km of ex-logging roads were upgraded to provide access to 31,512 people in underserved rural areas. In terms of utilities, coverage of rural electricity reached 97.6% and water supply 93.8%; 188,270 water tanks were also provided to supply clean water to 251,200 rural households in the remote areas of Sabah and Sarawak.
Under the Eleventh Malaysia Plan (2016–2020), the Rural Electricity Supply Programme will continue to focus on off-grid generation for remote and isolated areas. The government will also establish partnerships with non-governmental organisations to develop renewable energy sources for the rural community. Micro and pico grids will support the alternative system of solar hybrid and mini hydro to increase coverage. The local community will be trained and encouraged to collaborate in maintaining these facilities to ensure sustainability of the rural alternative electrification system. According
83Distributed Energy System in Malaysia
to the plan, 99% of rural households will have access to electricity, reaching an additional 36,800 houses.
Current Situation of Distributed Energy System
Current installed capacity by type of energy source
Malaysia’s total installed capacity as of end 2015 was 30,439 MW, an increase of 1.5% from 29,974 MW in 2014 (Table 4.1).
In Malaysia, the Electricity Supply Act 1990 (and amendment in year 2001) regulates DES. The act requires any activity related to the supply of electricity to be licensed. In accordance with the Electricity Regulations 1994 (and amendment 2003), two types of licences may be granted: public and private. The Energy Commission (ST) issues licences for the operation of such facilities in Peninsular Malaysia and Sabah. A public licence allows the licensee to operate a public installation to supply energy to others, whereas a private licence is granted to operate a private installation to generate electricity for its own use or at its own property. In terms of renewable energy, the public licensee can sell electricity generated from energy sources to utilities. The private licensee can generate electricity for its own use using efficient technologies such as cogeneration or power generation.
Based on the National Energy Balance report for 2015, the data on DES for Malaysia is as follows (Table 4.2)
Model Case 1: Felda Palm Industries Sdn. Bhd. (Table 4.3)
1.Felda Palm Industries Sdn. Bhd. (FPISB) was incorporated in Malaysia on 14 September 1995 under Companies Act 1965 as a private limited company. Formally known as Felda Mills Corporation, it was established on 1 July 1975 under Section 42 of the Land Development Ordinance 1956 as an agency of Federal Land Development Authority (FELDA). 2.The FPISB has a paid-up capital of RM202 million (US$1.00 = RM3.9)and the shareholders comprise Felda Holding Berhad (72%) and Koperasi Permodalan Felda (28%). The company’s core activities are purchasing and processing of fresh fruit bunch from the Felda estates, settlers, and external suppliers to produce crude palm oil and palm kernel.
84 Distributed Energy System in Southeast Asia
FiT
= fe
ed-in
tariff
, IPP
= in
depe
nden
t pow
er p
rodu
cer, M
FO =
, SEB
= , S
ESB
=, T
NB
= . T
enag
a Nas
iona
l Ber
had.
Sour
ce: N
atio
nal E
nerg
y Bala
nce (
NEB
) 201
5 .
Tabl
e 4.1
. Ins
talle
d Ca
pacit
y as o
f 31 D
ecem
ber 2
015 i
n M
W
Hyd
roN
atur
al G
asCo
alD
iese
l / M
FOBi
omas
sSo
lar
Biog
asO
ther
sTo
tal
Peninsular Malaysia
TNB
2,149
.14,
150.
00.
00.
00.
00.
00.
00.
06,
299.
1
IPPs
0.0
6,34
4.5
8,06
6.0
0.0
0.0
0.0
0.0
0.0
14,4
10.5
Coge
nera
tion
0.0
876.
10.
00.
090
.70.
069
.50.
01,0
36.2
Self-
gene
ratio
n 2.1
0.0
0.0
399.
035
1.81.0
4.9
0.0
758.
8
FiT
23.6
0.0
0.0
0.0
44.4
206.
730
.40.
030
5.1
Subt
otal
2,17
4.8
11,3
70.6
8,06
6.0
399.
048
6.9
207.7
104.
70.
022
,809
.8
Sabah
SESB
76.0
112.0
0.0
180.
90.
00.
00.
00.
036
8.9
IPPs
0.0
1,012
.60.
018
9.9
0.0
0.0
0.0
0.0
1,202
.5
Coge
nera
tion
0.0
106.
80.
00.
012
2.70.
00.
00.
022
9.5
Self-
gene
ratio
n 0.
00.
00.
052
6.8
135.8
0.1
3.40.
066
6.1
FiT
6.5
0.0
0.0
0.0
43.0
18.1
2.70.
070
.3
Subt
otal
82.5
1,231
.40.
089
7.630
1.518
.36.
10.
02,
537.3
Sarawak
SEB
1,058
.861
4.6
480.
015
8.3
0.0
0.0
0.0
0.0
2,31
1.7
IPPs
2,40
0.0
0.0
0.0
0.0
0.0
0.0
0.0
0.0
2,40
0.0
Coge
nera
tion
0.0
289.
00.
00.
00.
00.
00.
00.
028
9.0
Self-
gene
ratio
n 0.
00.
00.
011.
674
.10.
30.
55.1
91.5
Subt
otal
3,45
8.8
903.
648
0.0
169.
974
.10.
30.
55.
15,
092.
2
Tota
l5,
716.
113
,505
.68,
546.
01,4
66.5
862.
522
6.3
111.3
5.1
30,4
39.3
Shar
e (%
)18
.844
.428
.14.
82.
80.
70.
40.
010
0.0
85Distributed Energy System in Malaysia
Source: National Energy Balance (NEB) 2015.
Table 4.2. Electricity Generation and Installed Capacity of Renewable Energy by Private Licensee by Region in 2015
Natural gas 93.00 411.94Diesel 9.56 6.35Palm oil waste 19.90 34.66Wood/sawmill dust 23.90 52.56Others 5.05 6.91Subtotal 151.41 512.42Grand total 1,297.95 1,500.44
3.The FPISB is the largest crude palm oil producer with a yield of 2.51 million tons per year, which is 17% of Malaysia’s total production. Currently, the FPISB operates 69 palm oil mills throughout the country. Total milling capacity currently stands at 3,364 tons of fresh fruit bunch per hour or 17 million tons per year. The FPISB has a total workforce of 5,800 comprising of professionals and semi-skilled workers.
86 Distributed Energy System in Southeast Asia
Location Umas Palm Oil Mill, Tawau, Sabah
Design Biogas Output 1,200 m3/hour
Gas Engine Capacity 1.2 MW
Point of Electricity Injection Existing Felda Distribution Facility
Electricity Supply Areas
Umas Complex (3,000 houses, offices, and commercial premises)
Settler family (2,500 houses)
Staff Quarters (500 houses)
Table 4.3. Background of Umas Palm Oil Mill in Tawau, Sabah
Source: Felda Palm Industries Sdn. Bhd., 2015.
Model Case 2: Sabah Forest Industries Sdn. Bhd. (Table 4.4)
1. Sabah Forest Industries (SFI) is one of Malaysia’s largest timber growers and wood processors. It manages a forest estate totalling 288,000 hectares, pulp and paper manufacturing facilities, and an integrated timber complex consisting of a saw mill and a veneer and plywood factory. 2. The SFI is Malaysia’s only integrated pulp and paper manufacturer. Recent modifications to its pulp mill have doubled its capacity to 240,000 bone dry tons of pulp per year. Half of this is manufactured into writing and printing paper for domestic and international markets and the other half is exported as market pulp. 3. The majority owner of SFI is Ballarpur Industries Limited, which in turn is part of the Avantha Group of companies.
Licensee and Locationof Installation Energy Source Licensed
Capacity (MW)Generated
Electricity (GWh)
Sabah Forest Industries Sdn Bhd MukimKg. Sebubuh Daerah Sipitang Wood waste 79.5 52.6
Table 4.4. Background of Sabah Forest Industries Sdn. Bhd. in Sipitang, Sabah
GWh = gigawatt-hour, MW = megawatt.Source: Performance and Statistical Information on Electricity Supply Industry in Malaysia 2015.
87Distributed Energy System in Malaysia
Model Case 3: BASF Petronas Chemical Sdn Bhd (Table 4.5)
1. BASF PETRONAS Chemicals celebrated its 20th anniversary in 2017. The company has grown in leaps and bounds since its inception in August 1997. 2. It is a smart joint venture partnership between BASF of Germany, one of the world’s largest chemical companies, and PETRONAS, Malaysia’s fully integrated oil and gas multinational, under its subsidiary PETRONAS Chemicals Group. 3. With an initial investment of RM3.4 billion (US$1.00 = RM3.90), this partnership brought together a vast amount of experience, innovation, cutting- edge technology, and an abundance of strategically located high-quality resources. The second wave of investments include the RM1.5 billion (about US$500 million) Integrated Aroma Ingredients Complex and production facilities for highly reactive polyisobutylene (HR-PIB), which are expected to come on-stream in 2017 whereas the 2-ethylhexanoic acid plant started up successfully in late 2016. 4. Today, operating from one of the largest Verbund (Integrated) chemical sites in Asia- Pacific, BASF PETRONAS Chemicals has become a leading chemical company, producing and marketing chemical products, which are ever-present and highly essential in consumers' daily lives.
Licensee and Locationof Installation Energy Source Licensed
Capacity (MW)Generated
Electricity (GWh)
BASF PETRONAS Chemicals Sdn Bhd Lot 139, Kawasan Perindustrian Gebeng 26080Kuantan Pahang
Natural Gas 27.4 29.31
Table 4.5. Background of BASF Petronas Chemicals Sdn. Bhd. In Kuantan, Pahang
GWh = gigawatt-hour, MW = megawatt.Source: Performance and Statistical Information on Electricity Supply Industry in Malaysia 2015.
Model Case 4: Gas District Cooling (Putrajaya) (GDCP) Sdn Bhd (Table 4.6)
1. GDCP Sdn Bhd was incorporated in 1997. 2. Its principal activities are generation and sale of chilled water for air- conditioning of buildings in Putrajaya. 3. It is 100% owned by Putrajaya Holdings Sdn Bhd. 4. GDCP business operation is governed by a 22-year concession agreement with the government. 5. Currently, the GDCP operates six district cooling plants in Putrajaya, serving mainly government buildings and facilities.
88 Distributed Energy System in Southeast Asia
6. Every customer enters a sale and purchase agreement before chilled water is supplied to their respective development project.
Licensee and Locationof Installation Energy Source Licensed
Capacity (MW)Generated
Electricity (GWh)
Gas District Cooling (Putrajaya) Sdn Bhd Plot 2U1 Putrajaya Precinct 2 Wilayah Persekutuan Putrajaya
Natural Gas 10.74 23.51
Table 4.6. Background of Gas District Cooling (Putrajaya) Sdn. Bhd. In Putrajaya
GWh = gigawatt-hour, MW = megawatt.Source: Energy Commission of Malaysia (2015).
Overview of the Feed-in Tariff System in Malaysia
Malaysia's feed-in tariff (FiT) system obliges distribution licensees to buy from feed-in approval holders the electricity produced from renewable resources (renewable energy) and using the FiT rate, as set by the Ministry, through the Sustainable Energy Development Authority (SEDA). The distribution licensees will pay for renewable energy supplied to the electricity grid for a specific duration (Table 4.7).
By guaranteeing access to the grid and setting a favourable price per unit of renewable energy, the FiT mechanism would ensure that renewable energy becomes a viable and sound long-term investment for companies and individuals.
Key terminologies in FiT: 1. Distribution licensees: Companies holding the licence to distribute electricity (e.g. Tenaga Nasional Berhad, Sabah Electricity Sdn. Bhd., NUR Generation). 2. Feed-in approval holder: An individual or company who holds a feed-in approval certificate issued by the Sustainable Energy Development Authority Malaysia. The holder is eligible to sell renewable energy at the FiT rate. 3. FiT rate: Fixed premium rate payable for each unit of renewable energy sold to distribution licensees. The FiT rate differs for different renewable resources and installed capacities. Bonus FiT rate applies when the criteria for bonus conditions are met. 4. Indigenous: Renewable resources must be from Malaysia and are not imported. 5. Duration: Period during which the renewable electricity could be sold to distribution licensees and paid with the FiT rate. The duration is based on the characteristics of the renewable resources and technologies. The duration is 16 years for biomass and biogas resources, and 21 years for small hydropower and solar photovoltaic (PV) technologies.
89Distributed Energy System in Malaysia
Renewable Energy CapacityFeed-in-Tariff
$ cent/kWh
Solar PV
<=4 kW 26.11
4 kW< x <=24 kW 25.48
24 kW < x <= 72 kW 21.78
Biomass
<=10 MW 8.79
10 MW < x <=20 MW 8.22
20 MW < x <= 30 MW 7.66
Biogas
1 MW < x <=4 MW 9.07
4 MW < x <=10 MW 8.50
10 MW < x <= 30 MW 7.94
Hydro<=10 MW 6.84
10 MW < x <=30 MW 6.55
Table 4.7. Financial Support for Renewable Power Generation
kWh = kilowatt-hour, PV = photovoltaic.Source: Sustainable Energy Development Authority (SEDA) Malaysia, 2017.
Emission Factor in Malaysia
The increase of electricity demand in Malaysia will be a major challenge for the country. This includes the sustainable, reliable, and environment-friendly future electricity supply to meet the international and national growing demand on combating climate change issues and green technology evolution.
The total carbon dioxide (CO2) emissions per MWh indicate the CO2 emissions from fossil fuels consumed for electricity generation. Thus, the emission per MWh varies a lot across countries and from year to year, depending on generation mix.
Malaysia used the latest and updated version of methodology tool to calculate the emission factor for operation margin and build margin in 2015 (Table 4.8). The result showed that the decreases in the emission factors for Peninsular Malaysia and Sarawak slightly increased for Sabah. This decrease can be due to many reasons, namely, the shutdown of a certain number of fossil fuel-fired power plants, increase in the capacity generation of hydro power and efficiency of technologies installed in the stations as well as the process of electricity transmission and distribution. The development of more fossil-fuel power units increased the emission factor.
90 Distributed Energy System in Southeast Asia
Region2012 2013 2014 2015 Change in % from
2012 to 2015t CO2/MWh
Peninsular Malaysia 0.741 0.742 0.694 0.680 -8,97
Sabah 0.546 0.533 0.536 0.546 No change
Sarawak 0.872 0.724 0.699 0.597 -46.0
Table 4.8. Grid Electricity Emission Factor 2015
MWh = megawatt-hour, tCO2 = tonnes of CO2.
Source: Malaysian Green Technology Corporation (MGTC), 2017.
Based on the emission factor of each region, the potential CO2 avoidance from DES could be calculated. In 2015, this was about 174.52 ktCO2 equivalent. From the total, 51.9% or 90.54 ktCO2 equivalent was from Peninsular Malaysia, 32.2% from Sarawak, and 15.9%, from Sabah (Table 4.9).
GWh = gigawatt-hour, MWh = megawatt-hour, tCO2 = tonnes of CO2 .Source: Author’s Calculation.
Governments typically use cost–benefit analysis to evaluate the desirability of a given intervention. This tool analyses the cost effectiveness of different alternatives to see whether the benefits outweigh the costs. The aim is to gauge the efficiency of the intervention relative to the status quo. The costs and benefits of an intervention are evaluated in terms of the public's willingness to pay for the impacts (benefits) or willingness to pay to avoid them (costs) (Table 4.10).
The estimated costs for off-grid for DES for each case were calculated based on their respective cost elements, such as capital, fuel, variable, and fixed costs (Table 4.11). For case 1, which uses biogas as the main fuel, the estimated cost for off-grid is approximately US$2,878,974. For case 2, which uses biomass as the main fuel with a capacity of 79.5 MW, the estimated off-grid cost is US$177,478,766. As for case 3, which uses natural gas as the main fuel, the estimated off-grid cost is US$20,634,898. For case 4, which uses natural gas as the main fuel at 10.74 MW capacity, the estimated off-grid cost is US$8,398,428.
Assumptions 1. About 5% of transmission line cost was already captured under capital cost. 2. The estimated average transmission line cost is US$180,000 per kilometre. 3. Ten kilometres are required to supply electricity to the national grid from the power plant.
Total Cost (US$) 2,878,974 177,478,766 20,634,898 8,398,428
With the same parameter data for each case, the estimated total cost was calculated for the on-grid condition (Table 4.12). This is just an analysis to see the difference between off grid and on grid of the total cost for DES. For case 1, the cost for on-grid is about US$4,678,974, 62.5% higher than the estimated cost for off-grid. For case 2, the total cost for on-grid is about US$179,278,766, only 1.0 % more than off-grid. For case 3, the cost for on-grid is about US$22,434,898, 8.7 % higher than the off-grid condition. Finally, for case 4, the total cost for on-grid is about US$10,198,428, about 21.4% higher than for off-grid.
Total cost (US$) 4,678,974 179,278,766 22,434,898 10,198,428
93Distributed Energy System in Malaysia
Current PolicyNo specific policy on DES exists in Malaysia. However, some programmes created by the government support the rural electrification activities. The Rural Electricity Supply Programme includes a grid connection method, alternative methods such as hybrid solar and hydro micro, and installation of streetlights in villages to ensure the sufficiency, guarantee, and reliability of electricity supply to the people especially in rural areas.
The Akaun Amanah Industri Bekalan Elektrik (AAIBE) or Malaysian Electricity Supply Industries Trust Account (MESITA) was formed under Section 9 (3) of the Financial Procedure Act 1957, by means of a trust deed on 1 January 1997. It was officially launched in July 1997. The contributors to the fund are the power-generating companies, i.e. Tenaga Nasional Berhad Generation Sdn. Bhd. and independent power producers (IPPs) in Peninsular Malaysia comprising Genting Sanyen Power Sdn Bhd, Port Dickson Power Bhd, Powertek Bhd, Segari Energy Venture Sdn, and YTL Power Generation Sdn Bhd. Their contribution is voluntary, and they contribute 1% of their electricity sales (of their total annual audited turnover) to the Peninsular Grid or the transmission network to the fund.
Future Development of DES
Future installed capacity by type of energy sources
MFO = Medium Fuel Oil.Source: Results generated from LEAP Software, 2018.
Table 4.13. Future Installed Capacity by Energy Sources in MW
2020 2030 2040 2050
Hydro 5,967 8,510 8,543 8,543
Natural Gas 14,439 24,837 37,667 51,467
Coal 13,067 18,511 29,311 43,311
Diesel / MFO 1,309 1,137 1,197 1,197
Biomass 867 888 916 916
Solar 1,349 2,619 2,679 2,679
Biogas 189 194 194 194
Others 39 39 39 39
Total 37,226 56,735 80,546 108,346
94 Distributed Energy System in Southeast Asia
The estimated future installed capacity by type of energy source was calculated based on information from the latest power development plan for the country (Table 4.13).
By 2050, the total installed capacity in the country is expected to be at 108,346 MW. In 2050, about 48% of power-generating capacity will be from natural gas, followed by coal at 40%. The capacity will be from renewable energy such as hydro (8%), solar (2%), and biomass (1%).
Based on estimated future installed capacity, DES for Malaysia for the same period was estimated based on the proportion of the share of DES in 2015 (Tables 4.14 to 4.17).
Natural gas 354.40 1,569.82 Diesel 7.80 5.18 Palm oil waste 21.13 36.81 Wood/sawmill dust 25.38 55.82 Others 5.05 6.91 Subtotal 413.77 1,674.54 Grand total 2,526.14 4,767.79
In 2020, the projected future DES installed capacity is about 1,300 MW. The potential total electricity generation for DES is about 1,661 GWh. For 2030, the installed capacity for DES is about 1,613 MW with potential electricity generation around 2,520 GWh. In 2040, the installed capacity for DES is estimated at 2,069 MW with potential electricity generation about 3,611 GWh. The estimated installed capacity for DES in 2050 is 2,526 MW with potential electricity generation around 4,768 GWh.
Projected Potential CO2 Avoidance from DES in 2020, 2030, 2040, and 2050 [level 1]
98 Distributed Energy System in Southeast Asia
Based on estimation of DES in 2020, 2030, 2040, and 2050, we can calculate the projected potential CO2 avoidance. Tables 4.18 to 4.21 show the results for each period.
Table 4.18. Projected Potential CO2 Avoidance from DES for 2020
In 2020, the projected potential CO2 avoidance for DES will be about 179.31 ktCO2 equivalent and in 2030 the potential CO2 avoidance for DES will increase to 185.53 ktCO2 equivalent. The potential projected CO2 avoidance for DES in 2040 is expected to increase to 190.83 ktCO2 equivalent. By 2050, the projected potential CO2 avoidance from DES will be 190.83 ktCO2 equivalent.
102 Distributed Energy System in Southeast Asia
Sour
ce: A
utho
r’s ca
lculat
ion.
Tabl
e 4.2
2. Es
timat
ed C
ost B
etwe
en O
ff Gr
id an
d O
n Gr
id fo
r DES
in 2
020
2020
Off
-Grid
On-
Grid
Regi
onFu
el T
ype
Inst
alle
d Ca
paci
ty
(MW
)
Gen
erat
ion
(GW
h)Ca
pita
l Cos
t (U
S$)
Fuel
Cos
t (U
S$)
Varia
ble
Cost
(US$
)Fi
xed
Cost
(U
S$)
Tota
l Cos
t (U
S$)
Capi
tal C
ost
(US$
)Fu
el C
ost
(US$
)Va
riabl
e Co
st (U
S$)
Fixe
d Co
st
(US$
)To
tal C
ost
(US$
)
Peninsular Malaysia
Nat
ural
gas
378.
9876
9.45
284,
234,
135.
4717
,312,
639.
612,
539,
187.1
44,
926,
725.0
130
9,01
2,68
7.24
286,
034,
135.
4717
,312,
639.
612,
539,
187.1
44,
926,
725.0
131
0,81
2,68
7.24
Indu
stria
l pro
cess
was
te h
eat
11.55
18.0
825
,853
.408
.40
582,
300.
3214
1,054
.1193
5,222
.3827
,493
,985
.21
27,6
35,4
08.4
058
2,30
0.32
141,0
54.11
935,2
22.38
29,2
93,9
85.2
1
Die
sel
356.
179.
8751
5,984
,660
.66
864,
802.
2570
,092
.42
3,749
,095
.41
520,
668,
650.
7551
7,784
,660
.66
864,
802.
2570
,092
.42
3,749
,095
.41
522,
468,
650.
75
Empt
y fru
it bu
nch
300.
9476
.60
673,1
59,6
66.2
62,
466,
441.6
059
7,461
.01
24,36
7,874
.22
700,
591,4
43.0
967
4,95
9,66
6.26
2,46
6,44
1.60
597,4
61.0
124
,367,8
74.2
270
2,39
1,443
.09
Palm
oil s
hell a
nd fi
bre
5.41
0.45
12,0
96,9
97.14
14,56
5.60
3,528
.3143
7,902
.21
12,55
2,99
3.26
13,8
96,9
97.14
14,56
5.60
3,528
.3143
7,902
.21
14,35
2,99
3.26
Palm
oil m
ill effl
uent
8.
2412
.1219
,826
,719.
470
31,52
3,77
539,
260.
2520
,397,5
03.4
921
,626
,719.
47-
31,52
3.77
539,
260.
2522
,197,5
03,4
9
Woo
d du
st4.
160.
259,
308,
841.6
78,
092.
001,9
60.17
336,
973.0
89,
655,8
66.9
211,
108,
841.6
78,
092.
001,9
60.17
336,
937.0
811,
455,8
66.9
2
Sola
r5.9
60.
7225
,491
,605
.320
4,36
3.54
50,9
85.4
025
,546,
954.
2627
,291
,605
.32-
4,36
3.54
50,9
85.4
027
,346,
954.
26
Hyd
ro2.
225.5
158
5,130
.05
033
,621
.722,
874.
9862
1,626
.752,
385,1
30.0
5-
33,6
21.72
2,87
4.98
2,42
1,626
.75
Palm
oil w
aste
17.9
925
.82
40,2
48,37
3.39
831,5
33.9
220
1,427
.47
1,456
,960
.88
42,73
8,29
5.66
42,0
48,37
3.39
831,5
33.9
220
1,427
.47
1,456
,960
.88
44,53
8,29
5.66
Padd
y hus
k25
.130.
0356
,212
,812
.00
971.0
423
5.22
2,03
4,86
1.57
58,2
48,8
79.8
358
.012
,821
.00
971.0
423
5.22
2,03
4,86
1.57
60,0
48,8
79.8
3
Subt
otal
1,116
.76
918.
911,6
62,9
84,3
49.8
322
,081
,346.
343,6
24,4
54.9
038
.838
,735.3
81,7
27,5
28,8
86.4
51,6
82,78
4,34
9.83
22,0
81,34
6.34
3,62
4,45
4.90
38,8
38,7
35.38
1,747
,328,
886.
45
Sabah
Empt
y fru
it bu
nch
11.18
50.53
25,0
03,4
58.78
1,627
,139.
3639
4,15
1.77
905,1
06.4
227
,929
,856
.3326
,803
,458
.781,6
27,13
9.36
394.
151.7
790
5,106
.42
29,72
9,85
6.33
Agr
icul
tura
l was
te6.
530.
6114
,615
,331.1
219
,744.
484,
782.
8252
9.06
4.01
15,16
8.92
2.43
16,4
15,33
1.12
19,74
4.48
4,78
2.82
529,
064.
0116
,968
,922
.43
Die
sel
8.53
150.
5612
,362,
011.2
713
,188,
676.
191,0
68,9
45.2
288
,821
.20
26.70
9.45
3.87
14,16
2,01
1.27
13,18
8,67
6.19
1,068
.945
.22
89,8
21.2
028
,509,
453.8
7
Subt
otal
26.2
520
1.70
51,9
80,8
01.6
114
,835
,560
.03
1,467
,879
.81
1,523
,991
.63
69,8
08,2
32.6
357
,380
,801
.1614
,835
,560
.03
1,467
,879
,81
1,523
,991
.63
75,2
08,2
32.6
3
Sarawak
Nat
ural
gas
99.4
344
0.41
74,57
0,56
7.02
9,90
9,22
5.61
1,453
,353.0
91,2
92,55
6.50
87,2
25,70
2.21
76,37
0,56
7.02
9,90
9,22
5.61
1,453
,353.0
91,2
92,55
6.50
89,0
25,70
2.21
Die
sel
8.53
5.67
12,36
2,01
1.27
496,
518.
4740
,242
.94
59,6
61.57
12,9
58,4
34.2
414
,162,
011.2
749
6,51
8.47
40,2
42.9
459
,661
.5714
,758,
434.
24
Palm
oil w
aste
20.0
034
.84
44,74
5,398
.351,1
21,8
74.8
827
1,758
.511,6
19,74
9.81
47,75
8,78
1.55
46,54
5,398
.351,1
21,8
74.8
827
1,758
.511,6
19,74
9.81
49,55
8,78
1.55
Woo
d/sa
wm
ill du
st24
.02
52.8
353
,739,
448.
271,7
01,2
62.0
841
2,106
.96
1,945
,327.6
657
,798,
144,
9755
,539,
448.
271,7
01,2
62.0
841
2,106
.96
1,945
,327.6
659
,598,
144.
97
Oth
ers
5.05
6.91
11,29
6,05
2.10
222,
502.
0053
,898
.00
408,
908.
6011,
981,3
60.70
13,0
96,0
52.10
222,
502.
0053
,898
.00
408,
908.
6013
,781,3
60.70
Subt
otal
157.0
454
0.66
196,
713,
477.0
213
,451
,383
.04
2,23
1,359
.50
5,32
6,20
4.13
217,7
22,4
23.6
820
5,71
3,44
7.02
13,4
51,38
3.04
2,23
1,359
.50
5,32
6,20
4.13
226,
772,
423.
68
Gra
nd to
tal
1,300
.04
1,661
.28
1,911
,678
,628
.01
50,36
8,28
9.41
7,323
,694
.2145
,688
,931
.132,0
15,0
59,54
2.77
1,945
,878
,628
.01
50,36
8,28
9.41
7,323
,694
.21
45,6
88,9
31.13
2,049
,259,
542.7
7
103Distributed Energy System in Malaysia
Sour
ce: A
utho
r’s ca
lculat
ion.
Tabl
e 4.2
3. Es
timat
ed C
ost B
etwe
en O
ff Gr
id an
d O
n Gr
id fo
r DES
in 2
030
2030
Off
-Grid
On-
Grid
Regi
onFu
el T
ype
Inst
alle
d Ca
paci
ty
(MW
)
Gen
erat
ion
(GW
h)Ca
pita
l Cos
t (U
S$)
Fuel
Cos
t (U
S$)
Varia
ble
Cost
(US$
)Fi
xed
Cost
(U
S$)
Tota
l Cos
t (U
S$)
Capi
tal C
ost
(US$
)Fu
el C
ost
(USD
)Va
riabl
e Co
st (U
S$)
Fixe
d Co
st
(US$
)To
tal C
ost
(US$
)
Peninsular Malaysia
Nat
ural
gas
651.8
91,3
23.56
488,
920,
508.
5329
,780,
042.
254,
367,7
39.53
8,47
4,62
2.15
531,5
42,9
12.4
549
0,72
0,50
8.53
29,78
0,04
2.25
4,36
7,739
.538,
474,
622.1
553
3,342
,912
.45
Indu
stria
l pro
cess
was
te h
eat
11.83
18.52
26,4
61,17
9.53
596,
404.
4814
4,47
0.65
957,8
74.8
228
,159,
929.
4828
,261
,179.
5359
6,40
4.48
144,
470.
6595
7,874
.82
29,9
59,9
29.4
8
Die
sel
309.
378.
5744
8,18
5,301
.1375
1,168
.95
60,8
82.4
23,2
56,4
71.72
452,
253,8
24.2
244
9,98
5,301
.1375
1,168
.95
60,8
82.4
23,2
56,4
71.72
454,
053,8
24.2
2
Empt
y fru
it bu
nch
308.
2378
.45
689,
464,
571.6
72,
526,
182.
4061
1,932
.3824
,958
,099
,5471
7,560
,786.
0069
1,264
,571,6
72,
526,
182.
4061
1,932
.3824
,958
,099
.5471
9,36
0,78
6.00
Palm
oil s
hell a
nd fi
bre
5.54
0.46
12,39
0,00
3.99
14,9
18.4
03,6
13.77
448,
508,
8412
,857
,045
.00
14,19
0,23
5.86
14,9
18.4
03,6
13.77
448,
508.
8414
,657
,045
.00
Palm
oil m
ill effl
uent
8.
4512
.45
20,35
1,235
.86
032
,357.7
455
2,32
1.92
20,9
35,9
15.51
22,15
1,235
.86
-32
,357.7
455
2,32
1.92
22,73
5,915
.51
Woo
d du
st4.
260.
269,
534,
315.3
48,
288.
002,
007.6
534
5,135
.05
9,88
9,74
6.05
11,33
4,31
5.34
8,28
8.00
2,00
7.65
345,1
35.0
511,
689,
746.
05
Sola
r11.
571.3
949
,490
,373.8
60
8,47
1.53
98,9
85.0
149
,597,8
30.4
051
,290
,373.8
6-
8,47
1.53
98,9
85.0
151
,397,8
30.4
0
Hyd
ro3.1
77.8
683
4,49
9.20
047
,950
.544,
100.
2388
6,54
9.96
2,63
4,49
9.20
-47
,950
.544,
100.
232,
686,
549.
96
Palm
oil w
aste
18.4
326
.45
41,2
23,2
47.4
985
1,674
.88
206,
306.
341,4
92,2
50.59
43,77
3,479
.3043
,023
,247
.49
851,6
74.8
820
6,30
6.34
1,492
,250
.5945
,573,4
79.30
Padd
y hus
k25
.740.
0357
,574,
368.
0099
4.56
240.
922,
084,
148.
8759
,659
,752.
3559
,374,
368.
0099
4.56
240.
922,
084,
148.
8761
,459
,752.
35
Subt
otal
1,358
.50
1,478
.00
1,844
,429
,604
.60
34,52
9,67
3.92
5,485
,973
.47
42,6
72,51
8.73
1,927
,117,7
70.72
1,864
,229,
604.
6034
,529,
673.9
25,
485,
973.
4742
,672
,518
.781,9
46,9
17,7
70.72
Sabah
Empt
y fru
it bu
nch
11,45
51.76
25,6
09,0
78.8
91,6
66,55
1.04
403,6
98.70
927,0
29.4
228
,606
,358.
0427
,409
,078
.89
1,666
,551.0
440
3,698
.7092
7,029
.42
30.4
06.35
8.04
Agr
icul
tura
l was
te6.
690.
6314
,969
,335.6
820
,222
.04
4,89
8.67
541,8
78.71
15,53
6,33
5.78
16,76
9,33
5.68
20,2
22.72
4,89
8.67
541,8
78.71
17,33
6,33
5.78
Die
sel
7.41
130.
7710
,737,6
67.54
11,45
5,710
.3392
8,48
7.94
78,0
18.71
23,19
9,88
4.68
12,53
7,667
.5411,
455,7
10.33
928,
487.9
478
,018
.87
24,9
99,8
84.6
8
Subt
otal
25.5
518
3.16
51,3
16,0
82.11
13,14
2,48
4.09
1,337
,085
.311,5
46,9
26.9
967
,342
,578
.50
56,7
16,0
82,11
13,14
2,48
4.09
1,337
,085
.31
1,546
,926
.99
72,74
2,57
8.50
Sarawak
Nat
ural
gas
171.0
375
7.56
128,
271,2
91.17
17,0
45,18
5.70
2,49
9,96
0.57
2,22
3,369
.05
150,
039,
806.
4913
0.07
1.291
.1717
,045
,185.7
02,
499,
960.
572,
223,3
69.0
515
1,839
,806
.49
Die
sel
7.41
4.92
10,73
7,667
.5443
1,376
.93
34,9
55.0
951
,822
.1611,
255,7
21.72
12,53
7,667
.5443
1,276
.93
34,9
55.0
951
,822
.1613
,005
,721.7
2
Palm
oil w
aste
20.4
935
.68
45,8
29,19
6.93
1,149
,048
.3227
8.34
0.90
1,658
,982
.5048
,915
,568.
6547
,629
,196.
931,1
49,0
48.32
278,
340.
901,6
58,9
82.50
50,71
5,568
.65
Woo
d/sa
wm
ill du
st24
.61
54.11
55,0
41,0
95.8
11,7
42,4
69.12
422,
088.
791,9
92,4
46.32
59,19
8,10
0.04
56,8
41,0
95.8
11,7
42,4
69.12
422,
088.
791,9
92,4
46.32
60,9
98,10
0.04
Oth
ers
5.05
6.91
11,29
6,05
2.10
222,
502.
0053
,898
.00
408,
908.
6011,
981,3
60.70
13,0
96,0
52.10
222,
502.
0053
,898
.00
408,
908.
6013
,781,3
60.70
Subt
otal
228.
5985
9.20
251,1
75,3
03.5
420
,590
,482
.08
3,28
9,24
3.35
6,33
5,52
8.62
218,
390,
557.6
026
0,17
5,30
3.54
20,59
0,48
2.08
3,28
9,24
3.35
6,33
5,52
8.62
290,
390,
557.6
0
Gra
nd to
tal
1,612
.64
2,52
0.36
2,14
6,92
0,99
0.25
68,26
2,640
.09
10,11
2,302
.1350
,554
,974
.35
2,275
,850
,906
.82
2,181
,120,
990.
2568
,262,6
40.0
910
,112,
302.
1350
,554,
974.
352,3
10,0
50,9
06.8
2
104 Distributed Energy System in Southeast Asia
Sour
ce: A
utho
r’s ca
lculat
ion.
Tabl
e 4.2
4. Es
timat
ed C
ost B
etwe
en O
ff Gr
id an
d O
n Gr
id fo
r DES
in 2
040
2040
Off
-Grid
On-
Grid
Regi
onFu
el T
ype
Inst
alle
d Ca
paci
ty
(MW
)
Gen
erat
ion
(GW
h)Ca
pita
l Cos
t (U
S$)
Fuel
Cos
t (U
S$)
Varia
ble
Cost
(US$
)Fi
xed
Cost
(U
S$)
Tota
l Cos
t (U
S$)
Capi
tal C
ost
(US$
)Fu
el C
ost
(US$
)Va
riabl
e Co
st
(US$
)Fi
xed
Cost
(U
S$)
Tota
l Cos
t (U
S$)
Peninsular Malaysia
Nat
ural
gas
988.
642,
007.2
674
1,481
,209
.28
45,16
3,459
.81
6,62
3,974
.1112
,852
,340.
9680
6,12
0,98
4.15
743,2
81,2
09.2
845
,163,4
59.8
16,
623,9
74.11
12,8
52,34
0.96
807,9
20,9
84.15
Indu
stria
l pro
cess
was
te h
eat
12.2
019
.1127
,295
,541.0
561
5,210
.03
149,
026.
0398
8,07
8.08
29,0
47,8
55.19
29,9
05,54
1.05
615,2
10.0
314
9,02
6.03
988,
078.
0830
,847
,855
.19
Die
sel
325.7
09.
0347
1,836
,240
.5079
0,80
8.48
64,0
95.2
13,4
28,31
7.20
476,
119,4
61.38
473,6
36,2
40.50
790,
808.
4864
,095
.21
3,428
,317.2
047
7,919
,461
.38
Empt
y fru
it bu
nch
317.9
580
.93
711,2
04,4
45.56
2,60
5,836
.80
631,2
27.55
25,74
5,066
.65
740,
186,
576.
5571
3,004
,445
.562,
605,8
36.8
063
1,227
.5525
,745,0
66.6
574
1,986
,576.
55
Palm
oil s
hell a
nd fi
bre
5.71
0.48
12,78
0,67
9.80
15,38
8.80
3,727
.7246
2,65
1.01
13,2
62,4
47.32
14,58
0,67
9.80
15,38
8.80
3,727
.7246
2,65
1.01
15,0
62,4
47.32
Palm
oil m
ill effl
uent
8.
4512
.45
20,35
1,235
.86
032
,357.7
456
9,73
7.47
20,9
53,33
1.07
22,15
1,235
.86
-32
,357.7
456
9,73
7.47
22,75
3,331
.07
Woo
d du
st4.
400.
279,
834,
946.
918,
549.
332,
070.
9635
6,01
7.69
10,2
01,58
4.89
11,63
4,94
6.91
8,54
9.33
2,07
0.96
356,
017.6
912
,001
,584.
89
Sola
r11.
841.4
250
,624
,173.9
50
8,66
5.61
101,2
52.70
50,73
4,09
2.26
52,4
24,17
3.95
-8,
665.6
110
1,252
.7052
,534,
092.
26
Hyd
ro3.1
87.8
983
7,735
.21
048
,136.
484,
116.13
889,
987.8
22,
637,7
35.2
1-
48,13
6.48
4,116
.132,
689,
987.8
2
Palm
oil w
aste
19.0
127
.28
42,52
3,079
.62
878,
529.
4921
2,81
1.49
1,539
,303.5
445
,153,7
24.14
44,32
3,079
.62
878,
529.
4921
2,81
1.49
1,539
,303.5
446
,953
,724.
14
Padd
y hus
k26
.550.
0359
,489,
776.
001,0
25.9
224
8.51
2,149
,865
.28
61,54
0,91
5.71
61,18
9,77
6.00
1,025
.92
248.
512,1
49,8
65.2
863
,340,
915.7
1
Subt
otal
1723
.64
2,16
6.14
2,14
8,15
9,06
3.71
50,0
78,8
08.6
67,7
76,34
1.41
48,19
6,74
6.69
2,25
4,21
0,96
0.48
2,16
7,959
,063
.71
50,0
78,8
08.6
67,7
76,3
41.4
148
,196,
746.
692,
274,
010,
960.
48
Sabah
Empt
y fru
it bu
nch
11.81
53.39
26,4
16,57
2.36
1,719
,099
.95
416,
427.9
495
6,26
0.07
29,50
8,36
0.32
28,2
16,57
2.36
1,719
,099
.95
416,
427.9
495
6,26
0.07
31,30
8,36
0.32
Agr
icul
tura
l was
te6.
900.
6515
,441
,341.7
620
,860
.375,0
53.13
558,
964.
9716
,026
,220
.24
17,2
41,34
1.76
20,8
60.37
5,053
.1355
8,96
4.97
17,8
26,2
20.2
4
Die
sel
7.80
137.6
711,
304,
299.
0712
,060
,233
.3197
7,484
.66
82,13
5.96
24,4
24,15
3.00
13,10
4,29
9.07
12,0
60,2
33.31
977,4
84.6
682
,135.9
626
,224
,153.0
0
Subt
otal
26.5
219
1.71
53,16
2,21
3.20
13,8
00,19
3.63
1,398
,965
.731,5
97,3
61.0
169
.958
,733
.57
58,5
62,2
13.2
013
,800
,193.
631,3
98,9
65.7
31,5
97,3
61.0
175
,358
,733
.57
Sarawak
Nat
ural
gas
259.
381,1
48.9
019
4,53
2,138
.5225
,850
,183.5
93,7
91,36
0.26
3,371
,890
.40
227,5
45,57
2.78
196,
332.1
38.52
25,8
50,18
3.59
3,791
,360.
263,3
71,8
90.4
022
9,34
5,572
.78
Die
sel
7.80
5.18
11,30
4,29
9.07
454,
035.6
136
,799.
6954
,556.
8411,
849,
691.2
213
,104,
299.
0745
4,03
5.61
36,79
9.69
54,55
6.84
13,6
49,6
91.2
1
Palm
oil w
aste
21.13
36.8
147
,274
,261
.701,1
85,2
79.57
287,1
17.4
11,7
11,29
2.76
50,4
57,9
51.4
449
,074
,261
.701,1
85,2
79.57
287,1
17.4
11,7
11,29
2.76
52,2
57,9
51.4
4
Woo
d/sa
wm
ill du
st25
.3855
.82
56,77
6,62
5.86
1,797
,411.
8443
5,397
.90
2,05
5,271
.20
61,0
64,70
6.80
58,57
6,62
5.86
1,797
,411.
8443
5,397
.90
2,05
5,271
.20
62,8
64,70
6.80
Oth
ers
5.05
6.91
11,29
6,05
2.10
222,
502.
0053
,898
.00
408,
908.
6011,
981,3
60.70
13,0
96,0
52.10
222,
502.
0053
,898
.00
408,
908.
6013
,781,3
60.70
Subt
otal
318.
751,2
53.6
232
1,183
,377
.25
29,5
09,4
12.6
24,
604,
573.
267,6
01,9
19.8
036
2,89
9,28
2.92
330,
183,
377.2
529
,504,
412.6
24,
604,
573.
267,6
01,9
19.8
037
1,899
,282
.92
Gra
nd to
tal
2,06
8.9
3,61
1.47
2,52
2,50
4,65
4.16
93,38
8,41
4.90
13,77
9,88
0.40
57,3
96,0
27.5
02,6
87,0
68,9
76.9
72,
556,
704,
654.
1693
,388,4
14.9
013
,779
,880
.40
57,39
6,02
7.50
2,721
,268,
976,
97
105Distributed Energy System in Malaysia
Sour
ce: A
utho
r’s ca
lculat
ion.
Tabl
e 4.2
5. Es
timat
ed C
ost B
etwe
en O
ff Gr
id an
d O
n Gr
id fo
r DES
in 2
050
2050
Off
-Grid
On-
Grid
Regi
onFu
el T
ype
Inst
alle
d Ca
paci
ty
(MW
)
Gen
erat
ion
(GW
h)Ca
pita
l Cos
t (U
S$)
Fuel
Cos
t (U
S$)
Varia
ble
Cost
(U
S$)
Fixe
d Co
st
(US$
)To
tal C
ost
(US$
)Ca
pita
l Cos
t (U
S$)
Fuel
Cos
t (U
S$)
Varia
ble
Cost
(U
S$)
Fixe
d Co
st
(US$
)To
tal C
ost
(US$
)
Peninsular Malaysia
Nat
ural
gas
1,350
.85
2,742
.66
1,013
,136,
522.
6361
,709,
926.
099,
050,
789.
1617
,561,0
33.0
61,1
01,4
58,2
70.9
41,1
04,9
36,52
2.63
61,70
9,92
6.09
9,05
0,78
9.16
17,56
1,033
.06
1,103
,258
,270
.94
Indu
stria
l pro
cess
was
te h
eat
12.2
019
.1127
,295
,541.0
561
5,210
.03
149,
026.
0398
8,07
8.08
29,0
47,8
55.19
29,0
95,54
1.05
615,2
10.0
314
9,02
6.03
988,
078.
0830
,847
,855
.19
Die
sel
325.7
09.
0347
1,836
,240
.5079
0,80
8.48
64,0
95.2
13,4
28,31
7.20
476,
119,4
61.38
473,6
36,2
40.50
790,
808.
4864
,095
.21
3,428
,317.2
047
7,919
,461
.38
Empt
y fru
it bu
nch
317.9
580
.93
711,2
04,4
45.56
2,60
5,836
.80
631,2
27.55
25,74
5,066
.65
740,
186,
576.
5571
3,004
,445
.562,
605,8
36.8
063
1,227
.5525
,745,0
66.6
574
1,986
,576.
55
Palm
oil s
hell a
nd fi
bre
5.71
0.48
12,78
0,67
9.80
15,38
8.80
3,727
.7246
2,65
1.01
13,2
62,4
47.32
14,58
0,67
9.80
15,38
8.80
3,727
.7246
2,65
1.01
15,0
62,4
47.32
Palm
oil m
ill effl
uent
8.
4512
.45
20,35
1,235
.86
032
,357.7
456
9,73
7.47
20,9
53,33
1.07
22,15
1,235
.86
-32
,357.7
456
9,73
7.47
22,75
3,331
.07
Woo
d du
st4.
400.
279,
834,
946.
918,
549.
332,
070.
9635
6,01
7.69
10,2
01,54
8.89
11,63
4,94
6.91
8,54
9.33
2,07
0.96
356,
017.6
912
,001
,584.
89
Sola
r11.
841.4
250
,624
,173.9
50
8,66
5.61
101,2
52.70
50,73
4,09
2.26
54,4
24,17
3.95
-86
65.6
110
1,252
.7052
,534,
092.
26
Hyd
ro3.1
87.8
983
7,735
.21
048
,136.
484,
116.13
889,
987.8
22,
637,7
35.2
1-
48,13
6.48
4,116
.132,
689,
987.8
2
Palm
oil w
aste
19.0
127
.28
42,52
3,079
.62
878,
529.
4921
2,81
1.49
1,539
,303.5
445
,153,7
24.14
44,32
3,079
.62
878,
529.
4921
2,81
1.49
1,539
,303.5
446
,953
,724.
14
Padd
y hus
k26
.550.
0359
,389,
776.
001,0
25.9
224
8.51
2,149
,865
.28
61,54
0,91
5.71
61,18
9,77
6.00
1,025
.92
248.
512,1
49,8
65.2
863
,340,
915.7
1
Subt
otal
2,08
5.85
2,90
1.54
2,41
9,81
4,37
7.07
66.6
25,27
4.94
10,20
3,156
.46
52,9
05,4
38.79
2,54
9,54
8,24
7.26
2,43
9,61
4,37
7.07
66,6
25,2
74.9
410
,203
,156.
4652
,905
,438
.792,
569,
348,
247.2
6
Sabah
Empt
y fru
it bu
nch
11.81
53.39
26,4
16,57
2.36
1,719
,099
.95
416,
427.9
495
6,26
0.07
29,50
8,36
0.32
28,2
16,57
2.36
1,719
,099
.95
416,
427.9
495
6,26
0.07
31,30
8,36
0.32
Agr
icul
tura
l was
te6.
900.
6515
,441
,341.7
620
,860
.375,0
53.13
558,
964.
9716
,026
,220
.24
17,2
41,34
1.76
20,8
60.37
5,053
.1355
8,96
4.97
17,8
26,2
20.2
4
Die
sel
7.80
137.6
711,
304,
299.
0712
,060
,233
.3197
7,484
.66
82,13
5.96
24,4
24,15
3.00
13,10
4,29
9.07
12,0
60,2
33.31
977,4
84.6
682
,135.9
626
,224
,153.0
0
Subt
otal
26.5
219
1.71
53,16
2,21
3.20
13,8
00,19
3.63
1,398
,965
.731,5
97,3
61.0
169
,958
,733
.57
58,5
62,2
13.2
013
,800
,193.
631,3
98,9
65.7
31,5
97,3
61.0
175
,358
,733
.57
Sarawak
Nat
ural
gas
354.
401,5
69.8
226
5,802
,574.
4935
,320,
875.0
15,1
80,39
5.00
4,60
7,244
.62
310,
911,0
89.12
267,6
02,57
4.49
35,32
0,87
5.01
5,180
,395.0
04,
607,2
44.6
231
2,711,
089.
12
Die
sel
7.80
5.18
11,30
4,29
9.07
454,
035.6
136
,799.
6954
,556.
8411,
849,
691.2
113
,103,2
99.0
745
4,03
4.61
36,79
9.69
54,55
6.84
13,6
49,6
91.2
1
Palm
oil w
aste
21.13
36.8
147
,274
,261
.701,1
85,2
79.57
287,1
17.4
11,7
11,29
2.76
50,4
57,9
51.4
449
,074
,261
.701,1
85,2
79.57
287,1
17.4
11,7
11,29
2.76
52,2
57,9
51.4
4
Woo
d/sa
wm
ill du
st25
.3855
.82
56,77
6,62
5.86
1,797
,411.
8443
5,397
.90
2,05
5,271
.20
61,0
64,70
6.80
58,57
6,62
5.86
1,797
,411.
8443
5,397
.90
2,05
5,271
.20
62,8
64,70
8.80
Oth
ers
5.05
6.91
11,29
6,05
2.10
222,
502.
0055
,898
.00
408,
908.
6011,
981,3
60.70
13,0
96,0
52.10
222,
502.
0053
,898
.00
408,
908.
6013
,781,3
60.70
Subt
otal
413.
771,6
74.5
439
2,45
3,81
3.21
39,9
80,10
4.03
5,99
3,60
8.00
8,83
7,274
.02
446,
264,
799.
2740
1,453
,813
.21
39,9
80,10
4.03
5,99
3,60
8.00
8,83
7,274
.02
455,
264,
799.
27
Gra
nd to
tal
2,52
6.14
4,76
7.79
2,86
5,43
0,40
3.48
119,4
05,57
2.60
17,59
5,730
.2063
,340
,073
.82
3,065
,771,7
80.10
2,89
9,63
0,40
3.48
119,4
05,57
2.60
17,5
95,7
30.2
063
,340,
073.8
23,0
99,9
71,78
0.10
Chapter 5Distributed Energy System in the Philippines
Introduction
For a developing country like the Philippines, energy demand will constantly increase through the years with rapid urbanisation and increased economic growth and industrialisation. The aspiration of the present Duterte administration towards industrialised Philippines would necessarily require ensured sufficient energy to support and drive the country towards this direction. And whilst the country is inducing more private investment in the generation sector and pursuing distribution and transmission reinforcements to support its power requirements, it still struggles to provide stable and reliable power supply.
The country’s archipelagic state remains a major constraint in strengthening the transmission and distribution infrastructures to be able to deliver power supply to end users. This limitation clearly deprives the communities in remote islands from access to electricity. Furthermore, implementation of power projects in the projected period is not guaranteed due to lengthy government processes and requirements. These are just some challenges that have prompted the Philippines to start exploring distributed energy system (DES) as a viable option to satisfy immediate electricity demands.
DES applies to all distributed generation or decentralised power system where electric power is produced and consumed locally at or near the consumers; it can either be utility or consumer owned. Off grid can be a stand-alone generation having no connection to the national grid whilst on grid is termed embedded generation1 or self-generating generator. Several technologies that form DES both in off-grid and on-grid areas include solar photovoltaic (PV), wind, solar, hydro, biomass, geothermal, diesel, coal, gas, and waste-to-heat recovery/cogeneration.
1 Embedded generator refers to generating units that are indirectly connected to the grid through the distribution utilities system or industrial generation facilities that are synchronised with the grid.
107Distributed Energy System in the Philippines
The advent of DES applications in the Philippines is progressively transforming the landscape of the power sector and its associated challenges. Today, DES begins to become part of the country’s power system primarily for services such as emergency power, uninterruptible supply, or ancillary service. Its dynamic features have responded to the complexity of the generation, transmission, and distribution systems incited by costly investment on conventional power plants, power losses, reliability issues, and environmental concerns, amongst others. It has become an effective energy solution for areas where electricity access seems to be unachievable. This energy system made it possible for consumers to be not just mere recipients of electricity supply, but also suppliers by allowing them to generate their own electricity and export excess to the grid.
As DES continuously becomes more desirable and economical because of its scale, flexibility, and proximity to the consumers, distributed generation may eventually be on par with centralised generation in the coming years. The continued technical advancement in the electric power system offers better opportunities for distributed generation to become as important as centralised generation. The widely growing interest of the implementation of DES applications simply suggests that it will become a significant element in restructuring and modernising the country’s power industry.
Methodology
On-Grid/Embedded Generations
The 2008–2015 data on power generation submitted by generation companies and distribution utilities through their monthly operations report served as the working database to assess the demand projection of on-grid DES/embedded generations by 2025 and 2040. Since the country’s system operator, the National Grid Corporation of the Philippines, does not capture and monitor embedded generations, the primary data needed for projections were sourced from the monthly operations report submitted to the Department of Energy (DOE). From this, all embedded generations were obtained and disaggregated per technology.
The base case demand projection was primarily derived using an econometric model of electricity generation based on technology, with economic growth and time trend as explanatory variables. Such estimation means that a unit change in electricity generation can be explained by the behaviour of economic growth and time trend over the planning period. This historical trend was used and applied to the actual 2015 electricity generation to come up with the baseline electricity generation forecasts.
108 Distributed Energy System in Southeast Asia
From the forecasted electricity generations that have been established, the peak demand forecasts are then obtained using the load factor approach. In this method, the forecasted electricity generation is divided by a predefined load factor. For this purpose, a high load factor of 70% is assumed in consideration of increased diversities and management of loads in industrial zones and on-grid areas resulting in relatively constant power usage.
In this methodology, identification of the additional capacity is solely dependent on the projection of electricity demand unlike in other planning processes where reserve requirements and committed capacities are also considered. To determine the annual deficit per type of power plant, the peak demand forecast was subtracted from the existing dependable capacity as of December 2015. The resulting value is the required or necessary DES capacity to meet future demand. A negative result indicates that the existing capacity still has a surplus capacity for that specific period.
Off-Grid Generation
To illustrate a holistic picture of DES profile for off-grid generation, this study captured the respective off-grid areas under the coverage franchise areas of grid-connected electric cooperatives.
This study used the following information to determine the future capacity of DES in off-grid areas: (i) 2015 data of DES installed capacity and electricity generated, and (ii) off-grid electricity demand projections for planning horizon 2025 and 2040.
The main source of information is the 2016 individual distribution development plan (DDP) of off-grid electric cooperatives as submitted to and approved by the DOE. The DDP is a 10-year plan prepared annually by all distribution utilities for managing their distribution systems and ensuring continuous, reliable, and affordable electricity service to its customers through identification of infrastructure requirements and timely procurement of power supply agreements. The 2016 DDP has a baseline year of 2015 (actual) and projections from 2016 to 2025, utilising various forecasting models. For this study, the electricity demand projections were extended to 2040 to capture long-term demand and the corresponding additional capacity requirements in off-grid areas.
To identify the required DES capacities by 2025 and 2040, the current installed capacities were subtracted from the projected electricity demand on a per-technology basis. The resulting figure then provides for the required additional DES capacities, if the existing capacities fall short of the projected demand for the planning period. On the
109Distributed Energy System in the Philippines
other hand, if the existing installed capacities are still sufficient to meet the 2025 and 2040 electricity demand, this indicates that no additional capacities are required for that outlook period.
On top of these, new DES technologies such as wind and geothermal energy sources were likewise accounted, with the understanding that these new technologies will essentially form part of the future DES energy mix. These new DES technologies are firm capacities that are electric cooperatives programmed in their power supply expansion plan.
Current Situation of Distributed Energy System
On-Grid/Embedded Generation
This section concentrates on the current situation of embedded generation in the country. Included in the discussions are the existing installed capacities per type of energy source and its substantial merits to the power sector, the present policies and opportunities to promote the use of distributed generation, and its share to the overall generation capacity to support enhancement of energy security.
Installed Capacity and Power Generation
As of 2015, the country’s total installed capacity of embedded generation operating in industrial zones and on-grid areas was recorded at 609 megawatts (MW) with a total power generation of 1,292,700 megawatt-hours (MWh)2 (Table 5.1). In this period, oil-based/diesel power plants with an equivalent installed capacity of 346.59 MW dominated embedded generation. This is attributed to the influx of embedded diesel power plants in Mindanao since 2012 as part of the government’s proposed actions to augment the power crisis in the region. The renewable energy sources also had a significant contribution in the country’s embedded generation with 159.77 MW, followed by combined heat and power (CHP) or industrial cogeneration, providing a considerable share of 103 MW. Meanwhile, there has been no record yet of coal-fired and geothermal power plants being utilised in the form of DES since they are widely used in centralised power as base load supply.
2 Embedded generations included in the 2015 data of the Department of Energy (DOE) that are presently grid-connected, non-operational, and decommissioned have been excluded to isolate the effects of such occurrences.
110 Distributed Energy System in Southeast Asia
Table 5.1. Total DES Installed Capacity and Gross Power Generation (On grid), 2015
ApplicationsCurrent/Existing Capacity
MW MWh
Solar PV 16.60 21,732
Wind 54.00 53,947
Biomass/biogas 9.40 23,561
Micro hydro 79.77 367,944
Geothermal 0.00 0
Diesel generator 346.59 561,785
Thermal power (coal, slurry, fuel oil, others) 0.00 0
CHP incl. heat recovery facility 103.00 263,731
Other generators
Total 609.00 1,292,700
CHP = combined heat and power, MW = megawatt, MWh = megawatt-hour, PV = photovoltaic.Source: Philippine DOE (2015).
Merits of Embedded Generation
Deployment and use of DESs in industrial zones and on-grid areas deliver substantial merits to both consumers and distribution utilities. Since most economic activities are centred in urbanised areas, ensured sufficient supply is very critical in all aspects for the continuous operation of cities, businesses, and homes. It is in this circumstance that majority of the embedded units installed today serve as backup especially during peak hours. Since application of renewable technologies is very site-specific, most units installed in these areas are diesel power plants.
In 2015, the DOE and Energy Regulatory Commission introduced the Interruptible Load Program (ILP) in Luzon in anticipation of the tight power supply during the summer period. In this mechanism, business customers of a distribution utility voluntarily disconnect themselves off the grid especially during peak demand period. Participating customers will be incentivised should they use their own embedded stand-by generation during power supply deficit. The ILP in some ways illustrated the practicality and helpfulness of embedded generations in today’s power industry.
111Distributed Energy System in the Philippines
Embedded generation significantly contributes to reducing peak power requirements. This has benefited distribution utilities just like the power distributor giant Manila Electric Company (MERALCO), most of whose franchise areas are growing load centres. MERALCO provides financial incentives to customer owners of embedded units to make them available to electric system operators during peak demand periods. In Mindanao, electric cooperatives and distribution utilities have started integrating embedded generations in their networks to serve as ancillary service as the National Grid Corporation of the Philippines is not providing a contract for ancillary services. Consequently, these embedded units around the country shared their part in alleviating the line congestion being experienced and increasing the reliability of delivering power. Since the units are usually closer to the consumers, power loss is also reduced, resulting in higher efficiency and better performance of the system. Thus, the use of embedded generations is an effective solution in providing emergency power, particularly on those facilities that require highly reliable electricity.
Opportunities and Economy of DES in On-Grid Areas
In terms of economy, there are vast opportunities in the development of DES, particularly in industrial and commercial sectors situated in on-grid areas and economic zones. According to the Philippine Economic Zone Authority, 358 economic zones are operating nationwide, hosting some of the top global manufacturing and industrial companies3 . These ecozones could be future sites for DES, particularly solar and wind farms that are expected to augment power requirements in the future.
The booming industrial and commercial field across the country denotes potential opportunities on the application of DES, especially that there is an ongoing trend of companies venturing on embedded generations to produce their own electricity for lower energy bills and increased reliability. From 2011 to 2015, the industrial and commercial sectors shares to total electricity consumption averaged 27% and 24%, respectively (Philippine DOE, 2016a). As these sectors are electricity intensive, meeting the electricity demands will require an unprecedented level of investment in fuel supply, generation, and networks. Thus, it is generally in these sectors that adoption of DES would be more beneficial in reducing electricity consumption and managing peak demands.
As the cost of DES becomes economical, it will be advantageous for some facilities and businesses requiring highly reliable electricity to install and generate their own power to
assure continuity of their operations. Since use of DES is limited to certain locations and conditions, many of the developers now are focusing on energising large commercial and industrial sectors through solar rooftops. Meanwhile, the application of cogeneration or waste heat recovery is also gaining popularity amongst the pulp and paper, refining, and manufacturing sectors.
Although application of DES is competitive with conventional generation, it is still difficult to attract investors as the government lacks concrete, transparent, and reliable policies regarding DES. Power investments are capital intensive; hence, these must be complemented with a market that is predictable and friendly to investors to enable and encourage higher penetration of embedded generations in the grid. Energy Security Brought by Embedded Generation
Enhancing energy security has always been a major challenge the country has to deal with. Sudden power outages have dramatic implications for the country’s economic activities resulting from interruption of business operations and loss of revenues. The introduction of generating power in the form of distributed generation can provide an enhanced energy security.
The Philippine DOE estimated that 3.18% of the country’s overall power generation in 2015 came from embedded generation in on-grid areas and economic zones (Table 5.2). Out of this, the share of renewable sources and fossil-based power plants to the total capacity of power generation registered at 0.83% and 2.35%, respectively.
Table 5.2. Percentage Share of Installed Generating Capacity, 2015
MW = megawatt.Source: Philippine DOE (2016b).
Installed Capacity, MW Percentage Share
Off-grid generation 404.50 2.1
On-grid generation 18,765.00 97.9
Embedded generation 609.36 3.18
Renewable energy 159.77 0.83
Fossil based 449.59 2.35
Overall power generation 19,169.50 100.00
113Distributed Energy System in the Philippines
CO2 Emissions Reduction by Existing On-Grid/Embedded DES
The use of renewable energy and energy-efficient technologies such as cogeneration/CHP in producing energy has been proven to drive down carbon emissions since it reduces the need to produce electricity from carbon-intensive sources such as fossil fuels. Using the standard emission factor of 7.03 x 10⁻⁴ MT-CO2/kWh set by the US Environmental Protection Agency and the actual electricity generation for 2015, the carbon footprint offset from renewable energy and CHP was estimated at 513,833.25 MTCO2 for a total of 730,915 MWh of clean energy (Table 5.3).
Table 5.3. Total CO2 Emissions Reduction by Renewable Energy System and Combined Heat and Power (On-grid DES), 2015
CHP = combined heat and power, MW = megawatt, MWh = megawatt-hour, MTCO2 = metric ton of CO2, PV = photovoltaic.Note: Emission factor = 7.03 × 10⁻⁴ MTCO2/kWh.Source: Philippine DOE (2015a).
ApplicationsExisting Dependable Capacity CO2 Emission
Case Studies of DES Application for Economic Zones
This study cites two manufacturing plants using on-site power generation to describe the state and performance of embedded generation in the country.
Case Study 1: San Carlos Ecozone Negros Occidental
San Carlos Bioenergy Inc. (SCBI) is a pioneer in ethanol manufacturing in the country. In 2008, it completed the first integrated sugar cane-based ethanol and power cogeneration power plant in Asia (Zabaleta, 2012). The integrated cogeneration facility located in San Carlos City, Negros Occidental has a capacity of 8.3 MW powered by indigenous biomass resources, particularly bagasse, by-products from ethanol production.
114 Distributed Energy System in Southeast Asia
Table 5.4. SCBI’s Installed Capacity and Power Generation, 2015
MW = megawatt. MWh = megawatt-hour. Source: Philippine DOE (2015a).
In 2010, the SCBI signed a power supply contract with VMC Rural Electric Services Cooperative Inc. (VRESCO) for 2.4 MW–4.8 MW in excess capacity for 30 years at P2.86 per kWh, subject to regular adjustments based on inflation (Gatdula, 2010). VRESCO distributes electricity to its franchise areas covering the cities of San Carlos, Victorias, Cadiz, Sagay, and Escalante and the municipalities of E.B. Magalona, Manapla, Toboso, and Calatrava in Negros Occidental.
In terms of power generation, the SCBI generated a total of 18,134 MWh in 2015 (Table 5.4). It is committed to providing sustainable power and maintaining the environmental integrity of its surrounding areas. The generating facility of the SCBI upheld this commitment in 2013 as it played a key role in the aftermath of Typhoon Yolanda (Haiyan). The whole province of Negros Occidental had no power due to damaged power lines of the local cooperative. But in just after 2 days, the facility was able to supply the city of San Carlos with 1.5–1.7 MW of electricity for 1 week.4 This model case of the SCBI clearly demonstrated the defining attributes and qualities of distributed generation in terms of enhancing energy security and reliability.
ApplicationsCurrent/Existing Capacity
MW MWhBiomass/BiogasSan Carlos Bioenergy Inc. (SCBI) 8.3 18,134
Case Study 2: United Pulp and Paper Company, Inc.
United Pulp and Paper Company, Inc. (UPPC) is the Philippines’ biggest industrial paper manufacturer located in Calumpit, Bulacan and a subsidiary of the Siam Cement Group of Thailand. This plant uses 100% waste paper as raw material and is powered by a 30 MW cogeneration power plant that runs on coal, paper rejects, waste paper sludge, and biomass like corn cob and straw dust.
Formerly a bunker-fired plant facility, the Siem Cement Group started to invest in 2004 to put up a circulating fluidised bed cogeneration plant to supply the power and steam requirements of its paper mills (Cahiles-Magkilat, 2005). This is part of the plant’s strategy to generate fuel savings and reduce production cost as it cost consumes a high amount of energy.
The UPPC generated a total of 143,359 MWh solely for its own consumption to run its machinery to produce paper (Table 5.5). The company’s decision to venture in power generation is an important motivation for many businesses on how large power consumers can translate their demand into additional power generation through on-site generation.
Table 5.5. UPPC’s Installed Capacity and Power Generation, 2015
CHP = combined heat and power, MW = megawatt, MWh = megawatt-hour. Source: Philippine DOE (2015a).
ApplicationsCurrent/Existing Capacity
MW MWhCHP incl. Heat Recovery FacilityUnited Pulp and Paper Company, Inc. (UPPC) 30 143,359
Current Policies for Embedded Generation
Technically, the country does not have an existing policy with respect to embedded generation. In fact, even the minimum connection and operational requirements of embedded generators in the distribution system have yet to be established and integrated with the Philippine Distribution Code. However, there are existing support mechanisms when it comes to embedded generations from renewable energy sources. The outstanding progress on applications of DES using renewable energy technologies is the result of the government’s continuous promotion and encouragement of cleaner sources of energy. Currently, the government offers incentives under the Renewable Energy Act of 2008 such as income tax holidays, 10% corporate tax rates, duty-free importation of renewable energy machinery and equipment, and 0% value-added tax on renewable energy sales and purchases. Under this law is the adoption of a feed-in-tariff (FiT) system where an eligible producer of renewable energy is entitled to a guaranteed payment of a fixed rate for each kilowatt-hour of energy it supplies to the relevant grid (ERC, 2010). In addition to this is the implementation of the net-metering scheme, a non-fiscal incentive that allows consumers to produce its own power generation using eligible renewable energy facilities and to deliver excess supplies back to the electric grid to offset their electricity consumption at 100 kW maximum.
116 Distributed Energy System in Southeast Asia
Table 5.6. List of Off-Grid Electric Cooperatives
Source: Philippine Department of Energy – 2016 Distribution Development Plan.
Island Off-Grid Electric Cooperative
Luzon
Batanes Electric Cooperative (BATANELCO)
Lubang Electric Cooperative (LUBELCO)
Occidental Mindoro Electric Cooperative (OMECO)
Oriental Mindoro Electric Cooperative (ORMECO)
Marinduque Electric Cooperative (MARELCO)
Tablas Island Electric Cooperative (TIELCO)
Romblon Electric Cooperative (ROMELCO)
Busuanga Island Electric Cooperative (BISELCO)
Palawan Electric Cooperative (PALECO)
First Catanduanes Electric Cooperative (FICELCO)
Masbate Electric Cooperative (MASELCO)
Ticao Island Electric Cooperative (TISELCO)
VisayasBantayan Island Electric Cooperative (BANELCO)
Camotes Electric Cooperative (CELCO)
Province of Siquijor Electric Cooperative (PROSIELCO)
Mindanao
Siasi Electric Cooperative (SIASELCO)
Sulu Electric Cooperative (SULECO)
Basilan Electric Cooperative (BASELCO)
Tawi-tawi Electric Cooperative (TAWELCO)
Dinagat Island Electric Cooperative (DIELCO)
Off-Grid Generation
This section briefly discusses the profile of DESs in off-grid areas. As of this writing, about 20 electric cooperatives are serving the off-grid areas (Table 5.6).
117Distributed Energy System in the Philippines
Table 5.7 lists the on-grid electric cooperatives with off-grid areas in their service franchises.
Table 5.7. List of On-grid Electric Cooperatives with Off-grid Areas
Source: Philippine Department of Energy – 2016 Distribution Development Plan.
Island Off-Grid Electric Cooperative
Luzon
Quezon II Electric Cooperative (QUEZELCO II)Polillo, Panukulan, Burdeos, Patnanungan, and Jomalig, Quezon
Aurora Electric Cooperative (AURELCO)Dinalungan, Casiguran and Dilasag, Aurora Dinapigue, Isabela
Batangas II Electric Cooperative (BATELEC II) Tingloy, BatangasCamarines Sur IV Electric Cooperative (CASURECO IV)
Caramoan and Garchitorena, Camarines Sur
Isabela II Electric Cooperative (ISELCO II) Divilacan, Palanan, and Maconnacon, Isabela
Albay Power and Energy Corporation (APEC)5 Rapu-Rapu, Albay
Visayas
Antique Electric Cooperative (ANTECO) Caluya Island, Antique
Biliran Electric Cooperative (BILECO) Higatangan Island, Biliran
Bohol I Electric Cooperative (BOHECO I) Inabanga, Calape, Baclayon, Tubigon and Panglao, Bohol
Iloilo III Electric Cooperative (ILECO III) Gigantes Island, Iloilo
Mactan Electric Company (MECO) Olango Island, Lapu-Lapu City
Northern Samar Electric Cooperative (NORSAMELCO)
Municipalities of Biri, San Antonio, Capul, San Vicente and Batag Island
Samar I Electric Cooperative (SAMELCO I) Municipalities of Sto. Nio , Almagro, and Tagapul-an
Samar II Electric Cooperative (SAMELCO II) Municipality of Zumarraga
Southern Leyte Electric Cooperative (SOLECO) Limasawa Island
Mindanao
Davao del Sur Electric Cooperative (DASURECO) Balut and Saranggani Islands
Sultan Kudarat Electric Cooperative (SUKELCO)Lebak, Kalamansig, Sen. Ninoy Aquino, and Palimbang, Sultan Kudarat
Surigao del Norte Electric Cooperative (SURNECO) Hikdop Island
Zamboanga City Electric Cooperative (ZAMCELCO) Sacol Island
5 APEC is the concessionaire of the defunct Albay Electric Cooperative, Inc. (ALECO).
118 Distributed Energy System in Southeast Asia
Table 5.8. Existing Off-Grid Power Plants by Type of Ownership, 2015
- = zero, NPC-SPUG = National Power Corporation – Small Power Utilities Group. Data Source: DOE, 2015.
6 QTP is created based on Section 59 of Republic Act No. 9136 or the Electric Power Industry Reform Act of 2001 or the EPIRA Law under Rule 14 of its Implementing Rules and Regulations. Said section stipulates that entities other than distribution utilities are authorised to provide electric service in remote and unviable areas that distribution utilities are unable to serve for any reason.
Existing Power Plants (Off-Grid)
As of December 2015, there were about 322 existing power plants (314 were oil based whilst 8 were micro hydro) operating as stand-alone DES in off-grid areas. By type of ownership, about 291 power facilities, mostly oil-based diesel, were state owned through the National Power Corporation – Small Power Utilities Group (NPC–SPUG). About 24 power facilities were privately owned and operated by New Power Providers. About five micro-hydro power plants were owned by distribution utilities, and two oil-based power plants were under the qualified third party (QTP)6 programme (Table 5.8).
OwnerNo. of Power Plants
TotalOil based Micro hydro
NPC-SPUG 290 1 291
New power providers 22 2 24
Utility-owned - 5 5
Qualified third parties 2 - 2
Total 314 8 322
Installed Capacity and Gross Power Generation (Off-Grid)
As of 2015, the total installed capacity of DES operating in off-grid areas was 404.5 MW. About 392.4 MW or 97% of the installed DES capacity came from diesel generators, whilst roughly 12.2 MW or 3% were from micro-hydro power plants.
During the same period, power generation grossed 1,066,236 megawatt-hours (MWh). The bulk (96.9%) of the electricity generated came from fossil-based diesel power generators whilst a mere portion (3.1%) was sourced from renewable energy-based micro-hydro power plants (Table 5.9).
119Distributed Energy System in the Philippines
Table 5.9. Total DES Installed Capacity and Gross Power Generation (Off grid), 2015
Applications Installed Capacity(MW)
Gross Generation (MWh)
Solar PV - -
Wind - -
Biomass/biogas - -
Micro hydro 12.15 33,335
Geothermal - -
Diesel generator 392.36 1,032,901
Thermal Power (coal, slurry, fuel oil, others) - -
CHP incl. heat recovery facility - -
Other generators - -
Total 404.51 1,066,236
- = zero, CHP = combined heat and power, MW = megawatt, MWh = megawatt-hour, PV = photovoltaic.Source: Philippine Department of Energy (2015b).
Merits of DES in Off-Grid Areas
The deployment of DES applications has merits, especially in off-grid areas. For one, the concept of DES as stand-alone mini-grid is practically viable in island provinces, especially when public funds are limited to finance the extension of the main transmission lines to reach the off-grid areas.
Elaborating further, the mobility of fossil-based DES technologies such as diesel power generators enables sustainable supply of energy in far-flung areas. Compared to other technologies, diesel power generators can be easily installed through modular units, and their installed capacity can be conveniently augmented at any given time.
Potential renewable energy sources such as run-of-river hydro, geothermal, biomass, wind, and solar PVs are site-specific resources that are abundantly available in rural areas. The abundance of this cleaner set of renewable sources in the off-grid areas allow for the immediate application of DES to secure the electricity supply of remote communities.
Opportunities and Economy of DES in Off-Grid Areas
The Philippine energy sector is open for business. In fact, there is a huge potential for investment opportunities for both on-grid and off-grid infrastructure in the areas of
120 Distributed Energy System in Southeast Asia
power generation, transmission, and distribution. However, because off-grid areas have relatively smaller electricity demand compared to on grid, the private sector is reluctant to invest in DES power generation. Hence, the government implemented the Private Sector Participation (PSP) programme.
The PSP is a government programme promulgated through Department Circular No. 2004-01-001 to encourage the inflow of private capital investment to engage in missionary electrification.7 This is pursuant to Section 3(b) of Rule 13 of the Implementing Rules and Regulations of Republic Act No. 9136 or the ‘Electric Power Industry Reform Act (EPIRA) of 2001’. The section provides that NPC–SPUG shall periodically assess the requirements and prospects for bringing its functions to commercial viability on an area-by-area basis at the earliest possible time, including a programme to encourage private sector participation.
In the long run, the PSP is expected to improve the delivery of power-related services, such as efficiency and reliability of power generation, that would significantly benefit the end consumers. Consequently, the PSP aims to meet future demand growth.
Because of the lower peak demand level in off-grid areas, economies of scale in putting up DES technologies are likewise being applied. Depending on the economic activities taking place in the island grids, the size of DES varies. For instance, relatively large off-grid areas such as Palawan, Mindoro, Masbate, and Siquijor are amongst the progressive missionary areas whose installed DES capacities ideally range from above 10 MW. On the other hand, the rest of the developing islands and islets have DES capacities of less than 10 MW.
Energy Security brought by DES in Off-Grid Areas
DES applications primarily aim to attain energy security especially in off-grid areas. Table 5.10 presents the percentage share of the on-grid and off-grid installed generating capacities for 2015. As shown in the table, about 97.9% of the installed generating capacities are used for on-grid application, with merely 2.1% coming from off grid.
For on grid, 64.9% of the total installed generating capacities are fossil-based facilities comprised of oil-based, coal, and natural gas power plants, whilst renewable types of generating capacities sccpunt for a 33.0% share.
7 Missionary electrification refers to providing basic electric services to remote or off-grid areas and ultimately bringing the operations in these areas to viable levels.
121Distributed Energy System in the Philippines
For off grid, the share of fossil-based generating capacities was only 2.1% of the total, mostly diesel. Roughly 0.1% of the off-grid capacities are sourced from renewable energy technologies.
Table 5.10. Percentage Share of Installed Generating Capacity, 2015
In general, off-grid capacities account for a very minimal share of the country’s total installed generating capacities. Considering that small-island and isolated grids possess varied peculiarities, DES applications serve a significant purpose in ensuring energy security and sustainability in off-grid areas.
CO2 Emissions Reduction by Existing Off-Grid DES
The increasing levels of greenhouse gas (GHG) emissions from the energy sector is widely viewed as a major contributor to global warming or climate change. Within the sector, these GHG emissions are largely attributed to the combustion of fossil fuels during the energy transformation processes. Whilst climate change has recently become an urgent and priority concern globally, the Philippines as a developing country remains a minor contributor to the world’s GHG emission compared to the developed economies and other neighbouring countries.
For this study, the present and future domestic GHG emissions were duly accounted for to establish the potential advantage of reducing GHG emissions through DES, especially for off-grid areas. In estimating the GHG equivalencies, this study used the emission factor of 7.03 x 10⁻⁴ MTCO2/kWh set by the United States Environmental Protection Agency (EPA).
122 Distributed Energy System in Southeast Asia
Table 5.11. CO2 Emissions Reduction Equivalencies in DES Off-Grid Areas, 2015
MTCO2e = metric tons carbon dioxide equivalent, MWh = megawatt-hour.Note: CO2 emissions reduction was calculated using the US Environmental Protection Agency’s emission factor of 7.03 x 10⁻⁴ MTCO2/kWh.Source: Department of Energy 2015 Gross Generation, 2015.
Table 5.11 shows the 2015 electricity gross generation in off-grid areas and the potential CO2 emissions reduction expressed in metric tons of carbon dioxide equivalent (MTCO2e). For the reported period, off-grid areas recorded a total potential GHG emissions reduction of 749,563.91 MTCO2e based on the actual 1,066,236 MWh gross power generation. About 96.9% of this figure, or 726,129.40 MTCO2e, can be reduced from fossil-based diesel generation. Avoided units of CO2 emissions from renewable energy account for 23,434.51 MTCO2e.
Fuel Type Gross Generation (MWh) CO2 Emissions Reduction(MTCO2e)
Fossil-based(diesel) 1,032,901 726,129.40
Renewable Energy(micro hydro) 33,335 23,434.51
Total 1,066,236 749,563.91
Cost–Benefit Analysis of On-Grid and Off-Grid Areas
Another envisioned advantage of utilising DES is to provide affordable energy. However, this vision is rather contrary in the case of the Philippines. To support this statement, the DOE conducted a cost–benefit analysis comparing the cost of providing electricity in the main grid against the off grid.
With reference to the 2015 data on electricity tariff (Table 5.12), the national average power rate in the main grid is ₱8.8029/kWh or US$0.1767.8 This was computed by taking the average electricity tariff of the on-grid electric cooperatives (US$0.1890/kWh) and the public investor-owned utilities (US$0.1644/kWh). On the other hand, the national average electricity tariff in off-grid areas as of December 2015 is ₱10.7396/kWh or US$0.2156/kWh.9
For both main grid and off grid, the national average effective electricity rates are composed of the (i) generation charge; (ii) system loss charge; (iii) distribution, supply, and metering charges; (iv) subsidy charges;10 (v) other charges;11 and (vi) government charges (universal charge, and value added tax).
8 Foreign exchange rate used: US$1 = ₱49.8126 (Reference: Bangko Sentral ng Pilipinas (BSP), accessed 30 May 2017).9 Including the cash incentive for renewable energy in off-grid areas; excluding the feed-in-tariff allowance. 10 Includes lifeline and Senior Citizen’s discount.11 Includes loan condonation, PEMC–SPA charges, over/under recovery and interclass cross subsidy.
kWh = kilowatt-hour.Source: Philippine DOE (2015c).
As a result of the cost–benefit analysis, off-grid power rates are deemed higher by US$0.0389 compared to the power rates in the main grid.
Case Studies of DES Application for Off-Grid Areas
This section discusses two model cases where off-grid DES is being applied: the Romblon Electric Cooperative, Inc. (ROMELCO) and the Basilan Electric Cooperative, Inc. (BASELCO) that serve as distribution utilities in the provinces of Romblon and Basilan, respectively.
Case Study 1: Romblon Electric Cooperative, Inc.
The province of Romblon is in the MIMAROPA12 region. It is composed of about 20 major and smaller islands scattered across the centre of the Philippine archipelago. The biggest is Tablas Island comprising nine municipalities (San Agustin, Calatrava, San Andres, Odiongan, Ferrol, Santa Fe, Looc, Alcantara, and Santa Maria); Sibuyan Island with three municipalities (Magdiwang, Cajidiocan, and San Fernando); and Romblon Island, the capital town, is an island municipality located in the middle of the islands. Four other major islands are the municipalities of Corcuera, Banton, Concepcion, and San Jose.
Romblon is primarily an agricultural province with most economic activities evolving in the basic sectors such as agriculture and livestock raising, marginal fishing, and small-scale mining activities with aggregates as the major product. Basically, major activities in the province are focused on the fishing and tourism industries, and crop production.
12 MIMAROPA is an administrative region in the Philippines comprising the provinces of Mindoro, Marinduque, Romblon, and Palawan.
124 Distributed Energy System in Southeast Asia
Table 5.13. ROMELCO’s Installed Capacity and Gross Power Generation, 2015
Two distribution utilities cater to the power requirements of the province: (i) Tablas Island Electric Cooperative, Inc. (TIELCO) serving the franchise area of Tablas Island, and (ii) ROMELCO, serving the rest of the island municipalities. This case study focuses only on the areas under the ROMELCO franchise.
As of end 2015, ROMELCO’s power-generating facilities had an installed capacity of 8.38 MW. By type of power source, 7.48 MW come from diesel generators operated by NPC-SPUG and 0.9 MW are sourced from Cantingas micro-hydro power plant owned by the utility. The 2015 system peak demand of ROMELCO reached 3.07 MW whilst gross power generation was registered at 16,913 MWh (Table 5.13).
In terms of gross provincial income, Basilan is a third-class island province located in the Autonomous Region in Muslim Mindanao. It is the largest island situated in the northernmost of the major islands of the Sulu archipelago.
The province is subdivided into 11 municipalities – Akbar, Al-Barka, Hadji Mohammad Ajul, Hadji Muhtamad, Lantawan, Maluso, Sumisip, Tabuan-Lasa, Tipo-Tipo, Tuburan, Ungkaya Pukan – and two cities – Isabela City, a component city, and Lamitan City, the capital.
125Distributed Energy System in the Philippines
Agriculture is the main source of livelihood with major products that include coconut (primarily copra), rubber, coffee, black pepper, and African palm oil. Other crops are palay, corn, cacao, and cassava.
Unlike Romblon, the power requirements of Basilan are being catered by its sole distribution utility, BASELCO. Basilan also belongs to the BASULTA area (Basilan, Sulu, and Tawi-Tawi), which is one of the large clusters of off-grid area in Mindanao.
In 2015, Basilan’s installed generating capacity totalled 14.03 MW. The bulk of the power supply (95.2%) was sourced from diesel-based facilities owned and operated by NPC-SPUG, with the remaining power capacity (4.8%) from utility-owned Kumalarang micro-hydro power plant. During the same period, system peak demand was recorded at 8.3 MW whilst total electricity generated was at 39,370 MWh (Table 5.14).
Table 5.14. BASELCO’s Installed Capacity and Gross Power Generation, 2015
= , CHP = combined heat and power, MW = megawatt, MWh = megawatt-hour, PV = photovoltaic.( - ) means zero.Source: BASELCO Distribution Development Plan, 2016.
Current Policies for DES in Off-Grid Areas
a. Universal Charge for Missionary Electrification (UCME)
Since it is costlier to generate electricity in off-grid areas compared to the main grid, the government implemented a subsidy programme through the universal charge for missionary electrification. UCME is a policy mechanism created under
126 Distributed Energy System in Southeast Asia
Rule 13 of the Implementing Rules and Regulations of Electric Power Industry Reform Act. Its sales revenue is a main funding source of NPC–SPUG to support the delivery of electricity services. More importantly, it cushions the impact of high generation costs in far-flung areas. The mechanism is expressed in peso per kilowatt-hour that is applied and charged to all electricity consumers of the country. The 2015 average UCME charge is US$0.0074/kWh.
b. Feed-in-Tariff
Republic Act No. 9513 or the ‘Renewable Energy Act of 2008’ articulated the government’s thrust to promote the development, utilisation, and commercialisation of renewable energy resources to shift towards a low-carbon future. To realise this thrust, the renewable energy law provided for policy mechanisms to encourage and accelerate the development and utilisation of cleaner energy sources.
Amongst the major incentives provided under the Renewable Energy Act is the feed-in-tariff (FiT). FiT refers to a renewable energy policy that offers guaranteed payments on a fixed rate per kilowatt-hour for emerging renewable energy sources, excluding any generation for own use. The implementation of the FiT system aims to:
• allow renewable energy developers to recover their investments and provide them with internationally acceptable return on investment during the FiT period;• accelerate the development of emerging/competitive renewable energy technologies; and• not unduly burden the consumers with heavy pass-on charges.
To further safeguard consumer interest, the FiT system was accompanied by a corresponding installation target per type of renewable energy resource. Installation targets are the renewable energy-rated capacities per technology projected based on the awarded renewable energy service contracts for a given period as certified by the government through DOE. The installation targets aim to pre-determine the impact of the FiT rates at a given period and the maximum penetration of renewable energy capacities to the grid. Table 5.15 summarises the current FiT rates and installation targets per renewable energy technology.
127Distributed Energy System in the Philippines
Table 5.15. Approved Feed-in Tariff Rates and Installation Target (as of June 2017)
RE Technology Approved Rates(US$/kWh)
Percentage Share(MWh)
Run-of-river hydro 0.1184 250
Biomass 0.1331 250
Wind 0.1486 400
Solar 0.1943 500
kWh = kilowatt-hour, MW = megawatt.Source: ERC Resolution No. 10, series of 2012; ERC Resolution No. 1, series of 2017.
At present, the FiT system is only applicable and can be availed of by prospective developers of renewable energy in the main grid. To guarantee that the FiT system would be practicable to all electricity consumers, the National Renewable Energy Board, the Department of Energy, and the Energy Regulatory Commission, in consultation with energy stakeholders, periodically conducts a review.
c. Cash Incentive for Renewable Energy Developers in Off-Grid Areas
As the government finds it very challenging to entice private investment for the development of renewable energy in off-grid areas, it likewise put in place a cash incentive mechanism.
As provided under Chapter VII General Incentives and Section 15(h) of the renewable energy law or Republic Act 9513, a renewable energy developer ‘shall be entitled to a cash generation-based incentive per kilowatt-hour rate generated, equivalent to fifty percent (50%) of the universal charge for power needed to service missionary areas where it operates the same, to be chargeable against the universal charge for missionary electrification’. In 2015, the cash incentive for renewable energy developers was US$0.000034/kWh.
d. Competitive Selection Process in Securing Power Supply Agreements
In June 2015, DOE issued Department Circular No. 2015-06-0008, mandating all distribution utilities to undergo a competitive selection process in securing power supply agreements with generation companies. The foremost objective of the policy is to reinforce good governance and instil a transparent process
128 Distributed Energy System in Southeast Asia
amongst distribution utilities in managing, negotiating, and procuring long-term power supply contracts. Correspondingly, the policy issuance enables a level-playing field and facilitates fair competition amongst generation companies that redound benefits to electricity consumers through reliable, adequate, and least-cost supply of electricity.
Development of Distributed Energy System
There is a great possibility that the future of power system is DES. This is becoming increasingly clear as demonstrated by the growing presence of stand-alone and on-site generations, advances in applications and new technologies, and the changing preference of consumers. In this section, the additional required capacities of DES per type of energy source for 2025 and 2040 will be identified. Determining the future power requirements is crucial as it will entail additional investments in meeting future demand.
On-Grid/Embedded Generation
2025 Outlook
Table 5.16 shows that the aggregated existing dependable capacity of 508.28 MW for embedded generation is theoretically sufficient to meet the projected demand of 457.71 MW by 2025 as denoted by an excess capacity of 50.57 MW. This is attributed to the huge presence of embedded diesel generators as it still has the surplus capacity of 93 MW in 2025.
However, considering that most of these units are stand-alone generations and that transfer of power is not readily possible, the excess capacity of diesel generators is not guaranteed to offset any deficiency of supply of other DES technologies to include the 1.52 MW for solar, 2.97 MW for biomass, 13.66 MW for hydro, and 24.28 MW for CHP. With this analysis, these technologies will have a shortfall of 42.43 MW in total by 2025.
Similarly, energy demand for embedded generations is estimated to double from its total generation of 1,292,700 MWh in 2015 to 2,529,921 MWh by 2040. This can be translated to an additional required energy of 1,237,221 MWh for the same period.
129Distributed Energy System in the Philippines
CHP = combined heat and power, MW = megawatt, MWh = megawatt-hour, PV = photovoltaic. Note: Required Capacity and Energy Demand by 2025 is based on author’s calculation. Source: Philippine DOE (2015a).
Table 5.16. Projected DES Required Capacity and Energy Demand by 2025 (On grid)
Total 508.28 1,292,700 457.71 (50.57) 2,529,921 1,237,221
2040 Outlook
Demand is forecasted to significantly increase from 2015 to 2040. Total peak demand is projected to reach 908.11 MW by 2040, requiring an additional capacity of 298.75 MW (Table 5.17). The need for additional capacities to support the expected demand comprises 17.36 MW for solar, 11.2 MW for biomass, 46 MW for hydro, 140.77 MW for diesel, and 83.42 MW for CHP.
Likewise, energy demand will continue to grow to about 4,671,609 MWh by 2040 from power generation of 1,292,700 MWh in 2015. This denotes an additional energy requirement of 3,378,909 MWh within the 25-year period. The future demand of the case models that practice the DES applications using on-site generation was likewise determined.
Projected CO2 Emissions Reduction by Future On-Grid/Embedded DES
Table 5.18 shows the cumulative CO2 emission reduction by the renewable energy system and CHP for on-grid DES from 2015 to 2040. In this approach, the computed
130 Distributed Energy System in Southeast Asia
CHP = combined heat and power, MW = megawatt, MWh = megawatt-hour, PV = photovoltaic. ( - ) means zero Note: Required Capacity and Energy Demand by 2040 is based on author’s calculation. Source: Philippine DOE (2015a).
Table 5.17. Projected DES Required Capacity and Energy Demand by 2040 (On grid)
Total 508.28 1,292,700 807.03 298.75 4,671,609 3,378,909
annual emission reduction of 513,833 MTCO2 for 2015 (Table 3) was used as the baseline for the annual CO2 emission reduction. In reference to this, renewable energy and CHP are expected to avoid total carbon emissions of at least 5,652,165.70 MTCO2 for 10 years, starting in 2015. Likewise, for a crediting period of 25 years (2015–2040), the total CO2 emission reduction is estimated to be at least 13,359,664 MTCO2. The computed CO2 emission reductions for 2025 and 2040 are minimum since the annual electricity production from renewable energy and CHP re assumed to be the same in 2015–2040 and that annual emission reduction for the entire crediting period is constant.
Case Study 1: San Carlos Ecozone Negros Occidental
The existing capacity of SCBI is forecasted to be insufficient to meet future demand. Based on projected demand, there will be a need of 1.31 MW by 2025 as its peak demand will reach 8.31 MW from its dependable capacity of 7 MW in 2015. Similarly, for 2040, it will need an additional capacity of 6.74 MW as peak demand is expected to be 13.74 MW. These additional capacities are necessary to support the SCBI’s own-use
131Distributed Energy System in the Philippines
Table 5.18. Projected CO2 Emission Reduction by Renewable Energy System and Combined Heat and Power (On-Grid DES)
RE Technology Projected CO2 Emission Reduction, MTCO2
2015 513,833.25
2016 1,027,666.49
2017 1,541,499.74
2018 2,055,332.98
2019 2,569,166.23
2020 3,082,999.47
: :
2025 5,652,165.70
: :
2040 13,359,664.37
Note: CO2 emissions reduction was calculated using US Environmental Protection Agency’s emission factor of 7.03 x 10⁻⁴ MTCO2/kWh
consumption for running its facilities and to comply with its power supply contract to VRESCO.
In terms of energy demand, the additional required energy by 2025 and 2040 is about 32,816 MWh and 66,103 MWh, respectively (Table 5.19).
Case Study 2: United Pulp and Paper Company, Inc.
UPPC’s future demand is estimated at 0.25 MW additional capacity by 2025 whilst in 2040, its required capacity is projected at 0.58 MW (Table 5.20). Noticeably, there is a slight increase on the projected power requirements of the company. This may be attributed to the constant number of units of their machinery being used for the past years especially since the forecasted demand was primarily derived from their actual power generation with time trend as independent variable. Also, large plant facilities like the UPPC strictly practice load management to have constant power usage for more efficient use of electricity. Thus, the company’s decision to expand and increase its machinery will result in a surge in its future demand.
132 Distributed Energy System in Southeast Asia
CHP
= co
mbi
ned
heat
and
powe
r, MW
= m
egaw
att,
MW
h =
meg
awat
t-ho
ur, P
V =
phot
ovol
taic.
N
ote:
Requ
ired
Capa
city a
nd E
nerg
y Dem
and
by 2
025
is ba
sed
on au
thor
’s ca
lculat
ion.
So
urce
: Phi
lippi
ne D
OE
(201
5a).
MW
= m
egaw
att,
MW
h =
meg
awat
t-ho
ur.
Not
e: Re
quire
d Ca
pacit
y and
Ene
rgy D
eman
d by
202
5 an
d 20
40 is
bas
ed o
n au
thor
’s ca
lculat
ion.
So
urce
: Phi
lippi
ne D
OE
(201
5a).
Tabl
e 5.1
9. SC
BI’s
Proj
ecte
d En
ergy
and
Capa
city R
equi
rem
ents
, 202
5 an
d 20
40
Tabl
e 5.2
0. U
PPC’
s Pro
jecte
d En
ergy
and
Capa
city R
equi
rem
ents
, 202
5 an
d 20
40
App
licat
ions
2015
2025
2040
Dep
enda
ble
Capa
city
(MW
)En
ergy
Prod
uctio
n(M
Wh)
Peak
D
eman
d,
MW
Ener
gy
Dem
and
(MW
h)
Requ
ired
Capa
city
(MW
)
Requ
ired
Ener
gy
(MW
h)
Peak
D
eman
d,
MW
Ener
gy
Dem
and
(MW
h)
Requ
ired
Capa
city
(MW
)
Requ
ired
Ener
gy
(MW
h)
(a)
(b)
(c)
(d)
(c –
a)
(d –
b)
(e)
(f)
(e –
a)
(f –
b)
Biom
ass/
bio
gas
San
Carlo
s Bio
ener
gy
Inc.
(SCB
I)7.0
18,13
48.
3150
,950
1.31
32,8
1613
.7484
,237
6.74
66,10
3
App
licat
ions
2015
2025
2040
Dep
enda
ble
Capa
city
(MW
)En
ergy
Prod
uctio
n(M
Wh)
Peak
D
eman
d,
MW
Ener
gy
Dem
and
(MW
h)
Requ
ired
Capa
city
(MW
)
Requ
ired
Ener
gy
(MW
h)
Peak
D
eman
d,
MW
Ener
gy
Dem
and
(MW
h)
Requ
ired
Capa
city
(MW
)
Requ
ired
Ener
gy
(MW
h)
(a)
(b)
(c)
(d)
(c –
a)
(d –
b)
(e)
(f)
(e –
a)
(f –
b)
CHP
incl
. Hea
t Rec
ov-
ery F
acilit
yU
nite
d Pu
lp a
nd P
aper
Co
mpa
ny, I
nc. (
UPP
C)
24.0
143,3
5924
.1514
8,09
60.
154,
737
24.58
150,
741
0.58
7,382
133Distributed Energy System in the Philippines
Envisaged Policy for Embedded Generation
As mentioned above, the country does not have a holistic policy that captures embedded generation. A well-defined treatment of embedded generation in the power market system is needed. DOE should consider self-generation as an effective energy solution that will be substantial and easy to implement in the future. Some of the self-generating industries in the country are ready to deliver power to the grid; however, the mechanism to do so is still not in place. Stating these specific concerns, it is essential to formulate and implement policy on embedded generation to provide the direction for embedded generators. Opening opportunities for embedded generations will enable DES to penetrate the power sector and compete in the market.
Off Grid
This section briefly discusses the future development of DESs in small-island and isolated grids. Specifically, the discussion highlights the projected energy (in MWh) and capacities (in MW) of DES for 2025 and 2040, respectively, capturing the additional requirements for the medium and long term. It also considers new power generation technologies that are projected to form part of the future DES capacity mix, and briefly discusses avoidance of GHG emissions.
On a per technology basis, Table 5.21 presents the total peak and energy demand as well as the corresponding additional capacity requirements of the off-grid areas by 2025 and 2040.
2025 Outlook
For the 2025 outlook, the off-grid system peak demand is projected at 813.2 MW. Considering the existing 2015 installed capacity of 404.5 MW, an additional 408.7 MW (excluding reserve capacities) is seen as necessary to meet the overall power requirement for the period. Per type of technology, diesel-based capacities need to be augmented by 371.5 MW whilst micro hydro, by 11.14 MW. On the other hand, aside from new capacities from micro hydro, additional firm capacities for new renewable energy sources, such as wind and geothermal, are foreseen at 6.0 MW and 20.0 MW, respectively. The entry of these new renewable energy capacities were accounted for from the power supply expansion plan of the Oriental Mindoro Electric Cooperative, Inc. Said capacities are programmed to commercially operate by 2017.
134 Distributed Energy System in Southeast Asia
CHP = combined heat and power, MW = megawatt, MWh = megawatt-hour, PV = photovoltaic.( - ) means zeroNote: Required Capacity and Energy Demand by 2025 and 2040 is based on author’s calculation. Source: Individual Distribution Development Plan of Electric Cooperatives (2016).
Table 5.21. Projected DES Required Capacity and Energy (Off Grid)
Total 813.19 408.68 855,718 1,325.60 921.09 2,407,308
Total energy demand by 2025 is estimated at 1,921,954 MWh. Since the 2015 existing power plants have a net energy production of 1,066,236 MWh, the required energy for 2025 is 855,718 MWh.
Oil-based power generation will continue to dominate the energy demand at 61.4%, whilst renewable energy generation’s share is expected to be 38.6%.
2040 Outlook
In 2040, off-grid system peak demand is forecasted to reach 1,325.6 MW. Subtracting the 2015 existing capacity of 404.5 MW, the required additional capacity for the period is around 921.1 MW.
Per plant type, 883.95 MW of additional capacity is required for diesel-based generators to meet demand. Except for micro-hydro power plants, renewable energy–based capacities, particularly wind and geothermal, have fixed energy and peak demand
135Distributed Energy System in the Philippines
MTCO2e = metric tons carbon dioxide equivalent, MWh = megawatt-hour.Note: CO2 emissions reduction was calculated using the US Environmental Protection Agency emission factor of 7.03 x 10⁻⁴ MTCO2/kWh.Source: Author's calculation.
Table 5.22. Projected CO2 Emissions Reduction Equivalencies in DES Off-grid Areas, 2025 and 2040
considering that these renewable sources have been commissioned at their maximum potential capacities.
On the other hand, total energy demand by 2040 was projected at 3,473,544 MWh. To meet this energy requirement, an additional 2,407,308 MWh should be generated on top of the net energy production of 1,066,236 MWh in 2015. The bulk of the required energy is seen to come from diesel-based technology.
Projected CO2 Emissions Reduction by Future Off-Grid DES
Table 5.22 illustrates the projected GHG emissions reduction equivalencies for the 2025 and 2040 planning horizons.
As projected, by year 2025 there will be a total of 1,351,134 MTCO2e GHG emissions reduction equivalencies given a forecasted energy demand of 1,921,954 MWh. Out of this figure, about 1,095,466 MTCO2e is foreseen to be avoided from fossil-based diesel generation. On the other hand, for the incoming set of cleaner technologies, such as hydro, wind, and geothermal energies, the potential GHG emissions reduction is expected to be 255,668 MTCO2e.
Come 2040, the almost-doubling energy demand projected at 3,473,544 MWh is expected to yield GHG emissions reduction equivalencies of up to 2,441,901 MTCO2e. Fossil-based diesel generation is projected to contribute 2,186,234 MTCO2e or a roughly 89.5% share of GHG emissions potential avoidance. Potential GHG emissions reduction from renewable energy are estimated to be a mere 10.5%.
136 Distributed Energy System in Southeast Asia
Case Study 1: Romblon Electric Cooperative, Inc.
Table 5.23 shows the 2025 and 2040 energy and peak demand projections of ROMELCO based on its 2016 Distribution Development Plan. It also highlights the baseline data for the installed capacity and the net electricity production in 2015. Furthermore, the table presents the corresponding additional energy and capacity requirements for 2025 and 2040.
Total peak demand was projected to reach 4.66 MW by 2025. It was nearly shared equally by micro-hydro and diesel power applications, posted at 2.35 MW and 2.31 MW, respectively. Per fuel type, micro-hydro capacities will require an additional 1.45 MW from its existing 0.9 MW installed capacity in 2015. The current installed capacity of diesel power plants at 8.38 MW is sufficient to cover the 2.31 MW demand for diesel. ROMELCO’s energy demand for 2025 was forecasted at 26,004 MWh. Considering the 2015 net energy production of 16,913 MWh, the additional energy requirement for the period is 9,091 MWh.
For the 2040 outlook period, ROMELCO’s expected peak demand of 7.02 MW will almost catch up with the existing supply of 8.38 MW, leaving an excess capacity of 1.36 MW. Although capacity requirements for micro hydro is still pegged at 1.45 MW, the required energy has significantly increased to 13,179 MWh compared to the 2025 energy requirement of 5,826 MWh. Existing diesel-based capacities should still be adequate by 2040, whilst energy requirements are expected to increase to 14,446 MWh, four times the 2025 demand level.
Case Study 2: Basilan Electric Cooperative, Inc.
Based on the demand and supply projections of BASELCO, the existing installed capacity of 14.03 MW and net energy production of 39,370 MWh in 2015 already falls short by 1.80 MW and 12,618 MWh, respectively, in 2025. Although there is a minimal excess in micro-hydro capacity at 0.03 MW, most of the capacity and energy requirement is expected to come from diesel-based technology.
By 2040, the almost doubling of peak demand is notable at 26.70 MW from its 2025 demand level of 15.83 MW, considering the economic growth of the area. To fill this gap, an additional 13.31 MW of diesel-based capacity is necessary.
Towards the long-term period, peak and energy demand for micro-hydro technology was similarly fixed at 0.64 MW and 600 MWh, respectively, having no capacity augmentation plan programmed by BASELCO for its Kumalarang micro-hydro power plant (Table 5.24).
137Distributed Energy System in the Philippines
MW
= m
egaw
att,
MW
h =
meg
awat
t-ho
ur.
Not
e: Re
quire
d Ca
pacit
y and
Ene
rgy D
eman
d by
202
5 an
d 20
40 is
bas
ed o
n au
thor
’s ca
lculat
ion.
So
urce
: RO
MEL
CO (2
016)
.
MW
= m
egaw
att,
MW
h =
meg
awat
t-ho
ur.
Not
e: Re
quire
d Ca
pacit
y and
Ene
rgy D
eman
d by
202
5 an
d 20
40 is
bas
ed o
n au
thor
’s ca
lculat
ion.
So
urce
: BAS
ELCO
(201
6).
Tabl
e 5.2
3. R
OM
ELCO
’s Pr
ojec
ted
Ener
gy an
d Ca
pacit
y Req
uire
men
ts, 2
025
and
2040
Tabl
e 5.2
4. B
ASEL
CO’s
Proj
ecte
d En
ergy
and
Capa
city R
equi
rem
ents
, 202
5 an
d 20
40
App
licat
ions
2015
2025
2040
Inst
alle
d Ca
paci
ty (M
W)
Net
Ener
gyPr
oduc
tion
(MW
h)
Peak
D
eman
d,
MW
Ener
gy
Dem
and
(MW
h)
Requ
ired
Capa
city
(MW
)
Requ
ired
Ener
gy
(MW
h)
Peak
D
eman
d,
MW
Ener
gy
Dem
and
(MW
h)
Requ
ired
Capa
city
(MW
)
Requ
ired
Ener
gy
(MW
h)
(a)
(b)
(c)
(d)
(c –
a)
(d –
b)
(e)
(f)
(e –
a)
(f –
b)
Mic
ro h
ydro
0.9
4,87
92.
3510
,705
1.45
5,826
2.35
18,0
581.4
513
,179
Die
sel
7.48
12,0
342.
3115
,299
(5.17
)3,2
654.
6726
,480
(2.8
1)14
,446
Tota
l8.
3816
,913
4.66
26,0
04(3
.72)
9,09
17.0
244
,538
(1.3
6)27
,625
App
licat
ions
2015
2025
2040
Inst
alle
d Ca
paci
ty (M
W)
Net
Ener
gyPr
oduc
tion
(MW
h)
Peak
D
eman
d,
MW
Ener
gy
Dem
and
(MW
h)
Requ
ired
Capa
city
(MW
)
Requ
ired
Ener
gy
(MW
h)
Peak
D
eman
d,
MW
Ener
gy
Dem
and
(MW
h)
Requ
ired
Capa
city
(MW
)
Requ
ired
Ener
gy
(MW
h)
(a)
(b)
(c)
(d)
(c –
a)
(d –
b)
(e)
(f)
(e –
a)
(f –
b)
Mic
ro h
ydro
0.67
579
0.64
600
(0.0
3)21
0.64
600
(0.0
3)21
Die
sel
13.36
38,79
115
.1951
,388
1.83
12,59
726
.7091
,685
13.34
52,8
94
Tota
l14
.03
39,3
7015
.83
51,9
881.8
012
,618
27.3
492
,285
13.3
152
,915
138 Distributed Energy System in Southeast Asia
Envisaged Policies for Off-Grid DES
This section enumerates envisaged policies and support mechanisms to further promote the development of DES in off-grid areas.
Additional Incentives
Whilst the FiT system is applicable to on-grid renewable energy developers, the government is looking at relinquishing the FiT system because the mechanism is becoming a burden to electricity consumers as an added cost to the electricity bill. As a policy recommendation, now that the investment costs for putting up renewable energy systems have significantly gone down and are at par with other conventional technologies, the FiT system applied in the off-grid is one considerable policy measure envisioned to encourage private sector interest in developing renewable energy resources.
Power Capacity Portfolio
As a priority thrust in the main grid, the government embarked on a national policy towards institutionalising a 70–20–10 percentage sharing of the baseload, mid-merit, and peaking load categories as well as reserve capacity requirement equivalent to 25% of the total peak demand. Whilst the existing profile of DES in off-grid areas is notably dominated by diesel-based technologies, diversification of the capacity mix – coupled with an appropriate power capacity portfolio such as the one being instituted in the main grid – will unquestionably strengthen the adequacy, reliability, and affordability of electricity supply.
Energy Resiliency Policy
The Philippines, most especially its remote communities, have become more vulnerable to various forms of natural and man-induced disasters and calamities in the advent of climate change. For this reason, the government has drafted a policy measure that will extensively strengthen the resiliency of the energy infrastructure, be it on grid or off grid. This initiative is visualised to reinforce the energy infrastructure to withstand the impacts of uncontrollable disruptive events.
139139
Chapter 6Distributed Energy System in Thailand
Thailand's Electricity Supply Industry Structure
Thailand is one of the best known developing countries in ASEAN. With a population of about 70 million, its need for electricity is gradually increasing. The country’s electricity market is the wholesale market, which is the same as that of many developing countries. However, the wholesale electricity market in Thailand is regulated by the government and related organisations such as the Department of Alternative Energy Development and Efficiency, Energy Policy and Planning Office (EPPO), and the Ministry of Energy, Energy Regulatory Commission. The Electricity Generating Authority of Thailand (EGAT) produces and transmits electricity and the Metropolitan Electricity Authority (MEA) and the Provincial Electricity Authority (PEA) distribute it. Most of the distributed energy systems (DESs), known as small power producers (SPPs) and very small power producers (VSPPs), are connected to the distribution system of PEA and MEA. The transmission system in Thailand already covers 99% of residential areas (Figure 6.1).
Thailand's Electricity Situation
In 2016, per EGAT records, the net peak demand of Thailand of 30,973 MW occurred on Wednesday, 11 May 2016, at 14:00, higher than that in 2015 by 2,890 MW or 10.3%. Its 2016 total net energy demand was 196,868 GWh higher than that in 2015 by 7,347 GWh or 3.9%. The highest electricity consumption comes from the industrial sector (42%), followed by the residential sector (24%), the business sector (19%), and other sector (15%). The country’s electricity consumption in 2016 grew as expected because of Thailand's economic growth of 3.2%.
In 2016, its net power capacity amounted to 45,065 MW, comprising combined cycle power plant of 20,712 MW (49.8%), thermal power plant of 8,567 MW (20.6%), renewable energy of 7,196 MW (17.3%), cogeneration of 4,749 MW (11.4%), gas turbine and diesel power plants of 30 MW (0.1%), and power exchanges between
140 Distributed Energy System in Southeast Asia
Thailand and Malaysia of 300 MW (0.7%). Figure 6.2 shows that Thailand’s power system includes power generated by non-firm SPPs and VSPPs. It also shows the contract capacity on Thailand power system by power plant type in 2016.
Figure 6.1: Thailand National Power Grid
Source: GENI (2016).
141Distributed Energy System in Thailand
Figure 6. 2. Contact Capacity on Thailand Power System by Power Plant Type, 2016
Thailand System 45,065 MW
- EGAT System 41,556 MW
- VSPP + DEDE PEA Self-gen 3,509 MW
EGAT System41, 556 (MW)
Thermal8,567 MW
20.6%
Combined Cycle20,712 MW
49.8%
Gas turbine,Diesel
30 MW0.1%
Cogeneration4,749 MW
11.4%TNB
300 MW0.7%
Domestic Hydro3,500 MW
8.4%
Lao PDR Hydro2,105 MW
5.1%
Biomass & Others1,593 MW
3.8%
Renewables
Solar2,058 MW
59%
Biogas287 MW
8%
Biomass884 MW
25%
Cogeneration/Diesel67 MW
2%
Wind31 MW
1%Hydro
122 MW3%MSW
55 MW2%
VSPP+DEDE PEA Self-gen
TotalMW
DEDE = Department of Alternative Energy Development and Efficiency, EGAT = Electricity Generating Authority of Thailand, MW = megawatt, PEA = Provincial Electricity Authority, VSPP = very small power producer. Source: MOE (2015).
In terms of fuel consumption for electricity generation in 2016, natural gas had the highest share in Thailand’s generated power of about 63.5%, followed by lignite and import coal (22.3%), renewable energy comprising all types of renewable energy and hydropower from both neighbouring countries and domestic hydropower (13.7%), and others (0.5%). Figure 6.3 shows the energy generation by fuel type in 2016.
142 Distributed Energy System in Southeast Asia
Current Situation of Thailand’s Distributed Energy System Thailand’s total generation installed capacity, as of March 2017, was about 55,600 MW. (The total capacity reported is the total generation installed capacity including independent power systems. Thus, the number in this report is higher than other official national power development plans (PDPs) which excludes the independent power systems). The main fuel used for Thailand’s electricity generation is natural gas. The installed capacity of natural gas–fired power plants is about 62%; of coal-fired power plants, 7.7%; bunker oil and diesel oil power plants, 1%; of hydro power plants, 8%; and of renewable energy, 13.1% (Figure 6.4). Main proportions in renewable energy capacity are biomass and solar photovoltaic (PV), which are estimated to be 5.7% and 4.9% of total capacity, respectively.
Existing Policies to Promote Distributed Energy Systems
The Royal Thai government, like many other countries, is concerned about promoting renewable energy. However, power generation costs from some renewable energy resources are still higher than those of conventional energy resources, such as coal, natural gas, and hydro, while renewable energy has been promoted to address global
Figure 6.3. Energy Generation by Fuel Type, 2016
Natural Gas124,761 GWh
63.5%
Lignite25,727 GWh
13.1%
Imported Coal18,020 GWh
9.2%
HVDC Malaysia115 GWh
0.06%
Diesel & Fuel Oil912 GWh
0.5%
Domestic Hydro3,540 GWh
1.8%
Renewable Energy12,262 GWh
6.2%Imported Hydro11,068 GWh
5.6%
196,405 GWh
GWh = gigawatt-hour, HVDC = high voltage direct current.Source: MOE (2015).
143Distributed Energy System in Thailand
Figure 6.4. Proportion of Installed Capacity by Fuel Type
Source: MOE (2015).
warming and climate change issues. Thus, the Thai government has been exerting efforts to reduce carbon dioxide (CO2) emission by gradually promoting renewable power into the power system. The government has been pushing forward the Alternative Energy Development Plan (AEDP), Figure 6.5, for Thailand to become a low-carbon society.
In the past, to attract investors, the Adder System1 was applied to encourage renewable power generation. Nowadays, the Feed-in Tariff (FiT) mechanism is being implemented to reflect the real cost of generating renewable power and to specify the time frame of purchasing. The plan intended to encourage waste (garbage), biomass, and biogas power generation as the priority. According to the plan, the potential of generating power from waste is 500 MW. However, the potential power generation from biomass would be 2,500 MW. The policies of the Ministry of Agriculture and Cooperatives (Thailand) to increase the plantation area of sugar cane and palm, as well as to raise productivity of cassava from 3.5 to 7 tons per Rai (or 0.4 Acre) per year, could provide feedstock for biomass power generation up to the capacity of 1,500 MW. In addition, area by area zoning and limited power generation capacity measures were adopted to prevent challenges from the previous plan. Technology improvement is expected to build the competitiveness of renewable energy over that of conventional energy,
1 The Thai government has applied the premium model of feed-in tariff (FIT), or generally called ‘Adder’ since 2007. The premium rates and support duration will be differentiated by renewable energy type. Power utilities will buy electricity from producers at a rate equal to the base tariff, plus the wholesale fixed tariff and Adder. The Adder will be passed on to consumers in the form of the retail fixed tariff. Therefore, in no case will the electricity tariff burden on the people will increase due to the duplication of revenue of producers, except the base tariff is reviewed by including the retail fixed tariff.
144 Distributed Energy System in Southeast Asia
especially liquefied natural gas. The main target of the AEDP is to increase the portion of renewable energy generation from 8% to 20% of the total power requirement in 2036, which accounts for a total of 19,684.4 MW.
According to the plan, SPPs and VSPPs, which can be accounted as DES, will be included in the plan. The estimated capacity of the future DES will later be discussed.
Figure 6.5. Alternative Energy Development Plan
Table 6.1. The Current Renewable Energy Tariff
MSW = Municipal Solid Waste, MW = megawattSource: EGAT (2017).
Type Solar Wind Hydro MSW Biogas Biomass Energy Crop Total
End of 2014 1,298.5 224.5 3,048.4 65.7 311.5 2,541.8 - 7,490.4
End of 2036 6,000 3,002 3,282.4 500 600 5,570 680 19,634.4
Figure 6.6. Current Proportion of DES Capacity to Total Thailand Capacity
Estimation of Current DES Status both On Grid and Off Grid
According to the assumptions of studies by the Economic Research Institute for ASEAN and East Asia (ERIA), the solar farm, solar PV, and small hydro under 50 MW are accounted for as DES. Coal, gas, geothermal, solar thermal, waste incineration plants, and biomass thermal plants under 100 MW are likewise accounted for as DES. The current installed capacity status estimates the total DES capacity (both on grid and off grid) calculated based on the above DES definition to be 7,500 MW. Therefore, DES makes up about 14% of total capacity (Figure 6.6).
ERIA’s definition of off-grid is slightly different from the one this study. In this study, off-grid power plants are those that are not connected as a supply to the main national grid (EGAT grid) but those connected to the national grid to use the national grid as back-up. In this case, we define it as independent power system and it is accounted as off-grid. Also, the off-grid power plants in this study are those connected to the independent distribution grid (PEA and MEA that are not connected to the main national grid). The independent distribution grids are used on islands and in some rural areas. Hence, based on the definition of off-grid in this report, off-grid DES installed capacity is about 940 MW, which is about 2% of the total installed capacity of Thailand. Obviously, from the total of 14% DES, the on-grid DES is estimated to be 6,570 MW, which is 12% of the total capacity of Thailand. From 7,500 MW of DES-installed capacity, the renewable DES–installed capacity is about 6,500 MW or 86% of installed DES capacity. The
DES = Distributed Energy System.Source: Authors' estimation.
146 Distributed Energy System in Southeast Asia
renewable- installed capacity is 12% of Thailand's total capacity. The major fuel types contributing to DES capacity are biomass (40%) and solar (30%) (Figure 6.7). Biomass and solar currently play a major role in DES since the government has promoted biomass and solar in the 2010 AEDP.
Figure 6.7. Current Proportion of DES Capacity by Fuel Type
Source: Authors' estimation.
Areas that use on-grid and off-grid DES
Most of Thailand’s DESs are connected on grid. The off-grid capacity of DES is only about 13% of total DES capacity in Thailand. Most of the 940 MW of the off-grid DES capacity (about 870 MW) is being used in industrial areas. Only 55 MW is used in remote residential areas, which include deep forest and remote mountainous villages.
The rest, approximately 15 MW, is used on islands. Therefore, about 93% of off-grid DES capacity is used in industrial areas, about 6% is used in remote residential areas, and about 1% is used on islands (Figure 6.8).
Diversity, security, and CO2 reduction
Currently, DES in Thailand, which consists of many types of fuel in the generation mix, is one factor that increases the diversity of the total fuel mix in the country’s generation capacity. Since most of the fuel used is natural gas, which is more than 60% of the total, the increase of biomass and solar in DES helps reduce the use of natural gas and results in the diversity of fuel mix. However, DESs in Thailand are not only for diversity
147Distributed Energy System in Thailand
Figure 6.8. Off-grid Electricity Area
Source: Authors' estimation.
and security but also for reducing electricity cost in industrial areas, for the return on investment of the government’s promotion of FiT, and for the electricity need in some remote areas and islands.
The energy generated by solar, wind, and hydro from DES in Thailand is about 5.34 million MWh. Thus, CO2 reduction using the factor of 7.30x10⁻⁴ metric tons CO2/kWh is about 3,760 million metric tons CO2 per year.
Estimation of Future DES in Thailand and Its Growth Opportunity
The government had already promoted renewables in its past PDPs. It continues to promote renewables into the system. Therefore, DES in Thailand tends to grow every year. The proportion of DES is expected to increase from 14% at 2017 to 23% at 2036. Figure 6.9 shows the estimated DES capacity according to the PDP.
Until 2036, the government’s policy is to increase DES, including SPPs and VSPPs and renewables more than 10,000 MW, especially focusing on solar and biomass due to their potential. The government also has a policy to subsidise the cost of renewables using FiT. Thus, there are still a lot of opportunities to invest in DES in Thailand according to the policies. Yet, there is almost no room to increase electricity coverage in Thailand since it is already 99%. Therefore, on-grid DES is expected to grow much more than off-
148 Distributed Energy System in Southeast Asia
grid DES in the near future, according to the PDP. However, if the levelised off-grid DES electricity cost is lower than the retail electricity price provided by MEA and PEA, the off-grid capacity might skyrocket in the future.
Figure 6.9. Estimated DES Capacity in Thailand, 2017–2036
DES = Distributed Energy System.Source: Authors' estimation.
Until 2036, the government’s policy is to increase DES, including SPPs and VSPPs and renewables by more than 10,000 MW, especially focusing on solar and biomass due to their potential. The government also has a policy to subsidise the cost of renewables using FiT. Thus, there are still a lot of opportunities to invest in DES in Thailand according to the policies. Yet, there is almost no room to increase electricity coverage in Thailand since it is already 99%. Therefore, on-grid DES is expected to grow much more than off-grid DES in the near future, according to the PDP. However, if the levelised off-grid DES electricity cost is lower than the retail electricity price provided by MEA and PEA, the off-grid capacity might skyrocket in the future.
Current cost of on-grid and off-grid, estimation of future cost of wind and solar compared with the retail electricity price in Thailand
Today, the cost of large-scale electricity production in Thailand is still lower than the levelised DES electricity cost. Large-scale utility power plants provided by EGAT offer reasonably low prices for consumers; thus, DES cost in Thailand is still not competitive. In the case of unsubsidised DES cost through FiT, the national grid cost plus the provided electricity cost in most remote areas is still lower than the DES off-grid cost.
149Distributed Energy System in Thailand
Figure 6.10. Comparison of Estimated Price of Electricity in Thailand
LCOE = levelised cost of electricity.Source: Authors' estimation.
The levelised cost of electricity (LCOE) of wind and solar is dropping sharply, and battery cost is decreasing annually. Hence, if future DES cost is anticipated to be lower than the retail electricity price, then DES will rapidly grow. The LCOE of solar and wind is expected to go below 1.5 baht (B)/kWh in 2036 (Source: Bloomberg new energy finance); battery capital expenditure cost is also expected to fall below 10 million B/MWh before 2022 (Seba, 2014). According to these assumptions, the residential self-generation electricity cost will be lower than the retail electricity price in 2022. Figure 6.10 compares the price of solar cell combined with that of battery electricity and the retail electricity price in Thailand when using 10 kWh/day.
In conclusion, current DESs in Thailand are mainly used in the private industrial section and investment in accordance with Thai government policy. The main types of DES being promoted in the country are solar and biomass. The on-grid DES in Thailand is expected to grow in the near future. DES is estimated to grow at 10,000 MW. However, the off-grid DES demand can skyrocket when the price of self-generation electricity falls below that of the electricity retail price.
150 Distributed Energy System in Southeast Asia
Thailand’s DES Policy
The new Cabinet formed in 2014 initiated the direction of Thailand’s Energy 4.0. The Ministry of Energy of Thailand focused Energy 4.0 on the Thailand Integrated Energy Blueprint to drive the country’s energy innovation and continue the desire of King Rama IX to strengthen families and communities.
The Energy Policy on the Electricity Sector (Energy 4.0) is shown in Figure 6.11. To enhance the power sector, the Ministry of Energy has set policies related to DES in two areas: 1. unbalanced fuel diversification and unstable renewable generation, and 2. centralisation of generation and distribution systems with high investment in transmission system.
Case Study on Thailand's Smart Grid Projects
The pilot programme included in the expedition plan of the Ministry of Energy, administration by the Energy Planning and Policy Office comprises three pilot projects: 1. Mae Hong Son smart grid, Muang district, Mae Hong Son province, operated by EGAT, 2. Micro Grid project in Mae Sariang district, Mae Hong Son province, operated by PEA. 3. Smart Grid project in Pattaya area Chonburi province, operated by PEA.
The Pilot Project of Mae Hong Son Smart Grid, Muang District, Mae Hong Son Province
The province of Mae Hong Son is preserved forest. It is the only province in Thailand where the electricity transmission system of EGAT is not accessible. Currently, electricity in the Mae Hong Son area is generated from various energy sources. Some of the electricity has to be distributed from the PEA's power distribution system through densely forested areas; Mae Hong Son province then has frequent power failures due to falling trees. Reliability and quality of electricity are important issues to be addressed in this area.
As a result, EGAT developed a smart grid as a pilot project in the Muang District of Mae Hong Son Province to make the power system in the district more stable. Mae Hong Son
151Distributed Energy System in Thailand
Figure 6.11. Energy Policy on the Electricity Sector (Energy 4.0)
Source: Authors' estimation.
is considered appropriate for the implementation of the pilot programme. Because of the location of the project, it is possible to control and operate the system together with the PEA Micro Grid System at Mae Sariang.
EGAT has an approved budget of B720 million for the project. To accelerate the smart grid operation, immediate action modifications have been made to the project, which covers smart grid technology and extends to a broader scope. An additional budget of B361 million has been proposed, leading to a total budget of B1.081 billion for this project.
To En
hanc
e Pow
er Se
ctor
Presently Key Measures 2017-2018 Target 2036
Unbalanced fuel diversification and unstable RE generation
• RE Generation Plan by Region• Firm RE & Energy Storage
System• More Transmission System for
RE
• Less Natural Gas in Gen. Mix (from 64% to 37%)
• More RE (from 8% to 20%)• More Coal (from 18% to
23%)• More Power Import (from
10% to 20%)Not Full Capacity of Generation & Transmission System Utilization
• Power Pool Market for old and high potential power plants
• Merit Order (with less constraints)
• Power Purchase from Neighboring Countries
• ASAN Hub on Electricity• Competitive electricity
tariff to ASEAN Countries
Inefficient Use of Electricity
• Change/Use High Efficient Equipment
• Block Grant/Matching Fund (Gov’t Hospitals)
• HEPs / MEPs• Building Code• ESCO
• Energy Saving by 89,000 GWh
• Not to Construct New Power Plants 10,000 MW (equivalently)
Centralised of Generation & Distribution System with High Investment of TX System
• Decentralised Generation System (Distributed Generation: DG)
• Micro Gris Pilot Projects
• Decentralised Power System
• Less Investment in Tx System
• Smart Power System• Smart Grid
INNOVATION • Micro Grid
• SMART Energy Management
• SMART Grid
• Energy Storage System• SPP Hybrid Firm/VSPP
Firm• Next Generation of
Renewable
152 Distributed Energy System in Southeast Asia
Figure 6.12. The Pilot Project of Mae Hong Son Smart Grid of EGAT
BEMS = Building Energy Management System, EGAT = Electricity Generating Authority of Thailand, EV = electric vehicles, HEMS = Household Energy Management System, PV = Photovoltaic, TX = transmission system. Source: EGAT (2017).
The Pilot Project of Micro Grid, Mae Sariang District, Mae Hong Son Province
The power system in Mae Sariang district, Mae Hong Son province, is supplied from Hod substation, which is about 110 kilometres away, and through the forest (Figure 6.13). These areas are those where electricity is generated from several sources, such as the PEA’s diesel power plant, the small hydropower plant of the Department of Alternative Energy Development and Efficiency (DEDE), the solar power plant of VSPPs, diesel emergency generators of large consumers, etc. However, these power sources have unstable and inadequate generation capacity, resulting in poor power quality and causing frequent power failure
PEA has conducted a pilot project in this area to study and develop the micro-grid controller for planning and operating power systems with various types and sizes of power generation. With highly unstable generation of renewable energy, to maximise the potential of the power system to increase its security, and to ensure reliability and overall power quality as a whole.
153Distributed Energy System in Thailand
At present, PEA has an approved budget of B265 million. To accelerate the concrete smart grid operation, as part of the short-term expediting programme, the details of the project including smart grid technology and the broader scope of operations have been expanded. An additional budget of B582 million has been proposed, leading to a total budget of B847 million for this PEA project.
The Pilot Project of Smart Grid in Pattaya City Area, Chonburi Province
The smart grid project in Pattaya City Area, Chonburi Province, is the first smart grid project of PEA. The Pattaya area was selected because it was considered appropriate and ‘ready’ in many aspects. It has major cities with high electricity demand, wide distribution of power consumers (residential, office buildings, hotels, businesses, and industrial sectors), and integrated communication and technologies. Pattaya City also has a policy to develop into a smart city, so it is appropriate to demonstrate new technologies; the infrastructure of the communication system is quite ready in that area.
Presently, PEA has an approved budget of B1,069 million. To accelerate the concrete operation of the smart grid, as part of the short-term expediting programme, the details of the project including smart grid technology and additional operations have been expanded. An additional budget of B439 million has been proposed, leading to a total budget of B1.508 billion for this PEA project.
Figure 6.13. The Pilot Project of Micro Grid, Mae Sariang District, Mae Hong Son Province, PEA
Source: Energy Policy and Planning Office (2017).
154 Distributed Energy System in Southeast Asia
Figure 6.14. The Pilot Project of Smart Grid in Pattaya City Area, Chonburi Province, PEA
Source: Energy Policy and Planning Office (2017).
155155
Chapter 7Conclusions and Policy Implications
ASEAN
The ASEAN primary energy supply is projected to increase from 592 Mtoe in 2013 to 1,697 Mtoe in 2040, representing more than threefold increases during this period. This increase in energy demand will put pressure on energy security, access, and price. Thus, the study of distributed energy system (DES) is explored as part of the energy system that could promote energy access more efficiently at lower costs. The study found that DES is a modern small power generation system that is flexible in providing electricity to end users more effectively due to lower investment cost and easier handling compared with large national power plants and grids. If it is to be widely deployed, DES could also help to address the daunting issue of electricity access to about 130 million people whose rights have been denied. The flexibility of DES at multiple locations through the increasing availability of small power generation has been applied. Thailand’s small power producers (SPPs) and very small power producers (VSSPs) have been widely used and their current share of 17.4% in the power generation mix in 2014 is expected to increase significantly.
At the ASEAN level, the idea of transboundary grids is being promoted in the ASEAN Power Grid. This grid is expected to make a major contribution to maximising ASEAN’s benefit in avoiding the cost of power generation. However, it is expensive and it may take years to realise the connectivity. In contrast, DES can overcome cost constraints that typically inhibit the development of large capital projects and transmission and distribution lines. Thus, DES will be widely used. The modern grid system is also expected to handle the integration of DES into the grid system. DES could be a stand-alone power generation or connected to the power grid. So, its application is also very suitable for mountainous terrain, islands, and remote rural areas.
The study also estimated the DES-related renewable capacity and needed investment at the ASEAN level. The estimated power generation from combined renewable energy such as wind, solar photovoltaic (PV), geothermal, hydropower, and biomass in ASEAN
156 Distributed Energy System in Southeast Asia
will increase significantly from the business-as-usual scenario (BAU) to the alternative policy scenario (APS); it also implies investment opportunities in this sector. Investment opportunities by 2040 in BAU for combined solar, wind, biomass, hydropower, and geothermal are estimated at US$34 billion, and in the APS at US$56 billion. Amongst DES-related renewable investment opportunities, those for solar and geothermal power are expected to double from BAU to the APS. Wind will increase more than threefold in terms of investment required to meet the expected generation output by 2040.
The introduction of DES also implies reduced CO2 emission. The study estimates that BAU would lead to a reduction of 46.1 million metric tons of CO2 emission and that the APS could lead to a reduction of 64.6 million metric ton of CO2.
Indonesia
DES can be implemented in regions like Indonesia where grid-connected electricity supply is unavailable or uneconomically viable. It can be implemented in Indonesia to support the electrification faster than by waiting for supply from a grid connection. DES is cost competitive compared with current diesel power plants. As DES projects use local energy resources, and are not necessarily technology intensive, these projects may also increase the involvement of local people in the construction and maintenance of the system. This may create jobs in the region.
As the potential of DES is huge in Indonesia, its development can be even faster with the participation of local governments, for example by providing free land for the sites of DES projects. To optimise the development of DES projects and ensure their sustainability, government support – such as tax incentives, longer term low-interest loans, and a streamlined licensing process – is needed. Good electricity tariffs for DES that take account of production costs and reasonable margins are also needed.
Malaysia
The implementation of DES is very important for the security of supply, especially for remote areas where the connectivity is far from the grid. To ensure the stability of electricity supply without disruption, equipment and other requirements for electricity generation should be properly installed and completed. DES is now the potential solution for this problem. Installing the transmission or distribution line to the national grid from remote areas is costlier. By using existing natural resources, such as biomass or biogas, DES can also reduce greenhouse gas (GHG) emissions.
157Conclusions and Policy Implications
Through DES, rural areas can achieve an electrification rate of 100%. Providing this basic amenity will help generate income for the economy. DES will also help boost tourism on several of Malaysia’s islands. With some remote islands in the country located far from the national grid system, the implementation of DES will be a great solution. Public and private funds are needed to ensure the success of DES’ implementation. Government can offer attractive incentives to attract local and international investors.
Philippines
Evidently, the underlying principles of DES present substantial potentials that correspond to the current setting of the Philippine electric power industry, either through on-site embedded generation or stand-alone off-grid systems.
As the government aspires to bring inclusive economic development to the grassroots level, the concept of DES applications undeniably portrays an integral role in ensuring the security of energy supply in the flourishing economic and industrial zones of the country and, more importantly, of the remote communities.
Government has recognised that the deployment of DES applications is an alternative platform to complement centralised and decentralised electrification initiatives.
Harnessing the full potential of the cleaner set of fuels such as renewables is admittedly an effective mitigating measure to drastically reduce GHG emissions. This in the long run is foreseen to counter the adverse impacts of climate change. To take full advantage of this benefit, the country should pursue the development and increased use of indigenous renewable energy sources that are abundant in rural locations. But strong policy support and mechanisms from the government are imperative.
Fundamentally, DES applications are intended to provide an affordable and reasonable source of electricity. But because the private sector lacks confidence to invest in the off-grid generation business, the national government assumes responsibility for bringing the necessary electricity services to spur local economic development. To sustain the operations of DES in off-grid communities, government subsidises the costs of generating power. In turn, DESs have become costly compared with grid-connected power systems.
Moving forward, the Department of Energy, the government arm overseeing the local energy sector, has come up with the following initiatives to foster the development of and promote DESs in the country. Amongst others, the government is inclined to:
158 Distributed Energy System in Southeast Asia
ɂ Conduct studies that will strengthen the existing DESs. ɂ Declare and include future DESs as energy projects of national significance. ɂ Regularly update the Missionary Electrification Development Plan. ɂ Pursue and intensify the private sector participation programme. ɂ Accelerate the promotion, utilisation, and development of renewable energy as
DESs. ɂ Explore emerging technologies that may be considered DESs. ɂ Develop and propose regulatory instruments that will open favourable opportunities
to prospective private investors. ɂ Periodically review and assess existing policies, programmes, and mechanisms that
will safeguard the interest of both public consumers and private investors. ɂ Pursue envisaged policies that are practicable and applicable to DESs. ɂ Study and implement a subsidy graduation programme for DES. ɂ Refurbish, rehabilitate, and upgrade old DES operated by the state-owned National
Power Corporation – Small Power Utilities Group of the (NPC–SPUG).
Thailand
DES has been widely applied in Thailand through small power producers (SPPs) and very small power producers (VSPPs). The current share of DES in Thailand is about 17.4% of the power generation mix, and its share and capacity will increase significantly in the future. Thailand’s experience could provide the best example for other ASEAN countries to use DES to respond to increasing energy demand.
DESs in Thailand are mainly used in the private industrial sector and investment in accordance with the government’s policy on subsidy. DESs in Thailand mainly promote solar and biomass. The on-grid DES of the country is expected to grow in the near future. Per the current policy on DES, about 10,000 MW DES growth is expected. However, off-grid DES demand could skyrocket when the price of self-generated electricity is lower than that of retailed electricity.
The new Cabinet provided the direction of Energy 4.0. To accommodate the government’s policy, the Ministry of Energy has kept the Energy 4.0 policy focused on the Thailand Integrated Energy Blueprint to drive energy innovation and given King Rama IX’s desire to strengthen families and communities. To enhance the power sector, the Ministry of Energy has set policies on DES in two areas – for places that experienced unbalanced fuel diversification and unstable renewable generation, and for places where the centralised generation and distribution system was faced with high investment in the transmission system.
159Conclusions and Policy Implications
Policy Implications for DES in ASEAN
DES offers emerging ASEAN countries one of the best options in responding to increasing energy demand and providing energy access to remote rural, mountainous, and island areas, and economic zones as stand-alone generator or combined with the grid system. The promotion of DES is crucial, but DES will need careful policy support if it is to deploy renewable energy. Basically, the policies will work around reducing upfront investment costs of DES-related renewable generation. Those friendly policies are the required top-down renewable energy targets such as renewable portfolio standards and other policies; fiscal incentives such as exemptions from taxes (value added, fuel, income, import and export, and local taxes); and accelerated depreciation through premium tariff rates such as a feed-in tariff. ASEAN could consider the introduction of carbon tax in the future. Banking institutions will need to enlarge their role and policy to finance DES-related renewable energy and find mechanisms to minimise risks, and to increase the profitability aspects of DES-related renewable investments. DES-related investment opportunities are large, and will provide jobs and many business opportunities to people and communities. DES is one of the modern generation systems and its deployment will also help address national energy security.
References
ASEAN Centre for Energy (ACE) (2013), ASEAN Guideline on Off-grid Rural Electrification Approaches. Jakarta: ACE.
ACE (2016), ASEAN Renewable Update Targets – Update from ASEAN Guideline on Off-grid Rural Electrification Approaches. Power point presentation at the Regional Workshop on Overcoming Critical Bottlenecks to Accelerate Renewable Deployment in ASEAN+6 countries, organised by International Renewable Energy Agency (IRENA) and United Nations for Economic and Social Commission for Asia and Pacific (UNESCAP) in Bangkok, Thailand, 14–15 June 2016.
Asian Power (2013), Retrieved from http://asian-power.com/project/news/distributed-generation-comes-philippines
Bangko Sentral ng Pilipinas (2017), ‘Foreign Exchange Rate’, Retrieved from http://www.bsp.gov.ph/statistics/sdds/RERB/30%20May%202017.pdf (accessed 26 October 2017)
Basilan Electric Cooperative, Inc. (BASELCO) (2016), ‘Distribution Development Plan’, Manila: Department of Energy. Downloadable at https://www.doe.gov.ph/sites/default/files/pdf/electric_power/medp_2016-2020.pdf (accessed 29 January 2018)
Bloomberg New Energy Finance (2018), Today’s Potential, Tomorrow’s Energy. https://about.bnef.com/ (accessed 11 October 2017)
Brandon, O. (2014), The Rise of Distributed Power. General Electric Company.
Cahiles–Magkilat, B. (2005), ‘UPPC to Invest P1.58 B in Power Plant Project; Majority Thai-Owned Firm’, https://www.highbeam.com/doc/1G1-126838544.html (accessed 12 October 2017)
Castlerock Consulting (2014), Mid-Term Report (Final): Least-Cost Electrification Plan for the Iconic Island, 2014. Retrieved from http://castlerockasia.com/sumba/Final%20Mid-Term%20Report%20141208.pdf (accessed 10 August 2017)
Department of Alternative Energy Development and Efficiency (DEDE) (2016), Thailand’s Energy Saving Company (ESCO) Fund. Bangkok: DEDE.
161References
Department of Energy (DOE) (2016), ‘Department of Energy Distribution Development Plan for Off-Grid Database’, Taguig, Philippines: DOE.
Directorate General of New Renewable Energy and Energy Conservation (2017), Database of the Directorate General of New Renewable Energy and Energy Conservation, Jakarta, Indonesia.
Economic Research Institute for ASEAN and East Asia (2015), JICA Electric Power Master Plan Study and Energy Outlook and Saving Potential in East Asia (EOSP). Data derived from both sources with further calculations by the author of this book.
EMP (2014), Myanmar´s Energy Master Plan. Nay Pyi Taw, Myanmar.
Energy Commission of Malaysia (2015), ‘Performance and Statistical Information on Electricity Supply Industry in Malaysia’, Putrajaya, Malaysia: Energy Commission, http://meih.st.gov.my/documents/10620/f34c62ce-b169-4729-b4e8-854bb5016922
Energy Policy and Planning Office (2017a), ‘Thailand’s Smart Grid Drive,’ Downloadable at
http://www.thai-smartgrid.com/แผนการขับเคลื่อนการดำาเ/(accessed 1 August 2017)
Energy Policy and Planning Office (2017b), ‘High Renewable Penetration,’ Downloadable at http://www.eppo.go.th/images/Power/pdf/smart_grid_actionplan.pdf (in Thai) (accessed 1 August 2017)
Energy Policy and Planning Office (2017c), Retrieved from http://www.eppo.go.th/images/Infromation_service/public_relations/PDF/Energy%204.0%20policy.pdf (accessed date 27 June 2017)
Energy Policy and Planning Office (2016) Energy 4.0. Downloadable at http://www.eppo.go.th/images/Infromation_service/public_relations/PDF/ Energy%204.0%20policy.pdf (accessed 16 November 2016).
Energy Regulatory Commission (ERC) (2017), Resolution No. 1 series of 2017, Pasig, Philippines: ERC.
Energy Regulatory Commission (ERC) (2012) Resolution No. 10 series of 2012, Pasig, Philippines: ERC.
Energy Regulatory Commission (ERC) (2010), Resolution No. 16 series of 2010, Pasig, Philippines: ERC.
162 Distributed Energy System in Southeast Asia
Felda Palm Industries Sdn. Bhd. (2015), Company Overview of Felda Palm Industries Sdn. Bhd. Malaysia.
Gatdula, D. (2010), ‘ERC okays Negros co-op, San Carlos Bioenergy deal’, The Philippine Star, 15 January, http://www.philstar.com/business/540465/erc-okays-negros-co-op-san-carlos-bioenergy-deal (accessed 22 November 2017)
Global Energy Network Institute (GENI) (2016), National Electricity Transmission Grid of Thailand, http://www.geni.org/globalenergy/library/national_energy_grid/thailand/thainationalelectricitygrid.shtml (accessed 10 July 2017)
Government of Indonesia and ADB (2014), ‘Mid-Term Report (Final): Least-Cost Electrification Plan for the Iconic Island 2014,’ Indonesia.
Khin Seint Wint (2014), Renewable Energy Association of Myanmar. Data taken from the power point presentation of Khin Seint Wint.
Kimura, S. and P. Han (2016), Energy Outlook and Energy Saving Potential in East Asia 2016. Jakarta: Economic Research Institute for ASEAN and East Asia Publication.
Malaysian Green Technology Corporation (MGTC) (2017), Malaysia Grid Electricity Emission Factor for 2015. Kuala Lumpur: MGTC.
Ministry of Energy and Mineral Resources of the Republic of Indonesia (MEMR) (2017), National Energy General Plan (RUEN), Database of the Generation. Jakarta: MEMR.
Ministry of Energy and Mineral Resources (2016) RUPTL PLN 2016–2025. Downloadable at http://www.djk.esdm.go.id/pdf/RUPTL/RUPTL%20PLN%202016-2025.pdf (accessed 20 April 2018)
Ministry of Energy (MOE) (2016), Alternative Energy Development Plan (AEDP) 2012–2021. Bangkok: MOE.
Ministry of Energy (MOE) (2015), Thailand Power Development Plan 2015–2036. Bangkok: MOE.
Ministry of Energy and Mineral Resources of the Republic of Indonesia (MEMR) (2016), Statistics of New Renewable Energy and Energy Conservation (2016), Database of the Generation. Jakarta: MEMR.
Ministry of Energy and Mineral Resources of the Republic of Indonesia (2015), Statistics of New Renewable Energy and Energy Conservation (2015). Database of the Generation. Jakarta: MEMR.
Ministry of Natural Resources and Environment of Malaysia (2011), Second National Communications (NC2) Study. Kuala Lumpur: MNREM): Publisher.
163References
National Electricity Transmission Grid of Thailand (2016), The National Grid. Downloadable at http://www.geni.org/globalenergy/library/national_energy_grid/thailand/thainationalelectricitygrid.shtml (accessed 10 July 2017)
National Energy Balance (2015), National Energy Balance, Energy Commission of Malaysia.
National Energy Balance (2014), National Energy Balance, Energy Commission of Malaysia.
National Energy Management Committee (2014),
Oil Palm Based Resources for Bioenergy: Sustainability and Challenges by Felda Palm Industry Sdn. Bhd. (IRENA: Bioenergy Forum 2014, Bangkok). Thailand.
Philippine Department of Energy (DOE) (2016a), ‘Power Development Plan 2016–2040’, Taguig, Philippines: DOE.
Philippine DOE (2016b). Power Statistics. Taguig, Philippines: DOE.
Philippine Department of Energy. (2015). Existing Off-Grid Power Plants. Taguig, Philippines: DOE.
Philippine DOE (2015a), Generation Data of Embedded/Self-Generating Generators. Taguig, Philippines: DOE.
Philippine Department of Energy (2015b), Generation Data in Off-Grid Areas. Taguig, Philippines: DOE.
Philippine DOE (2015c), Off-Grid Electric Cooperative Rates. Taguig, Philippines: DOE.
Philippine Economic Zone Authority (2016), Philippine Economic Zone Authority. Retrieved from http://www.peza.gov.ph/index.php/economic-zones/list-of-economic-zones (accessed 26 July 2017)
Ranada, P. (2013), ‘Green revolution in San Carlos city’, Rappler, 19 December. Retrieved from http://www.rappler.com/video/reports/46278-green-revolution-san-carlos-city (accessed dd-mm-year)
Romblon Electric Cooperative, Inc. (ROMELCO) (2016), Distribution Development Plan. Taguig, Philippines: DOE.
Seba, T. (2014), Clean Disruption of Energy and Transportation. Silicon Valley, CA: Clean Planet Ventures.
Sustainable Energy Development Authority of Malaysia (SEDA) (2017), ‘FiT System in Malaysia’, Putrajaya, Malaysia: SEDA.
Transparency Market Research (2016), ‘Distributed Energy Generation Systems Market – Global Industry Analysis, Size, Share, Growth, Trends and Forecast 2012–
164 Distributed Energy System in Southeast Asia
2022’, Retrived at [ https://www.marketsandmarkets.com/Market-Reports/distributed-generation-market-67245289.html?gclid=EAIaIQobChMI887S95bu3AIVzBwrCh16PAVrEAAYASAAEgJR2PD_BwE]. Accessed date 14 August 2018.
US Energy Information Administration (EIA) (2016), ‘Levelized Cost and Levelized Avoided Cost of New Generation Resources’, in Annual Energy Outlook 2016. Downloadable at https://www.eia.gov/outlooks/aeo/pdf/electricity_generation.pdf (accessed 16 August 2017)
US Environmental Protection Agency (EPA) (2016), ‘GHG Equivalencies Calculator – Calculations and References’, https://www.epa.gov/energy/ghg-equivalencies-calculator-calculations-and-references (accessed 16 November 2016).
United States Environmental Protection Agency (EPA) (2017), EPA.gov. Retrieved from https://www.epa.gov/energy/greenhouse-gases-equivalencies-calculator-calculations-and-references
World Bank (2018), World Development Indicators (WDI), Data Catalog. Retrieved from https://datacatalog.worldbank.org/dataset/world-development-indicators (accessed 14 August 2018)
World Bank (2015), ‘International Development Association Project Appraisal Document’, Report Number, PAD 1410, Washington, DC: World Bank.
Zabaleta, J.M. (2012), ‘Bronzeoak Philippines: A Profile’, Retrieved from http://philippinen.ahk.de/fileadmin/ahk_philippinen/EF_Presentations/Mr._Zabaleta_s_Presentation.pdf