Distribution and Ecology of Terrestrial Gastropods in Northwestern Minnesota Final Report: 2001-2002 Natural Heritage and Nongame Research Program Division of Fish and Wildlife Minnesota Department of Natural Resources St. Paul, Minnesota Jeffrey C. Nekola Department of Natural and Applied Sciences University of Wisconsin – Green Bay Green Bay, Wisconsin 54322 July 10, 2002
Transcript
1
Distribution and Ecology of Terrestrial Gastropods
in Northwestern Minnesota
Final Report: 2001-2002 Natural Heritage and Nongame
Research Program Division of Fish and Wildlife
Minnesota Department of Natural Resources St. Paul, Minnesota
Jeffrey C. Nekola Department of Natural and Applied Sciences
University of Wisconsin – Green Bay Green Bay, Wisconsin 54322
July 10, 2002
2
1
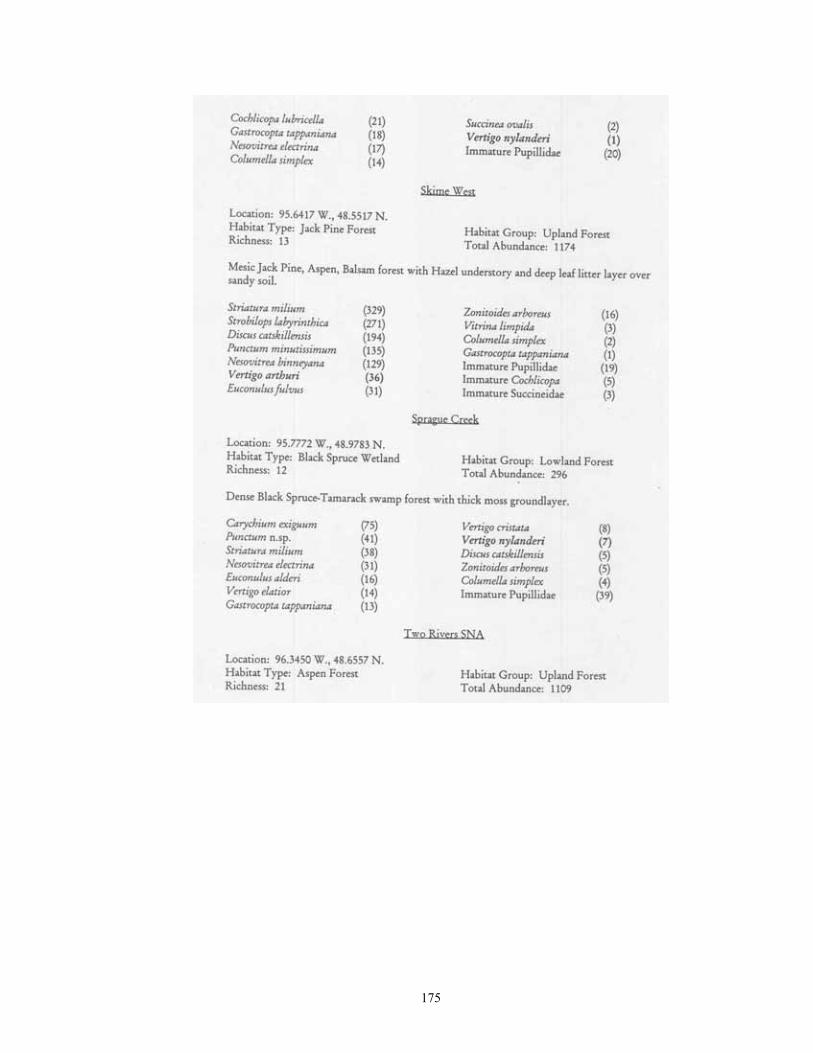
INTRODUCTION Minnesota has one of the most poorly known land snail faunas in the eastern U.S. (Hubricht 1985). Prior to 1999, 60 terrestrial gastropod taxa had been reported from the state (Dawley 1955, Hubricht 1985, Ostlie 1991). Of these, only 23 had been recorded from northwestern Minnesota (Hubricht 1985). - Fully 22% of Minnesota's land snail species are rare throughout the eastern U.S. A number of these are restricted to algific slope and carbonate cliff habitats in the southeast (e.g., Hendersonia occulta, Vertigo hubrichti, Vertigo 'iowaensis', Vertigo mermacensis; Frest 1991). Mafic igneous outcrops and conifer wetlands in northeastern Minnesota also support a number of rarities (Planogyra asteriscus, Vertigo cristata, Vertigo modesta modesta, Vertigo modesta parietalis, Vertigo paradoxa, Zoogenetes harpa; Nekola et al 1999). During the summer of 1999, a preliminary survey for land snails was conducted in northwestern Minnesota by myself and Dr. Brian Coles. We encountered 41 taxa at 12 sites scattered across Beltrami, Clearwater, Itasca, Kittson, Polk, and Roseau Counties. 20 of these were previously unreported from the region and 5 were new to the state. Some of the taxa encountered are very rare, including Vertigo arthuri (previously known from ca. 2 dozen sites in the Black Hills), V. cristata (not known to occur in the U.S. until 1996), and V. nylanderi (previously known from only 18 sites, and last seen in Minnesota in 1949). Not only were rare taxa encountered during this brief foray, but the diversities per site were the highest encountered at this latitude in central North America (over 20 taxa/site in some cases). The discovery of these globally rare taxa and diverse communities suggested that a more thorough inventory of the land snail fauna in this region was warranted. Two habitats, in particular, harbored important faunas. The first was calcareous wooded peatlands dominated by tamarack, white cedar, and/or black ash. These sites harbored Vertigo nylanderi, which had been lost to science for almost 50 years. All previous known; recent sites were limited to northeastern Wisconsin and the Upper Peninsula of Michigan. The Minnesota populations include the largest yet discovered. More individuals were . observed at Iron Springs Bog than had previously been seen at all other extant sites. Additionally, these sites were found to harbor over 20 associated species, making them among the richest wooded peatland faunas yet encountered. Associates included the rare Vertigo arthuri, V. cristata, V. elatior (new to the state), V. paradoxa, and Zoogenetes harpa. The second important habitat was aspen parkland. Vertigo arthuri was located at both inventoried sites, with the colony at Two Rivers SNA being perhaps the largest yet known globally. This site also supported Vertigo elatior, as well as 19 other taxa (21 total). The number of sympatic species at Two Rivers SNA was the most encountered at that time an upland woods in central North America. This richness is likely due to the highly calcareous nature of the Lake Agassiz plain. Our cursory survey of the region in 1999 did not permit analysis of other habitats which are also likely reservoirs of land snail biodiversity. Among the more important of these are fens,
2
which support diverse land snail communities and very large populations in Iowa (Frest 1990), Michigan (Nekola 1998), and Wisconsin (Nekola et al 1996). These sites have been found to harbor the European disjunct Euconulus alderi, the presumed glacial relicts Catinella exile, Vertigo elatior, and Vertigo morsei, plus at least two undescribed endemic taxa (Hawaiia n.sp. and Punctum n.sp.; Frest 1990). It is very likely that other important habitats and species exist in the region. Only by investigating representative examples of all major habitat types habitats throughout the region the true extent of this fauna can be documented. The documentation of this fauna is particularly important as land snail communities are among the most sensitive known to anthropogenic and other disturbances (Frest and Johannes 1995). Because of this, such unique communities can be lost from development and agricultural pressures (Frest 1991, Nekola et al. 1996) before the full extent of their biodiversity can be assessed. The following report summarizes findings from a land snail survey of all important natural communities found within the 14 most northwestern Minnesota counties. The large spatial and ecological extent of this analysis permits not only documentation of the distribution and abundance of individual species, in the regional fauna, but also the potential ecological patterns and processes that influence their distribution and abundance. This study represents the most extensive such survey of its kind made in North America.
METHODS:
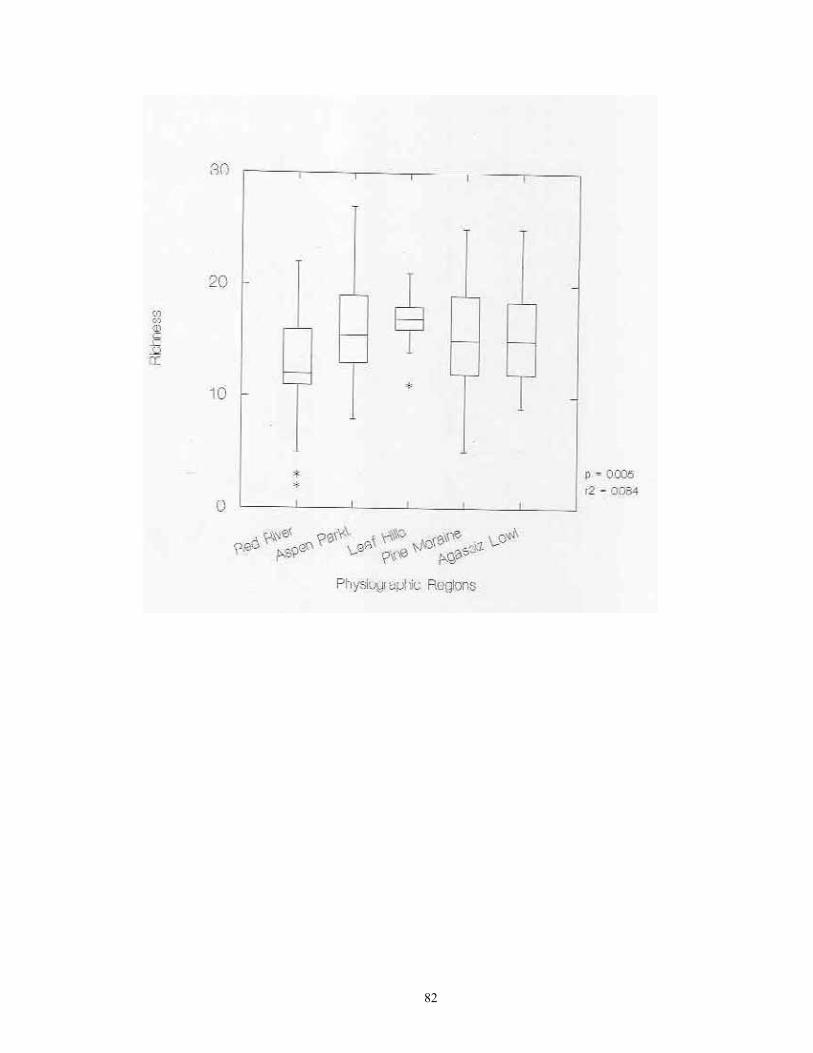
Study Region: A 14-county region of northwestern Minnesota was selected for analysis, including Becker, Beltrami, Clay, Clearwater, Hubbard, Kittson, Lake of the Woods, Mahnomen, Marshall, Norman, Pennington, Polk, Red Lake, and Roseau (Figure 1). This region covers 4.77 million hectares, and is of particular interest as it not only contains a wealth of calcium-rich soils, but also bisects the major plant community gradient between northern tallgrass prairie and mixedboreal forest. Five major physiographic provinces are present: Red River Valley, Aspen , Parkland, Leaf Hills, Pine Moraines, and Agassiz Lowlands. Study Sites: A total of 181 sites were chosen for analysis (Figure 1; Table 1). These were collected over to entire extent of the region where native plant communities still exist. For this reason, much of the western half of the Red River Valley was not sampled as it has been wholly converted to agriculture. The number of samples per county ranged from 21 (Clearwater and Polk) to 6 (Norman). Sites were selected if they represented typical examples of their respective habitat, and (except for anthropogenic habitats) were undisturbed. Collections were made from 22 different habitat types. These habitats can be broadly grouped into four categories: upland forests, lowland forests, upland grasslands, and lowland grasslands.
3
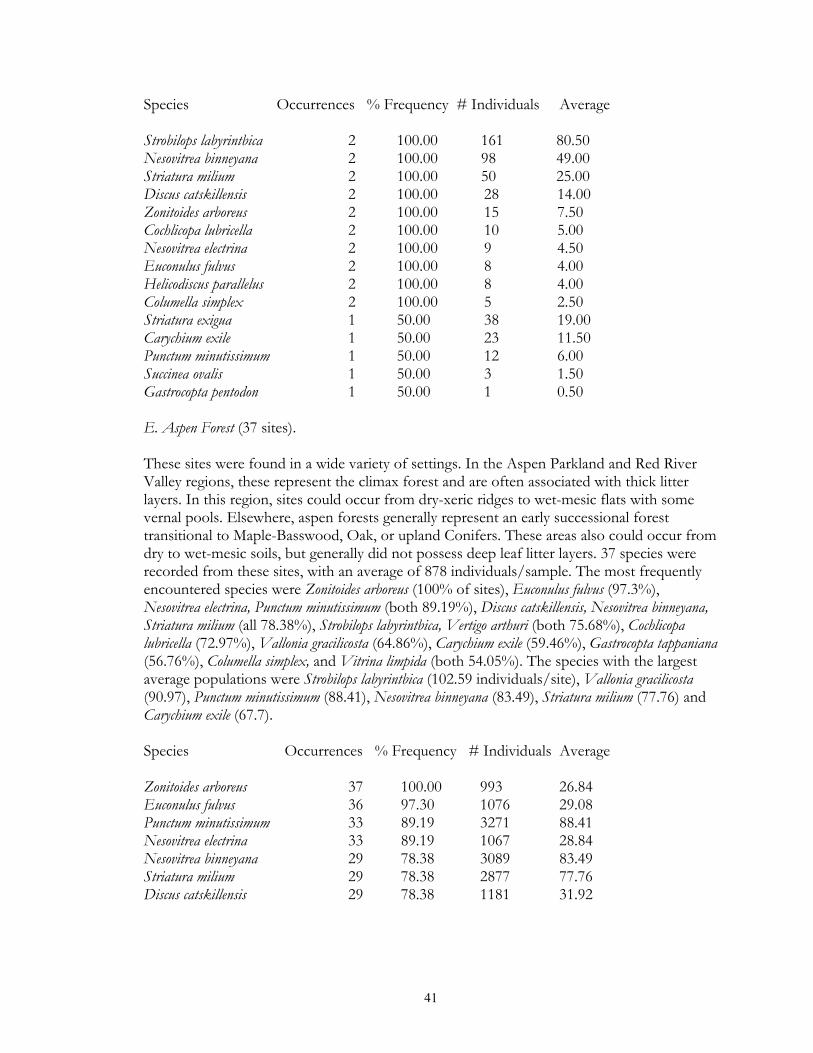
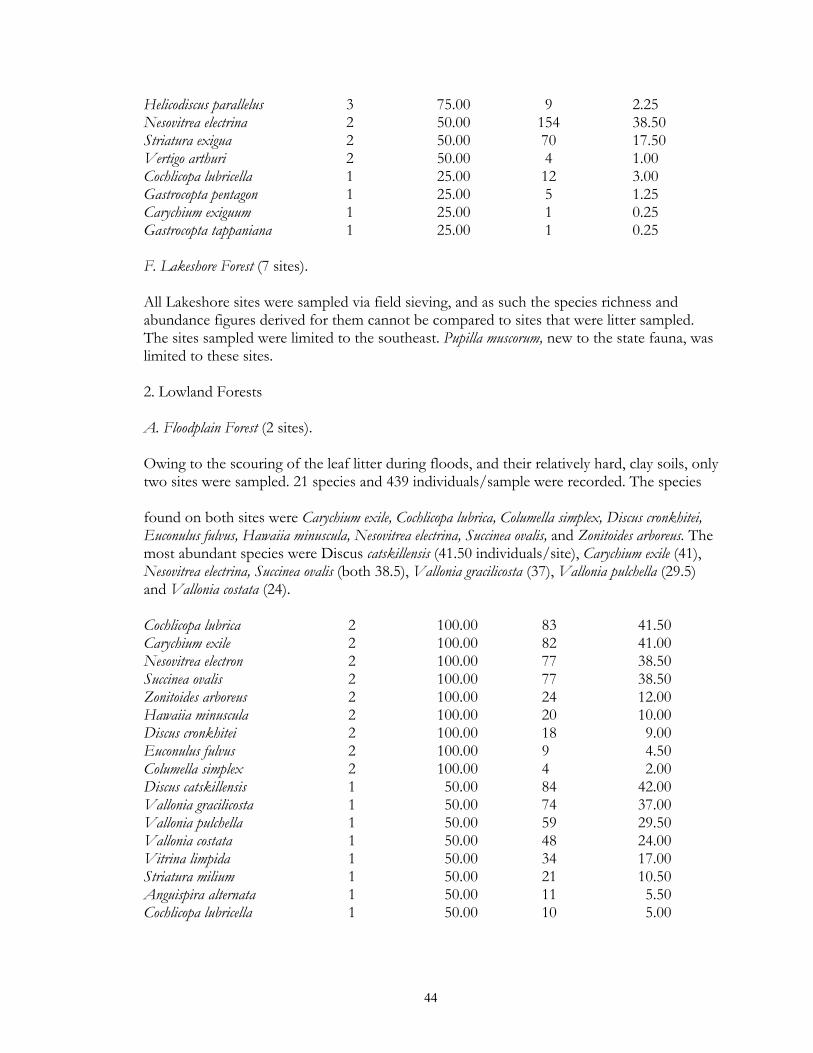
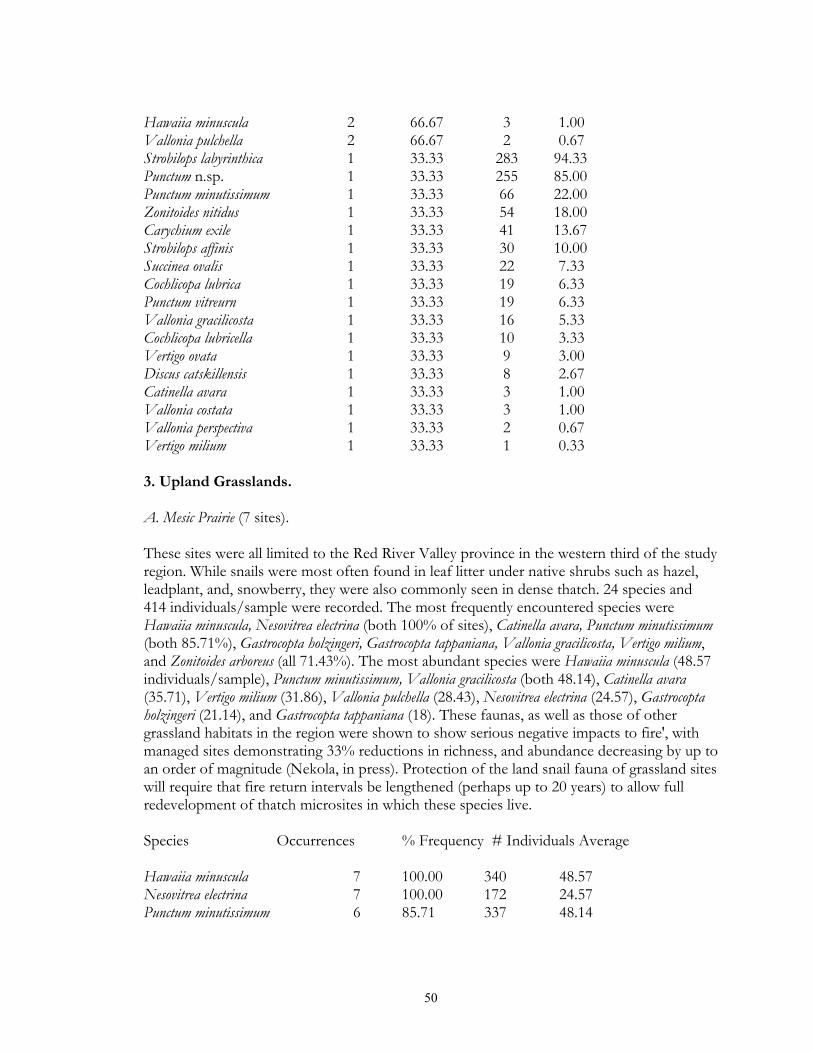
Eight types of upland forest habitats were surveyed. These sites primarily differed in their canopy species, usually as a result of different soils. Oak forest (16 sites) was found on dry ridges, and often occurred in loamy or sandy soil. Maple-basswood forest (8 sites) typically occurred on hard, clay-rich soils, had thin leaf litter layers. However, some sites (especially those dominated by Basswood) possessed very deep humus layers over loamy soils. BalsamWhite Spruce forests (2 sites) were upland sites dominated by either (or both) of these northern conifers. Balsam was co-dominant at the Mahnomen County site (Oakland) with Basswood and Bur Oak. Soil letter depth was generally moderate, and bryophyte cover locally dense. Paper Birch forests (2 sites) had deep leaf litter layers, but were generally found on well-drained, gravelly soils. Aspen forests (37) were found throughout the region in a number of situations, ranging from climax forests with deep leaf litter in the Aspen Parkland, to early successional forests with thin litter in the Leaf Hills, Pine Moraines, and Agassiz lowlands. Additionally, aspen forests were found across almost the entire moisture gradient (especially in the Aspen Parkland) from wet-mesic to xeric situations. Jack Pine forests (4 sites) were limited to excessively drained, sandy soils of outwash plains. Sites were limited to the Pine Moraines and Agassiz lowlands, with most examples being seen in Hubbard and Roseau counties. Sites ranged from mesic (where oak and red maple were also present) to, xeric (where savanna developed). Hazel groves with deep leaf litter layers were found in all sites. Red Pine forest (4 sites) occurred on loamy soils, with white pine and oak also being commonly present. Leaf litter layers were generally deep, especially under hazel groves. Sites were generally limited to the Pine Moraines province. Lastly, lakeshore forests (7 sites) were sampled primarily in the Pine Moraines within a 100 km distance from Lake Itasca. While most sites were wooded, the lake margin itself was often herb-dominated. These sites were sampled via field sieving, and as such were not statistically compared with the litter collected samples. Six types of lowland forests were surveyed. Floodplain forests (2 sites) occur on silty soils adjacent to streams and subjected to frequent flooding. Black Ash swamp forests (12 sites) were found throughout the Aspen Parkland, Leaf Hills, Pine Moraines, and Agassiz Lowlands provinces. These sites ranged from wet to mesic, with very deep, rich litter layers being found on more mesic sites. Tamarack swamp forests (24 sites) possessed a similar range, and were typically dominated by a rich bryophyte/herbaceous groundcover and alder/willow subcanopy. While surficial soil chemistry on these sites can vary from acidic (where Sphagnum moss is abundant) to neutral or alkaline (where Sphagnum is largely absent), litter collection was generally limited to the latter microsites. White Cedar swamp forests (6 sites) were limited to the Agassiz Lowlands, and often also supported black spruce and tamarack. Sites ranged from wet (with diverse bryophyte/herb groundlayers) to mesic (with little ground layer). Leaf litter depths were often great, and sites often had cool soils. Black spruce swamp forests (3 sites) were found in the Agassiz Lowlands and Pine Moraines, and typically supported a diverse bryophyte/herb ground layer. Little Sphagnum moss was noted in the sampled sites. Lastly, shrub-carr habitats (3 sites) were dominated by low-growing thickets of alder, willow, and dogwood, and supported a dense sedgegrass groundlayer. Four types of upland grasslands were surveyed. These sites were all limited to the Red River Valley, Aspen Parkland, and southern Pine Moraines provinces. Mesic prairie (7 sites) are
4
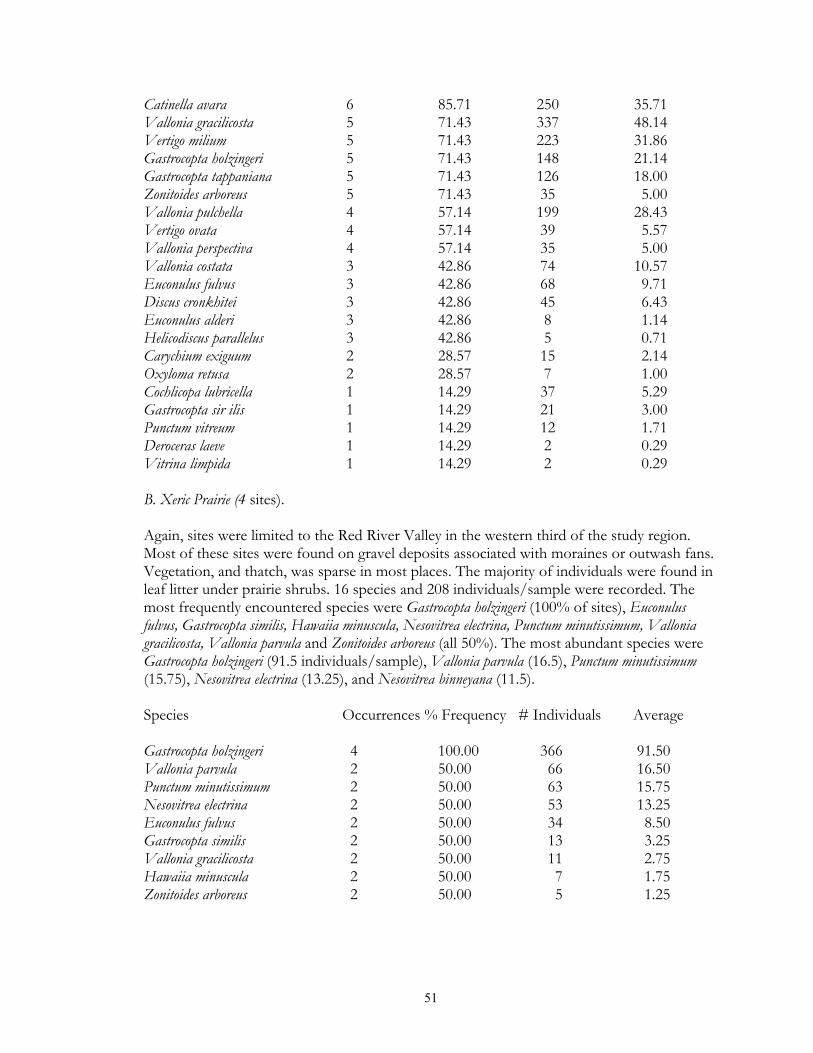
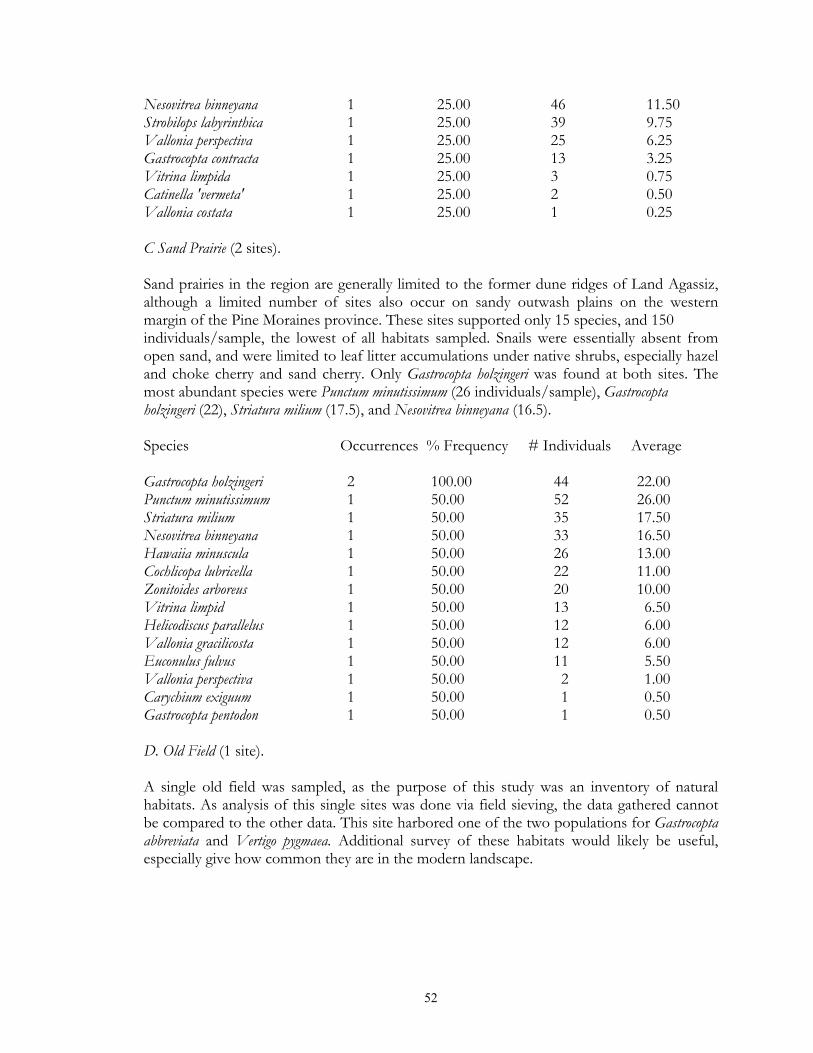
typical tallgrass prairie sites, usually found in calcareous soils associated with the Lake Agassiz plain. Unmanaged sites often had moderately thick thatch, and fairly deep leaf litter accumulations under small shrub (leadplant, snowberry, chokecherry) clumps. Sites which had been subjected to fire management in general lacked these microsites. Xeric prairie (4 sites) was limited to gravel deposits associated with moraines and Lake Agassiz beach ridges. Litter accumulation was essentially absent except under native prairie shrubs. Sand prairie (2 sites) was found in Lake Agassiz shoreline ridges, and in outwash plains in the Pine Moraines. As with xeric prairie litter accumulation was essentially limited to microsites under native shrubs. Lastly, a single old field was sampled via field sieving. As such, the composition and abundance of snails from this site were not compared to the other habitats sampled via litter collection. Lastly, four types of lowland grassland habitats were surveyed. Wet prairies (11 sites) are prairie areas generally found in the Red River Valley province that have saturated (or inundated) soils during at least part of the growing season. Included are brush prairies of the Aspen Parklands, which support high coverage of small willow, shrubby cinquefoil, and dogwood scrub. Unburned sites supported relatively thick thatch layers, and leaf litter accumulations under shrubs such as willows and dogwoods. Sedge meadows (3 sites) are perennially moist sites with mineral soils found throughout the region. Sedges dominate the groundlayer, with scattered clumps of willows, dogwood, and alder being commonly present. Fens (17 sites) are peatland areas with saturated soils found at sites of ground water discharge, with most sites being restricted to the Red River Valley, Agassiz Lowlands, and Pine Moraines. They maintain higher and more constant soil moisture than are otherwise found in the surrounding landscape (Nekola, 1994). Calcareous meadows (4 sites) are often sparsely vegetated wet meadows found on bare mineral (rather than organic) soils. Most of the sites were anthropogenically created through soil removal in borrow pits along roads and railroads. Field Methods Documentation of terrestrial gastropods from most sites was accomplished by hand collection of larger shells and litter sampling for smaller taxa from representative 100-1000 m2 areas. The latitude-longitude location for each was determined using either USGS 7.5 minute topographic maps or a hand-held GPS. Soil litter sampling was primary used as it provides the most complete assessment of site faunas (Oggier et al., 1998). As suggested by Emberton et al. (1996), litter collections were made at places of high micro-mollusc density, with a constant volume of soil litter (approximately 4 liters) being gathered from each site. For woodland sites, sampling was concentrated in areas supporting the thickest leaf litter and humus layers. For grassland sites, sampling consisted of: (1) small blocks (ca. 125 cm3) of turf; (2) loose soil and leaf litter accumulations under or adjacent to shrubs, cobbles, boulders, and/or hummocks; and (3) places with moderate to dense thatch accumulations. However, eight sites from two habitat types (lakeshore forest and old field) were sampled only via field sieving. As data gathered from this technique are not ecologically comparable to litter sampling, these sites were used only to map species occurrence patterns. Analysis of richness and abundance patterns were limited to litter sampled sites.
5
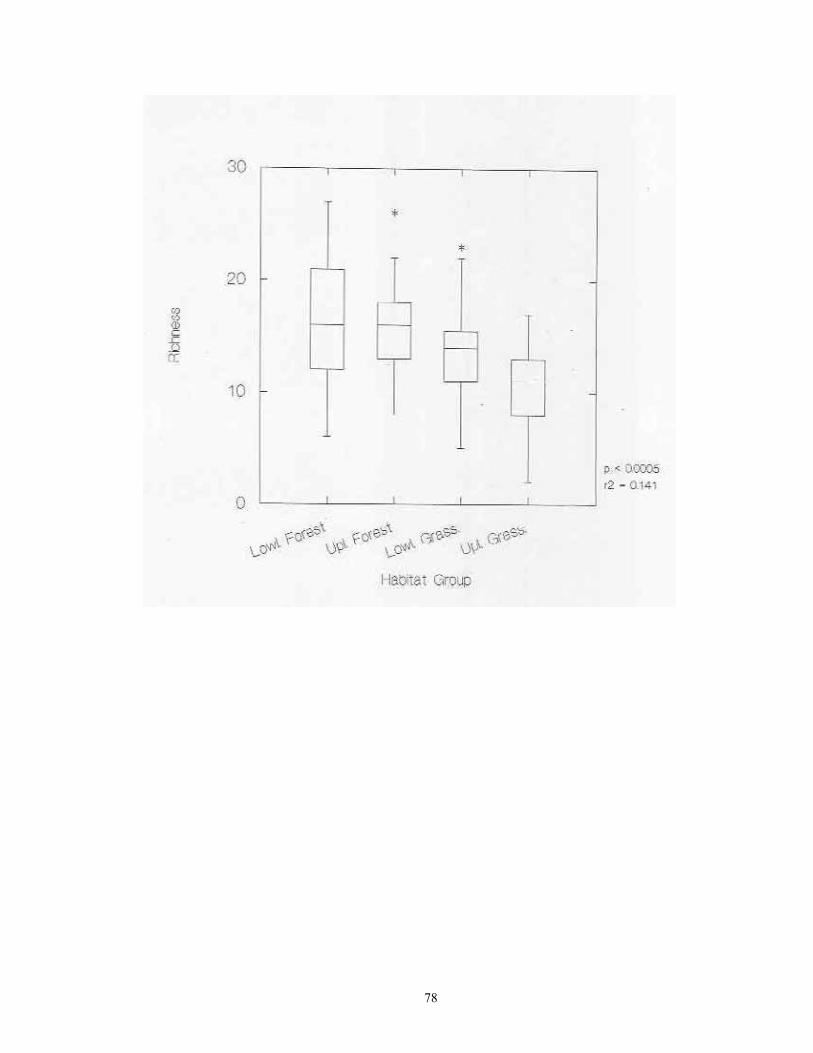
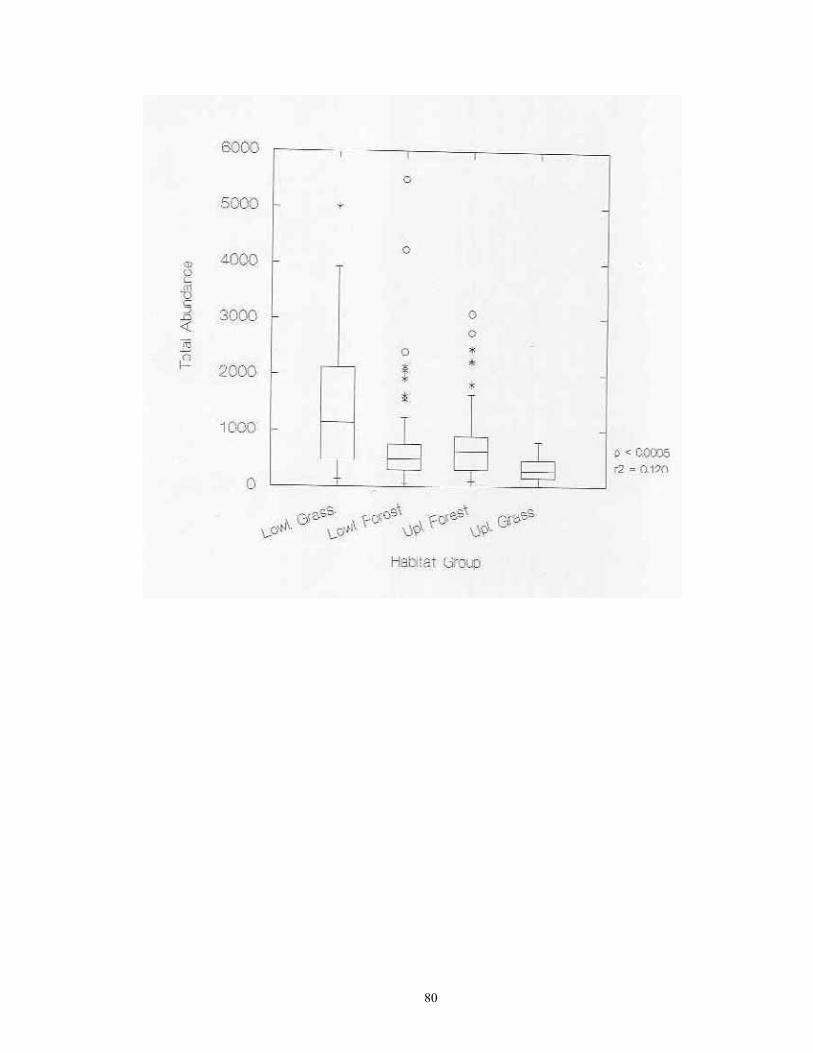
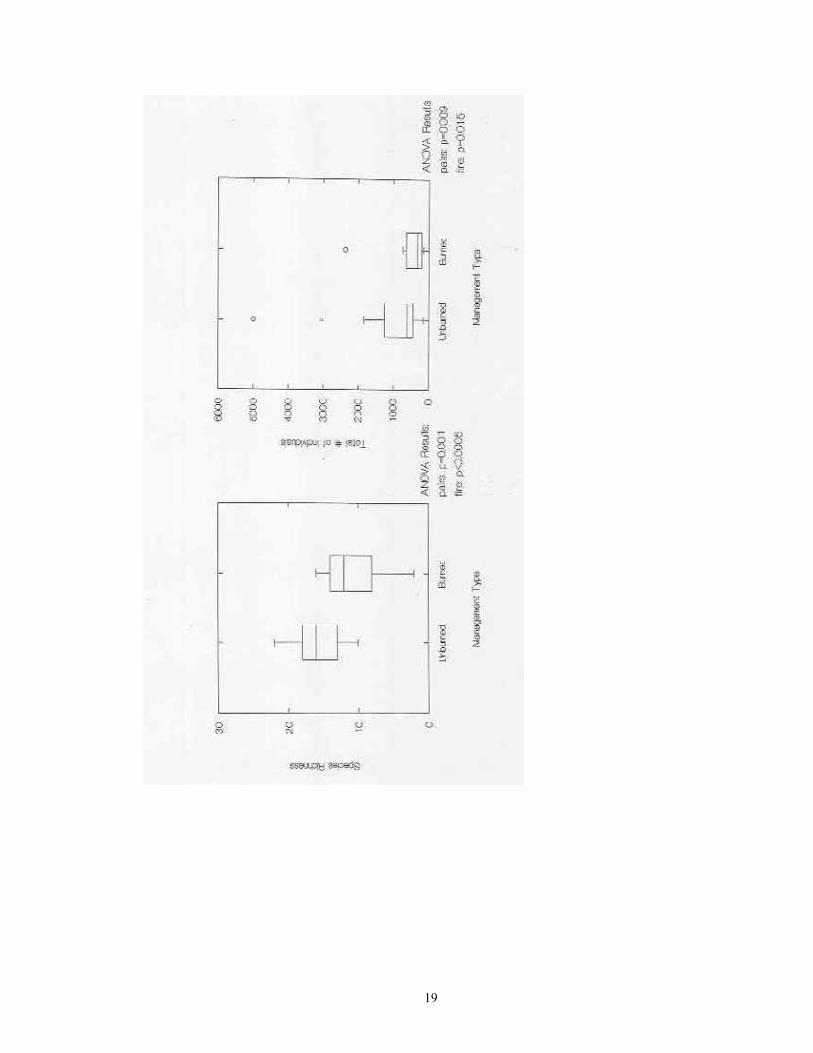
Laboratory Procedures Samples were slowly and completely dried in either in full sun in a greenhouse. Dried samples were then soaked in water for 3-24 hours, and subjected to careful but vigorous water disaggregation through a standard sieve series (ASTME 3/8" (9.5 mm), #10 (2.0 mm), #20 (0.85), and #40 (0.425 mm) mesh screens). Sieved sample fractions were then dried and passed again through the same sieve series. These dry, resorted fractions were hand picked against a neutral-brown background. All shells and shell fragments were removed. All identifiable shells from each site were assigned to species (or subspecies) using the author's reference collection and the Hubricht Collection at the Field Museum of Natural History (FMNH). Some additional specimens representing Holarctic taxa were verified by Robert Cameron of the University of Sheffield, UK. All specimens have been catalogued and are housed in the author's collection at the University of Wisconsin -Green Bay. Nomenclature generally follows that of Hubricht (1985), with updates and corrections by Frest (1990, 1991) and Nekola (in review). Statistical Tests ANOVA analyses were used to determine if statistically significant differences exited in site richness and total snail abundance between sites from the four major habitat groups (upland and lowland forests, upland and lowland grasslands) and the five physiographic provinces (Red River Valley, Aspen Parkland, Leaf Hills, Pine Moraines, Agassiz Lowlands). ANOVA was also used to document the significance of differences in richness and abundance between the 20 individual habitat types sampled and the 14 surveyed counties. The central tendencies in these relationships were graphically represented via box plots. In box plots, the central line represents the median of the sample, the margins of the box represent the interquartile distances, and the fences represent 1.5 times the interquartile distances. For data having a Gaussian distribution, approximately 99.3% of the data will fall inside of the fences (Velleman & Hoaglin, 1981). Outliers falling outside of the fences are shown with asterisks. Linear regression was used to describe the relationship between site richness and total abundance. Analyses were conducted separately on raw abundance and natural-log transformed abundance. An approximation of the spatial distribution of site richness and snail abundance per sample across the study region was calculated through the interpolation technique of block kriging (Burgess and Webster 1980).
6
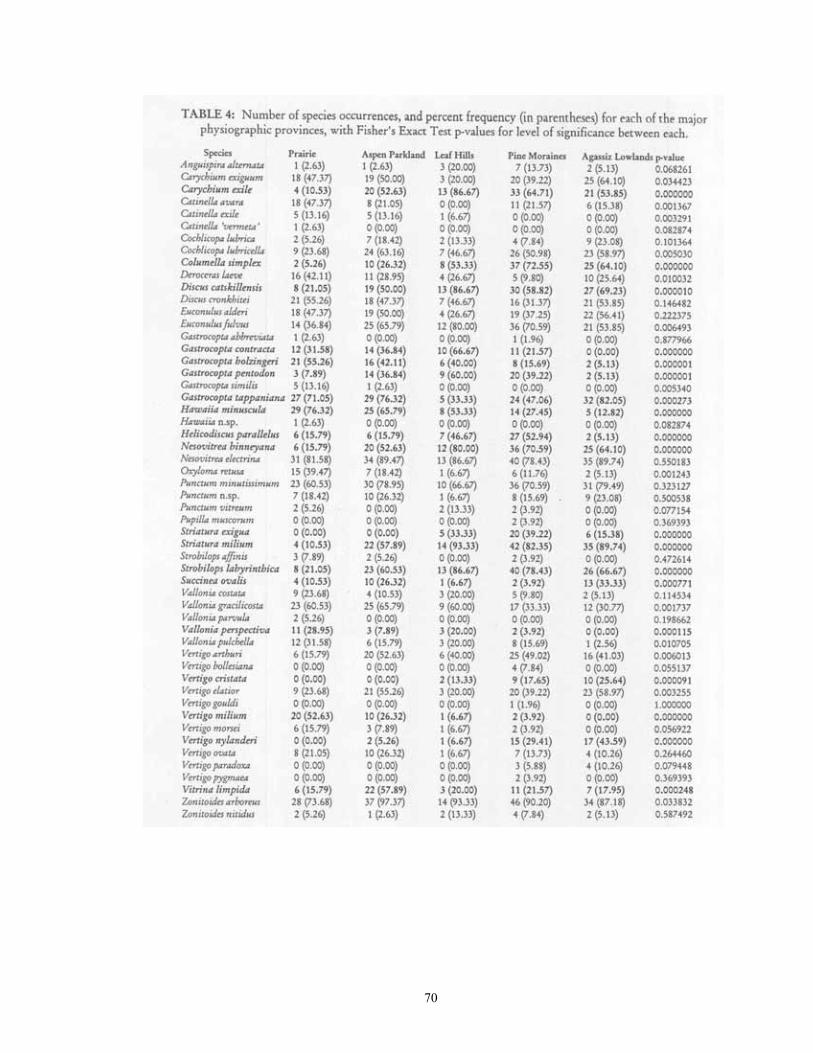
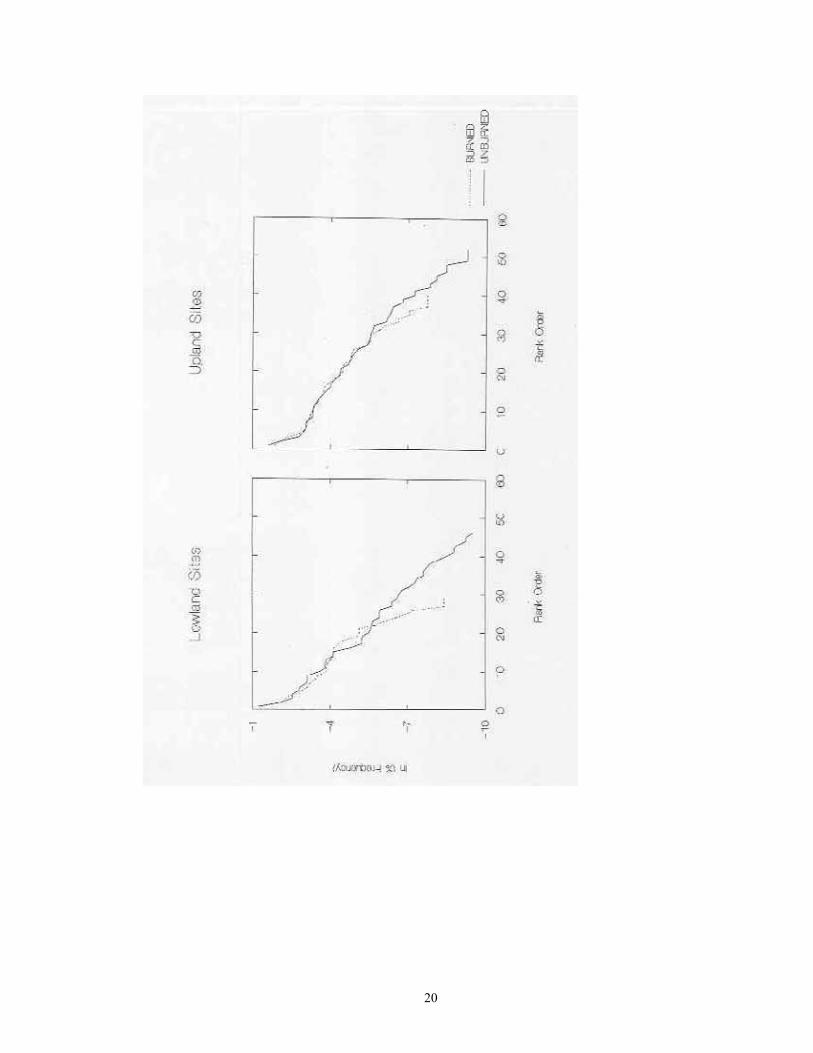
Contingency table analyses were used to assess which taxa differed in their occurrence frequencies among the four major habitat groups, and between the five physiographic provinces. The number of occurrences and absences for each taxon within each habitat group/province was then calculated. As observed frequencies of taxa were often sparse (< 5) in more than one-fifth of the areas, Fisher's Exact Test (Zar 1984) was used to identify significant differences in occurrence frequencies. Because this test was repeated on each of the 54 taxa, a Bonferroni correction was used to adjust the significance threshold to p=0.000926. Lastly, the proportion of individuals from each species within the total encountered was calculated. These proportions were natural log-transformed, and then placed in rank order from largest to smallest. A dominance-diversity curve was then plotted by graphing transformed frequency vs. rank order. This same process was also repeated individually for each of the four major habitat groups.
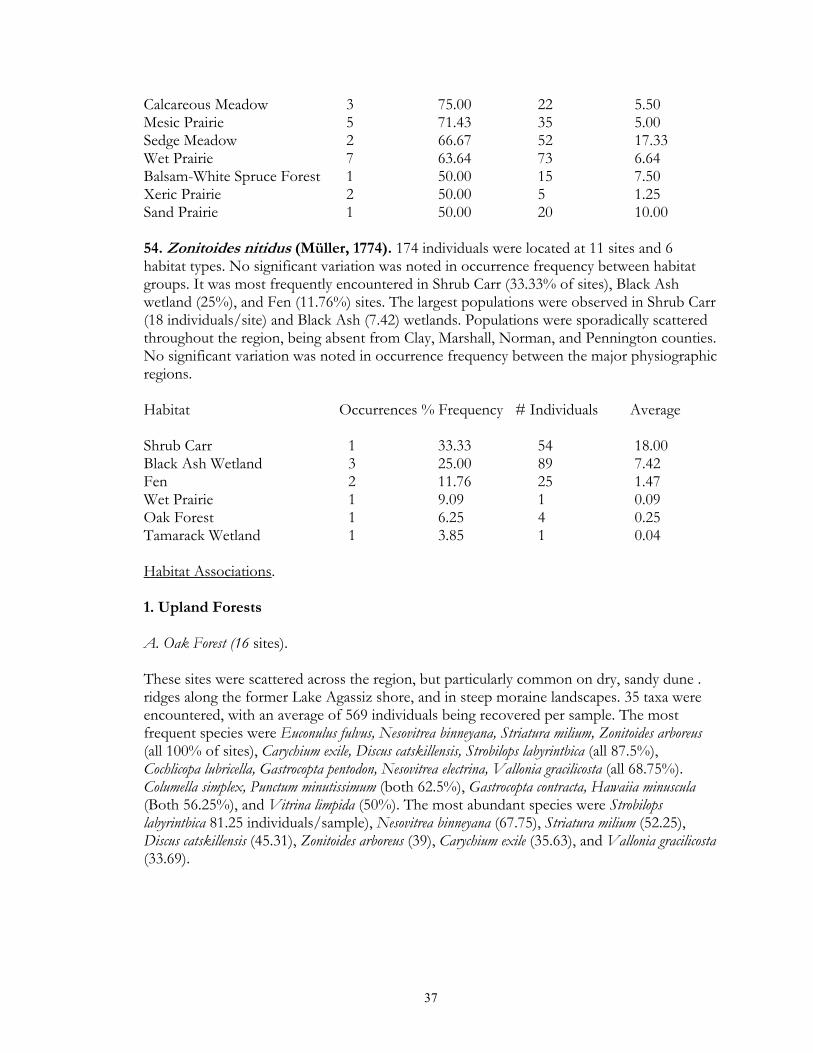
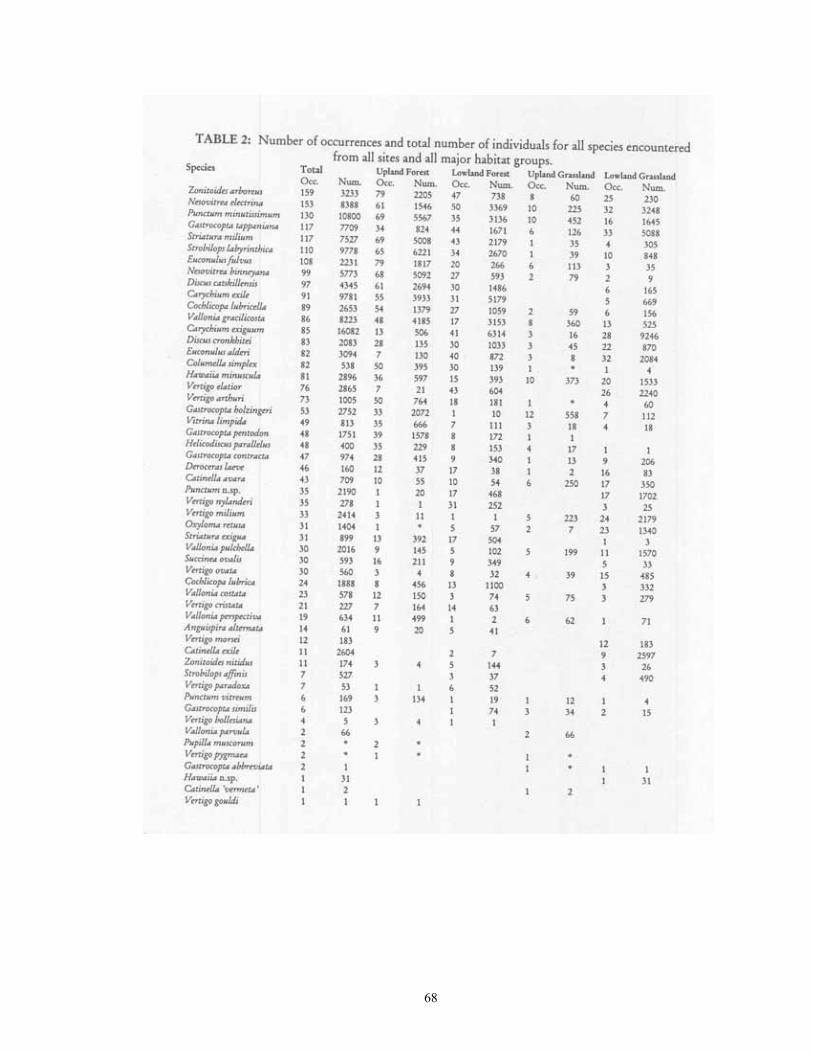
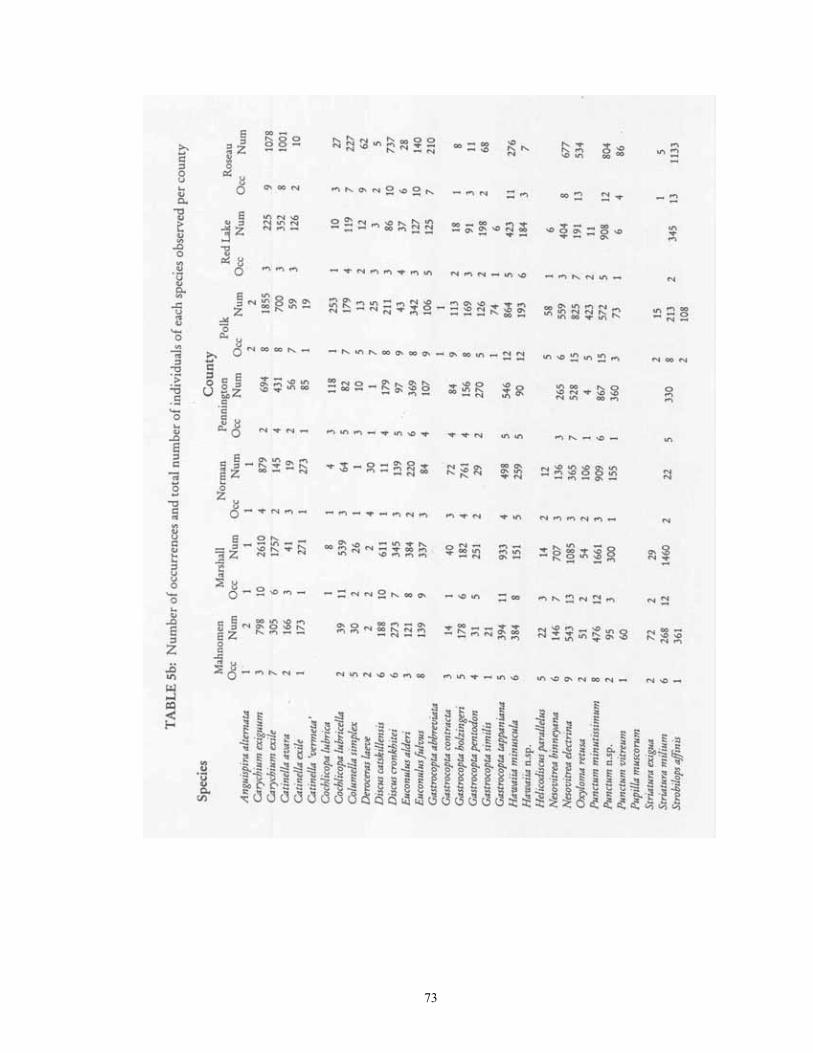
RESULTS AND DISCUSSION Description of the fauna 54 species were located during this survey from the 181 sampled sites (Table 2). At total of 151,157 individuals were encountered, of which 134,247 were identifiable to species. The remaining 16,910 individuals represent immature Pupillidae, Succineidae, Vallonia, Cochlicopa, or Discus. Species found in at least 50% of sites were Zonitoides arboreus (159 sites), Nesovitrea electrina (153), Punctum minutissimum (130), Gastrocopta tappaniana (117), Striatura milium (117), Strobilops labyrinthica (110), Euconulus fulvus (108), Nesovitrea binneyana (99), Discus catskillensis (97), and Carychium exile (91). The ten most abundant species were Carychium exiguum (16082 total individuals), Punctum minutissimum (10800), Carychium exile (9781), Strobilops labyrinthica (9778), Nesovitrea electrina (8388), Vallonia gracilicosta (8223), Gastrocopta tappaniana (7709), Striatura milium (7527), Nesovitrea binneyana (5773), Discus catskillensis (4345). Analysis of habitat and distributional patters for each of these species follows. The data discussed for each is found in Tables 3 & 4. 1. Anguispira alternata (Say, 1817). This is the largest land snail (up to 20 mm diameter) in the region, where it reaches its northwestern range limit. 61 individuals were located at 14 sites, and 7 habitat types, all of which were forested. The greatest number of shells were recovered from Black Ash (28), Maple-Basswood (15), and Floodplain (11) forest habitats. While found generally throughout the region, it was most frequently encountered in the Leaf Hills (20% of sampled sites) and Pine Moraines (13.73%) and least in Prairie and Aspen Parkland (both 2.63%). Habitat Occurrences % Frequency # Individuals Average Floodplain Forest 1 50.00 11 5.50 Balsam-White Spruce Forest 1 50.00 2 1.00 Maple-Basswood Forest 2 25.00 15 1.88
7
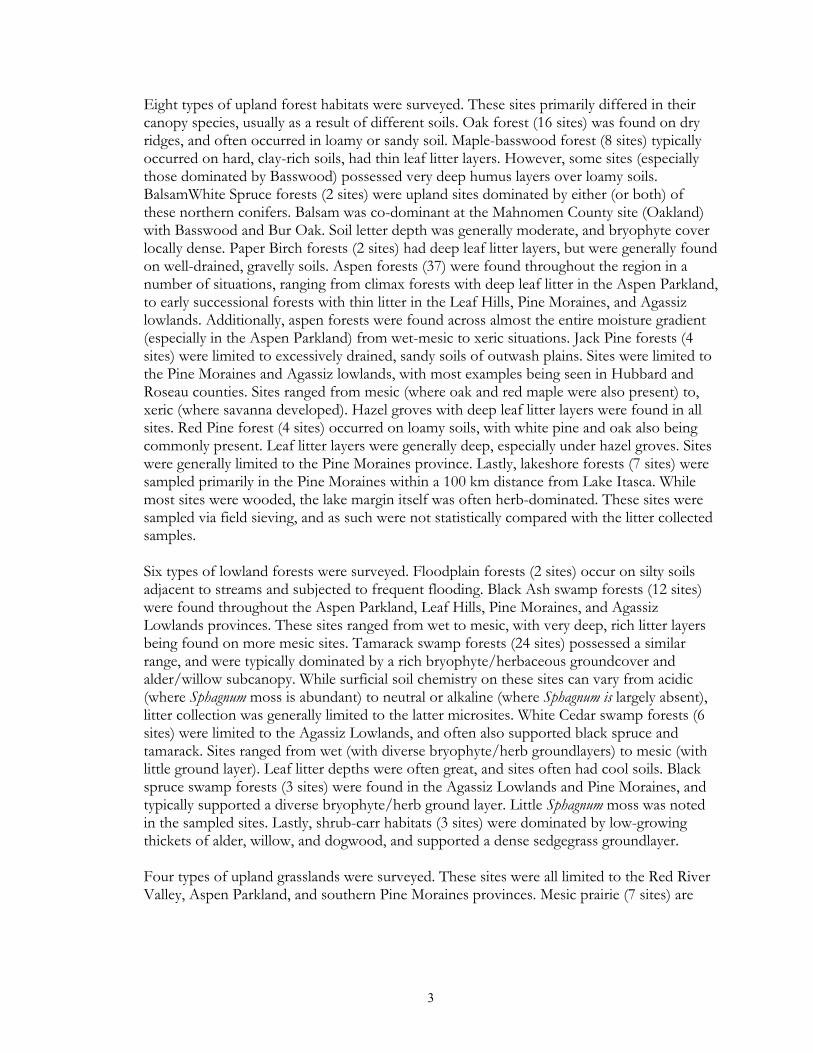
Black Ash Wetland 2 16.67 28 2.33 Oak Forest 2 12.50 2 0.13 Tamarack Wetland 2 7.69 2 0.08 Aspen Forest 1 2.70 1 0.03 2. Carychium exiguum (Say, 1822). This was the most abundant species encountered in the region, with 16,082 shells being recovered from 85 sites in 15 habitat types. Populations significantly favored Lowland Forests and Lowland Grasslands, with occurrence frequency being highest in Shrub Carr, Sedge Meadow, Fen (100% of sites), Tamarack Wetland (88.46%), Black Ash Wetland (83.33), and Calcareous Meadow (75%) habitats. The largest average populations were found in Fen (421.76 shells/sample), Shrub Carr (364.33), and Sedge Meadow (336.67) habitats. While found in all counties, its distribution showed a nonsignificant (p=0.034423) trend toward being most frequently encountered in the Agassiz Lowlands (64.1% of sites), Aspen Parkland (50%), and Prairie (47.37%), and least in the Leaf Hills (20%). Habitat Occurrences % Frequency # Individuals Average Fen 17 100.00 7170 421.76 Shrub Carr 3 100.00 1093 364.33 Sedge Meadow 3 100.00 1010 336.67 Tamarack Wetland 23 88.46 3512 135.08 Black Ash Wetland 10 83.33 1143 95.25 Calcareous Meadow 3 75.00 174 43.50 Black Spruce Wetland 2 66.67 212 70.67 White Cedar Wetland. 3 50.00 354 59.00 Sand Prairie 1 50.00 1 0.50 Wet Prairie 5 45.45 892 81.09 Mesic Prairie 2 28.57 15 2.14 Red Pine Forest 1 25.00 1 0.25 Aspen Forest 8 21.62 471 12.73 Maple-Basswood Forest 1 12.50 27 3.38 Oak Forest 1 6.25 7 0.44 3. Carychium exile H.C.Lea, 1842. 9781 individuals were encountered from 91 sites and 16 habitat types. This species demonstrated a highly significant (p < 0.000005) preference for upland and lowland forested sites. It was most frequently encountered in Maple-Basswood, Balsam-White Spruce, Floodplain (present at 100% of sites), Oak (87.5%), Black Ash (83.33), White Cedar (83.33), and Red Pine (75%) forests. The largest populations were found in Black Ash wetlands (283.08 individuals/sample), Sedge Meadows (126.33), and White Cedar wetlands (91.83). Although found in all counties, this species was encountered with significantly (p < 0.000005) higher frequency in the Leaf Hills (86.67% of sites), as compared to the Red River Valley (10.53%).
8
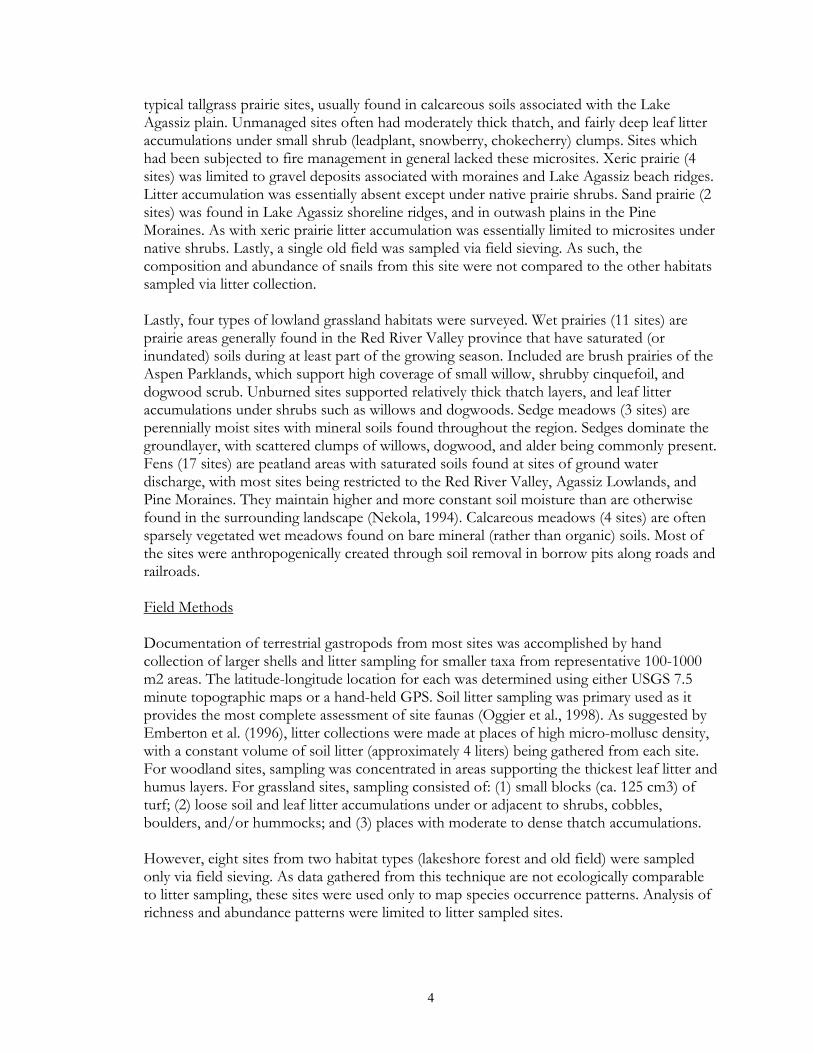
Habitat Occurrences % Frequency # Individuals Average Maple-Basswood Forest 8 100.00 638 79.75 Balsam-White Spruce Forest 2 100.00 91 45.50 Floodplain Forest 2 100.00 82 41.00 Oak Forest 14 87.50 570 35.63 Black Ash Wetland 10 83.33 3397 283.08 White Cedar Wetland 5 83.33 551 91.83 Red Pine Forest 3 75.00 102 25.50 Sedge Meadow 2 66.67 379 126.33 Aspen Forest 22 59.46 2505 67.70 Paper Birch Forest 1 50.00 23 11.50 Tamarack Wetland 12 46.15 1050 40.38 Black Spruce Wetland 1 33.33 58 19.33 Shrub Carr 1 33.33 41 13.67 Jack Pine Forest 1 25.00 4 1.00 Fen 2 11.76 239 14.06 Wet Prairie 1 9.09 51 4.64 4. Catinella avara (Say, 1824). 709 individuals of this species were encountered at 43 sites and 12 habitat types. Populations were significantly (p=0.000142) more frequent in grassland (43-49%) as compared to forested (13-19%) sites. Populations were most often encountered in Mesic (85.71% of sites) and Wet Prairie (81.82). Populations were also largest in these sites (35.71 and 21.45 individuals/sample, respectively). Although found in all counties but Hubbard, populations appeared more common to the southwest. A non-significant (p=0.001367) trend in distribution was present, with populations occurring most frequently in the Red River Valley (47.37% of sites), but being absent from the Leaf Hills. Habitat Occurrences % Frequency # Individuals Average Mesic Prairie 6 85.71 250 35.71 Wet Prairie 9 81.82 236 21.45 Calcareous Meadow 2 50.00 25 6.25 Black Spruce Wetland 1 33.33 14 4.67 Shrub Carr 1 33.33 3 1.00 Sedge Meadow 1 33.33 3 1.00 Fen 5 29.41 86 5.06 Black Ash Wetland 3 25.00 12 1.00 Tamarack Wetland 5 19.23 25 0.96 Aspen Forest. 5 13.51 48 1.30 Maple-Basswood Forest 1 12.50 6 0.75 Oak Forest 1 6.25 1 0.06
9
5. Catinella exile (Leonard, 1972). Diagnostic characteristics are based on Frest (1990), who noted that the shell of this species is smaller, has a higher spire, and is more orange-colored than Catinella avara. Described from Pleistocene material, it was previously thought extant only from fens in Iowa (Frest, 1990) and the western Great Lakes (Nekola, in review). 2604 individuals were located at 11 sites and 3 habitat types. All but 7 of these were found at 9 fen sites, where average number of encountered shells per sample was 152.76. Populations were essentially limited to the Red River Valley and Aspen Parkland regions, although this distributional trend was only marginally significant (p=0.003291). Given the small number of populations encountered, and their almost complete limitation to high-quality fens, consideration for state listing of this species seems warranted. Habitat Occurrences % Frequency # Individuals Average Fen 9 52.94 2597 152.76 Black Ash Wetland 1 8.33 6 0.50 Tamarack Wetland 1 3.85 1 0.04 6. Catinella cf. vermeta (Say, 1829). This small (< 5 mm tall) Catinella with a deep suture was limited to a single xeric prairie site (Felton Prairie), where 2 individuals were located. The treatment of these specimens follows that of Frest & Dickson (1986), who related a small Catinella from xeric Loess Hill prairies in western Iowa to this taxon. Seemingly identical individuals have also been found on xeric carbonate glades in northeastern Iowa and southeastern Minnesota (Nekola, 1999). Habitat Occurrences % Frequency # Individuals Average Xeric Prairie 1 25.00 2 0.50 7. Cochlicopa lubrica (Müller, 1774). Based upon the morphometric analyses of Preece (1992), I am using this name to designate individuals with shell heights > 6 mm and widths > 2.3 mm. I have also chosen European convention (e.g. Kerney & Cameron, 1979) in using Cochlicopa, rather than Cionella, for the generic name (see Turgeon et al., 1998). As defined, 1888 individuals of this taxon were located at 24 sites and 11 habitat types. A non-significant (p=0.031594) trend was noted in habitat preference with populations tending to favor lowland forests (25% of sampled sites) while being absent from upland grasslands. Populations were most frequently encountered in Floodplain Forests (100% of surveyed sites) and Black Ash wetlands (41.67%). Largest average population sizes were noted in Sedge Meadow (99.33 individuals/sample), Black Ash wetland (75.5), and floodplain forests (41.5). Although data collected do not permit testing, it appeared that populations were most frequently encountered in sites with thin leaf litter and hard clay soils, or which had been subjected to anthropogenic disturbance. Although scattered throughout, populations appeared somewhat more common in the north and west of the region.
10
Habitat Occurrences % Frequency # Individuals Average Floodplain Forest 2 100.00 83 41.50 Black Ash Wetland 5 41.67 906 75.50 Black Spruce Wetland 1 33.33 75 25.00 Shrub Carr 1 33.33 19 6.33 Sedge Meadow 1 3.33 298 99.33 Oak Forest 4 25.00 108 6.75 Maple-Basswood Forest 2 25.00 256 32.00 Calcareous Meadow 1 25.00 8 2.00 Tamarack Wetland 4 15.38 17 0.65 Wet Prairie 1 9.09 26 2.36 Aspen Forest 2 5.41 92 2.49 8. Cochlicopu lubricella (Porro, 1838). Kerney and Cameron (1979), Hubricht (1985), and Preece (1992) are followed in designating those mature individuals with shells < 2.3 mm wide and < 6 mm tall as this taxon. Additional morphometric and genetic analysis of this group is warranted, as individuals with various intermediate shell dimensions were consistently encountered. 2653 individuals of this taxon, as so defined, were located at 89 sites and 18 habitats. Populations were significantly (p < 0.0000005) more frequent in forested as compared to grassland sites (52-68% vs. 14-17%, respectively). This species was most frequently found in Balsam-White Spruce, Paper Birch (both 100% of sites) Maple-Basswood forest (87.50), Black Ash wetland (83.33%), and Aspen forest (72.97%). The largest populations were observed in Black Ash wetland (67.75 individuals/sample), Maple-Basswood forest (32.88), Sedge Meadow (29.67), and Aspen forest (25.65) habitats. Although found through the region in all counties, it did demonstrate a non-significant (p=0.00503) trend by being 50-60% less frequent in the Red River Valley than other physiographic regions. Habitat Occurrences % Frequency # Individuals Average Balsam-White Spruce Forest 2 100.00 3 1.50 Paper Birch Forest 2 100.00 10 5.00 Maple-Basswood Forest 7 87.50 263 32.88 Black Ash Wetland 10 83.33 813 67.75 Aspen Forest 27 72.97 949 25.65 Oak Forest 11 68.75 132 8.25 White Cedar Wetland 4 66.67 44 7.33 Floodplain Forest 1 50.00 10 5.00 Sand Prairie 1 50.00 22 11.00 Tamarack Wetland 10 38.46 180 6.92 Wet Prairie 4 36.36 43 3.91 Black Spruce Wetland 1 33.33 2 0.67 Shrub Carr 1 33.33 10 3.33 Sedge Meadow 1 33.33 89 29.67 -
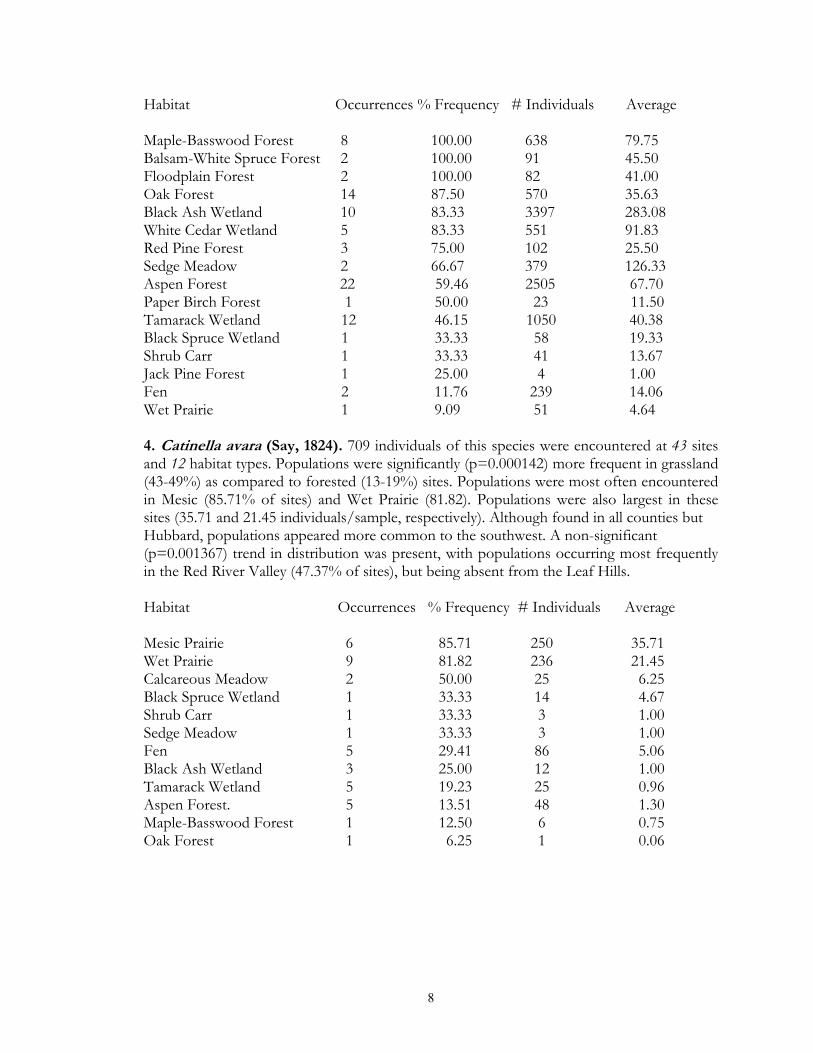
11
Jack Pine Forest 1 25.00 10 2.50 Red Pine Forest 1 25.00 12 3.00 Calcareous Meadow 1 25.00 24 6.00 Mesic Prairie 1 14.29 37 5.29 9. Columella simplex (Gould, 1841). 538 individuals of this species were identified at 82 sites and 13 habitat types. Populations were significantly (p < 0.0000005) more frequently encountered in woodland (58-63% of sites) vs. grassland (3-7%) sites. Populations were most often found in Paper Birch, Red Pine, Floodplain forest and Black Spruce wetland (100% of sampled sites), MapleBasswood, and Jack Pine forest (75%). Although frequently encountered, population sizes were typically low, with the most individuals/sample being recovered from Red Pine (8.50) and Aspen forest (6.62). A likely reason for these small observed population sizes is its arboreal nature, as living individuals were most commonly found over 50 dm ,off the ground on herbs and ferns. Although found in all counties, this species demonstrated a significantly (p < 0.0000005) higher occurrence frequency (53-73% of sites) in the east (Agassiz Lowlands, Pine Moraines, and Leaf Hills regions), as compared to the Aspen Parkland (26%) and Red River Valley (5%). Habitat Occurrences % Frequency # Individuals Average Paper Birch Forest 2 100.00 5 2.50 Red Pine Forest 4 100.00 34 8.50 Floodplain Forest 2 100.00 4 2.00 Black Spruce Wetland 3 100.00 15 5.00 Maple-Basswood Forest 6 75.00 42 5.25 Jack Pine Forest 3 75.00 9 2.25 White Cedar Wetland 4 66.67 11 1.83 Oak Forest 10 62.50 58 3.63 Black Ash Wetland - 7 58.33 55 4.58 Aspen Forest 20 54.05 245 6.62 Tamarack Wetland 14 53.85 54 2.08 Balsam-White Spruce Forest 1 50.00 2 1.00 Fen 1 5.88 4 0.24 10. Deroceras spp. Due to the nature of field collection techniques, live slugs were only infrequently observed. However, 160 internal plates from Deroceras were found at 46 sites and 14 habitat types. Observation of living individuals suggests that many of the lowland populations represent the native Deroceras laeve (Müller, 1774), while upland populations represent the introduced Deroceras reticulatum (Müller, 1774). Populations tended (p=0.001077) to favor lowland forests and grasslands (33-46% of sites) as opposed to upland sites (7-15%). Populations were most frequently encountered in Wet Prairie (72.73%), Shrub Carr (66.67), BalsamWhite Spruce, and Floodplain forests (both 50%). The largest populations were encountered in Fen (3.76 individuals/sample) and Shrub Carr (3) habitats.
12
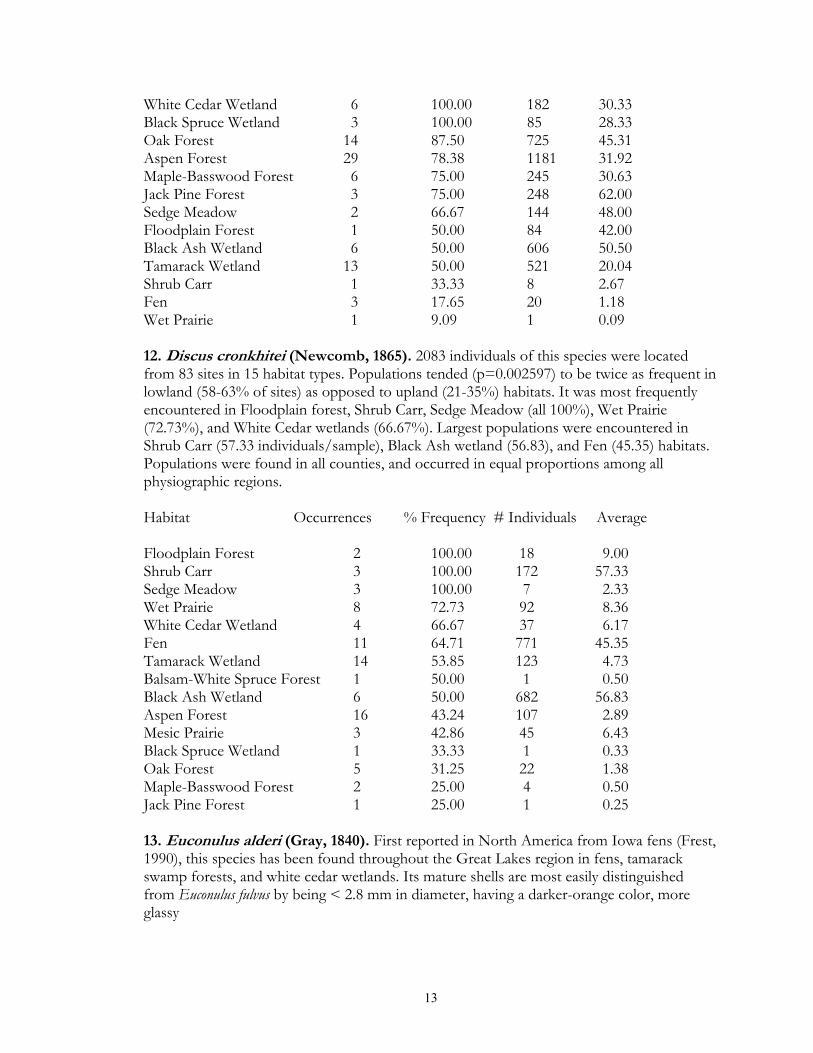
Although absent only from Hubbard County, populations tended (p=0.01) to be more frequent to the north and west, especially in the Red River Valley. Habitat Occurrences % Frequency # Individuals Average Wet Prairie 8 72.73 12 1.09 Shrub Carr 2 66.67 9 3.00 Balsam-White Spruce Forest 1 50.00 1 0.50 Floodplain Forest 1 50.00 1 0.50 Black Ash Wetland 5 41.67 8 0.67 Fen 6 35.29 64 3.76 Black Spruce Wetland 1 33.33 2 0.67 Sedge Meadow 1 33.33 1 0.33 Tamarack Wetland 8 30.77 18 0.69 Calcareous Meadow 1 25.00 6 1.50 Oak Forest 3 18.75 5 0.31 Mesic Prairie 1 14.29 2 0.29 Aspen Forest 5 13.51 30 0.81 Maple-Basswood Forest 1 12.50 1 0.13 11. Discus catskillensis (Pilsbry, 1898). Although usually considered distinct from Discus cronkhitei (Hubricht 1985, Turgeon et al., 1998), many individuals from many sites in the region proved to have shells with shapes intermediate between these two. Similar intergradation has also been noted in northeastern Minnesota, southern Ontario, and the Keweenaw Peninsula, suggesting that Pilsbry (1948) may have been correct in considering D. catskillensis a subspecies of D. cronkhitei. In deference to the current taxonomic treatment, and because of the lack of objective data to test morphometric such hypotheses, I have chosen to maintain these taxa as separate, with D. catskillensis representing those individuals possessing a more angular (as opposed to more rounded) body whorl margins. Based on this criteria, 4345 individuals were observed from 97 stations in 16 habitat types. Populations were significantly (p < 0.0000005) less frequent in grassland (0-17% of sites) as opposed to forest (58-76%) sites. Populations were most frequently encountered in Balsam-White Spruce, Paper Birch, Red Pine Forest, White Cedar, Black Spruce (found at 100% of all sites), Oak (87.5%), Aspen (78.38), Maple-Basswood, and Jack Pine (75%) forests. The largest populations were encountered in Jack Pine forest (62 individuals/sample), Black Ash wetland (50.5), Red Pine forest (49), Sedge Meadow (48), and Oak forest (45.31). Although found in every county, populations were significantly (p=0.00001) less frequent in the Red River Valley (21% of sites) as opposed to the other regions (50-87%). Habitat Occurrences % Frequency # Individuals Average Balsam-White Spruce Forest 2 100.00 71 35.50 Paper Birch Forest 2 100.00 28 14.00 Red Pine Forest 4 100.00 196 49.00
13
White Cedar Wetland 6 100.00 182 30.33 Black Spruce Wetland 3 100.00 85 28.33 Oak Forest 14 87.50 725 45.31 Aspen Forest 29 78.38 1181 31.92 Maple-Basswood Forest 6 75.00 245 30.63 Jack Pine Forest 3 75.00 248 62.00 Sedge Meadow 2 66.67 144 48.00 Floodplain Forest 1 50.00 84 42.00 Black Ash Wetland 6 50.00 606 50.50 Tamarack Wetland 13 50.00 521 20.04 Shrub Carr 1 33.33 8 2.67 Fen 3 17.65 20 1.18 Wet Prairie 1 9.09 1 0.09 12. Discus cronkhitei (Newcomb, 1865). 2083 individuals of this species were located from 83 sites in 15 habitat types. Populations tended (p=0.002597) to be twice as frequent in lowland (58-63% of sites) as opposed to upland (21-35%) habitats. It was most frequently encountered in Floodplain forest, Shrub Carr, Sedge Meadow (all 100%), Wet Prairie (72.73%), and White Cedar wetlands (66.67%). Largest populations were encountered in Shrub Carr (57.33 individuals/sample), Black Ash wetland (56.83), and Fen (45.35) habitats. Populations were found in all counties, and occurred in equal proportions among all physiographic regions. Habitat Occurrences % Frequency # Individuals Average Floodplain Forest 2 100.00 18 9.00 Shrub Carr 3 100.00 172 57.33 Sedge Meadow 3 100.00 7 2.33 Wet Prairie 8 72.73 92 8.36 White Cedar Wetland 4 66.67 37 6.17 Fen 11 64.71 771 45.35 Tamarack Wetland 14 53.85 123 4.73 Balsam-White Spruce Forest 1 50.00 1 0.50 Black Ash Wetland 6 50.00 682 56.83 Aspen Forest 16 43.24 107 2.89 Mesic Prairie 3 42.86 45 6.43 Black Spruce Wetland 1 33.33 1 0.33 Oak Forest 5 31.25 22 1.38 Maple-Basswood Forest 2 25.00 4 0.50 Jack Pine Forest 1 25.00 1 0.25 13. Euconulus alderi (Gray, 1840). First reported in North America from Iowa fens (Frest, 1990), this species has been found throughout the Great Lakes region in fens, tamarack swamp forests, and white cedar wetlands. Its mature shells are most easily distinguished from Euconulus fulvus by being < 2.8 mm in diameter, having a darker-orange color, more glassy
14
luster, and possessing spiral lines on the bottom that are more distinct than the transverse lines (Kerney & Cameron, 1979). Live material was verified as representing this taxon in 1999 by Robert Cameron. Although not morphometrically tested, it also appeared that the width of the nuclear whorl for E. alderi was slightly larger than that for E. fulvus. However, in North America E. alderi and E. fulvus are less distinct than in western European populations, with intermediate individuals being occasionally observed. Based on these criteria, 3094 individuals were observed from 82 sites and 11 habitat types. Populations demonstrated a strong (p < 0.0000005) preference for lowland (77-91%) vs. upland (9-21%) sites. Populations were most frequently encountered in Black Spruce wetland, Shrub Carr, Sedge Meadow, Fen (all 100% of sites), Tamarack Wetland (92.31%), Wet Prairie (81.82%) and Calcareous Meadow (75%) habitats. The largest populations were observed in Shrub Carr (93 individuals/site) and Fen (81.12) sites. Populations were found in all counties, and showed no significant difference in occurrence frequencies between physiographic regions. Habitat Occurrences % Frequency # Individuals Average Black Spruce Wetland 3 100.00 52 17.33 Shrub Carr 3 100.00 279 93.00 Sedge Meadow 3 100.00 132 44.00 Fen 17 100.00 1379 81.12 Tamarack Wetland 24 92.31 318 12.23 Wet Prairie 9 81.82 343 31.18 Calcareous Meadow 3 75.00 230 57.50 White Cedar Wetland 4 66.67 37 6.17 Black Ash Wetland 6 50.00 186 15.50 Mesic Prairie 3 42.86 8 1.14 Aspen Forest 6 16.22 130 3.51 14. Euconulus fulvus (Müller, 1774). 2231 individuals were located from 108 sites and 18 habitat types. Populations were significantly (p < 0.0000005) more frequent in upland forests (98.75% of surveyed sites) as compared to lowland forests (38%), upland grasslands (43%), and lowland grasslands (9%). Populations were most frequently encountered in Oak, MapleBasswood, Balsam-White Spruce, Paper Birch, Jack Pine, Red Pine, Floodplain (all 100% of surveyed sites), Aspen (97.3%), and Black Ash (75%) forests. The largest populations were found in Aspen (29.08 individuals/site), Maple-Basswood Forest (26.5), Oak (23.94), Red Pine (16.5) and Jack Pine (14.75), forests. Although found in all counties, populations tended (p=0.006493) to be less common in the Red River Valley (37% of sites) as compared to the other regions (54-80%). Habitat Occurrences % Frequency # Individuals Average Oak Forest 16 100.00 383 23.94 Maple-Basswood Forest 8 100.00 212 26.50 Balsam-White Spruce Forest 2 100.00 13 6.50
15
Paper Birch Forest 2 100.00 8 4.00 Jack Pine Forest 4 100.00 59 14.75 Red Pine Forest 4 100.00 66 16.50 Floodplain Forest 2 100.00 9 4.50 Aspen Forest 36 97.30 1076 29.08 Black Ash Wetland 9 75.00 134 11.17 White Cedar Wetland 3 50.00 47 7.83 Xeric Prairie 2 50.00 34 8.50 Sand Prairie 1 50.00 11 5.50 Mesic Prairie 3 42.86 68 9.71 Black Spruce Wetland 1 33.33 18 6.00 Sedge Meadow 1 33.33 23 7.67 Calcareous Meadow 1 25.00 1 0.25 Tamarack Wetland 5 19.23 58 2.23 Wet Prairie 1 9.09 11 1.00 15. Gastrocopta abbreviata (Sterki, 1909). This primarily western species was only observed from two sites: a wet prairie (Malmberg Prairie in Polk County) and an old field (at Lake Itasca State Park in Clearwater County). As this latter site was collected via field sieving, it was not included for ecological analysis. This species differs from the similar Gastrocopta similis by having a peg-shaped columellar lamella, a well-defined basal lamellae, and by having both palatal lamellae originate at the same distance from the aperture. The presence of this species in a disturbed old field makes it likely that it occurs in additional such sites throughout the region. As such, listing of this species does not seem warranted. Habitat Occurrences % Frequency # Individuals Average Wet Prairie 1 9.09 1 0.09 16. Gastrocopta contracta (Say, 1822). 974 individuals of this species were observed from 47 sites and 12 habitat types. This species tended (p=0.049078) to be at least half as frequent in upland grasslands as the other three major habitat types. It was most frequently encountered in Maple-Basswood forest (75% of sites), Shrub Carr (66.67%), Oak forest (56.25%), and Balsam-White Spruce forest (50%). The largest populations were recorded from Sedge Meadow (32.67 individuals/sample), Black Ash wetland (20.25), Shrub Carr (15.67), and Maple-Basswood forest (12.13). This species was restricted to the southwestern 2/3 of the region, being absent from the bulk of Beltrami, Lake of the Woods, and Roseau counties. A significant (p < 0.0000005) variation among physiographic regions was observed, being most common in the Leaf Hills (67% of sites) but absent from the Agassiz lowlands. Habitat Occurrences % Frequency # Individuals Average Maple-Basswood Forest 6 75.00 97 12.13 Shrub Carr 2 66.67 47 15.67
16
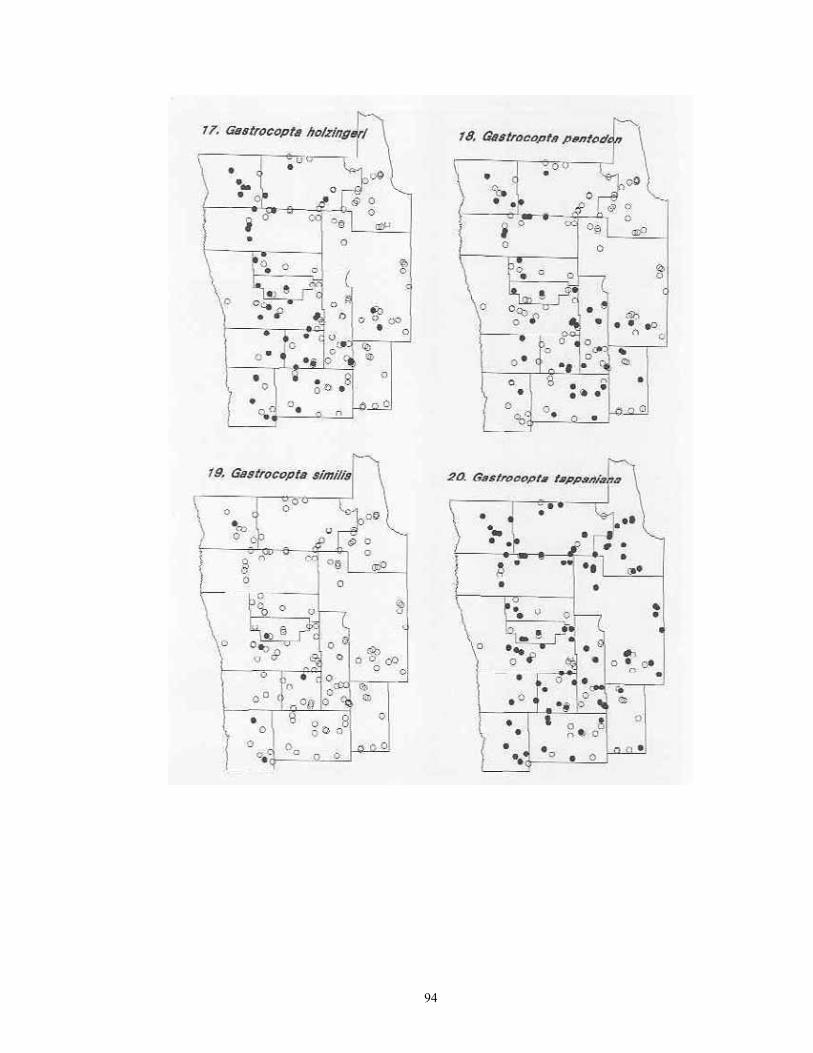
Oak Forest 9 56.25 80 5.00 Balsam-White Spruce Forest 1 50.00 2 1.00 Black Ash Wetland 5 41.67 243 20.25 Sedge Meadow 1 33.33 98 32.67 Wet Prairie 3 27.27 22 2.00 Aspen Forest 10 27.03 236 6.38 Xeric Prairie 1 25.00 13 3.25 Calcareous Meadow 1 25.00 21 5.25 Fen 4 23.53 65 3.82 Tamarack Wetland 2 7.69 50 1.92 17. Gastrocopta holzingeri (Sterki, 1889). 2752 individuals were recovered from 53 sites and 11 habitat types. It demonstrated strong (p < 0.0000005) variation in its habitat preferences, being found in 86% of Upland Grassland, but only 2% of Lowland Forest sites. It was also relatively frequent (41%) in upland forest. It was most commonly encountered in Xeric and Sand prairie (100% of sites), Mesic prairie (71.43%), Maple-Basswood forest, Balsam-White Spruce forest, and Calcareous Meadow (all 50%). The largest populations were encountered in Maple-Basswood forest (136.50 individuals/sample) and Xeric prairie (91.5). This species shares distributions almost identical to the previous species, being essentially limited to sites in the southwest half of the region. A significant (p=0.000001) variation was noted in occurrence frequency between physiographic regions, being most common in the Red River Valley (55%), and least in the Agassiz Lowlands (5%). Habitat Occurrences % Frequency # Individuals Average Xeric Prairie 4 100.00 366 91.50 Sand Prairie 2 100.00 44 22.00 Mesic Prairie 5 71.43 148 21.14 Maple-Basswood Forest 4 50.00 1092 136.50 Balsam-White Spruce Forest 1 50.00 5 2.50 Calcareous Meadow 2 50.00 28 7.00 Aspen Forest 15 40.54 797 21.54 Oak Forest 6 37.50 178 11.13 Wet Prairie 4 36.36 72 6.55 Sedge Meadow 1 33.33 12 4.00 Black Ash Wetland 1 8.33 10 0.83 18. Gastrocopta pentodon (Say, 1821). 1751 individuals of this species were observed at 48 sites and 8 habitat types. It demonstrated strong (p < 0.0000005) occurrence preference for upland forest (49% of sites), while being almost absent from grasslands (0-7%). It was most frequently encountered in Oak (68.75%) and Maple-Basswood (62.50) forest. The largest populations were found in Aspen (29.49 individuals/sample), Oak (20.19), Maple-Basswood (19.75) forest and Black Ash wetlands (11.83). Like the previous two species, populations were largely limited to the southwestern half of the study region. Significant (p=0.000001)
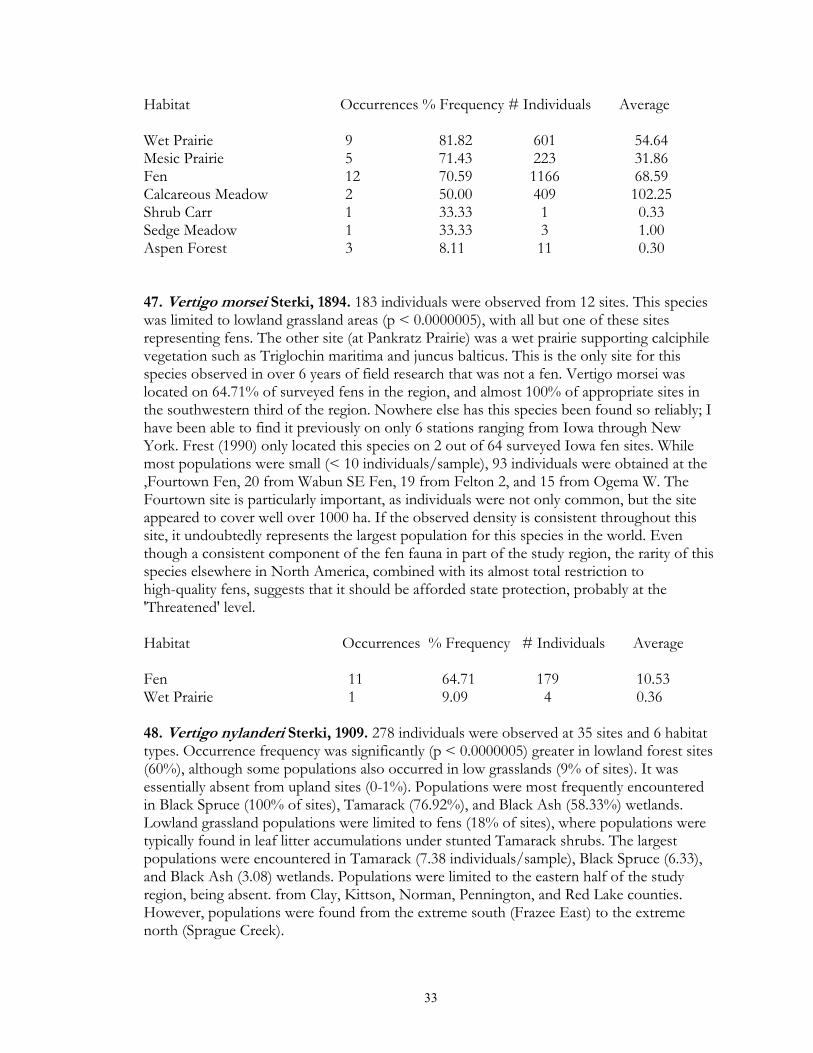
17
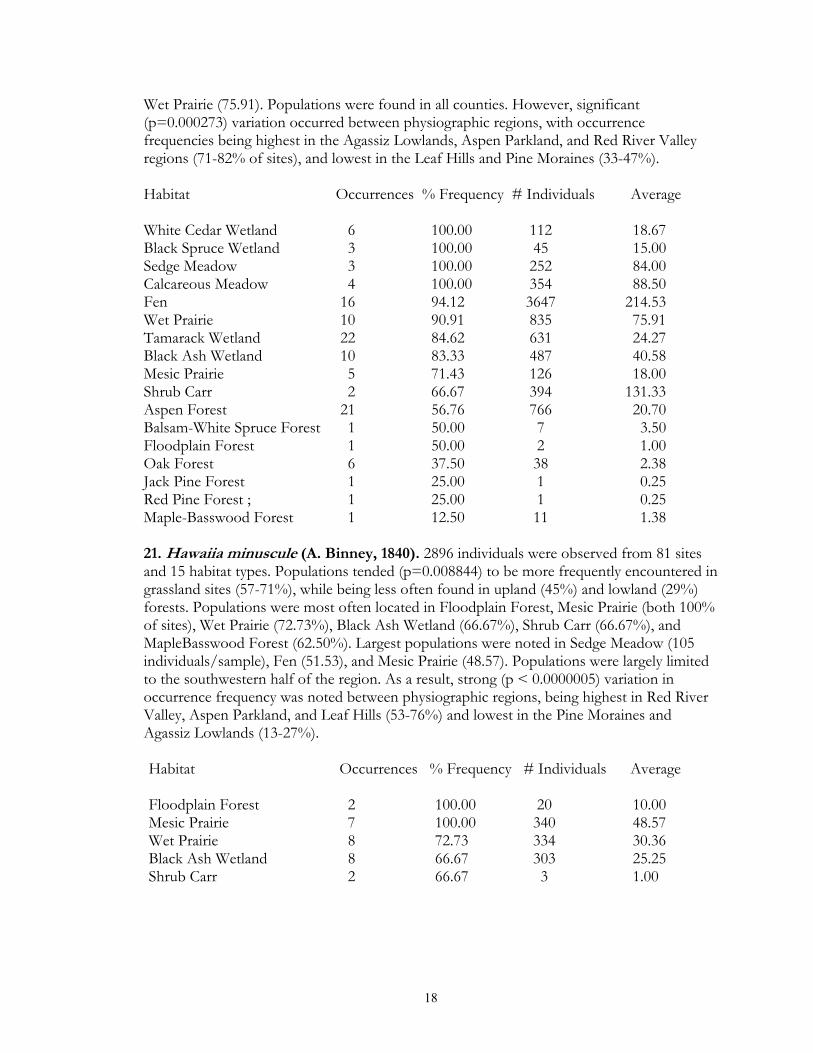
variation in occurrence frequency was noted between physiographic regions, being highest in the Leaf Hills (60%) and lowest in the Red River Valley (8%) and Agassiz Lowlands (5%). Habitat Occurrences % Frequency # Individuals Average Oak Forest 11 68.75 323 20.19 Maple-Basswood Forest , 5 62.50 158 19.75 Paper Birch Forest 1 50.00 1 0.50 Black Ash Wetland 6 50.00 142 11.83 Sand Prairie 1 50.00 1 0.50 Aspen Forest 18 48.65 1091 29.49 Red Pine Forest 1 25.00 5 1.25 Tamarack Wetland 2 7.69 30 1.15 19. Gastrocopta similis (Sterki, 1909). 123 individuals were observed from 6 sites and 5 habitat types. These sites represent this species northwestern range limit. It differs from the similar Gastrocopta abbreviata by having a plate-shaped columellar lamellae, lacking a basal lamellae, and by having its lower palatal lamella more deeply set from the aperture as compared to the upper palatal. Populations strongly trended (p=0.001043) towards favoring of grassland sites, being present in 21% up surveyed upland grasslands. Populations were most commonly encountered in Xeric Prairie (50% of sites), Calcareous Meadow (25%) and Mesic Prairie (14.29%). The largest population (74 individuals/sample) was noted in an anthropogenic Ash-Willow windbreak located next to a prairie. Populations were essentially limited to the western fourth of the study region, strongly trending (p = 0.00534) to be more frequent in the Red River Valley (13% of sites). Even though not common in the study region, state listing is not warranted, as this species is common and throughout bedrock glades of the southeast, with populations often exceeding 100 individuals/sample. Habitat Occurrences % Frequency # Individuals Average Xeric Prairie 2 50.00 13 3.25 Calcareous Meadow 1 25.00 9 2.25 Mesic Prairie 1 14.29 21 3.00 Wet Prairie 1 9.09 6 0.55 Black Ash Wetland 1 8.33 74 6.17 20. Gastrocopta tappaniana (C.B. Adams, 1842). 7709 individuals were located from 117 sites and 17 habitat types. It demonstrated strong (p < 0.0000005) preferences to lowland habitats, being found in 85% of lowland forest and 94% of lowland grassland sites, while only being encountered in 43% of upland forest and upland grassland sites. It was most frequently observed in White Cedar wetland, Black Spruce wetland, Sedge Meadow, Calcareous Meadow (100% of surveyed sites), Fen (94.12%), Wet Prairie (90.91%), Tamarack wetland (84.62%), and Black Ash Wetland (83.33%) sites. The largest populations were encountered in Fen (214.53 individuals/sample), Shrub Carr (131.33), Calcareous Meadow (88.5), Sedge Meadow (84), and
18
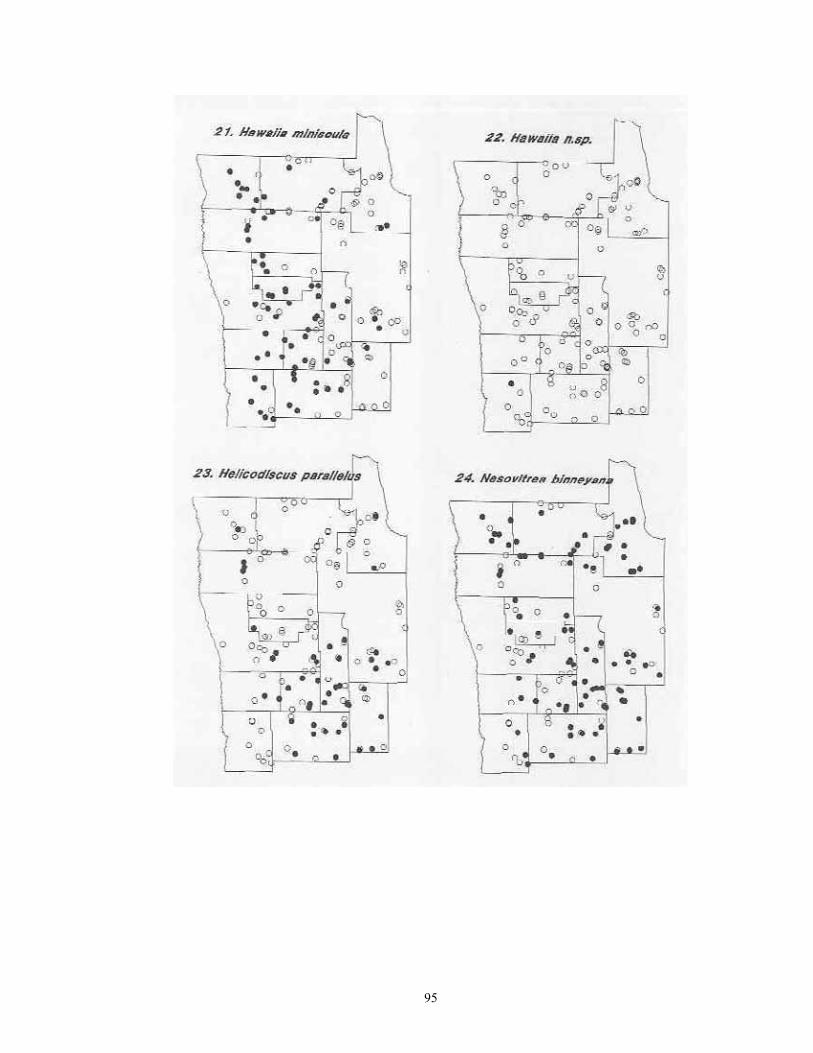
Wet Prairie (75.91). Populations were found in all counties. However, significant (p=0.000273) variation occurred between physiographic regions, with occurrence frequencies being highest in the Agassiz Lowlands, Aspen Parkland, and Red River Valley regions (71-82% of sites), and lowest in the Leaf Hills and Pine Moraines (33-47%). Habitat Occurrences % Frequency # Individuals Average White Cedar Wetland 6 100.00 112 18.67 Black Spruce Wetland 3 100.00 45 15.00 Sedge Meadow 3 100.00 252 84.00 Calcareous Meadow 4 100.00 354 88.50 Fen 16 94.12 3647 214.53 Wet Prairie 10 90.91 835 75.91 Tamarack Wetland 22 84.62 631 24.27 Black Ash Wetland 10 83.33 487 40.58 Mesic Prairie 5 71.43 126 18.00 Shrub Carr 2 66.67 394 131.33 Aspen Forest 21 56.76 766 20.70 Balsam-White Spruce Forest 1 50.00 7 3.50 Floodplain Forest 1 50.00 2 1.00 Oak Forest 6 37.50 38 2.38 Jack Pine Forest 1 25.00 1 0.25 Red Pine Forest ; 1 25.00 1 0.25 Maple-Basswood Forest 1 12.50 11 1.38 21. Hawaiia minuscule (A. Binney, 1840). 2896 individuals were observed from 81 sites and 15 habitat types. Populations tended (p=0.008844) to be more frequently encountered in grassland sites (57-71%), while being less often found in upland (45%) and lowland (29%) forests. Populations were most often located in Floodplain Forest, Mesic Prairie (both 100% of sites), Wet Prairie (72.73%), Black Ash Wetland (66.67%), Shrub Carr (66.67%), and MapleBasswood Forest (62.50%). Largest populations were noted in Sedge Meadow (105 individuals/sample), Fen (51.53), and Mesic Prairie (48.57). Populations were largely limited to the southwestern half of the region. As a result, strong (p < 0.0000005) variation in occurrence frequency was noted between physiographic regions, being highest in Red River Valley, Aspen Parkland, and Leaf Hills (53-76%) and lowest in the Pine Moraines and Agassiz Lowlands (13-27%). Habitat Occurrences % Frequency # Individuals Average
Maple-Basswood Forest 5 62.50 305 38.13 Oak Forest 9 56.25 77 4.81 Fen 9 52.94 876 51.53 Xeric Prairie 2 50.00 7 1.75 Sand Prairie 1 50.00 26 13.00 Calcareous Meadow 2 50.00 8 2.00 Aspen Forest 17 45.95 215 5.81 Black Spruce Wetland 1 33.33 56 18.67 Sedge Meadow 1 33.33 315 105.00 Tamarack Wetland 2 7.69 11 0.42 22. Hawaiia n.sp. This taxon was first mentioned by Frest (1990) during his inventory of Iowa fen land snails. It differs from the common Hawaiia miniscula by possessing a thickened apertural callus. It was initially reported from less than 2 dozen Iowa sites, and has subsequently been located at two sites in southern Wisconsin. It is limited to fen sites, and may often co-occur with H. miniscula. A single site was located in the study area from the large Felton Prairie fen. It was not present at the nearby smaller fen which had been subjected to fire management. At total of 31 individuals were observed. This site is approximately 300 miles north of the next nearest known population in northwestern Iowa. It likely occurs in Minnesota in other high quality fens. Given its strong habitat restriction, and limitation to a narrow geographic range centered on the corn-belt, listing of this species in Minnesota may be warranted. Habitat Occurrences % Frequency # Individuals Average Fen 1 5.88 31 1.82 23. Helicodiscus parallelus (Say, 1817). 400 individuals were uncovered from 48 sites and 13habitat types. Strong (p a 0.000003) preferences were noted in occurrence frequency among the four main habitat groups, with populations being most often found in upland forest (44% of sites) and upland grassland (29%) sites. It was least encountered in lowland grasslands (3%). It was most often found in Paper Birch (100% of sites), Maple-Basswood and Red Pine both 75%) forest habitats. The largest populations were located in Maple-Basswood forest (10.5 individuals/sample), Black Ash wetland (8.92), and Sand prairie (6). This species was much more prevalent in the southern half of the region. As such, strong (p < 0.0000005) variation was noted in occurrence frequency among physiographic regions, being highest in the Pine Moraines (53% of sites) and Leaf Hills (47%), and lowest in the Agassiz lowlands (5%). Habitat Occurrences % Frequency # Individuals Average
Paper Birch Forest 2 100.00 8 4.00 Maple-Basswood Forest 6 75.00 84 10.50 Red Pine Forest 3 75.00 9 2.25 Sand Prairie 1 50.00 12 6.00
20
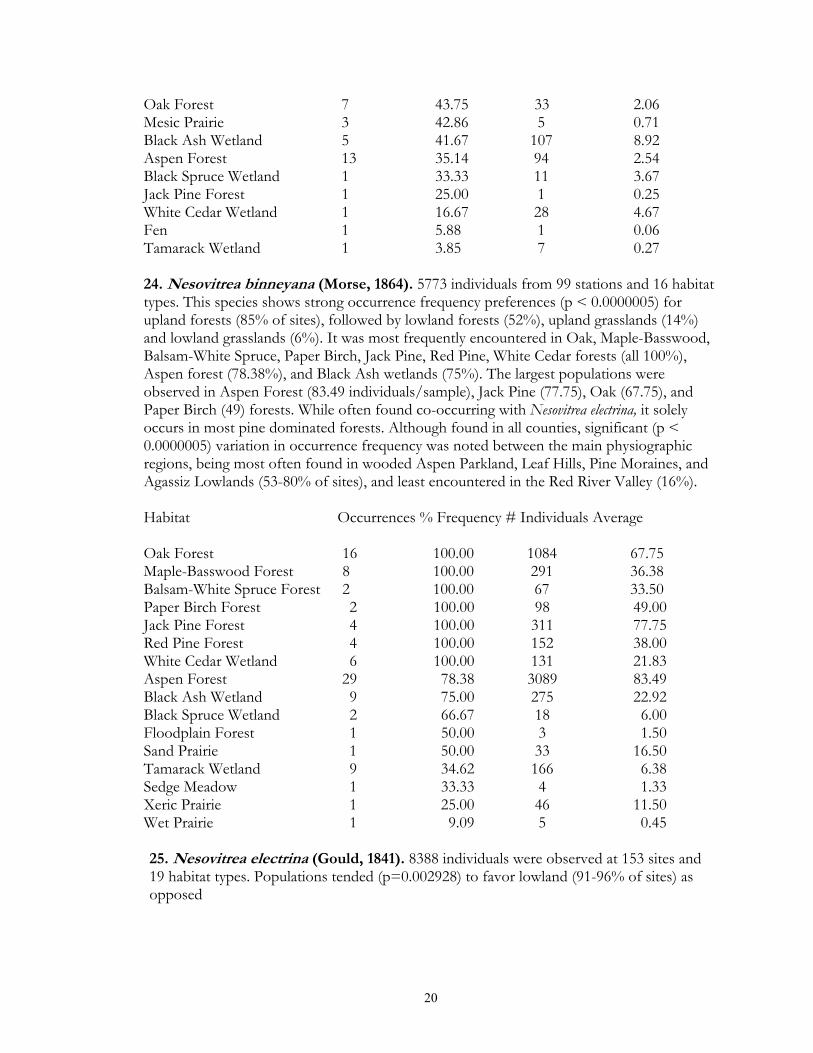
Oak Forest 7 43.75 33 2.06 Mesic Prairie 3 42.86 5 0.71 Black Ash Wetland 5 41.67 107 8.92 Aspen Forest 13 35.14 94 2.54 Black Spruce Wetland 1 33.33 11 3.67 Jack Pine Forest 1 25.00 1 0.25 White Cedar Wetland 1 16.67 28 4.67 Fen 1 5.88 1 0.06 Tamarack Wetland 1 3.85 7 0.27 24. Nesovitrea binneyana (Morse, 1864). 5773 individuals from 99 stations and 16 habitat types. This species shows strong occurrence frequency preferences (p < 0.0000005) for upland forests (85% of sites), followed by lowland forests (52%), upland grasslands (14%) and lowland grasslands (6%). It was most frequently encountered in Oak, Maple-Basswood, Balsam-White Spruce, Paper Birch, Jack Pine, Red Pine, White Cedar forests (all 100%), Aspen forest (78.38%), and Black Ash wetlands (75%). The largest populations were observed in Aspen Forest (83.49 individuals/sample), Jack Pine (77.75), Oak (67.75), and Paper Birch (49) forests. While often found co-occurring with Nesovitrea electrina, it solely occurs in most pine dominated forests. Although found in all counties, significant (p < 0.0000005) variation in occurrence frequency was noted between the main physiographic regions, being most often found in wooded Aspen Parkland, Leaf Hills, Pine Moraines, and Agassiz Lowlands (53-80% of sites), and least encountered in the Red River Valley (16%). Habitat Occurrences % Frequency # Individuals Average Oak Forest 16 100.00 1084 67.75 Maple-Basswood Forest 8 100.00 291 36.38 Balsam-White Spruce Forest 2 100.00 67 33.50 Paper Birch Forest 2 100.00 98 49.00 Jack Pine Forest 4 100.00 311 77.75 Red Pine Forest 4 100.00 152 38.00 White Cedar Wetland 6 100.00 131 21.83 Aspen Forest 29 78.38 3089 83.49 Black Ash Wetland 9 75.00 275 22.92 Black Spruce Wetland 2 66.67 18 6.00 Floodplain Forest 1 50.00 3 1.50 Sand Prairie 1 50.00 33 16.50 Tamarack Wetland 9 34.62 166 6.38 Sedge Meadow 1 33.33 4 1.33 Xeric Prairie 1 25.00 46 11.50 Wet Prairie 1 9.09 5 0.45 25. Nesovitrea electrina (Gould, 1841). 8388 individuals were observed at 153 sites and 19 habitat types. Populations tended (p=0.002928) to favor lowland (91-96% of sites) as opposed
21
to upland (71-76%) habitats. Populations were most frequently encountered in Balsam-White Spruce, Paper Birch, Floodplain, Tamarack, Black Spruce forests, Shrub Carr, Mesic Prairie, Sedge Meadow, Fen (all 100%), Black Ash wetland (91.67%), Aspen forest (89.19%), White Cedar wetland (83.33%), Wet Prairie (81.82%), Maple-Basswood forest and Calcareous Meadow (both 75%). The largest populations were found in Shrub Carr (130.67), Fen (130.59), Black Ash wetland (110.5), Sedge Meadow (99.67), and Calcareous Meadow (80.5) habitats. Populations occurred in all counties, and exhibited no significant variation between physiographic regions. Habitat Occurrences % Frequency # Individuals Average Balsam-White Spruce Forest 2 100.00 20 10.00 Paper Birch Forest 2 100.00 9 4.50 Floodplain Forest 2 100.00 77 38.50 Tamarack Wetland 26 100.00 1332 51.23 Black Spruce Wetland 3 100.00 126 42.00 Shrub Carr 3 100.00 392 130.67 Mesic Prairie 7 100.00 172 24.57 Sedge Meadow 3 100.00 299 99.67 Fen 17 100.00 2220 130.59 Black Ash Wetland 11 91.67 1326 110.50 Aspen Forest 33 89.19 1067 28.84 White Cedar Wetland 5 83.33 116 19.33 Wet Prairie 9 81.82 407 37.00 Maple-Basswood Forest 6 75.00 55 6.88 Calcareous Meadow 3 75.00 322 80.50 Oak Forest 11 68.75 225 14.06 Red Pine Forest 2 50.00 154 38.50 Xeric Prairie 2 50.00 53 13.25 Jack Pine Forest 1 25.00 16 4.00 26. Oxyloma retusa (I. Lea, 1834). 1404 individuals were located from 31 sites and 7 habitat types. Populations strongly (p < 0.0000005) favored lowland grassland habitats (occurring on 66% of sites) as opposed to the remaining habitat groups (1-14%). Populations were most frequently encountered in Fen (88.24% of sites), Shrub Carr (66.67%), and Wet Prairie (63.64%) habitats. The largest populations were found in Sedge Meadow (58.67 individuals/sample) and Fen (51.18) habitats. Populations were generally restricted to the southern 2.3 of the region. Populations tended (p=0.001243) to be more frequent in the Red River Valley (39% of sites), Aspen Parkland (18%), and Pine Moraines (12%). Habitat Occurrences % Frequency # Individuals Average Fen 15 88.24 870 51.18 Shrub Carr 2 66.67 37 12.33
22
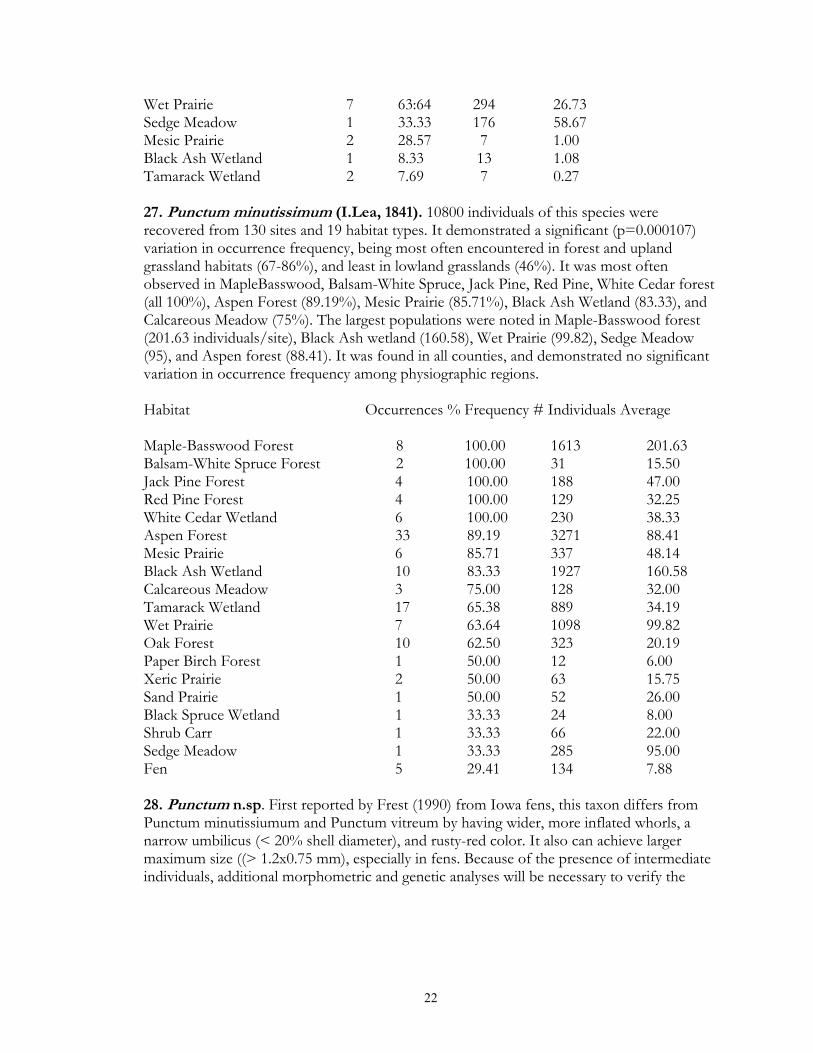
Wet Prairie 7 63:64 294 26.73 Sedge Meadow 1 33.33 176 58.67 Mesic Prairie 2 28.57 7 1.00 Black Ash Wetland 1 8.33 13 1.08 Tamarack Wetland 2 7.69 7 0.27 27. Punctum minutissimum (I.Lea, 1841). 10800 individuals of this species were recovered from 130 sites and 19 habitat types. It demonstrated a significant (p=0.000107) variation in occurrence frequency, being most often encountered in forest and upland grassland habitats (67-86%), and least in lowland grasslands (46%). It was most often observed in MapleBasswood, Balsam-White Spruce, Jack Pine, Red Pine, White Cedar forest (all 100%), Aspen Forest (89.19%), Mesic Prairie (85.71%), Black Ash Wetland (83.33), and Calcareous Meadow (75%). The largest populations were noted in Maple-Basswood forest (201.63 individuals/site), Black Ash wetland (160.58), Wet Prairie (99.82), Sedge Meadow (95), and Aspen forest (88.41). It was found in all counties, and demonstrated no significant variation in occurrence frequency among physiographic regions. Habitat Occurrences % Frequency # Individuals Average Maple-Basswood Forest 8 100.00 1613 201.63 Balsam-White Spruce Forest 2 100.00 31 15.50 Jack Pine Forest 4 100.00 188 47.00 Red Pine Forest 4 100.00 129 32.25 White Cedar Wetland 6 100.00 230 38.33 Aspen Forest 33 89.19 3271 88.41 Mesic Prairie 6 85.71 337 48.14 Black Ash Wetland 10 83.33 1927 160.58 Calcareous Meadow 3 75.00 128 32.00 Tamarack Wetland 17 65.38 889 34.19 Wet Prairie 7 63.64 1098 99.82 Oak Forest 10 62.50 323 20.19 Paper Birch Forest 1 50.00 12 6.00 Xeric Prairie 2 50.00 63 15.75 Sand Prairie 1 50.00 52 26.00 Black Spruce Wetland 1 33.33 24 8.00 Shrub Carr 1 33.33 66 22.00 Sedge Meadow 1 33.33 285 95.00 Fen 5 29.41 134 7.88 28. Punctum n.sp. First reported by Frest (1990) from Iowa fens, this taxon differs from Punctum minutissiumum and Punctum vitreum by having wider, more inflated whorls, a narrow umbilicus (< 20% shell diameter), and rusty-red color. It also can achieve larger maximum size ((> 1.2x0.75 mm), especially in fens. Because of the presence of intermediate individuals, additional morphometric and genetic analyses will be necessary to verify the
23
status of this taxon. 2190 individuals were located at 35 and 8 habitat types. Although limited in Iowa and Wisconsin to fen habitats, in northwestern Minnesota, it occurs in a wider range of habitats, including lowland forest, shrub carrs wet prairie, and other wet habitats. This species demonstrates a strong (p < 0.0000005) affinity for lowland habitats (33-39% of sites), while being almost absent (0-1%) from upland sites. It was most frequently encountered in Sedge Meadow` (100% of sites), Fen (76.47%), and Black Spruce wetland (66.67%) habitats. The largest populations were noted from Fen (89.65 individuals/sample), Shrub Carr (85), and Sedge Meadow (57.33) sites. This taxon was essentially found across the entire region, although it was absent from the extreme southeast and west-central. However, no significant differences were noted in occurrence frequency among the physiographic regions. Habitat Occurrences % Frequency # Individuals Average Sedge Meadow 3 100.00 172 57.33 Fen 13 76.47 1524 89.65 Black Spruce Wetland 2 66.67 47 15.67 Tamarack Wetland 10 38.46 133 5.12 Black Ash Wetland 4 33.33 33 2.75 Shrub Carr 1 33.33 255 85.00 Wet Prairie 1 9.09 6 0.55 Aspen Forest 1 2.70 20 0.54 29. Punctum vitreum H.B. Baker, 1930. This species is distinguished from both other Punctum taxa by having every 4th or 5th rib being markedly taller than the intervening, ones (Pilsbry, 1948). However, identification is often made difficult because of the presence of intermediate individuals, and the erosion of larger ribs, making them almost indistinguishable from the smaller. This species appears to replace Punctum minutussimum south of 450 N., and is the predominant form present in southern Wisconsin and Iowa. 169 individuals from 6 sites and 4 habitat types were noted. These individuals possessed only slightly more prominent large ribs, and seem to represent the intermediate forms that often occur near the juncture of both species ranges. No significant variation in occurrence frequency were noted between major habitat groups. It was most frequently encountered in Shrub Carr (33.33% of sites), Oak Forest (18.75) and Mesic Prairie (14.29). Largest populations were noted from Oak Forest (8.38 individuals/sample) and Shrub Carr (6.33). Although no significant variation in occurrence frequency was noted between physiographic regions, it was limited to sites in the far south (Clay, Becker, Mahnomen counties). Habitat Occurrences % Frequency # Individuals Average Shrub Carr 1 33.33 19 6.33 Oak Forest 3 18.75 134 8.38 Mesic Prairie 1 14.29 12 1.71 Fen 1 5.88 4 0.24
24
30. Pupilla muscorum (Linné, 1758). This species was found twice in the region through field sieving. Thus, no quantitative assessment of population size can be made. It has not, previously been reported from Minnesota. Both populations (on Lake Bemidji and Lake Itasca) were found on dry (sometimes heavily disturbed) lakeshore banks adjacent to state park boat ramps. It was unsuccessfully searched for at a number of other lakeshores in the region, and is thus likely not common. It is not clear if these represent native populations that are limited to dry lakeshore banks preferred for lakeshore access, or whether this species is nonnative and being transported to such sites by recreational activities. If further surveys . document its present rarity, state listing is probably warranted, especially to help better focus further development of boat ramp access in these areas. 31. Striatura exigua (Stimpson, 1847). 899 individuals were located from 31 sites and 11 habitat types. It demonstrated a strong (p=0.000642) preference in occurrence frequency to forest (especially lowland) sites (16-33%) as opposed to grasslands (0-3%). It was most frequently encountered in Black Spruce wetland (66.67% of sites), Balsam-White Spruce, Paper Birch, and Red Pine forest sites (all 50%). The largest populations were found in Black Spruce wetland (24 individuals/sample), Paper Birch forest (19), Red Pine forest (17.5), and White Cedar wetland (14.33). This species is limited to northern forest areas in the east of the study region. This variation in occurrence frequency was strong (p < 0.0000005), being most often located in the Leaf Hills and Pine Moraines (33-39%), but being absent from the Red River Valley and Aspen Parkland. Habitat Occurrences % Frequency # Individuals Average Black Spruce Wetland 2 66.67 72 24.00 Balsam-White Spruce Forest 1 50.00 9 4.50 Paper Birch Forest 1 50.00 38 19.00 Red Pine Forest 2 50.00 70 17.50 Black Ash Wetland 5 41.67 99 8.25 Maple-Basswood Forest 3 37.50 44 5.50 White Cedar Wetland 2 33.33 86 14.33 Sedge Meadow 1 33.33 3 1.00 Tamarack Wetland 8 30.77 247 9.50 Oak Forest 3 18.75 46 2.88 Aspen Forest 3 8.11 185 5.00 32. Striatura milium (Morse, 1859). 7527 individuals were collected at 117 sites and 16 habitat types. Like the previous species, it showed a strong (p < 0.0000005) occurrence preference to forested sites (83-86%) as opposed to grasslands (7-11%). It was most frequently encountered in Oak, Maple-Basswood, Balsam-White Spruce, Paper Birch, Jack Pine, and Red Pine forests, White Cedar and Black Spruce wetlands (all 100%), Tamarack wetland (92.31%), Aspen forest (77.76%), and Black Ash wetlands (75%). The largest populations were seen in Jack Pine forest (132.75-individuals/sample), Sedge Meadow (100), Red Pine (96.25) and Aspen (78.38) forest. While found in all counties, it became increasingly less frequent towards the southwest. Strong (p < 0.0000005) variation in occurrence frequency was noted between physiographic regions, being most frequent in the Agassiz Lowlands, Pine Moraines, and Leaf Hills (82-93%), and least in the Red River Valley (11%).
25
Habitat Occurrences % Frequency # Individuals Average Oak Forest 16 100.00 836 52.25 Maple-Basswood Forest 8 100.00 225 28.13 Balsam-White Spruce Forest 2 100.00 104 52.00 Paper Birch Forest 2 100.00 50 25.00 Jack Pine Forest 4 100.00 531 132.75 Red Pine Forest 4 100.00 385 96.25 White Cedar Wetland 6 100.00 334 55.67 Black Spruce Wetland 3 100.00 129 43.00 Tamarack Wetland 24 92.31 860 33.08 Aspen Forest 29 78.38 2877 77.76 Black Ash Wetland 9 75.00 835 69.58 Floodplain Forest 1 50.00 21 10.50 Sand Prairie 1 50.00 35 17.50 Sedge Meadow 1 33.33 300 100.00 Fen 2 11.76 2 0.12 Wet Prairie 1 9.09 3 0.27 33. Strobilops afnis Pilsbry, 1893. 527 individuals were collected from 7 sites and 4 habitat types. These populations represent the northwestern range limit for this species, and are disjunct 200 miles from the nearest previously known sites near the Twin Cities. Populations tended (p=0.012248) to be limited to lowland habitats (6-11% of sites), and were absent from upland sites. Populations were most frequently encountered in Black Spruce wetland, Shrub Carr (both 33% of sites), and Fen (23.53%) sites. The largest populations were found in Fen (28.82 individuals/sample) and Shrub Carr (10.00). Although no significant trends on occurrence frequency were noted between physiographic regions, populations were limited to the prairie-forest border in the southern half of the study region. As this species is one of the most characteristic and common taxa of fens in Iowa and southern Wisconsin, it likely occurs on most Minnesota fens sites to the south and east of this area. As such, even though rare in northwestern Minnesota, it likely does not warrant legal protection. Habitat Occurrences % Frequency # Individuals Average Black Spruce Wetland 1 33.33 1 0.33 Shrub Carr 1 33.33 30 10.00 Fen 4 23.53 490 28.82 Tamarack Wetland 1 3.85 6 0.23
26
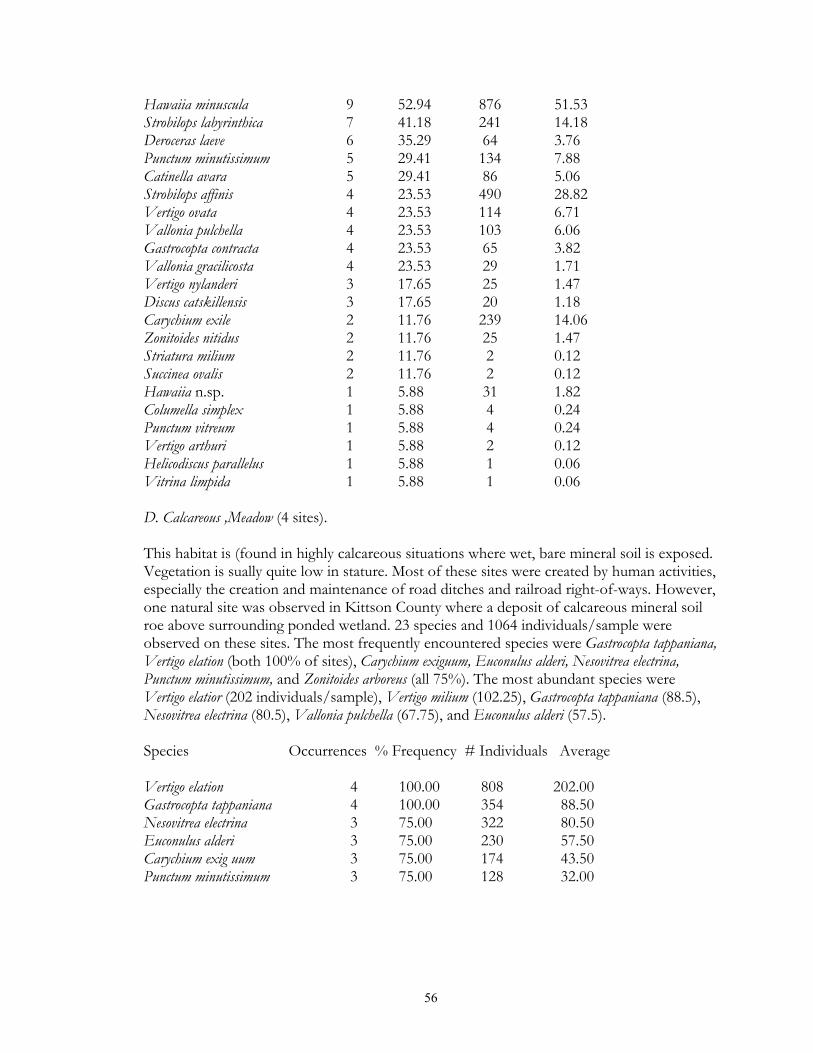
34. Strobilops labyrintbica (Say, 1817). 9778 individuals were located from 110 sites and 18 habitat types. It demonstrated strong (p < 0.0000005) variation in occurrence frequency between the major habitat groups, being most common in upland forests ((81% of sites), followed by lowland forests (65%), lowland grasslands (29%), and upland grasslands (7%). It was most frequently encountered in Maple-Basswood, Balsam-White Spruce, Paper Birch, Jack Pine, Red Pine, and White Cedar forests (all 100%), Oak (87.5%), Aspen forest (75.68%), and Black Ash wetlands (75%). The largest populations were observed in Sedge Meadow (197.67 individuals/sample), Aspen forest (102.59), Black Ash wetland (99.42), Shrub Carr (94.33), Jack Pine (91), Oak (81.25) and Paper Birch (80.5) forests. Although found in all counties, significant (p < 0.0000005) variation was observed in occurrence frequency between physiographic regions, being. most common in the Leaf Hills and Pine Moraines (78-87%), and least in the Reel River Valley (21%). Habitat Occurrences % Frequency # Individuals Average Maple-Basswood Forest 8 100.00 365 45.63 Balsam-White Spruce Forest 2 100.00 53 26.50 Paper Birch Forest 2 100.00 161 80.50 Jack Pine Forest 4 100.00 364 91.00 Red Pine Forest 4 100.00 182 45.50 White Cedar Wetland 6 100.00 278 46.33 Oak Forest 14 87.50 1300 81.25 Aspen Forest 28 75.68 3796 102.59 Black Ash Wetland 9 75.00 1193 99.42 Black Spruce Wetland 2 66.67 67 22.33 Tamarack Wetland 15 57.69 845 32.50 Floodplain Forest 1 50.00 4 2.00 Fen 7 41.18 241 14.18 Shrub Carr 1 33.33 283 94.33 Sedge Meadow 1 33.33 593 197.67 Xeric Prairie 1 25.00 39 9.75 Calcareous Meadow 1 25.00 1 0.25 Wet Prairie 1 9.09 13 1.18 35. Succinea ovalis Say, 1817. 593 individuals were collected from 30 sites and 11 habitat types. Even though usually considered a wetland species, no significant variation in occurrence frequency was noted among the 4 major habitat groups. Fully 20% of upland forest sites were found to harbor populations. The habitats with the highest occurrence frequency were Floodplain Forest (100%), Sedge Meadow (66.67%), and Paper Birch forest (50%). The largest populations were encountered in Floodplain Forest (38.5 individuals/sample), Black Ash wetland (19.58), and Sedge Meadow (10). Populations were primarily restricted to the north and west, being absent from Clearwater, Hubbard, and Mahnomen counties. Significant (p=0.000771) variation in occurrence frequency was noted
27
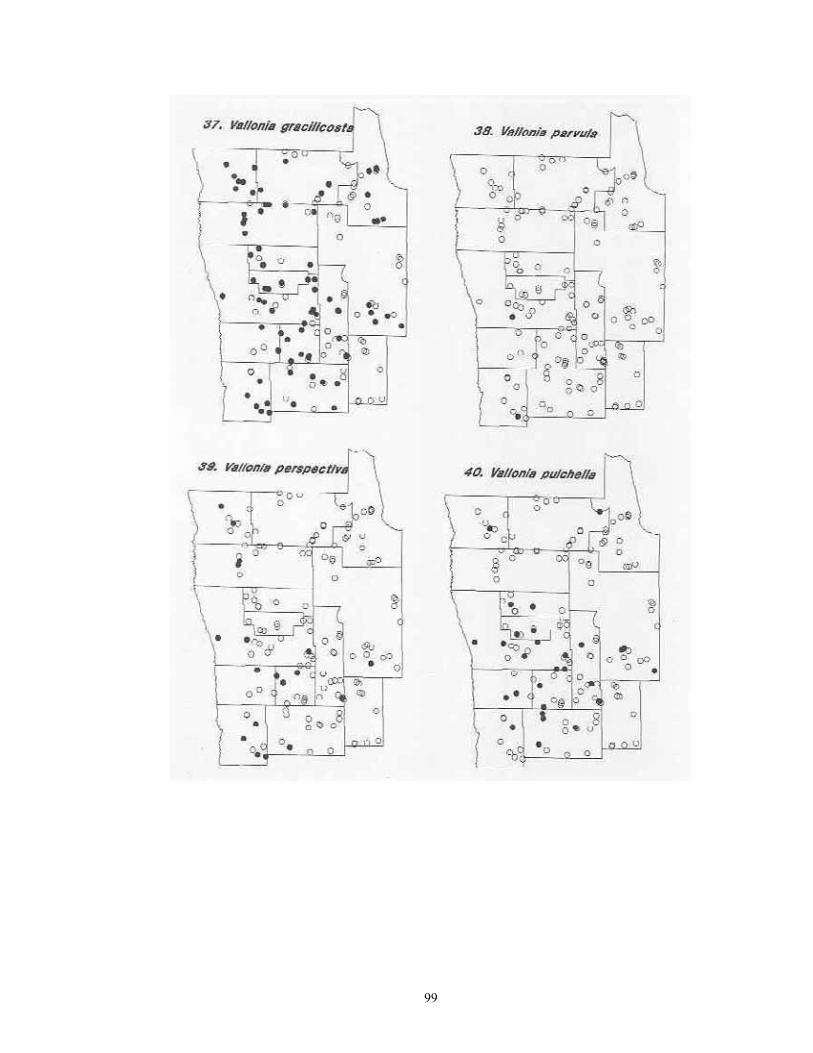
between physiographic provinces, being highest in the Agassiz Lowlands Aspen Parkland (2633%), and lowest in the Leaf Hills and Pine Moraines (4-7%). Habitat Occurrences % Frequency # Individuals Average Floodplain Forest 2 100.00 77 38.50 Sedge Meadow 2 66.67 30 10.00 Paper Birch Forest 1 50.00 3 1.50 . Black Ash Wetland 4 33.33 235 19.58 Shrub Carr 1 33.33 22 7.33 Oak Forest 4 25.00 56 3.50 Aspen Forest 9 24.32 135 3.65 Maple-Basswood Forest 1 12.50 17 Fen 2 11.76 2 0.12 Wet Prairie , 1 9.09 1 0.09 Tamarack Wetland 2 7.69 15 0.58 36. Vallonia costata (Müller, 1774). 578 individuals were located at 23 sites and 10 habitat types. Populations tended (p=0.02947) to be more frequent in upland (15-36%) and less in lowland (6-9%) habitats. It was most often encountered in Floodplain Forest (50% of sites), Mesic Prairie (42.86%), and Shrub Carr (33.33%). The largest populations were found in Calcareous Meadow (47.5 individuals/sample), Floodplain Forest (24), and Mesic Prairie (10.57). This species was often found in sites that had been subjected to some degree of anthropogenic disturbance. Although no significant variation in occurrence was noted between physiographic provinces, populations appeared to be more frequent in the southern half of the region. It was not located in Lake of the Woods and Pennington counties. Habitat Occurrences % Frequency # Individuals Average Floodplain Forest 1 50.00 48 24.00 Mesic Prairie 3 42.86 74 10.57 Shrub Carr 1 33.33 3 1.00 Maple-Basswood Forest 2 25.00 29 3.63 Xeric Prairie 1 25.00 1 0.25 Calcareous Meadow 1 25.00 190 47.50 Wet Prairie 2 18.18 89 8.09 Oak Forest 2 12.50 67 4.19 Black Ash Wetland 1 8.33 23 1.92 Aspen Forest 2 5.41 54 1.46 37. Vallonia gracilicosta Reinhardt, 1883. 8223 individuals were located at 86 sites and 16 habitat types. Populations tended (p=0.008322) to be more often located in upland (57-60%) vs. lowland (33-37%) sites. It was most frequently encountered in Mesic prairie (71.43% of sites), Oak forest (68.75%), Black Ash wetland (66.67%), Aspen forest (64.86%), Wet prairie
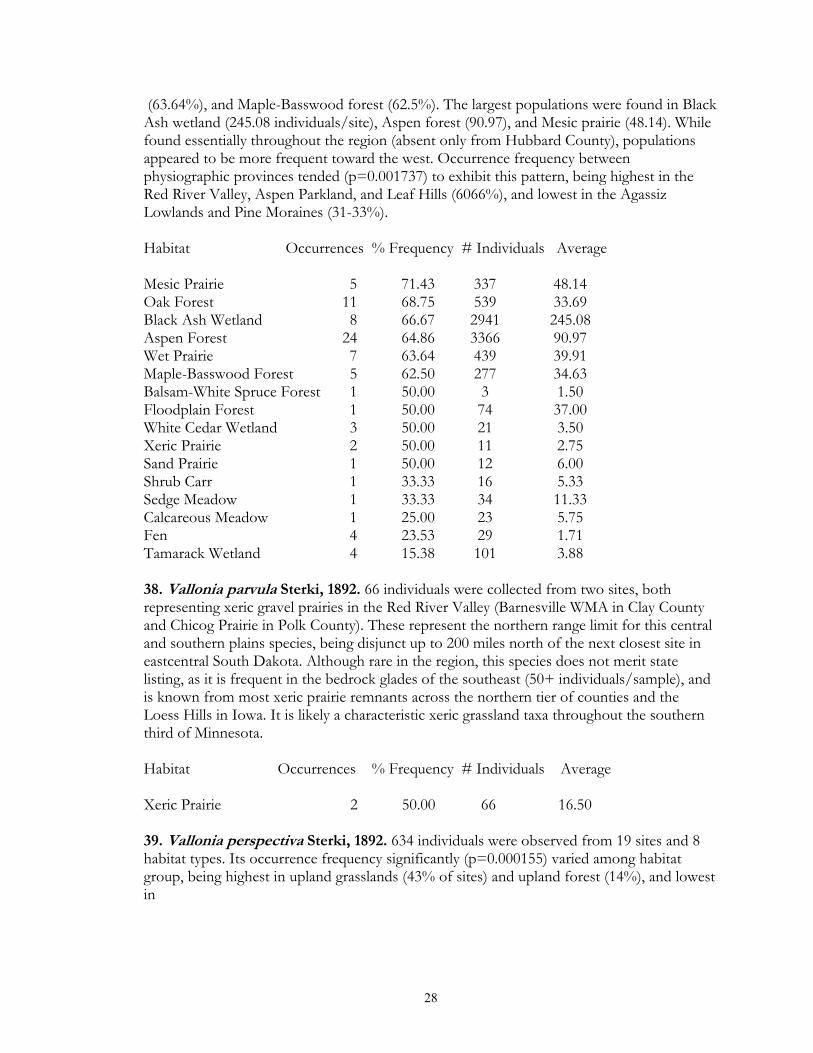
28
(63.64%), and Maple-Basswood forest (62.5%). The largest populations were found in Black Ash wetland (245.08 individuals/site), Aspen forest (90.97), and Mesic prairie (48.14). While found essentially throughout the region (absent only from Hubbard County), populations appeared to be more frequent toward the west. Occurrence frequency between physiographic provinces tended (p=0.001737) to exhibit this pattern, being highest in the Red River Valley, Aspen Parkland, and Leaf Hills (6066%), and lowest in the Agassiz Lowlands and Pine Moraines (31-33%). Habitat Occurrences % Frequency # Individuals Average Mesic Prairie 5 71.43 337 48.14 Oak Forest 11 68.75 539 33.69 Black Ash Wetland 8 66.67 2941 245.08 Aspen Forest 24 64.86 3366 90.97 Wet Prairie 7 63.64 439 39.91 Maple-Basswood Forest 5 62.50 277 34.63 Balsam-White Spruce Forest 1 50.00 3 1.50 Floodplain Forest 1 50.00 74 37.00 White Cedar Wetland 3 50.00 21 3.50 Xeric Prairie 2 50.00 11 2.75 Sand Prairie 1 50.00 12 6.00 Shrub Carr 1 33.33 16 5.33 Sedge Meadow 1 33.33 34 11.33 Calcareous Meadow 1 25.00 23 5.75 Fen 4 23.53 29 1.71 Tamarack Wetland 4 15.38 101 3.88 38. Vallonia parvula Sterki, 1892. 66 individuals were collected from two sites, both representing xeric gravel prairies in the Red River Valley (Barnesville WMA in Clay County and Chicog Prairie in Polk County). These represent the northern range limit for this central and southern plains species, being disjunct up to 200 miles north of the next closest site in eastcentral South Dakota. Although rare in the region, this species does not merit state listing, as it is frequent in the bedrock glades of the southeast (50+ individuals/sample), and is known from most xeric prairie remnants across the northern tier of counties and the Loess Hills in Iowa. It is likely a characteristic xeric grassland taxa throughout the southern third of Minnesota. Habitat Occurrences % Frequency # Individuals Average Xeric Prairie 2 50.00 66 16.50 39. Vallonia perspectiva Sterki, 1892. 634 individuals were observed from 19 sites and 8 habitat types. Its occurrence frequency significantly (p=0.000155) varied among habitat group, being highest in upland grasslands (43% of sites) and upland forest (14%), and lowest in
29
lowland grasslands (3%) and forests (2%). Its was most frequently found in Mesic (57.14%) and Sand (50%) prairie. The largest populations were encountered in Maple-Basswood (25.38 individuals/sample) and Oak (7.19) forests, Wet (6.45) and Xeric (6.25) prairie. Populations were limited to the southwestern half of the region, being absent from Hubbard, Lake of the Woods, and Roseau counties. Significant (p - 0.000115) variation in occurrence frequency was noted between physiographic provinces, being highest in the Red River Valley (29%) and Leaf Hills (20%) and lowest in the Pine Moraines (4%) and Agassiz Lowlands (0%). Habitat Occurrences % Frequency # Individuals Average Mesic Prairie 4 57.14 35 5.00 Sand Prairie 1 50.00 2 1.00 Shrub Carr 1 33.33 2 0.67 Oak Forest 4 25.00 115 7.19 Maple-Basswood Forest 2 25.00 203 25.38 Xeric Prairie 1 25.00 25 6.25 Wet Prairie 1 9.09 71 6.45 Aspen Forest 3 8.11 181 4.89 40. Vallonia pulchella (Müller, 1774). 2016 individuals were collected from 30 sites and 11 habitat types. Populations tended (p=006217) to more frequently occur in grassland (32-36%) vs. forest (10-11%) habitats. It was most often encountered in Shrub Carr (66.67% of sites), Mesic Prairie (57.14%), Floodplain Forest (50%), and Wet Prairie (45.45%) habitats. The largest populations were noted from Wet Prairie (81.33 individuals/sample), Calcareous Meadow (67.75), Floodplain Forest (29.5) and Mesic Prairie (28.43). This species appeared to be especially frequent in sites that had experienced anthropogenic disturbance. Populations appeared largely limited to the southern half of the region. Occurrence frequencies between physiographic region tended (p - 0.010705) to be lowest in the Agassiz Lowlands (3%) and highest in the Leaf Hills (20%) and Red River Valley (32%). Habitat Occurrences % Frequency # Individuals Average Shrub Carr 2 66.67 2 0.67 Mesic Prairie 4 57.14 199 28.43 Floodplain Forest 1 50.00 59 29.50 Wet Prairie 5 45.45 952 86.55 Sedge Meadow 1 33.33 244 81.33 Calcareous Meadow 1 25.00 271 67.75 Fen 4 23.53 103 6.06 Oak Forest 3 18.75 40 2.50 Black Ash Wetland 1 8.33 28 2.33 Tamarack Wetland 1 3.85 13 0.50 Aspen Forest 1 2.70 105 2.84
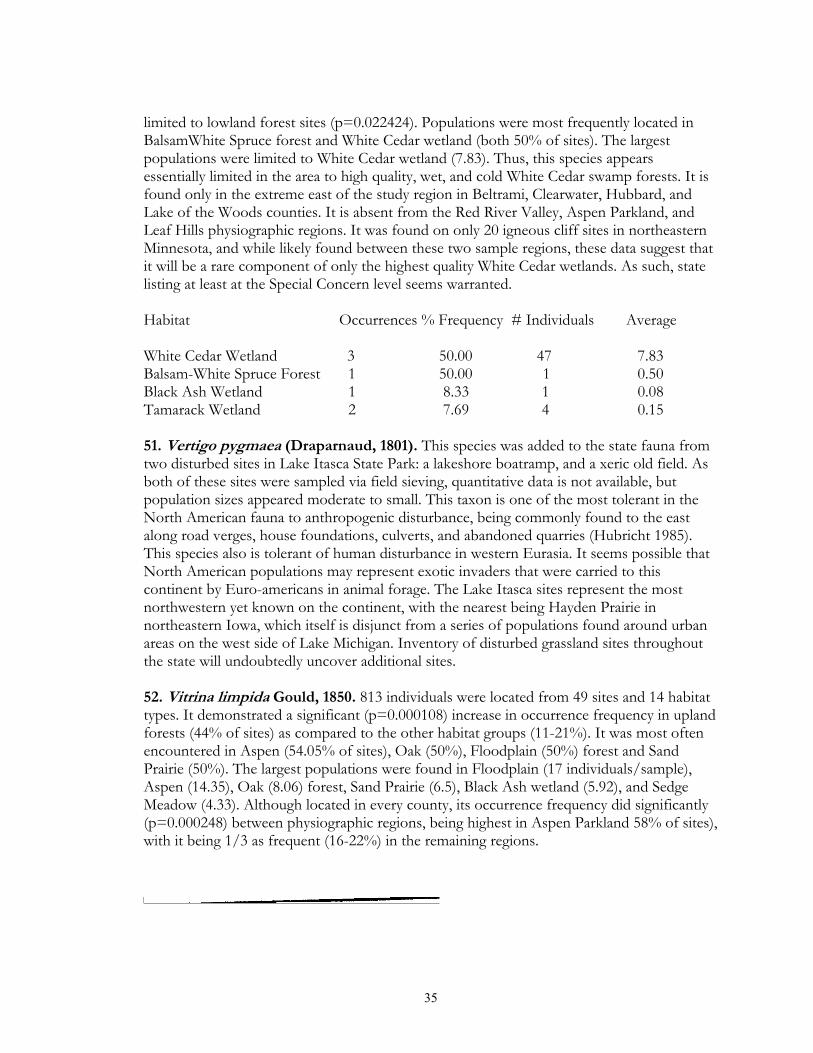
30
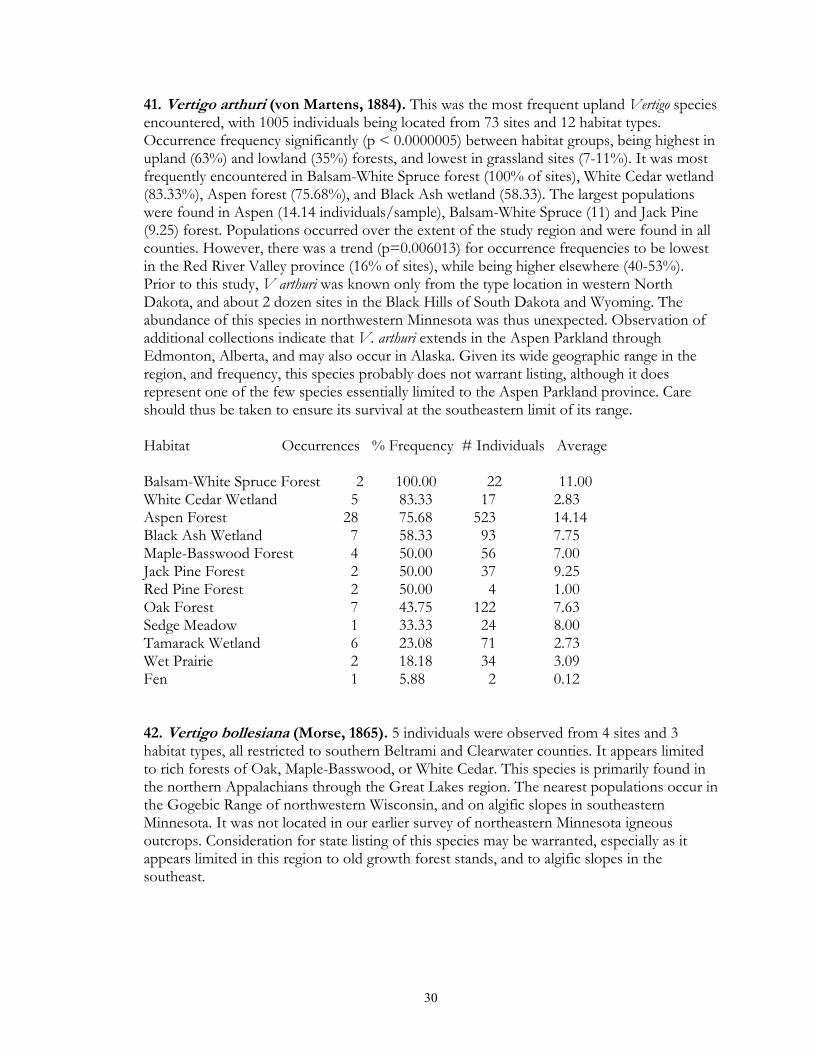
41. Vertigo arthuri (von Martens, 1884). This was the most frequent upland Vertigo species encountered, with 1005 individuals being located from 73 sites and 12 habitat types. Occurrence frequency significantly (p < 0.0000005) between habitat groups, being highest in upland (63%) and lowland (35%) forests, and lowest in grassland sites (7-11%). It was most frequently encountered in Balsam-White Spruce forest (100% of sites), White Cedar wetland (83.33%), Aspen forest (75.68%), and Black Ash wetland (58.33). The largest populations were found in Aspen (14.14 individuals/sample), Balsam-White Spruce (11) and Jack Pine (9.25) forest. Populations occurred over the extent of the study region and were found in all counties. However, there was a trend (p=0.006013) for occurrence frequencies to be lowest in the Red River Valley province (16% of sites), while being higher elsewhere (40-53%). Prior to this study, V arthuri was known only from the type location in western North Dakota, and about 2 dozen sites in the Black Hills of South Dakota and Wyoming. The abundance of this species in northwestern Minnesota was thus unexpected. Observation of additional collections indicate that V. arthuri extends in the Aspen Parkland through Edmonton, Alberta, and may also occur in Alaska. Given its wide geographic range in the region, and frequency, this species probably does not warrant listing, although it does represent one of the few species essentially limited to the Aspen Parkland province. Care should thus be taken to ensure its survival at the southeastern limit of its range. Habitat Occurrences % Frequency # Individuals Average Balsam-White Spruce Forest 2 100.00 22 11.00 White Cedar Wetland 5 83.33 17 2.83 Aspen Forest 28 75.68 523 14.14 Black Ash Wetland 7 58.33 93 7.75 Maple-Basswood Forest 4 50.00 56 7.00 Jack Pine Forest 2 50.00 37 9.25 Red Pine Forest 2 50.00 4 1.00 Oak Forest 7 43.75 122 7.63 Sedge Meadow 1 33.33 24 8.00 Tamarack Wetland 6 23.08 71 2.73 Wet Prairie 2 18.18 34 3.09 Fen 1 5.88 2 0.12 42. Vertigo bollesiana (Morse, 1865). 5 individuals were observed from 4 sites and 3 habitat types, all restricted to southern Beltrami and Clearwater counties. It appears limited to rich forests of Oak, Maple-Basswood, or White Cedar. This species is primarily found in the northern Appalachians through the Great Lakes region. The nearest populations occur in the Gogebic Range of northwestern Wisconsin, and on algific slopes in southeastern Minnesota. It was not located in our earlier survey of northeastern Minnesota igneous outcrops. Consideration for state listing of this species may be warranted, especially as it appears limited in this region to old growth forest stands, and to algific slopes in the southeast.
31
Habitat Occurrences % Frequency # Individuals Average White Cedar Wetland 1 16.67 1 0.17 Maple-Basswood Forest 1 12.50 1 0.13 Oak Forest 1 6.25 3 0.19 43. Vertigo cristata (Sterki, 1919). 227 individuals were observed at 21 sites and 7 habitat types. This species showed a significant (p=0.000354) preference for forest sites, occurring in 9% of upland and 27% of lowland sites, while being absent from all grassland sites. Its lower frequency in upland forests is almost certainly due to an under-representation of coniferdominated forests, as it was most frequently encountered in Jack Pine, Red Pine (both 75%), and Black Spruce wetland (66.67%). Of the seven habitats where it was located, only 1 was not dominated by conifers, and only a single individual was located from this site. The largest populations were also encountered in upland conifer forests of Red Pine (28.50 individuals/sample) and Jack Pine (10). Wetland populations supported on average 1-5 individuals/sample. These data strongly suggest this species to be the dominant Vertigo of upland conifer forests in the region. It was found only in the northeastern and southeastern margins of the study region. Strong (p-0.000091) variation in occurrence frequency was noted between physiographic regions, being absent from the Red River Valley and Aspen Parklands, uncommon in the Leaf Hills (13% of sites) where it was limited to conifer wetlands, and more frequent in the Pine Moraines (29%) and Agassiz Lowlands (44%). This was the most commonly encountered Vertigo in igneous cliffs of northeastern Minnesota. Combined with its affinity for conifer-dominated uplands (including Jack Pine savanna), it is likely that this species will be found across the northern third of Minnesota, and that it likely does not warrant listing. Habitat Occurrences % Frequency # Individuals Average Jack Pine Forest 3 75.00 40 10.00 Red Pine Forest 3 75.00 114 28.50 Black Spruce Wetland 2 66.67 10 3.33 Balsam-White Spruce Forest 1 50.00 10 5.00 White Cedar Wetland 3 50.00 25 4.17 Tamarack Wetland 8 30.77 27 1.04 Black Ash Wetland 1 8.33 1 0.08 44. Vertigo elatior Sterki, 1894. This was the most common Vertigo in the region, with 2865 individuals being collected from 76 sites and 11 habitat types. It demonstrated a very strong (p < 0.0000005) preference in occurrence frequency to lowland habitats (74-83%), while being almost absent from uplands (0-9%). All upland sites where it was found were forests (mainly Aspen) that had small wet areas contained within them. It was most frequently encountered in Tamarack wetland, Black Spruce wetland, Shrub Carr, Sedge Meadow, Calcareous Meadow (all 100% of sites), Fen (82.35%), and Black Ash wetland (75%). The largest populations were observed in Calcareous Meadow (202 individuals/sample), Fen (62.88), Sedge Meadow (49.33),
32
and Shrub Carr (44.33). Although it was located in every county in the region, it tended (p=0.003255) to be most frequent in the Aspen Parkland (55% of sites) and Agassiz Lowlands (59%) and lowest in the Red River Valley (24%) and Leaf Hills (20%). Habitat Occurrences % Frequency # Individuals Average Tamarack Wetland 26 100.00 275 10.58 Black Spruce Wetland 3 100.00 54 18.00 Shrub Carr 3 100.00 133 44.33 Sedge Meadow 3 100.00 148 49.33 Calcareous Meadow 4 100.00 808 202.00 Fen 14 82.35 1069 62.88 Black Ash Wetland 9 75.00 114 9.50 Wet Prairie 5 45.45 215 19.55 White Cedar Wetland 2 33.33 28 4.67 Aspen Forest 6 16.22 20 0.54 Oak Forest 1 6.25 1 0.06 45. Vertigo gouldi (A. Binney, 1843). A single specimen was located from the old-growth Maple-Basswood forest at Bear Paw Point at Lake Itasca. This is the northwestern-most site known, being disjunct from a single station in on the west shore of Lake County, Minnesota, and the limestone cliffs of the Paleozoic Plateau in the southeast. White certainly the rarest species in the region, its commonness in the southeastern corner of the state precludes it being listed for protection. Habitat Occurrences % Frequency # Individuals Average Maple-Basswood Forest 1 12.50 1 0.13 46. Vertigo milium (Gould, 1840). 2414 individuals were located from 33 sites and 7 habitat types. This species showed a strong (p < 0.0000005) preference for grassland (36-69% of sites) as compared to forest (2-4%) sites. It was most frequently encountered in Wet Prairie (81.82%), Mesic Prairie (71.43%), and Fen (70.59%) habitats. The largest populations were observed in Calcareous Meadow (102.25 individuals/sample), Fen (68.59), Wet Prairie (54.64), and Mesic Prairie (31.86) sites. It was essentially limited to the western third of the study region, being absent from Beltrami, Hubbard, Lake of the Woods, and Roseau counties. A significant (p < 0.0000005) variation in occurrence frequency was noted between physiographic regions, with populations being most frequent in the Red River Valley and Aspen Parkland (26-53%), and lowest in the remaining regions (0-7%). These populations represent the known northwestern range limit for this species. Although disjunct over 300 miles from the nearest reported sites in northern Iowa, it surely occurs in similar habitats throughout most of the southwestern half of Minnesota.
33
Habitat Occurrences % Frequency # Individuals Average Wet Prairie 9 81.82 601 54.64 Mesic Prairie 5 71.43 223 31.86 Fen 12 70.59 1166 68.59 Calcareous Meadow 2 50.00 409 102.25 Shrub Carr 1 33.33 1 0.33 Sedge Meadow 1 33.33 3 1.00 Aspen Forest 3 8.11 11 0.30 47. Vertigo morsei Sterki, 1894. 183 individuals were observed from 12 sites. This species was limited to lowland grassland areas (p < 0.0000005), with all but one of these sites representing fens. The other site (at Pankratz Prairie) was a wet prairie supporting calciphile vegetation such as Triglochin maritima and juncus balticus. This is the only site for this species observed in over 6 years of field research that was not a fen. Vertigo morsei was located on 64.71% of surveyed fens in the region, and almost 100% of appropriate sites in the southwestern third of the region. Nowhere else has this species been found so reliably; I have been able to find it previously on only 6 stations ranging from Iowa through New York. Frest (1990) only located this species on 2 out of 64 surveyed Iowa fen sites. While most populations were small (< 10 individuals/sample), 93 individuals were obtained at the ,Fourtown Fen, 20 from Wabun SE Fen, 19 from Felton 2, and 15 from Ogema W. The Fourtown site is particularly important, as individuals were not only common, but the site appeared to cover well over 1000 ha. If the observed density is consistent throughout this site, it undoubtedly represents the largest population for this species in the world. Even though a consistent component of the fen fauna in part of the study region, the rarity of this species elsewhere in North America, combined with its almost total restriction to high-quality fens, suggests that it should be afforded state protection, probably at the 'Threatened' level. Habitat Occurrences % Frequency # Individuals Average Fen 11 64.71 179 10.53 Wet Prairie 1 9.09 4 0.36 48. Vertigo nylanderi Sterki, 1909. 278 individuals were observed at 35 sites and 6 habitat types. Occurrence frequency was significantly (p < 0.0000005) greater in lowland forest sites (60%), although some populations also occurred in low grasslands (9% of sites). It was essentially absent from upland sites (0-1%). Populations were most frequently encountered in Black Spruce (100% of sites), Tamarack (76.92%), and Black Ash (58.33%) wetlands. Lowland grassland populations were limited to fens (18% of sites), where populations were typically found in leaf litter accumulations under stunted Tamarack shrubs. The largest populations were encountered in Tamarack (7.38 individuals/sample), Black Spruce (6.33), and Black Ash (3.08) wetlands. Populations were limited to the eastern half of the study region, being absent. from Clay, Kittson, Norman, Pennington, and Red Lake counties. However, populations were found from the extreme south (Frazee East) to the extreme north (Sprague Creek).
34
Strong (p < 0.0000005) variation was noted in occurrence frequency between physiographic regions, with populations being most frequently encountered in the Agassiz Lowlands (44% of sites) and Pine Moraines (29%). It was also rarely present in Aspen Parkland and the Leaf Hills (5-7%), but absent from the Red River Valley. This species was long known from only 5 pre-1950's collections. Outside of this region, I have only collected it from 18 stations across the Great Lakes region, and in none of these other regions does this species become a predictable component of the wooded wetland fauna. Thus, like the previous species, northwestern Minnesota must be considered the modal landscape for this very rare species. Because of its relative frequency, it is not clear that this species should be listed for protection. Habitat Occurrences % Frequency # Individuals Average Black Spruce Wetland 3 100.00 19 6.33 Tamarack Wetland 20 76.92 192 7.38 Black Ash Wetland 7 58.33 37 3.08 Fen 3 17.65 25 1.47 White Cedar Wetland 1 16.67 4 0.67 Aspen Forest 1 2.70 1 0.03 49. Vertigo ovata Say, 1822. 560 individuals were located from 30 sites and 10 habitats. Populations demonstrated a strong (p=0.000002) preference for lowland grasslands (43% of sites), through it was also a regular component of upland grassland (29%) and lowland forest (15%) sites. It was almost absent from upland forests (4%). It was most frequently encountered in Sedge Meadow (66.67% of sites), Wet Prairie (63.64%), Mesic Prairie (57.14), and Calcareous Meadow (50%) habitats. The largest populations were observed in Sedge Meadow (28.67 individuals/sample), Calcareous Meadow (20), and Wet Prairie (18.64) sites. This species was found essentially throughout the region, only being absent from Hubbard County, and no significant variation was noted between the physiographic provinces. Habitat Occurrences % Frequency # Individuals Average Sedge Meadow 2 66.67 86 28.67 Wet Prairie 7 63.64 205 18.64 Mesic Prairie 4 57.14 39 5.57 Calcareous Meadow 2 50.00 80 20.00 Shrub Carr 1 33.33 9 3.00 Fen 4 23.53 114 6.71 Black Ash Wetland 2 16.67 12 1.00 White Cedar Wetland 1 16.67 1 Tamarack Wetland 4 15.38 10 0.38 Aspen Forest 2 5.41 4 0.11 50. Vertigo paradoxa Sterki, 1900. This was one of the rarer species encountered, with only 53 individuals being observed from 7 sites and 4 habitat types. Populations were essentially
35
limited to lowland forest sites (p=0.022424). Populations were most frequently located in BalsamWhite Spruce forest and White Cedar wetland (both 50% of sites). The largest populations were limited to White Cedar wetland (7.83). Thus, this species appears essentially limited in the area to high quality, wet, and cold White Cedar swamp forests. It is found only in the extreme east of the study region in Beltrami, Clearwater, Hubbard, and Lake of the Woods counties. It is absent from the Red River Valley, Aspen Parkland, and Leaf Hills physiographic regions. It was found on only 20 igneous cliff sites in northeastern Minnesota, and while likely found between these two sample regions, these data suggest that it will be a rare component of only the highest quality White Cedar wetlands. As such, state listing at least at the Special Concern level seems warranted. Habitat Occurrences % Frequency # Individuals Average White Cedar Wetland 3 50.00 47 7.83 Balsam-White Spruce Forest 1 50.00 1 0.50 Black Ash Wetland 1 8.33 1 0.08 Tamarack Wetland 2 7.69 4 0.15 51. Vertigo pygmaea (Draparnaud, 1801). This species was added to the state fauna from two disturbed sites in Lake Itasca State Park: a lakeshore boatramp, and a xeric old field. As both of these sites were sampled via field sieving, quantitative data is not available, but population sizes appeared moderate to small. This taxon is one of the most tolerant in the North American fauna to anthropogenic disturbance, being commonly found to the east along road verges, house foundations, culverts, and abandoned quarries (Hubricht 1985). This species also is tolerant of human disturbance in western Eurasia. It seems possible that North American populations may represent exotic invaders that were carried to this continent by Euro-americans in animal forage. The Lake Itasca sites represent the most northwestern yet known on the continent, with the nearest being Hayden Prairie in northeastern Iowa, which itself is disjunct from a series of populations found around urban areas on the west side of Lake Michigan. Inventory of disturbed grassland sites throughout the state will undoubtedly uncover additional sites. 52. Vitrina limpida Gould, 1850. 813 individuals were located from 49 sites and 14 habitat types. It demonstrated a significant (p=0.000108) increase in occurrence frequency in upland forests (44% of sites) as compared to the other habitat groups (11-21%). It was most often encountered in Aspen (54.05% of sites), Oak (50%), Floodplain (50%) forest and Sand Prairie (50%). The largest populations were found in Floodplain (17 individuals/sample), Aspen (14.35), Oak (8.06) forest, Sand Prairie (6.5), Black Ash wetland (5.92), and Sedge Meadow (4.33). Although located in every county, its occurrence frequency did significantly (p=0.000248) between physiographic regions, being highest in Aspen Parkland 58% of sites), with it being 1/3 as frequent (16-22%) in the remaining regions.
36
Habitat Occurrences % Frequency # Individuals Average Aspen Forest 20 54.05 531 14.35 Oak Forest 8 50.00 129 8.06 Floodplain Forest 1 50.00 34 17.00 Sand Prairie 1 50.00 13 6.50 Black Ash Wetland 5 41.67 71 5.92 Sedge Meadow 1 33.33 13 4.33 Maple-Basswood Forest 2 25.00 3 0.38 Jack Pine Forest 1 25.00 3 0.75 Xeric Prairie 1 25.00 3 0.75 Calcareous Meadow 1 25.00 1 0.25 Mesic Prairie 1 14.29 2 0.29 Wet Prairie 1 9.09 3 0.27 Fen 1 5.88 1 0.06 Tamarack Wetland 1 3.85 6 0.23 53. Zonitoides arboreus (Say, 1816). This was the most frequent species in the region, with 3233 individuals being observed from 159 sites (88% of total) and all 20 habitat types. Significant variation in occurrence frequency was observed between habitat groups, being highest in forests (90-99%), and lowest in upland grasslands ((57%). It was most frequently encountered in Oak, Maple-Basswood, Paper Birch, Aspen, Jack Pine, Red Pine, Floodplain forest, Black Ash, White Cedar, Black Spruce wetland, Shrub Carr (all 100% of sites), Tamarack wetland (80.77%), Fen (76.47%), and Calcareous Meadow (75%). The largest populations were observed in Maple-Basswood (44.25 individuals/sample), Red Pine (39.25), Oak (39) forest, Black Ash wetland (27.33), and Aspen forest (26.84). It was found in all counties, but tended (p - 0.033832) to be less frequent in the Red River Valley (74% of sites) as compared to the remaining physiographic regions (87-97%). Habitat Occurrences % Frequency # Individuals Average Oak Forest 16 100.00 624 39.00 Maple-Basswood Forest 8 100.00 354 44.25 Paper Birch Forest 2 100.00 15 7.50 Aspen Forest 37 100.00 993 26.84 Jack Pine Forest 4 100.00 47 11.75 Red Pine Forest 4 100.00 157 39.25 Floodplain Forest 2 100.00 24 12.00 Black Ash Wetland 12 100.00 328 27.33 White Cedar Wetland 6 100.00 44 7.33 Black Spruce Wetland 3 100.00 56 18.67 Shrub Carr 3 100.00 34 11.33 Tamarack Wetland 21 80.77 252 9.69 Fen 13 76.47 83 4.88
37
Calcareous Meadow 3 75.00 22 5.50 Mesic Prairie 5 71.43 35 5.00 Sedge Meadow 2 66.67 52 17.33 Wet Prairie 7 63.64 73 6.64 Balsam-White Spruce Forest 1 50.00 15 7.50Xeric Prairie 2 50.00 5 1.25 Sand Prairie 1 50.00 20 10.00 54. Zonitoides nitidus (Müller, 1774). 174 individuals were located at 11 sites and 6 habitat types. No significant variation was noted in occurrence frequency between habitat groups. It was most frequently encountered in Shrub Carr (33.33% of sites), Black Ash wetland (25%), and Fen (11.76%) sites. The largest populations were observed in Shrub Carr (18 individuals/site) and Black Ash (7.42) wetlands. Populations were sporadically scattered throughout the region, being absent from Clay, Marshall, Norman, and Pennington counties. No significant variation was noted in occurrence frequency between the major physiographic regions. Habitat Occurrences % Frequency # Individuals Average Shrub Carr 1 33.33 54 18.00 Black Ash Wetland 3 25.00 89 7.42 Fen 2 11.76 25 1.47 Wet Prairie 1 9.09 1 0.09 Oak Forest 1 6.25 4 0.25 Tamarack Wetland 1 3.85 1 0.04 Habitat Associations. 1. Upland Forests A. Oak Forest (16 sites). These sites were scattered across the region, but particularly common on dry, sandy dune . ridges along the former Lake Agassiz shore, and in steep moraine landscapes. 35 taxa were encountered, with an average of 569 individuals being recovered per sample. The most frequent species were Euconulus fulvus, Nesovitrea binneyana, Striatura milium, Zonitoides arboreus (all 100% of sites), Carychium exile, Discus catskillensis, Strobilops labyrintbica (all 87.5%), Cochlicopa lubricella, Gastrocopta pentodon, Nesovitrea electrina, Vallonia gracilicosta (all 68.75%). Columella simplex, Punctum minutissimum (both 62.5%), Gastrocopta contracta, Hawaiia minuscula (Both 56.25%), and Vitrina limpida (50%). The most abundant species were Strobilops labyrintbica 81.25 individuals/sample), Nesovitrea binneyana (67.75), Striatura milium (52.25), Discus catskillensis (45.31), Zonitoides arboreus (39), Carychium exile (35.63), and Vallonia gracilicosta (33.69).
38
Species Occurrences % Frequency # Individuals Average Nesovitrea binneyana 16 100.00 1084 67.75 Striatura milium 16 100.00 836 52.25 Zonitoides arboreus 16 100.00 624 39.00 Euconulusfulvus 16 100.00 383 23.94 Strobilops labyrintbica 14 87.50 1300 81.25 Discus catskillensis 14 87.50 725 45.31 Carychium exile 14 87.50 570 35.63 Vallonia gracilicosta 11 68.75 539 33.69 Gastrocopta pentodon 11 68.75 323 20.19 Nesovitrea electrina 11 68.75 225 14.06 Cochlicopa lubricella 11 68.75 132 8.25 Punctum minutissimum 10 62.50 323 20.19 Columella simplex 10 62.50 58 3.63 Gastrocopta contracta 9 56.25 80 5.00 Hawaiia minuscula 9 56.25 77 4.81 Vitrina limpida 8 50.00 129 8.06 Vertigo arthuri 7 43.75 122 7.63 Helicodiscus parallelus 7 43.75 33 2.06 Gastrocopta holzingeri 6 37.50 178 11.13 Gastrocopta tappaniana 6 37.50 38 2.38 Discus cronkhitei 5 31.25 22 1.38 Vallonia perspectiva 4 25.00 115 7.19 Cochlicopa lubrica 4 25.00 108 6.75 Succinea ovalis 4 25.00 56 3.50 Punctum vitreum 3 18.75 134 8.38 Striatura exigua 3 18.75 46 2.88 Vallonia pulchella 3 18.75 40 2.50 Deroceras laeve 3 18.75 5 0.31 Vallonia costata 2 12.50 67 4.19 Anguispira alternata 2 12.50 2 0.13 Carychium exiguum 1 6.25 7 0.44 Zonitoides nitidus 1 6.25 4 0.25 Vertigo bollesiana 1 6.25 3 0.19 Catinella avara 1 6.25 1 0.06 Vertigo elatior 1 6.25 1 0.06 B. Maple-Basswood Forest (8 sites). Maple-basswood forests were found primarily in the southern half of the study region in the Leaf Hills and Pine Moraines physiographic regions. Most sites were characterized by hard, clay-rich soils supporting very thin leaf litter layers. However a few sites (often dominated by Basswood) were found to have loamy soils with very deep humus layers. Such sites (such as the old-growth forest at Bear Paw Point in Lake Itasca Sate Park) supported a very high
C Balsam-White Spruce Forest (2 sites). These sites represent upland forests which were dominated by either Balsam Fir or White Spruce. 22 species were found in these sites with an average of 286 individuals being observed per sample. Species found on both sites were Carychium exile, Cochlicopa lubricella, Discus catskillensis, Euconulus fulvus, Nesovitrea binneyana, Nesovitrea electrina, Punctum minutissimum, Striatura milium, Strobilops labyrintbica, and Vertigo arthuri. The most abundant species were Striatura milium (52 individuals/site), Carychium exile (45.5), Discus catskillensis (35.5), Nesovitrea binneyana (33.5), and Strobilops labyrintbica (26.5). Species Occurrences % Frequency # Individuals Average Striatura milium 2 100.00 104 52.00 Carychium exile 2 100.00 91 45.50 Discus catskillensis 2 100.00 71 35.50 Nesovitrea binneyana 2 100.00 67 33.50 Strobilops labyrintbica 2 100.00 53 26.50 Punctum minutissimum 2 100.00 31 15.50 Vertigo arthuri 2 100.00 22 11.00 Nesovitrea electrina 2 100.00 20 10.00 Euconulus fulvus 2 100.00 13 6.50 Cochlicopa lubricella 2 100.00 3 1.50 Zonitoides arboreus 1 50.00 15 7.50 Vertigo cristata 1 50.00 10 5.00 Striatura exigua 1 50.00 9 4.50 Gastrocopta tappaniana 1 50.00 7 3.50 Gastrocopta holzingeri 1 50.00 5 2.50 Vallonia gracilicosta 1 50.00 3 1.50 Anguispira alternata 1 50.00 2 1.00 Columella simplex 1 50.00 2 1.00 Gastrocopta contracta 1 50.00 2 1.00 Deroceras laeve 1 50.00 1 0.50 Discus cronkhitei 1 50.00 1 0.50 Vertigo paradoxa 1 50.00 1 0.50 D. Paper Birch Forest (2 sites). These sites typically had thick leaf litter layers over sandy or loamy soil. 15 species were found, with an average of 235 individuals being recorded per sample. Species observed in both sites include Cochlicopa lubricella, Columella simplex, Discus catskillensis, Euconulus fulvus, Helicodiscus parallelus, Nesovitrea binneyana, Nesovitrea electrina, Striatura milium, Strobilops labyrintbica, and Zonitoides arboreus. Species with the largest populations were Strobilops labyrintbica (80.50 individuals/site), Nesovitrea binneyana (49), Striatura milium (25), Striatura exigua (19), Discus catskillensis (14), and Carychium exile (11.5).
41
Species Occurrences % Frequency # Individuals Average Strobilops labyrintbica 2 100.00 161 80.50 Nesovitrea binneyana 2 100.00 98 49.00 Striatura milium 2 100.00 50 25.00 Discus catskillensis 2 100.00 28 14.00 Zonitoides arboreus 2 100.00 15 7.50 Cochlicopa lubricella 2 100.00 10 5.00 Nesovitrea electrina 2 100.00 9 4.50 Euconulus fulvus 2 100.00 8 4.00 Helicodiscus parallelus 2 100.00 8 4.00 Columella simplex 2 100.00 5 2.50 Striatura exigua 1 50.00 38 19.00 Carychium exile 1 50.00 23 11.50 Punctum minutissimum 1 50.00 12 6.00 Succinea ovalis 1 50.00 3 1.50 Gastrocopta pentodon 1 50.00 1 0.50 E. Aspen Forest (37 sites). These sites were found in a wide variety of settings. In the Aspen Parkland and Red River Valley regions, these represent the climax forest and are often associated with thick litter layers. In this region, sites could occur from dry-xeric ridges to wet-mesic flats with some vernal pools. Elsewhere, aspen forests generally represent an early successional forest transitional to Maple-Basswood, Oak, or upland Conifers. These areas also could occur from dry to wet-mesic soils, but generally did not possess deep leaf litter layers. 37 species were recorded from these sites, with an average of 878 individuals/sample. The most frequently encountered species were Zonitoides arboreus (100% of sites), Euconulus fulvus (97.3%), Nesovitrea electrina, Punctum minutissimum (both 89.19%), Discus catskillensis, Nesovitrea binneyana, Striatura milium (all 78.38%), Strobilops labyrintbica, Vertigo arthuri (both 75.68%), Cochlicopa lubricella (72.97%), Vallonia gracilicosta (64.86%), Carychium exile (59.46%), Gastrocopta tappaniana (56.76%), Columella simplex, and Vitrina limpida (both 54.05%). The species with the largest average populations were Strobilops labyrintbica (102.59 individuals/site), Vallonia gracilicosta (90.97), Punctum minutissimum (88.41), Nesovitrea binneyana (83.49), Striatura milium (77.76) and Carychium exile (67.7). Species Occurrences % Frequency # Individuals Average Zonitoides arboreus 37 100.00 993 26.84 Euconulus fulvus 36 97.30 1076 29.08 Punctum minutissimum 33 89.19 3271 88.41 Nesovitrea electrina 33 89.19 1067 28.84 Nesovitrea binneyana 29 78.38 3089 83.49 Striatura milium 29 78.38 2877 77.76 Discus catskillensis 29 78.38 1181 31.92
42
Strobilops labyrinthica 28 75.68 3796 102.59 Vertigo arthuri 28 75.68 523 14.14 Cochlicopa lubricella 27 72.97 949 25.65 Vallonia gracilicosta 24 64.86 3366 90.97 Carychium exile 22 59.46 2505 67.70 Gastrocopta tappaniana 21 56.76 766 20.70 Vitrina limpida 20 54.05 531 14.35 Columella simplex 20 54.05. 245 6.62 Gastrocopta pentodon 18 48.65 1091 29.49 Hawaiia minuscula 17 45.95 215 5.81 Discus cronkhitei 16 43.24 107 2.89 Gastrocopta holzingeri 15 40.54 797 21.54 Helicodiscus parallelus 13 35.14 94 2.54 Gastrocopta contracta 10 27.03 236 6.38 Succinea ovalis 9 24.32 135 3.65 Carychium exiguum 8 21.62 471 12.73 Euconulus alderi 6 16.22 130 3.51 Vertigo elatior 6 16.22 20 0.54 Catinella avara 5 13.51 48 1.30 Deroceras laeve 5 13.51 30 0.81 Striatura exigua 3 8.11 185 5.00 Vallonia perspectiva 3 8.11 181 4.89 Vertigo milium 3 8.11 11 0.30 Cochlicopa lubrica 2 5.41 92 2.49 Vallonia costata 2 5.41 54 1.46 Vertigo ovata 2 5.41 4 0.11 Vallonia pulchella 1 2.70 105 2.84 Punctum n.sp. 1 2.70 20 0.54 Anguispira alternata 1 2.70 1 0.03 Vertigo nylanderi 1 2.70 1 0.03 F. Jack Pine Forest (4 sites). These sites are limited in the region to sandy soils in the Agassiz Lowlands and Pine Moraines physiographic provinces. Moisture levels ranged from mesic to xeric, with the driest sites developing a savanna-like architecture. In such sites, snails were primarily limited to deep leaf litter accumulations under deciduous shrubs, primarily hazel. 17 species were observed on these sites, with an average of 495 individuals occurring per sample. The most frequently encountered species were Euconulus fulvus, Nesovitrea binneyana, Punctum minutissimum, Striatura milium, Strobilops labyrinthica, Zonitoides arboreus (all 100% of sites), Columella simplex, Discus catskillensis, and Vertigo cristata (all 75%). The species with the largest average population sizes were Striatura milium (132.75 individuals/sample), Strobilops labyrintbica (91), Nesovitrea binneyana (77.75), Discus catskillensis (62), and Punctum minutissimum (47).
43
Species Occurrences % Frequency # Individuals Average Striatura milium 4 100.00 531 132.75 Strobilops labyrintbica 4 100.00 364 91.00 Nesovitrea binneyana 4 100.00 311 77.75 Punctum minutissimum 4 100.00 188 47.00 Euconulus fulvus 4 100.00 59 14.75 Zonitoides arboreus 4 100.00 47 11.75 Discus catskillensis 3 75.00 248 62.00 Vertigo cristata 3 75.00 40 10.00 Columella simplex 3 75.00 9 2.25 Vertigo arthuri 2 50.00 37 9.25 Nesovitrea electrina 1 25.00 16 4.00 Cochlicopa lubricella 1 25.00 10 2.50 Carychium exile 1 25.00 4 1.00 Vitrina limpida 1 25.00 3 0.75 Discus cronkhitei 1 25.00 1 0.25 Gastrocopta tappaniana 1 25.00 1 0.25 Helicodiscus parallelus 1 25.00 1 0.25 G. Red Pine Forest (4 sites). These sites were also limited to the Agassiz Lowlands and Pine Moraines. However, they occurred on loamy as well as sandy soils, and leaf litter was usually deep throughout. White Pine was often also present, as were Oaks and other deciduous trees. 18 species were observed, with an average of 488 individuals being observed per sample. The most frequently encountered species were Columella simplex, Discus catskillensis, Euconulus fulvus, Nesovitrea binneyana, Punctum minutissimum, Striatura milium, Strobilops labyrintbica, Zonitoides arboreus (all 100%), Carychium. exile, Helicodiscus parallelus, and Vertigo cristata (all 75%). The species with the largest average population sizes were Striatura milium (96.25 individuals/site), Discus catskillensis (49), Strobilops labyrintbica (45.5), Zonitoides arboreus (39.25), Nesovitrea electrina (38.50), and Nesovitrea binneyana (38). Species Occurrences % Frequency # Individuals Average
Helicodiscus parallelus 3 75.00 9 2.25 Nesovitrea electrina 2 50.00 154 38.50 Striatura exigua 2 50.00 70 17.50 Vertigo arthuri 2 50.00 4 1.00 Cochlicopa lubricella 1 25.00 12 3.00 Gastrocopta pentagon 1 25.00 5 1.25 Carychium exiguum 1 25.00 1 0.25 Gastrocopta tappaniana 1 25.00 1 0.25 F. Lakeshore Forest (7 sites). All Lakeshore sites were sampled via field sieving, and as such the species richness and abundance figures derived for them cannot be compared to sites that were litter sampled. The sites sampled were limited to the southeast. Pupilla muscorum, new to the state fauna, was limited to these sites. 2. Lowland Forests A. Floodplain Forest (2 sites). Owing to the scouring of the leaf litter during floods, and their relatively hard, clay soils, only two sites were sampled. 21 species and 439 individuals/sample were recorded. The species found on both sites were Carychium exile, Cochlicopa lubrica, Columella simplex, Discus cronkhitei, Euconulus fulvus, Hawaiia minuscula, Nesovitrea electrina, Succinea ovalis, and Zonitoides arboreus. The most abundant species were Discus catskillensis (41.50 individuals/site), Carychium exile (41), Nesovitrea electrina, Succinea ovalis (both 38.5), Vallonia gracilicosta (37), Vallonia pulchella (29.5) and Vallonia costata (24). Cochlicopa lubrica 2 100.00 83 41.50 Carychium exile 2 100.00 82 41.00 Nesovitrea electron 2 100.00 77 38.50 Succinea ovalis 2 100.00 77 38.50 Zonitoides arboreus 2 100.00 24 12.00 Hawaiia minuscula 2 100.00 20 10.00 Discus cronkhitei 2 100.00 18 9.00 Euconulus fulvus 2 100.00 9 4.50 Columella simplex 2 100.00 4 2.00 Discus catskillensis 1 50.00 84 42.00 Vallonia gracilicosta 1 50.00 74 37.00 Vallonia pulchella 1 50.00 59 29.50 Vallonia costata 1 50.00 48 24.00 Vitrina limpida 1 50.00 34 17.00 Striatura milium 1 50.00 21 10.50 Anguispira alternata 1 50.00 11 5.50 Cochlicopa lubricella 1 50.00 10 5.00
45
Strobilops labyrintbica 1 50.00 4Nesovitrea binneyana 1 50.00 3 1.50 Gastrocopta tappaniana 1 50.00 2Deroceras laeve 1 50.00 1 0.50 B. Black Ash Swamp Forest (12 sites). These sites are limited to the eastern 2/3 of the study region, being absent from the Red River Valley physiographic province. 41 species (76% of the regional total) and 1618 individuals/site were recorded. The single most abundant concentration of land snails per sample (5492 at Strathcona SW) was recorded from this habitat type, with other sites harboring impressive numbers as well (e.g. Hal Swamp WMA with 4232 individuals/sample). The most frequently encountered taxa were Zonitoides arboreus (100% of sites), Nesovitrea electrina (91.67%), Carychium exiguum, Carychium exile, Cochlicopa lubricella, Gastrocopta tappaniana, Punctum minutissimum (all 83.33%), Euconulus fulvus, Nesovitrea binneyana, Striatura milium, Strobilops labyrintbica, Vertigo elatior (all 75%), Hawaiia minuscula, Vallonia gracilicosta (both 66.67%), Columella simplex, Vertigo arthuri, and Vertigo nylanderi (all 58.33%). The species with the largest populations were Carychium exile (283.08 individuals/sample), Vallonia gracilicosta (245.08), Punctum minutissimum (160.58), Nesovitrea electrina (110.5), Strobilops labyrintbica (99.42), and Carychium exiguum (95.25). Species Occurrences % Frequency # Individuals Average Zonitoides arboreus 12 100.00 328 27.33 Nesovitrea electrina 11 91.67 1326 110.50 Carychium exile 10 83.33 3397 283.08 Punctum minutissimum 10 83.33 1927 160.58 Carychium exiguum 10 83.33 1143 95.25 Cochlicopa lubricella - 10 83.33 813 67.75 Gastrocopta tappaniana 10 83.33 487 40.58 Strobilops labyrintbica 9 75.00 1193 99.42 Striatura milium 9 75.00 835 69.58 Nesovitrea binneyana 9 75.00 275 22.92 Euconulus fulvus 9 75.00 134 11.17 Vertigo elatior 9 75.00 114 9.50 Vallonza gracilicosta 8 66.67 2941 245.08 Hawaiia minuscula 8 66.67 303 25.25 Vertigo arthuri 7 58.33 93 7.75 Columella simplex 7 58.33 55 4.58 Vertigo nylanderi 7 58.33 37 3.08 Discus cronkhitei 6 50.00 682 56.83 Discus catskillensis 6 50.00 606 50.50 Euconulus alderi 6 50.00 186 15.50 Gastrocopta pentodon 6 50.00 142 11.83 Cochlicopa lubrica 5 41.67 906 75.50
46
Gastrocopta contracta 5 41.67 243 20.25 Hell codices parallelus 5 41.67 107 8.92 Striatura exigua 5 41.67 99 8.25 Vitrina limpida 5 41.67 71 5.92 Deroceras laeve 5 41.67 8 0.67 Succinea ovalis 4 33.33 235 19.58 Punctum n.sp. 4 33.33 33 2.75 Zonitoides nitidus 3 25.00 89 7.42 Catinella avara 3 25.00 12 1.00 Anguispira alternata 2 16.67 28 2.33 Vertigo ovata 2 16.67 12 1.00 Gastrocopta similis 1 8.33 74 6.17 Vallonia pulchella 1 8.33 28 2.33 Vallonia costata 1 8.33 23 1.92 Oxyloma retusa 1 8.33 13 1.08 Gastrocopta holzingeri 1 8.33 10 0.83 Catinella exile 1 8.33 6 0.50 Vertigo cristata 1 8.33 1 0.08 Vertigo paradoxa 1 8.33 1 0.08 C Tamarack Swamp Forest (26 sites). Like the previous habitat, Tamarack wetlands are essentially limited to the eastern half of the study region, being most frequent in the Agassiz Lowlands, Pine Moraines, with some scattered outliers existing in the Leaf Hills. 39 species and 493 individuals/sample were recorded from these sites. The most frequently encountered species were Nesovitrea electrina, Vertigo elatior (both 100% of sites), Euconulus alderi, Striatura milium (both 92.31%), Carychium exiguum (88.46%), Gastrocopta tappaniana (84.62%), Zonitoides arboreus (80.77%), and Vertigo nylanderi (76.92%). The species with the largest average populations were Carychium exiguum (135.08 individuals/sample), Nesovitrea electrina (51.23), Carychium exile (40.38), Punctum minutissimum (34.19), Striatura milium (33.08), and Strobilops labyrintbica (32.5). Species Occurrences % Frequency # Individuals Average Nesovitrea electrina 26 100.00 1332 51.23 Vertigo elatior 26 100.00 275 10.58 Striatura milium 24 92.31 860 33.08 Euconulus alderi 24 92.31 318 12.23 Carychium exiguum 23 88.46 3512 135.08 Gastrocopta tappaniana 22 84.62 631 24.27 Zonitoides arboreus 21 80.77 252 9.69 Vertigo nylanderi 20 76.92 192 7.38 Punctum minutissimum 17 65.38 889 34.19 Strobilops labyrintbica 15 57.69 845 32.50
47
Discus cronkhitei 14 53.85 123 4.73 Columella simplex 14 53.85 54 2.08 Discus catskillensis 13 50.00 521 20.04 Carycbium exile 12 46.15 1050 40.38 Cochlicopa lubricella 10 38.46 180 6.92 Punctum n.sp. 10 38.46 133 5.12 Nesovitrea binneyana 9 34.62 166 6.38 Striatura exigua 8 30.77 247 9.50 Vertigo cristata 8 30.77 27 1.04 Deroceras laeve 8 30.77 18 0.69 Vertigo arthuri 6 23.08 71 2.73 Euconulus fulvus 5 19.23 58 2.23 Catinella avara 5 19.23 25 0.96 Vallonia gracilicosta 4 15.38 101 3.88 Cochlicopa lubrica 4 15.38 17 0.65 Vertigo ovata 4 15.38 10 0.38 Gastrocopta contracta 2 7.69 50 1.92 Gastrocopta pentodon 2 7.69 30 1.15 Succinea ovalis 2 7.69 15 0.58 Hawaiia minuscula 2 7.69 11 0.42 Oxyloma retusa 2 7.69 7 0.27 Vertigo paradoxa 2 7.69 4 0.15 Anguispira alternata 2 7.69 2 0.08 Vallonia pulchella 1 3.85 13 0.50 Helicodiscus parallelus 1 3.85 7 0.27 Strobilops affinis 1 3.85 6 0.23 Vitrina limpida 1 3.85 6 0.23 Catinella exile 1 3.85 1 0.04 Zonitoides nitidus 1 3.85 1 0.04 D. White Cedar Swamp Forest (6 sites). Sites were limited to the Agassiz Lowlands, and often supported thick leaf litter layers in conjunction with diverse bryophyte and herb groundlayers. Sites ranged from wet to almost Mesic, with the most diverse faunas being recorded from the most hydric sites. 25 species and 489 individuals/sample were recorded. The most frequently encountered taxa were Discus catskillensis, Gastrocopta tappaniana, Nesovitrea binneyana, Punctum minutissimum, Striatura milium, Strobilops labyrintbica, Zonitoides arboreus (all 100% of sites), Carychium exile (91.83%), Nesovitrea electrina, Vertigo artburi (both 83.33%). The most abundant species were Carycbium exile (91.83 individuals/sample), Carychium exiguum (59), Striatura milium (55.67), Strobilops labyrintbica (46.33), Punctum minutissimum (38.33), and Discus catskillensis (30.33). Species Occurrences % Frequency # Individuals Average Striatura milium 6 100.00 334 55.67
48
Strobilops labyrinthica 6 100.00 278 46.33 Punctum minutissimum 6 100.00 230 38.33 Discus catskillensis 6 100.00 182 30.33 Nesovitrea binneyana 6 100.00 131 21.83 Gastrocopta tappaniana 6 100.00 112 18.67 Zonitoides arboreus 6 100.00 44 7.33 Carychium exile 5 83.33 551 91.83 Nesovitrea electrina 5 83.33 116 19.33 Vertigo arthuri 5 83.33 17 2.83 Cochlicopa lubricella 4 66.67 44 7.33 Discus cronkhitei 4 66.67 37 6.17 Euconulus alderi 4 66.67 37 6.17 Columella simplex 4 66.67 11 1.83 Carychium exiguum 3 50.00 354 59.00 Euconulus fulvus 3 50.00 47 7.83 Vertigo paradoxa 3 50.00 47 7.83 Vertigo cristata 3 50.00 25 4.17 Vallonia gracilicosta 3 50.00 21 3.50 Striatura exigua 2 33.33 86 14.33 Vertigo elation 2 33.33 28 4.67 Helicodiscus parallelus 1 16.67 28 4.67 Vertigo nylanderi 1 16.67 4 0.67 Vertigo bollesiana 1 16.67 1 0.17 Vertigo ovata 1 16.67 1 0.17 E. Black Spruce Swamp Forest (3 sites) These sites were generally limited to the Agassiz Lowlands, although some very good examples were also noted in the Pine Moraines. While dominated by Black Spruce, they also support Tamarack and occasionally White Cedar. The ground layer can be extraordinarily rich in both bryophytes and herbs, with little Sphagnum moss being present. 26 species and 469 individuals/sample were recorded. Species found on all three sites were Columella simplex, Discus catskillensis, Euconulus alderi, Gastrocopta tappaniana, Nesovitrea electrina, Striatura militim, Vertigo elatior, Vertigo nylanderi, and Zonitoides arboreus. The most abundant species were Carychium exiguum (70.67 individuals/site), Striatura milium (43), Nesovitrea electrina (42), Discus catskillensis (28.33), Cochlicopa lubrica (25), Striatura exigua (24), and Strobilops labyrinthica (22.33). Species Occurrences % Frequency # Individuals Average Striatura milium 3 100.00 129 43.00 Nesovitrea electrina 3 100.00 126 42.00 Discus catskillensis 3 100.00 85 28.33 Zonitoides arboreus 3 106.00 56 18.67 Vertigo elatior 3 100.00 54 18.00
49
Euconulus alderi 3 100.00 52 17.33 Gastrocopta to paniana 3 100.00 45 15.00 Vertigo nylanderi 3 100.00 19 6.33 Columella situ lex 3 100.00 15 5.00 Carychium exiguum 2 66.67 212 70.67 Striatura exigua 2 66.67 72 24.00 Strobilops labyrinthica 2 66.67 67 22.33 Punctum n.sp. 2 66.67 47 15.67 Nesovitrea binneyana 2 66.67 18 6.00 Vertigo cristata 2 66.67 10 3.33 Cochlicopa lubrica 1 33.33 75 25.00 Carychium exile 1 33.33 58 19.33 Hawaiia minuscula 1 33.33 56 18.67 Punctum minutissimum 1 33.33 24 8.00 Euconulus fulvus 1 33.33 18 6.00 Catinella avara 1 33.33 14 4.67 Helicodiscus parallelus 1 33.33 11 3.67 Cochlicopa lubricella 1 33.33 2 0.67 Deroceras laeve 1 33.33 2 0.67 Discus cronkhitei 1 33.33 1 0.33 Strobilops affins 1 33.33 1 0.33 F. Shrub Carr (3 sites). This habitat occurs throughout the study region, often along stream margins, or in areas of groundwater seepage. Sites are dominated by a mix of willow, alder, and dogwood, and often support a dens sedge groundcover. 29 species and 1249 individuals/sample were observed from these sites. Species observed on all 3 sites were Carychium exiguum, Discus cronkhitei, Euconulus alderi, Nesovitrea electrina, Vertigo elatior, and Zonitoides arboreus. The most abundant species were Carychium exiguum (364.33 individuals/sample), Gastrocopta tappaniana (13 x..33), Nesovitrea electrina (130.67), Strobilops labyrintbica (94.33), Euconulus alderi (93), and Punctum n.sp. (85). Species Occurrences % Frequency # Individuals Average Carychium exiguum 3 100.00 1093 364.33 Nesovitrea electrina 3 100.00 392 130.67 Euconulus alderi 3 100.00 279 93.00 Discus cronkhitei* 3 100.00 172 57.33 Vertigo elatior 3 100.00 133 44.33 Zonitoides arboreus 3 100.00 34 11.33 Gastrocopta tappaniana 2 66.67 394 131.33 Gastrocopta contracta 2 66.67 47 15.67 Oxyloma retusa 2 66.67 37 12.33 Deroceras laeve 2 66.67 9 3.00
50
Hawaiia minuscula 2 66.67 3 1.00 Vallonia pulchella 2 66.67 2 0.67 Strobilops labyrinthica 1 33.33 283 94.33 Punctum n.sp. 1 33.33 255 85.00 Punctum minutissimum 1 33.33 66 22.00 Zonitoides nitidus 1 33.33 54 18.00 Carychium exile 1 33.33 41 13.67 Strobilops affinis 1 33.33 30 10.00 Succinea ovalis 1 33.33 22 7.33 Cochlicopa lubrica 1 33.33 19 6.33 Punctum vitreurn 1 33.33 19 6.33 Vallonia gracilicosta 1 33.33 16 5.33 Cochlicopa lubricella 1 33.33 10 3.33 Vertigo ovata 1 33.33 9 3.00 Discus catskillensis 1 33.33 8 2.67 Catinella avara 1 33.33 3 1.00 Vallonia costata 1 33.33 3 1.00 Vallonia perspectiva 1 33.33 2 0.67 Vertigo milium 1 33.33 1 0.33 3. Upland Grasslands. A. Mesic Prairie (7 sites). These sites were all limited to the Red River Valley province in the western third of the study region. While snails were most often found in leaf litter under native shrubs such as hazel, leadplant, and, snowberry, they were also commonly seen in dense thatch. 24 species and 414 individuals/sample were recorded. The most frequently encountered species were Hawaiia minuscula, Nesovitrea electrina (both 100% of sites), Catinella avara, Punctum minutissimum (both 85.71%), Gastrocopta holzingeri, Gastrocopta tappaniana, Vallonia gracilicosta, Vertigo milium, and Zonitoides arboreus (all 71.43%). The most abundant species were Hawaiia minuscula (48.57 individuals/sample), Punctum minutissimum, Vallonia gracilicosta (both 48.14), Catinella avara (35.71), Vertigo milium (31.86), Vallonia pulchella (28.43), Nesovitrea electrina (24.57), Gastrocopta holzingeri (21.14), and Gastrocopta tappaniana (18). These faunas, as well as those of other grassland habitats in the region were shown to show serious negative impacts to fire', with managed sites demonstrating 33% reductions in richness, and abundance decreasing by up to an order of magnitude (Nekola, in press). Protection of the land snail fauna of grassland sites will require that fire return intervals be lengthened (perhaps up to 20 years) to allow full redevelopment of thatch microsites in which these species live. Species Occurrences % Frequency # Individuals Average Hawaiia minuscula 7 100.00 340 48.57 Nesovitrea electrina 7 100.00 172 24.57 Punctum minutissimum 6 85.71 337 48.14
51
Catinella avara 6 85.71 250 35.71 Vallonia gracilicosta 5 71.43 337 48.14 Vertigo milium 5 71.43 223 31.86 Gastrocopta holzingeri 5 71.43 148 21.14 Gastrocopta tappaniana 5 71.43 126 18.00 Zonitoides arboreus 5 71.43 35 5.00 Vallonia pulchella 4 57.14 199 28.43 Vertigo ovata 4 57.14 39 5.57 Vallonia perspectiva 4 57.14 35 5.00 Vallonia costata 3 42.86 74 10.57 Euconulus fulvus 3 42.86 68 9.71 Discus cronkhitei 3 42.86 45 6.43 Euconulus alderi 3 42.86 8 1.14 Helicodiscus parallelus 3 42.86 5 0.71 Carychium exiguum 2 28.57 15 2.14 Oxyloma retusa 2 28.57 7 1.00 Cochlicopa lubricella 1 14.29 37 5.29 Gastrocopta sir ilis 1 14.29 21 3.00 Punctum vitreum 1 14.29 12 1.71 Deroceras laeve 1 14.29 2 0.29 Vitrina limpida 1 14.29 2 0.29 B. Xeric Prairie (4 sites). Again, sites were limited to the Red River Valley in the western third of the study region. Most of these sites were found on gravel deposits associated with moraines or outwash fans. Vegetation, and thatch, was sparse in most places. The majority of individuals were found in leaf litter under prairie shrubs. 16 species and 208 individuals/sample were recorded. The most frequently encountered species were Gastrocopta holzingeri (100% of sites), Euconulus fulvus, Gastrocopta similis, Hawaiia minuscula, Nesovitrea electrina, Punctum minutissimum, Vallonia gracilicosta, Vallonia parvula and Zonitoides arboreus (all 50%). The most abundant species were Gastrocopta holzingeri (91.5 individuals/sample), Vallonia parvula (16.5), Punctum minutissimum (15.75), Nesovitrea electrina (13.25), and Nesovitrea binneyana (11.5). Species Occurrences % Frequency # Individuals Average Gastrocopta holzingeri 4 100.00 366 91.50 Vallonia parvula 2 50.00 66 16.50 Punctum minutissimum 2 50.00 63 15.75 Nesovitrea electrina 2 50.00 53 13.25 Euconulus fulvus 2 50.00 34 8.50 Gastrocopta similis 2 50.00 13 3.25 Vallonia gracilicosta 2 50.00 11 2.75 Hawaiia minuscula 2 50.00 7 1.75 Zonitoides arboreus 2 50.00 5 1.25
52
Nesovitrea binneyana 1 25.00 46 11.50 Strobilops labyrinthica 1 25.00 39 9.75 Vallonia perspectiva 1 25.00 25 6.25 Gastrocopta contracta 1 25.00 13 3.25 Vitrina limpida 1 25.00 3 0.75 Catinella 'vermeta' 1 25.00 2 0.50 Vallonia costata 1 25.00 1 0.25 C Sand Prairie (2 sites). Sand prairies in the region are generally limited to the former dune ridges of Land Agassiz, although a limited number of sites also occur on sandy outwash plains on the western margin of the Pine Moraines province. These sites supported only 15 species, and 150 individuals/sample, the lowest of all habitats sampled. Snails were essentially absent from open sand, and were limited to leaf litter accumulations under native shrubs, especially hazel and choke cherry and sand cherry. Only Gastrocopta holzingeri was found at both sites. The most abundant species were Punctum minutissimum (26 individuals/sample), Gastrocopta holzingeri (22), Striatura milium (17.5), and Nesovitrea binneyana (16.5). Species Occurrences % Frequency # Individuals Average Gastrocopta holzingeri 2 100.00 44 22.00 Punctum minutissimum 1 50.00 52 26.00 Striatura milium 1 50.00 35 17.50 Nesovitrea binneyana 1 50.00 33 16.50 Hawaiia minuscula 1 50.00 26 13.00 Cochlicopa lubricella 1 50.00 22 11.00 Zonitoides arboreus 1 50.00 20 10.00 Vitrina limpid 1 50.00 13 6.50 Helicodiscus parallelus 1 50.00 12 6.00 Vallonia gracilicosta 1 50.00 12 6.00 Euconulus fulvus 1 50.00 11 5.50 Vallonia perspectiva 1 50.00 2 1.00 Carychium exiguum 1 50.00 1 0.50 Gastrocopta pentodon 1 50.00 1 0.50 D. Old Field (1 site). A single old field was sampled, as the purpose of this study was an inventory of natural habitats. As analysis of this single sites was done via field sieving, the data gathered cannot be compared to the other data. This site harbored one of the two populations for Gastrocopta abbreviata and Vertigo pygmaea. Additional survey of these habitats would likely be useful, especially give how common they are in the modern landscape.
53
4. Lowland Grasslands. A. Wet Prairie (11 sites). These habitats) were restricted to the Red River Valley and Aspen Parkland provinces in the western third of the study region. Included are brush prairie sites that have up to 75% of their surface area covered by willow, aspen, and shrubby cinquefoil scrub. Snails were generally restricted to areas of deep thatch, and to leaf litter accumulations under shrubs. 36 species and 818 individuals/sample were observed on these sites. The most frequently encountered species were Gastrocopta tappaniana (90.91% of sites), Catinella avara, Euconulus alderi, Nesovitrea electrina, Vertigo milium (all 81.82%), Deroceras spp., Discus cronkhitei, Hawaiia minuscula (all 72.73%), Oxyloma retusa, Punctum minutissimum, Vallonia gracilicosta, Vertigo ovata, and Zonitoides arboreus (all 63.64%). The most abundant species were Punctum minutissimum (99.82 individuals/site), Vallonia pulchella (86.55), Carychium exiguum (81.09), Gastrocopta tappaniana (75,191), and Vertigo milium (54.64). Species Occurrences % Frequency # Individuals Average Gastrocopta tappaniana 10 90.91 835 75.91 Vertigo milium 9 81.82 601 54.64 Nesovitrea electrina 9 81.82 407 37.00 Euconulus alderi 9 81.82 343 31.18 Catinella avara 9 81.82 236 21.45 Hawaiia minuscula 8 72.73 334 30.36 Discus cronkhitei 8 72.73 92 8.36 Deroceras laeve 8 72.73 12 1.09 Punctum minutissimum 7 63.64 1098 99.82 Vallonia gracilicosta 7 63.64 439 39.91 Oxyloma retusa 7 63.64 294 26.73 Vertigo ovata 7 63.64 205 18.64 Zonitoides arboreus 7 63.64 73 6.64 Vallonia pulchella 5 45.45 952 86.55 Carychium exiguum 5 45.45 892 81.09 Vertigo elatior 5 45.45 215 19.55 Gastrocopta holingeri 4 36.36 72 6.55 Cochlicopa lubricella 4 36.36 43 3.91 Gastrocopta contracta 3 27.27 22 2.00 Vallonia costata 2 18.18 89 8.09 Vertigo arthuri 2 18.18 34 3.09 Vallonia perspectiva 1 9.09 71 6.45 Carychium exile 1 9.09 51 4.64 Cochlicopa lubrica 1 9.09 26 2.36 Strobilops labyrinthica 1 9.09 13 1.18 Euconulus fulvus 1 9.09 11 1.00 Gastrocopta similis 1 9.09 6 0.55
54
Punctum n.sp 1 9.09 6 0.55 Nesovitrea binneyana 1 9.09 5 0.45 Vertigo morsel 1 9.09 4 0.36 Striatura milium 1 9.09 3 0.27 Vitrina limpida 1 9.09 3 0.27 Discus catskillensis 1 9.09 1 0.09 Gastrocopta abbreviata 1 9.09 1 0.09 Succinea ovalis 1 9.09 1 0.09 Zonitoides nitidus 1 9.09 1 0.09 B. Sedge Meadow (3 sites). Sedge meadows occur throughout the region where wet, mineral soils are covered by a dense growth of sedges. Scattered dogwood, alder, and willow shrubs are also commonly present. Snails were most frequently encountered in thatch and in leaf litter under shrubs. 31 species and 1903 individuals/sample were observed on these sites. Species found on all sites were Carychium exiguum, Discus cronkhitei, Euconulus alderi, Gastrocopta tappaniana, Nesovitrea electrina, Punctum n.sp., and Vertigo elation. The most abundant species were Carychium exiguum (336.7 individuals/sample), Strobilops labyrinthica (197.67), Carychium exile (126.33), Hawaiia minuscula (105), Striatura milium (100), Nesovitrea electrina (99.67), Cochlicopa lubrica (99.33); Punctum minutissimum (95), Gastrocopta tappaniana (84), and Vallonia pulchella (81.33). Species Occurrences % Frequency # Individuals Average Carychium exiguum 3 100.00 1010 336.67 Nesovitrea electrina 3 100.00 299 99.67 Gastrocopta tappaniana 3 100.00 252 84.00 Punctum n.sp. 3 100.00 172 57.33 Vertigo elatior 3 100.00 148 49.33 Euconulus alderi 3 100.00 132 44.00 Discus cronkhitei 3 100.00 7 2.33 Carychium exile 2 66.67 379 126.33 Discus catskillensis 2 66.67 144 48.00 Vertigo ovata 2 66.67 86 28.67 Zonitoides arboreus 2 66.67 52 17.33 Succinea ovalis 2 66.67 30 10.00 Strobilops labyrinthica 1 33.33 593 197.67 Hawaiia minuscula 1 33.33 315 105.00 Striatura milium 1 33.33 300 100.00 Cochlicopa lubrica 1 33.33 298 99.33 Punctum minutissimum 1 33.33 285 95.00 Vallonia pulchella 1 33.33 244 81.33 Oxyloma retusa 1 33.33 176 58.67 Gastrocopta contracta 1 33.33 98 32.67 54
55
Cochlicopa lubricella 1 33.33 89 29.67 Vallonia gracilicosta 1 33.33 34 11.33 Vertigo arthuri 1 33.33 24 8.00 Euconulus fulvus 1 33.33 23 7.67 Vitrina limpida 1 33.33 13 4.33 Gastrocopta holzingeri 1 33.33 12 4.00 Nesovitrea binneyana 1 33.33 4 1.33 Catinella avara 1 33.33 3 1.00 Striatura exigua 1 33.33 3 1.00 Vertigo milium 1 33.33 3 1.00 Deroceras laeve 1 33.33 1 0.33 C. Fen (17 sites). Fens are found, in three very different situations in the study region. The most extensive fen areas are found in areas of groundwater discharge within the extensive peatland areas of the Agassiz lowlands. These sites are often very wet, with the only terrestrial habitats being found on shrubs that have colonized strings in these patterned peatlands. Fens also are found in the Pine Moraines and Leaf Hills provinces along shores of nutrient-rich lakes, where marl beds may develop. The majority of sampled sites, however, were associated with local groundwater discharge associated with former Lake Agassiz beach ridges in the Red River Valley province, as these sites were hypercalcareous, and supported a very rich flora. These sites supported', the most abundant and diverse fen snail communities, with up to 5000 individuals occurring per sample. 34 species and a mean of 1878 individuals/sample were recorded from these sites. The most frequently encountered species were Carychium exiguum, Euconulus alderi, Nesovitrea electrina (all 100% of sites), Gastrocopta tappaniana (94.12%), Oxyloma retusa, (88.24%), Vertigo elatior (82.35%), Punctum n.sp, Zonitoides arboreus (both 76.47%), and Vertigo milium (70.59%). The most abundant species were Carychium exiguum (421.76 individuals/sample), Gastrocopta tappaniana (214.53), Catinella exile (152.76), Nesovitrea electrina (130.59), Punctum n.sp. (89.65), and Euconulus alderi (81.12). Species Occurrences % Frequency # Individuals Average Carychium exiguum 17 100.00 7170 421.76 Nesovitrea electrina 17 100.00 2220 130.59 Euconulus alderi 17 100.00 1379 81.12 Gastrocopta tappaniana 16 94.12 3647 214.53 Oxyloma retusa 15 88.24 870 51.18 Vertigo elatior 14 82.35 1069 62.88 Punctum n.sp. 13 76.47 1524 89.65 Zonitoides arboreus 13 76.47 83 4.88 Vertigo milium 12 70.59 1166 68.59 Discus cronkhitei 11 64.71 771 45.35 Vertigo morsei 11 64.71 179 10.53 Catinella exile 9 52.94 2597 152.76
56
Hawaiia minuscula 9 52.94 876 51.53 Strobilops labyrinthica 7 41.18 241 14.18 Deroceras laeve 6 35.29 64 3.76 Punctum minutissimum 5 29.41 134 7.88 Catinella avara 5 29.41 86 5.06 Strobilops affinis 4 23.53 490 28.82 Vertigo ovata 4 23.53 114 6.71 Vallonia pulchella 4 23.53 103 6.06 Gastrocopta contracta 4 23.53 65 3.82 Vallonia gracilicosta 4 23.53 29 1.71 Vertigo nylanderi 3 17.65 25 1.47 Discus catskillensis 3 17.65 20 1.18 Carychium exile 2 11.76 239 14.06 Zonitoides nitidus 2 11.76 25 1.47 Striatura milium 2 11.76 2 0.12 Succinea ovalis 2 11.76 2 0.12 Hawaiia n.sp. 1 5.88 31 1.82 Columella simplex 1 5.88 4 0.24 Punctum vitreum 1 5.88 4 0.24 Vertigo arthuri 1 5.88 2 0.12 Helicodiscus parallelus 1 5.88 1 0.06 Vitrina limpida 1 5.88 1 0.06 D. Calcareous ,Meadow (4 sites). This habitat is (found in highly calcareous situations where wet, bare mineral soil is exposed. Vegetation is sually quite low in stature. Most of these sites were created by human activities, especially the creation and maintenance of road ditches and railroad right-of-ways. However, one natural site was observed in Kittson County where a deposit of calcareous mineral soil roe above surrounding ponded wetland. 23 species and 1064 individuals/sample were observed on these sites. The most frequently encountered species were Gastrocopta tappaniana, Vertigo elation (both 100% of sites), Carychium exiguum, Euconulus alderi, Nesovitrea electrina, Punctum minutissimum, and Zonitoides arboreus (all 75%). The most abundant species were Vertigo elatior (202 individuals/sample), Vertigo milium (102.25), Gastrocopta tappaniana (88.5), Nesovitrea electrina (80.5), Vallonia pulchella (67.75), and Euconulus alderi (57.5). Species Occurrences % Frequency # Individuals Average Vertigo elation 4 100.00 808 202.00 Gastrocopta tappaniana 4 100.00 354 88.50 Nesovitrea electrina 3 75.00 322 80.50 Euconulus alderi 3 75.00 230 57.50 Carychium exig uum 3 75.00 174 43.50 Punctum minutissimum 3 75.00 128 32.00
57
Zonitoides arboreus 3 75.00 22 5.50 Vertigo milium 2 50.00 409 102.25 Vertigo ovata 2 50.00 80 20.00 Gastrocopta holzingeri 2 50.00 28 7.00 Catinella avara 2 50.00 25 6.25 Hawaiia minuscula 2 50.00 8 2.00 Vallonia pulchella 1 25.00 271 67.75 Vallonia costata 1 25.00 190 47.50 Cochlicopa lubricella 1 25.00 24 6.00 Vallonia gracilicosta 1 25.00 23 5.75 Gastrocopta contracta 1 25.00 21 5.25 Gastrocopta similis 1 25.00 9 2.25 Cochlicopa lubrica 1 25.00 8 2.00 Deroceras laeve 1 25.00 6 1.50 Euconulus fulvus 1 25.00 1 0.25 Strobilops labyrinthica 1 25.00 1 0.25 Vitrina limpida 1 25.00 1 0.25 3. Species Richness and Abundance Patterns. 1. Habitat relationships. 30 sites (17% of total) were found to harbor 20 or more species. Two of these were Oak forests, 2 Maple-Basswood forests, 7 Aspen forests, 8 Black Ash wetlands, 6 Tamarack wetlands, 1 White Cedar wetland, 1 Black Spruce wetland, 2 Wet prairies, and 1 Sedge Meadow. The maximum observed site richness scores were 25 at Bear Paw Point East and Strathcona SW, 26 at the Lake Bronson wooded ravine, and 27 at Halma Swamp WMA. The lowest recorded richness levels were 2 taxa at Chicog Prairie and 3 on the open dunes at Prairie Smoke Dunes. Mean site richness significantly (p < 0.0005) and rather strongly (r2=0.284) varied among the 20 habitats sampled via litter collection (Figure 2). Black Ash swamp forests had the highest values at 19.7 taxa/site. Maple-Basswood forest and Black Spruce swamp forest had means of 17.7-17.8, respectfully. Oak forest, Sedge meadow, Balsam-White Spruce forest, White Cedar forest, Shrub Carr Aspen forest, and Tamarack swamp forest had means ranging from 15.016.8. Floodplain forest, Wet prairie, Fen, and Red Pine forest ranged from 13.25-14.0. Mesic prairie, Paper Birch forest, Jack Pine forest, and Calcareous meadow ranged between 11.25 and 12.6. The most species poor communities were Sand (8) and Xeric prairie (6.75). Highly significant (p < 0.0005), but less strong (r2 - 0.141) differences were also noted between the four major habitat groups (Figure 3). Lowland forests had the highest mean richness (16.4), followed by upland forest (14.3), lowland grassland (13.6), and upland grassland (9.4). 21 sites (12% of total) were found to harbor 2000 or more individuals per litter sample. Two of these were Maple-Basswood forests, 3 Aspen forests, 3 Black Ash wetlands, 1 Tamarack
58
wetland, 1 Shrub Carr, 1 Sedge Meadow, 9 Fens, and 1 Calcareous Meadow. The maximum observed abu dances were 5492 at Strathcona SW, 5001 at Ogema West, 4232 at Halma Swamp WMA, and 3923 at Florian Fen. The lowest number observed was 19 individuals at the open dun' at Prairie Smoke Dunes. Mean abundance significantly (p < 0.0005) and rather strongly (r2=0.290) varied among the 20 habitats sampled via litter collection (Figure 4). Sedge Meadows had the highest at 1902.7 individuals/sample, followed closely by Fen at 1877.5, and Black Ash swamp forest at 1617.7. Shrub Carr, Calcareous meadow, and Maple-Basswood forest had means ranging from 1044.9-1249.3. Aspen forest, Wet prairie, and Oak forest averaged 877.6, 817.8, and 569.2 individuals/sample respectively. Jack Pine forest, Tamarack wetland, White Cedar wetland, Red Pine fore t, Black Spruce wetland, Floodplain forest, and Mesic prairie had mean abundances ranging from 414.4-495.0. The habitat with the lowest mean abundances were Balsam-White !Spruce forest (286), Paper Birch forest (234.5), Xeric prairie (207.8) and Sand prairie (150). Highly significant (p < 0.0005) differences were also noted between the four major habitat groups (Figure 5). Lowland grasslands had the highest mean abundance (1453.6), followed by lowland forest (792.5), upland forest (687.9), and upland grassland (288.7). B. Geographic relationships. Total species richness per county (Table 5a-b) was fairly consistent, generally ranging from the upper 30's to chid 40's, with the lowest being 30 (Hubbard) and the highest 47 (Clearwater). Average richness per site was found to possess only a non-significant (p=0.079) trend between counties (Figure 6). Kittson County sites possessed the highest values (19.22), followed by Becker and Clearwater (16.5 and 16.4, respectfully), Pennington, Marshall, Red Lake, Mahnomen, Lake of the Woods, Roseau, Norman, and Beltrami (14.2-15.75), Hubbard (13.6), Clay (13.0), and Polk (12.5). Highly significant variation in mean site richness was noted, however, between the 5 physiographic provinces (Figure 7). Aspen Parkland, Leaf Hills, Pine Moraines and Agassiz Lowlands all possessed similar averages (16.9-15.1), while Red River Valley sites were considerably lower (12.7). The kriged response surface of this data over the study region (Figure 8) demonstrates the highest average site richness scores (15.6-18.7 taxa) were limited to! the Aspen Parklands of the northwest and a crescent-shaped area in the southeast. Lowest site richness (< 14.1 values were seen along the bulk of the Red River Valley (especially in the west-central), and in the east-central. Average snail abundance per sample possessed significant (p=0.011) variation between counties (Figure 9), being highest in Marshall, Kittson, and Norman counties (1469.8-1537.0). Becker Count followed at (1236.1). Pennington, Red Lake, and Clay counties had similar values (916.3-1(61.4), followed by Polk, Mahnomen, Clearwater, and Roseau (655.5-761.2). The counties with the lowest average number of individuals per sample were Hubbard (508.3), Beltrami (499.20, and Lake of the Woods (450.1). Not surprisingly, highly significant (p=0.008) variation in snail abundance was also noted between the 5 physiographic provinces
59
(Figure 10). Aspen Parkland and Red River Valley sites possessed the most average number of individuals pear sites (1084.2-1224.3), with Agassiz Lowlands, Pine Moraines, and Leaf Hills sites have mush lower values (527.7-728.5). The kriged response surface of this data over the study region (figure 11) clearly demonstrated this variation, with highest scores (1239-1780) being limited o the southwest and northwest corners. Again, Aspen Parkland landscapes in Kittson, Marshall, and western Roseau counties demonstrated the highest values over the landscape. Abundance fell so that essentially the entire eastern third of the region had less than 698 individuals, on average, per site. These analyse, demonstrate that the richest land snail habitats in the region tend to be mature wooded wetland (especially Black Ash and Black Spruce) and upland (Basswood and Oak) forest, all that tend to have deep soil humus layers. Grassland sites tend to have lower average richness value,. Highest abundance, however, is typically found in lowland grassland habitats such as Sedge meadows, Fens, and Calcareous meadows. High snail abundance also occurs in Black Ash swamp forest, Basswood forest, and Shrub Carr. Thus, in terms of both richness and abundance, Black Ash swamp forests are one of the most important reservoirs of land snail biodiversity in the region. Basswood-dominated forests with deep humus layers are also important. Interpolation of these data across the region indicated that the Aspen Parkland landscape is ore of the most important reservoirs of land snail biodiversity, harboring both the highest average site richness and abundance levels. What is not clear, however, is why the Red River Valley has the lowest mean site richness, but has one of the highest average site abundances. It is also important to remember that while the eastern parts of the study region have, on average, low site richness and abundance, this should not indicate that these areas are unimportant to land snail conservation. In fact, a number of species, including some of the most biogeographically interesting (e.g. Vertigo cristata, Vertigo nylanderi, Vertigo paradoxa) are limited to sites in the east. Thus, protection of this fauna will require the maintenance of sites throughout the region. 4. Species Distribution Patterns Distribution maps for all encountered species are found in Appendix I. Through visual inspection of these maps combined with the results of the Fisher's Exact test for changes in frequency between physiographic provinces (Table 4), four major distribution classes can be identified. 25 species (46% of total) can be considered cosmopolitan, as they are found across the entire study region at essentially equal frequencies. These species include: Anguispira alternata, Carychium exiguum, Carychium exile, Catinella avara, Cochlicopa lubrica, Cochlicopa lubricella, Discus catskillensis, Discus cronkhitei, Euconulus alderi, Euconulus fulvus, Gastrocopta tappaniana, Nesovitrea binneyana, Nesovitrea electrina, Oxyloma retusa, Punctum minutissimum, Punctum n.sp., Striatura milium, Strobilops labyrinthica, Vallonia gracilicosta, Vertigo arthuri,Vertigo elatior, Vertigo ovata, Vitrina limpida, Zonitoides arboreus, and Zonitoides nitidus.
60
The second largest group are those species (19, 35% of total) limited to, or most frequent in, the west and south. These species are generally more frequent in grassland habitats, or are more southern in distribution. These species include: Catinella exile, Catinella 'vermeta', Deroceras spp., Gastrocopta abbreviata, Gastrocopta contracta, Gastrocopta holzingeri, Gastrocopta pentodon, Gastrocopta similis, Hawaiia miniscula, Succinea ovalis, Vallonia costata, Vallonia parvula, Vallonia perspectiva, Vallonia pulchella, Vertigo milium, Hawaiia n.sp., Punctum vitreum, Strobilops afnis, and Vertigo morsei. It is interesting to note that 83% of Gastrocopta species, and 80% of Vallonia species share this biogeographic distribution. 6 species (11%) are limited to, or more frequent in, the east of the study region. These include: Col mella simplex, Striatura exigua, Vertigo cristata, Vertigo nylanderi, and Vertigo paradoxa. These species are generally of northeastern or boreal forest affinity, should be expected from additional Minnesota sites Minnesota east of the study region. All of these species, except V. nylanderi, were frequent from igneous cliffs along the Lake Superior shoreline in northeastern Minnesota. The smallest group of species (5; 9%) are those which are most frequent in the southeast. These are: Helicodiscus parallelus, Pupilla muscorum, Vertigo bollesiana, Vertigo gouldi, and Vertigo pygmaea, and are generally among the rarest species in the region. Their larger affinities are with eastern deciduous forest, although P. muscorum and V. pygmaea are most common in the eastern U.S. in highly modified, calcareous habitats (such as culverts, abandoned quarries, etc.; Hubricht 1985). Their presence in this region may reflect the greater human recreational impacts in this region, and they may represent recent introductions into the fauna. 5. Land Snail Community Structure. The nature of how richness varies with snail abundance at a particular site can help interpret the structure of these communities. When comparing raw richness and abundance data (Figure 12), it is clear that a strong richness-abundance relationship only occurs when sample densities fall blow 500 individuals/sample. Above this, no increase in richness occurs. In fact, the Lake Bronson Ravine sites had only 507 individuals but possessed the second-highest richness score (26). Sites with snail densities exceeding 1000 individuals ranged between 11-26 taxa, with the second most-abundant sites (Ogema West; 5001 individuals) supporting only 15 taxa. However, upon log-transformation of abundance data (Figure 12), a significant (p < 0.0005) and strong (r2=0.328) linear relationship between richness and density was noted. The comparison of the relative importance between species can also provide important information regarding the nature of niche partitioning within a community (Whittaker 1975). For these data, the importance of species were estimated by their relative proportion within the entire community. This is essentially a density-based estimate, which should be appropriate in this case as 99% of encountered individuals were microsnails (< 5 mm in maximum dimension), and thus have likely share similar resource utilization and production
61
rates. When dominance-diversity curves were calculated for either the entire dataset, or individually for the 4 major habitat groups, identical patterns were apparent, with a shallow, negative relationship existing from the most common to all but the most rare species, where the curve sharply dropped off (Figure 14). For the entire dataset, this dropoff occurred at the 5th rarest species, while it occurred from the 3rd to 12th most rare species for individual major habitat groups. These patterns indicate that over the region, land snails strongly exhibit a random niche-boundary structure, in which the resource space is randomly partitioned, and in which there! is little competition between species (Whittaker 1975). This is an unexpected result, as such patterns have generally been recognized for taxonomically related organisms from narrowly-defined, homogeneous communities (Whittaker 1975). Both of these analyses support the contention that interspecific resource competition may not be an important structuring element for land snail communities, at least at sample grains > 100m2 (Cain, 1983; Cowie & Jones, 1987; Smallridge & Kirby, 1988; Barker & Mayhill, 1999). As land, snail communities typically consume less than 0.5% of annual litter input per year (Mason, 1970), some speculate that few resources, beyond CaC03 (Boycott, 1934) and appropriate resting site availability (Pearce, 1997), will limit distribution. Given the highly calcareous nature of much of northwestern Minnesota soils, and the frequency of thick litter and humus layers (especially in wooded wetlands and mature forests), in this landscape even these resources!, may often not be limiting. These data also: strongly contradict predictions of the resource-ratio model of competition (Tilman 1988), which states that highest richness will occur at intermediate to low resource supply levels. In this region, however, as resource levels (and land snail numbers) increase, community richness does not fall. These findings support patterns seen in land snail communities at much smaller sample grains (0.04-100m2; Nekola and Smith 1999) suggesting that resource ratio models fail to predict the structure of land snail communities from micro to near-continental scales. 6. Conservation Recommendations A. Species of Conservation Importance. Even though this study was prompted by the discovery of some of the most uncommon eastern North American land snails in the region in 1999 (e.g. Vertigo arthuri, Vertigo nylanderi), the frequency of these species in the region confirms that none likely warrant legal protection in Minnesota. Additionally, most of the rarest species from the region (e.g. Gastrocopta similis, Punctum vitreum, Strobilops affinis, Vallonia parvula, Vertigo gouldi) are . probably common throughout southern Minnesota, given their known distribution in surrounding states, also making them unlikely candidates for listing. Three species in the fauna, however,, probably do warrant listing. Interestingly, all of these species are limited to high quality ferns.
62
Hawaiia n.sp. was only located at a single station. This population (at Felton Prairie) likely represents its northern range limit. It almost certainly occurs at additional sites to the south, but given its distribution in Iowa and Wisconsin, will likely be limited to a rather few number of high quality fen sites. Until additional information regarding its distribution throughout the remainder of Minnesota is known, listing as Threatened or Special Concern seems most prudent. Catinella exile was limited to 11 sites, with all but 2 of these representing fens. Like Hawaiia n.sp., it is known from high quality fen sites throughout northern Iowa and southern Wisconsin. Given its greater frequency in surrounding landscapes, and thus likely greater frequency in southern Minnesota, listing as Special Concern would appear most warranted. Vertigo morsei was observed at 12 sites, with 11 representing high quality fens. Unlike the previous two species, which are relatively frequent in Iowa and Wisconsin fens, in these regions this taxon is very rare. I have located previously at only 6 fens, with 3 of these being confined to the northern part of the Door Peninsula in Wisconsin. Frest (1990) was only able to locate it on 2 (out of 65) Iowa fens. Hubricht (1985) reports it from only 17 counties in the eastern USA, and it is known from only a single site in Canada (Pilsbry 1948). Most of these sites have not been relocated in over 50 years (Frest 1990). The discovery of V. morsei on almost 65% of surveyed fens in the region was unexpected, and suggests that northwestern Minnesota is the modal landscape for this very rare fen-endemic species. Additionally, what is almost certainly its largest global population also occurs at Fourtown Fen. Even though a predictable member of the fen fauna in this region, the few high quality sites, combined with their continual loss due to grazing and altered hydrology, suggests that this species should be listed as Threatened, if for no other reason to ensure its survival and genetic diversity in what likely represents its preferred landscape. If these sites are lost, its long-term survival throughout the rest of its range will brought into serious doubt. Additionally, three additional taxa (Pupilla muscorum, Vertigo bollesiana, and Vertigo paradoxa) may also warrant listing at the Special Concern level. This action is less certain for these species are it is not clear that: (1) P. muscorum is a native member of this fauna; and (2) that V. bollesiana and V. paradoxa are rare enough throughout the rest of the state to warrant listing. Additional survey work will be necessary to clarify these issues. B. Sites and Landscapes of Conservation Importance. The sites with the richest and/or most abundant land snail populations are Black Ash, Tamarack Swamp & White Cedar swamp forests; old growth Oak, Aspen, and Basswood forests with deep humus and leaf litter; and Fens. Sites of particular importance include: Bemis Hill 1, Cyr Creek, Dunton Locks County Park, Faith Fen, Faunce North, Felton 2 Fen, Fourtown Fen, Halma Swamp WMA, Higenbotham WMA 1, Huot Forest WMA, Lake Bronson State Park 1, Maple Lake Church WPA 1, Norris Camp, Oak Ridge, Ogema Fen, Old Mill State Park, Prairie Smoke Dunes 2, Randeen Ridge, Sanders Fen, Strathcona SW, Turtle Lake 2, Two Island Lake, Two Rivers SNA, and Waubun SE Fen.
63
By far the most important landscape for land snail biodiversity in the region is the Aspen Parkland in the far northwest, where maximum richness and density were both recorded. Maintenance of exemplary examples of important habitats in this landscape (mature Oak and Aspen forest, Black Ash swamp forest, Wet Prairie) will be important. Lastly, the single most important site in the region for land snail diversity is Lake Itasca State Park, which harbors populations of at least 42 taxa (78% of regional total). The reason for this appears to be the extensive amount of old-growth forest remaining in the park, in conjunction with a diverse assemblage of habitats. While this fauna would seem well protected, the frequent use of fire management in the park is leading to the removal of the leaf litter and humus layers upon which these diverse snail assemblages depend (see below). The sites sampled within the park have all been spared fire management, and it is essential that such non-burned refuges be maintained throughout the park within all habitat types to ensure that this remarkable fauna can be conserved. C. Appropriate management strategies. A final comment regarding appropriate management strategies for land snail faunas must be made. Throughout the region, fire is being used as the major management tool for wet to xeric prairies, brush prairie, shrub carr, fens, aspen, oak and pine forests. The only habitats which appears to have been spared fire management are lowland forests (particularly Black Ash, Black Spruce, Tamarack, and White Cedar). Fire has long been known to have serious negative consequences on forest faunas (e.g., Stanisic 1996,. Welter-Schultes & Williams 1999, Regan et al. 2001). Analyses made possible due to the data collected in this study (Nekola, in press; manuscript included as Appendix III) also shows that fire reduces grassland land snail richness by approximately 30%, and abundance by 50-90%. Fully 72% of turf-specialist snails were negatively impacted by fire, while 67% of duff-specialists demonstrated no significant response. Frequent use of fire management thus represents a significant threat to the health and diversity of North American grassland land snail communities. Protecting of land snails in the region will require preservation of site organic litter layers, no matter if woodland or grassland sites are being considered. This goal is not possible if fire return intervals less than 15 years are used (perhaps more in some habitats). Unless management practices become more diversified, and the rate of fire decreased, serious negative impacts on the land snail fauna may be expected. It is interesting to note that such an impact may be already visible in the fauna, with a depression in richness and abundance being noted for the central Red River Valley, where some of the most intense fire management is being currently conducted. Additionally, maintenance of old growth forest remnants is vital for land snail conservation, as these sites reliably had the highest species richness and abundance levels.
CONCLUSIONS AND RECOMMENDATIONS
Northwestern Minnesota supports a surprisingly abundant and relatively diverse land snail fauna, with 54 species being observed over the entire landscape. The Aspen Parkland landscape and lowland Black Ash forests are especially important, as up to 27 taxa may co-
64
occur, with densities approaching 5500 shells per 4 liters of soil litter and humus. These are among the highest densities reported in the world. While almost 50% of the fauna can be considered cosmopolitan in the region, fully 35% are restricted to, or most frequent in, the west and south of the region. These species largely represent grassland taxa, and southern species who are at the northern limit of their range. Included in this fauna are species which are quite rare elsewhere in the eastern U.S., including Hawaiia n.sp., Vertigo arthuri, Vertigo cristata, Vertigo morsei, Vertigo nylanderi, and Vertigo paradoxa. While the fauna appears relatively stable (based on the relatively few rare species), protection of the few remaining oldgrowth sites (such as in Lake Itasca State Park) will be essential to protection of this fauna, as these sites support the most well developed humus and leaf litter layers, and thus most diverse and abundant snail communities. Additionally, continued extensive use of fire in Prairie and Aspen Parkland communities may lead to significant reductions in both abundance and richness. Additional research (especially use of manipulative experiments on unburned sites) must be conducted to further quantify this impact, and the rate at which faunas can recover.
ACKNOWLEDGEMENTS I was assisted throughout this project in field sampling by Brian Coles, and without whose help I certainly would have been much less successful in identifying the most important microsites. I was also accompanied in the field by Matt Barthel and Michael Draney. Alyssa Barnes, Tracy Kuklinski, Rachel Berkoben, J.J. Schiefelbein, Angela Sette, and Jo Sutto helped processed many soil litter samples, and/or assisted in shell counting. Additional assistance in litter processing was also provided by students of the Land Snail Ecology Practicum at the University of Wisconsin - Green Bay. Funding was provided by the Minnesota Nongame Wildlife Tax Checkoff and Minnesota State Park Nature Store Sales through the Minnesota Department of Natural Resources Natural Heritage and Nongame Research Program.
LITERATURE CITED Barker, G.M. and P.C. Mayhill, P.C. 1999. Patterns of diversity and habitat relationships in
terrestrial mollusc communities of the Pukeamaru Ecological District, northeastern New Zealand. Journal of Biogeography. 26:215-238.
Boycott, A.E. 1934. The habitats of land mollusca in Britain. Journal of Ecology. 22:1-38. Burgess, T.M. and R. Webster. 1980. Optimal interpolation and isarithmic mapping of soil
properties. II. Block kriging. J. Soil Science. 31:333-341. Cain, A.J.. 1983. Ecology and ecogenetics of terrestrial molluscan populations. pp. 597-647
in: The Mollusca, Volume 6, Ecology (W.D. Russell-Hunter, ed.). Academic Press, New York.
Cowie, R.H. and J.S. Jones. 1987. Ecological interactions between Cepaea nemoralis and Cepaea hortensis: competition, invasion, but no niche displacement. Functional Ecology. 1:91-97.
Dawley, C. 1955. Minnesota land snails. Nautilus. 69:56-62: Emberton, K.C., T.A. Pearce, and R. Randalana. 1996. Quantitatively sampling land-snail species richness in Madagascan rainforests. Malacologia. 38:203-212.
65
Frest, T.J. 1990. Final Report, Field Survey of Iowa Spring Fens, Contract #65-2454. Iowa Department of Natural Resources, Des Moines. Frest, T.J. 1991. Summary Status Reports on Eight Species of Candidate Land Snails from the Driftless
Area (Paleozoic Plateau, Upper Midwest. Final Report, Contract #301-01366, USFWS Region 3, Ft. Snelling, Minnesota.
Frest, T.J., and J.R. Dickson. 1986. Land snails (Pleistocene-recent) of the Loess Hills: a preliminary survey. Proceedings of the Iowa Academy of Science. 93:130-157.
Frest, T.J. and E.J. Johannes. 1995. Interior Columbia Basin Mollusk Species of Special Concern. Final Report, Contract #43-OE00-4-9112, Interior Columbia Basin Ecosystem Management Project, Walla Walla, Washington.
Hubricht, L. 1985. The distributions of the native land mollusks of the eastern United States. Fieldiana. n.s.24:1-191.
Kerney, M.P., and R.A.D. Cameron. 1979. Field guide to the land snails of the British Isles and northwestern Europe. Collins Press, London.
Nekola, J.C. 1994. Environment and vascular flora of northeastern Iowa fen communities. Rhodora. 96:121169.
Nekola, J.C. 1998. Terrestrial gastropod inventory of the Niagara Escarpment and Keweenaw volcanic belt in Michigan's Upper Peninsula. Final Report, 1998 Small Grants Program, Natural Heritage Program, Michigan Department of Natural Resources. Lansing, Michigan.
Nekola, J.C. 1999. Terrestrial gastropod richness of carbonate cliff and associated habitats in the Great Lakes region if North America. Malacologia. 41:231-252.
Nekola, J.C. in press. Effects of fire management on the richness and abundance of central North American grassland land snail faunas. Animal Biodiversity and Conservation.
Nekola, J.C. in review. Terrestrial gastropod fauna of northeastern Wisconsin and the southern Upper Peninsula of Michigan. To: American Malacological Bulletin.
Nekola, J.C., T.A. Smith, and T.J. Frest. 1996. Land snails ofDoorPeninsula natural habitats. Final Report, Wisconsin Chapter, The Nature Conservancy, Madison.
Nekola, J.C, M. Barthel, P. Massart, and E. North. 1999. Terrestrial gastropod inventory on igneous outcrops in northeastern Minnesota. Final Report, Minnesota Department of Natural Resources, St. Paul.
Nekola, J.C. and T.A. Smith. 1999. Terrestrial gastropod richness patterns in Wisconsin carbonate cliff communities. Malacologia. 41:253-269.
Oggier, P., S. Zschokke, and B. Baur. 1998. A comparison of three methods for assessing the gastropod community in dry grasslands. Pedobiologia. 42:348-357.
Ostlie, W.R. 1991. Completion of the algific slope/maderate cliff landsnail survey in Minnesota. Midwest Regional Office, TNC, Minneapolis, Minnesota.
Pearce, T.A. 1997. Interference and resource competition in two land snails: adults inhibit conspecific juvenile growth in field and laboratory. Journal of Molluscan Studies. 63:389-399. Pilsbry, H.A. 1948. Land Mollusca of North America (North of Mexico). Academy of Natural Sciences of Philadelphia Monograph 2(2):521-1113. Preece, R.C. 1992. Cochlicopa nitens (Gallenstein) in the British late-glacial and Holocene.
Journal of Conchology. 34:215-224.
66
Regan, T.J., H.M. Regan, K. Bonham, R.J. Taylor and M.A. Burgman. 2001. Modelling the impact of timber harvesting on a rare carnivorous land snail (Tasmaphena lamproides) in northwest Tasmania, Australia. Ecological Modelling. 139:253-264.
Smallridge, M.A. and G.C. Kirby. 1988. Competitive interactions between the terrestrial gastropods Thebia pisana (Müller) and Cernuella virgata (DaCosta) from South Australia. Journal of Molluscan Studies. 54:251-258. Stanisic, J. 1996. New land snails from boggomoss environments in the Dawson Valley,
southeastern Queensland (Eupulmonata: Charopidae and Camaenidae). Memoirs of the Queensland Museum. 39:343-354.
Tilman, D. 1988. Plant Strategies and the Dynamics and Structure of Plant Communities. Princeton University Press, Princeton. Turgeon, D.D., J.F. Quinn Jr., A.E. Bogan, E.V. Coan, F.G. Hochberg, W.G. Lyons, P.M.
Mikkelsen. 1998. Common and scientific names of aquatic invertebrates from the United States and Canada: mollusks. 2nd edition. Special Publication 26, American Fisheries Society, Bethesda, MD. 509 pp.
Velleman, P.F., and D.C. Hoaglin. 1981. Applications, basics, and computing of exploratory data analysis. Addison-Wesley Press, Reading, Massachusetts. 354 pp'.
Welter-Schultes, F.W. and M.R. Williams. 1999. History, island area and habitat availability determine land snail species richness of Aegean islands. Journal of Biogeography. 26:239-249.
Whittaker, R.H., 1975. Communities and ecosystems. MacMillan Publishing, New York. Zar, J.H. 1984. Biostatistical analysis. Prentice-Hall, Inc., Englewood Cliffs, New Jersey.
67
68
69
70
71
72
73
74
75
76
77
78
79
80
81
82
83
84
85
86
87
88
89
APPENDIX I:
Distribution maps for the 54 encountered species. Dark circles represent sites of occurrence, while open circles represents sites of absence.
90
91
92
93
94
95
96
97
98
99
100
101
102
103
104
APPENDIX II:
Alphabetical enumeration of sample sites by county, with location, habitat type, richness, total abundance, and species list.
105
106
107
108
109
110
111
112
113
114
115
116
117
118
119
120
121
122
123
124
125
126
127
128
129
130
131
132
133
134
135
136
137
138
139
140
141
142
143
144
145
146
147
148
149
150
151
152
153
154
155
156
157
158
159
160
161
162
163
164
165
166
167
168
169
170
171
172
173
174
175
176
177
178
179
Effects of fire management on the richness and abundance of central North