29
Diversity, Multiculturalism, and Inclusivity Survey OSU Results June, 2009 (Student Affairs Research Report, 2009-01) Rebecca A. Sanderson, Director Student Affairs Research and Evaluation

Diversity, Multiculturalism, and Inclusivity Survey
OSU Results June, 2009
(Student Affairs Research Report, 2009-01)
Rebecca A. Sanderson, Director Student Affairs Research and Evaluation

i
Table of Contents
Executive Summary ................................................................................... Executive Summary 1
Introduction ................................................................................................................................. 1 Methods ....................................................................................................................................... 1 Survey Instrument ........................................................................................................... 1 Student Sample ............................................................................................................... 2 Survey Procedures ......................................................................................................... 2 Data Analysis ................................................................................................................... 3
Results ......................................................................................................................................... 3
Respondent Characteristics .......................................................................................... 3
Beliefs About Diversity Related to Self ......................................................................... 6
Perceptions of Campus Access/Support for Diverse Students ................................ 11 Discrimination and Harassment on Campus .............................................................. 12 Description of OSU and OSU Actions ......................................................................... 17
Discussion ................................................................................................................................. 20
Recommendations for Consideration ..................................................................................... 23
Questions for Consideration ................................................................................................... 23

Executive Summary 1
Diversity, Multiculturalism, and Inclusivity Survey OSU Results
April, 2009
(Student Affairs Research Report, 2009-01)
Executive Summary
The Diversity, Multiculturalism, and Inclusivity Study was undertaken in order to understand better OSU students’ perceptions related to diversity at OSU. The National Association of Student Personnel Administrators commissioned the nation-wide survey with a consortium of colleges and universities across the nation. OSU was one of those institutions that elected to participate in the study. During the 2009 winter term a random sample of 4,000 OSU undergraduate students stratified by classification (i.e., freshmen, sophomores, juniors, seniors) were invited to participate in the study by completing a web survey. Approximately 15% (607) students responded to the survey. Overall most students indicated that they thought OSU was a very diverse place. Students expressed that there were many different opinions, belief systems, cultures, sexual orientations, approaches to problem solving, lifestyles, and life histories, etc., present at OSU. While some students commented that OSU was not very racially diverse they also qualified that comment by stating that Oregon is not a racially diverse state overall. Many students also commented that OSU was the most diverse place they had ever lived. Most students agreed that they had become more open-minded and that they were more aware of issues of diversity since entering OSU. Approximately 9% of respondents indicated that they had not learned more about diversity since attending OSU. Students were also in agreement that being able to interact successfully in a diverse world would be valuable to them after graduation, yet few reported that they engaged in opportunities provided by OSU to learn more about diversity. The primary ways in which students reported learning more about diversity included: in class, from friends, and talking with friends. About one-third of students indicated that they were tired of hearing about diversity. Students were asked a series of questions about their comfort level being friends with students who possessed various characteristics. Generally students reported comfort with being close friends with someone who was different from them (~ 70%) in terms of race/ethnicity, gender, or socio-economic class. Students were least comfortable (~55-60%) being close friends with someone who differed from the in terms of ability/disability or sexual orientation. Very few students (< 5%) indicated that they were not at all comfortable with any of the personal characteristics referenced above. Approximately 83% of students in general and 79% of OSU students of color believed that they were treated fairly as a student at OSU. Students generally agreed that OSU was supportive of students from different races, ethnicities, ability/disability, sexual orientations, etc. Additionally, students overall agreed that OSU encouraged open discussions about difficult topics.
Executive Summary 2
Most students reported that they had not either witnessed or experienced discrimination or harassment on campus within the last 12 months. Though, 18% of students of color did report that they had experienced discrimination on campus in the last 12 months. Of all the students who reported that they had experienced discrimination or harassment on campus in the last 12 months, the five areas that were selected most often as the target of the discrimination/harassment included: appearance/physical characteristics, biological sex, ethnicity, age, and race or political views (tied). In most cases, the alleged perpetrators of the discrimination or harassment were another student (~41%). The other two most frequently cited were faculty member (~16%) and administrator/staff member (~12%). The physical locations where the discrimination/ harassment occurred were most often in class (~22%), while walking on campus (~10%), and in a public space on campus (~9%). Overall students reported that the level of racial/ethnic tension on the campus was slightly to not at all tense. Students of color reported some greater sense of tension than did students in general however; the percentage differences were small. Only about 35% of students in general agreed strongly/somewhat that OSU should make a greater effort to recruit and retain students, faculty, and staff from diverse backgrounds. About 45% of students of color agreed strongly/somewhat that OSU should do likewise. Lack of prior contact with individuals and groups that are different from themselves is indicative of many students at OSU. Thus, interactions with individuals and groups that are new and unfamiliar to individual students can predictably result in errors, mistakes, and messiness as students try to navigate these kinds of relatively novel experiences. The educational imperative to assist students as they continue to experience an increasingly diverse world is clear. Individuals in a new situation likely do not know what they do not know and thus the possibility of error is relatively high and can be expected. Thus, our ability to continually engage with and respond to students in areas of diversity, multiculturalism, and inclusivity from an intentional, respectful and educational perspective is essential to their continued learning and development. Recommendations for Consideration 1. Create multiple and varied environments where students can talk with one another about
their lives, their differences, their commonalities and their multiple identities (both in classes and outside of classes).
2. Include in these environments and intentional learning environments time to reflect upon experiences with others different from and like themselves.
3. Foster service learning experiences that put students in touch with the issues of oppression,
privilege, and difference. These experiences must include space, time, and accountability for reflection.
4. Use existing systems (classes, living environments, organizations, leadership experiences)
and create new ones that engage students in awareness, knowledge, skill building, and practice in diverse settings.

Executive Summary 3
Questions for Consideration 1. What is needed in order to assist students in learning better how to engage in a diverse
environment?
2. How can OSU assist students early in their transition to OSU to understand better the level and dimensions of diversity that they will experience here?
3. What does it mean that about one-third of our students are tired of hearing about diversity?
4. What outcomes do we hope for our students as a result of efforts to create a more diverse
campus? How will we know if our students have achieved those outcomes?

1
Diversity, Multiculturalism, and Inclusivity SurveyOSU Results
Introduction OSU publicly supports diversity in its strategic plan, core values and diversity action plan. Thus, the value of diversity for Oregon State University is clear in its published documents. The perspective of students concerning diversity on campus has not been investigated per se. This survey is focused on students and their understanding of diversity, areas where they believe OSU to be diverse or not, their interest in diversity and ways in which they may react in the face of discrimination or harassment. The National Association of Student Personnel Administrators (NASPA) in collaboration with practitioners, whose area of expertise is diversity/multiculturalism, developed a survey to assess student perspectives. They then enlisted a number of colleges and universities as partners to help distribute the survey to students. Oregon State University participated in the NASPA Consortium of Colleges and Universities to study student perspectives on diversity, multiculturalism, and inclusivity. Colleges and universities involved in the study were asked to survey a sample of undergraduate students, stratified by class and randomly selected. As a part of this consortium, OSU had access to the survey results for OSU students who participated. Additionally, at a later time, OSU will receive the national report which is a summation of the results nationally for this survey. The results of the survey of OSU students will be used to understand better student perceptions of diversity at OSU. This information along with other sources of data and information may then be used to assist departments and units in their work with students.
Methods This study involved the administration of a survey to assess student perceptions of diversity on the campus, their experiences with discrimination or harassment, and their beliefs about themselves and how OSU supports diversity. The survey administration occurred during the Winter, 2009 Quarter from mid-January until mid-February. A random sample, stratified by classification (First Year, Sophomore, Junior, Senior) was asked to participate in a survey via an email invitation with a link to a secure web interface that contained the survey. Survey Instrument The survey instrument was developed by experts in the field of diversity and multiculturalism with consultation from survey research experts. OSU received the survey and was allowed to provide input into the questions and response possibilities as the survey was being developed. The survey instrument was focused on student perceptions of attitudes and behaviors regarding diversity on campus.
2
Student Sample The OSU Registrar’s Office provided a random sample of degree seeking undergraduates from the Corvallis campus: 1,000 each, first year students, sophomores, juniors, and seniors. A total of 4,000 OSU undergraduate students were surveyed. Survey Procedures The study protocol was submitted to the IRB for review and was approved as written. Students were sent an email to their ONID account requesting that they participate in the survey. This email message also contained the link to the web address where they could find the survey. Three reminder emails were sent to non-responders once per week from mid-January to mid-February, 2009. Data Analysis Frequency distributions were provided by Student Voice, the NASPA partner that administered the survey, as well as a download of the OSU data set. Further analysis was conducted using cross tabulations by various student characteristics. Because cell size was very small in some categories, mean comparisons were not conducted for most items. Some cells were combined in order to achieve a sufficient cell size so that some further analysis or comparisons could occur.
Results
This section of the report is divided into results related to: a. Respondent Characteristics, b. Beliefs about Diversity Related to Self, c. Perceptions of Campus Access/Support for Diverse Students, d. Discrimination and Harassment on Campus, e. Descriptions of OSU and OSU Actions Related to Diversity.
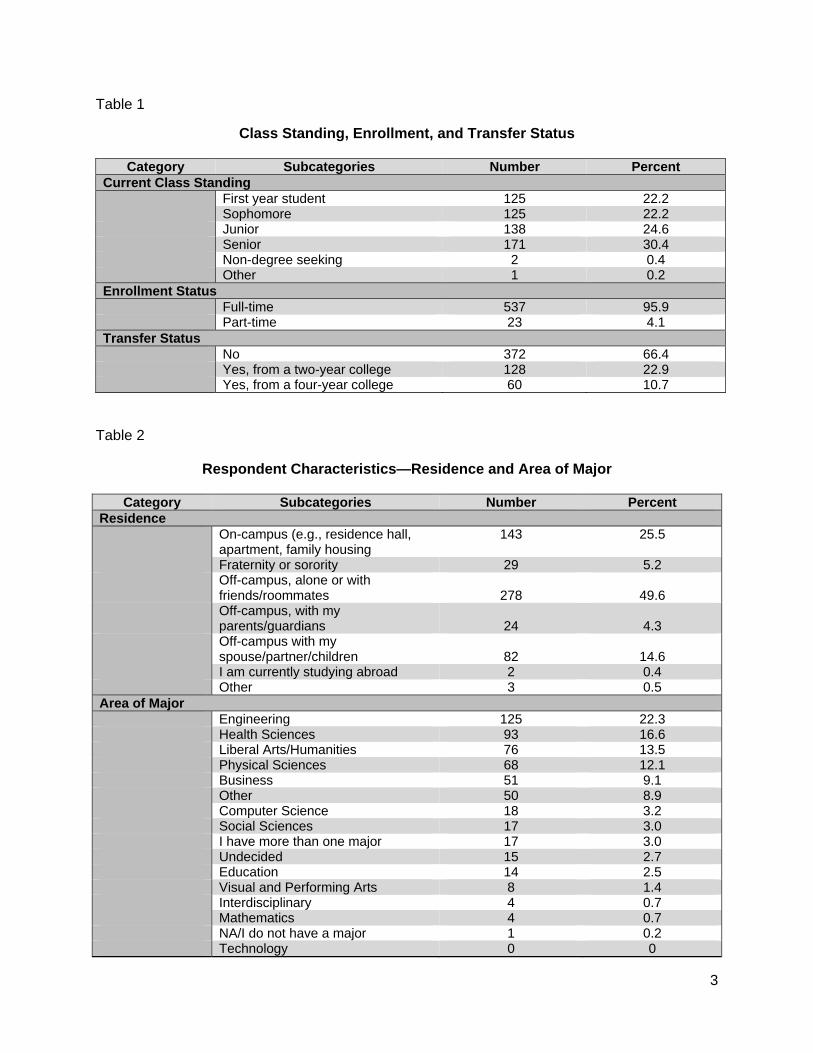
Respondent Characteristics Of the 4,000 students who were invited to participate in the study a total of 607 students or 15% responded to the survey. Overall respondents were fairly evenly spread across the four student classifications focused upon for the study. Further, most of the respondents (~96%) were full-time students with roughly one-third reporting that they had transferred to OSU. (See Table 1) The majority of students reported living off-campus versus on-campus with only about 25% living on-campus. As expected, the four most selected major areas reported by students included: Engineering, Health Sciences, Liberal Arts/Humanities, and the Physical Sciences. (See Table 2)
3
Table 1
Class Standing, Enrollment, and Transfer Status
Category Subcategories Number Percent Current Class Standing First year student 125 22.2 Sophomore 125 22.2 Junior 138 24.6 Senior 171 30.4 Non-degree seeking 2 0.4 Other 1 0.2 Enrollment Status Full-time 537 95.9 Part-time 23 4.1 Transfer Status No 372 66.4 Yes, from a two-year college 128 22.9 Yes, from a four-year college 60 10.7
Table 2
Respondent Characteristics—Residence and Area of Major
Category Subcategories Number Percent Residence On-campus (e.g., residence hall,
apartment, family housing 143 25.5
Fraternity or sorority 29 5.2 Off-campus, alone or with
friends/roommates
278
49.6 Off-campus, with my
parents/guardians
24
4.3 Off-campus with my
spouse/partner/children
82
14.6 I am currently studying abroad 2 0.4 Other 3 0.5 Area of Major Engineering 125 22.3 Health Sciences 93 16.6 Liberal Arts/Humanities 76 13.5 Physical Sciences 68 12.1 Business 51 9.1 Other 50 8.9 Computer Science 18 3.2 Social Sciences 17 3.0 I have more than one major 17 3.0 Undecided 15 2.7 Education 14 2.5 Visual and Performing Arts 8 1.4 Interdisciplinary 4 0.7 Mathematics 4 0.7 NA/I do not have a major 1 0.2 Technology 0 0

4
Unlike many surveys, approximately equal numbers of men and women responded to the survey. In terms of age, the majority (about 72%) of respondents were age 22 years of age or younger. Over 18% were 23 years old or older. (See Table 3) Table 3
Respondent Characteristics—Gender and Age
Category Subcategories Number Percent Gender Man 274 49.0 Woman 283 50.6 Transgender 0 0 Other 2 0.4 Age 19 or younger 180 32.4 20-22 250 45.0 23-25 46 8.3 26 or older 80 14.4 As is typical, most students (81.8%) reported their sexual orientation as heterosexual. Again, as expected only a small percentage of students were registered with the Disability Access Services Office at OSU. (See Table 4) Table 4
Respondent Characteristics--Sexual Identity and Registered with Disability Access Services
Category Subcategories Number Percent
Sexual identity Asexual 42 7.5 Bisexual 12 2.1 Gay 4 0.7 Genderqueer 0 0 Heterosexual 459 81.8 Lesbian 3 0.5 Pansexual 7 1.3 Queer 1 0.2 Questioning 6 1.1 Other 2 0.4 I prefer not to respond to this
question
25
4.5 Registered with Disability Access Services No 523 93.4 Yes 30 5.4 I do not know 7 1.3 As is typical of the OSU student population, 73.9% reported their racial identity as White. In order to increase the cell size for any racial comparisons, Asian/Pacific Islander, Black/African American, Latino(a)/Hispanic, Middle Eastern, and Indigenous/Native American were combined into a category entitled Students of Color. International students were not categorized with this

5
group as it was intended to represent domestic students of color. International students comprised 5.2% of students responding to the survey. (See Table 5) Table 5
Respondent Characteristics—International and Race/Ethnicity International Student Yes 29 5.2 No 529 94.8 Race/Ethnicity Asian/Pacific Islander 45 8.0 Black/African American 3 0.5 Latino(a)/Hispanic 17 3.0 Middle Eastern 7 1.3 Indigenous/Native American 7 1.3 White 414 73.9 Multiracial 26 4.6 I prefer to not respond to this
question
41
7.3 The religious affiliation of students was predominately Christian with 48.5% reporting this preference. Another 21.6% reported not being religious though 10% did say that while they were not religious they considered themselves to be spiritual. (See Table 6) Table 6
Respondent Characteristics—Religious Affiliation
Category Subcategories Number Percent Religious Affiliation Christian/Other 96 17.1 Christian/Protestant 93 16.6 Christian/Catholic 72 12.8 Agnostic 65 11.6 Not religious 65 11.6 Spiritual but not religious 56 10.0 Atheist 37 6.6 I prefer not to respond to this
question 31 5.5
Other 12 2.1 Christian/LDS/The Church of Jesus
Christ of the Latter-Day Saints 11 2.0
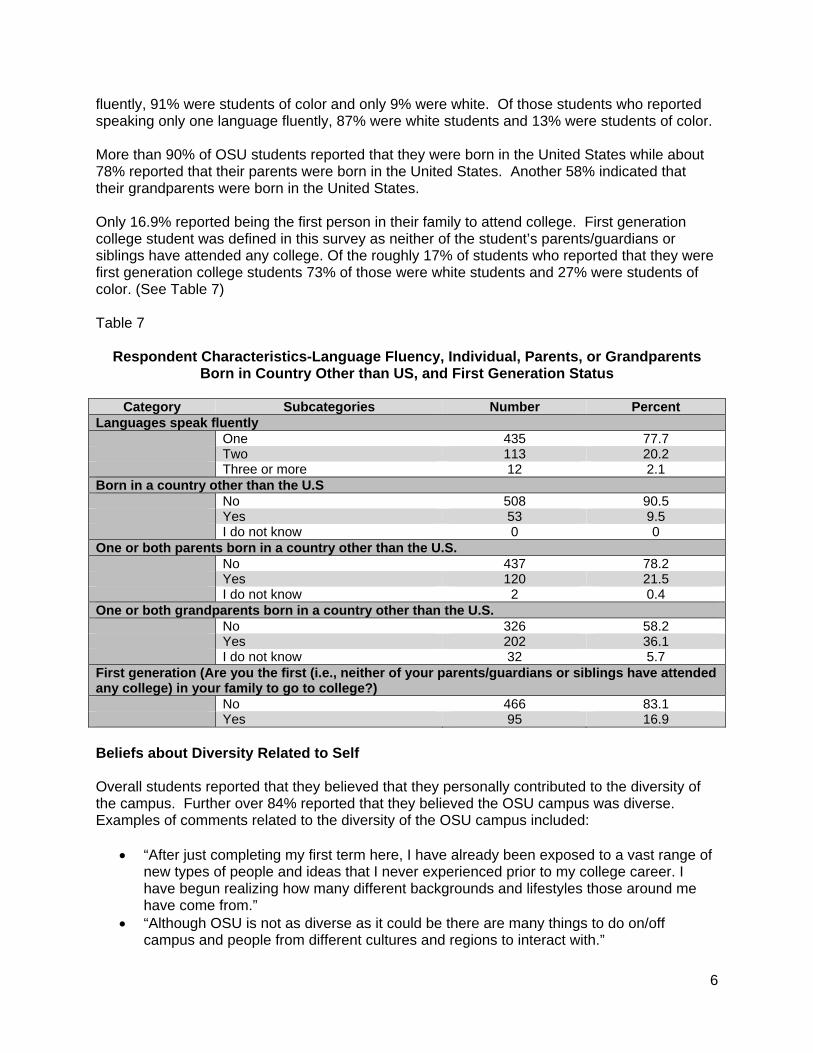
Buddhist/Taoist 10 1.8 Muslim 7 1.3 Jewish 3 0.5 Hindu 2 0.4 Zoroastrian 1 0.2 Most OSU students reported that they speak only one language fluently (77.7%). Another 20.2% reported speaking two languages fluently with only 2.1% reported speaking three or more languages fluently. Of those students who reported speaking three or more languages
6
fluently, 91% were students of color and only 9% were white. Of those students who reported speaking only one language fluently, 87% were white students and 13% were students of color. More than 90% of OSU students reported that they were born in the United States while about 78% reported that their parents were born in the United States. Another 58% indicated that their grandparents were born in the United States. Only 16.9% reported being the first person in their family to attend college. First generation college student was defined in this survey as neither of the student’s parents/guardians or siblings have attended any college. Of the roughly 17% of students who reported that they were first generation college students 73% of those were white students and 27% were students of color. (See Table 7) Table 7
Respondent Characteristics-Language Fluency, Individual, Parents, or Grandparents
Born in Country Other than US, and First Generation Status
Category Subcategories Number Percent Languages speak fluently One 435 77.7 Two 113 20.2 Three or more 12 2.1 Born in a country other than the U.S No 508 90.5 Yes 53 9.5 I do not know 0 0 One or both parents born in a country other than the U.S. No 437 78.2 Yes 120 21.5 I do not know 2 0.4 One or both grandparents born in a country other than the U.S. No 326 58.2 Yes 202 36.1 I do not know 32 5.7 First generation (Are you the first (i.e., neither of your parents/guardians or siblings have attended any college) in your family to go to college?) No 466 83.1 Yes 95 16.9 Beliefs about Diversity Related to Self Overall students reported that they believed that they personally contributed to the diversity of the campus. Further over 84% reported that they believed the OSU campus was diverse. Examples of comments related to the diversity of the OSU campus included:
• “After just completing my first term here, I have already been exposed to a vast range of new types of people and ideas that I never experienced prior to my college career. I have begun realizing how many different backgrounds and lifestyles those around me have come from.”
• “Although OSU is not as diverse as it could be there are many things to do on/off campus and people from different cultures and regions to interact with.”

7
• “Compared to my home in northeastern Oregon, this campus is very ethnically and racially diverse.”
• “I would say it is pretty diverse. While the majority of the campus is white, we have so many different cultures and outlooks on life attending school we get an image of a much larger world.”
• “It is all relative, I do think the campus is diverse because I have learned so much here but to others who have had a different life experience may disagree.
For the approximately 16% of students who reported that OSU is not diverse, their comments related to diversity included examples such as:
• “As I walk through the campus I see nothing but a sea of white faces--most looking fairly
affluent; very few of different colors and very few like myself; non-traditional (age), middle-to-lower income class.”
• “I believe that there certainly are minorities at OSU but looking at the campus, it is still a mainly white campus. Most of my classes are mainly white students. I am still the only minority in almost all of my classes, if not the only one then a very small group.”
• “I chose to answer no because while there are a fair number of minority students at OSU, I think that their representation in the student population could be improved. The group that I feel is dramatically underrepresented are students with physical disabilities - OSU's campus is not wheelchair friendly at all. While many buildings are "ADA compliant" they are not practical, and there are several buildings on campus that are almost completely inaccessible.”
• “It seems like there are "token" minorities. There is especially a small number of Hispanic students compared to Oregon's population. There are students of different backgrounds, but it seems as if different groups do not interact. Bacc core classes should be changed so that there is a class that really allows students of different backgrounds to interact, not just writing together, or learning about one minority group for a class.”
• “There are not enough people of color on campus and because of that, I feel uncomfortable on campus sometimes.”
• “This campus lacks a great deal of racial diversity, which is somewhat understandable, considering that Oregon is mostly Caucasian, but it's a bit unnerving for one like myself (coming from a pretty diverse city), to see so few people of color.”
Approximately 82% of the students of color who answered this question reported that they thought OSU was diverse. Likewise, approximately 85% of the white students who answered this question also thought the campus was diverse. Students reported agreement that since entering college they had become more open-minded about diversity-related issues. Approximately 52.6% agreed strongly/somewhat that they had become more open-minded while 15.9% disagreed strongly/somewhat that they had become more open-minded about diversity issues since entering college. Figure 1 below contains the areas of diversity that students reported learning more about or becoming more aware of since starting college. The three areas that students selected most often included race/ethnicity/culture, life experiences, and sexual orientation. Unfortunately about 9% reported that they had not learned more about diversity since attending college. Approximately 13% of men and 6% of women indicated that they had not learned more about diversity since attending OSU.

8
Figure 1
The venues where students reported learning about or becoming more aware of diversity, are contained in Figure 2 below. The three venues that students selected most often included: In class, from friends, and from talking with friends. Figure 2
0.00% 10.00% 20.00% 30.00% 40.00% 50.00% 60.00%
AgeDisability
GenderRace / ethnicity / culture
Geographic (where people grow up)Political views
Religion / spiritualitySexual orientation
Socio-economic status / classSocial justice / oppression and privilege
Life experiencesI have not learned more about diversity …
Other
Percent
Div
ersi
ty A
reas
Diversity Issues that Students Reported Learning Most About/Becoming More Aware of Since Coming to College
0% 20% 40% 60% 80%
In classAt work
From my friendsFrom my family
From studying abroadFrom traveling outside of the United States
In workshopsIn dialogue groups
Talking with friendsLiving in the residence hall with others …
Campus involvement (e.g., events, …Community service or volunteer work
Speakers, movies, or other campus …Other
Venu
es
Venues in which Students Learned About or Became More Aware of Diversity
9
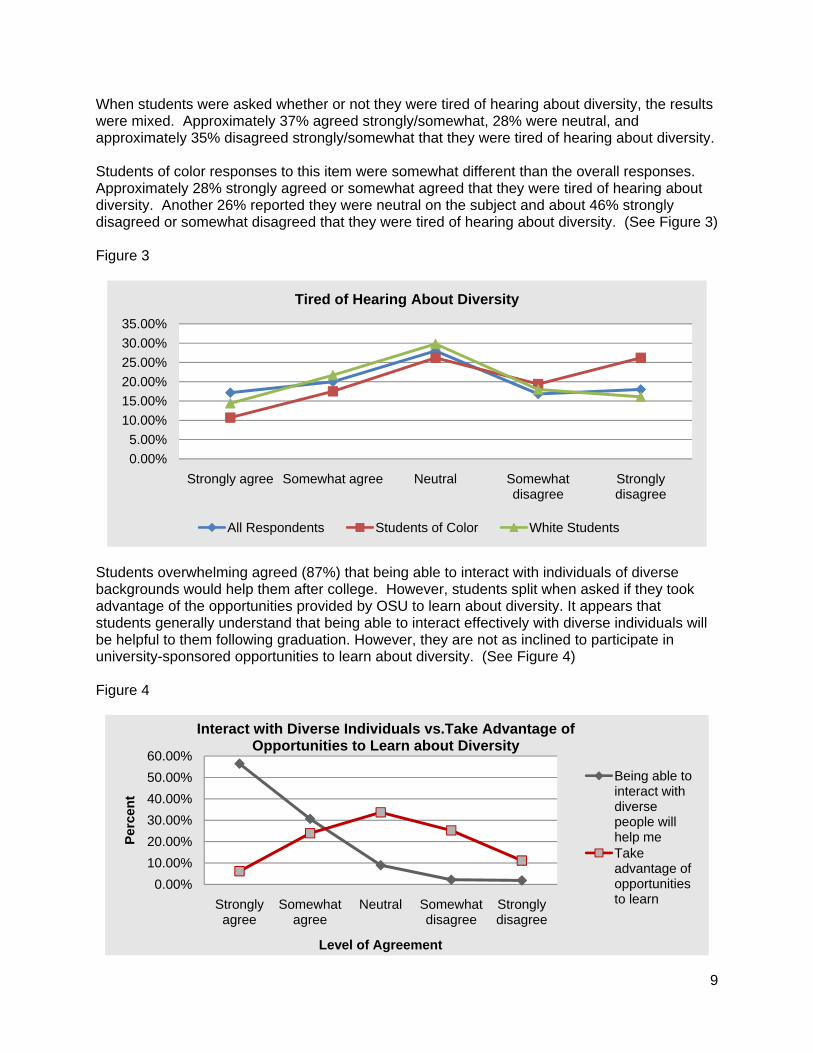
When students were asked whether or not they were tired of hearing about diversity, the results were mixed. Approximately 37% agreed strongly/somewhat, 28% were neutral, and approximately 35% disagreed strongly/somewhat that they were tired of hearing about diversity. Students of color responses to this item were somewhat different than the overall responses. Approximately 28% strongly agreed or somewhat agreed that they were tired of hearing about diversity. Another 26% reported they were neutral on the subject and about 46% strongly disagreed or somewhat disagreed that they were tired of hearing about diversity. (See Figure 3) Figure 3
Students overwhelming agreed (87%) that being able to interact with individuals of diverse backgrounds would help them after college. However, students split when asked if they took advantage of the opportunities provided by OSU to learn about diversity. It appears that students generally understand that being able to interact effectively with diverse individuals will be helpful to them following graduation. However, they are not as inclined to participate in university-sponsored opportunities to learn about diversity. (See Figure 4) Figure 4
0.00%5.00%
10.00%15.00%20.00%25.00%30.00%35.00%
Strongly agree Somewhat agree Neutral Somewhat disagree
Strongly disagree
Tired of Hearing About Diversity
All Respondents Students of Color White Students
0.00%10.00%20.00%30.00%40.00%50.00%60.00%
Strongly agree
Somewhat agree
Neutral Somewhat disagree
Strongly disagree
Perc
ent
Level of Agreement
Interact with Diverse Individuals vs.Take Advantage of Opportunities to Learn about Diversity
Being able to interact with diverse people will help meTake advantage of opportunities to learn

10
Men and women disagreed somewhat on each of these items however. Generally 61% of women agreed strongly/somewhat that they had become more open-minded about diversity compared to 46% of their male counterparts. Likewise more women (34%) than men (28%) agreed strongly/somewhat that they took advantage of the opportunities to learn about diversity. However, both of these percentages were quite low given the belief that over 80% of both men and women believed strongly/somewhat that being able to interact with individuals of diverse backgrounds would help them after college. While students may not be participating in university-sponsored opportunities to learn about diversity at high levels, students are talking with friends and family about diversity-related issues. About 52% of students agreed that they discussed diversity issues with friends. A nearly equal percentage of students, about 52%, agreed that they discussed diversity issues with family members. However, about one-fourth of students also indicated that they did not talk with friends or family about diversity-related issues. Generally, students expressed a high degree of comfort being friends or close friends with people who differed from them concerning race/ethnicity, religion, or gender. Figure 5 below contains the graphic results of the responses to these questions. Figure 5
Students likewise reported being comfortable being friends with or close friends with someone who differed from them concerning socio-economic status. The same could not be said of students who differed from them regarding sexual orientation or disability status. In these two cases, students were less comfortable being friends with someone who was disabled or who had a different sexual orientation than they did. (See Figure 6)
Not at all comfortable
with
Comfortable being
around
Comfortable interacting
with
Comfortable being
friends with
Comfortable being close friends with
Race/Ethnicity 0.18% 1.96% 7.30% 18.33% 72.24%Gender 0.53% 1.78% 6.05% 14.06% 77.58%Religion 0.18% 2.14% 8.02% 23.53% 66.13%
0.00%10.00%20.00%30.00%40.00%50.00%60.00%70.00%80.00%90.00%
Level of Comfort with Individuals Who are Different From Me Concerning . . .

11
Figure 6
Perceptions of Campus Access/Support for Diverse Students Students were asked a series of questions about how accessible or supportive the campus was for various groups of students. Generally, students reported that the campus was accessible/ supportive of these groups. However, representation of these various groups was fairly small in terms of respondents thus, the answers to these questions are responded to primarily from the perspective of the dominant culture at OSU. (See Figure 7) With closer examination students of color and white students responded similarly to the accessibility of campus to people with disabilities. Approximately 72% of both groups agreed strongly/somewhat that the campus is accessible to people with disabilities. Regarding agreement that OSU is supportive of people who identify as lesbian, gay, bisexual, or transgendered, students of color and white students differed somewhat. Nearly two-thirds of students of color agreed strongly/somewhat that OSU is supportive of GLBT students while a little over three-fourths of white students responded likewise. The number of students who reported their sexual identity as gay, lesbian, bisexual, or transgendered was too small to compare to other groups. In terms of OSU support for students of color, 82% of students of color agreed strongly/somewhat that OSU was supportive of students from different ethnic backgrounds. Likewise, 89% of white students agreed strongly/somewhat that OSU was supportive of students from different ethnic groups.
Not at all comfortable
with
Comfortable being
around
Comfortable interacting
with
Comfortable being
friends with
Comfortable being close friends with
Socio-Economic Status 0.53% 1.60% 5.87% 15.84% 76.16%Sexual Orientation 4.11% 8.41% 13.95% 25.22% 48.30%Disability 0.53% 3.57% 10.52% 27.45% 57.93%
0.00%10.00%20.00%30.00%40.00%50.00%60.00%70.00%80.00%
Level of Comfort with Individuals Who are Different From Me Concerning . . .

Figure 7
About 70discussiostrongly w Discrimi Studentsdiscrimincomfort lthey werefairly trea Approximtreated facolor in testudents campus w
0
10
20
30
40
50
60
Perc
ent
0% of studenons about difwith that sta
ination and
s were askednation or haraevel with repe treated faiated. Howev
mately 11% oairly on camerms of theiof color agr
while 86% o
.00%
.00%
.00%
.00%
.00%
.00%
.00%
Stroag
Deg
nts somewhafficult topics
atement.
Harassmen
d a series of assment on porting to OSrly on the caver, almost 1
of men and 9pus. There r perception
reed stronglyof white stud
ongly gree
Somag
gree to Whi
at or strongly. Neverthele
nt on Camp
f questions ccampus, ins
SU officials. ampus, most10% disagre
9% of womewas also a ds of fair trea
y/somewhat ents reporte
mewhat gree
Ne
Level of A
ch OSU is A
y agree that ess approxim
pus
concerning thstitutional re When studt (83%) som
eed somewh
en disagreeddifference b
atment on thethat they we
ed likewise. (
eutral Somdisa
Agreement
Accessible/
OSU encoumately 9% d
heir experiensponse, ava
dents were amewhat/stronhat/strongly t
d somewhat etween white campus. Aere fairly trea(See Figure
mewhat agree
Strodisa
/Supportive
urages free adisagree som
nce and/or oailability of inasked if they ngly agreed tthat they we
or strongly tte students aApproximateated as a stu8)
ongly agree
e of . . .
and open mewhat or
observation onformation, afelt as thoug
that they were treated fa
that they weand studentsely 79% of udent on
Accessible topeople with physical disabilities
Supportive ofLGBT people
Supportive ofpeople with different ethnbackgrounds
Supportive ofInternational students
12
of and gh
ere airly.
ere s of
o
f e
f
nic s
f
13
Figure 8
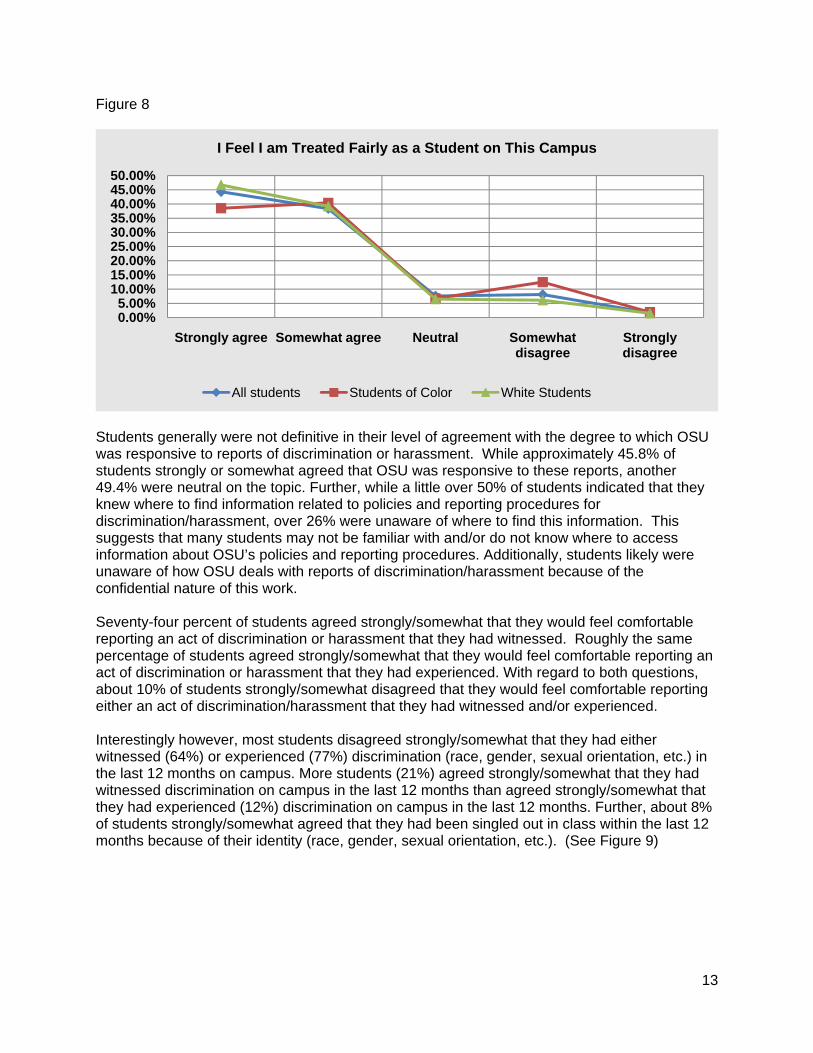
Students generally were not definitive in their level of agreement with the degree to which OSU was responsive to reports of discrimination or harassment. While approximately 45.8% of students strongly or somewhat agreed that OSU was responsive to these reports, another 49.4% were neutral on the topic. Further, while a little over 50% of students indicated that they knew where to find information related to policies and reporting procedures for discrimination/harassment, over 26% were unaware of where to find this information. This suggests that many students may not be familiar with and/or do not know where to access information about OSU’s policies and reporting procedures. Additionally, students likely were unaware of how OSU deals with reports of discrimination/harassment because of the confidential nature of this work. Seventy-four percent of students agreed strongly/somewhat that they would feel comfortable reporting an act of discrimination or harassment that they had witnessed. Roughly the same percentage of students agreed strongly/somewhat that they would feel comfortable reporting an act of discrimination or harassment that they had experienced. With regard to both questions, about 10% of students strongly/somewhat disagreed that they would feel comfortable reporting either an act of discrimination/harassment that they had witnessed and/or experienced. Interestingly however, most students disagreed strongly/somewhat that they had either witnessed (64%) or experienced (77%) discrimination (race, gender, sexual orientation, etc.) in the last 12 months on campus. More students (21%) agreed strongly/somewhat that they had witnessed discrimination on campus in the last 12 months than agreed strongly/somewhat that they had experienced (12%) discrimination on campus in the last 12 months. Further, about 8% of students strongly/somewhat agreed that they had been singled out in class within the last 12 months because of their identity (race, gender, sexual orientation, etc.). (See Figure 9)
0.00%5.00%
10.00%15.00%20.00%25.00%30.00%35.00%40.00%45.00%50.00%
Strongly agree Somewhat agree Neutral Somewhat disagree
Strongly disagree
I Feel I am Treated Fairly as a Student on This Campus
All students Students of Color White Students

14
Figure 9
Approximately 18% of students of color strongly/somewhat agreed that they had experienced discrimination on campus in the last 12 months. For white students 10% agreed strongly/somewhat that they had experienced discrimination on campus in the last 12 months. About 9% of students of color strongly/somewhat agreed that they had experienced harassment on campus in the last 12 months while 4.5% of white students responded likewise. Students who agreed strongly/somewhat that they had experienced discrimination or harassment on campus were asked several more questions related to areas in which they believe the discrimination or harassment was directed, the source, location, and nature of the act(s). The four most selected areas that students indicated were the subject of the discrimination or harassment included: appearance/physical characteristics, biological sex, ethnicity, and age. (See Table 8) Table 8
Areas in Which Students Reported Experiencing Discrimination or Harassment
Response Percent
Category Response Percent
Category
14.83% Appearance/physical characteristic 3.42% Nationality/country of origin 11.79% Biological sex 2.66% Gender identity 11.79% Ethnicity 1.90% English language accent/proficiency 11.03% Age 1.90% Other 9.51% Political views 1.14% Learning disability 9.51% Race 0.76% Military/veteran status 8.37% Religious beliefs 0.76% Physical disability 5.32% Socioeconomic status 0.38% Parental status (children) 4.56% Sexual orientation 0.38% Psychological disability
0
10
20
30
40
50
strongly disagree
somewhat disagree
neutral somewhat agree strongly agree
Perc
ent
I have witnessed discriminatory behavior on campus within the last 12 months . . .
Students of Color White Students All students

15
Likewise students who had experienced discrimination or harassment were asked to select all that applied from a list of potential perpetrators of discrimination or harassment. Table 9 below contains the response percentages. Table 9
Alleged Perpetrators of the Discrimination/Harassment
Response Percent Category 40.82% Another student 15.65% Faculty member 12.24% Administrator/staff member 7.48% Person not associated with your college/university 6.12% Teaching assistant 4.08% Campus police or security officer 4.08% Publication (posters, brochures, handouts) 3.40% Don’t know/unknown 3.40% Other (please specify) 2.72% Resident assistant or resident coordinator
Students were then asked where the discrimination/harassment occurred. They could select all locations that applied to their situation. Interestingly, the location most selected by students in terms of the location of the discrimination or harassment was “in a class.” This is particularly concerning since there is a faculty member present in the classroom. Table 10 contains the response percent to each of the categories. Table 10
Location of Discrimination/Harassment
Response Percent
Category Response Percent
Category
22.16% In a class 3.78% Campus office 10.27% While walking on campus 3.78% On-campus dining facility 9.19% In a public space on
campus 3.24% In a faculty office
8.65% Off campus 3.24% Other (please explain) 8.11% Campus event 2.70% On-campus recreation or
athletic facility 7.57% On-campus housing 2.70% While working at a campus
job 7.03% Off-campus housing 2.16% In a meeting with one other
person 5.41% In a group meeting

16
Students were asked if they had experienced any of the following in last 12 months. Students could select as many as were appropriate to their situation. Table 11 below contains the response percent and categories of discriminatory/harassing behaviors. Table 11
Types of Discriminatory or Harassing Incidents
Response Percent Category
70.75% None of the above 10.69% Been the target of offensive humor 5.35% Feared for my personal safety 4.87% Received hostile or threatening comments and/or gestures 3.46% Been the target of racial or ethnic profiling 1.89% Been the target of obscene or threatening language on an
online community
1.57% Received offensive personal email (targeted at you personally, as opposed to spam)
1.42% Received obscene or threatening phone calls
When a discriminatory or stereotypical comment is made, students generally indicated that their reaction depended on what was said, the situation and who was making the comment. Even though students had some qualifiers to the impact of the statements, almost one quarter of the students indicated that they ignored the comment but felt angry about it. Further nearly 28% reported feeling uncomfortable or awkward about what happened. Table 12 contains the respondent percent for each of the possible reactions listed. Table 12
Reaction when a Discriminatory/Stereotypical Comment is Made
Respondent % Student Reactions 67.77% It depends upon the situation. 67.60% It depends upon what was said. 45.47% It depends upon who is making the comment. 37.80% I correct/challenge the stereotype. 28.22% I feel uncomfortable or awkward. 24.04% I confront the person. 22.30% I ignore it but I feel angry about it. 19.16% I ignore it because I do not care. 18.82% I laugh at it. 17.07% I talk to others about it, but not the person who made the comment.7.32% Other

17
Description of OSU and OSU Actions Approximately 60% of students described OSU as being very welcoming with another 34% describing OSU as somewhat welcoming. Only about 7% of students indicated that OSU was slightly or not at all welcoming. Nearly the same percentages of students described OSU similarly with regard to being respectful. Over 50% of students agreed strongly or somewhat that the OSU curriculum and course offerings reflected the lives, perceptions, and contributions of people from diverse backgrounds. Though, a little over one third were neutral on this topic and another 12 % disagreed that the curriculum was reflective of people from diverse backgrounds. (See Figure 10) Figure 10
When asked about the level of racial/ethnic tension on campus over 50% reported that OSU was not racially/ethnically tense. About 12% of OSU students thought that the campus was very or somewhat racially/ethnically tense. The level of racial/ethnic tension reported by students of color was somewhat greater than that reported by white students but not to a significant degree. (See Figure 11)
15.55%
37.81%34.81%
8.48%
3.36%0.00%
5.00%
10.00%
15.00%
20.00%
25.00%
30.00%
35.00%
40.00%
Strongly agree Somewhat agree Neutral Somewhat disagree
Strongly disagree
Curriculum and Course Offerings Reflect the Lives, Perceptions, and Contributions of People from Diverse Backgrounds

18
Figure 11
Students overall showed balanced opinions concerning OSU recruitment of faculty, staff, and students. Roughly the same percentage of students agreed strongly/somewhat as disagreed strongly/somewhat in recruitment of diverse students, faculty and staff. (See Figure 12) Figure 12
Perspectives of students of color however differed somewhat from the overall student response to OSU recruitment efforts. More students of color strongly/somewhat agreed that OSU should
010203040506070
Very tense Somewhat tense Slightly tense Not at all tense
Perc
ent
Level of Racial/Ethnic Tension on Campus
Students of Color White Students All Students
05
101520253035404550
Strongly agree Somewhat agree Neutral Somewhat disagree
Strongly disagree
Perc
ent
OSU Should Make A Greater Effort To . . .
Recruit and retain students from diverse backgrounds
Recruit and retain faculty members from diverse backgrounds
Recruit and retain staff members from diverse backgrounds
19
make greater efforts to recruit faculty, staff, and students from diverse backgrounds. (See Table 13) Table 13
Students of Color Beliefs about OSU Making a Greater Effort to . . .
Strongly agree
Somewhat agree
Neutral
Somewhat disagree
Strongly disagree
Recruit and retain students from diverse backgrounds
26.7 24.8 35.2 7.6 5.7
Recruit and retain faculty members from diverse backgrounds
20.2 20.2 41.3 9.6 8.7
Recruit and retain staff members from diverse backgrounds
21.0 21.9 43.8 6.7 6.7
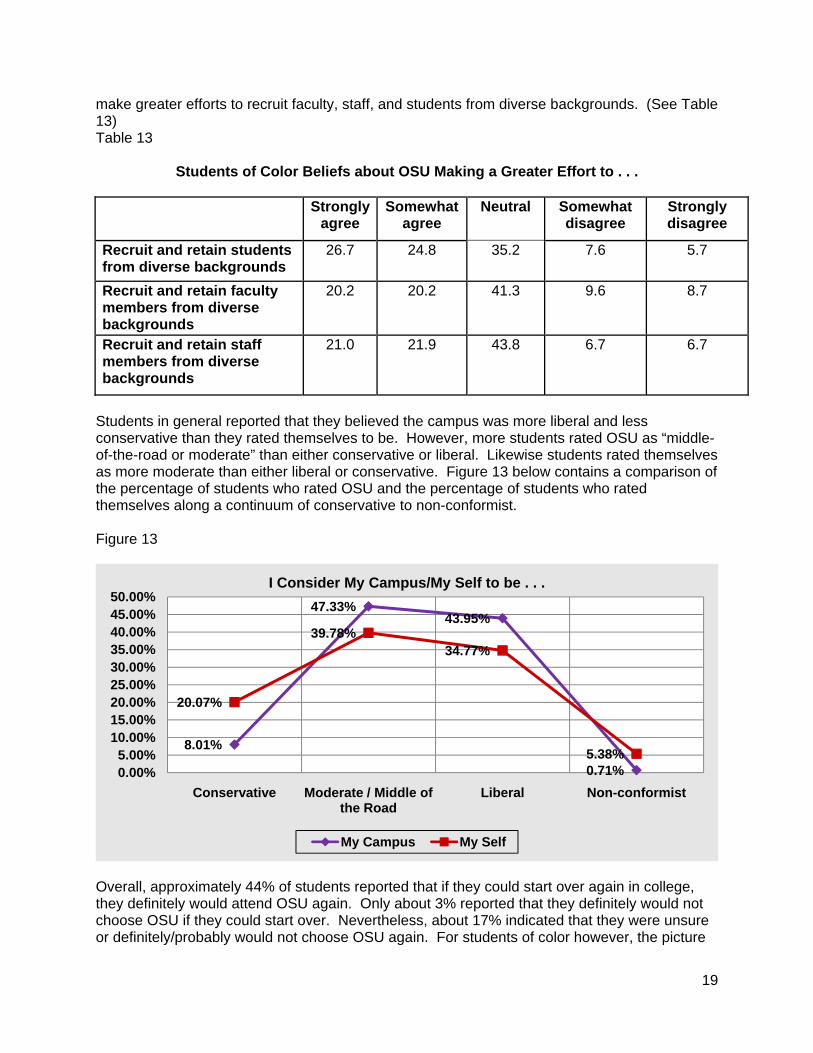
Students in general reported that they believed the campus was more liberal and less conservative than they rated themselves to be. However, more students rated OSU as “middle-of-the-road or moderate” than either conservative or liberal. Likewise students rated themselves as more moderate than either liberal or conservative. Figure 13 below contains a comparison of the percentage of students who rated OSU and the percentage of students who rated themselves along a continuum of conservative to non-conformist. Figure 13
Overall, approximately 44% of students reported that if they could start over again in college, they definitely would attend OSU again. Only about 3% reported that they definitely would not choose OSU if they could start over. Nevertheless, about 17% indicated that they were unsure or definitely/probably would not choose OSU again. For students of color however, the picture
8.01%
47.33%43.95%
0.71%
20.07%
39.78%34.77%
5.38%0.00%5.00%
10.00%15.00%20.00%25.00%30.00%35.00%40.00%45.00%50.00%
Conservative Moderate / Middle of the Road
Liberal Non-conformist
I Consider My Campus/My Self to be . . .
My Campus My Self
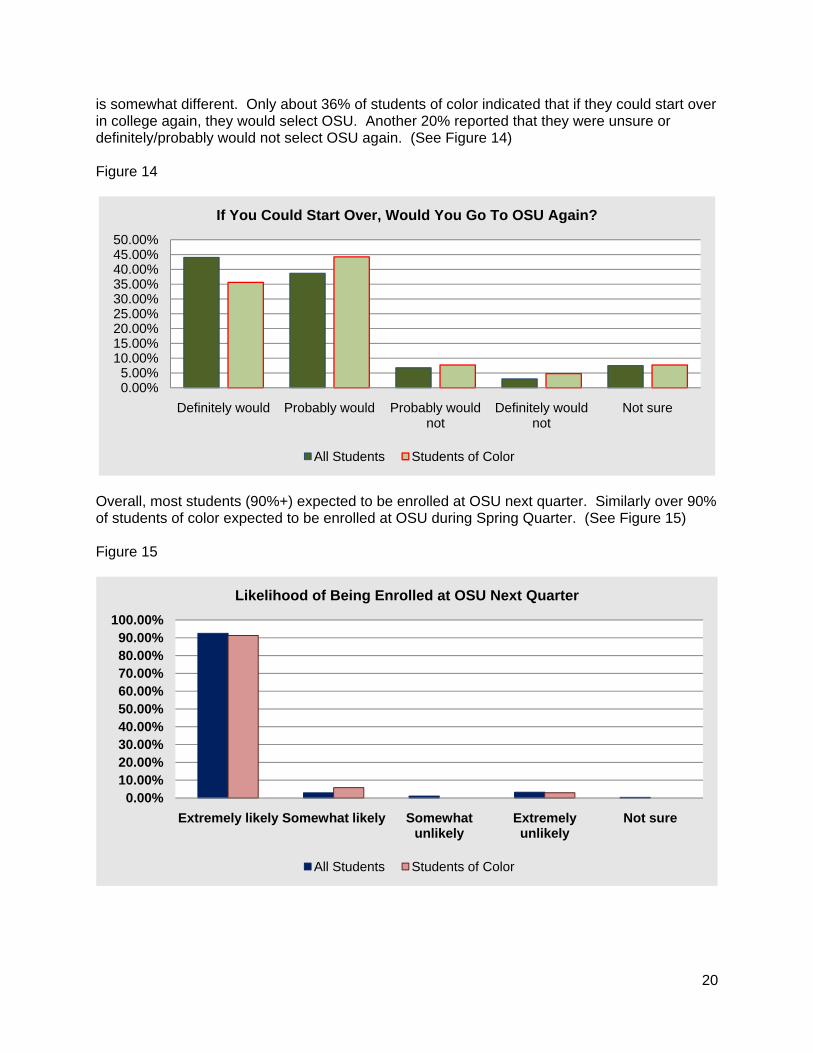
20
is somewhat different. Only about 36% of students of color indicated that if they could start over in college again, they would select OSU. Another 20% reported that they were unsure or definitely/probably would not select OSU again. (See Figure 14) Figure 14
Overall, most students (90%+) expected to be enrolled at OSU next quarter. Similarly over 90% of students of color expected to be enrolled at OSU during Spring Quarter. (See Figure 15) Figure 15
0.00%5.00%
10.00%15.00%20.00%25.00%30.00%35.00%40.00%45.00%50.00%
Definitely would Probably would Probably would not
Definitely would not
Not sure
If You Could Start Over, Would You Go To OSU Again?
All Students Students of Color
0.00%10.00%20.00%30.00%40.00%50.00%60.00%70.00%80.00%90.00%
100.00%
Extremely likely Somewhat likely Somewhat unlikely
Extremely unlikely
Not sure
Likelihood of Being Enrolled at OSU Next Quarter
All Students Students of Color

21
Discussion Oregon State University is diverse by choice. This sentiment is expressed in the University values, the strategic plan, and in the curricular requirements of the difference, power, and discrimination program. Students who attend OSU are exposed to a wide variety of diverse opinions, lifestyles, religions, ways of approaching problems, disciplines, and cultures to name just a few of the differences present at a land grant research university. Students too bring their individual experiences, opinions, lifestyles, etc. which further diversifies the university. Because enhancing the diversity of the campus is an important goal for OSU and because we believe that being able to thrive in a global environment is essential for OSU graduates, students are encouraged to participate in learning experiences that will enhance their abilities to engage successfully in a diverse world. Student opinions and experiences at OSU can shape how they view and interact with the diversity present at OSU. In order to better understand students and their perspectives on diversity, the Diversity, Multiculturalism, and Inclusivity study was undertaken. The results of this study were based upon a survey conducted at Oregon State University with a random sample of undergraduate students stratified by classification (e.g., first year, sophomore, etc.). A total of 4,000 students were invited to participate in the study with 607 students responding (15%). The survey was developed by a group of professionals with expertise in survey development and diversity/multiculturalism commissioned by the National Association of Student Personnel Administrators (NASPA). A consortium of colleges and universities administered the web-based survey through a company that supports assessment in student affairs, Student Voice. OSU was provided with the frequency distributions for all the questions as well as the raw de-identified data for all OSU respondents. At a later date, OSU will receive a report from NASPA for the national findings. Overall students reported that they believed that OSU was a very diverse place. Approximately 15% of respondents were domestic students of color and another 73% were white students. The remaining students either were international students (about 5%) or were students who preferred not to identify themselves within a category. Students expressed that there were many different opinions, belief systems, cultures, sexual orientations, approaches to problem solving, lifestyles, and life histories, etc. present at OSU. While some students commented that OSU was not very racially diverse, they also qualified that comment by stating that Oregon is not a racially diverse state overall. Most students agreed that they had become more open-minded and more aware of issues of diversity since coming to OSU. Of those issues of diversity that students had become more aware of the three most selected areas included: race/ethnicity/culture, life experiences, and sexual orientation. Unfortunately, approximately 9% of students overall reported that they had not learned more about diversity since attending OSU. The venues in which students reported learning more about diversity most frequently included: from friends, talking with friends, and in classes. From the student responses, it was clear that students realized that being able to interact with individuals from diverse backgrounds and cultures would be advantageous to them after college; however few acknowledged that they engaged in opportunities provided by OSU to learn more about diversity. A little over one-third of students strongly/somewhat agreed that they were tired of hearing about diversity.

22
Students were asked a series of questions about their comfort level being friends with students who possessed various characteristics. Generally students reported comfort with being close friends with someone who was different from them (~ 70%) in terms of race/ethnicity, gender, or socio-economic class. Students were least comfortable (~55-60%) being close friends with someone who differed from the in terms of ability/disability or sexual orientation. Very few students (< 5%) indicated that they were not at all comfortable with any of the personal characteristics referenced above. Generally students agreed that OSU was supportive of students from different races, ethnicities, ability/disability, sexual orientations, etc. Additionally, students overall agreed that OSU encouraged open discussions about difficult topics. Most students (83%) believed that they were treated fairly as a student at OSU. Additionally, 79% of OSU students of color also thought that they were fairly treated at OSU. About 11% of men and 9% of women students indicated that they did not feel that they were fairly treated at OSU however. Most students reported that they had not either witnessed or experienced discrimination or harassment on campus within the last 12 months. Though, 18% of students of color did report that they had experienced discrimination on campus in the last 12 months. Of all the students who reported that they had experienced discrimination or harassment on campus in the last 12 months, the five areas that were selected most often as the target of the discrimination/harassment included: appearance/physical characteristics, biological sex, ethnicity, age, and race or political views (tied). In most cases, the alleged perpetrators of the discrimination or harassment were another student (~41%). The other two most frequently cited were faculty member (~16%) and administrator/staff member (~12%). The physical locations where the discrimination/harassment occurred were most often in class (~22%), while walking on campus (~10%), and in a public space on campus (~9%). Students’ comfort with and knowledge about how to manage or report acts of discrimination/harassment were mixed. About three-quarters of the students indicated that they would feel comfortable reporting an act of discrimination/harassment that they had either witnessed or experienced. However, a little over two-thirds of students had not either witnessed or experienced discrimination or harassment. Additionally, about 25% of students were unaware of where to find information about reporting such incidents. Overall students reported that the level of racial/ethnic tension on the campus was slightly to not at all tense. Students of color reported some greater sense of tension than did students in general however; the percentage differences were small. Only about 35% of students in general agreed strongly/somewhat that OSU should make a greater effort to recruit and retain students, faculty, and staff from diverse backgrounds. About 45% of students of color agreed strongly/somewhat that OSU should do likewise. The results of this survey suggest that overall students are in relative agreement about many aspects of diversity on the campus. Where possible some group differences were noted however, many of the cell sizes were too small to compare reliably.

23
For many students, the University is seen as more liberal and less conservative that they rate themselves to be. Further, many OSU students reported that their experiences at OSU were much more diverse than their experiences prior to attending OSU. While this certainly was not true for all students, the overwhelming number of students that reported that they thought OSU was diverse is telling. Lack of prior contact with individuals and groups that are different from themselves is indicative of many students at OSU. Thus, interactions with individuals and groups that are new and unfamiliar to individual students can predictably result in errors, mistakes, and messiness as students try to navigate these kinds of relatively novel experiences. Results of this report suggest that overall students have understood the message that OSU is diverse and that diversity at OSU is important. Further the results indicate that they have heard the message that being able to work in a diverse environment will be valuable to them in the global marketplace. Yet, students report not taking full advantage of the many opportunities at OSU to become more skilled and learned in terms of diversity. The educational imperative to assist students as they continue to experience an increasingly diverse world is clear. Students in a new situation likely do not know what they do not know and thus the possibility of error is relatively high and can be expected. Thus, our ability to continually engage with and respond to students in areas of diversity, multiculturalism, and inclusivity from an intentional, respectful and educational perspective is essential to their continued learning and development.
Recommendations for Consideration 1. Create multiple and varied environments where students can talk with one another about
their lives, their differences, their commonalities and their multiple identities (both in classes and outside of classes).
2. Include in these environments and intentional learning environments time to reflect upon experiences with others different from and like themselves.
3. Foster service learning experiences that put students in touch with the issues of oppression,
privilege, and difference. These experiences must include space, time, and accountability for reflection.
4. Use existing systems (classes, living environments, organizations, leadership experiences)
and create new ones that engage students in awareness, knowledge, skill building, and practice in diverse settings.
Questions for Consideration 1. What is needed in order to assist students in learning better how to engage in a diverse
environment?
2. How can OSU assist students early in their transition to OSU to understand better the level and dimensions of diversity that they will experience here?
3. What does it mean that about one-third of our students are tired of hearing about diversity?
24
4. What outcomes do we hope for our students as a result of efforts to create a more diverse
campus? How will we know if our students have achieved those outcomes?


