ORBIT - Online Repository of Birkbeck Institutional Theses Enabling Open Access to Birkbecks Research Degree output Dividend policy : evidence from Turkey http://bbktheses.da.ulcc.ac.uk/124/ Version: Full Version Citation: Kilincarslan, Erhan (2015) Dividend policy : evidence from Turkey. PhD thesis, Birkbeck, University of London. c 2015 The Author(s) All material available through ORBIT is protected by intellectual property law, including copyright law. Any use made of the contents should comply with the relevant law. Deposit guide Contact: email
Transcript
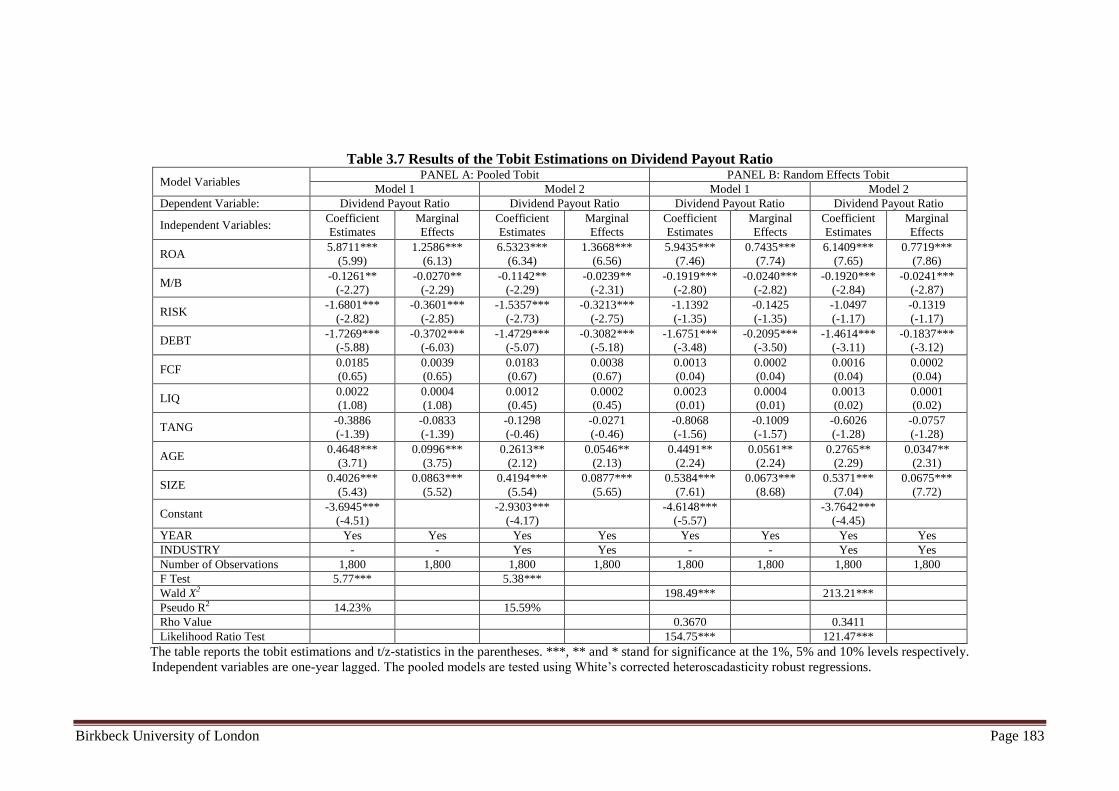
ORBIT - Online Repository of Birkbeck Institutional Theses
Enabling Open Access to Birkbecks Research Degree output
Dividend policy : evidence from Turkey
http://bbktheses.da.ulcc.ac.uk/124/
Version: Full Version
Citation: Kilincarslan, Erhan (2015) Dividend policy : evidence from Turkey. PhDthesis, Birkbeck, University of London.
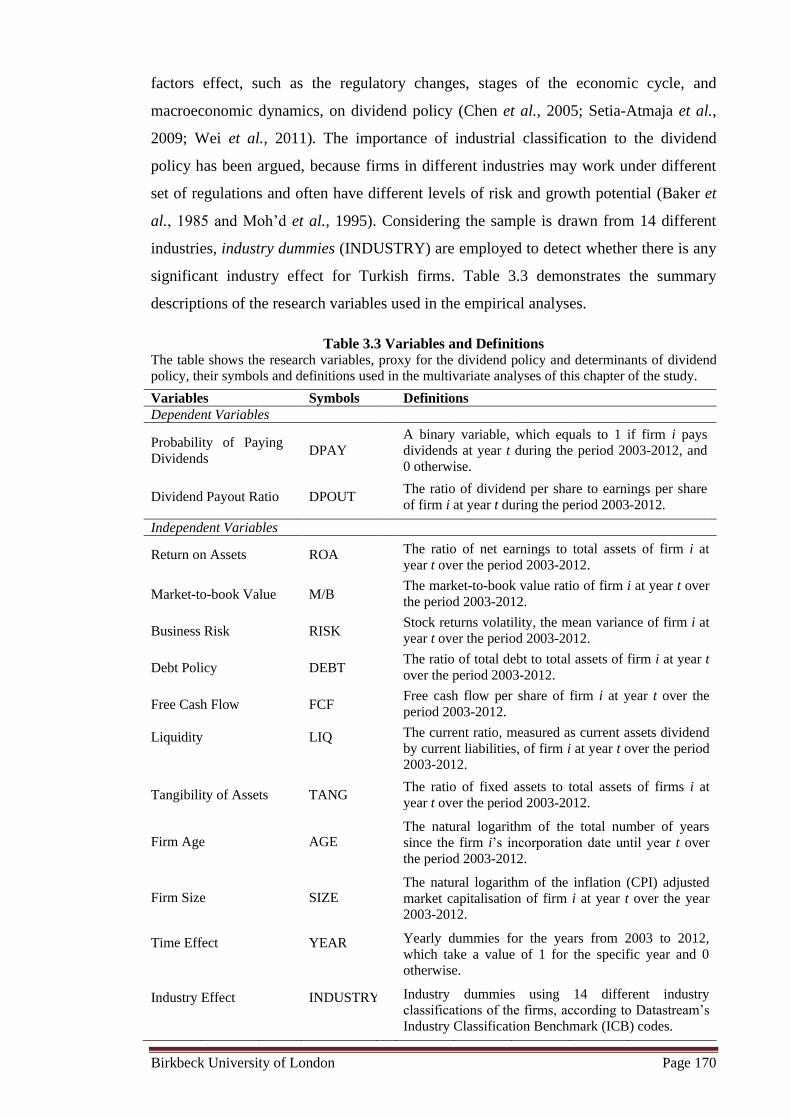
Table 5.6 Results of the Logit Estimations on Probability of Paying Dividends ............................. 289
Table 5.7 Results of the Tobit Estimations on Dividend Payout Ratio ............................................ 294
Table 5.8 Results of the Tobit Estimations on Dividend Yield ........................................................ 299
Table 5.9 Summary of Estimations Results for the Research Hypotheses ....................................... 301
Table 5.10 Results of the Probit Estimations on Probability of Paying Dividends .......................... 308
Table 6.1 Summary of Theoretical Findings of Chapter 3 ............................................................... 315
Table 6.2 Summary of Best Models of Chapter 4 ............................................................................ 317
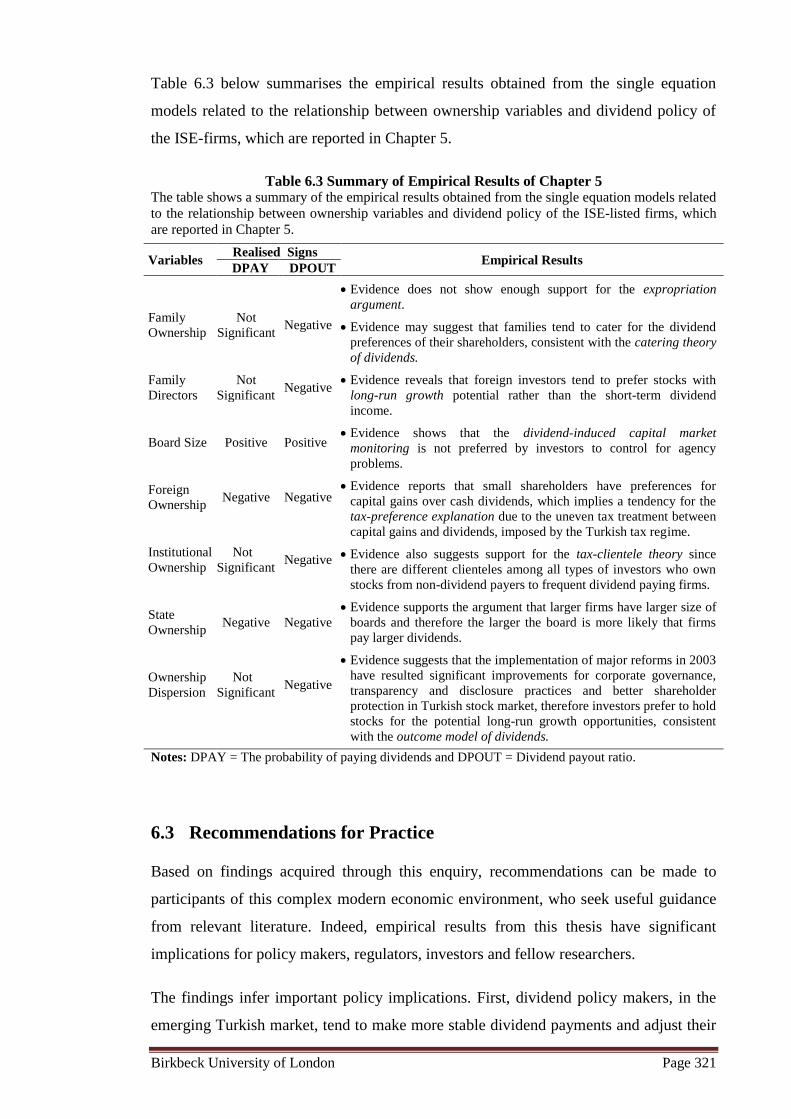
Table 6.3 Summary of Empirical Results of Chapter 5.................................................................... 321
Birkbeck University of London Page 12
CHAPTER 1
INTRODUCTION
1 Introduction
Birkbeck University of London Page 13
1.1 Background of the Study
Corporate finance literature assumes that the main goal of financial management is to
maximise the wealth of shareholders. Managers must, therefore, always consider how
their decisions affect the value of their firms’ shares, since share prices are critical
determinants of shareholders wealth (Ward, 1993; Bishop et al., 2000; Van Horne and
Wachowicz, 2001). Dividend policy is one of the major categories of corporate financial
decisions that managers face, and they can affect shareholders wealth through their
dividend policy decisions (Glen et al., 1995; Brealey and Myers, 2003). More precisely,
managers’ dividend policy decisions in determining the size and pattern of cash
distributions to shareholders influence common share prices, and therefore, the wealth
of shareholders over time (Lease et al., 2000).
Accordingly, dividend policy has attracted a great deal of attention from financial
economists in corporate finance literature. Questions such as why firms pay dividends,
why investors care, and to what extent dividend policy may affect firm’s market value
have been subject to a long-standing argument (Baker and Powell, 1999). Indeed,
finance academics have dealt with various theories, such as the tax preference,
signalling and agency cost theories, in order to explain why companies should pay or
not pay dividends. Some researchers (Brennan, 1970; Elton and Gruber, 1970; Lintner,
1956; Rozeff, 1982) have built and empirically tested a great number of models to
explain dividend behaviour. Others (Baker et al., 1985; Pruitt and Gitman, 1991; Baker
and Powell, 1999; Brav et al., 2005; Baker and Smith, 2006) have surveyed corporate
managers to find out their thoughts about dividends. Hence, dividend policy literature
contains various theories, hypotheses and explanations for dividends.
Miller and Modigliani (M&M)’s (1961) propose the dividend irrelevance theory, which
posits that all efforts spent on dividend decisions are wasted, and a managed dividend
policy irrelevant under the circumstance of a perfect capital market, with rational
investors and absolute certainty. Although M&M’s argument is logical and consistent
within a perfect market, once this idealised world gives way to the real world, numerous
market imperfections such as differential tax rates, information asymmetries, transaction
costs, and conflicts of interest between managers and shareholders, render the
irrelevance theory highly debatable. In fact, researchers have focused on the various
market imperfections in order to respond to M&M’s irrelevance theory and offered
many competing hypotheses about why companies pay, or not pay dividends (Lease et
al., 2000).
Birkbeck University of London Page 14
Some researchers (Graham and Dodd, 1951; Gordon and Shapiro, 1956; Gordon, 1959;
1963) suggest that dividends can increase firms’ values and shareholders wealth. This is
because, more certainty is attached to dividend payments received today, against
earnings retention for investment in projects whose future earnings are not certain.
Firms should, therefore, set a high dividend payout ratio and offer a high dividend yield
to maximise their share prices - this explanation is labelled as the bird-in-the-hand
hypothesis. However, there are theories propose, which include the tax preference
theory (Brennan, 1970; Elton and Gruber, 1970; Litzenberger and Ramaswamy, 1979)
and the transaction cost theory (Higgins, 1972; Fama 1974; Rozeff, 1982; Scholz,
1992), whereby, in the existence of market imperfections such as transaction costs and
uneven tax treatments, dividend payments can decrease firms value as well as can cause
negative consequences for shareholders wealth. Based on these theories, firms should
therefore avoid or make minimal dividend payments if they want to maximise their
share prices.
Other researchers (Lintner, 1956; Bhattacharya, 1979; John and Williams, 1985; Miller
and Rock, 1985) indicate that information asymmetry exists when a firm’s management
has a better understanding about the firms’ true value than outsiders who have only
access to public information. Hence, managers use dividend payments to convey useful
information about the current and future prospects of their firm, which is called the
signalling hypothesis. Furthermore, Jensen and Meckling (1976), Rozeff (1982) and
Easterbrook (1984) developed the agency cost theory of dividends, which derives from
problems associated with the separation of management and ownership, and differences
in managerial and shareholder priorities. This suggests that an effective dividend policy
minimises agency costs by reducing funds available from managers who may spend
unnecessarily on unprofitable investments, or even misuse for their own personal
consumption. Managers are therefore required to look for financing in capital markets.
Many researchers have developed various competing theories such as the pecking order
theory (Myers, 1984; Myers and Majluf, 1984), residual dividend theory (Saxena, 1999;
Lease et al., 2000), catering theory of dividends (Baker and Wurgler, 2004a; 2004b) and
maturity hypothesis (Grullon et al., 2002), which add more complexity to the dividend
controversy.
Fischer Black (1976, p.5) once described this lack of consensus on the matter as the
dividend puzzle by stating that “The harder we look at the dividend picture, the more it
seems like a puzzle, with pieces that just don’t fit together.” Although Black (1976)
Birkbeck University of London Page 15
came to this conclusion almost four decades ago, his observation still seems valid since
financial economists have not reached a definitive theory of dividends. Furthermore,
Brealey and Myers (2003), in their textbook, listed dividends as one of the ten important
unsolved problems in finance, supporting this conclusion. Allen and Michaely (1995,
p.833) suggested that “Much more empirical and theoretical research on the subject of
dividends is required before a consensus can be reached.”
Dividend policy literature is extensive since researchers have developed and empirically
tested various theories, models and hypotheses by contributing voluminous studies.
However, despite countless research and extensive debates, the actual motivation for
paying dividends still remains a puzzle (Baker and Powell, 1999). In addition to this,
most of the theoretical and empirical evidence on dividend policy have been based on
the developed markets, mainly the US and UK markets; therefore, less is known about
dividend policy and the explanatory power of models for other countries, specifically
developing countries (in other words, emerging markets). Considering the growing
importance of emerging markets in terms of global equity investments, these markets
have comparatively recently started attracting international investors. Accordingly, as
emerging markets have begun to contribute to the dividend puzzle, researchers have
started investigating the dividend behaviour of corporations in developing countries
(Glen et al., 1995; Adaoglu, 2000). In fact, empirical studies, taken in the context of
developing markets, have been increasing, especially during the last two decades.
Studies have indicated that emerging markets, to a degree, are generally differentiated
from developed markets in terms of their effectiveness in meeting requirements of their
determined functions. This is because of various discords such as political and social
instability, lack of adequate disclosure, poor laws and regulations, and weaker financial
intermediaries that provide efficient monitoring due the ineffectiveness of their financial
markets (La Porta et al., 1999; 2000; Aivazian et al., 2003a; 2003b; Yurtoglu, 2003). It
is, therefore, not surprising that various aspects of dividend policy behaviour of
companies listed in the emerging markets tend to differentiate from companies in
developed markets.
For instance, renowned cross-country studies such as La Porta et al. (1999), Claessens
et al. (2000) and Faccio et al. (2001) provide evidence that concentrated ownership by
large controlling shareholders, generally families, is the dominant form of the
ownership structure in most developing countries. This is in contrast to Berle and
Means’s (1932) concept of widely held corporations with dispersed small shareholders
Birkbeck University of London Page 16
and a concentrated control in the hands of managers, which is extensively accepted in
finance literature as a common ownership structure in developed countries.
Accordingly, Daily et al. (2003) argued that agency cost theory might function
differently in family-controlled publicly listed firms. Whereas prior findings from
widely held companies might not readily be appropriate into this type of setting. In
these firms, the salient agency problem might be the expropriation of the wealth from
minority owners by the controlling owners, the principal-principal conflict, rather than
the principal-managers conflict. Similarly, a number of studies (Manos, 2002; Kouki
and Guizani, 2009; Ramli, 2010; Ullah et al., 2012; Huda and Abdullah, 2013;
Thanatawee, 2013; Aguenaou et al., 2013; Gonzalez et al., 2014) emphasised that
agency cost theory of dividends needs to be uniquely investigated in emerging markets
and more importantly the ownership structure of the firms in these markets should
specifically be taken into account while identifying the proxies for agency cost
variables.
Aivazian et al. (2003a, 2003b), who are well-known scholars in investigating dividend
policy behaviour in emerging markets, compared the dividend policies of firms
operating in developing countries with the dividend policies of US firms. Aivazian et al.
(2003a) reported that Lintner’s (1956) model still works for US firms but it does not
work very well for emerging market firms. Current dividends are much less sensitive to
past dividends in these markets, which supports the notion that the institutional
structures of developing countries compose corporate dividend policy a less feasible
mechanism for signalling than for US firms operating in capital markets with arm’s
length transactions. However, Mookerjee (1992), Pandey (2001), Al-Najjar (2009),
Chemmanur et al. (2010), Al-Ajmi and Abo Hussain (2011) and Al-Malkawi et al.
(2014) found evidence supporting the Lintner model when explaining dividend
behaviour in different emerging markets. They, however, generally reported higher
adjustment factors, hence lower smoothing and less stable dividend policies compared
to developed countries. Furthermore, Aivazian et al. (2003b) concluded that firms in
emerging markets somehow follow the same determinants (either the same or different
signs) of dividend policy that are suggested by the developed markets. Studies from
different developing countries such as Al-Najjar (2009), Kirkulak and Kurt (2010),
Imran (2011), Mehta (2012) and Kisman (2013) supported this conclusion.
Nevertheless, as Aivazian et al. (2003b) stated that, because of various differences
between developed and developing markets, even among those developing economies,
Birkbeck University of London Page 17
such as financial systems, ownership structures, laws and regulations and so on, their
sensitivity to these determinants vary across countries.
Consequently, the debate on dividend policy is still unsolved and still remains as a
puzzle. There is no doubt that emerging markets attach more pieces to this puzzle. As
Glen et al. (1995) stated much more additional research is required to provide a better
understanding of dividend behaviour in these developing countries. Therefore, this
doctoral thesis is aimed at carrying the dividend debate into the emerging market
context with its findings a contribution to dividend literature.
1.2 Motivation of the Study
The debate on dividend policy has now been extensively researched for more than half a
century. Earlier research on dividends, in terms of developing theories and empirical
tests, were focused on developed markets, mainly the US followed by the UK.
However, researchers have also started investigating the dividend policy behaviour of
corporations in developing countries, especially over the past two decades, due to the
growing importance of these markets in terms of global equity investments (Glen et al.,
1995).
A rapid increase in magnitude of equity portfolio flows, to developing countries, results
in serious efforts, shown by emerging markets, to converge with the global world-
market portfolio (Bekaert, 1995; Kumar and Tsetsekos, 1999). In this respect, civil law
countries, which typically developing markets that generally have weaker rules of law
to protect investors (La Porta et al., 1997; 1999), have started to implement common
laws in order to integrate with world markets (Karacan, 1998) and to attract foreign
investors. Furthermore, Bekaert and Harvey (2002) suggested that emerging markets
need integration, both in terms of economic and financial aspects, with world markets;
economic integration involves the elimination of barriers to international trade, whereas
financial integration desires the free flow capital across borders. Such integration
requires a sequence of regulatory and institutional developments in the operations of
financial markets. However, Bekaert and Harvey (2002) went on to argue that the
concept of regulatory liberalisation and integration should be carefully distinguished. A
country may pass a law that apparently drops all barriers to foreign involvement in local
capital markets, which is liberalisation but this does not mean that regulatory
liberalisation are necessarily defining events for market integration. Therefore, Bekaert
Birkbeck University of London Page 18
and Harvey (2002) emphasised that, for any empirical research, it is very important to
know the approximate date emerging market undertook these structural changes in
integrating world capital markets.
Empirical studies taken in the context of developing markets have mostly confirmed
that dividend policy behaviour in emerging markets generally tend to be, not
surprisingly, different from developed markets in many aspects. This is because of
various factors such as political, social and financial instability, lack of adequate
disclosure, poor laws and regulations, weaker financial intermediaries, newer markets
with smaller market capitalisations, weaker corporate governance and different
ownership structures (La Porta et al., 1999; 2000; Kumar and Tsetsekos, 1999; Aivazian
et al., 2003a; 2003b; Yurtoglu, 2003).
It is nevertheless exemplified that, while examining the dividend policy behaviour in
different emerging markets, researchers have not clearly stated or distinguished, as
suggested by Bekaert and Harvey (2002), between the concepts of regulatory
liberalisation or integration undertaken in those emerging markets for their study sample
periods. Furthermore, it could be argued that dividend policy decisions of companies in
an emerging market should be better understood if researchers report whether the
emerging market examined passes laws for financial liberalisation or attempts to
implement serious economic and structural reforms to integrate with world markets. In
addition, it is questionable whether dividend policies of companies may significantly
differ based on the process of liberalisation or integration undertaken in the emerging
market in which they operate.
Accordingly, the main aim of this doctoral thesis is to investigate dividend policy
behaviour of an emerging market over the period after implementing serious economic
and structural reforms, in order to integrate with world markets. In this respect, the
dividend policies of the companies listed on the Istanbul Stock Exchange (ISE) will be
examined, since Turkey offers an ideal setting for the study of dividend behaviour of a
developing country. In particular, with its implementation of major reforms starting
with the fiscal year 2003 in compliance with the IMF stand-by agreement, as well as its
adoption of the EU directives and best-practice international standards for a better
working of the market economy, outward-orientation and globalisation.
Birkbeck University of London Page 19
1.3 Research Context in the Istanbul Stock Exchange (ISE)
This section provides a summary of the important developments of the Istanbul Stock
Exchange (ISE) and explains the rationale for choosing the ISE-listed companies as
study samples.
1.3.1 Financial Liberalisation and Earlier Developments of the ISE
Financial markets in Turkey were strictly regulated until a financial liberalisation
programme was implemented at the beginning of 1980, which comprised the
liberalisation of the foreign exchange regime, deregulation of interest rates and
establishment of financial markets (CMB, 2003; Odabasi et al., 2004). In the first half
of the 1980s, the Turkish securities markets underwent serious major developments in
terms of setting up both the legal and institutional structure fitting for sound capital
movements. The Capital Markets Law (CML) was launched in 1981, followed by the
establishment of the Capital Markets Board (CMB) in 1982, in order to regulate the
founding and operations of stock exchanges. After the adoption of related regulations
enacted and launched in the subsequent years, the Istanbul Stock Exchange (ISE) was
officially established in December 1985 and commenced its operations on January 3,
1986 (CMB, 2003).
Despite long standing macro-economic imbalances, the Turkish capital markets
attempted to make rapid progression in terms of political and regulatory changes during
the two decades after 1980. Important institutional and regulatory developments are
summarised below (Odabasi et al., 2004, p.511; TSPAKB, 2007, p.5).
1980-1985: Implementing liberalisation program, commencing of primary and
secondary markets, employing the New Banks Act and Securities Markets Law.
1986-1987: First bonds were issued by the Treasury, commencing of the interbank
market, the Istanbul Stock Exchange and open market operations by the Central
Bank.
1988-1990: Becoming a member of SWIFT (Society for Worldwide Interbank
Financial Telecommunication), allowing convertibility of the Turkish Lira,
relaxation of restrictions on capital flows, first ADR (American Depository Receipt)
was issued in the NYSE and establishing ISE Clearing House.
1991-1992: Establishing the ISE bond market and repo market, implementing EFT
(Electronic Funds Transfer) system and Insider Trading Law, and the ISE joined the
WFE (World Federation of Exchanges).
1993-1994: First overseas exchange listing and rights market were opened as well as
starting full computerised trading in the ISE, and recognition of the ISE by the US
SEC (Securities and Exchange Commission).
Birkbeck University of London Page 20
1995-1996: Establishing Customs Unions with the EU, setting regulations for short
sales, prosecution for first insider trading, starting Futures Market in the ISE and the
ISE joined the FEAS (Federation of Euro-Asian Stock Exchanges).
1997-1998: Setting up various new sub-markets under the ISE and the ISE became
project-leader in Southeast European Exchanges for substituting street-name by
customer name.
1999-2000: Adoption of free-float regime and Banking Law on BIS (Bank for
International Settlement)/Basel criteria.
2001-2002: Establishing the TSPAKB (The Association of Capital Market
Intermediary Institutions of Turkey), Investors’ Protection Fund and Central Registry
Agency. Remote trading was started at the ISE and pension system regulation was
passed.
1.3.2 An Overview of the ISE during the period 1986-2002
With the rapid development since its establishment in 1986, the ISE became highly
representative of a promising emerging market, with fast growth in terms of the number
of listed firms, the annual trade volume and the annual market capitalisation, as well as
indicating high volatility in returns. As can be observed from Table 1.1 on the next
page, the number of listed firms on the ISE significantly increased from 80 in 1986 to
315 in 2000 and then decreased to 310 in 2001 and to 288 in 2002 due to the economic
crises in the early 2000s in Turkey. The annual ISE stocks trading volume sharply
increased from US$ 13 million in 1986 and reached to a peak of US$ 181.9 billion in
2000 and then again it considerably fell to US$ 80 billion in 2001 and US$ 70 billion in
2002 with the economic crises (CMB, 2003).
Similarly, the total market capitalisation of the ISE grew rapidly. It dramatically rose
from US$ 0.9 billion at the end of 1986, reaching its peak to US$ 144 billion by the end
of 1999, just before noticeably decreasing to US$ 69.5 billion by the end of 2000. In the
following years, it further decline to about US$ 48 billion and US$ 34 billions,
reflecting the economic crises in the Turkish market that occurred in the early 2000s.
Odabasi et al. (2004) pointed out that emerging markets are characterised by high
volatility and high average returns as evidenced by research on stock returns in these
markets. In this case, they stated that the ISE is highly representative of an emerging
market. Consistent with their statement, the figures of the annual rate of returns,
calculated for the ISE-100 Index based on the closing prices in Table 1.1 indicate high
volatility and extremely high returns in some years during the period, 1986-2002 (CMB,
2003).
Birkbeck University of London Page 21
Table 1.1 Development of Main Indicators of the ISE during the period 1986-2002 The table illustrates the development of the number of listed firms in the ISE, trading volume, total
market capitalisation and annual rate of return for the ISE-100 Index based on closing prices
according to the years. For the ISE-100 Index calculation, the value of the ISE-100 Index in January
1986 is taken as a base year.
No. of Volume of Trade Total Market
Capitalisation
Annual Rate of
Return for
the ISE-100 Index Listed
Total Annually
Daily Average Firms
Year End of US$ US$ US$
(%) Year (millions) (millions) (millions)
1986 80 13 0.05 938 71
1987 82 118 0.44 3,125 294
1988 79 115 0.45 1,128 -44
1989 76 773 3.03 6,756 493
1990 110 5,854 23.70 18,737 47
1991 134 8,502 34.42 15,564 34
1992 145 8,567 34.13 9,922 -8
1993 160 21,770 88.50 37,824 417
1994 176 23,203 91.71 21,785 32
1995 205 52,357 208.59 20,782 47
1996 228 37,737 152.78 30,797 144
1997 258 58,104 230.57 61,879 254
1998 277 70,396 283.85 33,975 -25
1999 285 84,034 356.08 114,271 485
2000 315 181,934 739.57 69,507 -38
2001 310 80,400 324.19 47,689 46
2002 288 70,756 280.78 34,402 -25
Source: Compiled from CMB (2003)
After its establishment in 1986, the ISE made rapid progress during the period of 1990-
2000. In this period, the Turkish economy also often experienced global effects from a
number of geopolitical, financial and economic crises; for instance, by the Gulf War
Crisis in 1991, 1997 Asia Crisis, 1998 Russia Crisis and 2000 Argentina Crisis.
However, the major financial crisis that strongly affected the ISE was the systemic
banking crisis that the Turkish economy experienced in the early 2000s (BRSA, 2010).
As well, persistently increasing public deficit, the issuance of government debt
securities for financing public debt, high rates of real interest paid on these securities,
high and volatile inflation and unstable governments, coupled with consistent
intervention by the military that added political uncertainty, were some of the main
public and macro-economic imbalances that prevented the Turkish capital markets from
improving (CMB, 2003; IIF, 2005). Moreover, there were other reasons which had to do
with the nature of Turkey’s civil law tradition and its inefficient, and inconsistent
regulatory framework, which ensue paucity of the rule of law and its enforcement;
particularly, the poor Turkish culture of corporate governance and transparency and
disclosure practices (Aksu and Kosedag, 2006).
Birkbeck University of London Page 22
Studies show that Turkey is a civil law country1 where corporate ownership structure is
characterised by concentrated family ownership.2 Aksu and Kosedag (2006) emphasised
that the predicted benefits of good corporate governance and transparency and
disclosure practices are especially important for emerging markets like Turkey, who are
eager for external capital as their economies typically grow faster than that of more
developed countries. Aksu and Kosedag, however, argued that the transparency and
disclosure practices of the ISE firms were not impressive in terms of financial statement
disclosure as well as disclosures of shareholder’s rights and board and management
structures. It was because the ISE’s financial reporting standards (the Turkish Code of
Commerce, dating back to 1957) were only based on the generally accepted principles
of accounting and auditing, and the concept of full and fair disclosure. It did not
therefore regulate financial reporting properly and remained weak in the enforcement of
rules and lack of a disclosure philosophy in the Turkish business culture.3
Ararat and Ugur (2003) pointed out specific corporate governance problems and lack of
efficient transparency and disclosure practices experienced by Turkish firms. These
1Turkey is a civil law country where the present Turkish Commercial Code is adopted from the
Continental European Business Law (civil law), dating back to 1957. It had a very late start in the
liberalisation of its economy and the establishment of its stock market (ISE) whose history only dating
back to 1986 compared to the developed stock exchanges with hundreds of years of historical
development (Adaoglu, 1999; 2000; Aksu and Kosedag, 2006). Turkey has a history of poor structural
and microeconomic policies as well as a poor culture of corporate governance and transparency and
disclosure practices (IIF, 2005; Aksu and Kosedag, 2006). La Porta et al. (1997), well-known scholars for
their research interest in emerging markets, also categorised Turkey as a French origin civil law country
in their study and concluded that civil law countries generally have weaker rule of laws to protect
investors than common law countries. In fact, they found evidence that French civil law countries tend to
have poorer minority investors protection and relatively more corruptions among other types of civil law
traditions. 2 Gursoy and Aydogan (1999) reported that around 44% of firms listed on the ISE belonged to a family or
a small group of families and other 30% of them were controlled by holding companies (in other words,
business groups), showing predominant family involvement in approximately 74% of all firms between
1992 and 1998. Yurtoglu (2003) found that families ultimately owned about 80% of the 305 firms listed
on the ISE as of 2001 and families typically tended to organise a large number of firms under a pyramidal
ownership structure or through a complicated web of inter-corporate equity linkages and also often made
the use of dual class shares or other corporate charter arrangements through which they can reduce their
cash flow rights while they firmly have the control on their companies. Similarly, the task force report of
the Institute of International Finance (2005) documented that as is the case in many other emerging
markets, the largest domestically owned Turkish firms were mainly family-controlled and one
shareholder generally controlled more than 50% of voting rights in 45% of the all firms listed on the ISE.
It is also reported that at least three-fourths of all corporations are owned by families or a holding
company controlled by a family. Therefore, the protection of minority shareholder interests relies
primarily on full disclosure and accurate financial reporting (IIF, 2005). 3 In common law countries, the enforcement of high-quality financial reporting standards is compulsory
and required for shareholder protection. However, in civil law countries, such as Turkey, standard-setting
and enforcement are principally functions of government institutions and therefore there is a lower
demand for high-quality financial reporting and disclosure in such economies, since the reporting
requirements are oriented towards tax offices and financial institutions (UNCTAD, 2008). Hence, in
Turkey, accounting and auditing principles were not good enough for enforcement of good shareholder
protection.
Birkbeck University of London Page 23
included concentrated and pyramidal ownership structures dominated by families,
ownership of many banks by these groups of companies, inconsistent and unclear
accounting and tax regulations, and misinformation faced by investors because of the
absence of inflation and consolidation accounting standards. In addition, Ararat and
Ugur suggested that, as a result of this infrastructure, agency problems concentrate on
asymmetric information, weak minority shareholders’ and creditors’ rights, inconsistent
and unclear disclosure policies, and convergence of ownership and management, which
create an environment that may foster corruption, share dilution, asset stripping,
tunnelling, insider trading and market manipulation.
Indeed, during the late 1990s, a long list of cases in tunnelling became a prominent
issue in the Turkish public. A majority of these cases were simple resource transfers of
controlling shareholders from their firms in the form of outright theft or fraud. Whereas
a number of listed firms’ minority shareholders were harmed by these events, a bigger
proportion represented wealth transfers from state banks to controlling owners of
unlisted firms, concerning, in many cases, evident involvement of politicians (Yurtoglu,
2003). Likewise, a number of well-publicised cases revealed that unfair treatment of
minority shareholders was a serious corporate governance problem in Turkey, since
controlling families had the opportunities to expropriate profits from them. This was
done typically through the use of company assets or non-arm’s length related party
transactions (IIF, 2005).4 In the following period, in the early 2000s, the Turkish
economy experienced a systematic banking crisis, which was the major financial crisis
that strongly affected the ISE. As a result, 22 banks were transferred to the SDIF
(Saving Deposit Insurance Fund). The cost of re-structuring these banks and the
banking system was US$ 53.6 billion, which was equal to one-third of the national
income in Turkey in 2001 (BRSA, 2010).
4 For instance, in 1999, the Capital Markets Board (CMB) of Turkey inspected related party transactions
mutually between Turk Tuborg and its parent company, Yasar Holding, and affiliated companies. The
CMB found that Tuborg shares held by Bimpas (Tuborg’s marketing company) were sold to Mr.Selcuk
Yasar, who was the ultimate owner of Yasar Holding, and the price for this transaction was actually paid
two years later. Tuborg also had a contract with the Altinyunus Hotel, which was another Yasar Group
company, for a period of 15 years to rent 15 rooms at above published prices. Additionally, Tuborg
donated a property to the Yasar Foundation in violation of its Articles of Association, whilst selling
another property to another Yasar Group company (Desa) at a lower than its market price. Lastly, the
CMB questioned that Turk Tuborg bought shares in Yasar Holding’s bank, namely Yasarbank, to help the
bank from failing but Yasarbank did eventually fail and was taken over by the Savings Deposit insurance
Fund (IIF, 2005).
Birkbeck University of London Page 24
1.3.3 Market Integration Process of the ISE since 2003
Following the November 2002 elections, which resulted in a one-party (non-coalition)
government, the political uncertainty at some degree faded away and the economic
programs and structural reforms were jointly carried out by the government and the
International Monetary Fund (IMF), commencing in March 2003 (CMB, 2003).
Turkey’s progress in achieving full membership of the EU in this period also provided
the strongest motivation in establishing new reforms, rules and regulations to improve
corporate governance and transparency and disclosure practices; therefore, to integrate
its economy with Europe and to harmonise its institutions with those of the EU (IIF,
2005; Aksu and Kosedag, 2006).
According to the task force report provided by the IIF (2005), the legal and institutional
environment for corporate governance, and transparency and disclosure practices in
Turkey improved, particularly in the past few years, in line with the structural reforms
implemented in collaboration with the IMF. In addition, Turkish government and the
CMB, together with some private sector organisations such as the Turkish Industrialists
and Businessmen’s Association (TUSIAD), the Corporate Governance Forum of
Turkey (CGFT), the Corporate Governance Association (KYD) and the Foreign
Investors Association (YASED), performed hard to improve the rules for corporate
governance and transparency and disclosure.
The Capital Markets Board (CMB) attributed great importance to improve
communications with investors, issuers and other institutions in 2003, in order to ensure
that markets functioned in a safer, more transparent and efficient manner, in accordance
with regulations that were adopted in harmony with international norms and
developments (CMB, 2003). Accordingly, one of the most important developments was
that, in line with the EU requirements, the CMB issued the Communiqué Serial: XI, No:
25 entitled “Accounting Standards in Capital Markets” in November 2003, adopting
International Financial Reporting Standards (IFRS) and enforcing publicly owned and
traded firms to use new rules. In addition, the CMB obliged the implementation of
inflation-adjusted accounting at the same time (UNCTAD, 2008).
Moreover, in cooperation with the World Bank and the Organisation for Economic
Cooperation and Development (OECD), the CMB’s Corporate Governance Principles
were published in 2003, aiming to improve the ISE-listed firms’ corporate governance
practices. The CMB Principles consisted of four major parts. The first part discussed
Birkbeck University of London Page 25
shareholders’ rights and their equal treatments involved with issues such as right to
obtain and evaluate information, right to vote, right to join the general shareholders
meeting and more minority rights detailed in this part. The second part included
principles that were related to disclosure and transparency for establishing information
policies in firms with respect to shareholders and the adherence of firms to these
policies. The third part was concerned about firms’ obligations for their stakeholders,
including their workers, creditors, customers, suppliers, institutions, non-governmental
organisations, the government, and potential investors who may think of investing in
these firms in order to regulate the relationship between the firms and their stakeholders.
The fourth part discussed the functions, duties, obligations, operations and the structure
of the board of directors as well as the committees to be created to support the board
operations and executives (CMB, 2003; 2004; Caliskan and Icke, 2011).
Structural problems in the banking sector basically deepened during 2000 and turned to
a systemic banking crisis in February 2001. Many amendments were passed to improve
the transparency and quality of the banking sector. “The Banking Sector Restructuring
Program” was implemented in May 2001 in order to restructure the public banks,
resolve banks taken over by the SDIF, rehabilitate the private banking system, and to
strengthen the surveillance and supervision frame to increase efficiency in the sector
(BRSA, 2010). Several group banks, which previously funded much of their own
business group companies’ financial needs, declared bankrupt. With the introduction of
“the Regulation on Establishment and Operations of Banks” in July 2001, the risk group
definition and calculation of loan limits for a single group (including banks, businesses
and subsidiaries in the same group) considering direct and connected lendings were
established in order to avoid credit risk concentration as well as improve the assets
structure of the banking sector. As a result of preventing insider lending as a source of
financing, the ISE firms turned to the equity market with a greater incentive for more
transparent financing (IIF, 2005).
Other improvements also took place in order to improve the Turkish market in terms of
corporate governance and disclosure practices, since it sought to integrate its economy
with Europe and harmonise its institutions with those of the EU. The government,
accordingly, accelerated “privatisation” of State Economic Enterprises, together with
the elimination of legal barriers to market entry, and a general reduction in the state’s
direct involvement in the economy, indicating the importance of corporate governance
(IIF, 2005; Aksu and Kosedag, 2006). It is worth noting that 58% of the IPO proceeds
Birkbeck University of London Page 26
in the ISE, between 2003 and 2008, were raised by privatisation activities (TSPAKB,
2008). Moreover, since pension funds and other large institutional investors were not
permitted to vote for corporate directors, there were only a few institutional investors in
Turkey with an interest in good corporate governance, hence the sector was
underdeveloped (IIF, 2005). However, “Individual Retirement Savings and Investments
System” was implemented in 2003 (CMB, 2003) in the hope of creating pension funds
that were expected to serve as institutional investors and increase monitoring in public
firms (Aksu and Kosedag, 2006).
A brief timeline and some selected milestones of Turkish Capital Markets from 2003
and forward are summarised below (TSPAKB, 2007, p.5; 2008, p.40; 2012, p.1-2).
2003-2004: Corporate Governance Principles were published. Establishing first
private pension funds. Adoption of IFRS (International Financial Reporting
Standards). First exchange traded fund was established.
2005-2006: Setting up Turkish derivatives exchange. Dematerialisations of
equities, corporate funds and mutual finds were completed. Taxation of investment
instruments was changed.
2007-2008: Opening auction introduced at the ISE. Mortgage law is passed.
Eurobond market was established within the ISE. The ISE trading hours are
extended by 30 minutes. New anti-money laundering regulations in line with the
Market and Collective Products Markets is established within the ISE. Regulations
regarding IPOs are eased. Market was introduced for warrants and ETFs.
2011-2012: First Islamic bond and electricity futures were issued, FOREX
regulations were introduced and Investor Education Campaign was initiated.
Reforms implemented after the major financial crisis, as well as a number of well-
publicised unfair treatments experienced by minority shareholders, and the political
stability obtained after 2002 all provided a significant improvement in fundamental
indicators. Under the IMF-supported program, inflation fell spectacularly from triple
digits in 2001 to single digits in 2004, and was realised as 7.7% as of 2005. Real GDP
growth strikingly picked up and averaged 8% during 2002-2004. Additionally, the
public sector primary surplus exceeded 5% of GNP, leading to an anticipated decrease
in net public debt of a percentage of GNP from 92% in 2001 to 65% by the end of 2004.
As the public debt burden was reduced, the short-term policy interest rates were
declined below 20% by the end of 2005. These significant structural and
macroeconomic improvements of Turkish economy greatly increased both competition
and profitable investment opportunities. This resulted in an increase of interest of global
Birkbeck University of London Page 27
capital, and caused a strong capital entry, oriented directly to the country and formed as
portfolio investment (IIF, 2005; BRSA, 2010). Indeed, after the implementation of
major reforms in 2003, the Turkish stock market bounced back and generally had a
rapid growth in terms of the number of listed firms, trading volume, market
capitalisation (CMB, 2012) attracting a significant amount of foreign investments
(Adaoglu, 2008) during the period 2003-2012.
Table 1.2 Development of Main Indicators of the ISE during the period 2003-2012 The table illustrates the development of the number of listed firms in the ISE, trading volume, total
market capitalisation, equities traded by foreign investors and annual rate of return for the ISE-100
Index based on closing prices according to the years. For the ISE-100 Index calculation, the value of
the ISE-100 Index in January 1986 is taken as a base year.
No. of Volume of Trade Total Market
Capitalisation
Foreigners
Stocks in
Custody
Foreigners
to Total
Stocks Ratio
Annual Rate
of Return for
the ISE 100 Index Listed Total Daily
Firms Annually Average
Year End of US$ US$ US$ US$
(%) (%) Year (millions) (millions) (millions) (millions)
2003 285 100,165 407.17 69,003 8,690 51.5 80
2004 297 147,755 593.40 98,073 15,283 54.7 34
2005 306 201,763 794.35 162,814 33,812 66.3 59
2006 322 229,642 918.57 163,775 49,313 65.3 -2
2007 327 300,842 1,192.82 289,986 70,213 72.3 42
2008 326 261,274 1,040.93 119,698 42,152 67.5 -52
2009 325 316,326 1,255.26 235,996 56,246 67.3 97
2010 350 425,747 1,702.99 307,551 71,267 66.8 25
2011 373 423,584 1,674.25 201,924 45,919 62.2 -22
2012 395 347,854 1,374.92 309,644 78,545 65.8 53
Source: Compiled from CMB (2003, 2007, 2012)
Table 1.2 illustrates that the number of listed firms on the ISE significantly increased
from 285 in 2003 to 395 in 2012. The annual ISE stocks trading volume rapidly grew
from US$ 100 billion in 2003 and reached a peak of US$ 425.7 billion in 2010. It then
stayed approximately at this level in 2011, followed by a noticeable decrease to US$
348 billion in 2012. Moreover, the total market capitalisation of the ISE sharply
increased from US$ 69 billion in 2003 to US$ 290 billion by the end of 2007, and then
decreased to US$ 119.7 billion in 2008, due to the global financial crisis experienced in
that year. From this point, the total market capitalisation of the ISE showed generally an
increasing but fluctuating trend, and increased to US$ 309.6 billion by the end of 2012.
Furthermore, Table 1.2 presents the total stocks held in custody by foreign investors and
the ratio of stocks owned by foreigners to total stocks traded in the ISE by the end of
each year during the period, 2003-2012. Indeed, this period has been greatly attracted to
foreign investors. The ratio of stocks owned by foreign investors to total stocks in the
ISE was 51.5% by the end of 2003 and steadily increased to 72.3% by the end of 2007.
Birkbeck University of London Page 28
Perhaps due to the 2008 global crisis, this ratio decreased to 67.5% in 2008 and showed
a further slightly declining pattern in the following years to 65.8% by the end of 2012.
This still revealed a serious contribution from foreign investors, holding about two-
thirds of the total equities in custody in the ISE. Finally, the figures of annual rate of
returns calculated for the ISE-100 Index, based on the closing prices in the table,
indicate a high volatility and high returns in some years, as well as a considerably big
loss in 2008 over the period 2003-2012.
1.3.4 Historical Dividend Policy Regulations of the ISE
Dividend payment decisions are not always solely depended on managers’ judgement to
pay or not to pay, since factors such as regulations, financial crises and trends in the
macro-economy might have implications for dividend policy (Kirkulak and Kurt, 2010).
The evidence from cross-country studies (La Porta et al., 2000; Aivazian et al., 2003a)
has revealed that there are regulatory differences related to the dividend policy making
process forced by the governments throughout the world. Especially, as Glen et al.
(1995) stated, emerging market governments are likely to enforce constrains on the
dividend policy in order to protect both minority shareholders and creditors.
Public corporations listed on the ISE are subject to the regulatory policies put into effect
by the CMB of Turkey. Indeed, the dividend policy in the ISE was heavily regulated
when it first started to operate in 1986. For the fiscal years 1985-1994, the first
mandatory dividend policy was implemented by the enactment of Capital Markets Law
in 1982 and, according to the first regulation on dividend payments, the ISE-listed firms
were obliged to distribute at least 50% of their distributable income as a cash dividend,
which was known as “first dividend” in the Turkish capital market. Without paying the
“first dividend”, all other dividend payments such as the payments to employers or
maintaining it as retained earnings were not legally possible (Adaoglu, 1999; 2000).
The main purpose of this mandatory dividend payment regulation was to protect
minority shareholders rights by providing them satisfactory levels of dividends. This
was because the liquidity in the stock capital markets was almost non-existent as there
was no stock exchange before 1986, and the only source of income for minority
shareholders was the dividend income (Aytac, 1998).
In 1995, there was a major change in the dividend regulations implemented by the
CMB, which abolished the mandatory cash dividends distribution requirement for the
Birkbeck University of London Page 29
listed firms in the ISE.5 The amended regulations provided greater flexibility to the
listed-firms since they were not forced to pay out a certain percentage of their income as
cash dividends anymore. In fact, firms were allowed to decide between distributing
dividends and keeping their profits as retained earnings. Furthermore, even if a firm
decided to pay “first dividend”, payments could be in the form of cash dividends, stock
dividends or both cash and stock dividends, which were subject to voting in the annual
general meeting. The main purpose of the changes was to remove the restrictions forced
on the dividend payments and therefore to allow the investors to interpret the dividend
policy changes efficiently and to reflect their judgements in the shares prices (Adaoglu,
1999; 2008). In addition, the abolishment of the mandatory requirement of distributing
50% of the profits as cash dividends would lessen the firms’ liquidity problems and
would increase the amount of internal financing for these firms (Aytac, 1998).
Turkey went through a major economic crisis in 2001, and in order to recover, signed a
standby agreement with the IMF. As well as seeking to integrate with the EU, it started
to implement major structural reforms as previously explained. However, the crisis
resulted in substantial losses for investors, especially small Turkish shareholder who
heavily invested in the ISE prior to the economic crisis. Although the stock market
bounced back and attracted a substantial amount of foreign investments after
implementing various major structural reforms, the fear of small Turkish investors
continued. In order to attract these Turkish investors back to the stock market, the CMB
replaced the mandatory dividend policy, beginning with fiscal year 2003 (Adaoglu,
2008). Kirkulak and Kurt (2010) pointed out that the purpose for mandatory dividend
policy was to protect minority shareholders rights against the controlling shareholders.
This is because Turkish firms are generally highly dominated by families and mainly
attached to a group of companies, where the controlling shareholders, typically families,
often use a pyramidal structures or dual-class shares to augment control of their firms.
With the replacement of the second mandatory dividend policy, the ISE-listed firms
were obligated to pay at least 20% of their distributable income as the “first dividend”.
However, in a more flexible way from the first mandatory dividend payment policy
between 1985 and 1994, the listed firms did not have to pay the “first dividend” in cash
but had the option to distribute it in cash dividends or stock dividends or a mixture of
both, which was subject to the board of directors’ decision. The total payment, however,
5 Decree issued by the CMB Serial: IV, No: 9 published in the Official Gazette dated 27/12/ 1994 and No:
22154.
Birkbeck University of London Page 30
could not be less than 20% of the distributable income for the fiscal year 2003. They
were also given a right to distribute stock dividends with the requirement that the
amount of stock dividends is added to the paid-in capital (Adaoglu, 2008; Kirkulak and
Kurt, 2010).6
For the fiscal year 2004, the CMB increased the minimum percentage of mandatory
dividend payments for the ISE-listed firms from 20% to 30%, which then stayed at this
level for the fiscal year 2005. Then, the minimum percentage of mandatory dividend
payment level was reduced to 20% again in the fiscal year 2006 and remained at this
level for the fiscal years 2007 and 2008. Nevertheless, from the fiscal year 2009
onwards (2010, 2011 and 2012), the CMB decided to not determine a minimum
dividend payout ratio and to abolish mandatory minimum dividend payment distribution
requirement for the publicly-listed firms trading on the ISE. This provided total freedom
to the ISE-listed firms to make their own dividend policy decisions to pay or not to pay,
with the requirement that any decisions made regarding dividends should be publicly
disclosed.7
1.3.5 The Rationale in Examining Dividend Policy of the ISE-listed Firms
Turkey had a very late start in the liberalisation of its economy and the establishment of
its stock market, the ISE, whose history only dating back to 1986 compared to the
developed stock exchanges with hundreds of years of historical development (Adaoglu,
1999; 2000; Aksu and Kosedag, 2006). Studies reveal that Turkey is a civil law country
(La Porta et al., 1997), where corporate ownership structure is characterised by highly
concentrated family ownership (Gursoy and Aydogan, 1999; Yurtoglu, 2003). There is
also a history of poor structural and microeconomic policies as well as a poor culture of
6 The CMB decision number: 16535 and dated 30/12/2003, published in the CMB Weekly Announcement
Bulletin No: 2003/63. 7 Relating to the fiscal year 2004, the CMB decision number: 51/1747 and dated 30/12/2004 published in
the CMB Weekly Announcement Bulletin No: 2004/54.
Relating to the fiscal year 2005, the CMB decision number: 4/67 and dated 27/01/2006 published in the
CMB Weekly Announcement Bulletin No: 2006/3.
Relating to the fiscal year 2006, the CMB decision number: 2/53 and dated 18/01/2007 published in the
CMB Weekly Announcement Bulletin No: 2007/3.
Relating to the fiscal year 2007, the CMB decision number: 4/138 and dated 08/02/2008 published in the
CMB Weekly Announcement Bulletin No: 2008/6.
Relating to the fiscal year 2008, the CMB decision number: 1/6 and dated 09/01/2009 published in the
CMB Weekly Announcement Bulletin No: 2009/2.
Relating to the fiscal year 2009 and onwards, the CMB decision number: 02/51 and dated 27/01/2010
published in the CMB Weekly Announcement Bulletin No: 2010/4.
Birkbeck University of London Page 31
corporate governance and transparency and disclosure practices (IIF, 2005; Aksu and
Kosedag, 2006). With the rapid development since the establishment in 1986, the ISE
became highly representative of a promising emerging market, with fast growth in terms
of the number of listed firms, trading volume, market capitalisation and foreign
investment (Adaoglu, 2000) as well as indicating high volatility in returns especially
during the period 1990-2000.
In this period, Turkish economy also often experienced global effects from a number of
geopolitical, financial and economic crises; for instance, the Gulf War Crisis in 1991,
1997 Asia Crisis, 1998 Russia Crisis and 2000 Argentina Crisis. However, the major
financial crisis that strongly affected the ISE was the systemic banking crisis that
Turkish economy experienced in 2001 (BRSA, 2010), which resulted in substantial
losses for shareholders, especially small Turkish investors who heavily invested in the
ISE prior to economic crisis (Adaoglu, 2008). Indeed, during the late 1990s, a
considerably long list of cases in tunnelling took place in the Turkish public. Majority
of these cases were simple resource transfers of controlling shareholders from their
firms in the form of outright theft or fraud. Whereas a number of listed firms’ minority
shareholders were harmed by these events, a bigger proportion represented wealth
transfers from state banks to controlling owners of unlisted firms, involving in many
cases transactions with politicians (Yurtoglu, 2003).
Having experienced the series of booms and busts during its liberalisation period of its
economy (from the late 1980s to the early 2000s), the new Turkish government
(following the November 2002 elections which resulted in a non-coalition government)
signed a standby agreement with the IMF and began to implement major economic
programs and structural reforms for a better working of the market economy, outward-
orientation and globalisation, starting March 2003 (CMB, 2003; Adaoglu, 2008; Birol,
2011). Turkey’s progress in achieving full membership of the EU in this period also
provided the strongest motivation in establishing new reforms, rules and regulations in
line with the EU directives and best-practice international standards, to improve
corporate governance and transparency and disclosure practices; and therefore, to
integrate its economy with Europe and to harmonise its institutions with those of the EU
(IIF, 2005; Aksu and Kosedag, 2006; Rawdanowicz, 2010).
In this context, since the main motivation of this doctoral thesis is to investigate
dividend policy behaviour of an emerging market after implementing serious economic
and structural reforms in order to integrate with world markets, the Turkish stock
Birkbeck University of London Page 32
market, namely the ISE, offers an ideal setting for the purpose of this thesis, allowing a
study of the dividend behaviour of an emerging market, which implemented major
reforms starting with the fiscal year 2003, in compliance with the IMF stand-by
agreement, the EU directives and best-practice international standards for a better
working of the market economy, outward-orientation and globalisation.
1.4 The Importance of the Study
1. As evidenced by prior studies taken in the context of developing markets, it is
not surprising that dividend policy behaviour in emerging markets generally tend to be
different from developed markets in many aspects due to various factors such as
political, social and financial instability, lack of adequate disclosure, poor laws and
regulations, weaker financial intermediaries, newer markets with smaller market
capitalisations, weaker corporate governance and different ownership structures (La
Porta et al., 1999; 2000; Kumar and Tsetsekos, 1999; Aivazian et al., 2003a; 2003b;
Yurtoglu, 2003). What if, however, an emerging market implements serious economic
and structural reforms for market integration? Then what behaviour does the dividend
policy of this emerging market show? This doctoral thesis, differently from earlier
research, aims to carry the dividend debate into an emerging market context but
attempting to answer the above question.
2. As previously explained, the Turkish stock market offers an ideal setting for the
purpose of this study. There is, however, very limited evidence about the dividend
policy in Turkey from a few studies (La Porta et al., 2000; Adaoglu, 2000; Aivazian et
al., 2003a; 2003b; Kirkulak and Kurt, 2010). These studies were undertaken in the
earlier stage of the ISE while the Turkish economy was yet implementing its financial
liberalisation programme, suffering long-standing macro-economic imbalances, and
experiencing a number of financial crises. The Turkish economy implemented various
major economic and structural reforms in collaboration with the IMF, the EU directives
and best-practice international standards for a better working of the market economy,
outward-orientation and globalisation, starting with the fiscal year 2003. This study
provides empirical evidence about the dividend policy behaviour of the ISE-listed
companies during its market integration period by examining a long and more recent
panel dataset from 2003 to 2012.
Birkbeck University of London Page 33
3. The transparency and disclosure practices of the ISE firms were not remarkable;
because the ISE’s financial reporting standards (the Turkish Code of Commerce dating
back to 1957) were only based on the generally accepted principles of accounting and
auditing (Aksu and Kosedag, 2006). In 1990s, Turkey enjoyed an economic growth but
it was overall an economically unstable decade, with the experience of a number of
financial crises and the inflation rate surpassing 100% during the decade. As a result of
the instability, high inflation rates, inconsistent and unclear accounting practices, and
the absence of inflation accounting standards, the historical financial statements of the
ISE firms lost their information value and misinformed investors (Ararat and Ugur,
2003; UNCTAD, 2008). However, the need for a global set of high-quality financial
reporting standards has especially been important in developing countries and countries
with economies in transition. They tend to be eager for external capital as their
economies typically grow faster so that foreign and domestic investors can verify the
underlying profitability of the firm and therefore the security of their investment with
the help of comparable and consistent financial data (Aivazian et al., 2003a; UNCTAD,
2008).
In this respect, the CMB of Turkey attributed great importance to improve
communications with investors, issuers and other institutions, in 2003, in order to
ensure that markets are functioning in a safer, more transparent and more efficient
manner in accordance with regulations that were adopted in harmony with international
norms and developments (CMB, 2003). Accordingly, one of the most important
developments was that in line with the EU requirements. The CMB issued the
Communiqué Serial: XI, No: 25 entitled “Accounting Standards in Capital Markets” in
November 2003, adopting International Financial Reporting Standards (IFRS) and
enforcing publicly owned and traded firms to use new rules. In addition, the CMB
requested the implementation of inflation-adjusted accounting at the same time
(UNCTAD, 2008). This has resulted in a more transparent and more efficient
worldwide financial reporting standards, providing comparable and consistent financial
data for foreign and domestic investors, and other institutions. Likewise, the adoption of
the IFRS and inflation accounting has given researchers a way better opportunity to
study firm-specific characteristics of firms in the Turkish market. This study, thus,
investigates what firm-specific (financial) determinants affect dividend policy decisions
of the ISE-listed firms and whether they follow the same firm-specific determinants as
suggested by empirical studies from developed markets, while setting their dividend
Birkbeck University of London Page 34
policies over a decade after Turkey adopted the IFRS and inflation accounting, starting
with the fiscal year 2003.
4. The evidence from cross-country studies (Glen et al., 1995; La Porta et al.,
2000; Aivazian et al., 2003a) revealed that there are regulatory differences related to the
dividend policy making process forced by the governments throughout the world;
particularly, emerging market governments are likely to enforce constrains on the
dividend policy in order to protect both minority shareholders and creditors. For the
fiscal years 1985-1994, the dividend policy in the ISE was indeed heavily regulated due
to the first mandatory dividend policy imposed by the CMB, obliging the ISE firms to
pay at least 50% of their distributable income as a cash dividend. This did not provide
the managers of these firms much flexibility to choose their own dividend policies. In
fact, earlier studies (Adaoglu, 2000; Aivazian et al., 2003a) showed that the ISE firms
followed unstable dividend policies since cash dividend payments were solely depended
on the firm’s current year earnings as forced by the regulations and any variability in
earnings was directly reflected in the level of cash dividends.
In 2003, various reforms in accounting standards, corporate governance, transparency
and disclosure practices were implemented, as well as the restructuring public banks
and regulating private banks. Risk group definitions and a calculation of loan limits for
a single group, which generally includes banks, businesses and subsidiaries in the same
group, considering direct and connected lending, were established. This forced the ISE
firms to the equity market with greater incentive for more transparent financing since
insider lending (in other words non-arms length transactions) as a source of financing
was prevented (IIF, 2005). The CMB of Turkey also implemented much flexible
mandatory dividend policy regulations (during 2003-2008) and further removed
restrictions forced on the dividend payments (2009 and onwards) in order to allow the
ISE managers to set their own dividend policies and reflect their judgements in the
share prices (Adaoglu, 1999; 2000; 2008). In accordance, this study examines whether
ISE firms adopt deliberate cash dividend policies to convey a signal to investors, and as
well, whether they follow stable dividend policies, as in developed markets, by using
the Lintner (1956) model. Particularly, over a decade after the mandatory dividend
policy regulations are considerably relaxed and the insider lending (non-arm’s length
transactions) is prevented as a source of financing along with the implementation of
major reforms in 2003.
Birkbeck University of London Page 35
5. Corporate ownership structure in Turkey is characterised by concentrated
family ownership (Gursoy and Aydogan, 1999; Yurtoglu, 2003; IIF, 2005). Similarly, a
number of cross-country studies (La Porta et al., 1999; Claessens et al., 2000; Faccio et
al.. 2001) provide evidence that shows ownership by large controlling shareholders,
typically families, as the dominant form of ownership structure in most developing
economies. Shleifer and Vishny (1997) argued that when large shareholders, including
family shareholders, hold almost full control, they tend to generate private benefits of
control that are not shared with minority shareholders. In these cases, the salient agency
problem is therefore expropriation of the wealth of minority owners by the families, the
principal-principal conflicts. Indeed, during the late 1990s, a long list of cases of
corruption, share dilution, asset stripping, tunnelling, insider trading and market
manipulation dominated the Turkish public, and a number of listed firms’ minority
shareholders were harmed by these events (Ararat and Ugur, 2003; Yurtoglu, 2003; IIF,
2005).
Cash dividends can be used to either reduce or exacerbate the principal-principal
conflicts, since dividends are the substitutes for legal protection of minority
shareholders in the countries with weak legal protections. By paying dividends,
controlling shareholders return profits to investors, the possibility of expropriation of
wealth from others is reduced (La Porta et al., 2000). It is difficult to judge whether
families tend to expropriate of the wealth of minority owners through dividends in
emerging markets. There are several studies (Faccio et al., 2001; Chen et al., 2005; Wei
et al., 2011; Aguenaou et al., 2013; Gonzalez et al., 2014)) examined the relationship
between family-control and dividend policy in emerging markets, with a mixed report
of findings.
In 2003, the CMB’s Corporate Governance Principles was published in order to
improve the ISE listed firms corporate governance practices. The CMB Principles
consisted of four major parts; particularly, shareholders, disclosure-transparency,
stakeholders and board of directors. All firms traded in the ISE need to comply with
these principles and publish corporate governance compliance report yearly (CMB,
2003; 2004 and Caliskan and Icke, 2011). Considering the implementation of various
major economic and structural reforms, starting with the fiscal year 2003, and with
many areas improved in Turkish corporate governance practice, its capital market is still
heavily concentrated and characterised by high family ownership. This study, therefore,
investigates the link between ownership structure and dividend policy, based on the
Birkbeck University of London Page 36
agency cost theory. It analyses the effect of family control on dividend policy from the
principal-principal conflict perspective, as well as considering the impact of the non-
family blockholders, such as foreign investors, domestic financial institutions and the
state, and minority shareholders; particularly, on the ISE firms dividend policy
decisions over the past decade, when Turkey has employed major reforms, including the
publication of the CMB’s Corporate Governance Principles in the fiscal year 2003.
6. This study extends empirical research on dividend policy of an emerging
market, which not only passed laws for financial liberalisation, but implemented serious
economic and structural reforms to integrate with world markets. Hence, it could be a
benchmark for future longitudinal and cross-country research.
7. This study particularly provides important indicators on dividend policy
behaviour of the ISE-listed firms, after the Turkish government implemented various
major economic and structural reforms in collaboration with the IMF, the EU directives
and best-practice international standards, all for a better working of the market
economy, outward-orientation and globalisation, starting with the fiscal year 2003. Such
a contribution would be of interest to managers of these firms while they make their
dividend policy decisions, investors who are attracted to invest in firms traded in the
ISE, and other stakeholders, such as researchers and professional bodies.
1.5 The Structure of the Thesis
The remainder of this thesis is structured as follows:
Chapter 2 presents a detailed literature review of main dividend policy theories. These
include the dividend irrelevance theory, signalling theory, agency cost theory,
transaction cost theory, as well as tax-related explanations, bird-in-the-hand theory,
pecking order theory, residual dividend theory, catering theory, and maturity
hypothesis. It provides extensive empirical studies, where these theories were tested in
order to examine the relationship between theory and practice, from both developed and
developing markets.
Chapter 3 empirically investigates what firm-specific determinants affect dividend
policy decisions of the ISE-listed firms, and whether they follow the same firm-specific
determinants as suggested by empirical studies from developed markets, while setting
Birkbeck University of London Page 37
their dividend policies a decade after Turkey adopted the IFRS and inflation accounting
(fiscal year 2003). This investigation considers a more comprehensive empirical models
by estimating the effects of various financial determinants on dividend policy and
includes regression techniques, using pooled and panel data analyses (logit/probit and
tobit estimations). It employs alternative dividend policy measures (the probability of
paying dividends, dividend payout ratio and dividend yield), and discusses the main
firm-specific determinants of dividend policy for Turkish firms.
Chapter 4 attempts to examine whether the ISE-listed firms adopt deliberate dividend
policies to signal information to investors, and whether they adopt stable dividend
policies as in developed markets by using Lintner’s (1956) model, a decade after the
mandatory dividend policy regulations are considerably relaxed and insider lending
(non-arm’s length transactions) is prevented as a source of financing, along with the
implementation of major reforms in 2003. It employs richer research models (pooled
OLS, random effects, fixed effects and system GMM) in order to provide more valid,
consistent and robust results. The chapter also considers several extensions of Lintner’s
(1956) model by including additional regressors as explanatory variables, observed in
the literature and thought to be possibly influencing the dividend policy of the ISE firms
during the study sample period.
Chapter 5 provides empirical research for the link between ownership structure and
dividend policy based on the agency cost theory. Specifically, it analyses the effect of
family control on dividend policy from the principal-principal conflict perspective and
also considers the impacts of the non-family blockholders (foreign investors, domestic
financial institutions and the state) and minority shareholders on the ISE firms dividend
policy decisions, over a decade when Turkey employed major reforms, which include
the publication of the CMB’s Corporate Governance Principles in the fiscal year 2003.
The chapter uses pooled and panel data analyses (logit/probit and tobit estimations), as
well as employing alternative dividend policy measures (the probability of paying
dividends, dividend payout ratio and dividend yield), and discusses the findings of this
empirical analyses.
Chapter 6 illustrates an overall summary of the research results. In addition, it gives
recommendations for practice, addresses the research limitations and provides
suggestions for possible future research.
Birkbeck University of London Page 38
CHAPTER 2
A LITERATURE SURVEY ON DIVIDEND POLICY
2 A Literature Survey on Dividend Policy
Birkbeck University of London Page 39
2.1 Introduction
Dividend policy is one of the most controversial topics in corporate finance literature.
Finance academics have dealt with various theories in order to explain why companies
should pay or not pay dividends. Some researchers (Lintner, 1956; Brennan, 1970;
Elton and Gruber, 1970; Rozeff, 1982) have built and empirically tested a great number
of models to explain dividend behaviour. Others (Baker et al., 1985; Pruitt and Gitman,
1991; Baker and Powell, 1999; Brav et al., 2005; Baker and Smith, 2006) have
surveyed corporate managers to discover their thoughts about dividends. Hence,
dividend policy literature is extensive and contains various theories, hypotheses and
explanations for dividends. Despite much research and extensive debate, the actual
motivation for paying dividends still remains unsolved (Baker and Powell, 1999).
Fischer Black (1976, p.5) once described this lack of consensus on the matter as the
dividend puzzle by stating that “The harder we look at the dividend picture, the more it
seems like a puzzle, with pieces that just don’t fit together.” Although Black (1976)
came to this conclusion almost four decades ago, his observation still seems valid since
financial economists have not reached a definitive theory on dividends. Brealey and
Myers (2003) listed dividends as one of the ten important unsolved problems in finance
in their textbook, supporting this conclusion. Allen and Michaely (1995, p.833)
suggested that “Much more empirical and theoretical research on the subject of
dividends is required before a consensus can be reached.”
Accordingly, the aim of this chapter is to provide a detailed literature review of leading
theoretical developments on dividend policy and various empirical studies, which have
tested these theories in order to examine the relationship between theory and practice,
from both developed and developing markets. The structure of this chapter is as follows.
Section 2.2 outlines the main dividend theories. In Section 2.3, the empirical studies of
dividend policy in developed markets are reviewed, followed by the empirical studies of
dividend policy in developing markets in Section 2.4. The conclusions are then
presented in Section 2.5.
2.2 Dividend Policy Theories
In this section, the major dividend policy theories are discussed, beginning with the
dividend irrelevance theory, and followed by the signalling theory, agency cost theory,
Where, PAY is the average payout ratio over a seven-year period 1974-1980; INS is the
percentage of stock owned by insiders in 1981; GROW1 is the realised average growth
rate of revenues over a five-year period 1974-1979; GROW2 is the forecasted growth
rate of revenues by the Value Line Investment Survey over the five-year period 1979-
1984; BETA is the firm’s estimated beta coefficient of returns reported by Value Line
(1981 issue) and STOCK is the natural logarithm of the number of common
Birkbeck University of London Page 69
shareholders in 1981.27 In order to test his model, Rozeff (1982) collected a large sample
of 1,000 US firms over a seven-year period 1974-1980, including 64 different
industries, in 1981. The results of OLS regressions provided consistent evidence with
his cost minimisation model, which explained 48% of the cross-sectional variability in
payout ratio across individual firms, and reported the estimated coefficients on the five
explanatory variables are statistically significant as well as having predicted directional
signs by the model.
Lloyd et al.’s (1985) research is one of the first studies to replicate and expand the work
of Rozeff (1982). More specifically, they pointed out the importance of the effect of
firm size and argued that larger firms are more likely to have lower percentages of
insider ownership and higher numbers of common shareholders. Also, larger firms are
more likely to be mature and have easier access to capital markets and hence they are
less dependent on internally generated funds. In this context, they expanded Rozeff’s
(1982) original model by adding the firm size variable, which was measured as the
natural logarithm of the firm’s sales revenue. Further, Lloyd et al. (1985) used the OLS
cross-sectional regressions on a dataset that consisted of 957 US firms based on the July
to September 1984 edition of Value Line and their results showed that all the
explanatory variables were statistically significant and beared the predicted signs.
Consequently, the study presented credibility to the work of Rozeff (1982) and found
that firm size is also an important explanatory variable that has a positive impact on the
payout ratio.
Schooley and Barney (1994) also examined the agency cost theory of dividends by
modifying Rozeff’s (1982) model. First, they employed “dividend yield” as the
dependent variable instead of payout ratio in order to make sure that the denominator of
the dependant variable is a market measure (stock price) rather than an accounting
measure (net income). Besides, by using the dividend yield, they attempted to avoid
27
Rozeff’s (1982) model contained two proxies for agency costs, namely INS and STOCK. First, it is
predicted that there should be a negative relationship between the percentage of stock owned by insiders
(INS) and the payout ratio; if a higher percentage of stocks held by insiders, their ownership will be more
concentrated and easily influence managers behaviour, therefore reducing agency costs and leading to a
lower or none dividend payments. It is further hypothesised that there should be a positive relationship
between the second agency cost variable (STOCK), which is the number of common shareholders, and the
dividend payout ratio since more dispersion of ownership among outsiders, the more difficult monitoring
becomes, hence leading to higher dividends. Moreover, Rozeff (1982) employed three variables to
measure transaction costs, namely GROW1, GROW2 and BETA. It is hypothesised that all the transaction
costs variables, the past growth, forecasted growth and firm’s beta, are negatively related to the payout
ratio; if a firm experiences a rapid growth, other things being equal, the firm needs funds for investments,
therefore retaining its earnings to avoid costly external financing. Similarly, if a firm has higher beta,
which represents the riskiness of the firm, then it would prefer a lower or none payout policy to lower its
costs of external financing.
Birkbeck University of London Page 70
problems associated with negative or astronomic dividend payout ratios when the firm’s
net income is negative or closes to zero. Second, Schooley and Barney (1994) argued
that the relationship between dividend payout ratio and percentage of managerial stock
ownership may not be monotonic as suggested by Rozeff. Accordingly, they used the
CEO’s ownership percentage instead of the insider ownership that was combined
ownership percentages of a broad class of insiders and further added the squared
percentage of CEO stock ownership as another explanatory variable in the model to
investigate the hypothesised parabolic relation between dividend yield and CEO
ownership. After running the OLS cross sectional regressions on the study sample of
235 industrial US firms’ data centred around 1980, their results showed that the relation
between the percentage of CEO stock ownership and the dividend yield is non-
monotonic. As predicted, CEO ownership is significant and negatively related to
dividend yield, while the squared CEO ownership is significant and positively related,
with all other independent variables also significant in the model (past growth, future
growth, beta, and ownership dispersion respectively). Additionally, School and Barney
(1994) reported that dividend yield falls as CEO stock ownership increases to 14.9%
level, and dividend yield increases thereafter.
Moh’d et al. (1995) applied a number of changes to both the method and proxy
variables used in the original cost minimisation model of Rozeff (1982). First, they
aimed to test whether variations in payout ratios across time can be accounted for by
changes in the agency/transaction costs structure. Therefore, in order to asses the
dynamic relation whereby firms adjust their dividend payments each year in response to
information known, variables were not aggregated and prior period’s dividend payout
ratio was added to the model as an explanatory variable. Also, they modified Rozeff’s
(1982) measure of the firm’s beta coefficient to evaluate the separate effects associated
with transaction costs, and therefore the beta variable was substituted for measures of
operating leverage, financial leverage and the intrinsic business risk. Further, Moh’d et
al. (1995) included 26 industry dummies in the regression to control for each industry
effect. Finally, they also added firm size, as suggested by Lloyds et al. (1985), and the
percentage of common stock held by financial institutions as independent variables in
the model. Using more specific proxies for the agency cost theory and “time-series
cross- sectional” analysis, Moh’d et al. (1995) tested their modified model on 341 US
firms over 18 years from 1972 to 1989. The empirical results indicated consistency with
Rozeff’s original findings and, more importantly, showed that firms do appear to
Birkbeck University of London Page 71
respond to the dynamic changes in the agency/transaction costs structure over the time;
specifically, dividend policy is affected by firm size, rate of growth, operating/financial
leverage, intrinsic business risk and ownership structure. The results also reported a
significant and positive relationship between institutional ownership and payout ratio, as
well as a significant and positive coefficient for lagged payout ratio, which causes the
past growth variable to become insignificant and indicates that it has little or no role in
the dynamic adjustment of dividend payments. Consequently, Moh’d et al. (1995)
found that firms do perform to minimise the sum of agency cost and transaction cost
towards an optimum level of dividend payout; however, this relationship holds not only
across firms but within the firms across time as well.
Farinha’s (2003) empirical study provided an analysis of the agency explanation for the
cross-sectional variation of corporate dividend policy in the UK, by modifying Rozeff’s
(1982) cost minimisation model. Following School and Barney (1994), Farinha (2003)
hypothesised that the relationship between insider ownership and dividend policy might
be non-monotonic and employed past growth, future growth opportunities, shareholder
dispersion, institutional stock ownership, firm size and industry dummies based on the
original and various modified versions of the cost minimisation model. Moreover,
Farinha (2003) included a number of different explanatory variables for the analysis in
the hope of finding other complimentary instruments for agency/transaction costs and
dividend policy argument, such as debt, stock return variance, incorporate tax, free cash
flow, return on assets, the percentage of external directors, the log of the number of
analysts following a particular firm, and dummy variable of CADBURY, which takes
the value of 1 if a firm states it is full compliance with the Cadbury (1992) Code of Best
Practice,28 and zero otherwise. By using OLS cross sectional regressions, Farinha (2003)
examined a sample of UK firms (693 in 1991 and 609 in 1996) for two five-year
periods 1987-1991 and 1992-1996, in order to test whether insider ownership affects
dividends policies in line with a managerial entrenchment perspective. Consistent with
predictions, strong evidence found that there is a strong U-shaped relationship between
dividend payouts and insider ownership in the UK market. The findings indicated that
after a critical entrenchment level estimated in the region of 30%, the coefficient of
28
Cadbury (1992) Code of Best Practice was published in 1992. The document reviewed the role of
corporate boards in corporate governance and provided a set of recommendations of best practices to
improve the accountability and monitoring function of the directors ok UK firms. After publication of the
report, the London Stock Exchange asked its listed firms to state their compliance or reasons for not
complying, with the Code’s recommendations. Hence, the analysis of the relationship between dividend
policy and Cadbury (1992) compliance would be a novel way of investigating agency cost for dividend
payments given the Cadbury (1992) recognised role in corporate governance in the UK (Farinha, 2003).
Birkbeck University of London Page 72
insider ownership changes from negative to positive. Compliance with the Cadbury
(1992) Code of Best Practices was found to have a significantly positive effect on
dividend payments. Also, strong evidence of a significant and positive impact of
common shareholders dispersion on dividend payouts was reported, consistent with the
existing agency cost literature.
In conclusion, there is strong evidence that Rozeff’s (1982) cost minimisation model,
which combines transaction costs and agency costs to an optimal dividend policy, is
empirically valid. Indeed, the studies reviewed in this sub-section (Llyod et al., 1985;
Schooley and Barney, 1994; Moh’d et al., 1995; Farinha, 2003) have found results
consistent with Rozeff’s original findings and indicated the relationship between
dividend policy and agency cost variables.
2.3.2.2 Studies of the Capital Market Monitoring Hypothesis in Developed Markets
The function of dividend policy as a monitoring mechanism of managerial activities is
grounded by Easterbrook (1984), who argues that dividends play a role in controlling
agency related problems by facilitating primary capital market monitoring on the firm’s
activities and performance, since dividend payments force firms to raise capital more
often in capital markets. However, the dividend-induced monitoring for shareholders
may not be costless, such as tax burden or issuance costs. Easterbrook (1984) further
suggests substitution devices for controlling agency costs when non-dividend
monitoring mechanism is placed. For instance, the presence of large blockholders is
more likely to make the use of a costly dividend payout mechanism to induce capital
market monitoring redundant. Alternatively, firms might be driven to the capital market
by other circumstances, such as experiencing high growth, and hence making less use of
the dividend device for controlling agency costs due to the need of financing high
growth.
Crutchley and Hansen (1989) provided support for the monitoring rationale for
dividends as well as the substitution effects between dividends, managerial ownership
and leverage. They pointed out that there are several ways to reduce equity agency cost.
One way is to increase dividends. Paying larger dividends increases the chance that
external equity capital will have to be raised. When new equity is raised, managers are
monitored by regulators, investment bankers and providers of new capital. Hence, this
monitoring induces managers, who intend to retain their employment to act more in line
with stockholders’ interests. A second way could be increasing managerial stock
Birkbeck University of London Page 73
ownership in the firm; thus, better aligning their interests with shareholders’ interests.
Further, raising more debt financing might be the third way of reducing equity agency
costs.29 Using more debt reduces total equity financing in terms of reducing the scope of
the manager-shareholders conflict. Crutchley and Hansen (1989) studied 603 US
industrial firms for the period 1981-1985 in order to test the agency costs of monitoring
argument with regard to dividends, managerial ownership and leverage. Particularly,
they hypothesised that the three policies are jointly determined by the impact of five
characteristics, which were firms’ stock diversification, earnings volatility, floatation
costs, advertising and R&D expenditure, and firm size. Accordingly, each of the three
policy decisions was separately regressed on all five firm-specific characteristics. The
results of the regression tests showed that managers use a combination of policies,
including dividend policy, leverage policy and managerial ownership incentives, in
terms of monitoring and controlling the agency costs in the most efficient way.
Born and Rimbey (1993) also tested Easterbrook’s (1984) agency cost argument
relating to dividends as a monitoring device. They hypothesised that the share prices of
firms that announce both capital financing and dividend increases should raise more
value than firms that announce dividend increases alone due to monitoring issues.
Examining the shareholders response to 490 US firms that initiated or resumed a cash
dividend policy, including 388 of which non-financed and 102 of which financed, from
1962 to 1989, Born and Rimbey (1993) reported that the abnormal returns were
positively related to the extent of the dividend increases and this result held for the firms
that engage in financing, which suggested that the dividend is not redundant
information. Unlike its prediction, the average abnormal returns of financing firms did
not showed an increase as much as the non-financing firms. However, a cross-sectional
analysis of the abnormal returns associated with the dividend announcements revealed
that financing firms enjoy a higher return per unit of dividend yield than non-financing
firms. This result supported the primary hypothesis of the study and therefore provided
evidence in line with Easterbrook’s (1984) agency cost model.
Hansen et al. (1994) tested the relevance of the monitoring hypothesis for explaining
the dividend policies of regulated electric utilities. They argued that agency conflicts
29
Crutchley and Hansen (1989) further noted that each of the three agency cost control mechanisms;
dividends, leverage and managerial ownership, is not costless. For instance, increasing managerial
ownership may result managers’ wealth to be poorly diversified and then they would require increasing
amounts of compensation. Also, paying larger dividends might associate with substantial transaction
costs. Similarly, debt financing may lead to conflicts of interest between shareholders and bondholders.
Therefore, managers choose the policy mix of these three mechanisms to minimise agency cost.
Birkbeck University of London Page 74
might be particularly severe with regulators involved and hence by paying dividends,
the regulated firm exposes its managers and regulators to capital markets monitoring.
However, managers and shareholders of unregulated firms have access to a number of
different internal and external mechanisms to control agency cost. Consequently, this
suggest that if an important potential monitoring role of dividends is to be captured,
evidence of this is most likely to be found in the case of regulated utilities. Furthermore,
it is argued that the costs involved with dividend-induced monitoring are significantly
lower for regulated utilities than for industrials. Because the floatation costs associated
with issuing new equity can be, at least partially, passed on to ratepayers. Accordingly,
Hansen et al. (1994) hypothesised that, since dividends are both more useful and less
costly for utilities, they should have a higher payout ratio than non-regulated industrial
firms. Comparing the mean dividend payout ratios of electric utilities with the S&P 400
industrial firms during two five-year periods, 1981-1985 and 1986-1990, the results
showed that regulated utilities pay larger proportions of dividends than non-regulated
industrials in terms of being more capital intensive, therefore increasing the likelihood
of dividend-induced monitoring as hypothesised. Moreover, Hansen et al. (1994)
examined implications of cross-sectional regularities relating dividend payout ratio to
proxy measures for the severity of the shareholders-manager conflict, the shareholder-
regulator conflict and the cost of monitoring these conflicts within the regulated electric
utilities. By studying the dividend policies of 81 US utility firms from 1981-1985 and
70 US utility firms from 1986-1990, the cross-sectional regression results illustrated
that regulated utilities that experience higher regulatory and managerial conflicts of
interest, lower floatation costs and lower growth opportunities tend to pay higher
proportion of cash dividends to increase the probability of primary market monitoring.
Hence, the evidence of the study was consistent with the monitoring hypothesis that
regulated electric utilities use dividend-induced monitoring for controlling agency
problems, which occur from the shareholder-regulator and shareholder-manager
conflicts.
Noronha et al. (1996) investigated the validity of the monitoring rationale for dividends
and whether the resultant simultaneity of dividends and capital structure decisions are
dependent on the characteristics of the firms, as they relate to the growth opportunities
and to the presence of non-dividend mechanisms for controlling agency conflicts.
Having considered that dividend-induced monitoring obtains benefits, but also bear
costs, they indicated the existence of non-dividend devices. The presence of a large
outside shareholder might serve as an external monitor, or growth-induced might force
Birkbeck University of London Page 75
the firm to raise external capital and trigger capital market monitoring. Accordingly,
Noronha et al. (1996) hypothesised that for firms with high growth opportunities and/or
alternative non-dividend monitoring and/or monitoring from both sources, the empirical
validation of the monitoring rationale for dividends are not anticipated. However, for
firms with low growth opportunities and/or those characterised by low prevalence of
any alternative non-dividend monitoring devices, the monitoring rationale for dividends
is expected to be empirically valid. Noronha et al. (1996) collected a sample of 341 US
industrial firms from S&P 400 over the period 1986-1988. The sample was first
stratified according to the prevalence of alternative non-dividend monitoring
mechanisms. A firm was considered as having non-dividend monitoring mechanism
based on two criteria; the incentive component of managerial compensation and the
existence of a large shareholder.30 Further, the sample was then stratified according to
the firm’s growth opportunities.31 This stratification procedure led to two subsamples;
131 US firms with high use of non-dividend monitoring mechanisms and/or with high
growth-induced capital market monitoring and 210 US firms with low non-dividend
control mechanisms and low growth-induced capital market monitoring. Noronha et al.
(1996) tested the monitoring rationale for dividends by running regressions on a
modification of the cost minimisation model. The results were consistent with
monitoring hypothesis and simultaneity between capital structure and dividend
decisions is dependent on specific firm characteristics; in particular, the payouts of
firms with alternative mechanisms and high growth are not related to proxies for agency
cost variables, whereas the dividend decisions of firms with less alternative non-
dividend devices and low growth are made in line with Easterbrook’s monitoring
rationale.
Overall, the studies reviewed in this sub-section (Crutchley and Hansen, 1989; Born and
Rimbey, 1992; Hansen et al., 1994; Noronha et al., 1996) showed support to notion that
dividend policy may play a role in controlling agency related problems by facilitating
primary capital market monitoring on firms’ activities and performance, as proposed by
30
Firms had an above average incentive component in their managerial compensation packages, which
aligns management-shareholder interest, and a single large outside blockholder having at least 5% of the
firm’s equity, which serves as an external monitor as well as a potential take-over threat, were classified
as possessing alternative non-dividend mechanism. Compensation data was obtained from Forbes
magazine surveys, and the incentive component was measured as total compensation to the firm’s top
executives less the salary component, the difference divided by the total compensation. 31
Firms’ growth opportunities are measured by Tobin’s Q ratio that was measured as the market to book
ratio, which was computed as the sum of the market value of equity and book values of long-term debt
and preferred stocks, the total divided by the book value of total assets. Firms with Tobin’s Q ratio above
the sample average were categorised as high on growth opportunities, otherwise low.
Birkbeck University of London Page 76
Easterbrook (1984). They also presented evidence that dividends can be used as
substitutes with other non-dividend monitoring mechanisms such as managerial
ownership, leverage and growth.
2.3.2.3 Studies of the Free Cash Flow Hypothesis in Developed Markets
Jensen’s (1986) free cash flow hypothesis argues that managers with large amount of
excess cash, which he calls free cash flow, may act in ways not in shareholders’ best
interests. Instead of undertaking positive NPV investment projects by this cash, they
might overinvest by accepting marginal investment projects with negative NPVs.
However, substantial cash dividend payments would, all else being equal, lessen the
amount of free cash flow that managers may misuse and also the scope of
overinvestment; hence, increase the market value of the firm. Conversely, a dividend
decrease would result in undertaking more negative NPV projects and decreasing the
market value of the firm.
Lang and Litzenberger (1989) followed Jensen’s (1986) free cash flow argument and
called the extended form the overinvestment hypothesis. They used Tobin’s Q ratio, the
market-to-book ratio (hereafter Q), to distinguish between value-maximising firms and
overinvesting firms, and argued that if Q for a given firm is greater than unity (Q>1),
the firm is a value-maximiser since the market value reflects the book value plus the
positive NPV of the investment, whereas a Q less than one (Q<1) indicates
overinvestment. According to Lang and Litzenberger’s overinvestment hypothesis,
firms with Q less than one (over-investors) experience positive abnormal stock returns,
following a substantial increase in dividends; because, the market anticipates this as a
reduction in the overinvestment problem (a good indicator). It means that increases in
dividends decrease the amount of cash that would have been otherwise invested in
suboptimal projects. Contrarily, substantial dividend decreases suggest that the potential
for the overinvestment problem may have increased (a bad indicator). However,
dividend payout increases or decreases by firms with Q greater than one (value-
maximisers) merely reflect optimal investment decisions; therefore, the overinvestment
hypothesis further predicts that average price reactions to all substantial dividend
changes (either increases or decreases), should be larger for overinvesting firms than for
value-maximising ones.
Lang and Litzenberger (1989) tested their argument on a sample of 429 substantial
dividend change announcements of US firms for the period 1979-1984. They reported
Birkbeck University of London Page 77
that the average reaction to substantial dividend changes by firms having a low Q is
almost four times larger than the firms having a high Q, which is in line with the
overinvestment/free cash flow hypothesis and supports the argument that dividends may
constrain management’s ability to invest beyond the levels that shareholders desire.
Although this evidence is consistent with the overinvestment hypothesis, it is also
consistent with the signalling hypothesis. Hence, Lang and Litzenberger (1989)
attempted to distinguish between the effects of signalling and the overinvestment
hypotheses by re-arranging their sample and examining the average reactions for firms
with low and high Q groups based on the dividend increase and decrease
announcements. The signalling hypothesis suggests strong reactions to substantial
dividend decreases, regardless of Q ratio, as such announcements signal negative
information concerning future cash flows, whereas the overinvestment hypothesis
argues that the reactions to dividend changes of firms having low Q would be greater. In
this respect, Lang and Litzenberger (1989) found that the mean reactions to dividend
increases and decreases for low Q groups are both significant; whereas the average
reaction to dividend decreases for high Q firms are insignificant. Consequently, these
findings are consistent with the overinvestment hypothesis but inconsistent with the
signalling hypothesis.
Howe et al. (1992) aimed to provide an extension of Lang and Litzenberger’s analysis
of free cash flow and they investigated whether the free cash flow argument is valid for
explaining share repurchases and specially designated dividend (SDD) announcements.
Their sample consisted of 55 announcements of tender offer share repurchases and 60
announcements of SDDs of US firms from January 1979 to December 1989. Both the
share buybacks and SDD samples are further separated into two sub-samples, according
to whether Q ratios for the firms are less or greater than one. The empirical results
indicated that market reaction to share repurchases and SDDs were not statistically
different from each other at any conventional significance level across samples of high
Q ratio (value-maximisers) and of low Q ratio (over-investors). Furthermore, they
performed several cross-sectional regressions to test if cash flows have an independent
effect on abnormal returns. However, the regression results also showed that the free
cash flow hypothesis does not hold in explaining excess returns for share repurchases
and SDD announcements, since the coefficient of cash flow is insignificant in all
regressions. Therefore, Howe et al. (1992) concluded that results are inconsistent with
Birkbeck University of London Page 78
Lang and Litzenberger’s (1989) findings and they rejected the free cash flow
hypothesis.
Agrawal and Jayaraman (1994) attempted to use another method to examine whether
dividends reduce the opportunity for managers to use free cash flows in a self-serving
manner. Additionally, they investigated the interactions of dividend policy, financial
leverage and managerial ownership. Since both dividends and debt reduce the amount
of excess cash that managers can misuse, Agrawal and Jayaraman (1994) predicted that
dividends and debt are substitute mechanisms, and firms with low debt ratios, in other
words all-equity firms, tend to follow a policy of high dividend payout. They further
argued that managers’ equity ownership provides another way of monitoring, in
addition to debt and dividends, in order to reduce the agency cost of free cash flow.
Agrawal and Jayaraman (1994) used a sample of all-equity and levered firms, which
consisted of 71 industry-sized matched pairs of all-equity and levered US firms during
1979-1983. They reported that dividend payout ratios of all-equity firms were
significantly higher than levered firms.
They also reported that firms with high
managerial ownership had lower dividend payouts than the firms with low managerial
share holdings. Consequently, their results indicated that dividends, debt and managerial
ownership are served as alternative mechanisms to reduce the possible corruption
related to the agency cost of free cash flow.
In another study, Johnson (1995) also investigated whether dividends and debt are
substitute devices to reduce the agency costs associated with free cash flows. In
particular, he examined share price responses to announcements of straight debt issues,
by arguing that there are systematic differences between low and high dividend payout
firms. Drawing on the arguments that debt and dividends are alternative tools in
controlling agency cost of free cash flows, Johnson (1995) hypothesised that debt issues
should be more advantageous to firms with low dividend payout. Because, debt and
dividends are both inputs to control, the marginal level of one should depend on the
input level of the other. Based on this substitution argument, the share price response to
bond announcements should be more favourable for firms with lower payout ratios and
should be negatively related to dividend payout. Johnson (1995) studied 129 straight
debt offerings of AMEX/NYSE industrial firms for the period 1977-1983. The results
indicated that low dividend payout firms had an average two-day excess return of
0.78%, which is positive and significantly different from zero at the 10% level, while
high payout firms generated an average two-day excess return of -0.18% that is not
Birkbeck University of London Page 79
significantly different from zero. This is consistent with the view that debt and
dividends are substitutes and debt can be used for reducing agency costs of free cash
flows.
Overall, studies reviewed in this sub-section generally showed support for Jensen’s
(1986) free cash flow hypothesis; with the exception of Howe et al.’s (1992) study.
However, since both agency cost of free cash flow and the signalling hypothesis imply
relatively similar effects on share prices, empirical evidence in this area is quite mixed.
For instance, Lang and Litzenberger (1989), Agrawal and Jayraman (1994) and Johnson
(1995) have reported evidence consistent with the free cash flow argument but they
cannot completely rule out the cash flow signalling hypothesis.
2.3.2.4 Shareholders-Bondholders Conflict in Developed Markets
The conflict of interest between shareholders and bondholders is another type of agency
costs regarding dividends. It is argued that dividends can be potentially used to
expropriate wealth from bondholders to shareholders (Jensen and Meckling, 1976; Alli
et al., 1993). As stated by Lease et al. (2000, p.76), “All else being equal, shareholders
would like to receive as large as dividends as possible. Large dividends mean that even
if the firm eventually defaults, the shareholders will have received some return on their
investment prior to the default. In other words, dividends are a means to transfer a
firm’s assets from the common pool shared by all the security holders of the firm to the
exclusive ownership of the shareholders.” Consequently, bondholders tend to control
this problem through restrictions on dividend payments in the bond indenture (Smith
and Warner, 1979; Kalay, 1982b).
Woolridge (1983) analysed the effects of unexpected dividend changes on the values of
common stock, preferred stock and straight bonds related to the wealth transfer and
information content hypotheses, by arguing that if a firm finances an unexpected
dividend distribution with additional debt or reducing investment, a wealth transfer
between shareholders and bondholders may exist. This action could also be that
managers aim to convey about their firms’ prospects to the market. Indeed, the wealth
transfer and signalling effects of dividend policy are not necessarily mutually exclusive.
It is more likely that both effects are reflected in security prices, but one effect
dominates the other. Woolridge (1983) predicted the changes in security prices under
these two different hypotheses as illustrated in Table 2.1 below.
Birkbeck University of London Page 80
Table 2.1 Security Responses to Unexpected Dividend Changes The table illustrates the predicted responses of different securities, namely common stocks, preferred
stocks and debt, to both positive and negative unexpected dividends changes under the wealth
transfer and signalling effects of dividends hypotheses.
Positive Unexpected
Dividend Change
Negative Unexpected
Dividend Change
Wealth
Transfer Signalling
Wealth
Transfer Signalling
Common Stocks + + − −
Preferred Stocks − + + −
Debt − + + −
Source: Woolridge (1983, p.1609)
Woolridge’s (1983) research sample consisted of 317 positive and 50 negative
unexpected dividend changes of NYSE firms over the period 1971-1977. The study
findings indicated that common stock price reactions to the 317 unexpected dividend
increases were positive and statistically significant, whereas the stock reactions were
significantly negative to the 50 unexpected dividend decreases. These findings were
consistent with both the wealth transfer and signalling hypotheses, since both of them
predict the same share price movements towards unexpected dividend increases and
decreases. Woolridge (1983) therefore stated that the straight debt and preferred stocks
returns must have been analysed to discover the predominant effect of unexpected
dividend changes on security prices. Further analyses revealed that both bond price
reactions and preferred stock reactions were positive to the unexpected dividend
increases, whereas they showed a negative reaction to the unexpected dividend
decreases. Therefore, together with the common and preferred stock results, the
nonconvertible bonds findings supported the conclusion that the information content,
rather than wealth transfer, is the predominant hypothesis regarding unexpected
dividend changes on security values.
Jayaraman and Shastri (1988) examined the valuation impacts of SDDs by analysing
stock and bond price reactions to their announcements. It is argued that dividend
increases convey good information about the firm’s prospects but unexpected or extra
dividend payments, such as SDDs, could cause wealth transfer from bondholders to
shareholders by reducing the asset base of the firm. Hence, Jayraman and Shastri (1988)
suggested that there is a greater likelihood of observing wealth transfer around SDD
announcements than regular dividend increases. Further, they hypothesised that the
wealth transfer hypothesis would be accepted over the information content hypothesis,
if significant negative bond price reactions were observed to SDD announcements.
Birkbeck University of London Page 81
Jayaraman and Shastri (1988) collected a stock sample that consisted of 2,023 SDD
announcements from either NYSE or AMEX by 660 firms over the period 1962-1982.
Their bond sample included 154 straight bonds issued by 63 firms in their stock sample.
Their results indicated that share price reactions to SDDs are positive and statistically
significant. However, since both the information content and the wealth transfer
hypotheses predict positive share price reactions to dividend increases, Jayaraman and
Shastri (1988) further examined the reactions of the bond prices to SDDs to determine
which effect, information or wealth redistribution, dominates. Having analysed the
behaviour of bond prices around the 154 SDD announcements, they found that bond
prices remain unaffected by announcements of SDDs. Consequently, the results of this
study were consistent with the information content hypothesis and provided no support
for the wealth transfer hypothesis.
Moreover, Dhillon and Johnson (1994) analysed stock and bond reactions to dividend
changes in an effort to examine these two hypotheses. Nonetheless, in contrast to prior
studies mentioned above, their findings provided supports for the wealth transfer
hypothesis over the information content argument, since they found that the bond price
reactions to announcements of large dividend changes are opposite to the stock price
reactions. The evidence, however, cannot rule out the information content hypothesis
completely. Dhillon and Johnson (1994) studied a full dividend change sample, which
consisted of 131 announcements, including 61 dividend increases and 70 dividend
decreases from NYSE/AMEX listed firms over the period 1970-1987. The dividend
increase sample consisted of two sub-samples: 15 dividend initiations and 46 large
dividend increases (exceeding 30 percent). The dividend decrease sample consisted of
three sub-samples: 19 dividend omissions, 43 large dividend decreases (exceeding 30
percent) and 8 small dividend decreases. Their results showed that stock returns were
statistically positive for the dividend increases announcements, whereas bond returns
were negative despite not being quite significant. Moreover, the study results showed
that bond returns were significantly positive to dividend decrease announcements, while
stock returns were significantly negative. Dhillon and Johnson (1994) concluded that
bond prices decline when dividends are increased, whereas bond prices increase when
dividends are decreased, in an opposite manner of stock prices. Therefore, their
evidence supported the wealth redistribution hypothesis to the associated agency
problems.
Birkbeck University of London Page 82
Long et al. (1994) employed another way of examining whether firms attempt to
expropriate from bondholders by focusing on the underinvestment problem and the use
of dividend policy to expropriate lenders’ wealth. They hypothesised that, if debt creates
an incentive for shareholders to under-invest and expropriate bondholders’ collateral by
using dividend policy, then firms should increase dividends after new debt is issued. In
this respect, they investigated the dividend behaviour of firms after debt (straight debt
and convertible debt) was issued. The final sample of the study consisted of 141 straight
debt and 78 convertible debt issues of NYSE firms from 1964 to 1977. Their initial
results presented little support for the wealth transfer hypothesis but further analyses
were taken to investigate the issue more in depth. Long et al. (1994) then compared the
dividend growth rates of firms issuing debt with the benchmark NYSE index. However,
further analyses showed no systematic differences in dividend growth rates between the
two samples or the benchmark NYSE. Firm issuing straight debt showed a higher but
insignificant average rate of increase for the following years after issuing. Likewise,
firms issuing convertible debt showed a higher growth rate than firms on average, but
still there was no statistically significant difference. Consequently, Long et al. (1994)
suggested no evidence that firms manipulate dividend policy to expropriate wealth from
new bondholders to shareholders. Despite dividends do increase following the issue of
debt, the increases were in line with the market as a whole in terms of both timing and
relative magnitude.
Overall, the studies reviewed in this sub-section showed that there is not enough
evidence that dividend payments are used to transfer wealth from bondholders to
shareholders. Woolridge (1983), Jayaraman and Shastri (1988) and Long et al. (1994)
reported no evidence in favour of the wealth transfer hypothesis, whereas Dhillon and
Johnson (1994) supported the wealth distribution hypothesis but still cannot rule out the
information content hypothesis completely.
2.3.2.5 Conclusions for Empirical Studies of Agency Cost Theory in Developed
Markets
The empirical studies of the agency cost theory of dividends in developed markets that
are reviewed in this section are summarised in Table 2.4 to 2.7 in Appendix I.
In terms of shareholder-manager conflicts of agency cost theory, the empirical evidence
is extensive and strong in suggesting that dividend policy is a mechanism to reduce
these kinds of agency problems. First, there is strong evidence that Rozeff’s (1982) cost
Birkbeck University of London Page 83
minimisation model, which combines transaction costs and agency costs to an optimal
dividend policy, is empirically valid. A number of studies based on Rozeff’s (1982)
specification to explain dividend policy, including Llyod et al. (1985), Schooley and
Barney (1994), Moh’d et al. (1995) and Farinha (2003), have found results consistent
with Rozeff’s original findings and indicated a relationship between dividend policy and
agency cost variables.
Furthermore, there is evidence that dividend policy may play a role in controlling
agency related problems by facilitating primary capital market monitoring of firms’
activities and performance, as proposed by Easterbrook (1984). Also, there is evidence
that dividends can be used as substitutes with other non-dividend monitoring
mechanisms. A string of studies investigating the monitoring role and substitution
effects of dividends, including Crutchley and Hansen (1989), Born and Rimbey (1992),
Hansen et al. (1994) and Noronha et al. (1996), have presented evidence consistent with
dividend policy acting as a corporate monitoring vehicle, and with substitution effects
between dividends and other alternative control devices, such as managerial ownership,
leverage and growth. Moreover, various empirical studies have shown support for
Jensen’s (1986) free cash flow hypothesis in order to explain dividend policy decisions;
however, since both agency cost of free cash flow and signalling hypothesis imply
relatively similar effects on share prices, empirical evidence on this area is quite mixed.
For instance, Lang and Litzenberger (1989), Agrawal and Jayraman (1994) and Johnson
(1995) have reported evidence consistent with the free cash flow argument but they
cannot completely rule out the cash flow signalling hypothesis.
Finally, in terms of shareholder-bondholder conflict of agency costs, there is not enough
evidence that dividend policy is used to expropriate from bondholders to shareholders.
This is not easy to test empirically because the evidence is mixed and there is a possible
difficulty in distinguishing between two important hypotheses; the wealth transfer and
signalling hypotheses. Researchers have, however, investigated the impact of dividend
policy on both the share and bond markets to explain the conflicts of interest between
shareholders and debtholders. Woolridge (1983) supported the information content
hypothesis and observed no evidence of the wealth transfer hypothesis. Further,
Jayaraman and Shastri (1988) and Long et al. (1994) found no evidence that firms use
dividends to transfer wealth from debtholders to shareholders. In contrast, Dhillon and
Johnson’s (1994) study showed support for the wealth distribution hypothesis but they
still cannot rule out the information content hypothesis completely.
Birkbeck University of London Page 84
2.3.3 Empirical Studies of Tax Effect in Developed Markets
The following selective review of empirical research on the tax effect of dividend policy
in developed markets is divided into two sub-sections; (i) studies of the relationship
between dividend yields and risk-adjusted returns and (ii) studies of the ex-dividend day
share price behaviour.
2.3.3.1 Studies of the Relationship between Dividend Yields and Risk-Adjusted
Returns in Developed Markets
In order to analyse the relationship between tax risk-adjusted returns and dividend
yields, Brennan (1970) formulated an after-tax version of the capital asset pricing model
(CAPM), which maintains that a security’s pre-tax excess return is linearly and
positively related to its systematic risk and to its dividend yield. Brennan (1970) argued
that if dividends are taxed at higher rates than capital gains, then higher pre-tax returns
are associated with higher dividend yield securities, to pay off investors for the tax
disadvantages of dividends. The Brennan model can be expressed as:
In-depth interviews with managers who were responsible for setting their dividend policy.
Regression model to describe the dividend change behaviour.
Model and findings:
Change in dividends = α + (speed of adjustment coefficient) x (target dividend* – actual
previous year’s dividend) + u
R2 = 85%
*Target dividend = the target payout ratio x the current year’s earnings after tax.
Managers tend to make; (i) stabilize dividends and
sustainable increases whenever possible, (ii) dividend
smoothing with establishing an appropriate target
payout ratio to avoid frequent and spectacular
changes in the short run, (iii) avoiding dividend cuts
unless adverse circumstances are likely to persist.
Also, the level of current earnings and the pattern of
lagged dividends are the most important factors on
dividend policy.
Darling (1957)
Testing modifications
of Lintner’s partial
adjustment model.
Data sample:
US, an annual data set of all manufacturing firms for the period 1921-1954 with the years
1936-1938 omitted.
US, quarterly data on common stock dividends of 125 large industrial firms from first
quarter 1930 to second quarter 1955 with the years 1936-1938 omitted.
Methodology:
Multiple-regression.
Model and findings:
Regression measures for dividend functions:
All manufacturing firms, annual data, 1921-1954 (1936-1938 excluded).
I. Dividends = 763 + 0.134 net income** + 0.122 lagged income** + 0.288 amortisation*
– 0.0094 change in sales*** ► Adjusted R = 0.975
II. Dividends = 288 + 0.148 net income** + 0.619 lagged dividends* + 0.05 amortisation*
– 0.047 change in sales*** ► Adjusted R = 0.989
125 large industrial firms, quarterly data, 1930-1955, and 1936-1938 excluded
I. Dividends = 269 + 0.306 net income** + 0.136 lagged income** + 0.143 amortisation**
– 0.0054 change in sales *** ► Adjusted R = 0.992
II. Dividends = 152 + .322 net income** + 0.370 lagged dividends** + 0.054 amortisation**
– 0.0056 change in sales *** ► Adjusted R = 0.995
Consistent with the Lintner model; however,
dividends are not only influenced by current flows
but also by anticipations of future flows.
Based on the certain managerial goals such as
maintaining market position, providing adequate
manoeuvrability, dispersing stock ownership and
based on the budgetary constrains imposed on firms,
dividends tend to vary directly with current profits,
lagged profits, the rate of amortization recoveries and
tend to vary inversely with persistent changes in level
of sales.
Fama and
Babiak (1968)
Testing the Lintner
model using individual
firm data instead of
using aggregate data.
Data sample:
US, 392 major industrial firms for the 19 years 1946-1964
Methodology:
OLS time series regression and simulations.
Model and findings:
Lintner’s partial adjustment model.
Modified versions of Lintner’s model; removing the constant and adding the lagged
earnings variable into the model. Also, including cash flow and depreciation as other
explanatory variables.
Consistent with the Lintner model; the current
earnings, lagged dividends and constant perform
well.
However, removing the constant and adding the
lagged earnings into the model lead to a slight
improvement in the predictive power of the model.
Net income seemed to be a better proxy for profits
than either cash flow or net income and depreciation
included as different variables in the model.
***, ** and * indicate significance at the 1%, 5% and 10% levels, respectively.
Birkbeck University of London Page 121
Table 2.2 Studies of the Partial Adjustment Model in Developed Markets (continues) Researcher(s) Aim of the study Methodology (data sample and model) and main findings of the study Hypotheses consistent with results
Baker, Farrelly
and Edelman
(1985)
Investigating the
determinants of
dividend policy by
comparing with
Lintner’s model and
evaluating managers’
agreement with
Lintner’s findings.
Data sample:
US, 318 usable responses from the NYSE firms during 1983, with a 56.6 % response rate: 114
utilities, 147 manufacturing and 57 wholesaler/retailers.
Methodology:
Postal survey.
Five-point equal interval scale.
Chi-square difference test.
Consistent with Lintner’s findings; firms tend to
avoid changing dividend rates which maybe soon
need to be reversed, have a target payout ratio and
periodically adjust the payout toward the target.
The importance of factors influencing dividend
policy differs based on industry classification.
General agreement from mangers that dividend
policy affect share value.
McDonald,
Jacquillat and
Nussenbaum
(1975)
Examining the
dividend, investment
and financing decisions
of French firms by
using Lintner’s partial
adjustment model.
Data sample:
France, 75 firms in each of seven years, 1962-1968.
Methodology:
OLS and two-stage least squares (2SLS) regressions.
Model and findings:
Modified versions of Lintner’s model by adding investment and financing variables and
estimating the models with a cross-sectional specification.
All variables are deflated by firm size, as measured by sales.
Estimated coefficients of earnings and lagged dividends were significant at the 1% level in
all years, whereas investment and financing proxies were insignificant in both OLS and
2SLS results.
Consistent with Lintner’s findings, the study reveals
that dividend decisions of French firms are well-
described by earnings and lagged dividends as in the
Lintner basic model since investment and financing
variables were insignificant in the dividend equation.
Chateau
(1979)
Testing Lintner’s partial
adjustment model by
using alternative
econometric procedures
Data sample:
Canada, 40 large manufacturing firms for the period 1947-1970.
Methodology:
OLS, OLS corrected Hildreth-Lu, instrumental variables, quasi-generalised least squares,
augmented least squares and maximum likelihood estimator.
Model and findings:
Lintner’s partial adjustment model with and without the constant.
Constant term retention or removal does not seem to affect the econometric fit of the
predictive power of the model. Among the estimation procedures, ordinary and augmented
least squares seem to provide more reliable estimates for the partial adjustment model.
Provide support to the partial adjustment model.
Canadian large manufacturing firms follow stable
dividend policies. Especially, they are relatively
more conservative compared to US firms when it
comes to short-term dividend strategies even though
they have a higher average payout ratio.
Dewenter and
Warther(1998)
Comparing dividend
policies of US and
Japanese firms to
earnings changes by
using the Lintner
model.
Data sample:
313 US firms listed on the S&P 500 and 180 Japanese firms listed on the Morgan Stanley
Capital International Index during the period 1983-1992.
Methodology:
OLS regression, Wilcoxon rank-sum test and logit regression.
Model and findings:
Lintner’s partial adjustment model without the constant.
Running the model on US and Japanese samples as well as sub-samples of Japanese firms.
The median speed of adjustment estimates are 0.055 for all US firms, 0.094 for all Japanese
firms, and 0.117, 0.082 and 0.021 for keiretsu, hybrid and independent firms respectively.
The notion of Lintner’s speed of adjustment in
terms of dividend signalling explanation is supported.
US dividends are smoother than Japanese
dividends and Japanese firms cut dividends in
response to poor performance more quickly than US
firms.
Japanese keiretsu-member firms adjust dividends
more quickly than both US and Japanese independent
firms since they are subject to less information
asymmetry and fewer agency conflicts than US firms.
Birkbeck University of London Page 122
Table 2.2 Studies of the Partial Adjustment Model in Developed Markets (continues) Researcher(s) Aim of the study Methodology (data sample and model) and main findings of the study Hypotheses consistent with results
Baker, Powell
and Veit
(2002)
Investigating the
relationship between
dividend policy and
share value and four
common theories for
paying dividends: the
signalling, tax-
preference, agency cost
and bird-in-the-hand
theories.
Data sample:
US, 188 usable responses from cash dividend-paying NASDAQ firms in 1999, with a 29.8 %
response rate.
Methodology:
Postal survey.
Five-point equal interval scale.
T-tests and chi-square difference tests.
Strongly consistent with Lintner’s findings;
dividend-paying NASDAQ firms set their
dividend policy in line with Lintner’s explanation
and emphasise dividend continuity.
Optimal dividend policy maximises stock prices.
Strong support for the signalling explanation
whereas little or no support for the tax-preference,
agency cost and the bird-in-the-hand theories.
Brav,
Graham,
Harvey and
Michaely
(2005)
Determining the factors
influencing dividend
policy and share
repurchases decisions at
the beginning of 21st
century.
Data Sample:
US, (i) 384 usable responses from US firms in 2002, with a 16 % response rate. Also,
separately conducted 23 in-depth interviews. (ii) A sample of US firms matched to the survey
respondents for three distinct sub-periods for regression tests; 89 firms in the first sub-period
of 1950-1964, 244 firms in the second period 1965-1983, and 233 firms in the third time-
interval of 1984-2002.
Methodology:
Postal survey.
In-depth interviews.
Five-point interval scale and t-tests.
Regression tests.
Model and findings:
Regression-based evidence by using Lintner’s the partial adjustment model.
Results for the matched sample for the chosen sub-periods.
hence, managers are reluctant to cut dividends and
the current level of dividend payments is taken as
given unless adverse circumstances are likely to
persist.
Results indicated two important changes regarding
Lintner’s findings. First, firms target the dividend
payout ratio less than they used to, and they do not
correct their target ratio as fast as they used to (in
other words, more smoothing through time).
Second, managers favour share repurchases, which
are now an important way of payout and provides
greater flexibility, compared to dividend payments.
Hence, this is one of the main reasons why
repurchases have increased.
Birkbeck University of London Page 123
Table 2.3 Studies of the Information Content of Dividends Hypothesis in Developed Markets Researcher(s) Aim of the study Methodology (data sample and model) and main findings of the study Hypotheses consistent with results
Aharony and
Swary (1980)
Investigating whether
quarterly dividend
announcements provide
information beyond that
already provided by
quarterly earnings
numbers.
Data sample:
US, 149 NYSE industrial firms during 1963-1976, including 2,612 quarterly dividend
announcements that follow and 782 that precede quarterly earnings announcements.
Methodology:
Dividing the sample into sub-groups by using the dividend expectation model.
Estimating the daily average (AR) and cumulative daily average (CAR) abnormal returns of
securities in twenty days surrounding the dividend announcement days.
Mean comparison t-tests.
Model and findings:
Most of the statistically significant abnormal returns occurred during the dividend
declaration date (AD-1) and the dividend announcement date (AD); in other words, two
days excess return.
Two-day excess returns:
When earnings announcements precede or follow dividends
- For dividend increases: +0.72 %and +1.03 percent, respectively.
- For dividend decreases: -3.76 and -2.82 percent, respectively.
Capital market reacts to dividend announcement as
strongly in line with the information content of
dividends hypothesis.
Changes in quarterly cash dividends do convey
information about future prospect of a firm, beyond
that already provided by quarterly earnings
numbers.
Market reactions to dividend decreases are much
greater in magnitude than dividend increases.
Healy and
Palepu (1988)
Examining whether
dividend policy
changes, particularly
initiations and
omissions, convey
information about
future earnings.
Data sample:
US, 131 NYSE/AMEX firms that initiated dividends and 172 NYSE/AMEX firms that omited
dividends during the period 1969-1980.
Methodology:
t-test of mean abnormal returns for the period 60 days prior to 20 days after the
announcements of dividend initiations and omissions.
t-test and Wilcoxon test of mean and median earnings changes for the 5 years before, the
year of and 4 years after the dividend policy changes.
Cross-sectional regressions.
Model and findings:
The mean two-day announcements return (days -1 and 0) for the initiation firm is +3.9
percent and for the omitting firm is -9.5 percent, both significant at the 1 % level.
Initiating firms have positive earnings changes for up to 5 years before and in the year of
the dividend announcements, whereas omitting firms have negative earnings changes for
up to 2 years before and in the year of the dividend event.
β2 prior earnings change + β3 cumulative market-adjusted return from day following
earnings announcement for year -1 to 2 days before the dividend announcements.
Consistent with the hypothesis that dividend
initiations and omissions appear to convey
incremental information about firm’s future
performance.
Significant earnings changes for as many as 5 years
prior to dividend initiations, whereas significant
earnings decreases for 2 years prior to dividend
omissions.
Dividend initiating firms have earnings increases
for the year of and 2 years following initiation
events and these increases tend to be permanent.
Dividend omitting firms have earnings decreases
for 2 years prior and in the year of the
announcements. Then they experience a recovery
in following years.
Birkbeck University of London Page 124
Table 2.3 Studies of the Information Content of Dividends Hypothesis in Developed Markets (continues) Researcher(s) Aim of the study Methodology (data sample and model) and main findings of the study Hypotheses consistent with results
Michaely,
Thaler and
Womack
(1995)
Investigating both the
short-term and long-
term effects of dividend
initiation and omission
announcements.
Data sample:
US, 561 cash dividend initiations and 887 cash dividend omissions of NYSE/AMEX firms
over a 25-year period, 1964-1988.
Methodology:
Mean comparison t-tests.
Model and findings:
Short-run reactions:
For the initiation sample: Average excess return in the prior year is 15.1% and during the
three-day (from the day before the event to the day after) announcement period, the initiating
firms experience a significant additional excess return of 3.4%.
For the omitting sample: Average excess return in the prior year is -31.8% and during the
three-day announcement period, omitting firms experience a significant additional excess
return of -7.0%.
Long-term reactions:
For the initiation sample: The first year excess return following the announcements is 7.5%
and the following three-year excess return is 24.8%.
For the omitting sample: The first year excess return following the announcements is -11% and
the following three-year excess return is -15.3%.
Consistent with Healy and Palepu’s (1988)
findings that dividend initiations and omissions
signal information about firm’s future
performance.
Omission announcements are associated with a
mean price drop of about 7%, while initiations are
associated with a mean price increase of about 3%
in the short-run. Further, regarding long-term drifts
following the dividend events, the omissions
involved with negative excess returns, whereas
initiations involved with positive excess returns.
Also, these drift patterns seem consistent through
time as the study examines these events over the
25-year period.
Benartzi,
Michaely and
Thaler (1997)
Testing whether
changes in dividends
signal information
about the pattern of
future earnings.
Data sample:
US, 1,025 NYSE/AMEX firms with 7,186 firm-year observations during 1979-1991.
Methodology:
Categorical analysis: The sample divided into 7 groups according to changes in dividends
and then unexpected earnings changes of each group were compared for up to two years
from the year of dividend change announcements.
Two tailed t-tests.
Model and findings:
The study findings showed a strong relationship between dividend changes and earning
changes in a given year (year 0). However, regarding the following years of the dividend
change announcements, none of the dividend increasing groups had significantly faster
earnings growth than the no-change group, nor does the largest increase group grew faster than
the smallest dividend increasing group. Dividend decreasing firms presented even more bizarre
earnings in following years as they were significantly positive and much greater those of the
no-change firms.
Inconsistent with the hypothesis that dividend
changes have information about the future earnings
changes.
Instead, the study results suggest that there is a
strong past and current link between earnings and
dividend changes.
Birkbeck University of London Page 125
Table 2.3 Studies of the Information Content of Dividends Hypothesis in Developed Markets (continues) Researcher(s) Aim of the study Methodology (data sample and model) and main findings of the study Hypotheses consistent with results
Jensen and
Johnson
(1995)
Examining dividend
drop announcements in
order to assess real
motivation for the
dividend decreases by
studying firm-specific
financial characteristics
both before and after
the dividend drop
announcements.
Data sample:
US, 268 observations of 218 decreases and 50 omissions (by at least 20% in magnitude) from 242
different NYSE/AMEX firms during the period of 1974-1989.
Methodology:
Changes in firm-specific financial data in the three years before, the year of and two years
following a dividend decline were analysed.
21 financial variables were examined for each firm and these variables were grouped into 6
major categories: performance, cost structure, financial condition, financing, restructuring and
discretionary.
The median values for each variable was examined over the 6-year period relative to itself
(unadjusted) and relative to its industry (adjusted).
Graphical representations and Wilcoxon signed ranks test were employed.
Model and findings:
The results spotted a decline in earnings before the dividend drop and an increase afterwards.
Stock prices showed a similar pattern but the rebound in stock prices after the dividend drop was
not significant.
Dividend cuts lead to improvement in liquidity position and to reduction in the levels of debt.
Also, dividend decreasing firms tend to sell more fixed-assets, purchase fewer fixed-assets,
spend less on R&D and reduce employees at a faster pace to sort out their lingering financial
problems.
The evidence was in line with the view that
dividend drop announcements do not
necessarily signal a decline in earnings. In other
words, inconsistent with the information
content hypothesis of dividends. Rather, these
dividend cuts tend to signal the beginning of
restructuring activities and a turn around in
financial decline.
Akhigbe and
Madura
(1996)
Investigating the
dividend signalling
hypothesis for the long-
term performance of
corporations following
dividend initiation and
omission
announcements.
Data sample:
US, 128 dividend initiations and 299 dividend omissions during the period 1972-1990.
Methodology:
t-tests to examine the significance of average monthly abnormal price returns following
dividend announcements from month t+1 to month t+36 for both initiations and omissions.
Cross-sectional regression by using weighted least squares.
Model and findings:
Dividend initiations:
Long term abnormal return = 1.0069 + 0.1078 magnitude of dividend change – 0.0872 size** –
***, ** and * indicate significance at the 1%, 5% and 10% levels, respectively.
Birkbeck University of London Page 126
Table 2.3 Studies of the Information Content of Dividends Hypothesis in Developed Markets (continues) Researcher(s) Aim of the study Methodology (data sample and model) and main findings of the study Hypotheses consistent with results
DeAngelo,
DeAngelo and
Skinner
(1996)
Investigating whether
firms use dividends to
signal their views of
future earnings
prospects by focusing
on firms whose annual
earnings suddenly
declined after a long
term of a stable growth.
Data sample:
US, 145 NYSE firms having decline in annual earnings during the period 1980-1987 after a steady
earnings growth over at least nine or more years, including 99 of them increasing dividends, 44 no-
change and 2 reducing dividends.
Methodology:
Mean comparison t-tests and Wilcoxon tests.
The random walk and growth-adjustment models to estimate abnormal future earnings.
Cross-sectional regression.
Model and findings:
Both parametric and non-parametric tests showed no indication of positive earnings surprises for
dividend-increasing firms. The random walk estimates suggested that firms-increasing dividends
had earnings in year 1 to 3 that did not differ significantly from year 0 earnings. The growth-
adjusted estimates showed dividend increasing firms even had reliably negative earnings surprises
► Dividend signal variable was measured in 4 different ways and based on the different
specifications of this variable, 4 regressions were run. However, in all regressions, the coefficients
of dividend signalling variables were close to zero and not significant.
Inconsistent with the information content
hypothesis. Dividend increases are not a
reliable indicator for improved future
earnings performance.
Emphasising two possible ways to explain
inconsistent findings on dividend signalling:
1. Managers may suffer from behaviour
bias as they tend to convey over-
optimistic signals naively or deliberately.
2. The cash commitments to dividend
increases are relatively small. Thus, the
small amount of the incremental cash
payout conveys misleading signals.
Lipson,
Maquieira and
Megginson
(1998)
Examining whether
dividend initiations are
associated with
favourable subsequent
earnings surprises by
using the methodology
of DeAngelo et al.
(1996).
Data sample:
US, 99 newly public firms those initiating dividends and a matched sample of non-initiating firms as
well as 99 size-matched firms those are already paying dividends in the same industry during the
period 1980-1986.
Methodology:
Comparison analysis by using Wilcoxon test.
The random walk, the growth-adjustment and the growth-in-sales models to estimate abnormal
earnings returns.
Comparing dividend commitment of initiating firms with the corresponding resource commitment
of non-initiating firms if they were to introduce similar dividends.
Model and findings:
Earnings surprises are more favourable for the dividend initiating firms.
Cash dividend payments of the initiating firms were, on average, about 5% of earnings. If non-
initiating firms paid similar dividends as initiating firms, their cash dividend payments would be
8.5% of earnings, which was also larger than the 3.5% level of dividend increase as a percentage
of earnings found by DeAngelo et al (1996).
Consistent with the dividend signalling
hypothesis that dividend-initiating firms use
dividends to distinguish themselves from
other newly listed public firms in the same
industry and in contrast with DeAngelo et al.
(1996).
If non-initiating firms were to pay dividends
at the same level of dividends as initiating
firms, they would have paid higher
dividends, which suggesting that firms do not
initiate dividends until they believe those
dividends can be sustained by future
earnings.
Birkbeck University of London Page 127
Table 2.4 Studies of the Cost Minimisation Model in Developed Markets Researcher(s) Aim of the study Methodology (data sample and model) and main findings of the study Hypotheses consistent with results
Rozeff (1982)
Developing and testing
the cost minimisation
model of dividends.
Data sample:
US, 1000 firms over a seven-year period 1974-1980, including 64 different industries.
Methodology:
Ordinary least squares (OLS) cross sectional regression.
Model and findings:
Payout ratio = 47.81 – 0.09 Percentage of stock owned by insiders – 0.321 Average past growth
rate of revenues – 0.526 forecasted average growth rate of revenues – 26.543 Firm’s beta +
2.584 Log of number of common stockholders.
All coefficients are statistically significant.
Adjusted R2 = 48%
Consistent with the agency cost perspective of
dividend policy and the cost minimisation
model. Optimal dividend payments have the
benefit of reducing equity agency costs as well
as balancing against an increase in transaction
costs.
Lloyd, Jahera
and Page
(1985)
Expanding the cost
minimisation model by
including size as an
explanatory variable
and testing if the model
still holds credibility.
Data sample:
US, 957 firms in 1984.
Methodology:
OLS cross sectional regression.
Model and findings:
Payout ratio = 0.52 – 0.093 residuals from regression of percentage of insider stock ownership
on size – 0.564 past growth – 0.216 forecasted growth – 0.184 beta + 0.025 residuals from
regression of log number of common stockholders on size + 0.016 log of sales.
All coefficients are statistically significant at least at the 5% level.
beta*** + 0.05519 log of common stockholders*** – 0.00149 CEO ownership*** + 0.00005
squared CEO ownership**
Adjusted R2 = 49.8%
Consistent with the cost minimisation model of
dividends. However, the relationship between
dividends and insider ownership is parabolic,
rather than monotonic as reported in the
original model. Also, the critical entrenchment
level was found in the region of 14.9 %, where
the coefficient of CEO ownership changes from
negative to positive.
***, ** and * indicate significance at the 1%, 5% and 10% levels, respectively.
Birkbeck University of London Page 128
Table 2.4 Studies of the Cost Minimisation Model in Developed Markets (continues) Researcher(s) Aim of the study Methodology (data sample and model) and main findings of the study Hypotheses consistent with results
Moh’d, Perry
and Rimbey
(1995)
Testing a dynamic
modification of the cost
minimisation model.
Data sample:
US, 341 firms over 18 years from 1972 to 1989.
Methodology:
Panel data and time-series cross sectional analysis by using weighted least squares.
Model and findings:
Payout ratio = 13.533 + 0.465 lagged payout ratio*** + 0.013 past growth – 0.473 forecasted
growth*** + 0.310 size (log of sales) – 1.868 intrinsic business risk*** – 16.266 operating
***, ** and * indicate significance at the 1%, 5% and 10% levels, respectively.
Birkbeck University of London Page 130
Table 2.5 Studies of the Capital Market Monitoring Hypothesis in Developed Markets (continues) Researcher(s) Aim of the study Methodology (data sample and model) and main findings of the study Hypotheses consistent with results
Hansen,
Kumar and
Shome (1994)
Testing the relevance of
monitoring hypothesis
for explaining the
dividend policies of
regulated electric
utilities.
Data sample:
US, all S&P 400 industrial firms during two 5-year periods; 1981-1985 and 1986-1990 for
comparison analysis.
US, 81 electric utility firms from 1981 to 1985 and 70 electric utility firms from 1986-1990 for
regression analysis.
Methodology:
Mean comparison t-test, panel data and OLS cross sectional regression.
Model and findings:
Comparison analysis of mean payout ratios:
Period Electric utility firms S&P industrial firms Difference
***, ** and * indicate significance at the 1%, 5% and 10% levels, respectively.
Birkbeck University of London Page 132
Table 2.6 Studies of the Free Cash Flow Hypothesis in Developed Markets (continues) Researcher(s) Aim of the study Methodology (data sample and model) and main findings of the study Hypotheses consistent with results
Agrawal and
Jayaraman
(1994)
Examining whether
dividends reduce the
opportunity for
managers to use free
cash flows and
investigating the
interactions of dividend
policy, leverage and
managerial ownership.
Data sample:
US, 71 industry-sized matched pairs of all-equity and levered firms during 1979-1983.
Methodology:
Comparison analyses by using two-tailed t-tests and Wilcoxon signed-ranks, and OLS regressions.
Model and findings:
Comparison analyses for payout ratio and dividend yield for all-equity and levered firms:
Mean Median . All-equity Levered t-statistic All-equity Levered Wilcoxon probability Dividend per share: 0.325 0.188 3.20
High growth firms (N=65): Two-day excess return = – 0.0018 + 0.0145 payout ratio
►Adj. R2 = - 1.26%
.
Consistent with the hypothesis that debt
and dividends are substitutes in order to
reduce agency cost of free cash flows.
The results support that the substitution
effect between debt and dividends are only
significant for low growth firms; hence, in
line with Jensen’s (1986) argument that
low growth firms are likely to have greater
agency cost problems of free cash flows.
***, ** and * indicate significance at the 1%, 5% and 10% levels, respectively.
Birkbeck University of London Page 133
Table 2.7 Studies of the Shareholders-Bondholders Conflict in Developed Markets
Researcher(s) Aim of the study Methodology (data sample and model) and main findings of the study Hypotheses consistent with results
Woolridge
(1983)
Analysing the effects of
unexpected dividends
changes on the values
of common stock,
preferred stock and
straight bonds with
regard to the wealth
transfer and information
content hypotheses.
Data sample:
US, 317 positive and 50 negative unexpected dividend changes of NYSE firms from 1971 to 1977.
Methodology:
Event study, Comparison Period Return Approach (CPRA) and t-tests.
Model and findings:
Mean daily returns (MDRs):
For unexpected dividend increases:
Common stock ( n=317) Preferred stock (n=125) Straight bonds (n=248)
Observation period 0.66% 0.56% 0.10%
Comparison period 0.07% 0.27% 0.00%
Difference (t-statistic) 7.71** 4.49 ** 1.36 *
For unexpected dividend decreases:
Common stock ( n=50) Preferred stock (n=26) Straight bonds (n=45)
Observation period -2.38% -0.38% -0.66%
Comparison period 0.01% 0.05% -0.11%
Difference (t-statistic) -9.19 ** -0.95 -2.53**
Positive (negative) dividend change
announcements produce positive (negative)
common stock returns; hence, this is consistent
with both signalling and wealth transfer
hypothesis. Further, unexpected dividend
increases (decreases) are associated with
positive (negative) straight debt and preferred
stock returns. Overall, these results present that
signalling is the predominant effect influencing
security prices around dividend change
announcements. However, the wealth transfer
hypothesis cannot still be ruled out completely.
Jayaraman
and Shastri
(1988)
Testing the wealth
transfer and the
signalling hypotheses
by examining the
valuation impacts of
specially designated
dividends (SDDs)
announcements on
stock and bonds prices.
Data sample:
US, Stock sample: 2,023 SDD announcements of 660 NYSE/AMEX firms from 1962 to 1982.
Bond sample: 154 straight bonds of 63 NYSE/AMEX firms from 1962 to 1982.
Methodology:
Event study, Central Limit Theorem.
Model and findings:
Daily average excess returns of stocks for the three days around SDD announcements:
Sample Event days Average Excess Return (%)
Full Stock Sample (n=2,023) -1, 0, +1 1.629**
Stock sample Corresponding to
Bond sample (n=150) -1, 0, +1 1.517**
Daily average excess premium returns of bond around SDD announcements
-1 - 0.022 (Not significant)
Full Bond Sample (n=154) 0 - 0.020 (Not significant)
+1 - 0.017 (Not significant)
Stock price reactions to SDDs are positive and
significant; hence, this is consistent with both
the signalling and wealth transfer hypothesis.
However, further analysis reveals that bond
prices remain unaffected by SDDs
announcements. Consequently, these results
suggest the signalling hypothesis is the
predominant effect and provide no support for
the wealth transfer hypothesis.
***, ** and * indicate significance at the 1%, 5% and 10% levels, respectively.
Birkbeck University of London Page 134
Table 2.7 Studies of the Shareholders-Bondholders Conflict of Agency Cost in Developed Markets (continues) Researcher(s) Aim of the study Methodology (data sample and model) and main findings of the study Hypotheses consistent with results
Dhillon and
Johnson
(1994)
Testing stock and bond
price reactions to
dividend changes in an
effort to examine the
wealth transfer and the
signalling hypotheses.
Data sample:
US, 131 dividend change announcements, including 61 increases and 70 decreases from
NYSE/AMEX firms during the period 1970-1987.
Methodology:
Event study, the mean-adjusted returns methodology, comparison t-test.
Model and findings:
Standardised daily mean excess two-day returns:
For dividend increases
Sample: Stocks Bonds Sample size
1. Total sample 0.98** -0.37 61
1a. Initiations 0.28 -0.49 15
1b. Large increases (>30%) 1.21** -0.33 46
For dividend decreases
2. Total sample -2.01** 0.69** 70
2a. Omissions -1.09** 0.84 19
2b. Large decreases (>30%) -2.70** 0.81** 43
2c. Small decreases -0.54 -0.01 8
The study results provide supports for the
wealth transfer hypothesis over the information
content hypothesis since the findings showed
that bond price reactions to announcements of
large dividend changes are opposite to the stock
price reactions. However, the evidence cannot
rule out the information content hypothesis
completely.
Long, Malitz
and Sefcik
(1994)
Investigating whether
firms attempt to
expropriate
bondholders’ wealth by
focusing on the
underinvestment
problem and the use of
dividend policy to
expropriate lenders’
wealth.
Data sample:
US, 141 straight debt and 78 convertible debt issues of NYSE firms from 1964 to 1977.
Methodology:
Event study, comparison t-test.
Model and findings:
Average proportion of firms that increase and decrease dividends following debt issue. Years after Issue .
Straight debt (n=141) Year1 Year2 Year3 Year4 Average
Percentage of increases 56.0% 49.6% 59.6% 57.4% 55.7%
Percentage of decreases 7.1% 11.3% 9.2% 11.3% 9.8%
Convertible debt (n=78)
Percentage of increases 44.2% 44.2% 36.4% 41.6% 41.6%
Percentage of decreases 12.8% 20.8% 18.2% 18.2% 17.5%
t-statistic, differences of % of increases 1.67* 0.76 3.28
*** 2.23**
1.99**
t-statistic, differences of % of decreases 1.39 1.89* 1.93
* 1.4 1.65*
Average proportion of firms that increase and decrease dividends following debt issue.
Average number of decreases 9.8% 17.5% 11.0% t-statistic on difference with market -0.44 1.78
*
First, the results provided little support for the
wealth transfer hypothesis but further analysis
of the dividend growth rates of firms issuing
debt comparing with the benchmark NYSE
index, showed that no systematic differences in
dividend growth rates between the two samples
or the benchmark NYSE. Therefore, these
findings suggest no evidence that firms
manipulate dividend policy to expropriate
wealth from new bondholders to shareholders.
Despite dividends do increase following the
issue of debt, the increases are in line with the
market as a whole in terms of both timing and
relative magnitude.
***, ** and * indicate significance at the 1%, 5% and 10% levels, respectively.
Birkbeck University of London Page 135
Table 2.8 Studies of the Dividend Yield and Risk-Adjusted Return in Developed Markets
Researcher(s) Aim of the study Methodology (data sample and model) and main findings of the study Hypotheses consistent with results
Black and
Sholes (1974)
Examining the effect of
dividend yield on the
risk-adjusted returns
before and after taxes.
Data sample:
US, 25 investment portfolios from common stocks listed on the NYSE over the period 1936-1966.
Methodology:
Cross-sectional and pooled time-series regressions.
Model and findings:
A modified version of Brennan’s (1970) CAPM model by adding a dividend payout term.
A long-run estimate of dividend yield was employed.
Portfolio method (grouped data) was used.
►Results showed that the dividend yield coefficient was not significantly different from zero
either for the entire time period or for any of the ten-year sub-periods. In other words, the
expected returns on high-yield dividend stocks were not significantly different than the expected
returns on low-yielded stocks either before or after taxes, other things being equal.
Inconsistent with Brennan’s (1970) after-
tax CAPM model, stating that there is no
evidence of tax effect on dividends.
Provided support for the tax clientele
hypothesis, suggesting that investors
should ignore dividends when shaping their
portfolios.
Litzenberger
and
Ramaswamy
(1979)
Examining the effect of
dividend yield on the
risk-adjusted expected
returns during both the
ex-months and the non
ex-months.
Data sample:
US, all common NYSE stocks from 1936 to 1977.
Methodology:
Cross-sectional regression; OLS, GLE and MLE.
Model and findings:
An extended Brennan’s (1970) CAPM model.
A monthly dividend yield definition was employed instead of long-run definition.
Individual data was used instead of grouped data.
►Results revealed that the dividend yield coefficient was positive and statistically significant.
Hence, the dividend yield coefficient of 0.236 indicated that for every unit of increase in dividend
yield requires about an extra 23 percent in before tax expected returns.
There is a strong positive correlation
between before tax expected returns and
dividend yields of common stocks, and the
positive dividend yield coefficient is the
evidence of a dividend tax effect.
Consistent with Brennan’s (1970) after-tax
CAPM model, stating that investors dislike
cash dividends and require compensation
to receive them.
Miller and
Scholes
(1982)
Re-examining
Litzenberger and
Ramaswamy’s (1979)
study by attempting to
correct for the possible
information bias.
Data sample:
US, all common NYSE stocks from 1940 to 1978.
Methodology:
Cross-sectional and time-series regressions.
Model and findings:
Litzenberger and Ramaswamy’s (1979) tests.
A possible information-bias free dividend yield definition was employed.
Individual data was used instead of grouped data.
► Results showed that the dividend yield coefficient was insignificant.
Inconsistent with the tax effect hypothesis and
they also argued that Litzenberger and
Ramaswamy’s findings related to information
effect, rather than the tax effect.
Birkbeck University of London Page 136
Table 2.8 Studies of the Relationship between Dividend Yield and Risk-Adjusted Return in Developed Markets (continues) Researcher(s) Aim of the study Methodology (data sample and model) and main findings of the study Hypotheses consistent with results
Litzenberger
and
Ramaswamy
(1982)
Re-examining
Litzenberger and
Ramaswamy’s (1979)
study by using an
information-free
expected short-term
dividend yield.
Data sample:
US, all common NYSE stocks from 1936 to 1977 but this time, the sample contained only stocks
those declared dividends in month t-1 and distributed in month t, or stocks those delivered dividends
in month t-1 and thus were not likely to pay dividends again in month t.
Methodology:
Cross-sectional regression; OLS, GLS and MLE.
Model and findings:
An extended Brennan’s (1970) CAPM model.
An information-free expected short-term dividend yield.
Individual data was used instead of grouped data. ► After using information-free sample and short-term dividend yield, results still showed a
significant and positive dividend yield coefficient.
Results still provided evidence that strongly
supports the tax-effect hypothesis.
Blume (1980)
Re-examining the
relationship between
dividend policy and
total returns on a risk-
adjusted basis by
extending the Black and
Scholes (1974)
experiment.
Data sample:
US, all common NYSE stocks from 1936 to 1976.
Methodology:
Cross-sectional regression, mean square error criterion.
Model and findings:
The Black and Scholes (1974) experiment.
A quarterly dividend yield definition was employed.
Portfolio method was used.
► Results showed a positive and significant relation, on average, between the quarterly realised rate
of returns and both the beta coefficient and the anticipated quarterly dividend yields. However, the
significance of the dividend yield varied over time.
► Most strikingly, over the entire period examined, the average quarterly returns on non-dividend
paying stocks for a given beta exceeded the quarterly returns on most dividend-paying stocks.
Consistent with the tax effect hypothesis since
results revealed a positive and significant
dividend yield coefficient. Nevertheless, the
significance of the dividend yield variable
varied over time and also the returns on non-
dividend paying stocks tended to exceed, on
average, the returns of most dividend paying
stocks over 41 years to 1976, which is totally
inconsistent with the tax effect hypothesis.
Therefore, it is concluded that the relation
across stocks is far too complicated to be
entirely explained by tax effect.
Poterba and
Summers
(1984)
Investigating the
relationship between
dividends and stock
price movements
through different tax
regimes.
Data sample:
UK, 3,500 British companies for a 26-year period during the period 1955-1981.
Methodology:
GLS regression.
Model and findings:
The after-tax CAPM described by Litzenberger and Ramaswamy (1979).
Using monthly data.
Using different tax regimes, Regime I: No capital gains tax
Regime II: Introduction of capital gains tax
Regime III: Introduction of imputation system for dividends ► Results showed that the estimated tax penalty on dividends declined from 74 to 45 percent
between Regime II and Regime III, while the evidence on changes between Regime I and Regime II
was less clear.
Despite the estimated tax rates were so high due
to information effects or the possibility of
miscalculating of risk, the findings suggested
the importance of taxes in determining the
relationship between dividend yields and stock
returns.
Consistent with the tax effect hypothesis; the
valuation of dividends changes across tax
regimes provided strong evidence that taxes
explain part of the positive relationship between
yields and stock market returns.
Birkbeck University of London Page 137
Table 2.8 Studies of the Relationship between Dividend Yield and Risk-Adjusted Return in Developed Markets (continues) Researcher(s) Aim of the study Methodology (data sample and model) and main findings of the study Hypotheses consistent with results
Keim (1985)
Investigating the
relationship between
stock returns and long-
run dividend yields by
using CAPM.
Data sample:
US, a sample range from 429 NYSE firms in Jan 1931 to 1,289 NYSE firms in Dec 1978.
Methodology:
Cross-sectional and time-series regressions.
Model and findings:
The CAPM model.
A long-run dividend yield definition was employed.
Portfolio method was used.
► The average returns of the dividend yield portfolios were non-linearly related with average
yields. Further, an inverse relationship was found between positive yield and firm size.
► Much of the relation between yields and stock returns was due to a significant non-linear
relation between dividend yields and returns in the month of January (seasonality).
Results showed evidence of a yield-tax effect
but because of the significant effect of the
month of January, in other words the effect of
seasonality, on the relation between dividend
yield and stock returns, these results were not
entirely consistent with the tax effect
hypothesis.
Kalay and
Michaely
(2000)
Performing the
Litzenberger and
Ramaswamy (1979)
experiment by using
weekly data
Data sample:
US, all common NYSE stocks that had a data for at least 260 weeks during the period 1962-1986.
Methodology:
OLS, GLS and MLE.
Model and findings:
1. Litzenberger and Ramaswamy’s (1979) tests by using weekly data.
2. Litzenberger and Ramaswamy’s tests by using weekly data but with a long-run definition
of dividend yield.
► Using weekly data, the Litzenberger and Ramaswamy experiment resulted in a significant
and positive dividend yield coefficient but with a long-run definition of yield, the results showed
an insignificant coefficient, which was the evidence of time-series return-variation.
Results indicated that stocks experience only
time-series return variations and did not find
cross-sectional return variations, meaning
that the long-run risk adjusted returns are not
related with dividend yield. Therefore, the
findings are inconsistent with Brennan’s and
Litzenberger and Ramaswamy’s models.
However, the results are not completely
inconsistent with the tax hypothesis and it
could be that these empirical findings are in
some ways related to a more complex tax
effect theory, which is yet to be developed.
Birkbeck University of London Page 138
Table 2.9 Studies of the Ex-Dividend Day Share Price Behaviour in Developed Markets
Researcher(s) Aim of the study Methodology (data sample and model) and main findings of the study Hypotheses consistent with results
Elton and
Gruber (1970)
Investigating the
relationship between
marginal tax rates of the
marginal shareholders
and dividends by
examining the ex-
dividend share price
behaviour.
Data sample:
US, 4,148 observations from the NYSE shares that paid dividends between April 1, 1966 and March 31, 1967.
Methodology:
Event study around the ex-dividend days, Central Limit Theorem, Spearman’s Rank test.
Model and findings:
(PX ‒ PZ ) / D = (1- tD )/(1- tC); the ratio of price change on ex-days to nominal dividend amount should
reflect the marginal tax rates of marginal shareholders.
Ranking the sample based on the dividend yield from lowest to highest into 10 deciles as well as calculating
the implied tax brackets associated with each decile, hypothesising that there is a negative relationship
between investors’ tax brackets and dividend yield.
Repeating the same procedure based on the payout ratio.
► Results showed that the ex-dividend price drop was smaller than the dividend per share.
► The average share price decline was 77.67% and the marginal tax bracket for the average shareholders was
36.4%.
► The implied tax brackets were significantly and negatively related to the dividend yield.
Consistent with the tax effect hypothesis
that shareholders in a higher tax brackets
have a tax-induced preference for capital
gains over dividend income comparing to
those in lower tax brackets.
Consistent with the tax clientele effect as
well, suggesting that a change in dividend
policy could cause a costly change in
shareholders wealth, rather than dividend
policy itself.
.
Kalay (1982a)
Re-examining the
documented empirical
evidence of the ex-
dividend day behaviour
of stock prices in terms
of the short-term
trading hypothesis.
Data sample:
US, a sample of NYSE firms of 2,540 cash dividends paid between April 1, 1966 and March 31, 1967.
Methodology:
Event study, Spearman Rank Correlation.
Model and findings:
(PX ‒ PZ )/D =1; the arbitrage would ensure that the price drop is equal to dividend in the absence of risk
and transaction costs. However, transaction costs are unavoidable for the arbitrager’s trade, then (PX ‒ PZ)/D
will take any value within the bounds that are implied by arbitragers, which would range around 1.
In the presence of short-term traders, in other words arbitragers, the marginal tax rates of the shareholders
cannot be inferred by observing ex-dividend price drops - (PX ‒ PZ )/D.
► Results showed that lower ex-dividend day price drop than the dividend per share and higher relative drop
for high-yield stocks, suggesting that an ex-day share price drop less than the dividend per share provides
profit opportunities for the short-term traders.
The marginal tax rates of shareholders
cannot be inferred, in general, from the
relative price drop. Hence, this evidence
was not necessarily consistent with the tax
effect or the tax clientele effect.
Nevertheless, the evidence was still
consistent with the hypothesis that, on
average, the investors involving the trading
population pay higher taxes on dividends
rather than on capital gains. This evidence
captures the effects of both the short-term
traders and the tax rates of the trading
population.
Michaely
(1991)
Analysing the
behaviour of share
prices around ex-
dividend days through a
change in the tax law.
Data sample:
US, all firms listed on NYSE, which paid dividends during the period 1986-1989, containing 4,306 events in
1986; 4,499 events in 1987; 4,785 events in 1988 and 4,799 events in 1989.
Methodology:
Event study, OLS and Fisher sign tests.
Model and findings:
By using OLS market model, then mean ex-day premiums for the 50 days surrounding the ex-day (-25 to
+25) for 1986, 1987, 1988 and 1989 were calculated.
A change in the tax law, namely 1986 TRA in the US that significantly reduced the difference between the
taxes of realised capital gains and dividend income, was used to test the tax related hypotheses by comparing
the premiums before and after the implementation of the 1986 TRA.
The sample further was divided into deciles from lowest to highest according to dividend yield and
premiums were estimated for 1986 and 87 by using OLS market model. ►
The mean ex-dividend day premiums were insignificantly different from each other for before and after the
implementation of 1986 TRA.
The tax law change, which reduced the tax
difference between capital gains and
dividend income and then entirely
eliminated the differential, had no effect on
the ex-dividend share price behaviour.
Therefore, results were inconsistent with
the tax effect and the long-term trading
hypothesis.
On the other hand, results supported that
the activity of short-term traders and
corporate traders dominates the price
setting on the ex-day.
Birkbeck University of London Page 139
Table 2.9 Studies of the Ex-Dividend Day Share Price Behaviour in Developed Markets (continues) Researcher(s) Aim of the study Methodology (data sample and model) and main findings of the study Hypotheses consistent with results
Koski and
Scruggs
(1998)
Investigating whether
short-term trading
reduces or eliminates
the tax effect on ex-
dividend day prices by
analysing trading
volume around ex-
dividend days.
Data sample:
US, 70 ex-dividend day observations between Nov, 1990 and Jan, 1991 of NYSE stocks.
Methodology:
Event study, t-test and OLS regression.
Model and findings:
The abnormal trading volume around ex-days were calculated on an event window of 11 days
centred on the ex-dividend date (-5 < t < +5).
SAV = ß0 + ß1Yield + ß2Spread
Where, SAV is the standardised abnormal trading volume on the last cum-dividend day and is defined
as actual volume minus the average volume during normal trading period, standardised by the standard
deviation of the normal trading volume. Yield is the dividend yield where the price is the mean of
closing prices for share i over days -10 to -6 relative to ex-dividend Day 0. Spread is the proxy for
transaction costs and is estimated as the average of spreads for all bid and ask quotes for share i on the
cum-dividend day.
►Results of t-tests showed strong evidence that tax neutral security dealers execute in short-positions
dividend capture strategy to profit around ex-days.
SAV (Sales) = 1.296 + 70.596 Yield* - 64.504 Spread**
► Regression results showed that abnormal trading volumes around ex-days, for both buy and sell, is
positively related to dividend yield and negatively related to transaction costs.
Consistent with the short-term trading
hypothesis; tax-neutral dealers engage in
short-term trading for arbitrage profits, which
eliminates and is inconsistent with the tax
clientele hypothesis around ex-dividend days.
Kaplanis
(1986)
Examining share price
behaviour around ex-
days in the presence of
tax effect by estimating
directly the expected
fall-off implied in the
prices of options as
opposed to the actual
share price fall-off.
Data sample:
UK, 360 pairs of cum and ex-dividend closing offer prices of options written on 14 different British
firms from the LSE during 1979-1984 as well as the simultaneous underlying offer prices.
Methodology:
Event study, OLS, GLS and MLE.
Model and findings:
First, the implied expected fall-off was estimated by using cum and ex-dividend prices.
Then, the sample was ranked according to dividend yield and put into 3 groups from lowest to
highest to test if the fall-offs vary monotonically with the dividend yield.
Lastly, the actual market adjusted fall-offs and the estimates of the expected fall-offs were
compared.
► The results showed that the expected implicit fall-off around ex-dividend days in option prices was
about 55% of the dividend and significantly different from it. Also, the fall-off had a significant and
positive correlation with the dividend yield and the actual price drop was very similar to the implied
decline from option prices.
.
Since the average expected proportionate
fall-off was significantly lower than unity
and showed a positive relationship with the
dividend yield, the results were consistent
with the tax clientele hypothesis and
inconsistent with the short-term trading
hypothesis.
Thus, the usual assumption made in
valuing options on dividend paying shares,
that the decline is equal to the dividend, is
not realistic and would cause downward-
biased estimates of the option value.
***, ** and * indicate significance at the 1%, 5% and 10% levels, respectively.
Birkbeck University of London Page 140
Table 2.9 Studies of the Ex-Dividend Day Share Price Behaviour in Developed Markets (continues) Researcher(s) Aim of the study Methodology (data sample and model) and main findings of the study Hypotheses consistent with results
Lasfer (1995)
Investigating share
price behaviour around
the ex-dividend days
before and after the
implementation of the
1988 ICTA that
decreased considerably
the tax differential
between capital gains
and dividend income in
the UK.
Data sample:
UK, a total of 10,123 observations from British firms with 2,891 events in the pre-1988 and 7,232
events occurred in the post-1988 during the period April 6, 1985 – April 5, 1994.
Methodology:
Event study, t-test, Mann Whitney test and OLS regression.
Model and findings:
Ex-day returns were computed using the market model over the event window (-10, +10) relative
to ex-days.
To test for the potential short-term trading effects, the estimated ex-day returns were regressed on
the corresponding bid-ask and trading volume, which were both used as a proxy for transaction
costs.
►Results showed that in the pre-1988 period, ex-day returns were positive and significant, whereas in
the post-1988 period, ex-day returns were, in most cases, negative and insignificant.
►Also, ex-day returns were significantly related to dividend yield and to the length of the settlement
period but they were not influenced by the commonly used measures of transaction costs such as the
bid-ask spread and trading volume.
Consistent with the tax effect hypothesis,
suggesting that taxation significantly
affects ex-dividend day share price
behaviour in the UK.
Unlike the US market, ex-day returns were
not affected by short-term trading; thus,
inconsistent with the short-term trading
hypothesis. It might be that either the
institutional legislation was effective or the
UK market was efficient, and ex-day
returns and the tax credit were not high
enough to outweigh transaction costs.
Bell and
Jenkinson
(2002)
Analysing the
behaviour of share
prices around ex-days
before and after the
Finance Act 1997,
which was structured in
such a way that
immediate impact fell
almost entirely on the
largest investor class in
the UK, namely pension
funds.
Data sample:
UK, 9,673 ex-dividend day observations from 1,478 firms listed on the LSE during 30 days before and
after July 2, 1997.
Methodology:
Event study, OLS regression.
Model and findings:
Elton and Gruber (1970) model was used to examine ex-day price behaviour.
Estimated share price drop-off ratios before and after the Finance Act 1997 were compared to test
the tax hypothesis.
Tests for the tax clientele hypothesis involved with comparing drop-off ratios to dividend yield.
►Before 1997, the results showed that the average drop-off ratios ranged from 0.84 to 1.16 depending
on the sample and measurement method. Also, strong clientele effects were found since drop-off ratios
were positively related to dividend yields.
►After 1997, the results showed significant changes in drop-off ratios, especially high yield firms.
Drop-off ratios were found to be reduced on average by 13 to 18 percent depending on the firm size.
.
The study results provided strong evidence
supporting the tax clientele hypothesis and
were consistent with the tax effect hypothesis
that taxation significantly influences the
valuation of dividend income.
Birkbeck University of London Page 141
Table 2.10 Studies of the Partial Adjustment Model in Developing Markets
Researcher(s) Aim of the study Methodology (data sample and model) and main findings of the study Hypotheses consistent with results
Mookerjee
(1992)
Testing the Lintner
model of firm’s
dividend behaviour and
modifications of the
model on Indian
sample.
Data sample:
India, the aggregate corporate sector in India over the period 1950-1981.
Methodology:
OLS.
Model and findings:
Lintner’s partial adjustment model.
Modified versions of Lintner’s model by adding external finance as an explanatory variable and
removing the constant. Further, including lagged earnings and lagged external finance as other
explanatory variables.
Significant explanatory variables with the signs as hypothesised by the model and an Adjusted R2
value of 61% were reported. Also, a significantly positive external finance coefficient was found.
The basic Lintner model tends to explain the
dividend behaviour in India well and the
model is able to explain 61% of the variations
in dividend payments. However, inclusion of
the external finance as an additional
independent variable improves the
explanatory power of the model. This
evidence suggests that Indian firms may use
external finance to augment dividend payout
rates.
Adaoglu
(2000)
Examining the dividend
policy decisions of
Turkish companies by
using the Lintner
model.
Data sample:
Turkey, 76 industrial and commercial firms listed on the Istanbul Stock Exchange, 1985-1997.
Methodology:
Panel data; pooled OLS, fixed effects and random effects regressions.
Model and findings:
Lintner’s partial adjustment model.
Employed dividend per share as the dependent variable instead of aggregate dividends.
Significant and positive constant and earnings, whereas insignificant lagged dividends.
Speed of adjustment = 1.00, target payout ratio = 0.517 and Adjusted R2 = 89.4%.
Random effects model is found to be the most appropriate estimation.
Significant differences between Turkish firms
and the developed market firms’ dividend
policies since the ISE firms follow unstable
dividends policy unlike their counterparts in
developed markets. The main factor
determines the cash dividend payments is the
current earnings in a given year. Any
variability in the earnings of the firm is
directly reflected in the level of cash
dividends.
Pandey (2001)
Studying the dividend
behaviour of Malaysian
firms by examining (1)
the industry effect, (2)
earnings change and (3)
stability of dividends
using the Lintner
model.
Data sample:
Malaysia, 248 industrial firms listed on the Kuala Lumpur Stock Exchange, 1993-2000.
Methodology:
Panel data; pooled OLS, fixed effects, random effects, and multinomial logit regressions.
Model and findings:
Lintner’s partial adjustment model.
Following Fama and Babiak (1968), dividend and earnings per share are used.
Significant variations in payout ratios of industries are found by Kruskal-Wallis analysis.
Profitable firms pay more dividends and firms experiencing losses tend to omit dividends.
Fixed effects model is found to be the most appropriate estimation.
Lintner model explains the dividend
behaviour of Malaysian firms since they rely
on both current earnings and past dividends.
However, Malaysian firms have lower target
payout ratios and higher adjustment factors,
indicating low smoothing and less stable
dividend payments. Also, different industries
have different payouts and profitable firms
have higher payouts.
Birkbeck University of London Page 142
Table 2.10 Studies of the Partial Adjustment Model in Developing Markets (continues) Researcher(s) Aim of the study Methodology (data sample and model) and main findings of the study Hypotheses consistent with results
Aivazian,
Booth and
Cleary
(2003a)
Cross-country
comparisons of
dividend policy
between the largest
firms from eight
emerging markets and a
control sample of US
firms.
Data sample:
The largest firms from eight emerging markets (South Korea, Malaysia, Zimbabwe, India, Thailand,
Turkey, Pakistan and Jordan) and 100 US firms over the period, 1980-1990.
Methodology:
Pooled OLS.
Model and findings:
Lintner’s partial adjustment model by following Fama and Babiak’s (1968) method; dividend and
earnings per share are used. Also, the model was run separately on all observations and only
dividend-paying observations for each country.
The Lintner model works remarkably well for the US data with Adj. R2s around 89-90%; however,
the estimates are not as reliable in these emerging markets with much lower Adj. R2 s ranging from
19.7% for Thailand to 72.5% for Zimbabwe.
The Lintner model still works well for US
firms, whereas it does not work very well for
emerging market firms. Also, current
dividends are much less sensitive to past
dividends in these countries. Further, it is
more difficult to predict dividend changes for
such emerging countries since the quality of
cutting dividends are much similar to those
increasing dividends. In short, the institutional
structures of these developing countries make
dividend policy a less practical mechanism.
Al-Najjar
(2009)
Investigating the
determinants of
dividend policy in
Jordan as well as
examining whether
Jordanian firms smooth
their dividends by using
the Lintner model.
Data sample:
Jordan, 86 non-financial firms listed on the Amman Stock Exchange, 1994-2003.
Methodology:
Panel data; pooled and panel tobit and logit models, pooled OLS, random and fixed effects regressions.
Model and findings:
Logit and tobit regressions showed that dividends increase with profitability, growth opportunities,
and firm size’ increases, and are negatively related to debt ratio, institutional ownership, business risk
and assets tangibility. However, assets liquidity has no effect on dividends.
Lintner’s model is used but using firm-level (dividend and earnings per share) data.
All variables and constant term are significant and positively related to dividends.
Pooled model is more favourable than panel models.
Target payout ratio and speed of adjustment coefficients are 0.478 and 0.429 respectively (according
to the pooled model as it is more favourable).
Dividend policy in Jordan is governed by
similar determinants as suggested by the
developed markets such as leverage ratio,
institutional ownership, profitability, business
risk, assets structure, growth rate and firm
size.
The Lintner model is valid for explaining
Jordanian firms’ dividend behaviour. Indeed,
Jordanian firms have their target payout ratios
and they partially slowly adjust dividends to
their target - but relatively faster than those in
developed markets.
Chemmanur,
He, Hu and
Liu (2010)
Comparing dividend
policies of firms in
Hong Kong and the US
in order to study
dividend smoothing
using the Lintner
model.
Data sample:
Hong Kong and US: Industrial and commercial firms listed on the Stock Exchange of Hong Kong and
industry-matched US firms listed on the NYSE/AMEX/NASDAQ over the period 1984-2002.
Methodology:
Time series regression.
Model and findings:
The Lintner model and its variants using both aggregate and firm levels data.
Regression results on aggregate data showed that the Lintner model works well in explaining current
dividend payments in both Hong Kong and US markets.
The goodness of fits for both markets are high with Adj. R2s in the high eighties.
On a firm level basis, the speed of adjustment parameter for US firms is 0.279 and for Hong Kong
firms is 0.684.
Lintner model explains dividend behaviour of
both Hong Kong and US firms since they rely
on both current earnings and past dividends.
However, the extent of dividend smoothing by
firms in Hong Kong is significantly less than
those in the US, which indicates that they
adjust their dividends toward a long-term
payout ratio much faster than in the US.
Hence, compared to the US firms, Hong Kong
corporations follow a more flexible dividend
policy commensurate with current year
earnings.
Birkbeck University of London Page 143
Table 2.10 Studies of the Partial Adjustment Model in Developing Markets (continues) Researcher(s) Aim of the study Methodology (data sample and model) and main findings of the study Hypotheses consistent with results
Al-Ajmi and
Abo Hussain
(2011)
Testing the stability of
dividend policy in
Saudi Arabia using
Lintner’s (1956) model.
Data sample:
Saudi Arabia, an unbalanced panel dataset for a sample of 54 firms during the period 1990-2006,
totalling 708 firm-year observations.
Methodology:
Fixed effects panel regression.
Model and findings:
Lintner’s (1956) model and several versions of the model by following Fama and Babiak’s
(1968) method (firm-level data).
Results revealed that, in all of the tested models, the coefficients on both lagged dividends and
current earnings are positive and significant.
Basic Lintner model explains 67.8% of variability in dividend payments, evidenced by R2 value.
The speed of adjustment of Saudi firms is 71% and the implied target payout ratio is 43%.
Consistent with the partial adjustment model
purposed by Lintner (1956), that is, current
year dividend payments of Saudi firms are
functions of current year earnings and lagged
dividend levels.
Saudi firms have, on average, higher speed of
adjustment estimates, which suggests that
Saudi firms tend to adopt more flexible
dividend policies and they act quickly to
increase dividends as well as willing to cut
dividends when earnings decline.
Al-Malkawi,
Bhatti and
Magableh
(2014)
.
Examining dividend
smoothing of Omani
companies using
Lintner’s (1956) partial
adjustment model.
Data sample:
Oman, 104 firms listed on the Muscat Stock Market over the period 2001-2010, totalling 936 firm-
year observations.
Methodology:
Panel data; pooled tobit model.
Model and findings:
Lintner’s (1956) partial adjustment model using firm-level data.
A modified Lintner model by adding dummy variables to capture the impact of 2008 Global
Financial Crisis (GFC) on dividend stability.
The pooled tobit estimation is found to be more superior than random effects panel estimator as
evidence by the likelihood Ratio test, which is insignificant (p-value = 1.00) and indicates the
panel-level variance is unimportant. Hence, results are obtained using the pooled tobit models.
Results showed that the coefficients of earning per share and lagged dividends per share are both
positive and highly significant (at the 1% level). However, although GFC dummies are, as
expected, negative, they are not statistically significant.
The speed of adjustment estimate for Omani firms is 0.2572 and target payout ratio is 0.79.
Result provided empirical evidence supporting
the validity of Lintner’s original findings;
Omani firms tend to adjust their dividend
payments toward their target payout ratio
gradually with, more interestingly, a relatively
low speed of adjustment factor (0.2572)
compared to other firms in developed and
emerging economies. Furthermore, the
evidence showed that the 2008 global
financial crisis had no significant effect on
dividend stability of Omani firms.
Consequently, dividend signalling is an
important concern since Omani firms attempt
to smooth their dividend payment streams and
follow stable dividend policies.
Birkbeck University of London Page 144
Table 2.11 Studies of the Agency Cost Theory in Developing Markets
Researcher(s) Aim of the study Methodology (data sample and model) and main findings of the study Hypotheses consistent with results
La Porta,
Lopez-De-
Silanes, Shleifer
and Vishny
(2000)
Examining the agency
approach to dividends
on a cross-section
sample from 33
different countries
around the world by
using two alternative
agency models of
dividends; namely the
outcome model and
substitute model.
Data sample:
33 different countries around the world from 4,103 firms over the period 1989-1994.
Methodology:
Median comparison tests and country random effects regressions for the cross-section.
Model and findings:
Dependent variables are dividend-to-cash flow, dividend-to-earnings and dividend-to-sales.
Independent variables are civil/common law country dummy, low/high investor protection
dummy, growth sales, tax advantage on retain earnings, the interaction between growth sales
and civil law origin, and the interaction between growth sales and low protection.
Common law countries, where investors have better protection, distribute higher dividends.
In common but not in civil law countries, high growth firms make lower payouts.
No tax effect found.
Results showed support to the agency view of
dividends, particularly consistent with the
outcome agency model of dividends, which
suggests that dividends are outcome of
effective legal protection of shareholders.
Further, firms in countries with better
investors’ protection have higher payouts and
in these countries fast growth firms pay lower
dividends. Last, the study indicated no
conclusive evidence on the effect of taxes on
dividend policies.
Faccio, Lang
and Young
(2001)
Investigating how
dividend behaviour is
related to the structure
of ownership and
control of East Asian
firms with a benchmark
sample of West
European firms.
Data sample:
5,897 firms from 5 West European and 9 East Asian countries over the period 1992-1996.
Methodology:
Mean comparison tests and cross-sectional OLS regressions.
Model and findings:
Dependant variables are dividend/cash flows, dividend/earnings, dividend/sales and
dividend/market capitalisations ratios.
Independent variables are group affiliation dummy, controlling shareholders ratio of ownership-
to-control rights, the European dummy, growth sales, multiple owners dummy, total debt/net
assets, credit-rationing dummy, civil law dummy, the legal reserve variable and natural log of
the book value of total assets.
Families are the predominant controlling shareholders in both Asia and Europe.
Results showed that expropriation exists within business groups and there are differences in
expropriation between Europe and Asia.
The predominant form of ownership in East
Asia is control by a family, which often
provides a top manager. In fact, this form is
more pronounced in West Europe. Hence, the
most salient agency problem is expropriation
of outside shareholder by controlling families
in both regions. Dividends exhibit evidence
on this; group-affiliated firms in Europe pay
higher dividends than in Asia, dampening
insider expropriation. When multiple large
owners exist, dividends are higher in Europe
but lower in Asia, suggesting that they
dampen expropriation in Europe but
exacerbate it in Asia.
Manos (2002)
Investigating the agency
theory of dividend
policy in the context of
an emerging economy,
India, by using a
modified version of
Rozeff’s (1982) cost
minimisation model.
Data sample:
India, 661 non-financial firms listed on the Bombay Stock Exchange in 2001.
Methodology:
Cross-sectional OLS, tobit model, Heckman’s two step and maximum likelihood procedure.
ownership + β6 insider ownership + β7 ownership dispersion + β7 business group interaction
term + β8 group affiliation dummy + β9 most liquidity dummy + β10 less liquidity dummy + β11
least liquidity dummy + ἐ
The transaction cost variables were negatively related, whereas the agency cost variables were
generally positively related to the payout ratio. The positive relation for institutional and insider
ownership was contrary with the expectations.
Group affiliation appeared to have a significant negative effect on the payout ratio.
Consistent with the cost minimisation model
and agency cost theory rationale for dividend
policy in the context of an emerging market,
India. Further, it is revealed that group
affiliation appears to have a significant
negative effect on the payout ratios and also
has an important influence on the transaction
cost structure as well as agency problems
experienced by Indian companies.
Birkbeck University of London Page 145
Table 2.11 Studies of the Agency Cost Theory of Dividends in Developing Markets (continues) Researcher(s) Aim of the study Methodology (data sample and model) and main findings of the study Hypotheses consistent with results
Chen, Cheung,
Stouraitis and
Wong (2005)
Examining whether
concentrated family
ownership affects firm
performance, firm value
and dividend policy in
Hong Kong.
Data sample:
Hong Kong, 412 firms listed on the Stock Exchange of Hong Kong during 1995-1998.
Methodology:
Multivariate analyses by using pooled, industry fixed and firm fixed effects models.
Model and findings:
Dependent variables: ROA, ROE, Tobin’s Q, dividend payout ratio and dividend yield.
Independent variables: Family ownership, CEO duality, number of directors, independent
directors, audit committee, total assets, sales growth and debt-to-assets.
Results do not show a positive relation between family ownership and performance but little
relationship between family ownership and dividend policy for only small firms.
Only for small firms, there is a significant negative
relation between payouts and family holdings up to
10% and a positive relation for family ownership
between 10 and 35%, suggesting that families in
small firms are subject to less scrutiny by investors
and may be using dividends to extract resources.
Alternatively, results are also consistent with the
conjecture that outside investors anticipate potential
expropriation by families and demand higher
dividends from firms with potentially the largest
agency conflict.
Kouki and
Guizani (2009)
Studying the agency
cost theory explanation
of the dividend policy
by analysing the
influence of shareholder
ownership identity on
dividends in Tunisia.
Data sample:
Tunisia, 29 firms listed on the Tunisian Stock Exchange over the period 1995-2001.
ownership + β6 state ownership + β7 dummies for ownership concentration + ἐ
Free cash flow coefficient is positive and significant at the 1% level in all models, whereas
financial leverage is negatively related to dividend per share but only significant in one model
at only the 10% level. Q ratio is positive and significant at the 1% level in all models, whereby
firm size is negatively related to dividends and significant at the 1% level. The coefficients of
institutional and state ownership are negative and significant, whereas ownership
concentration is positively and significantly related to dividends.
Ownership structure approach is highly relevant in
explaining dividend policy in Tunisia. Institutional
ownership and state ownership are both significant
and negatively related to dividends. Further,
existence of multiple large shareholders and free
cash flow are positively related to dividends,
whereas firm size has significantly negative effect
on the level of dividends. Also, firms with better
investment opportunities are likely to pay more
dividends, while firms with high leverage tend to
pay lower dividends.
Wei, Wu, Li and
Chen (2011)
Testing the impact of
family control,
institutional
environment and their
interaction on the cash
dividend policy of listed
firms in China.
Data sample:
China, 1,486 firms listed on the Chinese A-share market for the period 2004-2008.
Methodology:
Group t-tests, logit and tobit regressions.
Model and findings:
Dependent variables: Cash dividend dummy, payout ratio and dividend yield.
Independent variables: Family control, institutional environment, firm size, financial leverage,
profitability, Tobin’s Q, cash, firm age, SOE regulations, year and industry dummies.
Family controlled firms have lower payouts and propensity to pay dividends than non-family
firms.
Institutional environment has a significant effect on dividend policy of listed firms, which
supports the outcome model of dividends proposed by La Porta et al. (2000).
Family firms have lower payouts and lower
tendencies to pay dividends than non-family firms.
A favourable regional institutional environment has
a significant positive effect on the cash dividends
and the impact of the regional institutional
environment on cash dividends is stronger in family
firms than in non-family firms. Also, surprisingly,
results showed that families in China tend to
intensify Agency Problem I rather than Agency
Problem II.
Birkbeck University of London Page 146
Table 2.11 Studies of the Agency Cost Theory of Dividends in Developing Markets (continues) Researcher(s) Aim of the study Methodology (data sample and model) and main findings of the study Hypotheses consistent with results
Aguenaou,
Farooq and Di
(2013)
Investigating the effect
of ownership structure
on dividend policies for
Moroccan firms.
Data sample:
Morocco, firms listed on the Casablanca Stock Exchange during the period 2004-2010,
totalling 200 firm-year observations.
Methodology:
Panel data analysis; fixed effects and random effects estimations.
Model and findings:
Payout ratio = α + β1 institutional investor dummy + β2 industrial company dummy + β3
government dummy + β4 family dummy + β5 foreign investor dummy + β6 size + β7
leverage + β8 earnings per share + β9 year dummies + β10 industry dummies + ἐ
Results showed that two forms of ownership identity, namely family ownership and
industrial company ownership, are negatively and significantly influencing the dividend
policy of the firms listed on the Casablanca Stock Exchange.
Family ownership negatively influences the level of
distributed dividends; as for family ownership is a
typical aspect of firms in the Moroccan market, the
low dividend payout ratios are justified by high
agency problems in family controlled firms.
Because, family shareholders increase the cost for
firms since their lack of diversification, the hiring
of unskilled family members and the abuse of other
shareholders’ rights, which all may result in poor
transparency and absence of accountability. In
addition, industrial company ownership also
involves with lower dividend payouts, which may
imply that industrial company ownership leads to
additional monitoring on managerial discretion.
Gonzalez,
Guzman, Pombo
and Trujillo
(2014)
Examining how family
involvement influences
agency problems
between majority and
minority shareholders
and whether the level
and likelihood of
dividend payments
serve as mitigating
mechanisms.
Data sample:
Colombia, 458 Colombian firms over the period 1996-2006.
Methodology:
Panel random effects probit and classical tobit cross-section regressions.
Model and findings:
Dependent variables are dividend payout ratio (dividends/total assets) and dividend
dummy, which takes the value of 1 if the firm pays dividends, and zero otherwise.
Test variables are family CEO dummy, family ownership dummy, pyramidal family
control and majority family board dummy.
Control variables are ROA, ROA(t-1), leverage, leverage(t-1), growth, size, age, group
affiliation, group diversification, board size, non-family directors, board turnover, CEO
board dummy, auditing firm and contestability index.
Also, year and industry dummies are included.
Results showed that family influence in relation to the level and likelihood of dividend
payments differs considerably according to the type of family involvement.
Colombian firms have high ownership
concentration, family business groups and low
investor protection. Furthermore, the relationship
between family influence and dividends varies
based on the type of family interaction.
Specifically, family involvement in management
does not affect dividend policy, whereas family
involvement in both ownership and control through
pyramidal structures has negative impacts but
family involvement in control through
disproportionate board representation has positive
effect on dividend policies of Colombian
companies. Therefore, family influence on agency
problems, and hence on dividend policy as a
mitigating device, varies depending on family
involvement.
Birkbeck University of London Page 147
Table 2.12 Studies of the Determinants of Dividends in Developing Markets
Researcher(s) Aim of the study Methodology (data sample and model) and main findings of the study Hypotheses consistent with results
Aivazian, Booth
and Cleary
(2003b)
Examining dividend
policy behaviour in
different institutional
environments; cross-
country comparisons
from eight emerging
markets and a control
sample of US firms.
Data sample:
The largest firms from eight emerging markets (South Korea, Malaysia, Zimbabwe, India, Thailand,
Turkey, Pakistan and Jordan) and 99 US firms over the period, 1981-1990.
Methodology:
Pooled OLS.
Model and findings:
Dependent variable is dividends-to-total assets, whereas independent variables are business risk,
size, tangibility of assets, ROE, market-to-book ratio, debt ratio and country dummies.
Dividends are negatively related to debt and positively related to ROE and the market-to-book
ratio. Country dummies indicated significant differences exist among countries.
Emerging markets showed dividend behaviour
similar to US firms, which are explained by
the profitability, debt and market-to-book
ratio. Of course, their sensitivity to these
variables vary across countries. Also,
emerging market firms seemed to be more
influenced by assets mix and country factors
are as important in dividend policies as in
capital structure decisions.
Kirkulak and
Kurt (2010)
Examining the dividend
payment decisions of
publicly listed firms in
Turkey
Data sample:
Turkey, 2,326 firm-year observations of dividend and non-dividend payers and 732 firm-year
observations of dividend reductions from the ISE listed firms during the period 1991-2006.
Methodology:
Logit regressions.
Model and findings:
Dependent variables are the probability of paying dividends and the probability of reducing
dividends, whereas independent variables are current net income, lagged net income, liability,
growth, year dummies for 1997, 1998, 2001 and 2002.
Earnings are the most important determinant on both dividend and reduction decisions, similarly
investment opportunities influences both. However, the debt level has no effect on dividend
paying decisions but has a significant effect on dividend reductions. Also, financial crisis had a
very clear impact on both.
Firms with large current earnings tend to pay
dividends, whereas dividend reductions are
associated with low current earnings. The debt
level has no effect on dividend decisions but it
significantly affects reductions since higher
levels of debt lowered dividends. Further,
firms with low investment opportunities are
more likely to reduce dividends, whereas high
investment opportunities increase the dividend
payments. Finally, the results showed that the
financial crises had a very clear impact on
both dividend payment and reduction
decisions.
Imran (2011)
Examining the factors
that determine the
dividend payout
decisions in the case of
Pakistan’s engineering
sector.
Data sample:
Pakistan, 36 engineering firms listed on the Karachi Stock Exchange from 1996 to 2008.
Methodology:
Panel data; pooled OLS, fixed effects and random effects estimations.
Model and finding:
Dividend per share = α + β1 lagged dividend per share + β2 earnings per share + β3 profitability
Results indicated that dividend per share is a positive function of previous year’s dividend per
share, earning per share, profitability, sales growth and firm size, while it has a negative
association with cash flow. However, liquidity of the firm has no effect on dividend policy
decisions in the case of Pakistani engineering firms.
Firms with higher sales and profitability tend
to pay more dividends. Also, larger firms are
more willing to increase the dividends. Firms
are reluctant to cut their dividends and
perform every task to meet or increase the
payout ratio from its previous level. The
negative association between dividends and
cash flow suggests that firms plough back
their extra cash. The liquidity of the firm has
found unrelated to dividend.
Birkbeck University of London Page 148
Table 2.12 Studies of the Determinants of Dividends in Developing Markets (continues) Researcher(s) Aim of the study Methodology (data sample and model) and main findings of the study Hypotheses consistent with results
Mehta (2012)
Investigating the most
important factors which
affect the dividend
payout decisions of the
firms in the United
Arab Emirates (UAE).
Data sample:
UAE, 44 non-financial firms listed on the Abu Dhabi Stock Exchange during 2005-2009.
Methodology:
Correlation and backwards multiple linear regression models.
Model and findings:
Dependent variable is dividend payout ratio, whereas independent variables are profitability, risk,
liquidity, leverage and firm size.
Firm size, risk and profitability explained 42% of the total variations in the dividend payout
policy; however, profitability is not always significant. Also, liquidity and leverage have no effect
on dividends.
Firm size and risk are the most important
factors affecting dividend policy in the UAE;
larger sized firms pay out more dividends and
the higher the firm’s price-to-earnings ratio,
the lower its risk and the higher is its payout
ratio. Further, the study findings indicate that
profitability, liquidity and leverage are
insignificant in influencing the dividend
payout decisions in the UAE.
Kisman (2013)
Examining factors that
influence the
probability corporate
decisions to pay or not
to pay dividends in
Indonesia.
Data sample:
Indonesia, 34 firms listed on the Indonesian Stock Exchange over the period, 2005-2011.
Methodology:
Panel data, logit regression models.
Model and findings:
Probability of paying dividends (0/1) = α + β1 profitability + β2 agency cost (log of the number of
period 2003-2012 are all considered and included in the sample. As illustrated by Panel
B in Table 3.1, the listed companies of the ISE are increasing every year because of the
new listed firms. Due to the delisted and newly listed companies, the sample is not the
same for every year but rather it increases during the ten-year period from 2003 to 2012,
hence this type of panel is called unbalanced panel data.47
Panel C in Table 3.1 presents the distribution of the sampled Turkish companies across
industries. The sample is classified into 14 different industries based on ICB codes.
However, the sample has a majority of companies in only four different industries,
namely personal & household goods, industrial goods & services, construction &
materials and food & beverage (18.6%, 17.4%, 13.3% and 11.7% respectively), which
are all making up to 61% of all companies in the sample.
47
The panel data can be a balanced panel that it has all its observations, where the variables are observed
for each entity and each time period. However, a panel that has some missing values for at least one time
period for at least one entity is called an unbalanced panel (Stock and Watson, 2003). The methods used
in this study can be used with both a balanced and an unbalanced panel data.
Birkbeck University of London Page 166
Table 3.1 Selection Criteria and Distributions of the Sample across Time and Industries Panel A illustrates criteria for inclusion in the sample of the ISE listed companies. Panel B illustrates the distribution of the final sample
across time during the period of 2003-2012, whereas Panel C illustrates the distribution of the final sample across industries for which
relevant data is available from Datastream. ICB code provides Industry Classification Benchmark code for industries.
Panel A
Panel B
Panel C
Selection Criteria for the Sample Distribution of the
Sample across Time
Distribution of the Sample across Industries
Criterion Number
of Firms
Years
Number
of Firms
Industry
ICB
Code
Sample
(%)
All firms listed on the
380 2003 157 Oil & Gas 500 1.5
ISE during 2003-2012 2004 164 Chemicals 1300 5.7
2005 199 Basic Resources 1700 5.7
Financial Firms 111 2006 211 Construction & Materials 2300 13.3
Final Sample 264 2009 218 Food & Beverage 3500 11.7
(Excluding financials 2010 226 Personal & Household Goods 3700 18.6
& utilities) 2011 249 Health Care 4500 1.5
2012 259 Retail 5300 5.7
Media 5500 2.6
Travel & Leisure 5700 6.4
Telecommunications 6500 0.8
Technology 9500 4.9
Total 100%
Number of Firms 264
Birkbeck University of London Page 167
Table 3.2 on the next page, reports the descriptive statistics for the firm’s characteristics
for the sampled Turkish companies during the period 2003-2012. In order to prevent the
inflation effect over the period, all aggregate variables are measured in real terms and
normalised by the consumer price index (CPI) deflator, using 2003 as a base year. The
CPI deflator data is taken from the Central Bank of the Republic of Turkey (CBRT)
database.
Three measures of firm size are illustrated; sales, total capital and market value (on
average for the entire time period, 812.1 million TL, 505.1 million TL and 656.7 million
TL respectively), which are all showing an increased pattern with, of course, some
fluctuations over the period. Furthermore, net income of the sample increased to 69.7
million TL in 2012 from 33.8 million TL in 2003, whereas cash dividends paid by the
sampled firms increased to 27.2 million TL in 2012 from 3.9 million TL in 2003.
However, both net income and cash dividends figures show some major fluctuations
over the period, as can be observed from the table. When looking at the descriptive
statistics of the debt level of the sample, it is observed that Turkish firms make about
25% of debt usage for their capital budgeting on average for the entire time period. The
debt level is found to be fluctuated around 20% from 2003 to 2007 but it dramatically
rose to 27.2% in 2008, perhaps reflecting the global financial crisis in 2008. It then
reached to approximately 30% at the end of the period 2012.
3.3.2 Variables and Models
3.3.2.1 Variable Descriptions
This chapter of the thesis employs two variables to proxy for the dependent variable,
namely the probability of paying dividends and the intensity of paying dividends. The
probability of paying dividends is observed as the binary variable, which indicates that
such a firm did (DPAY=1) or did not (DPAY=0) pay dividends in any given year during
the period 2003-2012. The intensity of paying dividends (the payout level decisions),
DPOUT, represents the actual dividend payout ratio made by a firm, which is measured
as the dividend per share is divided by the earnings per share, in a given year during the
period 2003-2012. The variable takes a positive value if such a firm paid dividends and
it takes on a value of zero if the firm did not.
Birkbeck University of London Page 168
Table 3.2 Firm Characteristics for the Sampled Turkish Companies Sample includes 264 firms (non-financial and non-utility) listed on the ISE during 2003-2012 for which relevant data is available from Datastream. Sales represent
annual gross sales and other operating revenue. Total capital represents the total annual investment in the company that is the sum of common equity, preferred
stocks, minority interest, long-term debt, non-equity reserves and deferred tax liability in untaxed reserves. Market value equals the share price multiplied by the
number of ordinary shares in issue. Net income represents annual income after all operating and non-operating income and expenses, reserves, income taxes, minority
interest and extraordinary items. Cash dividends equal the total annual common and preferred dividends paid in cash to shareholders of the firm. Debt level is
measured annually as total debt divided by total assets of a firm. In order to remove the inflation effect, variables are measured in real terms and normalised by the
consumer price index (CPI) deflator using 2003 as a base year. The CPI deflator data is taken from the Central Bank of the Republic of Turkey (CBRT) database.
A tobit model can be applicable where a dependent variable is censored within certain ranges (Greene,
2003; Wooldridge, 2010). In the case of dividend modelling in this study, the dependant variable
(dividend payout ratio) is bounded at zero; there is no implicit continuum of the dependent variable below
0 if none dividends distributed. Otherwise, it is always non-zero, in other words taking positive values.
Therefore, the study employs the tobit model as follows:
0 if yi* ≤0
yi
βxi + ui, ui ~ N (0, σ2) if yi* > 0
In the model, the data are censored at zero, T = 0 and the likelihood function for the censored normal
distribution of dividend per share is:
Setting T = 0 and parameterizing μ as Xiβ provides the likelihood function for the tobit model. Hence:
The tobit model has the log-likelihood function, which is made up of two parts. The first part estimates
the classical regression for the uncensored observations, whereas the second part estimates the relevant
probabilty that an observation is censored (Greene, 2003; Wooldridge, 2010) as presentes below:
When the dividend payout ratio of the firm is used a dependent variable, which is left censored at zero,
then the tobit model is more favourable than the ordinary least squares appraoch related to our data
characteristics.
Birkbeck University of London Page 174
3.3.2.3 Descriptive Statistics of the Variables
Table 3.4 below presents the descriptive statistics (mean, median, standard deviation,
maximum and minimum values, skewness and kurtosis) for the research variables used
in the multivariate analyses of this chapter of the study. The panel dataset (unbalanced)
includes 264 Turkish firms (non-financial and non-utility) listed on the Istanbul Stock
Exchange (ISE) with 2,112 firm-year observations51 over the period 2003-2012.
Table 3.4 Descriptive Statistics of the Research Variables The table reports the descriptive statistics for the research variables used in the multivariate
analyses of this part of the study. The unbalanced panel dataset includes 264 firms (non-financial
& non-utility) listed on the ISE with 2,112 firm-year observations over the period 2003-2012.
Variables Mean Median S.D. Min Max Skewness Kurtosis
DPAY 0.339 0.000 0.473 0.000 1.000 0.682 1.465
DPOUT 0.243 0.000 0.911 0.000 21.05 14.34 287.9
ROA 0.021 0.030 0.185 -5.120 1.059 -11.41 295.9
M/B 1.508 1.162 1.322 0.284 18.66 5.304 43.01
RISK 0.457 0.420 0.196 0.017 2.868 2.746 22.96
DEBT 0.249 0.158 0.542 0.000 10.76 12.77 221.2
FCF 0.078 0.042 1.340 -19.18 13.58 -0.683 45.15
LIQ 3.014 1.561 9.099 0.005 263.6 16.49 378.0
TANG 0.490 0.497 0.215 0.001 0.991 -0.068 2.390
AGE 3.445 3.555 0.499 1.098 4.477 -1.002 4.296
SIZE 4.863 4.704 1.712 0.513 10.16 0.427 2.792
At first glance, the mean of DPAY is 0.339, indicating that in almost 34 % of the total
2,112 firm-year observations; Turkish firms paid dividends, whereas in the rest of the
66% of the total observations, they did not. On average, DPOUT reveals that the
sampled Turkish firms had the dividend payout ratio of 24.3% over the entire period.
Furthermore, the statistics (DEBT and ROA) report that on average firms make about
25% debt financing in their capital structure and had only approximately 2% of the
returns on their total assets invested over the period. LIQ variable demonstrates a high
mean current ratio of 3:1, which suggests that Turkish firms are on average capable of
paying their obligations. Moreover, the descriptive statistics of the other variables can
be observed from the table.
51
Each research variable has 2,112 firm-year observations, except dividend payout ratio (DPOUT), which
has 2,066 firm-year observations. When the firm makes losses, its earnings per share becomes negative
and although that firm pays some amount of dividends, its dividend payout ratio will be negative since
payout ratio is calculated as dividend per share divided by earnings per share. However, a firm’s dividend
payout ratio cannot be negative; therefore such observations are excluded while measuring the DPOUT
variable.
Birkbeck University of London Page 175
3.3.2.4 Correlation Matrix and VIF Values of the Independent Variables
Table 3.5 demonstrates the correlation matrix and the Variance Inflation Factors (VIF)
of the independent variables included in the multivariate analyses.
Table 3.5 Correlation Matrix & VIF Values of Independent Variables
ROA
M/B
RISK
DEBT
FCF
LIQ
TANG
AGE
SIZE
VIF
1/VIF
ROA
1.000
1.56
0.641
M/B
-0.144
1.000
1.51
0.662
RISK
-0.132
0.171
1.000
1.14
0.877
DEBT
-0.498
0.458
0.073
1.000
1.77
0.565
FCF
0.276
- 0.042
-0.027
-0.104
1.000
1.09
0.917
LIQ
0.111
0.052
-0.012
-0.093
0.056
1.000
1.03
0.970
TANG
-0.145
-0.000
0.024
0.082
-0.111
-0.058
1.000
1.06
0.943
AGE
-0.005
-0.091
-0.071
0.035
0.044
-0.049
0.088
1.000
1.06
0.943
SIZE
0.301
0.152
-0.247
-0.157
0.103
0.011
0.094
0.146
1.000
1.03
0.970
Although a few variables are moderately correlated, there does not appear to be high
correlation between any two of the variables. Furthermore, to determine more directly
if multicollinearity exists between independent variables, the VIF statistics are used. As
a rule of thumb, the values of VIF larger than 10 are generally regarded as suggesting
multicollinearity. Tolerance, calculated as 1/VIF, is also used to check the degree of
multicollinearity; if a tolerance value is lower than 0.1, corresponding to a VIF value of
10, it implies multicollinearity. As reported in the table, none of the VIF values exceed
10, nor the tolerance values smaller than 0.1, the results therefore suggest that there is
no multicollinearity.
3.4 Empirical Results
The effects of firm-specific factors on dividend policy in Turkey are analysed in two
steps: (1) decisions to pay or not to pay and (2) how much dividends to pay. The nature
of the dependent variable defines the appropriate estimation method. When the
dependent variable is the probability of paying dividends, which is a binary variable that
equals to 1 if a firm pays dividends and zero otherwise, logit estimations are used.
When the dependent variable is the intensity of paying dividends, which is left censored
Birkbeck University of London Page 176
at zero, and the distribution of the sample is a mixture of discrete and continuous
variables, tobit estimations are employed.
In order to provide further interpretations of the estimation coefficients, the marginal
effects of the independent variables in logit and tobit models are also calculated. The
marginal effects show the marginal impact of each independent variable on the
dependent variable at the mean values of other independent variables.52 The marginal
effects are provided in the same tables next to the coefficient estimations columns for
each regression models, illustrating the marginal effects of the independent variables on
the probability of paying dividends (in logit models), as well as showing their marginal
influences on setting the actual level of payout ratios (in the tobit models). The results
of the logit and tobit estimates are summarised in Table 3.6 and Table 3.7 respectively.
Also, in order to control for heteroscadasticity, the pooled models are tested using
White’s corrected hetereoscadasticity robust regressions. Hence, the models in this
chapter do not suffer from heteroscadasticity. This section reports and discusses the
results of the empirical analyses.
3.4.1 Results of the Logit Estimations
Table 3.6 on the next page reports the results of logit estimations53 on the probability of
Turkish firms to pay dividends based on 1,846 firm-year observations from 264 ISE-
listed firms over the period 2003-2012. The dependent variable is a binary variable
taking 1 if the firm pays dividends and 0 otherwise. Whereas Model 1 includes the set
of all independent variables that are employed according to research hypotheses as
previously explained, and Model 2 expands the regression model by adding industry
dummies (INDUSTRY) to control for different industry classifications effect of the
sample.
52
Marginal Effects at the Means (MEMs) are computed by setting the values of independent variables
(X) at their means, and then seeing the effect of a one-unit change in one of the independent variables
(Xk) on the dependent variable, P(Y=1). For categorical variables, the effects of discrete changes are
computed; the marginal effects for categorical variables show how P(Y=1) is predicted to change as Xk
changes from 0 to 1, holding all other independent variables at their means. This can be quite useful,
informative, and easy to understand. For continuous independent variables, the marginal effect measures
the instantaneous rate of change. If the instantaneous rate of change is similar to the change in P(Y=1) as
Xk increases by one unit while holding all other X variables at their means, this too can be quite useful
and informative (Long, 1997; Long and Freese, 2006). 53
It is worth noting that this chapter of the study also employs probit estimations on the probability of
paying dividends. The corresponding pooled and panel (random effects) probit models provide very
similar findings with the logit estimations. The results are reported in Table 3.10 in Appendix II.
Birkbeck University of London Page 177
Table 3.6 Results of the Logit Estimations on Probability of Paying Dividends
Model Variables PANEL A: Pooled Logit PANEL B: Random Effects Logit
Number of Observations 1,846 1,846 1,846 1,846 1,846 1,846 1,846 1,846
Wald X2 409.70*** 418.14*** 196.46*** 198.06***
Pseudo R2 36.32% 37.92% - -
Rho Value 0.6343 0.6148
Likelihood Ratio Test 311.84*** 268.41***
The table reports the logit estimations and z-statistics in the parentheses. ***, ** and * stand for significance at the 1%, 5% and 10% levels respectively.
Independent variables are one-year lagged. The pooled models are tested using White’s corrected heteroscadasticity robust regressions.
Birkbeck University of London Page 178
In order to identify the most important financial determinants that influence the
probability of paying dividends in the emerging Turkish market, pooled and panel
(random effects) logit regressions estimations are applied. It is argued that a random
effects logit (panel) model, which uses both within and between (group) possible
variations, is more favourable than a pooled logit model (ignoring the firms effects) in
its estimating power, since it allows the derivation of more efficient estimators
(Gujarati, 2003). Therefore, both types of models are employed to find out whether they
provide similar or significantly different results, and more importantly, to identify
which one is more favourable in order to investigate the dividend puzzle in the context
of developing Turkish economy. Accordingly, Panel A in Table 3.6 in the previous page
displays the results of pooled logit estimation coefficients and marginal effects, whereas
Panel B in the same table shows the results of random effects (panel) logit estimation
coefficients and marginal effects of the independent variables on the probability of
paying dividends for Model 1 and Model 2. The following conclusions can be drawn
from the table.
1. When Model 1 and Model 2 are estimated by the pooled logit regressions, they
are overall statistically significant at the 1% level as evidence by the Wald X2
tests.
Also, the Pseudo R2
values for the models (36.32% and 37.92% respectively) suggest a
good indication as to the prediction power of the models. Similarly, the random effects
logit (panel) regressions estimate that the models (1 and 2) are also, overall, statistically
significant at the 1% level as reported by the Wald X2 tests. Further, the Likelihood-
ratio tests are statistically significant at the 1% for both Model 1 and 2, indicating that
the proportion of the total variance, contributed by the panel-level variance component,
rho, values54 are significantly different from zero (0.6343 and 0.6148 respectively).
Therefore, this suggests that panel models are more favourable than pooled models.
Hence, the following results are reported based on the random effects logit models
(Panel B).
54
A likelihood-ratio test formally compares the panel estimator with the pooled estimator for probit, logit
and tobit models. As a rule of thumb, when rho, also known as the intraclass correlation coefficient,
which is the proportion contribution to the total variance of the panel-level components, is zero, then the
panel-level variance component is not important; therefore, the panel estimator is not different from the
pooled estimator.
H0 : Ѳ = 0
H1 : Ѳ ≠ 0
Where, the null hypothesis is that rho is zero, in other words no significant panel effect. This means the
null hypothesis states that the pooled probit/logit/tobit is more appropriate rather than the random effects
probit/logit/tobit model, if it holds true. However, if the null hypothesis is rejected, that means that there
is a significant panel effect and the random effects model is appropriate (Frain, 2008; Cameron and
Trivedi, 2010).
Birkbeck University of London Page 179
2. The probability of a Turkish firm paying dividends is significantly and
positively affected by the ROA variable (profitability). The coefficients of the variable
are statistically significant and positive at the 1% level in both Model 1 and Model 2
(when the industry effect is controlled). Moreover, the results of the marginal effects of
ROA show that it has the largest impact on the probability of paying dividends among
all the significant variables. The marginal effects of this variable are found to be
positively significant at the 1% level in the models (+1.1173 and +1.1043 when the
industry dummies are included), illustrating that one unit of increase in ROA will
increase the probability of a Turkish firm to pay dividends by about 100% for an
average firm. Therefore, this result is consistent with the signalling theory of dividend
policy, arguing that profitable firms are more likely to pay dividends to signal their
good financial performance (Lintner, 1956; Bhattacharya, 1979; Miller and Rock, 1985;
John and Williams, 1985; Benartzi et al., 1997). Similarly, Aivazian et al. (2003b) from
eight different emerging markets, Al-Najjar (2009) from Jordan, Kirkulak and Kurt
(2010) from Turkey and Imran (2011) from Pakistan reported evidence that there is a
strong positive relationship between profitability and dividend payments. Moreover,
Aivazian et al. (2003b) stated that high profitability tends to mean high dividend
payments, and they concluded that this evidence also provides strong support for the
residual dividend theory. Since more profitable firms have more internally generated
funds, only after all positive NPV investments have been undertaken, they are more
likely to distribute cash dividends than less profitable firms (Saxena, 1999; Lease et al.,
2000).
3. The probability of a Turkish firm paying dividends is significantly and
negatively affected by the M/B variable (investment opportunities). The coefficients of
the variable are statistically significant and negative at the 1% level in both Model 1 and
Model 2 (when the industry effect is controlled). Moreover, the marginal effects of this
variable are found to be significantly negative at the 1% level in the models (-0.0344
and -0.0343 when the industry dummies are included), implying that one unit of
increase in M/B will decrease the probability of a Turkish firm to pay dividends by
about 3.4% for an average firm. Accordingly, this finding is consistent with the prior
literature from developed markets, arguing that the higher the investment opportunities,
the more need for funds to finance investments, therefore the more likely the firm is to
preserve earnings for investments rather than paying dividends, by the transaction costs
theory (Rozeff, 1982; Llyod et al. 1985; Schooley and Barney, 1994; Moh’d et al.,
1995), pecking order theory (Myers and Majluf, 1984) and overinvestment hypothesis
Birkbeck University of London Page 180
(Lang and Litzenberger, 1989). Likewise, Kisman (2013) found a significant negative
correlation between investment opportunity and dividend policy in the emerging
Indonesian market.
4. The probability of a Turkish firm paying dividends is statistically and negatively
affected by the DEBT variable (debt policy). The coefficients of the variable are
statistically significant and negative at the 1% level in both Model 1 and Model 2 (when
the industry effect is controlled). Furthermore, the results of the marginal effects of
DEBT display that it has the second largest impact on the probability of paying
dividends among all the significant variables. The marginal effects of this variable are
found to be negatively significant at the 1% level in the models (-0.4043 and -0.3753
when the industry dummies are included), revealing that one unit of increase in DEBT
will decrease the probability of a Turkish firms to pay dividends by around 40% and
37.5% if the industry effect is controlled for an average firm. Hence, this evidence is
consistent with the notion that debt and dividends are alternative mechanisms to control
agency costs associated with the free cash flow problems, and since they are alternative
devices to fulfil the same purpose, debt and dividends are conversely related (Jensen
and Meckling, 1979; Jensen, 1986; Crutchley and Hansen, 1989). Further, the evidence
is also consistent with studies including Aivazian et al. (2003b), who reported that
higher debt ratios consequence none or lower dividend payments in emerging markets,
Al-Najjar (2009) in Jordan and Kisman (2013) in Indonesia, who found a significantly
negative relationship between firm debt levels and dividend policies. Similarly,
Kirkulak and Kurt (2010) presented evidence that debt level significantly influences the
dividend reductions since an increased level of debt increases the dividend reductions in
Turkey.
5. The probability of a Turkish firm paying dividends is significantly and
positively affected by the AGE variable (firm age). The coefficients of the variable are
statistically significant and positive at the 5% level in Model 1 but only at the 10% level
in Model 2, when the industry effect is controlled. Further, the marginal effects of AGE
are also found to be positively significant at the 5% level in Model 1, but only
significant at the 10% level in Model 2 (+0.0795 and +0.0736 respectively), suggesting
that one unit of increase in AGE will increase the probability of a Turkish firm to pay
dividends by about 7-8% for an average firm. Accordingly, this result is consistent with
the maturity hypothesis proposed by Grullon et al. (2002), arguing that since a firm gets
older in terms of age, its investment opportunities decline, which leads to slower growth
Birkbeck University of London Page 181
rates and therefore reducing the fund’s requirements of capital expenditure. Hence,
mature firms tend to have steady earnings with high excess to external capital markets
and they are able to preserve a good level of funds, which allow them to pay higher
dividends.
6. The probability of a Turkish firm paying dividends is statistically and positively
affected by the SIZE variable (firm size). The coefficients of the variable are highly
significant and positive at the 1% level in both Model 1 and Model 2 (when the industry
effect is controlled). Moreover, the marginal effects of SIZE are also found to be
positively significant at the 1% level in the models (+0.1131 and +0.1062 when the
industry dummies are added), indicating that one unit of increase in SIZE will increase
the probability of a Turkish firm to pay dividends by approximately 11% for an average
firm. This result is supported by the agency costs and transactions costs theory of
dividends (Lloyd et al., 1985; Gaver and Gaver, 1993; Moh’d et al., 1995; Redding,
1997; Fama and French, 2001; Farinha, 2002), suggesting a positive relationship
between firm size and dividend policy as a control mechanism. Similarly, the evidence
is also consistent with studies, including Al-Najjar (2009), Imran (2011), Mehta (2012)
and Kisman (2013), which reported that firm size significantly and positively related to
the dividend policies of the firms in different developing countries.
7. The random effects (panel) logit estimations report no significant relations
between the RISK (business risk), FCF (free cash flow), LIQ (assets liquidity) and
TANG (assets tangibility) variables, and the probability of a Turkish firm to pay
dividends. The empirical results indicate that there is a negative correlation between
business risk and dividend policy, in line with studies including Jensen et al. (1992),
Manos (2002), Farinha (2003), Al-Najjar (2009) and Mehta (2012). However, this
negative correlation is found to be insignificant. Moreover, the analyses show no
significant impact of firms’ free cash flow on dividend payment decisions, which is
inconsistent with the arguments related to the agency cost theory (Jensen, 1986; Shleifer
and Vishny, 1997; La Porta et al., 1999; 2000). Consistent with Al-Najjar (2009),
Mehta (2012) and Kisman (2013) who reported that assets liquidity does not have any
effects on dividend policy in different emerging markets, the evidence reveals no
significant relationship between liquidity and dividend policy in Turkish market.
Finally, although the results show a negative association between assets tangibility and
dependent variable, as suggested by Aivazian et al. (2003b) and Al-Najjar (2009), this
negative association is found to be insignificant.
Birkbeck University of London Page 182
8. In order to test for industry-specific effect, 14 different industries classification
dummies are added in the multivariate tests. The empirical results report that the
inclusion of industry dummies does not change the significance levels of the
coefficients of significant variables and results in slightly different marginal effects of
the variables (only in one case, the coefficient of AGE is found to be positively
significant at the 5% level but when the industry effect is controlled, it is observed to be
positively significant at the 10% level) Therefore, there is no considerable impact of the
industry-specific effect detected.
3.4.2 Results of the Tobit Estimations
This part of the study also uses a continuous dependent variable, dividend payout ratio
that is denoted as DPOUT, to indentify the most important firm-specific determinants,
while Turkish firms set their actual level of payout ratios, and hence to provide more
robust empirical results. When the dependent variable is the intensity of paying
dividends, which is left censored at zero, and the distribution of the sample is a mixture
of discrete and continuous variables, a tobit estimation is appropriate (Greene, 2003).
The tobit model has the log-likelihood function, which is made up of two parts. The first
part estimates the classical regression for uncensored observations, whereas the second
part estimates the relevant probability that an observation is censored. Therefore, when
the dividend payout ratio is used as a dependent variable, which is left censored at zero
and includes discrete and continuous variables, then the tobit model is more favourable
and informative than the probit/logit and the ordinary least squares approach (Greene,
2003; Wooldridge, 2010).
Accordingly, Panel A in Table 3.7 on the next page reports the results of pooled tobit
estimation coefficients and marginal effects. Panel B, in the same table, illustrates the
results of the random effects (panel) tobit estimation coefficients and marginal effects of
the independent variables on the dividend payout levels for Model 1 and Model 2, in
order to identify the most important financial determinants, while Turkish firms set their
actual level of payout ratios based on 1,800 firm-year observations from 264 firms
listed on the ISE over the period 2003-2012. From the tobit estimation results displayed
in Table 3.7, the following conclusions are made.
Birkbeck University of London Page 183
Table 3.7 Results of the Tobit Estimations on Dividend Payout Ratio
Model Variables PANEL A: Pooled Tobit PANEL B: Random Effects Tobit
Model 1 Model 2 Model 1 Model 2
Dependent Variable: Dividend Payout Ratio Dividend Payout Ratio Dividend Payout Ratio Dividend Payout Ratio
Independent Variables: Coefficient
Estimates
Marginal
Effects
Coefficient
Estimates
Marginal
Effects
Coefficient
Estimates
Marginal
Effects
Coefficient
Estimates
Marginal
Effects
ROA 5.8711***
(5.99)
1.2586***
(6.13)
6.5323***
(6.34)
1.3668***
(6.56)
5.9435***
(7.46)
0.7435***
(7.74)
6.1409***
(7.65)
0.7719***
(7.86)
M/B -0.1261**
(-2.27)
-0.0270**
(-2.29)
-0.1142**
(-2.29)
-0.0239**
(-2.31)
-0.1919***
(-2.80)
-0.0240***
(-2.82)
-0.1920***
(-2.84)
-0.0241***
(-2.87)
RISK -1.6801***
(-2.82)
-0.3601***
(-2.85)
-1.5357***
(-2.73)
-0.3213***
(-2.75)
-1.1392
(-1.35)
-0.1425
(-1.35)
-1.0497
(-1.17)
-0.1319
(-1.17)
DEBT -1.7269***
(-5.88)
-0.3702***
(-6.03)
-1.4729***
(-5.07)
-0.3082***
(-5.18)
-1.6751***
(-3.48)
-0.2095***
(-3.50)
-1.4614***
(-3.11)
-0.1837***
(-3.12)
FCF 0.0185
(0.65)
0.0039
(0.65)
0.0183
(0.67)
0.0038
(0.67)
0.0013
(0.04)
0.0002
(0.04)
0.0016
(0.04)
0.0002
(0.04)
LIQ 0.0022
(1.08)
0.0004
(1.08)
0.0012
(0.45)
0.0002
(0.45)
0.0023
(0.01)
0.0004
(0.01)
0.0013
(0.02)
0.0001
(0.02)
TANG -0.3886
(-1.39)
-0.0833
(-1.39)
-0.1298
(-0.46)
-0.0271
(-0.46)
-0.8068
(-1.56)
-0.1009
(-1.57)
-0.6026
(-1.28)
-0.0757
(-1.28)
AGE 0.4648***
(3.71)
0.0996***
(3.75)
0.2613**
(2.12)
0.0546**
(2.13)
0.4491**
(2.24)
0.0561**
(2.24)
0.2765**
(2.29)
0.0347**
(2.31)
SIZE 0.4026***
(5.43)
0.0863***
(5.52)
0.4194***
(5.54)
0.0877***
(5.65)
0.5384***
(7.61)
0.0673***
(8.68)
0.5371***
(7.04)
0.0675***
(7.72)
Constant -3.6945***
(-4.51)
-2.9303***
(-4.17)
-4.6148***
(-5.57)
-3.7642***
(-4.45)
YEAR Yes Yes Yes Yes Yes Yes Yes Yes
INDUSTRY - - Yes Yes - - Yes Yes
Number of Observations 1,800 1,800 1,800 1,800 1,800 1,800 1,800 1,800
F Test 5.77*** 5.38***
Wald X2 198.49*** 213.21***
Pseudo R2 14.23% 15.59%
Rho Value 0.3670 0.3411
Likelihood Ratio Test 154.75*** 121.47***
The table reports the tobit estimations and t/z-statistics in the parentheses. ***, ** and * stand for significance at the 1%, 5% and 10% levels respectively.
Independent variables are one-year lagged. The pooled models are tested using White’s corrected heteroscadasticity robust regressions.
Birkbeck University of London Page 184
1. When Model 1 and 2 are estimated by the pooled tobit regressions, they are
overall statistically significant at the 1% level, as evidence by the F test values. Also,
the random effects tobit (panel) regressions estimate that Model 1 and 2 are also overall
statistically significant at the 1% level, as reported by the Wald X2 tests. However, the
Likelihood-ratio tests are statistically significant at the 1% for both models, indicating
that the proportion of the total variance contributed by the panel-level variance
component, rho, values are significantly different from zero (0.3670 and 0.3411
respectively); therefore, the panel models are more favourable than pooled models.
Hence, the following results are reported based on the random effects tobit models
(Panel B) and also compared with the prior results, to see whether they produce similar
or different findings.
2 The results indicate that the dividend payout ratio of a Turkish firm is
significantly and positively affected by the ROA variable (profitability), which is
consistent with the logit estimations. The coefficients and marginal effects of the
variable are statistically significant and positive at the 1% level in both Model 1 and 2.
Moreover, the results of the marginal effects of ROA show that it has the largest impact
(positive) among all the significant variables, illustrating that one unit of increase in
ROA will increase the amount of payout ratio by about 74-77% for an average firm.
Therefore, this evidence suggests that we can accept Hypothesis 1 that there is a
positive relationship between profitability and the dividend payment decisions of
Turkish firms.
3 The results show that the dividend payout ratio of a Turkish firm is significantly
and negatively affected by the M/B variable (investment opportunities), which is
consistent with the logit estimations. The coefficients and marginal effects of the
variable are statistically significant and negative at the 1% level in both Model 1 and 2.
Further, the marginal effects of M/B reveal that one unit of increase in M/B will
decrease the amount of dividend payout ratio by about 2.4% for an average firm. Hence,
the findings provide evidence that we can accept Hypothesis 2a that there is a negative
relationship between investment opportunities and the dividend payment decisions of
Turkish firms.
4 The results indicate that the dividend payout ratio of a Turkish firm is
significantly and negatively affected by the DEBT variable (debt level), which is
consistent with the logit estimations. The coefficients and marginal effects of this
Birkbeck University of London Page 185
variable are highly significant and negative at the 1% level in both Model 1 and 2.
Moreover, the results of the marginal effects of DEBT show that it has the second
largest impact (negative) among all the significant variables, suggesting that one unit of
increase in DEBT will reduce the amount of dividend payout ratio by about 18-21% for
an average firm. Accordingly, the empirical evidence supports Hypothesis 4 that there
is a negative relationship between debt policy and the dividend payment decisions of
Turkish firms.
5 The results show that the dividend payout ratio of a Turkish firm is significantly
and positively affected by the AGE variable (firm age), which is consistent with the
logit estimations. The coefficients and marginal effects of this variable are statistically
significant and positive at the 5% level in both Model 1 and 2. Further, the results of the
marginal effects of AGE reveal that one unit of increase in AGE will increase the
amount of dividend payout ratio by about 3.5-5.5% for an average firm. Therefore, this
evidence suggests that we can accept Hypothesis 8 that there is a positive relationship
between firm age and the dividend payment decisions of Turkish firms.
6 The results indicate that the dividend payout ratio of a Turkish firm is
significantly and positively affected by the SIZE variable (firm size), which is
consistent with the logit estimations. The coefficients and marginal effects of this
variable are highly significant and positive at the 1% level in both Model 1 and 2.
Moreover, the results of the marginal effects of SIZE show that one unit of increase in
SIZE will increase the amount of dividend payout ratio by almost 7% for an average
firm. Hence, the findings support Hypothesis 9 that there is a positive relationship
between firm size and the dividend payment decisions of Turkish firms.
7 The random effects (panel) tobit estimations report no statistically significant
coefficients and marginal effects of the RISK (business risk), FCF (free cash flow), LIQ
(assets liquidity) and TANG (assets tangibility) variables, which is consistent with the
logit estimations. Accordingly, the empirical results suggest no evidence of
relationships between business risk, free cash flow, assets liquidity and assets tangibility
and dividend payout ratios of Turkish firms and therefore they are not considered as
important firm-specific determinants when Turkish firms set their dividend policies.
Hence, Hypothesis 3, 5, 6 and 7 are not supported.
8 In line with the prior results, the panel tobit estimations find no considerable
industry impact when the industry dummies are included in the equation.
Birkbeck University of London Page 186
9 Consequently, the results of the panel tobit estimations are consistent with the
panel logit estimations. Particularly, there is strong and consistent evidence that ROA
(profitability), AGE (firm age) and SIZE (firm size) have significantly positive effects,
whereas M/B (investment opportunities) and DEBT (debt policy) have significantly
negative impact on the dividend policy decisions of Turkish firms.
3.4.3 Further Analyses
In this sub-section, additional tests are conducted in order to confirm the primary
findings. This is done by employing an alternative dividend policy measure, namely
dividend yield.55 Since dividend yield (DYIELD) is a continuous variable, which is left
censored at zero and the distribution of the sample is a mixture of discrete and
continuous variables, a tobit estimation is appropriate. Therefore, dividend yield is
substituted for dividend payout ratio56 as the dependent variable, to further examine the
most important firm-specific determinants affecting the dividend policy decisions of
Turkish firms regarding how much dividends to pay, and to check the robustness of the
primary findings from tobit estimations. Accordingly, Panel A in Table 3.8 on the next
page reports the results of pooled tobit estimation coefficients and marginal effects,
whereas Panel B in the same table shows the results of random effects (panel) tobit
estimation coefficients and marginal effects of the independent variables on the levels of
dividend yield of Turkish firms for Model 1 and 2.
55
Dividend yield variable (denoted as DYIELD) is measured as the ratio of dividend per share to price
per share of firm i at year t during the period, 2003-2012. The descriptive statistics of DYIELD are
illustrated below. As can be seen that the mean ratio of the dividend yield is 0.0185, indicating that the
sampled Turkish firms had the dividend yield of just below 2% over the entire period.
Variable Observations Mean Median Std Dev. Min Max Skewness Kurtosis
Number of Observations 1,846 1,846 1,846 1,846 1,846 1,846 1,846 1,846
F Test 15.10*** 11.98***
Wald X2 372.96*** 377.75***
Pseudo R2 14.52% 15.11%
Rho Value 0.5338 0.5253
Likelihood Ratio Test 342.00*** 315.86***
The table reports the tobit estimations and t/z-statistics in the parentheses. ***, ** and * stand for significance at the 1%, 5% and 10% levels respectively.
Independent variables are one-year lagged. The pooled models are tested using White’s corrected heteroscadasticity robust regressions.
Birkbeck University of London Page 188
At first glance, the results in Table 3.8 display that both pooled tobit and panel tobit
models are overall statistically significant at the 1% level. However, the Likelihood-
ratio tests are statistically significant at the 1% for both Model 1 and 2, indicating that
the proportion of the total variance, contributed by the panel-level variance component,
rho, values, are significantly different from zero (0.5338 and 0.5253 respectively);
therefore, as in case of the prior results, this suggests that panel tobit models are more
favourable than pooled tobit models. Hence, the results are drawn from the random
effects tobit models (Panel B).
The empirical results show that the random effects tobit estimations, when the dividend
yield is used as the dependent variable, provide very similar findings consistent with the
previous results regarding the dividend payout ratio. Although the marginal effects are
found to be different, the amounts of the dividend yield of Turkish firms are
significantly affected by the same variables with the same significance levels and the
same directional impacts as in the case of their dividend payout ratio levels.
Particularly, the amount of dividend yield is significantly and positively affected by
ROA, AGE and SIZE, whereas it is significantly and negatively influenced by M/B and
DEBT. Moreover, the results show no significant relation between RISK, FCF, LIQ and
TANG and the amounts of dividend yield of Turkish firms. Also, inclusion of
INDUSTRY (industry dummies) into the equation shows no considerable industy effect.
Consequently, when the panel tobit regression estimates are used to examine the firm-
specific determinants of Turkish firms’ dividend policy decisions of how much
dividends to pay, by employing an alternative dependent variable, namely dividend
yield, the results show a very similar evidence confirming the robustness of the primary
findings from the panel tobit regressions performed on the dividend payout ratios of the
Turkish firms.
The summary of the empirical results for the research hypotheses is illustrated in Table
3.9 below.
Birkbeck University of London Page 189
Table 3.9 Summary of Estimations Results for the Research Hypotheses
Variables Predicted
Sign
Realised
Sign Findings
Justification of the
Hypotheses
ROA (+) (+)
Profitability has a significantly positive effect on the dividend policy decisions of Turkish
firms. The evidence is consistent with Aivazian et al. (2003b), Al-Najjar (2009), Kirkulak and
Kurt (2010) and Imran (2011), providing support for the signalling theory of dividends and the
residual dividend theory.
Hypothesis 1 is supported.
M/B (+) or (-) (-)
Investment opportunities have a significantly negative effect on the dividend policy decisions
of Turkish firms, contrary to studies (Aivazian et al., 2003b; Al-Najjar, 2009; Kirkulak and
Kurt, 2010; Imran, 2011) reported a positive relation. This is consistent with Kisman (2013),
suggesting evidence for the transaction cost theory, the pecking order theory and the
overinvestment hypothesis.
Hypothesis 2a is supported.
RISK (-) (-)
There is a negative correlation between business risk and dividend policy but this negative
correlation is statistically insignificant. Therefore, the evidence suggests that business risk is
not one of the most important determinants of the dividend policy decisions of Turkish firms.
Hypothesis 3 is not supported.
DEBT (-) (-)
Debt policy has a significantly negative effect on the dividends policy decisions of Turkish
firms. The evidence is consistent with Aivazian et al. (2003b), Al-Najjar (2009) and Kisman
(2013), providing support for the agency cost theory of dividends.
Hypothesis 4 is supported.
FCF (+) (+)
There is a positive correlation between free cash flow and dividend policy but this positive
correlation is statistically insignificant. Hence, the evidence suggests that free cash flow is not
one of the most important determinants of the dividend policy decisions of Turkish firms.
Hypothesis 5 is not supported.
LIQ (+) (+)
There is a positive correlation between firm liquidity and dividend policy but this positive
correlation is statistically insignificant. Therefore, the evidence suggests that firm liquidity is
not one of the most important determinants of the dividend policy decisions of Turkish firms.
Hypothesis 6 is not supported.
TANG (-) (-)
There is a negative correlation between assets tangibility and dividend policy but this negative
correlation is statistically insignificant. Hence, the evidence suggests that assets tangibility is
not one of the most important determinants of the dividend policy decisions of Turkish firms.
Hypothesis 7 is not supported.
AGE (+) (+) Firm age has a significantly positive effect on the dividend policy decisions of Turkish firms,
which is consistent with the maturity hypothesis proposed by Grullon et al. (2002). Hypothesis 8 is supported.
SIZE (+) (+)
Firm size has a significantly positive effect on the dividend policy decisions of Turkish firms.
The evidence is consistent with Al-Najjar (2009), Imran (2011), Mehta (2012) and Kisman
(2013), providing support for the agency cost theory and the transaction costs theory of
dividends.
Hypothesis 9 is supported.
Birkbeck University of London Page 190
3.5 Conclusions
This chapter of the thesis investigates the firm-specific (financial) determinants of
dividend policy decisions after the implementation of major economic and structural
reforms starting with the fiscal year 2003 in the Turkish market, where an ideal setting
is provided to study the dividend behaviour of an emerging economy (a civil law
originated country), which employed the common laws in order to integrate with world
markets. Therefore, the study focuses on a recent large panel dataset of 264 corporations
(non-financial and non-utility) listed on the ISE, over a ten-year period 2003-2012,
including 1,846 firm-year observations in logit models and 1,800 firm-year observations
in tobit models. Particularly, empirical examinations establish how the ISE-listed firms
are affected by the firm-specific determinants while setting their dividend policies, and
whether they follow the same firm-specific determinants of dividend policy as
suggested by empirical studies from developed markets during the research period. In
addition, it considers a more comprehensive empirical model by estimating the effects
of various firm-specific determinants on dividend policy, employs richer regression
techniques (the pooled and panel logit/probit and tobit estimations) and uses alternative
dividend policy measures (the probability of paying dividends, dividend payout ratio
and dividend yield) in order to provide more valid, consistent and robust results.
The dividend policy of Turkish firms is analysed in two steps: (1) decisions to pay or
not pay and (2) how much dividends to pay. The results indicate that profitability, debt
policy, firm size, investment opportunities and firm age are the determinants primarily
affecting the dividend policy decisions of Turkish firms.
The positive association between firm profitability and dividend policy is consistent
with the signalling hypothesis, arguing that profitable firms pay larger dividends to
signal their good financial performance. This positive relation also may be due to the
residual dividend theory, proposing that more profitable firms have more internally
generated funds and, only after all positive net NPV investments have been undertaken,
hence they will distribute larger dividends than less profitable firms. Furthermore, the
negative relationship between debt ratio and dividend policy supports the view that debt
and dividends may be alternative mechanisms to control the problems associated with
agency problems and, since they are alternative devices to fulfil the same purpose, debt
and dividends are conversely related. It may also be that debt implies an increase in both
dependency on external financing, and in the total risk of the firm’s stocks, because debt
Birkbeck University of London Page 191
represents the fixed costs that firms have to repay, increasing the need for re-financing.
Accordingly, higher level of debt consequences a higher level of fees when external
finance is raised. Hence, firms with high levels of debt tend to maintain their earnings in
order to lower external financing costs, thus lowering its dividends.
The study findings further indicate the positive relationship between firm size and
dividend policy, suggesting that larger firms are more likely to have more dispersed
ownership structures and, in this context, face higher potential agency costs. Also,
larger firms are more likely to be mature and have easier access to capital markets to
raise external finance at lower costs. Hence, the lower transaction costs and higher
potential for agency problems, suggest a positive relationship between firm size and
dividend payments as a control mechanism. Moreover, the level of investment
opportunities is another firm-specific determinant that negatively influences dividend
policies of the firms. This negative influence implies that firms with better investment
opportunities choose lower dividend payments, which is consistent with the transaction
cost, pecking order and agency cost theories; the higher the growth, the more is the need
for funds to finance investments. Therefore, the more likely the firm is to preserve
earnings rather than paying dividends because external finance is costly.
The results show that more mature firms, in terms of age, distribute higher dividends,
consistent with the maturity hypothesis, suggesting that since a firm gets older its
investment opportunities decline, which leads to slower growth rates and therefore
reducing the fund’s requirements of capital expenditure. Thus, mature firms tend to
have steady earnings with high excess to external capital markets, and they can be able
to preserve a good level of funds, which allow them to pay higher dividends.
Furthermore, the study presents no evidence of a significant relationship between
dividend policy and business risk, free cash flow, assets liquidity and assets tangibility,
and therefore they are not considered as the important firm-specific determinants while
the ISE firms set their dividend policies. Finally, the analyses indicate no considerable
industry effect on the dividend policies of Turkish firms.
Aivazian et al. (2003b) report that the dividend policies of firms in emerging markets
are affected by the same firm-specific determinants as their counterparts in the US;
however, emerging market firms may be more sensitive to some of these determinants
and may react differently, indicating the greater financial constrains in different
countries under which they operate. Consequently, the study results are consistent with
Birkbeck University of London Page 192
the findings of Aivazian et al.’s (2003b) research and suggest that Turkish firms follow
the same firm-specific determinants of dividend policy as proposed by dividend
theories, and as suggested by empirical studies conducted in developed markets, after
Turkey implemented major reforms in the fiscal year 2003. Particularly, the primary
firm-specific determinants of dividend policy are profitability, debt level, firm size,
investment opportunities and firm age in the context of emerging Turkish market.
Birkbeck University of London Page 193
APPENDIX II
RESULTS OF THE PROBIT ESTIMATIONS
Birkbeck University of London Page 194
Although probit and logit estimations provide qualitatively similar results, the main
difference between them is that the probit model57 uses the normal distribution, whereas
the logit model uses the logistic distribution (Gujarati, 2003). In this context, the
corresponding probit models, where the dependent variable is the binary variable and
the independent variables have the same previous definitions, are developed to examine
the most important firm-specific determinants affecting the probability of paying
dividends in the Turkish market, and to check whether they confirm similar results as
reported by the logit estimations. Accordingly, Panel A in Table 3.10 on the following
page displays the results of pooled probit estimation coefficients and marginal effects,
whereas Panel B in the same table shows the results of random effects (panel) probit
estimation coefficients and marginal effects of the independent variables on the
probability of paying dividends for Model 1 and 2.
The results illustrate that both pooled and panel probit models are overall statistically
significant at the 1% level. However, the Likelihood-ratio tests are statistically
significant at the 1% level for both Model 1 and 2, indicating that the proportion of the
total variance, contributed by the panel-level variance component, rho, values, are
significantly different from zero (0.6443 and 0.6255 respectively). Hence, as in the case
of logit estimations, this suggests that panel probit models are more favourable than
pooled probit models.
The results of the random effects probit models (Panel B) report almost the same results
(the same levels of significance of the coefficients and very similar marginal effects) as
reported by the random effects logit estimations. Particularly, the probability of a
Turkish firm paying dividends is significantly and positively affected by ROA, AGE
and SIZE, whereas it is significantly and negatively influenced by M/B and DEBT.
Further, the results show no significant relation between RISK, FCF, LIQ and TANG
and the probability of paying dividends. Finally, there is no considerable industry
impact found when the industry dummies are included in the equation. Consequently,
the results of the probit models are consistent, compared to the results of logit models,
confirming very similar findings regarding the decisions of Turkish firms on whether to
pay cash dividends or not.
57
The probit model uses the normal distribution and the probability function in this estimation model can
be presented as follows:
Prob (Y=1 | x) = φ (X',β)
Prob (Y=0 | x) = 1 – F(X',β)
Where, φ is the cumulative distribution function of the normal distribution. β presents the impact of the
change on X on the probability (Greene, 2003).
Birkbeck University of London Page 195
Table 3.10 Results of the Probit Estimations on Probability of Paying Dividends
Model Variables PANEL A: Pooled Probit PANEL B: Random Effects Probit
Number of Observations 1,846 1,846 1,846 1,846 1,846 1,846 1,846 1,846
Wald X2 503.23*** 515.45*** 218.91*** 220.22***
Pseudo R2 36.09% 37.56%
Rho Value 0.6443 0.6255
Likelihood Ratio Test 318.28*** 277.89***
The table reports the probit estimations and z-statistics in the parentheses. ***, ** and * stand for significance at the 1%, 5% and 10% levels respectively.
Independent variables are one-year lagged. The pooled models are tested using White’s corrected heteroscadasticity robust regressions.
Birkbeck University of London Page 196
CHAPTER 4
DIVIDEND POLICY AND SIGNALLING THEORY:
EVIDENCE FROM TURKEY
4 Dividend Policy and Signalling Theory: Evidence
from Turkey
Birkbeck University of London Page 197
4.1 Introduction
The aim of this chapter is to investigate whether the ISE-listed firms adopt deliberate
cash dividend policies to signal information to investors, and whether they follow stable
cash dividend payments as in developed markets by using Lintner’s (1956) partial
adjustment model, and several extensions of this model, since the fiscal year 2003 when
Turkey began to implement serious economic and structural reforms for a better
working of the market economy, outward-orientation and globalisation, in other words
for market integration.
Accordingly, the chapter contributes to the literature in several ways. First of all, it is
the first major research to our knowledge that examines the information content of cash
dividend payments and dividend smoothing over time in Turkey (during its market
integration process in the post 2003 period), using Lintner’s (1956) partial adjustment
model. Second, unlike previous studies (Adaoglu, 2000; Aivazian et al., 2003a), this
chapter provides a large-scale dataset that covers a more recent long period of time.
Third, it further pursues several extensions of the Lintner model by adding additional
explanatory variables (lagged earnings, external finance and year dummies to capture
the effect of 2008 global financial crisis).
Dividend policy has attracted a great deal of attention from financial economists in
corporate finance literature. Questions such as why firms pay dividends, why investors
care, and to what extent dividend policy may affect firm’s market value have been
subject to a long-standing argument (Baker and Powell, 1999). Miller and Modigliani
(1961) assert that, under the circumstance of a perfect capital market with rational
investors and perfect certainty, a managed dividend policy does not affect the firm value
and therefore it is irrelevant. Under such circumstances, the valuation of the firm
depends on the productivity of the firm’s assets, not the type of dividend payout.
However, real world capital markets are subject to various market imperfections, such
as information asymmetries, differential taxes, transaction costs and agency problems.
These imperfections have led to the development of many competing theories of
dividend policy in order to explain why companies pay, or not pay dividends (Lease et
al., 2000).
Lintner (1956) was the first researcher to investigate the information content of
dividends, and he found that US firms follow extremely deliberate dividend payout
policies, contrary to M&M’s (1961) prediction. In his pioneering study in 1956, Lintner
Birkbeck University of London Page 198
showed that US firms tend to smooth dividends relative to earnings; they only increase
dividend payments when they believe that earnings can sustain higher dividend levels
permanently. They were also reluctant to cut dividends unless adverse circumstances are
likely to persist, since dividend cuts are bad signals to the market. Lintner (1956)
concluded that US firms have target payout ratios and make partial adjustments toward
their target ratios to smooth dividend payment streams in the short-run and therefore
they pursue stable dividend policies.
Various studies from developed countries have been strongly supportive of Lintner’s
(1956) findings and reported consistency of results across many studies and different
periods of time, including Darling (1957), Brittain (1964; 1966), Fama and Babiak
(1968), McDonald et al. (1975), Chateau (1979), Dewenter and Warther (1998), Baker
et al. (1985), Baker et al. (2002), Brav et al. (2005) and Chemmanur et al. (2010).
Further, Baker et al. (1985, p. 83) stated that “……the results show that the major
determinants of dividend payments today appear strikingly similar to Lintner’s
behavioural model developed during the mid-1950’s.” Similarly, Benartzi et al. (1997)
and Baker and Powell (1999) concluded that Lintner’s model of dividends has been the
best description of the dividend setting process available even after all these years.
Several empirical studies have examined the information content of dividends as
proposed by Lintner (1956) in emerging stock markets and have reported mixed
evidence in these developing markets. Aivaizan et al. (2003a) compared the dividend
policy behaviour of firms operating in eight different emerging economies with the
dividend policies of US firms, and they reported that the Lintner basic model still works
for US firms but it does not work very well for emerging firms, since current dividends
are much less sensitive to past dividends in these markets. However, Mookerje (1992)
in India, Pandey (2001) in Malaysia, Al-Najjar (2009) in Jordan, Chemmanur et al.
(2010) in Hong Kong, Al-Ajmi and Abo Hussain (2011) in Saudi Arabia and Al-
Malkawi (2014) in Oman found evidence supporting the Lintner model in explaining
dividend behaviour in these emerging markets, but they generally have higher
adjustment factors, hence lower smoothing and less stable dividend policies compared
to developed countries. Contrarily, Adaoglu (2000) found inconsistent results with the
Lintner argument in the Turkish market and reported that Turkish firms follow unstable
dividends policies.
Birkbeck University of London Page 199
The main motivation of this thesis is to carry the dividend debate into an emerging
market but, in a different way from prior research, it examines the dividend policy
behaviour of a particular emerging market that implemented serious economic and
structural reforms for the integration with world markets, and attempts to identify what
behaviour of the dividend policy of this emerging market shows afterwards. In this
respect, Turkey and its stock market (the ISE) offer ideal setting for the purpose of this
thesis by allowing to study the dividend behaviour of an emerging market which
implemented major reforms starting with the fiscal year 2003 in compliance with the
IMF stand-by agreement, the EU directives and best-practice international standards for
a better working of the economy, outward-orientation and globalisation.
Financial markets in Turkey were strictly regulated until a financial liberalisation
programme was implemented in 1980. After the adoption of related regulations enacted
and launched in the subsequent years, the Istanbul Stock Exchange was officially
established in December 1985 and commenced its operations on January 3, 1986 (CMB,
2003). A number of studies revealed that Turkey has a bank-based financial system
(Aivazian et al., 2003a; 2003b) where private sector banks dominate the market and are
mainly part of a bigger family-owned commercial corporations (Erturk, 2003). Indeed,
Turkish firms generally have the concentrated and pyramidal ownership structures
dominated by families who generally own business groups, including banks, businesses
and subsidiaries in the same group. As a result of this infrastructure, families have
control over many banks that belong to their business groups, and the banks’ lending
decisions. This has led to business groups obtaining much of their finance from their
own banks, in other words allowing non-arm’s length party transactions (Yurtoglu,
2003; IIF, 2005; Aksu and Kosedag, 2006).
In this context, Aivazian et al. (2003a; 2003b) argue that dividend policy may be a more
useful pre-commitment and signalling device in markets that are greatly dependent on
arm’s length transactions. However, the financial systems in emerging markets like
Turkey are generally characterised by closely held bank-financed companies in where
the direct interactions between shareholders and corporate creditors, who have access to
private information, reduce the need for dividends as a signal and therefore make
dividend stability less important. Similarly, Dewenter and Warther (1998) suggest that
stable dividend policy may not be important for firms that rely on bank debt due to the
close ties between managers and lenders.
Birkbeck University of London Page 200
Dividend policy decisions are not always solely dependent on managers’ judgement,
since factors such as regulations, financial crisis and trends in macro-economy might
also have implications for firms’ dividend policies (Kirkulak and Kurt, 2010). The
evidence from cross-country studies (La Porta et al., 2000; Aivazian et al., 2003a) has
revealed that there are regulatory differences related to the dividend policy making
process forced by governments throughout the world. The civil law countries, typically
emerging economies, generally have weaker laws in terms of protecting minority
shareholders’ rights, relative to the rich common law countries (La Porta et al., 1999;
2000) and hence these emerging markets are likely to enforce constrains on dividend
policy in order to protect both minority shareholders and creditors (Glen et al., 1995).
Public corporations listed on the ISE are subject to the regulatory policies put into effect
by the CMB of Turkey. Indeed, the dividend policy in the ISE was heavily regulated
when it first started to operate in 1986. For the fiscal years 1985-1994, the first
mandatory dividend policy was implemented by the enactment of Capital Markets Law
in 1982 and, according to the first regulation on dividend payments, the ISE-listed firms
were obliged to distribute at least 50% of their distributable income as a cash dividend,
which was known as “first dividend” in the Turkish capital market. Without paying the
“first dividend”, all other dividend payments, such as the payments to employers or
maintaining it as retained earnings, were not legally possible (Adaoglu, 1999; 2000).
The main purpose of this mandatory dividend payment regulation was to protect
minority shareholders rights by providing them satisfactory levels of dividends since the
liquidity in the stock capital markets was almost non-existent. There was no stock
exchange before 1986 and the only source of income for minority shareholders was the
dividend income (Aytac, 1998).
The limited research (Adaoglu, 2000; Aivazian et al., 2003a) conducted in the emerging
Turkish market showed that the Lintner model did not work well in explaining dividend
behaviour in Turkey; the ISE-listed firms followed unstable cash dividend payments
and the level of current earnings of firms in a given year were the main determinant
affecting the firms’ cash dividend payments. However, Adaoglu (2000) and Aivazian et
al. (2003a) examined the dividend behaviour of Turkish firms for the period while the
dividend payments of the ISE listed firms were heavily regulated due to the first
mandatory dividend policy (they were obliged to pay at least 50% of their distributable
income as cash dividends) imposed by the CMB, which did not provide much flexibility
to the managers of these firms in choosing their own dividend policies. Therefore, one
Birkbeck University of London Page 201
can expect that cash dividend payments were solely dependent on the firms’ current
year earnings, as forced by regulations, and any variability in earnings of the firms was
directly reflected in the level of cash dividends. In this period, Turkey also had issues
with insider lending, in other words non-arm’s length transactions, within business
groups owned by families, which reduced the need for dividend signalling and stability
for the ISE firms, as suggested by Aivazian et al. (2003a; 2003b) and Dewenter and
Warther (1998).
Following the November 2002 elections which resulted in one-party government
(whereby political uncertainty, to some degree, diminished), the new Turkish
government signed a standby agreement with the IMF and began to implement major
economic programs and structural reforms for a better working of the market economy,
outward-orientation and globalisation in March 2003 (CMB, 2003; Adaoglu, 2008;
Birol, 2011). Turkey’s progress in achieving full membership of the EU in this period
also provided a strong motivation in establishing new reforms, rules and regulations to
improve corporate governance and transparency and disclosure practices; therefore, to
integrate its economy with Europe and to harmonise its institutions with those of the EU
(IIF, 2005; Aksu and Kosedag, 2006). Accordingly, there are reasons that may suggest
the ISE-listed firms may adopt dividend smoothing and follow stable dividend policies
as in developed markets after the implementation of major reforms in 2003.
Along with many other regulations and reforms, the CMB of Turkey made many
amendments to improve the transparency and quality of the banking sector and adopted
“The Banking Sector Restructuring Program” in May 2001 for restructuring the public
banks, rehabilitating the private banking system, and strengthening surveillance and
supervision frame to increase efficiency in the sector (BRSA, 2010). Moreover, with the
introduction of “Regulation on Establishment and Operations of Banks” in July 2001,
the risk group definition and calculation of loan limits for a single business group
(including banks, businesses and subsidiaries in the same group), considering direct and
connected lending, were established to prevent insider lending (non-arm’s length
transactions) as a source of financing. Therefore, the ISE firms turned to the equity
market with a greater incentive for more transparent financing (IIF, 2005).
Another reason that might suggest the ISE firms may smooth their dividends relates to
the much more flexible mandatory dividend policy regulations imposed by the CMB
after the implementation of major reforms in 2003. The CMB replaced the second
Birkbeck University of London Page 202
mandatory dividend policy that forced the ISE firms to pay at least 20% of their
distributable income as the “first dividend”. However, in a more flexible way from the
first mandatory dividend payment policy between 1985 and 1994, the listed firms did
not have to pay the “first dividend” solely in cash but had the option of distributing it in
cash dividends or stock dividends or a mixture of both, which was subject to the board
of directors’ decision. The total payment could not, however, be less than 20% of the
distributable income for the fiscal year 2003. Further, for the fiscal year 2004, the CMB
increased the minimum percentage of mandatory dividend payments for the ISE-listed
firms from 20% to 30%, which also stayed at this level for the fiscal year 2005. Then,
the minimum percentage of mandatory dividend payment level was again reduced to
20% in the fiscal year 2006 and remained at this level for the fiscal years 2007 and
2008. Nevertheless, from the fiscal year 2009 and onwards (2010, 2011 and 2012), the
CMB decided to not determine a minimum dividend payout ratio and abolished
mandatory minimum dividend payment distribution requirement for the ISE firms,
which provided total freedom for the ISE-listed firms to make their own dividend policy
decisions (Adaoglu, 2008; Kirkulak and Kurt, 2010).
Empirical research in developing markets contributed relatively little evidence
compared to the empirical evidence conducted in developed markets. A few empirical
studies reviewed in Chapter 2 have provided some evidence as to whether managers are
concerned about dividend smoothing over time in a number of different emerging
markets, as proposed by Lintner (1956). However, it can be observed that there is only
narrow evidence from the Turkish market, which is subjected to following issues. First,
applying Lintner’s (1956) model, Adaoglu (2000) examined the dividend policy of
Turkish firms for the period 1985-1997 and Aivazian et al. (2003a) covered the period
1983-1990. It is certain that the results from these two studies are relatively old and
perhaps outdated. Hence, one can suggest that there is need for evidence from recent
data. Second, unlike the results of Adaoglu (2000) and Aivazian et al. (2003a), the ISE
firms may adopt deliberate cash dividend policies to signal information to investors
during the period, when the mandatory dividend policy is considerably relaxed and the
insider lending (non-arm’s length transactions) is prevented as a source of financing,
following the implementation of major reforms in 2003. Third, Adaoglu’s (2000) data
sample included only the ISE listed firms with at least 5 years of nonzero cash
dividends. Therefore one can argue that the study may be biased due to the sample
selection errors, since only analysing regular or frequent dividend-paying companies
Birkbeck University of London Page 203
may lead to different results and these results may not represent dividend policy
behaviour of the market as a whole. Likewise, although Aivazian et al. (2003a) reported
evidence from eight different markets, they stated that their Turkish data included a
limited number of only largest listed firms. Hence, the results regarding the Turkish
market may be biased due to limited sample selection procedures.
Accordingly, the aim of this chapter is to empirically investigate the information content
of cash dividends as proposed by Lintner (1956) over a decade after the implementation
of major economic and structural reforms, starting with the fiscal year 2003, in the
Turkish market, and to also provide more evidence on this developing country, by
attempting to fill the gaps in the literature, as pointed out in the above criticisms. In
particular, the chapter contributes to the dividend literature in the following aspects.
First, Turkey offers an ideal setting to study the dividend behaviour of an emerging
market (a civil law originated country) which employed the common laws in order to
integrate with world markets. Therefore, the chapter examines how the ISE-listed firms
set their cash dividend payments and whether they follow stable dividend policies, as in
developed markets, after the implementation of major reforms in 2003. Second, it uses a
large-scale dataset that covers a more recent long period of time. Third, it employs
richer research methodologies (the pooled OLS, random effects, fixed effects and
system GMM analyses). Finally, it attempts to answer the following research questions:
1. Does Lintner’s (1956) partial adjustment model work to explain dividend policy
behaviour in the emerging Turkish market? Do results show support to the dividend
signalling hypothesis?
2. What are the implications of the Lintner’s coefficients (the speed of adjustment
and target payout ratio) in the Turkish market? Do the ISE-listed firms smooth their
dividend payments and follow stable dividend policies?
3. Is the pooled OLS more suitable to investigate the Lintner’s model in the
Turkish market or are the panel models (random effects and fixed effects) more
favourable than pooled OLS?
4. Does the system GMM estimation provide consistent results with the
preliminary findings from the pooled OLS or the panel models, or does it provide
significantly different results?
Birkbeck University of London Page 204
5. When adding other variables such as lagged earnings, external finance and year
dummies (to capture the effect of the 2008 global financial crisis) into the basic Lintner
model, does the model work better in explaining dividend behaviour in Turkey?
The remainder of this chapter is organised as follows. The following section 4.2 reviews
the previous studies and develops the research hypotheses. The methodology and data
are explained in section 4.3. Section 4.4 presents the empirical results, whereas section
4.5 summarises the conclusions of this chapter of the study.
4.2 Previous Studies and Research Hypotheses
In a pioneering study of dividend policy behaviour, Lintner (1956) developed a
mathematical model, after an extensive field research of US companies, to test for the
stability of cash dividend payments, where he suggests that each firm has a target
dividend level in a given year, which is a function of earnings in that year and its target
payout rate, as illustrated below:
Dit*
= ri Eit (4.1)
Where Dit* is the target dividend payment for firm i in year t, ri is the target payout ratio
for firm i and Eit is the net earnings in year t for firm i. Lintner (1956) further argues that
the firm will only adjust dividends partially toward the target dividend level in any
given year. Hence, the actual difference in dividend payments from year t-1 to year t
can be given by:
Dit – Di(t-1) = αi + ci (Dit* − Di(t-1)) + uit (4.2)
Where αi is the intercept term, ci is the speed of adjustment coefficient for firm i, uit is
the error term, Dit is the actual dividend payment for firm i in year t and Di(t-1) is the
previous year’s (t-1) dividend payment for firm i. By substituting ri Eit for the target
dividend payment (Dit*) in the model and rearranging Equation 4.2, the following
empirically testable equation can be equivalently obtained:
Dit = αi + β1Eit + β2Di(t-1) + uit (4.3)
Where β1 = ci ri and β2 = (1−ci). According to Lintner (1956), the constant term (αi) is
expected to have a positive sign to reflect management’s reluctance to reduce dividends,
Birkbeck University of London Page 205
and the speed of adjustment coefficient (ci) shows the stability in dividend payment
changes and calculates the speed of adjustment toward the target payout ratio (ri) in
response to earnings changes. Hence, the value ci reflects the dividend smoothing
behaviour of the firm i to changes in the level of earnings; a higher value of ci implies
less dividend smoothing, in other words unstable dividend policy, and vice-versa.
Consequently, Lintner (1956) suggests that firms set their dividends in line with their
current earnings and their previous year dividends, and they make partial adjustments to
a target payout ratio and do not correspond immediately with the changes in earnings.
Empirical support of Lintner’s (1956) model of dividends was provided by early
studies. Darling (1957), Brittain (1964; 1966) and Fama and Babiak (1968) re-evaluated
and extended the Lintner model by adding other variables, or undertaking more
comprehensive approaches, and they all confirmed the original findings of Lintner that
US companies follow stable dividend policies. Similarly, several empirical studies
examined corporate dividend policy behaviour in different developed markets and
showed support to Lintner’s (1956) argument. McDonald et al. (1975) examined the
dividend, investment and financing decisions of French firms, and reported that
dividends of French firms are well explained by profit and lagged dividends in the
dividend model of Lintner (1956), whereas investment and financing variables were
insignificant in the dividend equation. Chateau (1979) tested the partial adjustment
model on large Canadian manufacturing firms. The study findings revealed that
Canadian corporations follow stable dividend policies. Especially, they are relatively
more conservative compared to American firms when it comes to short-term dividend
strategies even though they have a higher average payout ratio. Further, Dewenter and
Warther (1998) compared dividend polices of US and Japanese firms, and found that
the speed-of-adjustment estimates from Lintner (1956) model confirm that US
dividends are smoother than Japanese dividends and Japanese firms reduce dividends in
response to poor performance more quickly than US firms.
Survey researchers have taken another path to study the actual behaviour of
corporations in setting their dividend policies. Instead of using secondary data, they
have asked corporate managers about their perceptions of dividends. Despite survey
responses possibly suffering from non-response and incorrect response bias, they
supplement methods of inferring management motives by providing direct evidence
about managerial attitudes (Baker et al., 2002). Numerous researchers surveyed chief
Birkbeck University of London Page 206
financial officers of US firms regarding their dividend policy decisions, including Baker
et al. (1985), Baker and Farrelly (1988), Pruitt and Gitman (1991), Baker and Powell
(1999), Baker et al. (2002) and Brav et al. (2005). In general, evidence from survey
research suggested that the major determinants of dividend policy decisions are still
strikingly similar to Lintner’s (1956) findings and managers tend to avoid spectacular
changes in dividend rates that may soon need to be reversed, have a target payout ratio
and periodically adjust their dividends toward the target. Benartzi et al. (1997, p.1032)
concluded that “…..Lintner’s model of dividends remains the best description of the
dividend setting process available.”
A number of studies investigated dividend policy behaviour in different developing
countries by using Lintner’s (1956) model. For instance, Mookerjee (1992) applied the
Lintner model to firms in the private sector in a developing country, India. The results
showed that the basic Lintner model performs well in explaining dividend payout
behaviour during the period 1950-1981 in India. However, the explanatory power of the
model was significantly increased by the inclusion of external finance as an additional
explanatory variable in the dividend model. In Turkey, Adaoglu (2000) found that the
main factor that determined the cash dividend payments was the current earnings. Also,
Lintner’s speed of adjustment factor was found to be 1.00, which was at the maximum
level, meaning that the ISE firms did not smooth the dividends during the period 1985-
1997. Until 1995, the ISE firms were regulated to pay 50% of their distributable income
as cash dividends. Because of this regulation of compulsory distribution of profits, the
firms followed earnings-oriented dividend policies and any variability in the earnings of
the firm was directly reflected in the level of cash dividends. Even though 1995
regulatory change provided greater flexibility to the ISE firms in choosing their own
dividend policies, they continued to follow unstable dividend policies during the period
1995-1997.
Pandey’s (2001) empirical study showed support for the Lintner model in the emerging
Malaysian market, revealing that Malaysian firms relied both on past dividends and
current earnings in setting the current period’s dividend payments during the period
1993-2000. Nevertheless, they had lower payout ratios and higher adjustment factors,
pointing out that the Malaysian firms have low smoothing and less stable dividend
policies. Furthermore, in their famous study regarding dividend policy behaviour in
emerging markets, Aivazian et al. (2003a) compared the dividend behaviour of firms
operating in developing countries with the dividend policies of US firms. Their sample
Birkbeck University of London Page 207
consisted of the largest firms from eight emerging markets (South Korea, Malaysia,
Zimbabwe, India, Thailand, Turkey, Pakistan and Jordan) and 100 US firms over the
period 1980-1990. The study results showed that current dividends in developing
countries were much less sensitive to lagged dividends than the US control sample of
companies and the Lintner model indeed still worked well for the US firms, whereas it
did not work very well for the emerging market companies. Aivazian et al. (2003a)
concluded that the institutional structures of developing countries compose corporate
dividend policy a less feasible mechanism for signalling or for reducing agency costs
than for US firms operating in capital markets with arm’s length transactions.
In another study, Al-Najjar (2009) used the Lintner model to investigate dividend
smoothing and stability of Jordanian firms during the period 1994-2003. The study
findings reported that the Lintner model successfully explains Jordanian markets'
dividend behaviour and further suggested that the Jordanian firms have target payout
ratios. They slowly adjust dividends to their target but relatively faster than those in US
(developed) market. Chemmanur et al. (2010) compared corporate dividend policies in
Hong Kong and the US from 1984 to 2002. Their analysis of the Lintner model revealed
that dividend payout in Hong Kong is more closely related to current year earnings and
therefore the extent of dividend smoothing by firms in Hong Kong is considerably less
than those in the US.
Al-Ajmi and Abo Hussain (2011) studied the stability of dividend policy in the
emerging Saudi Arabian market for the period 1990-2006. The empirical results showed
that lagged dividends and current earnings have the expected signs and are statistically
significant as proposed by Lintner (1956). Further, Saudi firms have more flexible
dividend policies since they act quickly to increase dividend payments and are willing
to cut or skip dividends when earnings decline. More recently, Al-Malkawi et al. (2014)
examined dividend smoothing of Omani companies using Lintner’s (1956) partial
adjustment model and the extended version covering the period 2001-2010. Their
results provided empirical evidence supporting the validity of Lintner’s original
findings; Omani companies seem to adjust their dividends toward the target payout ratio
gradually, more interestingly with a relatively low speed of adjustment, as compared to
other firms in developed and emerging economies. In addition, the empirical evidence
also suggested that the 2008 global financial crisis had no significant impact on
dividend stability of Omani corporations.
Birkbeck University of London Page 208
Financial markets in Turkey were strictly regulated until a financial liberalisation
programme was implemented in 1980. After the adoption of related regulations enacted
and launched in the subsequent years, the Istanbul Stock Exchange was officially
established in December 1985 and commenced its operations on January 3, 1986 (CMB,
2003). A number of studies revealed that Turkey is a civil law country (La Porta et al.,
1997) where corporate ownership structure is characterised by highly concentrated
family ownership (Gursoy and Aydogan, 1999 and Yurtoglu, 2003), and has a bank-
based financial system (Aivazian et al., 2003a; 2003b) where private sector banks
dominate the market and are mainly part of bigger family-owned business groups;
including banks, businesses and subsidiaries in the same group (Erturk, 2003). As a
result of this infrastructure, families have control over many banks that belong to their
business groups and the banks’ lending decisions, which led to business groups
obtaining much of their finance from their own banks, in other words allowing non-
arm’s length party transactions (Yurtoglu, 2003; IIF, 2005; Aksu and Kosedag, 2006).
Dividend policy in the ISE was heavily regulated when it first started to operate in
1986. For the fiscal years 1985-1994, the first mandatory dividend policy was
implemented by the enactment of Capital Markets Law in 1982 and, according to the
first regulation on dividend payments, the ISE-listed firms were obliged to distribute at
least 50% of their distributable income as a cash dividend, which was known as “first
dividend” in the Turkish capital market. Without paying the “first dividend”, all other
dividend payments such as the payments to employers or maintaining it as retained
earnings, were not legally possible (Adaoglu, 1999; 2000). The main purpose of this
mandatory dividend payment regulation was to protect minority shareholders rights by
providing them satisfactory levels of dividends, since the liquidity in the stock capital
markets was almost non-existent, as there was no stock exchange before 1986 and the
only source of income for minority shareholders was the dividend income (Aytac,
1998).
Lintner’s (1956) famous classic study revealed that managers are concerned about
dividend signalling over time and indeed various studies to date in developed as well as
emerging markets have shown consistent results. Contrarily, the limited research
(Adaoglu, 2000; Aivazian et al., 2003a) conducted in Turkey reported that the Lintner
model did not work well explaining dividend behaviour in Turkey; the ISE-listed firms
followed unstable cash dividend payments and the level of current earnings of firms in a
given year was the main determinant affecting the firms’ cash dividend payments.
Birkbeck University of London Page 209
However, Adaoglu (2000) and Aivazian et al. (2003a) examined the dividend behaviour
of Turkish firms for the period while the dividend payments of the ISE listed firms were
heavily regulated due to the first mandatory dividend policy (they were obliged to pay
at least 50% of their distributable income as cash dividends) imposed by the CMB,
which did not provide much flexibility to the managers of these firms to choose their
own dividend policies. Therefore, one can expect that cash dividend payments were
solely dependent on the firms’ current year earnings, as forced by regulations, and any
variability in earnings of the firms was directly reflected in the level of cash dividends.
In this period, Turkey also had issues with insider lending, in other words non-arm’s
length transactions, within business groups owned by families, which reduced the need
for dividend signalling and stability for the ISE firms, as suggested by Aivazian et al.
(2003a; 2003b) and Dewenter and Warther (1998).
Following the November 2002 elections which resulted in one-party, the new Turkish
government signed a standby agreement with the IMF and began to implement major
economic programs and structural reforms for a better working of the market economy,
outward-orientation and globalisation in March 2003 (CMB, 2003; Adaoglu, 2008;
Birol, 2011). Further, Turkey’s progress in achieving full membership of the EU in this
period also provided the strongest motivation in establishing new reforms, rules and
regulations to improve corporate governance and transparency and disclosure practices;
therefore, to integrate its economy with Europe and to harmonise its institutions with
those of the EU (IIF, 2005; Aksu and Kosedag, 2006). Accordingly, there are reasons
that may suggest the ISE-listed firms may adopt dividend smoothing and follow stable
dividend policies as in developed markets after the implementation of major reforms in
2003.
Along with many other regulations and reforms, the CMB of Turkey made many
amendments to improve the transparency and quality of the banking sector and adopted
“The Banking Sector Restructuring Program” in May 2001 for restructuring the public
banks, rehabilitation of private banking system, strengthening of surveillance and
supervision frame to increase efficiency in the sector (BRSA, 2010). Moreover, with the
introduction of “Regulation on Establishment and Operations of Banks” in July 2001,
the risk group definition and calculation of loan limits for a single business group
(including banks, businesses and subsidiaries in the same group), considering direct and
connected lending, were established to prevent insider lending (non-arm’s length
Birkbeck University of London Page 210
transactions) as a source of financing. Therefore, the ISE firms have turned to the equity
market with a greater incentive for more transparent financing (IIF, 2005).
Another reason that might suggest the ISE firms may smooth their dividends relates to
the much more flexible mandatory dividend policy regulations imposed by the CMB
after the implementation of major reforms in 2003. The CMB replaced the second
mandatory dividend policy that forced the ISE firms to pay at least 20% of their
distributable income as the “first dividend”. However, in a more flexible way from the
first mandatory dividend payment policy between 1985 and 1994, the listed firms did
not have to pay the “first dividend” all in cash. They had the option to distribute it in
cash dividends or stock dividends or both, which was subject to the board of directors’
decision but the total payment could not be less than 20% of the distributable income
for the fiscal year 2003. Further, for the fiscal year 2004, the CMB increased the
minimum percentage of mandatory dividend payments for the ISE-listed firms from
20% to 30%, which remained at this level for the fiscal year 2005. Then, the minimum
percentage of mandatory dividend payment level was reduced to 20% again, in the
fiscal year 2006, and stayed at this level for the fiscal years 2007 and 2008.
Nevertheless, from the fiscal year 2009 and onwards (2010, 2011 and 2012), the CMB
decided to not determine a minimum dividend payout ratio, and abolished mandatory
minimum dividend payment distribution requirement for the ISE firms, which provided
total freedom for the ISE-listed firms in making their own dividend policy decisions,
allowing investors to interpret dividend policies of firms efficiently in reflecting their
judgements in the share prices (Adaoglu, 2008; Kirkulak and Kurt, 2010).
In this context, the ISE firms may adopt deliberate cash dividend policies to signal
information to investors during the period, when the mandatory dividend policy is
considerably relaxed and the insider lending (non-arm’s length transactions) is
prevented as a source of financing, following the implementation of major reforms in
2003. Additionally, the evidence conducted by a number of researchers (Mookerje,
1992; Pandey, 2001; Al-Najjar, 2009; Chemmanur et al., 2010; Al-Ajmi and Abo
Hussain, 2011; Al-Malkawi et al., 2014) showed support of the Lintner model in
explaining dividend behaviour in different emerging markets but generally reported
higher adjustment factors, hence lower smoothing and less stable dividend policies
compared to developed countries. Yet, it is hypothesised that the ISE firms also have
dividend behaviour consistent with the Lintner model and they have their target payout
Birkbeck University of London Page 211
ratio and adjust their dividends by dividend smoothing at a degree that may be different
to the developed markets. Therefore:
Hypothesis 1: Cash dividend payments are the functions of the level of net earnings and
the pattern of dividends paid in the previous year in the Turkish market.
Although various studies to date have been strongly supportive of Lintner’s (1956)
findings, reporting consistency in results across different periods of time, his model
has also been criticised for not considering other factors that may possibly affect
dividend policy. Some researchers (Darling, 1957; Brittain, 1964; 1966; Fama and
Babiak, 1968 and Mookerjee, 1992) have attempted to modify and extend Lintner’s
partial adjustment model in order to indentify the best-fit dividend behaviour model.
Accordingly, this chapter of the study further pursues several extensions of Lintner’s
(1956) partial adjustment model by including additional regressors as explanatory
variables that are observed in the literature, and considered to be possibly influencing
dividend policies of the firms in the emerging Turkish market, especially during the
study sample period, 2003-2012. Therefore, the following aspects are discussed and
the corresponding hypotheses are developed.
Since emerging markets are generally characterised by higher volatility and are more
risky, compared to the developed markets (Odabasi et al., 2004), corporations in
these markets might have more cyclical and impermanent earnings, which would
result in fluctuated dividend changes if those corporations do not carefully evaluate
the changes in the levels of earnings and adjust their dividend policies consequently
(Adaoglu, 2000). Therefore, lagged earnings patterns are important to indicate a
record of positive or negative earnings and the persistent earnings problems
(Kirkulak and Kurt, 2010). Indeed, Fama and Babiak (1968) emphasised the
importance of the lagged earnings in determining cash dividend payments of a firm
and re-evaluated the Lintner model by adding the lagged earnings as an explanatory
variable. Fama and Babiak (1968, p.1160) further concluded that “…..The two-
variable Lintner model, including a constant term, Dt-1 and Et , performs well relative
to other models; in general, however, deleting the constant and adding the lagged
profits variable Et-1 leads to a slight improvement in predictive power of the model.”
Accordingly, the following hypothesis is developed to test the effect of adding the
lagged earnings variable into the basic Lintner model in the Turkish market.
Birkbeck University of London Page 212
Hypothesis 2: Cash dividend payments are the functions of the level of net earnings
and lagged net earnings, and the pattern of dividends paid in the previous year in the
Turkish market.
Mookerjee (1992) attempted to examine whether the basic Lintner model explains
dividend payout behaviour in the emerging Indian market, and more interestingly,
drew attention to the importance of the viability of external finance in the context of
developing countries, where the financial and institutional environments, within
which firms operate, are different than those from developed countries. Moreover,
the empirical findings showed that the Lintner model performed well in explaining
dividend behaviour in India over the period 1950-1981, but the inclusion of the
external finance into the model as an explanatory variable significantly improved the
predictive power of the model, which revealed that firms in India used external
finance to augment cash dividend payments. Mookerjee (1992) suggested that this
finding was a reflection of the availability of bank loans provided to Indian firms,
which were legally allowed to use external finance to augment dividend payments, at
subsidised rates. Hence, the viability of external finance might also be an important
determinant of dividend payments.
Dividend policy may be a more useful pre-commitment and signalling device in
markets that are greatly dependent on arm’s length transactions (Aivazian et al., 2003a;
2003b). As previously mentioned, Turkey had issues with insider lending (non-arm’s
length transactions) within business groups owned by families who have control over
many banks, whereby they belong to their business groups, and the banks’ lending
decisions, which may lead to business groups obtaining much of their finance from their
own banks, reducing the need for dividend signalling and stability for the ISE firms.
However, the CMB of Turkey made many amendments to improve the transparency and
quality of the banking sector and adopted related regulations to prevent insider lending
(non-arm’s length transactions) as a source of financing in 2001. Therefore, the ISE
firms have turned to the equity market with a greater incentive for more transparent
financing. This may imply that external financing may have significant effects on cash
dividend payments of the ISE firms, since external financing that they now obtain from
arm’s length parties can be more costly – in fact, a significantly negative effect of debt
on dividend policy decisions of the ISE-listed firms is reported in the previous empirical
chapter. Accordingly, the following hypothesis is formulated to test the effect of adding
Birkbeck University of London Page 213
the external finance (current and lagged level of external financing) variable into the
basic Lintner model in the Turkish market.
Hypothesis 3: Cash dividend payments are the functions of the level of net earnings, the
pattern of dividends paid in the previous year and the level of current and lagged
external finance in the Turkish market.
Turkish economy has often experienced global effects from a number of geopolitical,
financial and economic crises, including the Gulf War Crisis in 1991, the Asia Crisis
in 1997, the Russian Crisis in 1998 and the Argentinean Crisis in 2000. It also
suffered from the big financial shock due to the depreciation of Turkish Lira in 1994,
experienced heavy turmoil from the failure of the Turkish disinflation program in
1999 and had gone through a rigorous banking crisis that resulted in substantial loses
for shareholders, and many corporations declared bankruptcy in 2001 (Adaoglu,
2008; BRSA, 2010; Kirkulak and Kurt, 2010). However, each crisis did not have
obvious impacts for the dividend policies of the ISE-listed firms. For instance, the
economic crisis in 1994, due to the depreciation of the Turkish Lira, did not affect
dividend payment decisions very much, whereas the severe banking crisis in 2001
had an extensive negative effect on dividend payments of the ISE firms (Adaoglu,
2008; Kirkulak and Kurt, 2010). In this respect, Kirkulak and Kurt (2010) examined
dividend policy of the ISE firms from 1991 through 2006, the period that
experienced several financial crises. They used yearly dummies for the years from
1997 to 2002 to capture possible effects of the financial crises on dividend payment
decisions in the Turkish market. The results showed that the crises in 1997 and 1998
did not have any significant effects on dividend policies but the banking crisis in
2001 and its extensive impact in 2002 had significantly negative effects forcing the
ISE firms to reduce or not to pay dividends.
Following the series of geopolitical, financial and economic crises between the early
1990’s and the early 2000s, Turkish economy bounced back and enjoyed a strong
uninterrupted growth until 2007 (Adaoglu, 2008; CMB, 2012). This improvement
was perhaps reflecting a more efficient process since the new Turkish government
signed a standby agreement with the IMF, as well as attempting to integrate its
economy with the EU and began to implement major economic programs and serious
structural reforms in the fiscal year 2003. However, the September 2008 global crisis
also markedly hit Turkey and abruptly interrupted the recent expansion of its
Birkbeck University of London Page 214
economy (Rawdanowicz, 2010; Yorukoglu and Atasoy, 2010; Birol, 2011).
Accordingly, it is worth investigating whether the September 2008 global crisis
affected the dividend payment decisions of the ISE-listed firms, since this study
covers the period 2003-2012. Therefore, the following hypothesis is developed to test
the effect of adding the yearly dummies, which reflect the 2008 global crisis and its
effects in the subsequent years, into the basic Lintner model.
Hypothesis 4: Cash dividend payments are the functions of the level of net earnings
and the pattern of dividends paid in the previous year and are negatively affected by
the 2008 global crisis in the Turkish market.
4.3 Methodology
The following sub-sections describe the methodology used in this chapter of the study.
First, the sample data is explained, followed by the variables and models are presented,
which are employed in order to test the research hypotheses.
4.3.1 Sample Data
The purpose of this chapter is to investigate the information content of cash dividend
payments after the implementation of major economic and structural reforms starting
with the fiscal year 2003, in the emerging Turkish market, by applying the Linter’s
(1956) model, examining how the Turkish firms set their cash dividends, and whether
they prefer stable divided policies as in developed markets. Therefore, the data sample
is drawn from the Istanbul Stock Exchange (ISE) according to the subsequent criteria:
1. First, all companies listed on the ISE during the period 2003-2012 are
considered, unlike some studies (Dewenter and Warther, 1998; Adaoglu, 2000; Baker et
al., 2002; 2006; 2008) that restrict their sample to dividend paying companies.58 A long
panel data set allows testing the degree of dividend smoothing and dividend stability in
a way that cannot be achieved using cross-sectional data.
58
For instance, Dewenter and Warther’s (1998) and Adaoglu’s (2000) studies included only the firms
with at least 5 years of nonzero cash dividend, which may be biased due to the sample selection errors
since only analysing regular or frequent dividend-paying companies may lead to different results and
these results may not represent dividend policy behaviour of the market as a whole. Because, some
companies might not distribute cash dividends as often as regular dividend-payers or they may make
dividends payments regardless of dividend smoothing and dividend stability considerations, whereas
others might tend to avoid such payments in the context of emerging markets but zero cash dividend
payment may still be a dividend policy itself. Therefore, this study includes all companies in order to
prevent the sample selection bias and to obtain results that present dividend policy behaviour of the
Turkish market as a whole during the period 2003-2012.
companies and utilities (gas, electric, water) are excluded, since they are governed by
different regulations and follow arguably different investment and dividend policies.
After these exclusions, a number of all non-financial and non-regulated corporations
remain.
3. Third, accounting and financial data for this research is obtained from
DATASTREAM and the validity of the data is also cross checked with OSIRIS. The
Stock Exchange Daily Official List (SEDOL) codes and International Security
Identification Numbers (ISIN) of the companies are used to match companies between
different databases.
The sample selection criteria result a panel data set of total 264 non-financial and non-
utility firms listed on the ISE from 14 different industries during the period 2003-2012.
In order to minimise possible survivorship bias, both companies that delisted, due to the
mergers and acquisitions, business failure or any other process leading to delisting, and
companies that listed in the different times during the period 2003-2012, are all
considered and included in the sample. Therefore, due to the presence of delisted and
newly listed companies, the sample is not the same for every year; rather it increases
during the ten-year period from 2003 to 2012, which is known as unbalanced panel
data. Furthermore, the selection criteria and distribution of the sample across time and
industries in Table 3.1, and the descriptive statistics for the firm’s characteristics of the
sampled Turkish companies in Table 3.2 are presented in Chapter 3.
Moreover, Table 4.1 on the next page reports the descriptive statistics for the firm’s
dividend policy characteristics from the sampled 264 ISE-listed companies with 2,112
firm-year observations, over the period 2003-2012. Panel A in the table presents the
mandatory dividend payout ratio that was imposed by the CMB, the number of the
sampled firms on the ISE, the percentage of the dividend-paying firms, the average
dividend payout and dividend yield ratios of the firms, across time.
After the implementation of major reforms in 2003, the CMB also re-introduced the
mandatory dividend policy starting in the same year. With the replacement of the
second mandatory dividend policy, the ISE-listed firms were obliged to pay at least
20% of their distributable income as dividends. For the fiscal year 2004, the CMB
increased the minimum percentage of mandatory dividend payments for the ISE-listed
Birkbeck University of London Page 216
firms to 30% from 20%, which remained at this level for the fiscal year 2005. The
minimum percentage of mandatory dividend payment level was then reduced to 20%
again in the fiscal year 2006 and remained at this level for the fiscal years 2007 and
2008. Nevertheless, from the fiscal year 2009 and onwards (2010, 2011 and 2012), the
CMB decided to not determine a minimum dividend payout ratio and to abolished
mandatory minimum dividend payment distribution requirement.59
Table 4.1 Dividend Policy Characteristics for the Sampled Turkish Companies Sample includes 264 firms (non-financial and non-utility) listed on the ISE with 2,112 firm-year
observations during the period 2003-2012. Panel A illustrates the mandatory dividend payout
policy imposed by the CMB, the number of the sampled firms, percentage of the dividend-paying
firms, average payout ratio and average dividend yield ratio for the sampled Turkish firms across
years during the period 2003-2012. Panel B illustrates annual earnings and corresponding cash
dividend changes of the sample over the relevant time period.
Panel A: Mandatory Payout Ratio, Average Payout Ratio and Dividend Yield of the Sample
Fiscal
Year
Mandatory
Dividend
Payout Ratio
Number
of
Firms
Percentage of
the Dividend
Paying Firms
Average Dividend
Payout Ratio of
the Firms
Average Dividend
Yield Ratio of
the Firms
2003 20% 157 20% 15% 1.60%
2004 30% 164 24% 11% 1.63%
2005 30% 199 36% 20% 1.88%
2006 20% 211 40% 18% 1.74%
2007 20% 214 40% 38% 2.51%
2008 20% 215 38% 45% 2.92%
2009 0% 218 33% 24% 1.84%
2010 0% 226 34% 21% 1.55%
2011 0% 249 34% 18% 1.26%
2012 0% 259 34% 28% 1.64%
Overall 12% 264 34% 24% 1.85%
Panel B: Earnings and Cash Dividend Changes for the Sample
Earnings Changes Percentage of Cases in which the ISE Firms
Percentage
of Cases
Increased
Dividends
Decreased
Dividends
Initiated
Dividends
Omitted
Dividends
Continued
Omissions Total
Earnings > 0
Increases 39% 21% 13% 10% 6% 50% 100%
Decreases 31% 21% 20% 7% 28% 24% 100%
Earnings < 0 30% 2% 2% 3% 15% 78% 100%
Total 100% 15% 12% 7% 15% 51% 100%
59
The second mandatory dividend policy replaced by the CMB in 2003 was much more flexible
compared to the first mandatory dividends policy imposed between 1985 and 1994, since the first
mandatory dividend policy required the firms to pay at least 50% of their profit as cash dividends. The
second mandatory dividend policy gave the firms the opportunity to distribute dividends as cash
dividends, stock dividends or a mixture of both, which was subject to the board of directors’ decision.
The total payment, however, could not be less than 20% of the distributable income for the fiscal year
2003. Also, they were given a right to distribute stock dividends with the requirement that the amount of
stock dividends added to the paid-in capital.
Birkbeck University of London Page 217
As can be observed from Panel A in Table 4.1, the number of firms in the sample
consistently increased from 157 in 2003 to 259 in 2012. Among those ISE-listed firms,
20% of them paid cash dividends in 2003 and the percentage of dividend payers
increased, reaching its peak at 40% in 2006 and 2007. However, the dividend-paying
firms slightly dropped to 38% in 2008, followed by a further decline, and stayed at the
level of 33-34% in the subsequent years. Similarly, the average dividend payout ratio
and dividend yield ratio of the sampled Turkish firms showed similar patterns that
increased and reached their peak in 2008, experiencing a decrease in the following
years. This may be the negative consequences of the 2008 global financial crisis, which
occurred during this period.
Panel B in Table 4.1 demonstrates the analysis performed to monitor the cash dividend
policy responses of Turkish firms to earnings changes for 2,112 firm-year observations
over the period 2003-2012. The annual changes in earnings are categorised as earnings
increases and decreases when there is profit (earnings > 0), and the third category stands
for when annual earnings are negative (earnings < 0). The annual changes in dividends
are categorised as dividend increases, decreases, dividend initiations, dividend
omissions and continued omissions, then corresponding dividend responses to earnings
changes are calculated.
When the earnings increased, the Turkish firms increased their cash dividend payments
in 21% of all cases, and they started paying cash dividends in 10% of them, whereas the
firms decreased their cash dividends in 13% of all observations and they stopped
distributing cash dividends in 6% of them. Even though earnings increased, non-
dividend paying Turkish firms continued not to pay cash dividends in 50% of all
observations. In the case of earnings decreases, the Turkish firms omitted paying cash
dividends in 28% of all observations and continued not to distribute dividends in 24%
of them, whereas the firms decreased their cash dividend payments in 20% of all cases.
Although earnings declined, the Turkish firms still increased their cash dividends in
21% of all cases and some of them initiated dividend payments in 7% of all
observations. When earnings are negative, there is a comparatively different distribution
of dividend changes responses by the Turkish firms. Not surprisingly, the firms
decreased (2%), omitted (15%) or kept omitting cash dividends (78%) in total of 95% of
all observations.
Birkbeck University of London Page 218
4.3.2 Variables and Models
4.3.2.1 Variable Descriptions
This study employs the current cash dividend payments for firm i at time t as the
dependent variable, which is denoted as Divi,t and is measured as the total cash common
and preferred dividends paid to shareholders of the firm during the period 2003-2012.
The following two explanatory variables are used in the basic Lintner model, namely
the current net earnings for firm i at time t and the lagged cash dividend payments for
firm i that distributed in the year t-1. The current net earnings (Earningsi,t ) is the net
income after all operating and non-operating income and expense, reserves, income
taxes, minority interest and extraordinary items of the firm during the period 2003-
2012. The second variable is symbolised as Divi,(t-1) and it is the previous year’s cash
dividend payments of the firm in the relevant time interval.
While testing several extensions of Lintner’s (1956) model, the following additional
explanatory variables are further included. The lagged net earnings is denoted as
Earningsi,(t-1) and is the previous year’s net earnings of the firm i (at time t-1) over the
period 2003-2012. Further, the current external finance is defined as the total debt,
which is the sum of long and short term debt, of the firm i at time t and symbolised as
Debti,t, whereas the lagged external finance (Debti,(t-1)) is the previous year’s total debt
of the firm i (at time t-1) during the period 2003-2012. In order to capture the effect of
the 2008 global financial crisis and its impact on the cash dividend payments of the ISE
firms in the following years covered by the sample period, yearly dummies for the years
2008 to 2012, which they take a value of 1 for the year in question and 0 otherwise, are
included on the right hand side of the Lintner (1956) model.
Finally, the importance of industrial classification to the dividend policy has been
argued (Baker et al., 1985 and Moh’d et al., 1995), since firms in different industries
work under different set of regulations and often have different levels of risk and growth
potential. Accordingly, INDUSTRY, which represents industry dummies using
Datastream’s ICB (Industry Classification Benchmark) Codes, is included as a control
variable in regression models.
Table 4.2 on the following page demonstrates the summary descriptions of the research
variables used in the empirical analyses.
Birkbeck University of London Page 219
Table 4.2 Variables and Definitions The table illustrates the research variables, their symbols and definitions used for the partial
adjustment models in the empirical analyses of this chapter of the study.
Variables Symbols Definitions
Dependent Variable
Current Cash Dividend
Payments Divi,t
The total cash dividends paid to shareholders of firm i at year t during the period 2003-2012.
Independent Variables
Current Net Earnings
Earningsi,t
The net earnings after all operating and non-operating
income and expense, reserves, taxes, minority
interests and extraordinary items of the firm i at year t during the period 2003-2012.
Lagged Net Earnings
Earningsi,(t-1)
The previous year’s (at year t-1) net earnings of the
firm i during the period 2003-2012.
Lagged Cash Dividend
Payments
Divi,(t-1)
The previous year’s (at year t-1) total cash dividends
paid to shareholders of the firm i during the period
2003-2012.
Current External
Finance Debti,t
The total debt, which is the sum of long and short
term debt, for firm i at year t during the period 2003-
2012.
Lagged External
Finance
Debtt,(t-1)
The previous year’s (at year t-1) total debt for firm i
during the period 2003-2012.
Year Effects
Year2008
Year2009
Year2010
Year2011
Year2012
Yearly dummies for the years from 2008 to 2012,
which they take a value of 1 for the year in question
and 0 otherwise, to capture the effect of the 2008
global financial crisis and its impact in the following
years covered by the sample period.
Industry Effect
INDUSTRY
Industry dummies using 14 different industry
classifications of the firms, according to Datastream’s
Industry Classification Benchmark (ICB) codes.
4.3.2.2 Research Design and Models
The research is aimed to provide an empirical examination on the signalling theory
explanation, applying Lintner’s (1956) partial adjustment model in order to identify
whether the publicly-listed companies adopt stable dividend policies using dividend
smoothing as proposed by Lintner (1956) in the emerging Turkish market, after the
implementation of major reforms in 2003. Accordingly, a large-scale panel dataset that
covers a relatively recent long time period is created, which allows for testing the
degree of dividend smoothing and dividend stability in this study; the research sample
contains a panel dataset of 264 non-financial and non-utility firms listed on the ISE over
a ten-year period 2003-2012.
Birkbeck University of London Page 220
This chapter of the study uses pooled OLS60 and two types of panel data models, namely
fixed effects61 and random effects62 estimations in order to test the research hypotheses
and to obtain comparable and more valid results. Due to missing observations, because
of newly listed and delisted companies, the sample is not the same for every year over
60
The basic model using pooled ordinary least squares (OLS) is as follows:
Yit = α + β X’it + uit
It has double subscripts, where i denotes for cross-sectional entities in the sample (i = 1,…,N) and t
stands for time period (t = 1,….,T). Yit is the dependant variable and X’it is a K-dimensional vector of the
explanatory variables. Further, α is the intercept, β is the slope of the coefficients of the explanatory
variables and uit is the error term. This pooled OLS approach takes that the intercept, α, and the slope
coefficients in β are identical for all entities and time periods. Similarly, the error term, uit,, is based on the
assumption of independent and identically distributed over entities and time and (Verbeek, 2008).
61 Fixed effects approach (also known as the Least-Squares Dummy Variable model) takes that the slope
of coefficients are constant but the intercept varies between entities to control for omitted variables in
panel data while omitted variables vary across entities but do not change over time (Stock and Watson,
2003). In this case, the model is as follows:
Yit = αi + β X’it + uit
Where, αi has subscript i (i = 1,…,N) to illustrate that the intercept for each entity may be different and
they are fixed unknown constants that are measured along with β, where error term is typically assumed
to be independent and identically distributed over entities and time. In short, all intercept term α is
omitted since it is subsumed by the individual intercept αi. The fixed effects capture all (un)observable
time-invariant differences across entities (Verbeek, 2008). As dummy variables are used to estimate fixed
effects, in the literature this model is also called as the least-squares dummy variable (LSDV) model
(Gujarati, 2003). Moreover, Gujarati (2003) states that fixed effects model allows to differ among
individuals in detection of the fact that each individual, or cross-sectional, entity might have some special
characteristics of its own. Hence, fixed effects model is suitable in situations where the individual-
specific intercept might be correlated with one or more regressors. However, a disadvantage of the model
is that it consumes a lot of degrees of the freedom when the sample, N, is very large, in which case N
dummies have to be introduced in the regression. Also, fixed effects model may not be able to estimate
the impact of time-invariant explanatory variables (such as sex, colour or ethnicity) since they do not
change over time.
62 In the random effects model (also referred as Error Components Model), the intercept αi is treated as a
random variable rather than fixed constant. The αi is assumed to be independent of errors uit and also
mutually independent. Then, the intercept for each firm can be expressed as: αi = α + ui , where α is the
random variable with a mean value of intercept and uit is a random error. Thus, the random effects model
can be written as follows:
Yit = α + β X’it + ui + μit
Or it can be expressed as:
Yit = α + β X’it + wit
Where, wit = ui + μit , which is called the composite error term that consists of two components, ui is the
cross-section or individual-specific error component and μit is the combined time series and cross-section
error component. The term error components model (ECM) derives its name because the composite error
term wit contains of two error components. The random effects model assumes that the intercept of an
individual entity is a random drawing from a much larger population with a constant mean value. The
individual intercept is therefore expressed as a deviation from this constant mean value. The main
advantage of the random effects over fixed effects is that it is efficient in terms of degrees of freedom
since N cross-sectional intercepts do not have to be estimated (only the mean value of the intercept and
its variance need to be estimated). The random effects model is suitable in situations where the random
intercept of each cross-sectional entity is uncorrelated with the regressors (Maddala, 2001; Gujarati,
2003).
Birkbeck University of London Page 221
the period 2003-2012, and hence the study provides an unbalanced panel dataset for the
relevant period. However, the methods used in this study can be used with both a
balanced and unbalanced panel data.
Lintner (1956) used aggregate data to explain dividend decisions of individual firms.
Accordingly, the basic Lintner model of aggregate corporate dividend behaviour is
applied by controlling for industry effect on the Turkish panel dataset, which is
Table 4.3 below displays the descriptive statistics (mean, median, standard deviation,
maximum and minimum values, skewness and kurtosis) for the research variables used
in the empirical analyses. The panel dataset (unbalanced) includes 264 Turkish firms
(non-financial and non-utility) listed on the ISE with 2,112 firm year observations
during the period, 2003-2012. Further, in order to remove the inflation effect over the
Birkbeck University of London Page 222
period, all research variables are measured in real terms and normalised by the
consumer price index (CPI) deflator using 2003 as a base year. The CPI deflator data is
taken from the Central Bank of the Republic of Turkey (CBRT) database.
However, it should be noted that the inflation adjusted descriptive statistics for the
lagged versions of research variables are based on 1,846 firm-year observations. In
addition, all figures of the research variables summarised in the table are in millions of
Turkish Lira (TL).
Table 4.3 Inflation Adjusted Descriptive Statistics of the Research Variables The table reports the descriptive statistics for the research variables. The unbalanced panel
dataset includes 264 firms (non-financial & non-utility) listed on the ISE with 2,112 firm-year
observations over the period 2003-2012. It is worth noting that the descriptive statistics for the
lagged versions of the variables are based on 1,846 firm-year observations.
Variables
Mean
Median
S.D.
Min
Max
Skewness
Kurtosis
Divi,t
20.30 0.000 114.1 0.000 2484 12.97 215.4
Divi,(t-1)
19.42 0.000 111.6 0.000 2484 13.55 236.9
Earningsi,t
46.98 4.556 184.4 -1123 2422 6.541 63.09
Earningsi,(t-1)
43.98 4.446 173.7 -1123 2257 6.383 62.69
Debti,t
196.9 24.99 602.7 0.000 7987 5.838 48.05
Debti,(t-1)
181.6 24.37 554.2 0.000 7581 5.739 46.31
4.3.2.4 Correlation Matrix and VIF Values of the Independent Variables
Table 4.4 below presents the correlation matrix and the Variance Inflation Factors (VIF)
of the independent variables.
Table 4.4 Correlation Matrix & VIF Values of Independent Variables
Divi,(t-1)
Earningsi,t
Earningsi,(t-1)
Debti,t
Debti,(t-1)
VIF
1/VIF
Divi,(t-1)
1.000 2.38 0.420
Earningsi,t
0.715 1.000 3.87 0.258
Earningsi,(t-1)
0.734 0.830 1.000 3.85 0.259
Debti,t -0.479 -0.567 -0.551 1.000 7.82 0.127
Debti,(t-1)
-0.448 -0.573 -0.516 0.939 1.000 7.73 0.129
There seems to be a high correlation between the current and lagged values of the
variables. However, to identify more directly if multicollinearity exists between
independent variables, the VIF statistics are used. As a rule of thumb, the VIF values
Birkbeck University of London Page 223
larger than 10 generally suggest multicollinearity. Tolerance, calculated as 1/VIF, is
also used to check the degree of multicollinearity, if a tolerance value is lower than 0.1,
which corresponds to a VIF value of 10, it implies multicollinearity. As observed from
the table, none of the VIF values exceed 10, nor are the tolerance values smaller than
0.1, the results therefore suggest that there is no serious multicollineariy.
4.4 Empirical Results
The estimation results for the research models using the pooled OLS, random effects,
fixed effects and robustness check (the system GMM) regressions are summarised in
Table 4.5, Table 4.7, Table 4.8 and Table 4.9. The regression estimates are collected
from a large panel dataset of 264 Turkish firms listed on the ISE over the period 2003-
2012. It is noted that the number of the firm-year observations is 1,846 in the different
model specifications.
In order to control for heteroscadasticity, the pooled OLS and fixed effects models are
tested using White’s corrected hetereoscadasticity robust regressions. Hence, the models
in this chapter do not suffer from hetereoscadasticity. This section reports and discusses
the results of the empirical analyses.
4.4.1 The Lintner (1956) Model Analyses
Table 4.5 below reports the results of pooled OLS, panel models (random effects and
fixed effects) and robustness check (the system GMM) estimations applying the Lintner
(1956) model (Model 1). The following conclusions can be drawn from the table.
1. The overall pooled OLS model is significant at the 1% level as evidenced by F-
statistic. Similarly, panel models (the random effects model at the 1% level as
evidenced by the Wald X2 and the fixed effects model at the 5% level as evidence by the
F-statistic) are overall significant.
Birkbeck University of London Page 224
Table 4.5 Results of the Lintner (1956) Model applied on the Turkish Firms
The target payout ratio (r) 0.427 0.463 0.113 0.429
The speed of adjustment (c) 0.342 0.354 0.788 0.310
Number of Observations
1,846
1,846
1.846
1,846
F-Statistic 34.27*** - 3.73** 219.36***
Wald X2 - 493.19*** - -
R-Squared 81.4% 81.2% 80.2% -
Lagrange Multiplier Test 1.80
F-Test 1.09
Hausman Test†
-
Arellano-Bond test for AR(1) Pr > z = 0.033
Arellano-Bond test for AR(2) Pr > z = 0.307
Hansen overidentifying test Pr > chi2 = 0.216
Number of instruments 59
Notes: Table reports coefficients and t/z-statistics in the parenthesis. The pooled OLS and fixed effects
models are tested using White’s corrected heteroscedasticity robust regressions. Robustness Check
analysis is estimated using Blundell and Bond’s (1998) the system GMM. The two-step, robust (standard
error correction), small (corrections that result in t instead of z test statistic for the coefficients and F
instead of Wald X2 test for overall fit) and orthogonal (maximising sample size in panels with gaps)
commands are used to make the estimations even more robust. ***, ** and * stand for significance at the
1%, 5% and 10% levels respectively. †Since the pooled OLS model is found to be more favourable,
Hausman specification test, which compares the fixed and random effects models, is not needed.
2. The Lagrange Multiplier test statistic is 1.80 (p = 0.179) and not statistically
significant, which means that the pooled OLS model is more appropriate than the
random effects model.63 Further, the F-test value is found to be 1.09 (p = 0.364) and not
statistically significant. Therefore, we cannot reject the null hypothesis that no fixed
effects (group and time) are needed; hence, the pooled OLS is favoured over the fixed
63
Breusch and Pagan (1980) have developed a Lagrange multiplier test for the random effects model
based on the OLS residuals, which helps to determine between random effects and pooled OLS
regressions.
H0 : ơit 2
= 0
H1 : ơit 2
≠ 0
Where, the null hypothesis is that variances across entities are zero, in other words no significant
difference across entities, hence no panel effect. This means that the null hypothesis states that the pooled
OLS is appropriate rather than the random effects, if it holds. Nevertheless, if the null hypothesis is
rejected, that means that there is panel effect and the random effects model is appropriate (Greene, 2003).
Birkbeck University of London Page 225
effects model as well.64 Since both null hypothesis of Lagrange Multiplier test and F-test
are not rejected, the pooled OLS is consequently the most appropriate model and
therefore the following results regarding the Lintner (1956) model are reported, based
on the pooled OLS estimations. This is consistent with Al-Najjar (2009), who found the
pooled OLS model is more favourable than panel models. Aivazian et al. (2003a) too
obtained their estimations by the pooled OLS regressions. However, Adaoglu (2000)
reported that the random effects model is more suitable to examine dividend behaviour
of Turkish firms during the period 1985-1997 by applying the Lintner model. In
addition, it is worth noting that, the Hausman65 specification test compares fixed and
random effects models in order to decide which one is more favourable. Nevertheless,
as the pooled OLS model is found to be more appropriate than the panel models in this
study, the Hausman specification test is not needed.
3. The R-squared value of 81.4 is very high and suggests that the model is able to
explain about 81% of the variation in cash dividend payments in the ISE-listed firms.
This is consistent with Lintner’s (1956) original study that reported the R-squared value
of 85% in the US, Adaoglu’s (2000) research that found the adjusted R-squared value of
89% in Turkey, Al-Najjar’s (2009) empirical work that showed the R-squared value of
80% in Jordan, and Chemmanur et al. (2010) who reported the adjusted R-squared
values of 84% in the US and 86% in Hong Kong in their study.
4. Lintner (1956) found that the regression constant was significant and positive in
his original model. He interpreted this finding as the indication that US managers are
reluctant to avoid dividend cuts even when earnings decrease, unless adverse
circumstances are likely to persist. The regression constant for the ISE-listed firms is
found also to be positive (3.8 million TL) but not significant, suggesting that there is a
64 The F-test compares a fixed effect model with a pooled OLS model. In a regression model of that Yit =
α + μi + Xit ′β+ Ɛit, the null hypothesis is that all dummy parameters except for one for the dropped are all
zero;
H0 = μ1 =.…. = μn-1 = 0
The alternative hypothesis is that at least one dummy parameter is not zero. If the null hypothesis rejected
(at least one group/time specific intercept is not zero), it may be concluded that there is a significant fixed
effect; therefore, the fixed effects model is better than the pooled OLS (Park, 2011). 65
Hausman (1978) proposed a test based on the difference between the random effects and fixed effects
estimates by testing the correlation between the explanatory variables (X) and the individual random
errors (ui). Since the fixed effects model is consistent when ui and Xit are correlated but the random effects
model is inconsistent, a statistically significant difference is interpreted as evidence against the random
effects assumptions. Hausman test checks for strict exogeneity, if no correlation is detected then the
random effects should be employed. Further, the test implements the null hypothesis that the random
effects estimator is more efficient than the fixed effects estimator (Wooldridge, 2010).
Birkbeck University of London Page 226
tendency for the Turkish firms to not decrease their cash dividends, but they are not as
reluctant as the US companies.
5. The empirical results show that current earnings and lagged cash dividend
payments are positively significant factors in determining current cash dividend
payments of the listed Turkish firms, since the regressions coefficients of earnings and
lagged cash dividends are found to be positive and significant at the 1% significance
level. This indicates that the Lintner’s (1956) partial adjustment model works well for
explaining cash dividend policy behaviour of the ISE firms during the period 2003-
2012, after Turkey implemented major economic and structural reforms in 2003 as well
as adopting more flexible mandatory dividend policy regulations and attempting to
prevent insider lending (non-arm’s length transactions). This is inconsistent with earlier
research (Adaoglu, 2000; Aivazian, 2003a), which showed no support to the validity of
the Lintner model in the Turkish market; possibly due to the relatively much poorer
structural and microeconomic policies, poorer culture of corporate governance,
transparency and disclosure practices, with weaker minority investors protections and
the presence of rigid mandatory dividend policy imposed to the ISE firms during the
earlier periods. Therefore, we can accept Hypothesis 1 that cash dividend payments are
the functions of the level of net earnings and the pattern of dividends paid in the
previous year in the Turkish market.
4.4.2 Robustness Check for the Lintner (1956) Model
One of the major advantages of panel data is the ability to model individual dynamics.
A dynamic model can be estimated on an individual level by including one or more
lagged values of the dependent variable among its explanatory variables (Baltagi, 2002).
Indeed, Lintner’s (1956) partial adjustment model suggests that the current behaviour of
cash dividend payments depends upon the past behaviour of cash dividends along with
the current level of earnings.
Although Gujarati (2003) argues that the partial adjustment model can be consistently
estimated by the OLS,66 adding a lagged dependent variable in the right-hand side of the
66
The partial adjustment model (PAM) or also called the stock adjustment model, provided by Marc
Nerlove, is examined with regard to the lagged dependent variable and stochastic term. The model
considers that there is equilibrium, optimal, desired or long-term amount of capital stock needed to
provide a given output under the given state of interest. For simplicity let this desired level of capital (Y*)
be a linear function of output X as follows (Gujarati, 2003):
Yt * = α + β1 Xt +ut
Birkbeck University of London Page 227
equation may complicate the estimation and, if the lagged dependent variable is
correlated with the error term, then the OLS estimation results become inconsistent and
biased (Greene, 2003).67 Accordingly, a more advanced method, namely the “System
Generalised Method of Moments (GMM)" is also employed to estimate the Lintner
(1956) model on the Turkish sample, to provide more robust results, and to find out
whether the pooled OLS model findings are consistent compared to the system GMM
specification results.
Since the desired level of capital (Yt
*) is not directly observable, Nerlove develops the following
proposition, as the partial adjustment hypothesis:
Yt - Yt-1 = δ (Yt* - Yt-1)
Where, δ is known as the coefficient of adjustment, or speed of adjustment, and varies between zero and a
unit (0 < δ ≤ 1). Further, Yt - Yt-1 is the actual change and (Yt*
- Yt-1) is the desired change. As the change
in capital stock between two periods is nothing but investment, then it can be written as:
It = δ (Yt* - Yt-1)
Where, It is the investment at time t. Hence, the equation suggests that the actual change in investment in
any given time is some fraction speed of adjustment, δ, of the desired change for that time period. If δ = 1,
it means that the actual stock of capital is equal to the desired stock in where the actual stock adjusts to
the desired stock immediately in the same time period. On the other hand, if δ = 0, it means that nothing
changes since the actual stock in period t is the same as in the previous time period. Further, the
adjustment mechanism can also be expressed as follows:
Yt = δYt* + (1-δ)Yt-1
Indicating that the actual capital stock at period t is a weighted average of the desired capital stock and at
that period and the lagged capital stock, and δ and (1-δ) are being the weights. Now substitution of the
adjustment mechanism into the linear model gives:
Yt = δα + δβ1 Xt + (1-δ)Yt-1 + δut
This final form of the model is called the partial adjustment model. In this equation, once the speed of
adjustment coefficient, δ, is estimated (from the coefficient of the lagged dependent variable, which
would be β2 = 1-δ), the long-run function can be easily derived by basically dividing δα and δβ1 by δ and
omitting the lagged dependent variable (Gujarati, 2003).
In short, if an explanatory variable in a regression model is correlated with the stochastic disturbance
term, the OLS estimators are biased and inconsistent, even the sample size is increased indefinitely, the
estimators do not approximate their true population values (in the case of distributed-lag model, where the
current and lagged values of explanatory variables in the regression). However, the partial adjustment
model is different and it can be consistently estimated by OLS despite the presence of the lagged
dependant variable. Because, in the partial adjustment model, disturbance term is δut , where 0 < δ ≤ 1 and
although the lagged dependent variable, Yt-1, depends on ut-1 and all the previous disturbance terms, it is
not related to current error term, ut . Hence, as long as ut is serially independent, Yt-1 will also be
independent or at least uncorrelated with ut , then satisfying an important assumption of OLS that is non-
correlation between explanatory variables and stochastic disturbance term (Gujarati, 2003).
67
Similarly, substantial complications may also arise in estimation of such a model in both fixed effects
and random effects setting when a lagged dependent variable appears as an explanatory variable and is
correlated with the error term(s). If the individual effects are treated as fixed, then the number of
individual specific parameters increases with the number of cross-sectional units, N, but over only a short
period of time in where the fixed effects formulation is no longer consistent in that case. Further, when
the individual specific effects are treated as random and the lagged dependent variable is correlated with
the compound disturbance in the model, the problem is more obvious since the same individual specific
effects enter the equation for every observation (Hsiao, 1986; Greene, 2003).
Birkbeck University of London Page 228
Arellano and Bond (1991) suggest a GMM estimator based on a first-differenced
equation in order to deal with the dynamic panel model, where the differences are
instrumented by lagged levels of the regressors, providing heteroscadasticity-consistent
and asymptotically correct standard errors for statistical inferences. Nevertheless, the
first-differenced GMM method has some econometric weaknesses. For instance,
Blundell and Bond (1998) show that when the explanatory variables are persistent over
time, the lagged levels of these variables are weak instruments for the regression model
expressed in first-differences. Second, the coefficients of time invariant explanatory
variables, such as industry dummies, cannot be estimated, since the first-differencing
transformation eliminates these variables from the equation (Ngobo et al., 2012).
Moreover, Blundell and Bond (1998) develop another estimator – the System GMM –
derived from a system of two simultaneous equations; one in levels with lagged first
differences as instruments, and the other in first differences with lagged levels as
instruments (Presbitero, 2006). The system GMM estimation technique can significantly
improve efficiency as well as preventing the weak instruments problem in the first-
differenced GMM estimator, allowing for time-invariant variables that would be
eliminated in a difference GMM (Blundell and Bond, 1998; Roodman, 2006; 2009).
Therefore, the Lintner (1956) partial adjustment model based on 1,846 firm-year
observations from 264 firms listed on the ISE over the period 2003-2012 is also re-
estimated by using the system GMM estimator in order to deal with the dynamic panel
model where a lagged dependent variable is included in the right hand-side of the
equation as an explanatory variable (consistent with a number of studies such as
Presbitero, 2006; Antonios et al., 2006; Ngobo et al., 2012; He, 2012; Caixe and
Krauter, 2013).
In using the system GMM on estimating the Lintner model, the lagged cash dividend
payments variable is treated as predetermined, whereas the current year earnings and
industry dummies are defined as exogenous in the equation. Furthermore, the two-step
system GMM estimator that uses one-step residuals to build the asymptotically optimal
weighting matrix is applied, since it is more efficient than the one-step estimators in
presence of heteroscedasticity and serial correlation (Davidson and MacKinnon, 2004).
Although asymptotically more efficient, the two-step GMM shows estimates of the
standard errors that may be severely downward biased, but this problem can be solved
using Windmeijer (2005) standard error correction, which employs finite-sample
correction to the two-step covariance matrix (Roodman, 2006). Hence, the two-step
Birkbeck University of London Page 229
robust system GMM is applied to estimate the model. In addition, small-sample
adjustments (corrections that result in t instead of z test statistic for the coefficients and
F instead of Wald X2 test for overall fit) and orthogonal deviations (maximising sample
size in panels with gaps) are used to make the estimations even more robust, as
suggested by Roodman (2006; 2009). The system GMM estimation results are
presented in the last column of Table 4.5 and the following conclusions can be drawn.
1. The overall system GMM regression model is significant at the 1% level as
evidenced by F-statistic. However, the validity of the results also depends on the
adequacy of the model for the assumptions in the system GMM. Arellano-Bond (1991)
test checks for serial correlation; if the model is well specified, then we expect to reject
the null hypothesis of no autocorrelation of the first order (AR(1)), and to accept the
null hypothesis of no autocorrelation of the second order (AR(2)). Accordingly, as can
be observed from Table 4.5, the Arellano-Bond first-order and second-order tests for
autocorrelation in the residuals rejected and accepted, respectively, the null hypothesis
of no autocorrelation for the model, as required by Arellano and Bond (1991), which
support the model specification.
2. Furthermore, the Hansen’s (1982) overidentification test (J statistic) checks for
the validity of instruments, where non-rejection of the null hypothesis suggests that the
instrument set can be considered valid, which means that a higher p-value of the Hansen
statistic is better (a perfect p-value of Hansen statistic would be 1.00). In this context,
the system GMM specification of the Lintner model applied on the Turkish sample
passes the Hansen J statistic test (corresponding p-value of 0.216) for overidentifying
restrictions, confirming that the instruments are valid in the model, since it did not reject
the null hypothesis for the conventional significance levels (1%, 5% and 10%).68 It is
worth noting that Roodman (2006; 2009) emphasises to mind and report the instrument
count. As a rule of thumb, the number of instruments should not exceed the number of
N (cross-sectional units - firms in this study); otherwise, too many instruments can
overfit endogenous variables and fail to expunge their endogenous components, which
consequently weaken the power of the Hansen test. However, the quantity of the
instruments used in the model (59) is considerably lower than the number of firms
(264), suggesting the robustness of the results.
68
However, Roodman (2009) suggests that not only the conventional significance levels (1%, 5% and
10%) but also higher significance levels, such as the 25%, should be considered while checking a Hansen
test p-value and any values below the 25% level may be seen as potential signs of trouble.
Birkbeck University of London Page 230
3. The regression constant is positive but not significant, as in the pooled OLS
model.
4. The estimated coefficients on the lagged cash dividend and current earnings are
both positive and statistically significant at the 1% level, indicating that the Lintner’s
(1956) partial adjustment model works well for explaining cash dividend policy
behaviour of the ISE-listed firms during the period 2003-2012. Consequently, one can
observe that the system GMM estimations are very similar to those in pooled OLS
regression model; therefore, this confirms more valid, robust and reliable results from
both estimation methods.
4.4.3 Implications of the Linter (1956) Model in the Turkish Market
The model developed by Lintner (1956) suggests that all companies have a target
payout ratio r (hereafter TPR) and companies do not move immediately to the target
dividend payments, but instead, smooth out changes in their dividends by moving part
of the way to the target dividend payments each year. The speed with which companies
adjust their cash dividends is defined by the speed of adjustment c (hereafter SOA)
parameter shows how responsive a company’s cash dividends are to changes in
earnings. A lower value of c indicates a slower adjustment, while a higher value of c
indicates speedier adjustment (0 < c ≤ 1). Accordingly, the SOA parameter of 1.00 is at
its maximum level, implying that the companies do not adjust or smooth their cash
dividends; they basically rely on their long-run target payout ratios. Then, a reverse
argument is valid for the SOA values that are close to zero, meaning that those
companies smooth their cash dividend payments and slowly adjust to their TPRs.
As Table 4.5 presents the TPR (r) is 42.7% (0.146/0.342) and the SOA (c) parameter is
0.342 (1-0.658) for the ISE-listed firms based on the pooled OLS estimations (because
it is found to be more favourable than the panel models). Further, the system GMM
estimation results confirm very similar TPR, r = 42.9% (0.133/0.310) and SOA
parameter, c = 0.310 (1-0.690) for the firms in Turkish market, consistent with the
pooled OLS model, which suggest that ISE-listed firms adjust their cash dividend
payments towards their target payout ratios and that Turkish firms smooth their
dividends and therefore follow stable cash dividend policies over the period 2003-2012.
Adaoglu (2000) found the SOA factor was 1.00, which was at its maximum level and
means that the ISE-listed firms did not smooth their cash dividends during the earlier
years between 1985 and 1997, while they were obliged to pay at least 50% of their
Birkbeck University of London Page 231
distributable profit as cash dividends by the first mandatory dividend policy imposed by
the CMB. During this period, he also found that the TPR was 51.7%, which was
consistent with the mandatory dividend policy requirement. Therefore, not surprisingly,
the main factor determined the cash dividend payments was the level of current earnings
in a given year, and any variability in the earnings of the firm was directly reflected in
the level of cash dividends. Consequently, the Turkish firms followed unstable dividend
policies. The empirical results in this chapter, however, are contradictory to Adaoglu’s
(2000) findings and indicate that the ISE firms do indeed adjust their cash dividend
payments toward their target payout ratios by smoothing their dividends and employing
stable cash dividend policies over the period 2003-2012.
Various studies have examined corporate dividend behaviour using the Lintner model in
developed and emerging markets. Table 4.6, on the next page, reports the estimates of
the Lintner parameters, namely the SOA and TPR, from the present, and a number of
previous empirical studies conducted in different markets or time periods for
comparison purposes. The SOA obtained in the current study (0.34 based on the pooled
OLS and 0.31 based on the system GMM) is very close to the value of 0.30 obtained by
Lintner (1956) and relatively lower than the value of 0.45 reported by Fama and Babiak
(1968) for US companies. Moreover, Brav et al. (2005) found that the SOA estimates of
US firms are 0.66, 0.35 and 0.22 for the periods 1950-1964, 1965-1983 and 1984-2002
respectively. The present study estimate is lower than that for the first period and close
to the one in the second period, but higher than the estimate provided for the third
period. Recently, Chemmanur et al. (2010) reported SOA estimate of 0.28 for US
companies, which is slightly lower than that of the current study for ISE firms.
However, Dewenter and Warther (1998) found much smoother SOA estimates of 0.06
and 0.09 for US and Japanese firms respectively over the period 1983-2002.
Compared to the other emerging markets, the SOA of the current research is much
lower than that found by Mookerjee (1992) for India (c = 0.73), Al-Najjar (2009) for
Jordan (c = 0.43), Chemmanur et al. (2010) for Hong Kong (c = 0.68) and Al-Ajmi and
Abo Hussain (2011) for Saudi Arabia (c = 0.71) but slightly higher than that
documented by Al-Malkawi et al. (2014) for Oman (c = 0.26). Therefore, it can be
concluded that the ISE-listed firms generally have lower speed of adjustment factors,
hence higher smoothing and more stable dividend policies compared to the other
emerging markets, and they now smooth their dividend payments as their counterparts
in the developed US market.
Birkbeck University of London Page 232
Table 4.6 Summary of Empirical Studies on Lintner's (1956) Parameters The table illustrates the estimates of the Lintner parameters, namely the speed of adjustment and
target payout ratio, from the present and a number of previous empirical studies conducted in
different time periods or markets.
Study Market Period SOA TPR
Lintner (1956) USA 1918-1953 0.30 0.50
Fama & Babiak (1968) USA 1946-1964 0.45 0.33
Mookerjee (1992) India 1950-1981 0.73 0.85
Dewenter & Warther (1998) USA 1983-1992 0.06 -
Japan 1983-1992 0.09 -
Adaoglu (2000) Turkey 1985-1997 1.00 0.52
Pandey (2001)a
Malaysia 1993-2000 0.20 to 0.63 0.12 to 0.76
Brav et al. (2005) USA 1950-1964 0.66 0.35
1965-1983 0.35 0.24
1984-2002 0.22 0.11
Al-Najjar (2009) Jordan 1994-2003 0.43 0.48
Chemmanur et al. (2010) USA 1984-2002 0.28 -
Hong Kong 1984-2002 0.68 -
Al-Ajmi & Abo Hussain (2011) Saudi Arabia 1990-2006 0.71 0.43
Al-Malkawi et al. (2014) Oman 2001-2010 0.26 0.79
Present Study – by the pooled OLS Turkey 2003-2012 0.34 0.43
Present Study – by the system GMM Turkey 2003-2012 0.31 0.43
Notes: SOA= Speed of adjustment, TPR = Target payout ratio. a The study used the Lintner model to test
the stability of the Malaysian firms in six different industrial sectors and reported the SOA and TPR
values that vary considerably across the industrial sectors.
Another parameter of interest is whether the ISE firms have a TPR or not. Lintner
(1956) argues that companies set a long-term target payout ratio and adjust gradually
toward the target. Accordingly, the TPR of 43% (based on both the pooled OLS and
system GMM), reported in the present study is comparatively higher than the observed
mean payout ratio of 24% (see Table 4.1), which suggests that the ISE firms do have
long-term target payout ratios and set binding long-term target payout ratios by moving
gradually to their target, consistent with Lintner’s prediction.
4.4.4 Further Analyses
This part presents the empirical results from several extensions of Lintner’s (1956)
partial adjustment model by including additional explanatory variables into the model.
These variables are observed in the literature and considered to be possibly influencing
the dividend policy of the firms in the emerging Turkish market, especially during the
study sample period 2003-2012.
Birkbeck University of London Page 233
4.4.4.1 The Effect of Adding Lagged Earnings in the Lintner (1956) Model
Table 4.7 below reports the results of pooled OLS, panel models (random effects and
fixed effects) and robustness check (the system GMM) estimations for the analyses
when the lagged earnings variable is included into the basic Lintner model as an
explanatory variable (Model 2). The following results are drawn from the table.
Table 4.7 Results of adding Lagged Earnings in the Lintner (1956) Model
The target payout ratio (r) 0.428 0.461 0.109 0.432
The speed of adjustment (c) 0.341 0.353 0.793 0.312
Number of Observations 1,846 1,846 1,846 1,846
F-Statistic 27.52*** 7.42*** 301.22***
Wald X2 - 537.31*** - -
R-Squared 81.4% 81.2% 79.8% -
Lagrange Multiplier Test 1.00
F-Test 0.73
Hausman Test† -
Arellano-Bond test for AR(1)
Pr > z = 0.032
Arellano-Bond test for AR(2) Pr > z = 0.305
Hansen overidentifying test Pr > chi2 = 0.116
Number of instruments 64
Notes: Table reports coefficients and t/z-statistics in the parenthesis. The pooled OLS and fixed effects
models are corrected using White’s corrected heteroscedasticity robust regressions. Robustness Check
analysis is estimated using Blundell and Bond’s (1998) the system GMM. The two-step, robust
(standard error correction), small (corrections that result in t instead of z test statistic for the coefficients
and F instead of Wald X2 test for overall fit) and orthogonal (maximising sample size in panels with
gaps) commands are used to make the estimations even more robust. ***, ** and * stand for
significance at the 1%, 5% and 10% levels respectively. †Since the pooled OLS model is found to be
more favourable, Hausman specification test, which compares the fixed and random effects models, is
not needed.
1. The pooled OLS, random effects and fixed effects models are all overall
statistically significant at the 1% level, but the Lagrange Multiplier test statistic of 1.00
(p = 0.317) and the F-test value of 0.73 (p = 0.603) are not statistically significant at all,
Birkbeck University of London Page 239
indicating that the pooled OLS model is more favourable than the panel models.
Therefore, the following results are reported based on the pooled OLS estimations.
2. When the year dummies (from 2008 to 2012) are included into the basic Lintner
model, the R-squared value remains the same as in the basic Lintner model, which is
found to be 81.4, suggesting that the model explains around 81% of the variations in
cash dividend payments of the ISE firms.
3. The pooled OLS estimations show that the current earnings and lagged cash
dividends variables are positive and statistically significant at the 1% level, whereas the
coefficients of the 2008, 2010, 2011 and 2012 year dummies have all positive signs with
the exception of the 2009 dummy, which is found to be negative; however, none of the
coefficients of the year dummies are statistically significant. This suggests that although
the September 2008 global crisis markedly hit Turkey in various aspects71 and abruptly
interrupted the recent expansion of its economy as in many other world markets,
including both developed and developing countries, it did not significantly affect cash
dividend payments decisions of the ISE firms. Also, despite the global crisis, the ISE
firms continue to follow stable dividend policies, possibly to signal the market about
their good performance. This result is consistent with Al-Malkawi et al.’s (2014)
finding, that the 2008 global crisis had no significant effect on dividend policy and
dividend stability of Omani firms, and they even kept paying high dividends after the
outbreak of the financial crisis. Indeed, the Turkish economy quickly started recovering
from the global crisis starting the second quarter of 2009 by possessing challenges for
fiscal and monetary policy, which required a careful balance between supporting the
recovery and sustaining macroeconomic stability over the longer term (Rawdanowicz,
2010). They praised in having this swift recovery without aid from the IMF (Birol,
2011). Accordingly, the negative coefficient of the 2009 dummy possibly reflects the
tendency of the ISE firms reducing their cash dividends as an initial reaction to the
shocking global financial crisis experienced in late 2008. Since the Turkish economy
swiftly started to recover from the crisis, the coefficients of the following year dummies
are again found to be positive. However, the year dummies are not statistically
71
The September 2008 global financial crisis led to a rapid contraction in the world economy and
financial markets and a deceleration in trade volume. Further, the global crisis significantly affected the
Turkish economy mostly through four aspects. The first was the trading aspect with exports declined
dramatically. The second was the expectation aspect as the household expectations worsened and hence
reducing their consumption due to the financial turmoil. The foreign capital flows were the third aspect
and cross-border lending was decreased during the crisis period. The last one was the credit supply since
banks cut their lending during the crisis, which resulted in a sharp decline in economic activity and an
increase in unemployment (Yorukoglu and Atasoy, 2010).
Birkbeck University of London Page 240
significant in any cases. Nor are they affecting the validity of the basic Lintner model,
or the stability of the ISE firms’ dividend policies. Therefore, we cannot accept
Hypothesis 4.
4. Furthermore, the robustness check column of the table shows that the overall
system GMM model is significant at the 1% level as evidenced by the F-statistic. The
Arellano and Bond (1991) first-order and second-order tests for autocorrelation in the
residuals are rejected (at the 5% level) and accepted, respectively, the null hypothesis of
no autocorrelation for the model, which show support to the model specification.
Further, Hansen’s overidentification test (J statistic) confirms that the instruments are
valid in the model, since it did not reject the null hypothesis (corresponding p-value of
0.116). Also, the quantity of the instruments used in this model (64) is significantly
lower than the number of firms (264), suggesting the robustness of the results. The
system GMM model also estimates that the current earnings and lagged dividends are
positive and highly significant at the 1% level, whereas the coefficients of the 2008,
2010, 2011 and 2012 year dummies have all positive signs but are insignificant, with
the exception of the 2009 dummy, which is found to be negative and even slightly
significant (at the 10% level). Therefore, the system GMM estimations provide
consistent and robust results in line with the pooled OLS estimations.
4.5 Conclusions
This chapter of the study investigates the information content of cash dividend
payments after the implementation of major economic and structural reforms, starting
with the fiscal year 2003 in the Turkish market. Turkey offers an ideal setting to study
the dividend behaviour of an emerging economy (a civil law originated country), which
employed the common laws in order to integrate with world markets. Therefore, the
study focuses on a recent panel dataset of 264 companies (non-financial and non-utility)
listed on the ISE, over a ten-year period 2003-2012, including 1,846 firm-year
observations. In particular, it empirically examines whether the ISE-listed firms adopt
deliberate dividend policies to signal information to investors and whether they follow
stable dividend policies, as in developed markets, by using Lintner’s (1956) partial
adjustment model over a decade after the mandatory dividend policy regulations are
considerably relaxed and insider lending (non-arm’s length transactions) is prevented as
a source of financing, along with the implementation of major reforms in 2003. Further,
Birkbeck University of London Page 241
the study also considers several extensions of Lintner’s (1956) partial adjustment model
by including additional regressors as explanatory variables that are observed in the
literature and thought to be possibly influencing the dividend policy of the ISE firms
during the study sample period. In addition, it employs richer research models (the
pooled OLS, random effects, fixed effects and system GMM) in order to provide more
valid, consistent and robust results.
The empirical results show that current earnings and lagged cash dividend payments are
positively significant factors in determining current cash dividend payments of the listed
Turkish firms. This indicates that the Lintner’s (1956) partial adjustment model works
well for explaining cash dividend policy behaviour of the ISE firms during the period
2003-2012, after Turkey implemented major economic and structural reforms in 2003,
as well as adopting more flexible mandatory dividend policy regulations and attempting
to prevent insider lending (non-arm’s length transactions). This is contrary to earlier
research (Adaoglu, 2000; Aivazian, 2003a) that showed no support to the validity of the
Lintner model in the Turkish market; possibly due to the relatively much poorer
structural and microeconomic policies, poorer culture of corporate governance,
transparency and disclosure practices with weaker minority investors protections and
the presence of rigid mandatory dividend policy imposed to the ISE firms during earlier
periods.
Furthermore, the results reveal that ISE firms now adjust their cash dividends by a
serious degree of smoothing (0.342 based on the pooled OLS and 0.310 based on the
system GMM), which is generally much lower (hence higher smoothing and more
stable dividend policies) compared to other emerging markets, and is almost as smooth
as their counterparts in the developed US market. Then again, this finding is
inconsistent with Adaoglu (2000) who reported a speed of adjustment factor of 1.00,
implying that the ISE firms did not smooth their cash dividends during the earlier years
between 1985 and 1997. It is also found that the target payout ratio of the ISE firms is
43% (based on both the pooled OLS and system GMM), which is comparatively higher
than the observed average payout ratio of 24% for the listed firms. This suggests that
the ISE companies do have long-term payout ratios and adjust gradually to their target,
consistent with the Lintner’s (1956) prediction, over the period 2003-2012.
Moreover, the empirical results from several extensions of Lintner’s (1956) partial
adjustment model show some important facts regarding the Turkish market over the
Birkbeck University of London Page 242
period that is under investigation. First, adding the lagged net earnings into the basic
Lintner equation increases the predictive power of the model, as suggested by Fama and
Babiak (1968), and suggests that current earnings encourage firms to increase/decrease
their cash dividends. However, the levels of lagged earnings are the dominant
component in terms of net earnings numbers while the ISE-listed firms make their
dividend policy decisions in order to avoid spectacular and frequent changes, which is
in line with Lintner’s (1956) argument. Second, when external finance (current and
lagged total debt) is included into the Lintner model, significantly negative correlations
between the cash dividends and both the current and lagged level of total debt are found,
which possibly reflects that the ISE corporations find external finance that they now
obtain from arm’s length parties more costly. This is because the CMB of Turkey
attempted to prevent insider lending, in other words non-arm’s length transactions, as a
source of financing for business group companies. Third, yearly dummies from year
2008 to 2012 are added into the partial adjustment model in order to identify the effect
of the 2008 global crisis and its impact in the following years. It is found that although
the September 2008 global crisis markedly hit Turkey in various aspects and abruptly
interrupted the recent expansion of its economy, as in many other world markets
including both developed and developing countries, it did not significantly affect cash
dividend payments decisions of the ISE firms, as well as their preferences of following
stable dividend policies.
Consequently, the empirical findings suggest that implementing major economic and
structural reforms, as well adopting more flexible mandatory dividend policy
regulations and attempting to prevent insider lending (non-arm’s length transactions),
lead the ISE firms to follow the same determinants as suggested by Lintner (1956) and
as followed by the US (developed) companies. Particularly, dividend payments of the
ISE firms seem to be affected by previous dividend levels and current earnings.
Furthermore, they attempt to adjust partially their dividends towards their target payout
ratio, more interestingly with a relatively low speed of adjustment as their counterparts
in developed markets. This implies that Turkish companies tend to smooth their
dividends, and adopt stable dividend policies, and therefore it can be concluded that
Turkish corporations have been using cash dividends as a signalling mechanism since
2003 with the implementation of severe economic and structural reforms.
Birkbeck University of London Page 243
CHAPTER 5
AGENCY COST THEORY, OWNERSHIP
STRUCTURE EFFECT AND DIVIDEND POLICY:
EVIDENCE FROM TURKEY
5 Agency Cost Theory, Ownership Structure Effect
and Dividend Policy: Evidence from Turkey
Birkbeck University of London Page 244
5.1 Introduction
This chapter investigates the link between ownership structure and dividend policy
based on the agency cost theory of dividends for the ISE-listed firms since the fiscal
year 2003, when Turkey began to implement serious economic and structural reforms
for a better working of the market economy, outward-orientation and globalisation, in
other words for market integration.
To the best of our knowledge, this chapter is the first to examine the impact of
ownership structure on dividend policy in the emerging Turkish market. In particular,
the chapter attempts to uncover the effects of family involvement (through ownership
and board representation), non-family blockholders (foreign investors, domestic
financial institutions and the state), and minority shareholders on dividend payment
decisions of the ISE-listed firms related to the agency cost theory argument, after
Turkey implemented major economic and structural reforms in 2003.
In their classic study, Berle and Means (1932) drew attention to the prevalence of
widely held corporations in which ownership structure of firms is dispersed among
small shareholders but the control is concentrated in the hands of managers. The Berle
and Means widely held corporation is extensively accepted in finance literature as a
common organisational form for large firms in the richest common law countries such
as the US, the UK, Canada, and Australia. In this respect, one of the most widely studied
explanations for why firms pay dividends is the agency cost theory, which derives from
the problems associated with the separation of management (the agent) and ownership
(the principal), and the differences in managerial and shareholder priorities, also known
as the principal-agent conflict (Jensen and Meckling, 1976). This theory argues that
cash dividends can be used to mitigate agency problems in a company by reducing free
cash flow and forcing management to enter the capital market for financing, hence
leading to induce monitoring by the market (Rozeff, 1982; Easterbrook, 1984; Jensen,
1986).
Prior research has paid extensive amounts of attention to the principal-agency conflict72
and mostly focused on the developed countries, where financial markets are well-
regulated and relatively transparent; mostly contain the publicly-held firms with
dispersed ownership and the control is in the hands of professional managers. In
72
The traditional agency cost theory that drives from the owner (the principal)-manager (the agent)
conflict is also referred to as Agency Problem I in this study like prior studies.
Birkbeck University of London Page 245
contrast, outside the developed countries, particularly emerging economies with poorer
shareholder protection, the prevalence of the Berle and Means dispersed ownership
structure is not representative for corporations in these markets. Indeed, various
researchers reported that ownership is heavily concentrated at the hands of large
controlling shareholders in developing economies across the world. For instance, La
Porta et al. (1999) examined the ownership structures of large firms in 27 different
countries and they reported that relatively few of these firms are widely held; rather they
are heavily concentrated and are commonly controlled by families or the states. A
majority of the developing economies in South America are governed by family-owned
firms, according to Shleifer and Vishny (1997). Furthermore, Claessens et al. (2000)
reported that single shareholder controls more than two-thirds of publicly-listed East
Asian firms and about 40% of all listed companies are dominated by families. Similarly,
Faccio et al. (2001) found that the predominant form of ownership in East Asia is
family-control and this form is even more pronounced in West Europe, whereas
Yurtoglu (2003) documented that families ultimately own 80% of all firms listed on the
ISE in Turkey. In short, increasing evidence reveals that family firms are widespread
around the world and occupy a growing importance in the economic globe.
Accordingly, Daily et al. (2003) suggested that agency cost theory may function
differently in family-controlled publicly listed firms and prior findings from widely held
companies may not readily generalise into this setting. In the firms with significant
family ownership and family control, the salient agency problem may be the
expropriation of the wealth from minority owners by the controlling owners, also known
as the principal-principal conflict.73
Moreover, a number of researchers have recently emphasised that it is extremely
important to consider ownership structure of companies in emerging markets in
understanding dividend policy related to the agency problems in these markets. For
instance, Manos (2002) in India, Chen et al. (2005) in Hong Kong, Kouki and Guizani
(2009) in Tunisia, Ramli (2010) in Malaysia, Wei et al. (2011) in China, Ullah et al.
(2012) in Pakistan, Huda and Abdullah (2013) in Bangladesh, Aguenaou et al. (2013) in
Morocco, Thanatawee (2013) in Thailand and Gonzalez et al. (2014) in Colombia have
all indicated that ownership structure approach is highly relevant in explaining dividend
policy based on agency cost theory. Consequently, agency cost theory of dividends
needs to be uniquely investigated in emerging markets and, more importantly, the
73
The potential problems stem from the controlling and minority shareholders (the principal-principal
conflict) is also referred to as Agency Problems II here like previous studies.
Birkbeck University of London Page 246
ownership structure of the firms in these markets should specifically be taken into
account while identifying the proxies for agency cost variables.
As is the case in many other emerging markets, the concentrated ownership by large
controlling shareholders is the dominant form of ownership structure in Turkey, where
corporate ownership is characterised by highly concentrated family ownership with the
existence of other large shareholders such as foreign, institutional and state ownerships
(Gursoy and Aydogan, 1999; Yurtoglu, 2003; IIF, 2005; Sevil et al., 2012). Further,
Ararat and Ugur (2003) pointed out the specific corporate governance problems and the
lack of efficient transparency and disclosure practices experienced by Turkish firms,
possibly due to the concentrated and pyramidal ownership structures dominated by
families who generally own business groups, including banks, businesses and
subsidiaries in the same group (IIF, 2005; Aksu and Kosedag, 2005), and the
inconsistent and unclear accounting and tax regulations, and the investors
misinformation faced by the absence of inflation and consolidation accounting
standards. As a result of this infrastructure, Ararat and Ugur (2003) suggested that
agency problems are concentrated on asymmetric information, weak minority
shareholders protection, inconsistent and unclear disclosure policies and convergence of
ownership and management, which create an environment that may foster corruption,
share dilution, asset stripping, tunnelling, insider trading and market manipulation.
Indeed, during the late 1990s, a considerably long list of cases in tunnelling took place
in the Turkish public. Majority of these cases were simple resource transfers of
controlling shareholders from their firms in the form of outright theft or fraud, whereas a
number of listed firms’ minority shareholders were harmed by these events; a bigger
proportion represented wealth transfers from state banks to controlling owners of
unlisted firms, involving in many cases the visible hands of politicians (Yurtoglu, 2003).
Likewise, a number of well-publicised cases revealed that unfair treatment of minority
shareholders was a serious corporate governance problem in Turkey since controlling
families had the opportunities to expropriate profits from them, typically through the use
of company assets or non-arm’s length related party transactions (IIF, 2005).
However, Turkey signed a standby agreement with the IMF and began to implement
major economic programs and structural reforms for a better working of the market
economy, outward-orientation and globalisation, starting March 2003 (CMB, 2003;
Adaoglu, 2008; Birol, 2011). Furthermore, Turkey’s progress in achieving full
Birkbeck University of London Page 247
membership of the EU in this period also provided the strongest motivation in
establishing new reforms, rules and regulations in line with the EU directives and best-
practice international standards to improve corporate governance and transparency and
disclosure practices; therefore, to integrate its economy with Europe and to harmonise
its institutions with those of the EU (IIF, 2005; Aksu and Kosedag, 2006; Rawdanowicz,
2010). In this context, the CMB of Turkey attributed great importance to improve
communications with investors, issuers and other institutions in order to ensure that
markets are functioning in a safer, more transparent and more efficient manner in
accordance with regulations that were adopted in harmony with international norms and
developments (CMB, 2003). Accordingly, one of the most important developments was
that in cooperation with the World Bank and the Organisation for Economic
Cooperation and Development (OECD), the CMB published its Corporate Governance
Principles74 in 2003, which was aimed to improve the ISE-listed firms’ corporate
governance practices (CMB, 2003; Caliskan and Icke, 2011).
Since the CMB Principles were published in 2003, many areas in terms of the legal and
institutional environment for corporate governance and transparency and disclosure
practices in Turkey have been improved. Turkish government and the CMB, together
with some private sector organisations, such as the Turkish Industrialists and
Businessmen’s Association (TUSIAD), the Corporate Governance Forum of Turkey
(CGFT), the Corporate Governance Association (KYD) and the Foreign Investors
Association (YASED), have performed hard to improve the rules for corporate
governance and transparency and disclosure (IIF, 2005; Caliskan and Icke, 2011).
However, it is not realistic to expect an immediate effect of these performances and
changes of laws and regulations to move towards much stronger minority shareholder
rights. As Odabasi et al. (2004) stated, each country has its own history and contributors
with their distinctive psycho-physical characteristics, and all of these characteristics are
likely to influence the nature and the speed of evolution of the regulatory reforms.
74
The CMB Principles consisted of four major parts. The first part discussed shareholders’ rights and
their equal treatments involved with issues such as right to obtain and evaluate information, right to vote,
right to join the general shareholders meeting, and more minority rights detailed in this part. The second
part included principles related to the disclosure and transparency for establishing information policies in
firms with respect to shareholders and the adherence of firms to these policies. The third part was
concerned about firms’ obligations for their stakeholders, including their workers, creditors, customers,
suppliers, institutions, non-governmental organisations, the government and potential investors who may
think of investing in these firms, in order to regulate the relationship between the firms and their
stakeholders. The fourth part discussed the functions, duties, obligations, operations and the structure of
the board of directors as well as the committees to be created to support the board operations and
executives (CMB, 2003; 2004; Caliskan and Icke, 2011).
Birkbeck University of London Page 248
Yet the concept and implementation of corporate governance practices are rather new in
Turkey. However, considering the various major economic and structural reforms
carried out for a better working of the market economy, outward-orientation and
globalisation, the prospect for integration with the EU and the competition of emerging
markets to attract global foreign direct investment, corporate governance is the hot topic
in Turkey as is the case in the world. Accordingly, Turkey’s corporate governance
practices could promptly improve toward a better legal framework and stronger minority
shareholders rights in order to be more competitive and able to access capital from
international markets (IIF, 2005; Caliskan and Icke, 2011).
Empirical research related to agency cost theory of dividends is extensive in developed
markets but they generally assume that firms in these markets are widely held and the
control is concentrated in the hands of managers, the principal-managers conflict, while
examining whether dividends are used to reduce agency problems. However, a growing
number of researchers have recently emphasised that it is extremely important to
consider ownership structure of companies in developing markets, in understanding
dividend policy related to the agency problems in these markets, since they have
provided evidence that the ownership structures of companies in developing economies
are not widely held. In fact, they have concentrated ownership structures, generally
dominated by families. Therefore, in developing markets, the most salient agency
problem is expropriation of the wealth of minority owners by the controlling
shareholders, in other words the principal-principal conflict, so called Agency Problem
II. Several studies have examined the relationship between family-control and dividend
policy in emerging markets from Agency Problem II perspective but there has not yet
been any research conducted examining the effect of families on dividend policy
decisions in the emerging Turkish market, despite the fact that Turkish companies are
mainly family-controlled.
Accordingly, the aim of this chapter of the thesis is to empirically investigate the link
between ownership structure and dividend policy, which is still unexplored in the
emerging Turkish market, over a decade after Turkey implemented major economic and
structural reforms as well as the publication of the CMB’s Corporate Governance
Principles in 2003. Particularly, this chapter contributes to the dividend literature in the
following aspects. First, Turkey offers an ideal setting to study the dividend behaviour
of an emerging market (a civil law originated country), which employed the common
laws in order to integrate with world markets. Second, it examines the relationship
Birkbeck University of London Page 249
between family ownership and dividend policy from the principal-principal conflict
perspective to identify whether families tend to expropriate the wealth from minority
investors through dividends after the implementation of major reforms, starting with the
fiscal year 2003. Third, it also focuses on investigating the effects of non-family
blockholders, such as foreign investors, domestic financial corporations and the state, on
dividend policy of Turkish firms over the relevant period. Fourth, it further attempts to
detect the relationship between minority shareholders and dividend policy in the Turkish
market. (v) Fifth, it uses a large-scale dataset that relatively covers a more recent long
time period, employs richer research methodologies (the pooled and panel logit/probit
and tobit regression analyses) and uses alternative dividend policy measures (the
probability of paying dividends, dividend payout ratio and dividend yield). Finally, it
attempts to answer the following research questions:
1. Do families prefer higher/lower cash dividend payments in order to
mitigate/exacerbate the wealth expropriation from outside shareholders in Turkey?
2. What are the impacts of non-family blockholders (foreign investors, domestic
financial corporations and the state) on dividend policy of Turkish firms?
3. What is the attitude of minority shareholders toward cash dividend payments in
the Turkish stock market?
4. Is there any significant industry-effect for Turkish firms when industry dummies
are included in the models?
5. Are the pooled logit models more favourable to estimate the probability of
paying dividends of Turkish firms or are the panel logit models more suitable rather
than pooled models?
6. Is the effect of ownership structure on the probability of paying dividends and
the intensity of paying dividends of Turkish firms different from each other or the same?
7. Are the tobit regressions results, which are used to estimate the intensity of
paying dividends of Turkish firms, consistent with the logit regression results or
significantly different? Are the pooled tobit models more favourable to estimate the
intensity of paying dividends of Turkish firms, or are the panel tobit models more
suitable rather than the pooled models?
Birkbeck University of London Page 250
8. Do the tobit estimations provide the same or different results when the different
measure of dividend policy, which stands for the intensity of paying dividends of
Turkish firms, is applied?
The remainder of this chapter is organised as follows. The following section 5.2 reviews
the previous studies and develops the research hypotheses. The methodology and data
are explained in section 5.3. Section 5.4 presents the empirical results, whereas section
5.5 summarises the conclusions of this chapter of the study.
5.2 Previous Studies and Research Hypotheses
5.2.1 Agency Problems and Dividend Policy
In the corporate dividend policy literature, researchers focus on two kinds of agency
problems. Following Berle and Means’ (1932) analysis of the modern corporation,
where ownership of capital is dispersed among small shareholders but control is
concentrated in the hands of managers, the traditional agency cost theory (Agency
Problem I) has stemmed from the conflict of interest between shareholders (the
principal) and management (the agent) and the need has emerged for shareholders to
monitor management behaviour. A relatively large number of studies have researched
this type of managerial agency cost theory, which was developed by Jensen and
Meckling (1976), Rozeff (1982) and Easterbrook (1984). Jensen and Meckling (1976)
identified three components of agency costs: monitoring expenditures,75 bonding
expenditures76 and residual loss,77 respectively. Easterbrook (1984) argued that dividend
payments are used to take away the free cash from the managers’ control and pay it to
shareholders. Paying larger dividends decreases the internal cash flow subject to
75 Jensen and Meckling (1976) argue that dividend payments force managers to raise external finance
more frequently than they would without paying dividends and this allows outside professionals, such as
investment banks, regulators, lawyers, public accountants and potential investors to scrutinize the firm
and monitor its managers’ activities. This capital market monitoring decreases the agency cost and
increases the market value of the firm. 76
Bonding expenditures are associated with the amount of cash flow at managers’ disposal. Dividend
payments would reduce the agency costs by controlling and improving the forms of incentives that
managers create for themselves and reducing the amount of cash that they may misuse for their own
consumption. 77
Residual loss implies that managers with large balances of excess cash, so called free cash flows, may
not use this cash in profitable ways that shareholders desire; for instance, investing in negative NPV
projects or unwise acquisitions. However, dividends reduce the amount of excess cash that managers can
overinvest or misuse.
Birkbeck University of London Page 251
management discretion and forces the company to approach the capital market in order
to meet the funding needs for new projects. Increase of costly outside capital subjects to
the company to the scrutiny of the capital market for new funds and decreases the
chance of suboptimal investment. The efficient monitoring of capital markets also
assists to ensure that managers perform in the best interests of shareholders. Thereby,
dividend payments might serve as a means of monitoring and bonding management
performance. Similarly, Jensen (1986) suggested that shareholders use dividends as a
device to reduce overinvestment by managers. The managers control the company and
they may use free cash to invest in projects with negative NPVs, but a dividend
payment reduces this free cash flow and the scope of overinvestment.
Although large dividend payments may reduce agency costs, they lead a firm to raise
external finance, which may be associated with increased transaction costs. In this
context, Rozeff (1982) introduced the cost minimisation model, which combines
transaction costs and agency costs to an optimal dividend policy that is the outcome of a
trade-off between equity agency costs and transaction costs. Optimal dividend payments
have the benefit of reducing equity agency costs as well as balancing against an increase
in transaction costs. In fact, various studies based on Rozeff’s (1982) specification to
explain dividend policy, including Llyod et al. (1985), Schooley and Barney (1994),
Moh’d et al. (1995) and Farinha (2003), have found results consistent with Rozeff’s
original findings and indicated a relationship between dividend policy and agency cost
variables. In short, the traditional agency theory of dividend policy, therefore,
emphasises the principal-agent conflict and seeks to answer its research questions
related to firms with dispersed ownership in only a few countries, such as the US and
the UK, consistent with the Berle and Means paradigm (1932).
Recent cross-country studies, nevertheless, have provided evidence that concentrated
ownership, by large controlling shareholders, is the dominant form of the ownership
structure in most developing economies, in contrast with the Berle and Means image of
the widely-held corporation (La Porta et al., 1999; Claessens et al., 2000; Shleifer and
Vishny, 1986). La Porta et al. (1999) examined the ownership structures of large firms
in 27 different countries and suggested that relatively a few of these firms are widely
held; rather they are heavily concentrated and are commonly controlled by families or
the states. Furthermore, Claessens et al. (2000) reported that single shareholder controls
more than two-thirds of publicly listed East Asian firms and families dominate about
40% of all listed companies. Faccio et al. (2001) examined 5,897 companies from West
Birkbeck University of London Page 252
European and East Asian countries and found that families, which often supplied a top
manager, are the predominant form of ownership in East Asia. In fact, this form of
ownership was actually more pronounced in Western Europe. According to Shleifer and
Vishny (1997), family-owned firms govern a majority of the developing economies in
South America. Consequently, increasing evidence reveals that family firms are
widespread around the world and occupy a growing importance in the economic globe.
Moreover, Shleifer and Vishny (1997) argued that when large shareholders, including
family shareholders, hold almost full control, they tend to generate private benefits of
control that are not shared with minority shareholders. Controlling shareholders can
expend the companies’ cash flows and implement policies that benefit themselves in
such ways as paying themselves extreme salaries, and providing top managerial
positions and board seats to their family members even though they are not capable. In
these cases, the salient agency problem is therefore expropriation of the wealth of
minority owners by the controlling shareholders, which is the conflict of interest
between controlling and minority shareholders (the principal-principal conflict).
Similarly, La Porta et al. (1999) stated that families are almost always involved in the
management of their firms, which highly provides greater alignment between the
interests of shareholders and managers; therefore, family control is one of the most
efficient forms of organisational governance of monitoring managers and may bring
more effective management and supervision, which leads to zero or lower owner-
manager agency cost (Agency Problem I), than other large shareholders or dispersed
corporations (La Porta et al., 1999; Ang et al., 2000; Anderson and Reeb, 2003).
On the other hand, family control increases the moral risks arising from the abuse of
control rights and families might have powerful incentives to expropriate wealth from
minority shareholder. Faccio et al. (2001) argued that families are likely to expropriate
wealth when their control rights are greater than their cash flow rights. Further, Shleifer
and Vishny (1997) indicated that in the existence of highly concentrated ownership
structures, expropriation by large shareholders has become a prominent agency
problem. Villalonga and Amit (2006) suggested that families have a greater incentive to
expropriate wealth from minority shareholders than other controlling large shareholders.
Likewise, Anderson and Reeb (2004) emphasised that founding families might involve
self-dealing by lessening firm risk, enriching themselves at the expense of minority
owners, engaging in non-profit maximising projects, misusing firm’s resources or
generally holding their interests over the other investors of the firm. Therefore, evidence
Birkbeck University of London Page 253
from various studies indicates that the principal-principal conflict, in other words
Agency Problem II, is more prevalent in family-controlled publicly listed firms. In this
respect, Daily et al. (2003) suggested that agency cost theory may function differently
in family-controlled publicly listed firms, and that prior findings from widely held
corporations may not readily generalise into this setting.
5.2.2 Family Control and Dividend Policy
In most emerging economies, companies usually have controlling shareholders that own
significant fractions of equity, typically founding families. With regard to Agency
Problem I, it is widely assumed that family ownership leads to a better governance in
order to monitor and control the managers, due to their direct involvement in the
management of the firms and greater controlling rights, therefore zero or lower owner-
manager agency cost (La Porta et al., 1999). Nevertheless, due to lack of effective
monitoring, family shareholders, as the insiders in the company, may have increased
access to the use of corporate funds that may increase agency costs. Therefore, some
researchers argue that families have powerful motivations to expropriate wealth from
minority shareholders (Shleifer and Vishny, 1997; Anderson and Reeb, 2004;
Villalonga and Amit, 2006).
Based on the argument of Agency Problem II, family owners may use their controlling
power to exacerbate the principal-principal conflicts in various ways. For instance,
Morck and Yeung (2003) identified the “other people’s money” problem, which
involves the situation in which families have significant control over a firm, with very
little investment in that firm. Indeed, by the separation between cash flow and control
rights through pyramidal company structures or multiple classes of voting power of
shares, controlling shareholders can divert resources to themselves and obtain “private
benefits of control”, such as paying themselves extreme salaries and providing top
managerial positions and board seats to their family members even though they are not
capable (Shleifer and Vishny, 1997). Another common form of expropriation of wealth
from minority owners is referred to as “tunnelling”.78 This is defined as the transfer of
assets and profits, within a family-owned business group. In this case, the controlling
family transfer assets and profits to firms in which they have higher ownership, from
78
Johnson et al. (2000) argued that the controlling shareholders have strong motivations to drain
resources off the firm to increase their wealth through the pyramidal business group structure and coined
the term “tunnelling”, suggesting that tunnelling may take many forms, including the form of outright
theft or fraud, more subtle legal forms such as dilutive share issues that discriminate against minority
shareholders and mergers between affiliated companies to transfer resources out of the bidder.
Birkbeck University of London Page 254
firms with lower ownership, through non-market prices (Johnson et al, 2000). In short,
Agency Problem II is the salient agency problem and may seriously harm the interests
of minority shareholders in family-controlled firms.
Another major way in which families can exercise control is through board
representation. In fact, top executives almost always come from the controlling family
(La Porta et al., 1999; Faccio et al., 2001; Yoshikawa and Rasheed, 2010). The
corporate governance literature suggests that a firm’s board of directors can play an
important role in mitigating agency problems, particularly by monitoring executive
management (Fama and Jensen, 1983; Farinha, 2003). However, controlling-family
members sitting on the boards can reduce the effectiveness of the board of directors as a
monitoring mechanism by executing policies that benefit themselves and hence can
increase the costs of potential expropriation of minority shareholders’ wealth in the firm
(La Porta et al., 1999; Leng, 2008; Huda and Abdullah, 2013). If this is the case, then
who monitors the family-directors’ decisions on the boards?
The answer to this question could be the existence of independent non-executive
directors on the board. Indeed, independent directors are considered as a useful
mechanism in monitoring executive directors’ actions and thus reducing agency conflict
of interest within a firm (Jensen and Meckling, 1976; Jensen, 1993). Since governance
tools in family firms are limited, minority shareholders generally rely on the boards to
scrutinize and control the possible opportunistic behaviour of families, and the interests
of minority shareholders are best protected when independent directors have power on
family blockholders (Westphal, 1998; Anderson and Reeb, 2004). Nevertheless, family
firms are not likely to appoint boards that may limit their control over their firms’
resources and hence have a significant negative impact on the independence of board,
which means that they tend to have none or lower proportions of independent directors
on the board and a tendency to exacerbate agency problems (Setia-Atmaja et al., 2009).
La Porta et al. (2000) suggested that one of the main remedies to these types of agency
problems is the law. Corporate law and legal environment can supply outside investors
and existing shareholders, including non-family and minority shareholders, specific
powers79 to protect their wealth against expropriation by controlling families. Moreover,
79
These powers could vary from the right to vote on important corporate matters, to the right to sue the
firm for damages, to the right to receive the same per share dividends as the controlling owners, which are
the legal protections that explains why becoming a minority shareholders is a reasonable investment
strategy, rather than just being a complete giveaway of funds to others who are under a few, if any,
obligations to return (La Porta et al, 2000).
Birkbeck University of London Page 255
La Porta et al. (2000) argued that dividends are the substitutes for legal protection of
minority shareholders in the countries with weak legal protections. A reputation for
good treatment of shareholders is worth the most in economies with poor legal
protection of minority shareholders, who have little else to rely on. By paying
dividends, controlling shareholders return profits to investors, which reduce the
possibility of expropriation of wealth from others, therefore establishing a good
reputation.80
It is difficult to judge whether families either mitigate or exacerbate Agency Problem II
and how family control affects corporate dividend policy. A few recent studies have
investigated and reported mixed evidence concerning family-controlled companies’
dividend policy behaviour. Faccio et al. (2001) investigated how dividend behaviour is
related to the structure of ownership and control of East Asian firms, with a benchmark
sample of West European firms during the period 1992-1996. Their analysis showed
that the salient agency problem in both regions is expropriation of wealth from outside
shareholders by controlling shareholders, which are predominantly the families.
Especially, this type of expropriation is more likely to arise when the corporation is
affiliated to a group of corporations that are all controlled by the same shareholder,
which was found to be the case for about half of the firms in Western Europe, as well as
in East Asia. Particularly, they found that group-affiliated firms in Europe paid
significantly higher dividends than in Asia, dampening insider expropriation.
Additionally, the presence of multiple large shareholders increased dividend rates in
Western Europe but decreased in East Asia, suggesting that other large owners tend to
help reduce the controlling shareholder’s expropriation of minority owners in Europe,
whereas they appear to exacerbate it in Asia.
80
La Porta et al. (2000) proposed two alternative agency models based on the legal environment and
dividends as “the outcome model” and “the substitute model”. According to first view, dividends are an
outcome of an effective system of legal protection of shareholders. Under an effective system with strong
protections, minorities use their legal powers to force firms to disgorge cash in the form of dividends,
hence preventing controlling owners to expropriate corporate wealth. However, “the substitute model”
posits that dividends are substitutes for legal protection in the countries with poor shareholders protection.
Further, companies with weak shareholders protection need to establish a reputation for good treatment of
minority investors. Accordingly, paying dividends will establish a reputation for preventing expropriation
of wealth from minority shareholders.
The outcome model predicts that dividend payments are higher in countries with effective shareholder
protection. Contrarily, the substitute model argues that in countries with effective shareholder protection,
however, the need for a reputation mechanism is weaker, therefore so is the need to distribute dividends,
then suggesting, ceteris paribus, that dividend ratios should be higher in countries with poor legal
protection of shareholders than in countries with strong protections. Moreover, the outcome model also
states that firms with better investment opportunities should have lower payout ratios in economies with
good shareholder protections. On the other hand, the substitute model predicts that in markets with poor
legal environment, firms with better investment opportunities may pay out more to maintain their
reputations (La Porta et al, 2000).
Birkbeck University of London Page 256
Chen et al. (2005) analysed a sample of 412 Hong Kong firms during 1995-1998 and
they found that, for only small firms, there was a significant negative relationship
between dividend payouts and family ownership of up to 10% of the firm’s
shareholdings and a positive relationship for family ownership between 10% and 35%.
Chen et al (2005) interpreted their findings as dividend payouts are potentially used by
controlling families in smaller Hong Kong companies as a tool of extracting resources
out of the firms they control. When their shareholdings increase, family managers may
care more about their dividend income compared to their cash salary, since on average
their cash salary is much lower than their dividend income. However, it may also be the
case that other shareholders foresee the potential expropriation by the families and
require higher payouts from firms with potentially the largest agency conflicts.
Moreover, using a data sample of 1,486 Chinese A-share listed firms for the period
2004-2008, Wei et al. (2011) found that families have lower cash dividend payouts and
lower tendencies to distribute dividends than non-family firms in China, and a
favourable regional institutional environment has a significant positive effect on the
payout ratios and the tendency to pay dividends of listed companies. The results also
showed that the impact of the regional institutional environment on cash dividends is
stronger in family controlled firms than in non-family firms. Having interpreted their
results, Wei et al. (2011) suggested that controlling family shareholders in China
seemed to increase Agency Problem I, rather than Agency Problem II, which has a
significant negative impact on cash dividend policy due to a lack of effective
supervision, and the occupation of leading positions by incapable family members
usually reduces corporate efficiency. Then, a favourable regional institutional
environment takes a positive corporate governance role by helping to lessen Agency
Problem I and encouraging family firms to distribute cash dividends. Accordingly, they
further suggested that a high cash dividend payout is more likely to be the consequences
of the outcome model of dividends, which is proposed by La Porta et al. (2000), by a
favourable regional institutional environment.
More recently, Aguenaou et al. (2013) investigated the effect of ownership structure on
dividend policies for firms listed on the Casablanca Stock Exchange during the period
2004-2010. The study results revealed that family ownership negatively influences the
level of distributed dividends. Aguenaou et al. (2013) suggested that family ownership
is a typical aspect of firms in the Moroccan market and the low dividend payout ratios
are justified by high agency problems in family-controlled firms. Because, family
Birkbeck University of London Page 257
shareholders increase the cost for firms since their lack of diversification, the hiring of
unskilled family members and the abuse of other shareholders’ rights, which all may
result in poor transparency and absence of accountability. Furthermore, using a database
of 458 Colombian companies over the period 1996-2006, Gonzalez et al. (2014)
examined the effects of family involvement on dividend policy and how family
involvement influences agency problems between majority and minority shareholders.
Their results showed that family influence in relation to the level and likelihood of
dividend payments differs considerably according to the type of family involvement.
Specifically, family involvement in management does not affect dividend policy,
whereas family involvement in both ownership and control through pyramidal
structures has a negative impact. Family involvement in control through
disproportionate board representation has a positive effect on dividend policies of
Colombian companies. Therefore, family influence on agency problems, and hence on
dividend policy as a mitigating device, varies depending on family involvement.
5.2.3 Other Large Shareholders, Monitoring and Dividend Policy
Shleifer and Vishny (1986) suggested that if legal protection does not provide enough
control rights to small investors, perhaps large shareholders might mitigate the
shareholders conflict by an efficient monitoring of the management. According to
Grossman and Hart (1980), managements of the companies should be monitored, which
must be effectively done by larger shareholders. The existence of such large
shareholders can mitigate the free rider problem of monitoring managers and therefore
reducing agency costs. Similarly, Yoshikawa and Rasheed (2010) pointed out that
publicly listed family-owned companies have also other types of outside shareholders
who might expose the possibility that the family firm is subject to outside influence.
When such outside shareholders are large, they may have some ability to affect
managerial decisions and actions of family-owned companies, hence lessening the
likelihood of expropriation.
Large shareholders may take several distinct forms depending on the proportion of
shares held and the type of legal owners, such as management or board ownership,
family and foreign shareholders, the state and financial institutions ownerships (La
Porta et al., 1999; Huda and Abdullah, 2013). The identity of controlling shareholder
can be an important factor in determining financial polices of corporations.
Birkbeck University of London Page 258
5.2.3.1 Foreign Ownership and Dividend Policy
Most industrial country investors often hold stocks of developing markets for their long-
run growth potential, not for the short-term cash dividend income they will generate,
which suggests a negative correlation between foreign ownership and dividend
payments (Glen et al., 1995). Foreign investors who own large shareholdings in
emerging markets may serve as effective monitors of these companies due to their
implementation of more established global standards and practices stemming from their
affirmed preference of a longer-run investment philosophy (Jeon et al., 2011). Further,
foreign ownership increases foreign analysts’ interests in these firms and it is true that
foreign analysts generally ask managements to disclose their financial policies,
providing more monitoring on the managements’ activities and hence with less need for
the dividend-induced monitoring device (Glen et al., 1995; Manos, 2002). This also
suggests a negative relationship between foreign ownership and dividend payments.
Although foreign investors generally have significant global investment experiences
using well-developed technology, which implies they are in a stronger position to assess
a firm’s performance, it is however disputed whether foreign investors have information
disadvantages in trading local stocks, since they may have inferior information due to
geological, cultural and political differences. Therefore, the task of monitoring
managements in emerging markets could be more difficult and costly for foreign
investors, which suggests the importance of and the need for the dividend-induced
capital market monitoring increase, with the increase in the percentage of foreign
shareholdings, leading to a positive impact of foreign ownership on dividend policy
(Manos, 2002; Jeon et al., 2011).
There is limited evidence in understanding the impact of foreign investors on dividend
policy of firms in emerging markets. By examining 661 non-financial firms listed on the
Bombay Stock Exchange in 2001, Manos (2002) reported a significant positive relation
between foreign ownership and dividend policy of Indian firms; the greater the
percentage owned by foreign investors, the greater the need for dividend-induced capital
market monitoring, consistent with the view that it may be more difficult for overseas
investors to monitor firms and their managements in emerging market, therefore they
tend to use higher dividend payments to enhance better managerial monitoring.
Moreover, Lin and Shiu (2003) investigated foreign ownership in the Taiwan stock
market from 1996 to 2000. Based on a complete panel data for 245 firms for the
Birkbeck University of London Page 259
duration of the study period, their analysis showed that foreign investors are likely to
hold shares with low dividend yields, possibly reflecting their tax considerations due to
the different taxation on capital gains and dividends in Taiwan. Since foreign investors
had to pay a 25% withholding tax for dividends paid from earnings, but capital gains
were tax-free in that period, the empirical results suggested that foreign investors
avoided holding shares with higher dividend yields to mitigate the negative impact of
disharmonious taxation. The evidence for this claim, however, was mixed and weak.
Jeon et al. (2011) studied the relation between foreign ownership and the decisions on
payout policy in the Korean stock exchange by using a sample of 5,583 firm-year
observations from 1994 to 2004. Their research revealed that foreign investors show a
preference for firms pay dividends and when they have substantial ownership, foreign
shareholders lead firms to distribute more dividends. The results were driven by the fact
that most of the foreign investors in Korea were institutional investors who had
institutional charters, prudent-man rule restrictions and relative tax advantages on
dividends. By investing in firms paying larger dividends, they also aimed to reduce the
cost due to their information disadvantage, as well as continue to promote higher levels
of cash payouts in order to minimise agency costs. Therefore, foreign investors had both
dividend clienteles and dividend-induced monitoring incentives in the Korean stock
market. Likewise, Ullah et al. (2012) reported that foreign ownership has a positive
impact on the dividend payout ratios of Pakistani firms based on their analysis from 70
randomly selected companies listed on the Karachi Stock Exchange (KSE) 100 Index
over the period 2003-2010. They suggested that the reason for this positive impact is
because foreign investors cannot directly observe the activities of managers, thus they
use higher dividend payments as a tool of monitoring and disciplining device. However,
by examining a sample of 1,927 firm-year observations from 287 firms listed on the
Stock Exchange of Thailand during the period 2002-2010, Thanatawee (2013) found
that foreign equity ownership has no significant effect on dividend payouts of Thai
firms.
5.2.3.2 Institutional Ownership and Dividend Policy
Dividend payments force firms to go to the external capital markets for additional
funding and therefore undergo monitoring by the capital market (Rozeff, 1982;
Easterbrook, 1984). However, Demsetz and Lehn (1985) and Shleifer and Vishny
(1986) argued that institutional blockholders, such as pension funds, insurance
Birkbeck University of London Page 260
companies, investment and unit trusts, and banks, may act as a monitoring mechanism
on the firm’s management, consequently reducing in general the need for high dividend
payouts. In this respect, Manos (2002) noted that institutional investors have more
incentives to spend resources for monitoring the firm and its management compared to
other investors, due to their expertise and better capability to scrutinize management
activities at relatively low cost. Since their percentage ownership is generally
comparatively large, institutions also tend to benefit from monitoring. Further,
institutional shareholders are in a better position to take over inefficient firms and hence
this threat is another aspect that forces managements to act more efficiently.
Subsequently, institutional ownership has commonly been considered as a solution to
the free rider problem, which suggests that the larger the proportion owned by
institutions, the less is the need for dividend-induced monitoring.
Nevertheless, Zeckhauser and Pound (1990) argued that institutional shareholders are
unlikely to provide direct monitoring themselves, due to the arm’s length perspective of
investment accepted by many institutional investors, along with the incentives to free
ride with regard to monitoring activities. In fact, institutions generally prefer to force
firms to increase their dividends, and so they are consequently forced to the external
capital market for future funds. Likewise, Farinha (2003) suggested that institutions
might force companies to pay higher dividends to enhance better managerial monitoring
by external capital markets, especially when they think that their own direct monitoring
efforts are inefficient or too costly. In this case, a positive relationship between
institutional ownership and dividend payout ratio is expected.
A number of studies investigated the impact of institutional investors on dividend
policies of firms listed in emerging markets. Manos (2002) found that the impact of
institutional ownership on the payout ratios of Indian firms was positive, which is
inconsistent with the argument that the ability of institutions in terms of more effective
monitoring reduces the need for the dividend-induced mechanism. Indeed, this was
consistent with the dividend-induced monitoring preferences of institutions in India,
reflecting that greater agency conflicts in the emerging Indian market, hence the level of
direct institutional monitoring was inefficient. Contrarily, having analysed the influence
of shareholder ownership identity on dividend policy for a panel of 29 Tunisian firms
from 1995 to 2001, Kouki and Guizani (2009) reported that Tunisian firms paid out
lower dividends when they had higher institutional ownership, in line with the effective
monitoring role of institutional investors.
Birkbeck University of London Page 261
More evidence regarding the relationship between institutional ownership and dividend
policy provided by Ullah et al. (2012) from Pakistan. They found that institutional
shareholding has a positive impact on the dividend payout ratio, and increases in the
percentage of institutional ownership lead to increases in dividend payments in the
Pakistani market, where the poor legal protection given to the investors failed
institutions to directly monitor the managements. Hence, institutional investors prefer to
have dividends in order to reduce the opportunistic behaviour of managers. Similarly,
Thanatawee (2013) showed evidence that Thai firms are more likely to pay dividends
and have a tendency to pay higher dividends when they have higher institutional share
ownership, consistent with the argument that institutional investors prefer dividend-
induced monitoring and force managers to distribute more dividends. On the other hand,
Huda and Abdullah (2013) reported that institutional shareholders have a significant but
negative effect on the dividend per share in Bangladesh, by examining 21 highly traded
blue-chip companies listed on the Chittagong Stock Exchange (CSE) 30 Index during
the period 2006-2010. This implied that institutions do not monitor or control
managerial activities through dividends; rather the Bangladeshi firms, where the
institutional ownership is large, tend to pay lower dividends.
5.2.3.3 State Ownership and Dividend Policy
State ownership is another common form of concentrated control in some countries,
particularly in countries with poor shareholder protection (La Porta et al., 1999). It is a
fact that state firms are generally extremely inefficient, since they tend to use firms to
pursue political objectives and their losses result in huge deficiencies of their
economies, which is inconsistent with the efficiency justification for their existence
(Kikeri et al., 1992; Shleifer and Vishny, 1997). Further, state-controlled corporations
can be seen as manager-controlled firms in which a double principal-agent problem yet
exists; although the ultimate owners of these companies are the citizens, they do not
control them directly, but their elected representatives should do. However, politicians
may not actively or accurately monitor the companies that the state owns and this leads
to even greater principal-agent conflicts between managers and the citizen owners of the
state-owned corporations. In this respect, elected politicians are held responsible for all
government activities and therefore they may be expected to have a particularly strong
preference in seeing a steady flow of dividends from a state-owned company, since
dividends may be good enough to convince citizens that the company performs well, as
well as reduce the free cash flow in the hands of managers (Gugler, 2003).
Birkbeck University of London Page 262
Moreover, the recognition of enormous inefficiency of state companies and the
pressures on public’ budgets have recently created a popular response around the world,
so called “privatisation” that replaces political control with private control by outside
investors in most cases. Also, privatisation in most countries generates concentrated
private cash flow ownership in addition to the control. Privatisation generally provides
relatively more efficient ownership structures and a significant improvement in
performance of privatised firms (Megginson et al., 1994; Lopez-de-Silanes, 1994).
However, it is possible that privatisation does not work as well as intended; for instance,
when firms are privatised without the creation of large investors, which provides
managers with more discretion. In these cases, agency costs of managerial control may
increase, even though the costs of political control decreases and the problems of
managerial discretion can be almost as serious as the prior problems of political control
in these companies (Shleifer and Vishny, 1997).
A few studies showed evidence that firms with high state ownership are characterised
by high dividend payouts. Gugler (2003) investigated the relationship between
dividends, ownership and control structure of the firm for a panel of 214 Austrian
companies over the period 1991-1999, and found that principal-agent conflict is more
severe in state-controlled firms. In particular, the study results showed that state
ownership and control have a positive impact on target payout ratios, and state-
controlled firms in Austria are more reluctant to cut dividends, which is consistent with
the managerial agency cost explanation. Using 3,994 observations of Chinese firms
from 1995 to 2001, Wei et al. (2004) also reported that there is a significantly positive
relationship between the state ownership and cash dividends. Wang et al. (2011),
analysing 13,116 firm-year observations over the period 1998-2008, and Lam et al.
(2012), examining 7,519 firm-year observations during the period 2001-2006, provided
more evidence from China. The results of both studies similarly showed that Chinese
firms with higher state ownership are likely to pay higher cash dividends. However,
Kouki and Guizani (2009) found a significantly negative relationship between dividend
per share and the state ownership in the context of emerging Tunisian market in contrast
with the evidence of previously mentioned studies.
5.2.4 Minority Shareholders and Dividend Policy
Conflicts of interest between corporate insiders such as managers or ultimate controlling
shareholders and outside investors, specifically minority shareholders, have been crucial
Birkbeck University of London Page 263
to the analysis of modern corporations (Berle and Means, 1932; Jensen and Meckling,
1976). Insiders may vary from country to country. For instance, in the US, the UK or
Canada, where companies are relatively dispersed, typically their managers are in the
controlling positions, whereas in most other countries - especially in emerging markets,
companies are generally controlled by large shareholders, such as founding families (La
Porta et al., 1999). The insiders who control the corporate assets can use these funds for
their own purposes without benefiting minority shareholders through various formats
such as outright theft, misusing firms’ resources, excessive salaries, asset sales (selling
other companies that they control at favourable prices) to themselves and so on (Jensen,
1986; Shleifer and Vishny, 1997; Johnson et al., 2000). This is consistent with
DeAngelo et al.’s (2008, p.218) statement that “There is much yet to be learned about
the nature and scope of minority stockholder exploitation.” Nevertheless, regardless of
the identity of controlling shareholders, the victims are always the minority investors
(La Porta et al., 2000).
Even though minority shareholders have stronger protections in countries such as the
US and the UK, researchers hypothesised and found a positive relationship between
dispersion of ownership among outside shareholders and dividend payout. The
existence of large number of small investors leads to a low level of ownership
concentration, which increases the potential agency costs given the free-rider problem
associated with higher ownership diffusion and the need for outside monitoring.
Therefore, Rozeff (1982) and Easterbrook (1984) hypothesised that minority
shareholders seek greater dividend payout, as they perceive their level of control to
diminish. Indeed, a string of studies that followed Rozeff’s (1982) work reported a
positive relationship between ownership dispersion and dividend payments in developed
markets, including Schooley and Barney (1994), Moh’d et al. (1995) and Farinha
(2003).
Moreover, Shleifer and Vishny (1997) argued that, in countries where minority
investors do not have much protection rights, large investors generally in the form of
families, the states or banks may control managers, but it still leaves existing and
potential minority investors unprotected. In this case, La Porta et al. (2000) suggested
that these minority shareholders would typically desire for dividends, which reduce
what is left for expropriation. They further stated that, “A reputation for good treatment
of shareholders is worth the most in countries with weak legal protection of minority
Birkbeck University of London Page 264
shareholders, who have little else to rely on. As a consequence, the need for dividends
to establish a reputation is the greatest in such countries” (La Porta et al., 2000, p.7).
In the context of emerging Indian market, Manos (2002) indeed found that investors
with the smaller percentage of shareholdings have a taste for cash dividends, in order to
reduce the collective action of monitoring problem by dividend-induced capital market
monitoring, therefore preferring higher dividend payments. However, in the emerging
markets such as China, where dividends are taxed as ordinary income but capital gains
are not, small investors may have preference for capital gains over dividends (Wang et
al., 2011). According to Wei et al. (2004), small investors in China are too poorly
informed for even the rights they actually have, hence they have neither the incentive
nor the ability to collect information and monitor the managements. They
characteristically care about the appreciation or depreciation of shares they hold, and
depend on short-run capital gains rather than cash dividend income. In this respect, an
inverse relationship can be expected between the proportion of small investors’
shareholdings and dividend payout ratio. In fact, Lam et al. (2012) reported that
Chinese firms with higher public (small) ownership tend to pay lower cash dividends,
reflecting the preference of small investors for capital gains over dividends, due to the
advantageous tax treatment of capital gains and the weak legal protections for minority
shareholders in China.
5.2.5 Research Context in Turkey and Hypotheses Development
As is the case in many other emerging markets, the concentrated ownership by large
controlling shareholders is the dominant form of the ownership structure in Turkey.
Corporate ownership is characterised by highly concentrated family ownership, with the
existence of other large shareholders such as foreign, institutional and state ownerships
(Gursoy and Aydogan, 1999; Yurtoglu, 2003; IIF, 2005; Sevil et al., 2012), in contrast
with the Berle and Means image of the widely held corporation in which ownership
structure of firm is dispersed among small shareholders but the control is concentrated
in the hands of managers.
Accordingly, it is crucial to consider ownership structure of companies in Turkey in
understanding dividend policy related to the agency problems, since the most salient
agency problem maybe the expropriation of the wealth of minority owners by the
controlling shareholders, namely the principal-principal conflict. Indeed, during the late
1990’s, a considerably long list of cases of corruption, share dilution, asset stripping,
Birkbeck University of London Page 265
tunnelling, insider trading and market manipulation took place in the Turkish public,
and a number of listed firms’ minority shareholders were harmed by these events
(Ararat and Ugur, 2003; Yurtoglu, 2003; IIF, 2005). Following the November 2002
elections, which resulted in one-party government, the economic programs and
structural reforms were jointly carried out by the government and the IMF for a better
working of the market economy, outward-orientation and globalisation, starting in
March 2003 (CMB, 2003). Further, Turkey’s progress in achieving full membership of
the EU in this period also provided the strongest motivation in establishing new
reforms, rules and regulations to improve corporate governance and transparency and
disclosure practices; therefore, to integrate its economy with Europe and to harmonise
its institutions with those of the EU (IIF, 2005; Aksu and Kosedag, 2006).
The CMB of Turkey attributed great importance to improve communications with
investors, issuers and other institutions in order to ensure that markets are functioning in
a safer, more transparent and more efficient manner in accordance with regulations that
were adopted in harmony with international norms and developments (CMB, 2003).
Accordingly, one of the most important developments was that, in cooperation with the
World Bank and the OECD, the CMB published its Corporate Governance Principles in
2003, which was aimed to improve the ISE listed firms corporate governance practices
(CMB, 2003; Caliskan and Icke, 2011). Considering the implementation of various
major economic and structural reforms starting with the fiscal year 2003, and with many
areas improved in Turkish corporate governance practices, its capital market is still
heavily concentrated and characterised by high family ownership (IIF, 2005; Caliskan
and Icke, 2011). Cash dividends can be used to either reduce or exacerbate the
principal-principal conflict, since dividends are the substitutes for legal protection of
minority shareholders in the countries with weak legal protections. By paying
dividends, controlling shareholders return profits to investors, which reduce the
possibility of expropriation of wealth from others (La Porta et al., 2000). Therefore, this
chapter of the thesis focuses on the effect of ownership structure, including families,
foreign investors, domestic institutional corporations, the state and minority investors,
on dividend policy behaviour in Turkey based on the principal-principal conflict
perspective of agency cost theory over a decade after Turkey implemented major
reforms, including the publication of the CMB’s Corporate Governance Principles,
starting with the fiscal year 2003.
Birkbeck University of London Page 266
Moreover, the tax factor may also play an important role in understanding the attitude of
investors towards cash dividends in Turkey. Under the current Turkish tax system, cash
dividends and capital gains are taxed differently. Table 5.1 below illustrates a summary
of the Turkish tax regime on capital gains and cash dividends for the investors. Before
2006, a 15% withholding tax used to be imposed on all kinds of investment instruments
(deposits, equities, bonds, mutual funds) regardless of the type of the investor
(resident/non-resident, individual/corporate), but the Turkish tax regime on investment
instruments changed significantly at the beginning of 2006 (TSPAKB, 2007).
Table 5.1 Taxation of Capital Gains and Dividends on Equities in Turkey The table presents a summary of the Turkish tax regime of capital gains and dividends on equity
investments for the investors (resident/non-resident, individual/corporate) since 2006.
Investment Individuals Corporations
Residents Non-residents Residents Non-residents
Capital Gains
on Equities
Capital gains
derived from
shares subject to
0% withholding
tax. However, the
shares of
investment trusts
and exchange
traded funds are
subject to 10%
withholding tax, if
held for less than a
year.
0% withholding
tax.
Capital gains
derived from
shares subject to
0% withholding
tax. However, the
shares of
investment trusts
and exchange
traded funds are
subject to 10%
withholding tax, if
held for less than a
year.
0% withholding
tax.
Dividends on
Equities
15% withholding
tax is applied by
the corporation
distributing
dividends.
15% withholding
tax is applied by
the corporation
distributing
dividends.
Not subject to
dividend
withholding tax.
Dividends
received from
resident
incorporations are
exempt from
corporate tax.
15% withholding
tax is applied by
the corporation
distributing
dividends.
Source: Compiled from TSPAKB (2007; 2008; 2012)
As illustrated in the table, foreign investors, both individuals and corporations, are not
subject to any taxes for capital gains derived from shares, whereas they are taxed with a
15% withholding tax rate for their cash dividends distributed on the shares they held.
Similarly, domestic individual investors are not subject to any taxes for capital gains but
they are subject to a 15% withholding tax for their cash dividend income. However,
domestic corporations’ taxation relatively differs from the other types of investors.
Domestic corporations are not subject to any taxes for both capital gains and cash
dividends that derived on equities of resident incorporations. It is also important to note
Birkbeck University of London Page 267
that, even though domestic investors, both individuals and corporations, are exempt
from taxation on capital gains, they are subject to 10% withholding tax for capital gains
on the shares of investment trusts and exchange traded funds, if held less than one year,
implying that the Turkish tax system encourages domestic investors to hold these type
of shares for longer period.
Corporate dividend literature argues that uneven tax treatment of dividends and capital
gains may affect investors’ preferences and therefore dividend policy decisions of firms.
For instance, the tax preference theory (Brennan, 1970; Elton and Gruber, 1970;
Litzenberger and Ramaswamy, 1979) proposes that investors who receive favourable
tax treatment on capital gains (lower taxes on capital gains than dividends) might prefer
shares with none or low dividend payouts, since the income tax on dividends is greater
and hence the high dividend payments will increase shareholders’ tax burden. However,
the tax clientele theory (Miller and Modigliani, 1961; Black and Scholes, 1974; Miller
and Scholes, 1978) argues that each investor has their own implied calculations of
choosing between high or low cash dividends and selecting dividend policies according
to their tax category circumstances, and since there are enough companies to provide
these different dividend policies, investors will invest in only companies with policies
best fit their tax position. Therefore, in equilibrium, no firm can increase its value by
reducing taxes through its dividend policy; in fact, this may cause a change in clientele
and could be costly because of trading costs. Consequently, due to the uneven taxation
of capital gains and cash dividends in Turkey, the tax factor may also play a role in
understanding the relationship between ownership structure of the firms, in other words
various types of investors holding shares of the firms, and cash dividend policy in the
emerging Turkish market.
Furthermore, the principal-principal conflict (Agency Problem II), which is based on the
expropriation argument, suggests that families prefer lower dividend payments to
maintain cash flows that they can potentially expropriate (Setia-Atmaja et al., 2009;
Yoshikawa and Rasheed, 2010). However, it is difficult to judge whether families either
mitigate or exacerbate Agency Problem II and how family control affects corporate
dividend policy in emerging markets. Although a few recent studies (Faccio et al.,
2001; Chen et al., 2005; Wei et al., 2011; Aguenaou et al., 2013; Gonzalez et al., 2014)
investigated and reported mixed evidence concerning the effect of family involvement
on dividend policy, they generally found a negative relationship between family control
and dividend payout ratio. In this respect, Turkey, where corporate ownership structure
Birkbeck University of London Page 268
is characterised by highly concentrated family ownership,81 offers an ideal setting to
investigate the relationship between family ownership and cash dividends in the context
of an emerging market.
Even though some aspects of the family-owned firm structure sharply contrast with the
basic concepts of corporate governance, other aspects of it may be advantageous in
many cases. In family-owned companies, management and ownership are not separated,
and Turks highly value close family ties. These ties, or sense of belonging to a larger
social group, have done well in motivating manager employees to work hard for the
well being of the company. Therefore, overlapping ownership and management may
help to minimise the managerial agency problems (Izmen, 2003). However, by
maintaining tight control, family members have in some instances obtained well-paid
jobs and perks from the company, even if they are not capable. Moreover, controlling
families have had the opportunities to expropriate profits from minority investors,
typically through the use of company assets or non-arm’s length related party
transactions (IIF, 2005). Further, Turkish families mostly generate the control through
the presence of business groups, which are affiliations of industrial and financial
companies, organised under the legal form of a “holding company” (Yurtoglu, 2003).82
In this case, the controlling families may have strong initiatives to expropriate wealth of
minority shareholders, which may exacerbate Agency Problem II. As previously
mentioned, during the late 1990’s, a considerably long list of cases of corruption, share
dilution, asset stripping, tunnelling, insider trading and market manipulation took place
in the Turkish public, and a number of listed firms’ minority shareholders were harmed
by these events (Ararat and Ugur, 2003; Yurtoglu, 2003; IIF, 2005).
Along with the major economic and structural reforms implemented in 2003, the CMB
of Turkey published its Corporate Governance Principles in cooperation with the World
81
The largest domestically owned Turkish corporations are mainly family-controlled. One shareholder
generally controls more than 50% of voting rights in 45 % of the firms listed on the ISE. It is also
reported that at least three-fourths of all corporations are owned by families or a holding company
controlled by a family (IIF, 2005). A study done by Gursoy and Aydogan (1999) revealed that around
44% of companies on the ISE belonged to a family or a small group of families and other 30% of them
were controlled by holding companies, showing predominant family involvement in approximately 74%
of all companies between 1992 and 1998. Similarly, Yurtoglu (2003) indicated that business groups are
the dominant forms in Turkish corporate governance and business groups in Turkey are a set of industrial
and financial corporations organised under a legal structure of a holding company, which is commonly
controlled by a single family or sometimes a partnership of a few families. In fact families ultimately
owned 80% of all firms listed on the ISE. 82
Yurtoglu (2003) reported that holding companies are the most frequently observed form of direct
ownership by families who organise a large number of firms under a pyramidal ownership structure or
even through more complicated web of inter-corporate equity linkages in the Turkish capital market.
Birkbeck University of London Page 269
Bank and the OECD in the same year. Since then, many areas in terms of the legal and
institutional environment for corporate governance and transparency, and disclosure
practices in Turkey have been improved. However, it is not realistic to expect an
immediate effect of these performances and changes of laws and regulations, to move
toward much stronger minority shareholder rights. In fact, the acceptance and
application of the CMB Principles have been relatively slow among the ISE-listed
firms, since the majority of companies are dominated by a single family as the
controlling shareholder and many family-owned firms, by no means all, tend to avoid
carrying out key governance provisions that might constrain family control (IIF, 2005;
Caliskan and Icke, 2011). This suggests that unfair treatment of minority shareholders
may still be a serious problem in Turkey. Therefore, if it holds true, families prefer
lower dividend payments to maintain cash flows that they can potentially expropriate,
which implies a negative relationship between family ownership and dividend payout in
the Turkish market.
Moreover, La Porta et al. (2000) proposed two alternative agency models based on the
legal environment and dividends as the outcome model and the substitute model.
According to first view, dividends are an outcome of an effective system of legal
protection of shareholders. Under an effective system with strong protections,
minorities use their legal powers to force firms to disgorge cash in the form of
dividends, hence preventing controlling owners of expropriating corporate wealth.
However, the substitute model posits that dividends are substitutes for legal protection
in the countries with poor shareholders protection. Further, companies with weak
shareholders protection need to establish a reputation for good treatment of minority
investors; because such a reputation will enable companies to access equity markets in
the future. Accordingly, paying dividends will establish a good reputation for
preventing expropriating of minority shareholders. If this is the case, families should
pay higher dividends regardless of whether or not the major reforms implemented in
2003 have led to a better legal and institutional environment for corporate governance
and transparency, and disclosure practices in Turkey, which implies a positive
relationship between family ownership and dividend payout.
However, the outcome model further predicts that, in countries with good shareholder
protection, other things being equal, firms with better investment opportunities should
have lower payout ratios. Contrarily, the substitute model does not make this prediction,
arguing that, in countries with poor shareholder protection, firms with better investment
Birkbeck University of London Page 270
opportunities should still pay higher dividends to maintain their reputations. In this
respect, based on the outcome model, if the legal and institutional environments for
corporate governance, transparency and disclosure practices are improved, leading to a
better shareholder protection since 2003 in Turkey, then as a promising emerging
market with fast growth, investors (including all types) may in general have a tendency
to prefer long-term growth potential of the stocks they own, not for the short-term
dividend income, which is involved with lower dividend payments.
Additionally, tax considerations may also have an effect on families’ attitudes towards
cash dividends. In Turkey, domestic individual shareholders and foreign investors (both
individuals and corporations) have tax advantages on capital gains over cash dividends;
hence, they may prefer capital gains based on the tax preference theory and impose
families to pay none or lower dividends, which implies a negative relationship between
family ownership and dividend payout. On the other hand, uneven tax treatment may
not be a concern for families, due to different clienteles with their own tax category
circumstances consistent with the tax clientele theory. For instance, domestic Turkish
corporations (both financial and non-financial corporation) generally have a neutral tax-
treatment with respect to cash dividends and capital gains. Combining the ideas from
the principal-principal conflict (Agency Problem II) based on the expropriation
argument, outcome and substitute model of dividends and tax considerations, as well as
the negative relationship generally reported from other emerging markets reported by a
few studies, the following hypothesis can be formulated:
Hypothesis 1: There is a negative relationship between family ownership and the
dividend payment decisions of Turkish firms.
Another basic characteristic of Turkish firms are insider boards in addition to
concentrated family ownership. Owner families govern the boards of Turkish-listed
firms and the boards are generally used as an internal mechanism of control by the
controlling families (Yurtoglu, 2003; Caliskan and Icke, 2011). Further, Yurtoglu
(2003) reported that at least half of the board directors are also members of the owner
family in the family-controlled Turkish companies. According to the IIF (2005) report,
80% of listed companies in Turkey had at least one board member who was from the
controlling family and more than one-third of the board directors were, on average, the
members of the controlling family based only on having the same family name, not
even considering in-laws or other kinships.
Birkbeck University of London Page 271
The CMB of Turkey Principles published in 2003 emphasised the importance for the
independence of the board of directors and further recommended that one-third of the
board should consist of non-executive directors, of which at least two of them should be
independent members (IIF, 2005; Caliskan and Icke, 2011). However, as is often the
case in other emerging markets, listed-firms in Turkey generally tend to not require
supermajorities, and particularly the boards of the family-owned companies often act
mostly as rubber stamps for decisions made by the majority shareholder. Even though
many family-controlled company boards have non-executive directors, they are likely to
form small minorities, playing little role in the board, and they also tend to serve
generally on the board of subsidiaries, which minimises their influence. In addition, the
existence of the independent members on the boards is very limited (IIF, 2005; Ararat et
al., 2011; Caliskan and Icke, 2011). In this respect, the CMB of Turkey revised its
corporate governance principles and issued a new set of mandatory principles83 for the
ISE-listed firms, convened no later than 30 June 2012. According to the new
communiqué, among the non-executive directors, the board shall compulsorily include
independent members, where the number of independent directors shall not be less than
one-third of the board, and in any case, at least two independent directors have to be on
the boards (Berispek, 2012).
Accordingly, it can be said that families generally dominated the boards of the ISE-
listed firms they control by their direct involvement in many cases, and easily
influenced managerial decisions over the period 2003-2012, except the year 2012 due to
the compulsory corporate governance principles imposed by the CMB. Consistent with
the negative relationship between family ownership and dividend policy anticipated
from the previous discussion, it is also predicted that family control through the board
negatively affects dividend policy decisions. Therefore, the following hypothesis is
formulated:
Hypothesis 2: There is a negative relationship between the number of family members
on the board and the dividend payment decisions of Turkish firms.
From the agency cost perspective, the size of a board can play a significant role in
monitoring executive management. Larger boards can provide greater expertise and
diversity of specialisation as well as outside contacts that a firm may lack internally, and
hence more efficient monitoring (Fiegener et al., 2000; Klein, 2002; Gabrielsson, 2007).
83
The Communiqué issued by the CMB Serial: IV, No: 57 published in the Official Gazette dated:
11/02/2012 and No: 28201.
Birkbeck University of London Page 272
However, Jensen (1993) argued that large boards may be less efficient than smaller
boards, since it can be more difficult to coordinate between large numbers, and if it is
sufficiently small but with enough independent directors, a board can monitor its
executive managers more closely. As explained in the above discussion, Turkish
families are unlikely to appoint boards that will limit their control over their firm’s
resources and therefore regardless of the size of boards, smaller or larger, it is expected
that owner families have direct influence on the composition and characteristics of
boards.
Alternatively, it is also argued that there is a positive relationship between firm size and
the size of the board (Fiegener et al., 2000; Gabrielsson, 2007; Huda and Abdullah,
2013). In this respect, board size may indeed be reflecting the firm size in the Turkish
market rather than a proxy for monitoring mechanism due to the mentioned reasons.
Since the results reported in Chapter 3 indicate a positive relationship between firm size
and dividend policy, it is anticipated that larger firms have larger size of boards and
therefore the larger the board is the more likelihood that the firm pays higher dividends.
Hence, the following hypothesis is formulated:
Hypothesis 3: There is a positive relationship between the board size and the dividend
payment decisions of Turkish firms.
Since Turkey has a liberal foreign policy, there are no constraints on foreign
investments, repatriation of capital and profits. Foreign investors (both individuals and
corporations) can freely buy and sell all types of securities and other capital market
instruments (TSPAKB, 2007; 2012). After the implementation of major reforms in
2003, the Turkish stock market generally had a rapid growth in terms of the number of
listed firms, trading volume, market capitalisation, and attracted a significant amount of
foreign investment during the period 2003-2012 (CMB, 2003; 2012; Adaoglu, 2008).
Indeed, this period was greatly attracted to foreign investors. The ratio of stocks owned
by foreign investors to total stocks in the ISE was 51.5% by the end of 2003 and
steadily increased to 72.3% by the end of 2007. Probably, due to the 2008 global crisis,
this ratio decreased to 67.5% in 2008 and showed a further slightly declining pattern in
the following years to 65.8% by the end of 2012, which still revealed a serious
contribution from foreign investors, holding about two-thirds of the total equities in
custody in the ISE (CMB, 2012). Accordingly, such a big foreign stock-ownership
Birkbeck University of London Page 273
might possibly have some important implications for the Turkish capital market (Sevil
et al., 2012) and therefore its firms, while setting their dividend policies.
The empirical evidence regarding the relationship between foreign ownership and
dividend policy in emerging markets is limited and mixed. For instance, Manos (2002)
in India, Jeon et al. (2011) in Korea and Ullah et al. (2012) in Pakistan found evidence
that foreign ownership has a positive impact on dividend payout ratio, consistent with
the notion that it is more difficult for overseas investors to monitor firms and their
managements in emerging market, therefore the need for the dividend-induced capital
market monitoring, and they tend to use higher dividend payments to enhance better
managerial monitoring. Additionally, Jeon et al. (2011) further suggested that the
relative tax advantages of most foreign investors on dividends in Korea was another
reason for their preference for higher cash dividends. However, Lin and Shiu (2003)
reported an inverse correlation between foreign ownership and dividend payout policy.
They concluded that this may be due to the different taxation on capital gains and cash
dividends in Taiwan, where foreign investors had to pay a 25% withholding tax for cash
dividends, but capital gains were tax-free, thus foreign investors avoided holding shares
with higher dividend yields to mitigate the negative impact of disharmonious taxation.
In Turkey, foreign investors have to use a Turkish intermediary for their capital market
activities such as purchasing or selling shares, repo, portfolio management, investment
consultancy, underwriting, and so on (TSPAKB, 2012). After the implementation of the
various major economic and structural reforms, including the publication of the CMB
Principles of corporate governance in 2003, significant improvements have been
observed in many areas in terms of the legal and institutional environment for corporate
governance and transparency and disclosure practices in Turkey (IIF, 2005; Caliskan
and Icke, 2011). In addition, the big Turkish financial intermediaries may help prevent
the information asymmetry that foreign investors suffer, while they are investing in this
market. Since the Turkish stock market became a promising emerging market with a
fast growth, it has attracted a significant amount of foreign investment during the period
2003-2012 (CMB, 2003; 2012; Adaoglu, 2008). This may indicate that foreign investors
invest for stocks in Turkish market for their long-run growth potential, not for the short-
term cash dividend income, consistent with Glen et al.’s (1995) statement. Moreover,
the uneven tax treatment between capital gains and cash dividends, imposed by the
Turkish tax regime, which provides foreign shareholders with tax advantages for capital
Birkbeck University of London Page 274
gains over dividends,84 also implies that foreign investors possibly prefer none or lower
dividend payouts in order to reduce their tax burden on cash dividends. Therefore:
Hypothesis 4: There is a negative relationship between foreign ownership and the
dividend payment decisions of Turkish firms.
Greater attention has been paid to the monitoring role of institutional investors in
dividend policy literature. A number of studies investigated the impact of institutional
investors on dividend policies of firms listed in emerging markets; however, they
generally reported evidence supporting two opposing arguments. A few researchers
(Manos, 2002; Ullah et al., 2012; Thanatawee, 2013) found that institutional
shareholding has a positive impact on the dividend policy, consistent with the argument
that greater agency conflicts and poor legal protection given to the investors in
emerging markets mean institutional investors fail to directly monitor management,
hence they prefer dividend-induced capital market monitoring. Contrarily, other
researchers (Kouki and Guizani, 2009; Huda and Abdullah, 2013) reported that there is
a negative relationship between institutional ownership and dividend payout ratio,
which is in line with the argument that institutional investors act as a monitoring
mechanism on the firm’s management, consequently reducing, in general, the need for
high dividend payouts.
In Turkey, two legal entities, which have rather unusual ownership structures, namely
Turkiye Is Bankasi and OYAK Group, are the most common domestic financial
institutions controlling a number of ISE-listed companies (Yurtoglu, 2003).85 Apart
from these two corporations, the role of institutional investors in corporate governance
is still a new issue and the sector is underdeveloped (IIF, 2005; OECD, 2006).
However, the CBM of Turkey implemented “Individual Retirement Savings and
Investments System” in 2003 in the hope of creating pension and mutual funds that
84
Foreign share owners, both individuals and corporations, are not subject to any taxes for capital gains
derived from shares, whereas they are taxed with a 15% withholding tax rate for their cash dividends
distributed on the shares they held. 85
Turkiye Is Bankasi is a quasi-private bank founded in 1924 that has an unusual ownership structure.
The Republican People’s Party (CHP) is the testamentary heir to the shares initially held by Ataturk
(founder of Isbank). Under the Ataturk’s will, CHP only has the voting right of the shares but if there are
any dividends on the shares; dividends are equally paid to the Turkish Linguistic Society and the Turkish
Historical Society. Also, active and retired bank employees have shares in the bank’s capital. Moreover,
OYAK Group is, also known as Turkish Armed Forces Assistance Fund, a quasi-private group of
companies, which is founded in 1961 by a special law as a social security organisation for the members of
the Turkish army. OYAK operates as an insurance company and also as a financial institution that
provides its members with the financial support in the form of credit products that point their particular
needs at different stages of their life.
Birkbeck University of London Page 275
were expected to serve as institutional investors and increase monitoring in public firms
(CMB, 2003; Aksu and Kosedag, 2006). Although the CMB-regulated pension and
mutual funds were relatively small at first, they have been growing. Supposedly, as their
assets under management increase, they could become an important market player if
they have the right incentives to contribute actively in the governance of the firms in
which they invest (OECD, 2006). Accordingly, this implies that institutional investors
may act as a monitoring mechanism on the firm’s management in Turkey, consequently
reducing, in general, the need for high dividend payouts. Therefore, the following
hypothesis is formulated:
Hypothesis 5: There is a negative relationship between domestic institutional ownership
and the dividend payment decisions of Turkish firms.
From its early days to 1980s, when an export-led stabilisation and structural adjustment
policy that included the liberalisation of the capital market was implemented in Turkey,
the state was the major player, both as an owner of large industrial companies, and in
assigning resources to the private sector. A large number of state-owned enterprises
(SOEs) were founded and managed by the state during this time period (Kepenek and
Yenturk, 1996; Yurtoglu, 2003). However, the adoption of privatisation as one of the
essential tools of the market economy was started in Turkey, from 1986 onwards, in the
hope of reducing the size of the government and public spending, and increasing private
sector involvement and foreign direct investment (Karatas, 2009).
Furthermore, along with the implementation of major reforms, starting with the fiscal
year 2003, the new Turkish government accelerated the privatisation programme, which
included the divestiture of considerably large SOEs. The new stage of privatisation
process attracted a great amount of FDI to Turkey and foreign corporations, partnering
with powerful domestic collaborators, managed to obtain the ownership of these large
SOEs. As a result, together with the elimination of legal barriers to market entry, a
substantial reduction in the state’s direct involvement in the economy, increasing
private sector, and FDI involvement and ownership may also indicate a better corporate
governance and transparency and disclosure practices environment in Turkey (IIF,
2005; Aksu and Kosedag, 2006; Karatas, 2009).
Privatisation generally provides relatively more efficient ownership structures and a
significant improvement in performance of privatised firms (Megginson et al., 1994;
Lopez-de-Silanes, 1994). However, it is also possible that privatisation may not work as
Birkbeck University of London Page 276
well as intended and may lead to increases in agency costs of managerial control that
can be almost as serious as the political control in these companies (Shleifer and
Vishny, 1997). Indeed, the important aspect determining the efficiency of an enterprise
is not whether it is state-owned or privately owned, but how it is managed (Cook and
Kirkpatrick, 1988). In this context, a few researchers (Wei et al., 2004; Wang et al.,
2011; Lam et al., 2012) reported a positive relationship from China, whereas Kouki and
Guizani (2009) found a negative relationship in Tunisia, between state ownership and
dividend payout policy. Therefore, the following opposing hypotheses can be
formulated:
Hypothesis 6a: There is a negative relationship between state ownership and the
dividend payment decisions of Turkish firms.
Hypothesis 6b: There is a positive relationship between state ownership and the
dividend payment decisions of Turkish firms.
At the beginning of 2006 the Turkish tax regime changed significantly, as explained
previously, providing a favourable tax treatment on capital gains over dividends for
investors in general (except domestic corporations, who are not subject to any taxes
both for capital gains and cash dividends). In this respect, small shareholders may have
preferences for capital gains over cash dividends to avoid tax burden and hence it
suggests an inverse relationship between minority owners and payout policy, consistent
with the Lam et al. (2012). However, Turkey has a history of poor structural and
microeconomic policies, as well as poor culture of corporate governance and
transparency and disclosure practices, therefore poorer minority investor protection and
relatively more corruption (IIF, 2005; Aksu and Kosedag, 2006).
Indeed, during the late 1990s, a long list of cases in tunnelling took place in the Turkish
public. A Majority of these cases were simple resource transfers of controlling
shareholders, from their firms, in the form of outright theft or fraud. A number of listed
firms’ minority shareholders were harmed by these events; a bigger proportion
represented wealth transfers from state banks to controlling owners of unlisted firms,
involving, in many cases, the visible hands of politicians (Yurtoglu, 2003). Likewise, a
number of well-publicised cases revealed that the unfair treatment of minority
shareholders was a serious corporate governance problem in Turkey, since controlling
families had the opportunities to expropriate profits from them, typically through the
use of company assets or non-arm’s length related party transactions (IIF, 2005). In the
Birkbeck University of London Page 277
following period, in early 2000s, the Turkish economy experienced a systematic
banking crisis, and this strongly affected the ISE, resulting in substantial losses for
shareholders, especially small Turkish investors who heavily invested in the ISE prior to
the economic crisis (Adaoglu, 2008; BRSA, 2010).
Accordingly, the CMB of Turkey re-introduced the mandatory dividend policy starting
with the fiscal year 2003 until 2008 (however, it was much more flexible than the first
mandatory dividend policy that imposed to pay 50% of distributable earnings as cash
dividends in the earlier years). The purpose for re-introducing the mandatory dividend
policy was to protect minority shareholders rights against the controlling shareholders,
since Turkish firms are highly dominated by families and generally attached to a group
of companies, where the controlling shareholders, typically families, often use a
pyramidal structures or dual-class shares to augment control of their firms (Kirkulak
and Kurt, 2010). From this perspective, it implies that minority shareholders in Turkey
might have a taste for higher dividends, to reduce the risk of expropriation of their
wealth by controlling shareholders, as proposed by La Porta et al. (2000) and therefore
increasing outside monitoring through cash dividend payments, consistent with a
number of studies (Rozeff, 1982; Schooley and Barney, 1994; Moh’d et al., 1995;
Manos, 2002; Farinha, 2003) reported a positive relationship between minority owners
and payout policy. Therefore:
Hypothesis 7: There is a positive relationship between minority shareholders ownership
and dividend payment decisions of Turkish firms.
5.3 Methodology
The following sub-sections describe the methodology used in this chapter of the
research. First, the sample data is explained, followed by the variables and models are
presented, which are employed in order to test the research hypotheses.
5.3.1 Sample Data
The purpose of this chapter is to empirically investigate the effects of family
involvement, through ownership and board representation, non-family blockholders,
such as foreign investors, domestic financial institutions and the state, and minority
shareholders on dividend policy related to the agency cost theory argument, after the
Birkbeck University of London Page 278
implementation of major economic and structural reforms, starting with the fiscal year
2003 in the Turkish market. Therefore, the data sample is drawn from the Istanbul Stock
Exchange (ISE) according to the following criteria:
1. First, all companies listed on the ISE, during the period 2003-2012 are
considered. A long panel dataset allows understanding the effect of ownership structure
on dividend policy in a way that cannot be achieved using cross-sectional data.
Table 5.2 on the next page presents the descriptive statistics of the distribution for
ownership structure, according to the identity of the shareholders and dividend payment
groups from the sampled 264 Turkish firms with 2,112 firm-year observations during
the period 2003-2012. The shareholders are categorised into six types; family ownership
includes family managers, family members and family-controlled holdings share-
ownership, whereas foreign ownership represents the shares held by foreign companies,
foreign financial institutions and foreign individuals. Further, domestic institutional
ownership measures the percentage of shares owned by Turkish financial institutions
such as banks, pension funds, investment trusts and insurers, while organisations such as
cooperatives, voting trusts, and a company or a group with no single controlling investor
are categorised as miscellaneous. The column named “Dispersed” shows the distribution
of the percentage of the outstanding equity held by minority (small) investors, which are
defined as the shareholders who own less than 5% of a listed firm’s equity.86 In addition,
the last two columns of the table show the statistics for the board size and the number of
controlling family members on the board.
86
Under Turkish mandatory provisions and the CMB Principles, all types of shareholders, who own more
than 5% of any listed company’s capital, either directly or indirectly should be disclosed to the public
(CMB, 2003; 2012). Therefore, shareholders who hold less than 5% are categorised as small investors.
Birkbeck University of London Page 280
Table 5.2 Summary Statistics for Ownership Structure by Dividend Payment Groups Sample includes 264 firms (non-financial and non-utility) listed on the ISE with 2,112 firm-year observations during the period 2003-2012.
Variables
Family
Ownership
(%)
Foreign
Ownership
(%)
Domestic
Institutional
Ownership (%)
State
Ownership
(%)
Miscellaneous
(%)
Dispersed
(%)
Board
Size
Family
Directors
Panel A: Non-Dividend Paying Firms – 126 Firms with 852 firm-year observations during 2003-2012
Mean 46.08 7.93 1.45 1.68 2.18 40.68 5.60 1.87
Median 51.75 0.00 0.00 0.00 0.00 37.11 5.00 2.00
S.D. 27.69 22.77 10.21 6.16 10.78 20.94 1.80 1.56
Min 0.00 0.00 0.00 0.00 0.00 2.46 3.00 0.00
Max 96.34 97.54 82.50 82.77 86.00 100.00 14.00 6.00
Panel B: Less Frequent Dividend Paying Firms – 49 Firms with 451 firm-year observations during 2003-2012
Table 5.4 shows the descriptive statistics (mean, median, standard deviation, minimum
and maximum values, skewness and kurtosis) for the research variables used in the
multivariate analyses. The panel dataset (unbalanced) includes 264 Turkish firms (non-
financial and non-utility) listed on the Istanbul Stock Exchange (ISE) with 2,112 firm-
year observations (except dividend payout ratio, DPOUT, which has 2,066
observations) over the period 2003-2012.
Table 5.4 Descriptive Statistics of the Research Variables The table reports the descriptive statistics for the research variables used in the multivariate
analyses of this part of the study. The unbalanced panel dataset includes 264 firms (non-financial
& non-utility) listed on the ISE with 2,112 firm-year observations over the period 2003-2012.
Variables Mean Median S.D. Min Max Skewness Kurtosis
Number of Observations 1,846 1,846 1,846 1,846 1,846 1,846 1,846 1,846
Wald X2 422.29*** 452.09*** 194.09*** 198.83***
Pseudo R2 35.88% 38.22%
Rho Value 0.6530 0.6231
Likelihood Ratio Test 335.29*** 280.09***
The table reports the logit estimations and z-statistics in the parentheses. ***, ** and * stand for significance at the 1%, 5% and 10% levels respectively. Independent
variables are one-year lagged. The pooled models are tested using White’s corrected heteroscadasticity robust regressions.
Birkbeck University of London Page 290
Furthermore, both pooled and panel (random effects) logit regressions estimations are
employed in order to identify which one is more favourable in investigating the
dividend puzzle in the context of developing Turkish market.89
Accordingly, Panel A in
Table 5.6 displays the results of pooled logit estimation coefficients and marginal
effects, whereas Panel B in the same table shows the results of random effects (panel)
logit estimation coefficients and marginal effects of the independent variables on the
probability of paying dividends for Model 1 and Model 2. The following conclusions
can be drawn from Table 5.6.
1. When Model 1 and Model 2 are estimated by the pooled logit regressions, they
are overall statistically significant at the 1% level as evidence by the Wald X2
tests.
Also, the Pseudo R2
values for the models (35.88% and 38.22% respectively) suggest a
good indication about the prediction power of the models. Similarly, the random effects
(panel) logit regressions estimate that the models (Model 1 and 2) are also overall
statistically significant at the 1% level as reported by the Wald X2 tests. However, the
Likelihood-ratio tests are statistically significant at the 1% for both Model 1 and 2,
indicating that the proportion of the total variance contributed by the panel-level
variance component, rho, values are significantly different from zero (0.6530 and
0.6231 respectively); therefore, this suggests that panel models are more favourable
than pooled models. Hence, the following results are reported based on the random
effects logit models (Panel B).
2. The results from the random effects logit regressions in Model 1 and Model 2
(when the industry effect is controlled) show that the coefficients and marginal effects
of all control variables, in other words firm-specific (financial) variables, ROA, M/B,
DEBT, AGE and SIZE, are all statistically significant determinants (at the 1%, 1%, 1%,
5% and 1% level respectively) in affecting Turkish firms’ decisions whether to pay cash
dividends. Further, the probability of a Turkish firm paying dividends is positively
affected by the ROA, AGE and SIZE, whereas it is negatively influenced by the M/B
and DEBT variables. These results are consistent with the previous findings in Chapter
3, as well as in line with prior research taken in both developed and emerging markets,
suggesting that more profitable (Lintner, 1956; Bhattacharya, 1979; Miller and Rock,
1985; Jensen et al., 1992; Benartzi et al., 1997; Aivazian et al., 2003b; Al-Najjar, 2009;
Kirkulak and Kurt, 2010), more mature (Grullon et al., 2002) and larger sized firms
89
It is worth noting that this chapter of the study also employs probit estimations on the probability of
paying dividends. The corresponding pooled and panel (random effects) probit models provide very
similar findings with the logit estimations. The results are reported in Table 5.10 in Appendix III.
Birkbeck University of London Page 291
(Lloyd et al., 1985; Moh’d et al., 1995; Fama and French, 2001; Al-Najjar, 2009;
Imran, 2011; Kisman, 2013) are more likely to pay dividends. Whereas firms with
higher growth opportunities (Rozeff, 1982; Myers and Majluf, 1984; Lang and
Litzenberger, 1989; Schooley and Barney, 1994; Kisman, 2013) and with more debt
(Jensen and Meckling, 1979; Jensen, 1986; Crutchley and Hansen, 1989; Aivazian et
al., 2003b; Al-Najjar, 2009; Kisman, 2013) are less likely to pay dividends in the
Turkish market.
3. With regard to the test variables, in other words ownership structure variables, a
number of conclusions are drawn from the random effects logit models. First, in order
to investigate how family control influences the probability of paying dividends, two
family effect variables are created, namely family share ownership (FAMILY) and
family control through the board by family members (FAMBOARD). However, the
results show no significant relation between the family control variables, both FAMILY
and FAMBOARD, and the probability of a Turkish firm to pay dividends, since the
coefficients and the marginal effects of the variables are negative but not statistically
significant at any conventional significance levels in both Model 1 and Model 2. These
findings are inconsistent with the expropriation argument (Sheleifer and Vishy, 1997;
Anderson and Reeb, 2004; Villalonga and Amit, 2006), outcome and substitute model
of dividends (La Porta et al., 2000) as well as the evidence provided in emerging
markets by a few studies (Faccio et al., 2001; Chen et al., 2005; Wei et al., 2011;
Aguenaou et al., 2013; Gonzalez et al., 2014).
4. Among non-family blockholders, FOREIGN has a significantly negative impact
on the probability of a Turkish firm paying dividends. The coefficients of the variable
are statistically significant and negative at the 10% level in Model 1, and at the 5% level
in Model 2 when the industry effect in controlled. Further, the marginal effects of
FOREIGN are also found to be negatively significant at the 10% level in Model 1 and
significant at the 5% level in Model 2 (-0.1766 and -0.2125 respectively), suggesting
that one unit of increase in FOREIGN will decrease the probability of a Turkish firm to
pay dividends by about 17-21% for an average firm. The evidence of the negative
correlation is consistent with Glen et al. (1995) and Lin and Shiu (2003), and may
suggest that foreign investors invest in stocks of Turkish firms for their long-run growth
potential rather than the short-term dividend income. This may also be indicating that,
along with the significant improvements in many areas for corporate governance and
transparency and disclosure practices in Turkey since 2003, the increase in foreign
Birkbeck University of London Page 292
ownership provides more monitoring on the managements’ activities and hence less
need for the dividend-induced monitoring device. Further, it may as well be reflecting
the uneven tax treatment between capital gains and cash dividends imposed by the
Turkish tax regime, which provides foreign shareholders with tax advantages for capital
gains over dividends, and therefore foreign investors possibly prefer none or lower
dividend payouts in order to reduce their tax burden on cash dividends.
5. Similarly, the panel logit estimations show that state ownership (STATE) has
also a significantly negative effect on the probability of paying dividends in Turkey.
The coefficients and marginal effects of the variable (suggesting that one unit of
increase in STATE will reduce the probability of a Turkish firm paying dividends by
around 24-27% for an average firm) are reported to be negative and statistically
significant at the 10% level in Model 1 and even more significant (at the 5% level)
when the industry dummies are added in Model 2. This finding is in contrast with the
evidence of Gugler (2003), Wei et al. (2011), Wang et al. (2011) and Lam et al. (2012)
who reported a positive relationship between state ownership and dividend payments.
However, it is consistent with Kouki and Guizani (2009) who found a negative impact
of the state on dividend policy in Tunisia. Accordingly, the evidence may imply that,
after the implementation of major reforms, starting with the fiscal year 2003, the
accelerated privatisation programme, which included the divestiture of considerably
large SOEs, executed by the Turkish government provide relatively more efficient
ownership structures which resulted in better corporate governance, transparency and
disclosure practices environment in Turkey, and therefore the state ownership is
involved with less need for the dividend-induced capital market monitoring.
6. Moreover, the results reveal that domestic financial institutions (INST) and
minority (DISP) shareholdings have no impact on the Turkish firms’ decisions on
whether to pay dividends. The coefficients and marginal effects of both variables are
negative but not statistically significant at any conventional significance levels in both
Model 1 and Model 2. Contrarily, the variable BOARD is highly significant (at the 1%
level in both Model 1 and 2) and positively affects the probability of a Turkish firm to
pay dividends (the marginal effects of the variable suggest that, one unit increase in
BOARD will increase the probability of paying dividends by about 2.5-2.6% for an
average Turkish firm). This result is consistent with the argument that larger firms have
larger size of boards (Fiegener et al., 2000; Gabrielsson, 2007; Huda and Abdullah,
2013) and therefore the larger the board is the more likelihood that the firm pays
Birkbeck University of London Page 293
dividends. In fact, the controlling owners, generally families in Turkey, are most likely
to not appoint boards that will limit their control, and usually the boards of the family-
owned companies often act mostly as rubber stamps for decisions made by the majority
shareholder (IIF, 2005; Ararat et al., 2011; Caliskan and Icke, 2011). Hence, the size of
board (BOARD) reflects the firm size, as hypothesised, and it is positively related to
dividend policy, also in line with the previous firm-specific variable (SIZE) proxying
for the firm size.
7. Consequently, random effects logit estimates report that Turkish firms’
decisions regarding whether to pay dividends are negatively affected by the FOREIGN,
STATE, M/B and DEBT variables, but positively influenced by the ROA, AGE, SIZE
and BOARD variables, while the FAMILY, FAMBOARD, INST and DIPS variables
have no significant effects. Further, the industry effect is attempted to control by adding
14 different industries classification dummies in the multivariate tests. Even though
inclusion of industry dummies changes the significance levels of the significant
variables in a couple of cases (FOREIGN and STATE), and slightly changes the
marginal effects of the significant variables, it shows no considerable impact.
5.4.2 Results of the Tobit Estimations
The effect of ownership structure of Turkish firms on their dividend policy decisions
regarding the amount of dividend payouts is examined by the tobit regressions.
Accordingly, the continuous dependent variable, dividend payout ratio, which is
denoted as DPOUT and left censored at zero, is employed. Model 1 includes the set of
all independent variables (test and control variables) to indentify the ownership
structure influence while Turkish firms set their actual level of payout ratios, whereas
Model 2 expands the regression model by adding industry dummies to control for
different industry classifications effect of the sample.
Panel A in Table 5.7 on the next page illustrates the results of pooled tobit estimation
coefficients and marginal effects, whereas Panel B in the same table presents the results
of random effects tobit estimation coefficients and marginal effects of the independent
variables on the dividend payout levels for Model 1 and Model 2. The following
conclusions are made from Table 5.7.
Birkbeck University of London Page 294
Table 5.7 Results of the Tobit Estimations on Dividend Payout Ratio
Model Variables PANEL A: Pooled Tobit PANEL B: Random Effects Tobit
Model 1 Model 2 Model 1 Model 2
Dependent Variable: Dividend Payout Ratio Dividend Payout Ratio Dividend Payout Ratio Dividend Payout Ratio
Independent Variables: Coefficient
Estimates
Marginal
Effects
Coefficient
Estimates
Marginal
Effects
Coefficient
Estimates
Marginal
Effects
Coefficient
Estimates
Marginal
Effects
FAMILY -0.6073 -0.1307 -1.1287** -0.2357** -1.2628** -0.1555** -1.6226** -0.2012**
Number of Observations 1,800 1,800 1,800 1,800 1,800 1,800 1,800 1,800
F Test 5.28*** 5.12***
Wald X2 198.39*** 217.47***
Pseudo R2 14.22% 16.02%
Rho Value 0.3772 0.3309
Likelihood Ratio Test 161.46*** 120.43***
The table reports the tobit estimations and t/z-statistics in the parentheses. ***, ** and * stand for significance at the 1%, 5% and 10% levels respectively. Independent
variables are one-year lagged. The pooled models are tested using White’s corrected heteroscadasticity robust regressions.
Birkbeck University of London Page 295
1. When Model 1 and Model 2 are estimated by the pooled tobit regressions, they
are overall statistically significant at the 1% level, as evidence by the F-test values.
Also, the random effects (panel) tobit regressions estimate that the models (Model 1 and
2) are also overall statistically significant at the 1% level, as reported by the Wald X2
tests. However, the Likelihood-ratio tests are statistically significant at the 1% for both
Model 1 and 2, indicating that the proportion of the total variance contributed by the
panel-level variance component, rho, values are significantly different from zero
(0.3772 and 0.3309 respectively); therefore, this suggests that panel models are more
favourable than pooled models. Hence, the following results are reported based on the
random effects tobit models (Panel B).
2. The results from the random effects tobit regressions in Model 1 and Model 2
(when the industry effect is controlled) indicate that the coefficients and marginal
effects of all control variables, ROA, M/B, DEBT, AGE and SIZE, are all statistically
significant. Further, the amount of dividend payout ratio is positively affected by the
ROA, AGE and SIZE, whereas it is negatively influenced by the M/B and DEBT
variables. These results are consistent with the panel logit models results previously
reported, suggesting that more profitable, more mature and larger sized Turkish firms
pay higher dividends, whereas the ones with higher growth opportunities and more debt
pay lower dividends.
3. Regarding the test variables, the panel tobit regressions report that all the
ownership variables, FAMILY, FAMBOARD, BOARD, FOREIGN, INST, STATE and
DISP, are statistically significant, unlike the panel logit estimations. More interestingly,
they are all negatively affecting the amount of dividend payouts of the Turkish firms,
except BOARD, which is indeed found to be reflecting the firm size. The results show
that FOREIGN and STATE variables are significantly and negatively related to
dividend payouts of Turkish firms (as well as the probability of the dividend payment
decisions, as reported by the panel logit estimations), indicating that higher foreign and
state ownerships lead to lower dividend payments.
4. The coefficients of the family control variables, FAMILY and FAMBOARD,
are both significantly negative at the 5% and the 10% level, respectively in Model 1 and
Model 2 (when the industry dummies are included). The marginal effects of the
variables indicate that one unit increase in FAMILY and FAMBOARD variables will
reduce the amount of payout ratio by about 15-20% and 0.4%, respectively for an
average Turkish firm. These results are consistent with the evidence provided by Faccio
Birkbeck University of London Page 296
et al. (2001) in East Asia, Chen et al. (2005) for small firms in Hong Kong, Wei et al.
(2011) in China and Aguenaou et al. (2013) in Morocco, who reported a significantly
negative impact on dividend policy of family control. Additionally, Gonzalez et al.
(2014) also reported that family ownership has a negative impact on dividend policies
of Colombian firms, but they contrarily found that family representation through board
has a positive effect on dividends. Therefore, the results imply that families in Turkey
tend to exacerbate expropriation of wealth from minority investors by paying lower
dividends in line with the Agency Problem II argument (Sheleifer and Vishy, 1997;
Anderson and Reeb, 2004; Villalonga and Amit, 2006). However, considering the non-
significant impact of Turkish families on the decisions to pay or not pay dividends (if
the expropriation argument through dividends holds true for Turkish families, their
control should also be significantly and negatively affecting the probability of paying
dividends) and the significantly negative effects of all other blockholders (foreign and
domestic financial investors, and the state), and even minority shareholders on the
dividend payout ratio, the evidence for expropriation argument for Turkish families is
relatively weak. In fact, this negative correlation may suggest that families are likely to
cater for the dividend preferences of their shareholders, consistent with the catering
theory of dividends90 developed by Baker and Wurgler (2004a; 2004b).
5. Likewise, the variables INST and DISP, which have no significant effect on the
probability of paying dividends, are reported to be significantly and negatively affecting
the amount of payout ratios of the Turkish firms by the panel tobit estimations (the
coefficients of both variables are negative and significant at the 10% level in Model 1
and at the 5% level in Model 2). The marginal effects of the two variables suggest that
one unit increase in INST and DISP will decrease the amount of payout ratio by about
16-22% and 17-23% respectively, for an average Turkish firm. The evidence of the
inverse relationship between the minority shareholders, DISP, and the payout ratio is
contrary to the statement of La Porta et al. (2000), that minority shareholders might
have a taste for higher dividends to reduce the risk of expropriation of their wealth by
controlling shareholders, and inconsistent with a number of studies (Rozeff, 1982;
Schooley and Barney, 1994; Moh’d et al., 1995; Manos, 2002; Farinha, 2003).
However, this finding implies that small shareholders have preferences for capital gains
90
According to the catering theory of dividends, investors’ preferences for dividends may change over
time and the decision by firms to pay dividends is driven by investors’ preferences for dividends.
Therefore, managers cater to investors by distributing dividends when investors put a premium on such
stocks. Correspondingly, managers will omit dividends when investors rate more highly firms that do not
pay dividends. Consequently, managers recognize and cater to shifts in investors demand for dividend
preferences (Baker and Wurgler, 2004a; 2004b).
Birkbeck University of London Page 297
over cash dividends to avoid tax burden, due to a favourable tax treatment on capital
gains provided by the Turkish tax regime. This is in line with Lam et al. (2012), who
reported a negative relationship for the same reason in China. Moreover, higher stock
ownership of domestic financial investors (INST) in a Turkish firm associates with
lower dividend ratios, which is contrary to evidence provided by Manos (2002), Ullah et
al. (2012) and Thanatawee (2013), who argue that greater agency conflicts and poor
legal protection given to the investors in emerging markets lead to institutional investors
failing to directly monitor the managements, hence they prefer dividend-induced capital
market monitoring. In fact, consistent with studies such as Kouki and Guizani (2009)
and Huda and Abdullah (2013), the evidence suggests that increasing ownership of
Turkish institutional investors in general reduce the need for high dividend payouts,
which may be due to their efficient monitoring on the firms’ management.
6. The negative relationship between ownership variables and payout ratios of
Turkish firms may be the reflection of the uneven tax treatment imposed by the Turkish
tax regime. The CMB of Turkey re-introduced the mandatory dividend policy in 2003
to attract the investors, who suffered from substantial loses from prior economic crisis,
back to the stock market. Initially, capital gains and dividends were taxed equally,
regardless of the type of investor, but the Turkish tax regime changed significantly at
the beginning of 2006, providing a favourable tax treatment on capital gains over cash
dividends for foreign investors (both corporations and individuals) and domestic
individual investors. This may imply why these investors generally have preferences for
capital gains over cash dividends, to avoid tax burden. However, the tax-preference
explanation does not solely explain the whole puzzle, since Turkish corporations (both
financial and non-financial) are not subject to any taxes, both for capital gains and cash
dividends, but in general they have tendencies to require lower dividend payouts. As
illustrated in Table 5.2, there are indeed different clienteles, including all types of
investors, who own stocks of non-dividend payers and less frequent dividend paying or
frequent dividend paying Turkish firms. Therefore, this implies support for the tax
clientele theory (Miller and Modigliani, 1961; Black and Scholes, 1974; Miller and
Scholes, 1978), arguing that each investor has their own implied calculations of
choosing between high or low cash dividends and selecting dividend policies according
to their tax category circumstances or their own cash flow requirements.
7. As previously mentioned, although the outcome model of dividends, proposed by
La Porta et al. (2000), argues that dividends are an outcome of an effective system of
Birkbeck University of London Page 298
legal protection of shareholders, therefore suggesting higher dividend payments, it also
predicts that, other things being equal, firms with better investment opportunities should
in general pay lower payout ratios in countries with good shareholder protection. Based
on this argument, and considering the results of tobit regressions reporting that all the
ownership variables, family, foreign, domestic institutional, state and even minority
shareholdings, are statistically and negatively affecting the amounts of dividend payout
ratios of the Turkish firms, the evidence implies that the implementation of various
major economic and structural reforms in cooperation with the IMF and the EU
directives and best-practice international standards, including the CMB’s Corporate
Governance Principles in line with the World Bank and the OECD, starting with the
fiscal year 2003, have resulted significant improvements for the ISE-listed firms
corporate governance, transparency and disclosure practices and better shareholder
protection. Accordingly, investors in general have preference for the potential long-run
growth opportunity for the stocks they hold in the ISE, since Turkey is a fast-growing
market.
8. Finally, in line with the prior results, the panel tobit estimations show no
considerable industry impact when the industry dummes are included in the equation.
5.4.3 Further Analyses
In this sub-section, additional tests are conducted in order to confirm the primary
findings. This is done by employing an alternative dividend policy measure, namely
dividend yield.91 Since dividend yield (DYIELD) is a continuous variable, which is left
censored at zero and the distribution of the sample is a mixture of discrete and
continuous variables, a tobit estimation is appropriate. Therefore, dividend yield is
substituted for dividend payout ratio as the dependent variable,92 to further examine the
effect of ownership structure on dividend policy decisions of Turkish firms regarding
how much dividends to pay, and to check the robustness of the primary findings from
tobit estimations.
91
Dividend yield variable (denoted as DYIELD) is measured as the ratio of dividend per share to price
per share of firm i at year t during the period, 2003-2012. The descriptive statistics of DYIELD are
illustrated below. As can be seen that the mean ratio of the dividend yield is 0.0185, indicating that the
sampled Turkish firms had the dividend yield of just below 2% over the entire period.
Variable Observations Mean Median Std Dev. Min Max Skewness Kurtosis
Number of Observations 1,846 1,846 1,846 1,846 1,846 1,846 1,846 1,846
F Test 14.55*** 12.30***
Wald X2 372.33*** 381.72***
Pseudo R2 14.59% 15.37%
Rho Value 0.5397 0.5221
Likelihood Ratio Test 349.92*** 313.65***
The table reports the tobit estimations and t/z-statistics in the parentheses. ***, ** and * stand for significance at the 1%, 5% and 10% levels respectively. Independent
variables are one-year lagged. The pooled models are tested using White’s corrected heteroscadasticity robust regressions.
Birkbeck University of London Page 300
Panel A in Table 5.8 on the previous page reports the results of pooled tobit estimation
coefficients and marginal effects, whereas Panel B in the same table presents the results
of the random effects (panel) tobit estimation coefficients and marginal effects of the
independent variables on the levels of dividend yield of Turkish firms for Model 1 and
Model 2.
At first glance, the results display that both pooled tobit models and panel tobit models
are overall statistically significant at the 1% level. However, the Likelihood-ratio tests
are statistically significant at the 1% for both Model 1 and 2, indicating that the
proportion of the total variance contributed by the panel-level variance component, rho,
values are significantly different from zero (0.5397 and 0.5221 respectively). Therefore,
as in case of the prior results, this suggests that panel tobit models are more favourable
than pooled tobit models. Hence, the following results are reported based on the random
effects tobit models (Panel B).
The results reported in Table 5.8 show that the random effects tobit estimations, when
the dividend yield is used as the dependent variable, provide very similar findings in
line with the previous results regarding the dividend payout ratio. Although the
significance levels of some explanatory variables and the marginal effects are found to
be different, the amounts of the dividend yield of Turkish firms are significantly
affected by the same variables with the same directional impacts, as in the case of their
dividend payout ratio levels. Particularly, the amount of dividend yield is significantly
and positively affected by ROA, AGE and SIZE, whereas it is significantly and
negatively influenced by M/B and DEBT. Regarding the test variables, FAMILY,
FAMBOARD, FOREIGN, INST, STATE and DISP have significantly negative impacts
but BOARD has a significantly positive effect on the amounts of dividend yield of
Turkish firms. Also, inclusion of INDUSTRY dummies shows no substantial impact.
Subsequently, when the panel tobit regression estimates are used to examine the effect
of ownership structure on dividend policy decisions of Turkish firms, regarding how
much dividends to pay, by employing an alternative dependent variable (dividend
yield), the results report very similar evidence confirming the robustness of the primary
findings from the panel tobit regressions performed on the dividend payout ratios of the
Turkish firms.
The summary of the empirical results for the research hypotheses is illustrated in Table
5.9 on the next page.
Birkbeck University of London Page 301
Table 5.9 Summary of Estimations Results for the Research Hypotheses
Variables Predicted
Sign
Realised
Sign Findings
Justification of the
Hypotheses
FAMILY (-)
(-)
Family control variables are both found to be negative but insignificant factors on the probability of a
Turkish firm paying dividends. However, they are both significantly negative determinants in setting
dividend payout ratio once the Turkish firm decides to pay dividends. Hence, the evidence does not show
enough support for the expropriation argument based on Agency Problem II perspective (Sheliefer and
Vishny, 1997; Anderson and Reeb, 2004; Villalonga and Amit, 2006) and for the results provided by Faccio
et al. (2001), Chen et al. (2005, Wei et al. (2011) and Aguenaou et al. (2013).
Hypothesis 1 and 2 are
partially supported.
FAMBOARD (-) (-)
BOARD (+) (+)
The size of board is in fact found to be reflecting the firm size. The evidence supports the argument that
larger firms have larger size of boards (Fiegener et al., 2000; Gabrielsson, 2007; Huda and Abdullah, 2013)
and therefore the larger the board is more likelihood that the firm pay larger dividends. Hypothesis 3 is supported.
FOREIGN (-) (-)
Foreign ownership has a significantly negative effect on both the decisions of Turkish firms regarding
whether to pay cash dividends and how much dividends to pay. The evidence is consistent with Glen et al.
(1995) and Lin and Shiu (2003) suggesting that foreign investors invests in stocks for their long-term
potential rather than the short-term dividend income. This may be implying that along with the significant
improvements in many areas for corporate governance and transparency and disclosure practices in Turkey
since 2003, the increase in foreign ownership provides more monitoring on the managements’ activities and
hence less need for the dividend-induced monitoring device. Further, it may also be reflecting the uneven
tax treatment imposed by the Turkish tax regime, which provides foreign shareholders with tax advantages
for capital gains over dividends.
Hypothesis 4 is supported.
INST (-) (-)
Domestic financial institutions ownership has no significant effect on the probability of paying dividends
even though it is negatively correlated. However, it is found to be significantly and negatively affecting the
amount of the payout rations of the Turkish firms. Hence, the evidence is consistent with the studies such as
Kouki and Guizani (2009) and Huda and Abdullah (2013), suggesting that the increasing ownership of
Turkish institutional investors reduces in general the need for high dividend payouts, which may be due to
their efficient monitoring on the firms’ management.
Hypothesis 5 is partially
supported.
STATE (+) or (-) (-)
State ownership has a significantly negative effect on both the decisions of Turkish firms regarding whether
to pay cash dividends and how much dividends to pay. The evidence in line with Kouki and Guizani (2009),
implying that the state ownership involves with the less need for the dividend-induced capital market
monitoring.
Hypothesis 6a is supported.
DISP (+) (-)
Minority shareholders ownership has no significant effect on the probability of paying dividends but it is
significantly and negatively affecting the amount of the payout ratios of Turkish firms. The evidence is
contrary to the argument that minority shareholders have a taste for higher dividends to reduce the risk of
expropriation of their wealth by controlling shareholders (La Porta et al., 2000) and it implies that small
shareholders have preferences for capital gains over cash dividends to avoid from tax burden due to a
favourable tax treatment on capital gains provided by the Turkish tax regime, which is consistent with Lam
et al. (2012) who reported a negative relationship for the same reason in China.
Hypothesis 7 is not
supported.
Birkbeck University of London Page 302
5.5 Conclusions
This chapter of the study investigates the effect of ownership structure on dividend
policy decisions after the implementation of major economic and structural reforms,
starting with the fiscal year 2003, in the Turkish market. Turkey offers an ideal setting
to study the dividend behaviour of an emerging market (a civil law originated country),
which employed the common laws in order to integrate with world markets. Therefore,
the study focuses on a recent panel dataset of 264 companies (non-financial and non-
utility) listed on the ISE, over a ten-year period 2003-2012, including 1,846 firm-year
observations in logit models and 1,800 firm-year observations in tobit models.
Particularly, it examines the effect of family control, through their ownership and board
representatives, on cash dividend payment decisions based on the agency cost
explanation. Furthermore, the study also considers the impacts of the non-family
blockholders (foreign investors, domestic financial institutions, and the state) and
minority shareholders on the ISE-listed firms’ dividend policy decisions. In addition, it
employs richer research models (pooled and panel logit/probit and tobit estimations),
and uses alternative dividend policy measures (the probability of paying dividends,
dividend payout ratio and dividend yield) in order to provide more valid, consistent and
robust results.
The dividend policy of Turkish firms is analysed in two steps: (1) decision to pay or not
to pay and (2) how much dividends to pay. The results indicate that control variables
(firm-specific factors) all significantly affect the dividend policy decisions of the
Turkish firms, consistent with the results in Chapter 3. Specifically, the dividend policy
is positively influenced by profitability, firm age and firm size, whereas it is negatively
affected by investment opportunities and debt level in the context of Turkish market.
The results further report that Turkish firms have highly concentrated ownership
structure and are mostly owned by families followed by foreign investors, while other
blockholders, Turkish financial institutions and the state, show relatively lower
shareholdings. Moreover, it is found that foreign and state ownership are associated
with a less likelihood of paying dividends, while other ownership variables are
insignificant in affecting the probability of a Turkish firm to pay cash dividends.
However, all the ownership variables, family effect (both control through ownership
and board representation), foreign investors, domestic financial institutions, the state
Birkbeck University of London Page 303
and minority investors ownerships, have significantly negative impacts on the amount
of dividend payouts of Turkish firms.
Accordingly, the study presents consistent evidence that foreign investors invest in
stocks of Turkish firms for their long-run growth potential, rather than the short-term
dividend income. This may be implying that, along with the significant improvements
in many areas for corporate governance and transparency and disclosure practices in
Turkey since 2003, the increase in foreign ownership provides more monitoring on the
managements’ activities and hence less need for the dividend-induced monitoring
device. Further, it may also be reflecting the uneven tax treatment between capital gains
and cash dividends imposed by the Turkish tax regime, which provides foreign
shareholders with tax advantages for capital gains over dividends, and thus foreign
investors possibly prefer none or lower dividend payouts in order to reduce their tax
burden on cash dividends. Moreover, the empirical findings show evidence that state
ownership and dividend policy are negatively correlated, which may suggest that, after
the implementation of major reforms starting with the fiscal year 2003, the accelerated
privatisation programme that included the divestiture of considerably large SOEs
executed by the Turkish government, provide relatively more efficient ownership
structures, which resulted in better corporate governance, transparency and disclosure
practices environment in Turkey and, therefore, state ownership involving less with the
need for the dividend-induced capital market monitoring.
The expropriation argument based on the principal-principal conflict (Agency Problem
II) argues that when large shareholders, such as families, hold almost full control, they
prefer none or lower dividends to preserve cash flows that they can potentially
expropriate. Nevertheless, the study reports inconclusive evidence in this respect. Even
though family control has a significantly negative effect on the amount of dividend
payouts of Turkish firms, considering the non-significant impact of Turkish families on
the decisions to pay or not pay dividends (if the expropriation argument through
dividends holds true for Turkish families, their control should also be significantly and
negatively affecting the probability of paying dividends) and the significantly negative
relationship between dividend payout ratio and all other blockholders and even minority
shareholders, the evidence of expropriation argument for Turkish families is relatively
weak. In fact, this negative correlation may suggest that families are likely to cater for
the dividend preferences of their shareholders, consistent with the catering theory of
dividends developed by Baker and Wurgler (2004a; 2004b).
Birkbeck University of London Page 304
Similarly, domestic financial institutions and minority investors’ stock ownership have
no significant effect on Turkish firms’ decisions regarding whether to pay dividends,
but they are both significantly and negatively affecting the amount of the payout ratios.
Hence, higher stock ownership of domestic financial investors in a Turkish firm
associates with lower dividend ratio, which is contrarily to the argument that greater
agency conflicts and poor legal protection given to the investors in emerging markets,
fail institutional investors in directly monitoring the management; thus, they prefer
dividend-induced capital market monitoring. Indeed, the evidence suggests that the
increasing ownership of Turkish institutional investors reduces in general the need for
high dividend payouts, which may be due to their efficient monitoring on the firms’
management. Further, the evidence of the inverse relationship between the minority
shareholders and the payout ratio is contrary to the statement of La Porta et al. (2000),
that minority shareholders might have a taste for higher dividends to reduce the risk of
expropriation of their wealth by controlling shareholders. Instead, it implies that small
shareholders have preferences for capital gains over cash dividends to possibly avoid
from tax burden due to a favourable tax treatment on capital gains provided by the
Turkish tax regime.
Overall, the study findings reveal that cash dividends are not used as a monitoring
mechanism by investors in order to control for agency problems in Turkish market.
Also, there is not enough evidence that families are likely to expropriate by paying
lower dividends. Rather, the negative relationship between ownership variables and
payout ratios of Turkish firms may be the reflection of the uneven tax treatment
imposed by the Turkish tax regime, which provides a favourable tax treatment on
capital gains over cash dividends for foreign investors (both corporations and
individuals) and domestic individual investors. However, the tax-preference explanation
does not solely explain the whole puzzle since Turkish corporations (both financial and
non-financial) are not subject to any taxes both for capital gains and cash dividends but,
in general, they have tendencies to require lower dividend payouts. In fact, the results
show that there are different clienteles, among all types of investors, who own stocks of
non-dividend payers and less frequent dividend paying or frequent dividend paying
Turkish firms, suggesting support for the tax clientele theory.
Even though the outcome model of dividends, proposed by La Porta et al. (2000),
argues that dividends are an outcome of an effective system of legal protection of
shareholders, and therefore suggests higher dividends payments, it also predicts that,
Birkbeck University of London Page 305
other things being equal, firms with better investment opportunities should in general
pay lower payout ratios in countries with good shareholder protection. Based on this
argument, the evidence implies that the implementation of various major economic and
structural reforms in cooperation with the IMF and the EU directives and best-practice
international standards, including the CMB’s Corporate Governance Principles in line
with the World Bank and the OECD, starting with the fiscal year 2003, have resulted
significant improvements for the ISE-listed firms corporate governance, transparency
and disclosure practices and better shareholder protection. Consequently, investors in
general have preference for the potential long-run growth opportunity for the stocks
they hold in the ISE, since Turkey is a fast-growing market.
Birkbeck University of London Page 306
APPENDIX III
RESULTS OF THE PROBIT ESTIMATIONS
Birkbeck University of London Page 307
Probit regression models are employed to test the research hypotheses and to validate
the results from the logit models. Hence, the corresponding probit models, where the
dependent variable is a binary variable (0/1) and the independent variables have the
same previous definitions, are developed to examine the influence of Turkish firms’
ownership structure on their dividend policy decisions, regarding whether or not to pay
dividends, and to check whether they will confirm similar results as reported by logit
estimations. Accordingly, Panel A in Table 5.10 on the next page displays the results of
pooled probit estimation coefficients and marginal effects, whereas Panel B in the same
table shows the results of random effects (panel) probit estimation coefficients and
marginal effects of the independent variables on the probability of paying dividends for
Model 1 and Model 2.
The results display that both pooled probit models and panel probit models are, overall,
statistically significant at the 1% level. However, the Likelihood-ratio tests are
statistically significant at the 1% for both Model 1 and 2, indicating that the proportion
of the total variance contributed by the panel-level variance component, rho, values are
significantly different from zero (0.6626 and 0.6336 respectively). Therefore, as in case
of the logit estimations, this suggests that panel probit models are more favourable than
pooled probit models. Hence, the following results are reported based on the random
effects probit models (Panel B).
As can be observed from Table 5.10, the random effects probit estimations confirm
almost the same results (the same levels of significance of the coefficients and very
similar marginal effects) as reported by the random effects logit models. Particularly,
the probability of a Turkish firm paying dividends is significantly and positively
affected by ROA, AGE and SIZE, whereas it is significantly and negatively influenced
by M/B and DEBT. With regard to the test variables, FOREIGN and STATE have a
significantly negative effect but BOARD has a significantly positive impact, while
FAMILY, FAMBOARD, INST and DIPS have a negative, but not statistically
significant, effect on the probability of paying dividends. Also, inclusion of
INDUSTRY dummies shows no considerable impact. Consequently, the results of the
panel probit models are consistent, compared to the results of logit models, confirming
very similar findings regarding the decisions of Turkish firms on whether to pay cash
dividends or not.
Birkbeck University of London Page 308
Table 5.10 Results of the Probit Estimations on Probability of Paying Dividends
Model Variables PANEL A: Pooled Probit PANEL B: Random Effects Probit
Number of Observations 1,846 1,846 1,846 1,846 1,846 1,846 1,846 1,846
Wald X2 522.38*** 551.20*** 214.65*** 219.55***
Pseudo R2 35.74% 38.01%
Rho Value 0.6626 0.6336
Likelihood Ratio Test 339.99*** 286.42***
The table reports the probit estimations and z-statistics in the parentheses. ***, ** and * stand for significance at the 1%, 5% and 10% levels respectively. Independent
variables are one-year lagged. The pooled models are tested using White’s corrected heteroscadasticity robust regressions.
Birkbeck University of London Page 309
CHAPTER 6
CONCLUSION
6 Conclusion
Birkbeck University of London Page 310
6.1 Introduction
This concluding chapter illustrates an overall summary of the research results. In
addition, it gives recommendations for practice, addresses the research limitations and
provides suggestions for possible future research.
The main aim of this doctoral thesis is to carry the dividend debate into an emerging
market context and contribute more evidence to dividend literature. However, the
difference from prior research is that the dividend policy behaviour of an emerging
market is examined over a period, where serious economic and structural reforms have
been implemented, in order to integrate with world markets. Accordingly, this research
endeavours to uncover what behaviour the dividend policy of this emerging market
shows. In particular, the dividend policies of the companies listed on the Istanbul Stock
Exchange (ISE) are analysed, since Turkey offers an ideal setting for the purpose of this
thesis in allowing a study in dividend behaviour of a developing country, which has
implemented major reforms, starting with the fiscal year 2003, in compliance with the
IMF stand-by agreement, the EU directives and best-practice international standards for
a better working of the market economy, outward-orientation and globalisation.
This thesis has six chapters. The first chapter is an introduction to the study that
discusses the study background and motivation. It further provides a summary of
important developments of the ISE and justifies the rationale of choosing the ISE-listed
firms as the study sample. The chapter also supplies an overview of the importance of
this doctoral thesis. In Chapter 2, a detailed literature review on the dividend puzzle is
presented, including the leading dividend policy theories and empirical studies from
both developed and developing countries. Chapter 3 provides empirical research for the
firm-specific determinants affecting dividend policy decisions of the ISE-listed firms,
over a decade after Turkey adopted serious economic and structural reforms, including
the IFRS and inflation accounting, starting with the fiscal year 2003. Chapter 4 focuses
on the signalling theory of dividends. By using Lintner’s (1956) partial adjustment
model, it examines whether the ISE firms adopt deliberate cash dividend policies to
convey signals to investors, and whether they follow stable cash dividend payments, as
in developed markets, after the implementation of major reforms in 2003. Chapter 5
empirically investigates the link between ownership structure and dividend policy based
on the agency cost theory. Particularly, it analyses the effect of family control on
dividend policy from the principal-principal conflict perspective and also considers the
Birkbeck University of London Page 311
impacts of the non-family blockholders, such as foreign investors, domestic financial
institutions, the state, and minority shareholders on the ISE firms dividend policy
decisions, over a decade when Turkey employed major reforms, including the
publication of the CMB’s Corporate Governance Principles in the fiscal year 2003.
Finally, the current chapter, Chapter 6, presents an overall summary of the research
results, provides reccomendations for practice, addresses the research limitations, and
gives future research suggestions.
6.2 Overall Summary of Results
After the introduction chapter, the study provides, in Chapter 2, a literature review on
the dividend debate, which asserts that corporate dividend policy literature offers
various explanations and contains voluminous research. Although Miller and
Modigliani’s (1961) dividend irrelevance theory is logical and consistent under the
circumstances of perfect capital market assumptions, in real markets, where various
imperfections exist, this theory becomes highly debatable. Indeed, researchers proposed
a range of leading dividend theories involved with the relaxation of M&M’s
assumptions, and dealt with dividends in the presence of the various market
imperfections, including the signalling theory, agency cost theory, transaction cost
theory, tax-related explanations, bird-in-the-hand theory, pecking order theory, residual
dividend theory, catering theory and maturity hypothesis. However, it is concluded that
none of these theories explain the dividend puzzle single-handedly.
Chapter 2 also illustrates that empirical research regarding dividend policy is extensive.
Many scholars have built and empirically tested a great number of models relating to
these theories to explain why companies should pay or not pay dividends, whereas
others have surveyed managers to learn their thoughts about dividends. However, the
chapter shows an inconclusive judgment on the actual motivation for paying dividends,
despite countless research, as in line with Fisher Black’s (1976, p.5) statement that “The
harder we look at the dividend picture, the more it seems like a puzzle, with pieces that
just don’t fit together.”
Furthermore, it is observed that all these leading dividend policy theories, models and
frameworks are originally formulated based on developed markets. In fact, earlier
research on dividend policy, in terms of developing theories and empirical tests were,
Birkbeck University of London Page 312
focused on mainly the US market, followed by the UK market. Therefore, less is known
about dividend behaviour and the explanatory power of models for other countries,
particularly developing (emerging) economies, where market imperfections are the
norm rather than expectations, and are much stronger than in developed countries.
Nevertheless, considering the growing importance of emerging markets in terms of
global equity investments, these markets have recently started attracting considerable
international investors. Accordingly, emerging markets attach more pieces to the
dividend puzzle and researchers have started investigating the dividend behaviour of
corporations in developing countries (Glen et al., 1995; Adaoglu, 2000).
Even though the empirical research in developing markets has relatively contributed
little evidence compared to developed markets, researchers have also started examining
the dividend policy behaviour in emerging economies, especially over the past two
decades. A number of studies reviewed in Chapter 2, in the context of emerging
markets, have mostly confirmed that dividend policy behaviour in these markets
generally tend to be, not surprisingly, different from developed markets in many aspects
due to the various factors such as political, social and financial instability, lack of
adequate disclosure, poor laws and regulations, weaker financial intermediaries, newer
markets with smaller market capitalisations, weaker corporate governance and different
ownership structures (La Porta et al., 1999; 2000; Kumar and Tsetsekos, 1999;
Aivazian et al., 2003a and 2003b; Yurtoglu, 2003).
On the other hand, while examining dividend policy behaviour in different emerging
markets, researchers have not clearly stated or distinguished, as suggested by Bekaert
and Harvey (2002), between the concepts of regulatory liberalisation or integration
undertaken in those markets for their study sample periods. Hence, it can be argued that
dividend policy decisions of companies in an emerging market should be better
understood if researchers report whether the emerging market examined passes laws for
financial liberalisation or attempts to implement serious economic and structural
reforms to integrate with world markets. In this respect, dividend policies of companies
may significantly differ based on the process of liberalisation or integration undertaken
in the emerging market in which they operate. Accordingly, this thesis is also motivated
in carrying the dividend debate into an emerging market but by examining the dividend
policy behaviour of a particular emerging market that implemented serious economic
and structural reforms for the integration with world markets and attempts to identify
what behaviour the dividend policy of this emerging market shows afterwards.
Birkbeck University of London Page 313
Moreover, Turkey has had a very late start in the liberalisation of its economy and the
establishment of its stock market, the ISE, whose history only dates back to 1986. As
illustrated in the literature review, there is very limited evidence about dividend policy
in Turkey from a few studies (La Porta et al., 2000; Adaoglu, 2000; Aivazian et al.,
2003a; 2003b and Kirkulak and Kurt, 2010), which were undertaken in the earlier stage
of the ISE, while the Turkish economy was yet implementing its financial liberalisation
programme, suffering long-standing macro-economic imbalances and experiencing a
number of financial crises. Following the November 2002 elections, which resulted in
one-party government, political uncertainty, to some degree, diminished, and economic
programmes and structural reforms were jointly carried out by the government and the
IMF, starting in March 2003 (CMB, 2003). Further, Turkey’s progress in achieving full
membership of the EU, during this period, also provided the strongest motivation in
establishing new reforms, rules and regulations to improve corporate governance and
transparency and disclosure practices; therefore, to integrate its economy with Europe
and to harmonise its institutions with those of the EU (IIF, 2005; Aksu and Kosedag,
2006).
Accordingly, the Turkish stock market offers an ideal setting for the purpose of this
thesis, and therefore the study provides empirical evidence about the dividend policy
behaviour of publicly listed companies in Turkey, during its market integration period.
In order to fulfil the research purpose, the sample is drawn from the Istanbul Stock
Exchange. The study sample contains a recent large panel dataset of 264 non-financial
and non-utility firms listed on the ISE, from 14 different industries, during the period
2003-2012, including 1,846 firm-year observations (it is 1,800 firm-year observations
when the dividend pout ratio is used as a dependent variable).
The three chapters of this thesis, Chapter 3, 4 and 5, are empirical in nature. First, the
financial reporting standards of the ISE firms were only based on the generally accepted
principles of accounting and auditing. Even though Turkey generally enjoyed an
economic growth in 1990s, it was overall an economically unstable decade experiencing
a number of financial crises and having high inflation rates that surpassed 100% during
this decade. Due to the inconsistent and unclear accounting practices and the absence of
inflation accounting standards, the historical financial statements of the ISE firms lost
their information value and misinformed investors. However, the CMB of Turkey
adopted the International Financial Reporting Standards (IFRS) in 2003 and enforced
listed firms to use the new rules. In addition, the CMB obliged the implementation of
Birkbeck University of London Page 314
inflation-adjusted accounting at the same time. This has resulted in a more transparent
and more efficient worldwide financial reporting standards, providing comparable and
consistent financial data for foreign and domestic investors, and other institutions.
Likewise, the adoption of the IFRS and inflation accounting has given researchers a
way better opportunity to study firm-specific characteristics of firms in the Turkish
market. Therefore, Chapter 3 empirically investigates what firm-specific (financial)
determinants affect dividend policy decisions of the ISE firms, over a decade after
Turkey adopted the IFRS and inflation accounting, starting with the fiscal year 2003.
The results in Chapter 3 illustrate that profitability, firm size and firm age have
significantly positive effects, whereas debt level and investment opportunities have
significantly negative impacts on the dividend policy decisions of the ISE firms.
Further, the results show no significant relationship between dividend policy and
business risk, free cash flow, assets liquidity and assets tangibility, and therefore they
are not considered as the important firm-specific determinants while the ISE firms set
their dividend policies. Also, it is revealed that industry effect shows no considerable
impact.
According to Aivazian et al. (2003b), the dividend policies of firms in emerging
markets are affected by the same firm-specific determinants as their counterparts in the
US; however, emerging market firms may be more sensitive to some of these
determinants and may react differently, indicating the greater financial constrains in
different countries under which they operate. Consequently, the results of Chapter 3 are
consistent with the study of Aivazian et al. (2003b) and suggest that Turkish firms
follow the same determinants of dividend policy as proposed by dividend theories and
as empirically suggested by developed markets, after Turkey adopted the IFRS and
inflation accounting starting with the fiscal year 2003. Particularly, the primary firm-
specific determinants of dividend policy are profitability, debt level, firm size,
investment opportunities and firm age in the context of the emerging Turkish market.
Table 6.1 on the next page summarises the theoretical findings obtained from the results
of the single equation models related to the firm-specific determinants of dividend
policy of the ISE-listed firms, which are reported in Chapter 3.
Birkbeck University of London Page 315
Table 6.1 Summary of Theoretical Findings of Chapter 3 The table presents a summary of the theoretical findings obtained from the results of the single
equation models related to the firm-specific determinants of dividend policy of the ISE-listed
firms, which are reported in Chapter 3.
Variables Theory Theory
Prediction
Empirical Evidence
of the Study
Profitability Signalling Theory
Residual Dividend Theory
Positive
Positive
Investment
Opportunities Transaction Cost Theory
Pecking Order Theory
Overinvestment Hypothesis
Substitute Model
Negative
Negative
Negative
Positive
X
Business Risk Transaction Cost Theory Negative Not significant
Debt Policy Agency Cost Theory Negative
Free Cash Flow Free Cash Flow Theory Positive Not significant
Liquidity Signalling Theory Positive Not significant
Assets Tangibility Agency Theory Negative Not significant
Firm Age Maturity Hypothesis Positive
Firm Size Agency Cost Theory
Transaction Cost Theory
Positive
Positive
Notes: stands for the consistency between the theoretical prediction and the results of the study.
X reports no evidence identified from the results.
The evidence from cross-country studies (Glen et al., 1995; La Porta et al., 2000;
Aivazian et al., 2003a) revealed that emerging market governments are likely to enforce
constraints on dividend policy in order to protect both minority shareholders and
creditors. Similarly, the dividend policy in the ISE was heavily regulated during the
period 1985-1994 due to the first mandatory dividend policy imposed by the CMB,
which obliged to pay at least 50% of the distributable income as cash dividends. Earlier
studies (Adaoglu, 2000; Aivazian et al., 2003a) reported that the ISE firms followed
unstable dividend policies, since cash dividend payments were solely dependent on the
firm’s current year earnings, as forced by regulations, and any variability in earnings
was directly reflected in the level of cash dividends. However, the CMB of Turkey
implemented various reforms in terms of accounting standards, corporate governance,
and transparency and disclosure practices. In order to prevent insider lending, in other
words non-arms length transactions, the CMB regulated private banks by establishing
risk group definition and calculation of loan limits for a single business group, which
generally includes banks, businesses and subsidiaries in the same group. Further, the
Birkbeck University of London Page 316
CMB also employed much flexible mandatory dividend policy regulations (during
2003-2008) and eventually removed the restrictions forced on the dividend payments
(2009 and onwards). These developments may force the ISE firms to the equity market
with greater incentive for more transparent financing, since insider lending is prevented
and also allow the ISE managers to set their own dividend policies to reflect their
judgements in the share prices. Hence, Chapter 4 investigates whether the ISE firms
adopt deliberate cash dividend policies to signal information to investors and whether
they follow stable cash dividend payments, as in developed markets, after the
implementation of major reforms in 2003, by using Lintner’s (1956) partial adjustment
model and several extensions of this model.
The empirical results in Chapter 4 show that current earnings and lagged cash dividend
payments are positively significant factors in determining current cash dividend
payments in the listed Turkish firms, which indicate that the Lintner’s (1956) partial
adjustment model works well for explaining cash dividend payments behaviour of the
ISE-listed firms during the period 2003-2012. The results also indicate that the ISE
managers now adjust their cash dividends by a serious degree of smoothing that is
generally almost as smooth as their counterparts in the developed US market, compared
to previous studies. These findings are contrary to earlier research (Adaoglu, 2000;
Aivazian et al., 2003a) taken in the Turkish market, which showed no support to the
validity of the Lintner model and reported that the ISE-listed firms did not smooth their
cash dividends during the earlier years, between 1985 and 1997.
Furthermore, the empirical results from several extensions of the Lintner model reveal
some important facts regarding the Turkish market over the research period. It is found
that current earnings encourage firms to increase/decrease their cash dividends but the
levels of lagged earnings are the dominant component in terms of net earnings, while
the ISE-listed firms make their dividend policy decisions in order to avoid spectacular
and frequent changes, which is in line with Lintner’s (1956) argument. When external
finance (current and lagged total debt) is included into the Lintner model, significantly
negative correlation between the cash dividends and external finance is reported, which
possibly reflects that the ISE corporations find external finance, they now obtain from
arm’s length parties, more costly. By adding yearly dummies from year 2008 to 2012
into the model, the effect of the 2008 global crisis and its impact in the following years
are analysed. It is found that although the September 2008 global crisis markedly hit
Turkey, as in many other world markets, including both developed and developing
Birkbeck University of London Page 317
countries, it did not significantly affect cash dividend payments decisions of the ISE
firms, as well as their preferences of following stable dividend policies.
Table 6.2 below summarises the best models obtained from applying Lintner’s (1956)
partial adjustment model and several extensions of this model related to the signalling
theory on dividend policy of the ISE-listed firms, which are reported in Chapter 4.
Table 6.2 Summary of Best Models of Chapter 4 The table illustrates a summary of the best models from Lintner’s (1956) partial adjustment model
and several extensions of this model related to the signalling theory on dividend policy of the ISE-
Notes: TPR = Target payout ratio, SOA = Speed of adjustment. ***, ** and * stands for significance at
the 1%, 5% and 10% levels respectively.
The empirical findings in Chapter 4, overall, suggest that implementing major economic
and structural reforms as well as adopting more flexible mandatory dividend policy
regulations and attempting to prevent insider lending (non-arm’s length transactions)
lead the ISE firms to follow the same determinants as suggested by Lintner (1956) and
Birkbeck University of London Page 318
as followed by the US (developed) companies. Particularly, dividend payments of the
ISE firms seem to be affected by previous dividend levels and current earnings.
Furthermore, they attempt to adjust partially their dividends towards their target payout
ratio, more interestingly with a relatively low speed of adjustment as their counterparts
in developed markets. This implies that Turkish companies tend to smooth their
dividends, and adopt stable dividend policies, and therefore it can be concluded that
Turkish corporations have been using cash dividends as a signalling mechanism since
2003, with the implementation of severe economic and structural reforms.
In 2003, the CMB of Turkey published its Corporate Governance Principles in
cooperation with the World Bank and the OECD in order to improve the ISE firms’
corporate governance practices and to ensure that markets are functioning in a safer,
more transparent and more efficient manner. The CMB Principles consisted of four
major parts; specifically, shareholders, disclosure-transparency, stakeholders and board
of directors, and all firms traded in the ISE need to comply with these principles and
publish compliance reports yearly. Even though many areas have improved in Turkish
corporate governance practices since 2003, the ISE firms have highly concentrated
ownership structures and are heavily characterised by families. In this context, cash
dividends can be used to either reduce or exacerbate the principal-principal conflicts,
since dividends are the substitutes for legal protection of minority shareholders in the
countries with weak legal protections. By paying dividends, controlling shareholders
return profits to investors, which reduce the possibility of expropriation of wealth from
others. Accordingly, Chapter 5 empirically investigates the link between ownership
structure and dividend policy based on the agency cost theory of dividends for the ISE
firms over a period after Turkey implemented major reform, including the publication
of the CMB’s Corporate Governance Principles in the fiscal year 2003.
Particularly, it analyses the effect of family control, through their ownership and board
representatives, on dividend policy of the ISE firms in order to indentify whether
families tend to expropriate wealth from other investors by using dividends. Further, it
considers the impacts of the non-family blockholders, including foreign investors,
domestic financial institutions, and the state, on dividend policy, to find out whether
cash dividends are used as a monitoring device by these investors in minimising agency
problems in Turkish market. Also, the attitude of minority shareholders toward cash
dividends in the ISE is tested to detect whether they have a taste for higher dividends to
reduce the risk of expropriation of their wealth by controlling shareholders.
Birkbeck University of London Page 319
The empirical results in Chapter 5 report that Turkish firms have highly concentrated
ownership structure and are mostly owned by families followed by foreign investors,
while other blockholders, Turkish financial institutions and the state, show relatively
lower shareholdings. Moreover, it is found that foreign and state ownership are
associated with less likelihood of paying dividends, while other ownership variables are
insignificant in affecting the probability of a Turkish firm to pay cash dividends.
However, all the ownership variables, family effect (both control through ownership
and board representation), foreign investors, domestic financial institutions, the state
and minority investors ownerships, have significantly negative impacts on the amount
of dividend payouts of Turkish firms. Therefore, the findings present consistent
evidence that foreign investors invest in stocks of Turkish firms for their long-run
growth potential rather than the short-term dividend income. This may be implying that
the increase in foreign ownership provides more monitoring on the managements’
activities and hence less need for the dividend-induced monitoring device. It may also
be reflecting the uneven tax treatment between capital gains and cash dividends
imposed by the Turkish tax regime, which provides foreign shareholders with tax
advantages for capital gains over dividends and thus foreign investors possibly prefer
none or lower dividend payouts in order to reduce their tax burden on cash dividends.
Similarly, there is consistent evidence that state ownership and dividend policy are
negatively correlated, which suggests that state ownership involves less of a need for
dividend-induced capital market monitoring in Turkey.
Even though family control has a significantly negative effect on the amount of
dividend payouts of Turkish firms, considering the non-significant impact of Turkish
families on the decisions to pay or not pay dividends (if the expropriation argument
through dividends holds true for Turkish families, their control should also be
significantly and negatively affecting the probability of paying dividends), and the
significantly negative relationship between dividend payout ratio and all other
blockholders and even minority shareholders, the chapter shows inconclusive evidence
for the expropriation argument. Indeed, this negative correlation may suggest that
families are likely to cater for the dividend preferences of their shareholders. Similarly,
domestic financial institutions and minority investors’ stock ownership have no
significant effect on Turkish firms’ decisions regarding whether to pay dividends, but
they are both significantly and negatively affecting the amount of the payout ratios.
Hence, the evidence suggests that the increasing ownership of Turkish institutional
Birkbeck University of London Page 320
investors reduces, in general, the need for high dividend payouts, which may be due to
their efficient monitoring on the firms’ management. Further, the evidence of the
inverse relationship between the minority shareholders and the payout ratio is contrary
to the statement of La Porta et al. (2000) that minority shareholders might have a taste
for higher dividends to reduce the risk of expropriation of their wealth by controlling
shareholders, but it implies that small shareholders have preferences for capital gains
over cash dividends, in order to possibly avoid a tax burden, due to a favourable tax
treatment on capital gains provided by the Turkish tax regime.
The empirical results in Chapter 5, after all, reveal that cash dividends are not used as a
monitoring mechanism by investors in order to control for agency problems in Turkish
market. Also, there is not enough evidence that families are likely to expropriate by
paying lower dividends. Rather, the negative relationship between ownership variables
and payout ratios of Turkish firms may be the reflection of the uneven tax treatment
imposed by the Turkish tax regime, with a favourable tax treatment on capital gains
over cash dividends for foreign investors (both corporations and individuals) and
domestic individual investors. However, the tax-preference explanation does not solely
explain the whole puzzle, since Turkish corporations (both financial and non-financial)
are not subject to any taxes both for capital gains and cash dividends, but they generally
tend to require lower dividend payouts. However, the results show that there are
different clienteles among all types of investors who own stocks of non-dividend payers
and less frequent dividend paying or frequent dividend paying Turkish firms, suggesting
support for the tax clientele theory. Although the outcome model of dividends, proposed
by La Porta et al. (2000) argues that dividends are an outcome of an effective system of
legal protection of shareholders, therefore suggesting higher dividends payments, it also
predicts that, other things being equal, firms with better investment opportunities should
generally pay lower payout ratios in countries with good shareholder protection.
Consequently, the evidence implies that the implementation of various major economic
and structural reforms in cooperation with the IMF and the EU directives and best-
practice international standards, including the CMB’s Corporate Governance Principles
in line with the World Bank and the OECD, starting with the fiscal year 2003, have
resulted in significant improvements for the ISE-listed firms corporate governance,
transparency and disclosure practices, and better shareholder protection. Therefore,
investors in general have preference for the potential long-run growth opportunity for
the stocks they hold in the ISE, since Turkey is a fast-growing market.
Birkbeck University of London Page 321
Table 6.3 below summarises the empirical results obtained from the single equation
models related to the relationship between ownership variables and dividend policy of
the ISE-firms, which are reported in Chapter 5.
Table 6.3 Summary of Empirical Results of Chapter 5 The table shows a summary of the empirical results obtained from the single equation models related
to the relationship between ownership variables and dividend policy of the ISE-listed firms, which
are reported in Chapter 5.
Variables Realised Signs
Empirical Results DPAY DPOUT
Family
Ownership
Not
Significant
Negative
Evidence does not show enough support for the expropriation
argument.
Evidence may suggest that families tend to cater for the dividend
preferences of their shareholders, consistent with the catering theory
of dividends.
Evidence reveals that foreign investors tend to prefer stocks with
long-run growth potential rather than the short-term dividend
income.
Evidence shows that the dividend-induced capital market
monitoring is not preferred by investors to control for agency
problems.
Evidence reports that small shareholders have preferences for
capital gains over cash dividends, which implies a tendency for the
tax-preference explanation due to the uneven tax treatment between
capital gains and dividends, imposed by the Turkish tax regime.
Evidence also suggests support for the tax-clientele theory since
there are different clienteles among all types of investors who own
stocks from non-dividend payers to frequent dividend paying firms.
Evidence supports the argument that larger firms have larger size of
boards and therefore the larger the board is more likely that firms
pay larger dividends.
Evidence suggests that the implementation of major reforms in 2003
have resulted significant improvements for corporate governance,
transparency and disclosure practices and better shareholder
protection in Turkish stock market, therefore investors prefer to hold
stocks for the potential long-run growth opportunities, consistent
with the outcome model of dividends.
Family
Directors
Not
Significant Negative
Board Size Positive Positive
Foreign
Ownership Negative Negative
Institutional
Ownership
Not
Significant Negative
State
Ownership Negative Negative
Ownership
Dispersion
Not
Significant Negative
Notes: DPAY = The probability of paying dividends and DPOUT = Dividend payout ratio.
6.3 Recommendations for Practice
Based on findings acquired through this enquiry, recommendations can be made to
participants of this complex modern economic environment, who seek useful guidance
from relevant literature. Indeed, empirical results from this thesis have significant
implications for policy makers, regulators, investors and fellow researchers.
The findings infer important policy implications. First, dividend policy makers, in the
emerging Turkish market, tend to make more stable dividend payments and adjust their
Birkbeck University of London Page 322
target payout ratios at a lower speed. The adoption of more stable dividend policies
supports the view that policy makers regard this corporate decision as a signalling
mechanism. This also implies that dividend policy makers only increase dividend
payments when they believe that earnings can sustain higher dividend levels
permanently. They are also reluctant to decrease or cut dividends drastically, since
dividend decreases and cuts are bad signals to the market of firms’ future prospects,
especially in emerging economies where financial markets are much less stable
compared to developed economies.
Second, the results show that investment opportunities have a significant negative effect
on the dividend policy decisions of ISE firms. They also revealed that investors
generally have preference for the potential long-run growth opportunities for the stocks
they hold in the ISE, since Turkey is a fast-growing market. In this respect, dividend
policy makers should carefully consider the influence of their firms’ investment projects
on dividend policies. This is because poor judgement might result in severe agency
problems that involve the overinvestment hypothesis. By paying none or lower
dividends, they may overinvest in projects with negative NPVs, instead of undertaking
positive NPV investment projects with this cash. Contrarily, they may omit investing in
profitable projects by paying higher dividends.
The results further indicate that there are different clienteles, among all types of
investors who own shares in non-dividend payers or less-frequent or more-frequent
dividend paying Turkish firms. Through these results, it is worth bearing in mind that
investors’ preferences for dividend may change over time. Therefore, companies’
dividend policy makers should make an effort to recognise and cater to shifts in
investors’ demands for dividend preferences. Careless and drastic changes in dividend
policy may cause a change in clientele and could be costly, due to trading costs.
The findings of this enquiry show significant implications to regulators, such as the
Capital Markets Board (CMB) of Turkey and the Capital Markets Law (CML). The
results show that the CMB attributed great importance to improve communications with
investors, issuers and other institutions in 2003, in order to ensure that markets function
in a safer, more transparent and efficient manner, in accordance with regulations that
were adopted in harmony with international norms and developments. This has resulted
in important improvements for the ISE-listed firms’ corporate governance, transparency
and disclosure practices, and better shareholder protection as well as attracting a
Birkbeck University of London Page 323
considerable amount of foreign investments, and Turkish investors back to the stock
market. Since Turkey is a fast-growing market, these significant improvements lead to
investors investing in stocks for their long-run growth potential rather than short-term
dividend income, which indicate that cash dividends are not used as a monitoring
mechanism in order to control agency problems by investors. In addition, the uneven tax
treatment imposed by the Turkish tax regime with a favourable tax treatment on capital
gains over cash dividends for foreign investors and domestic individual investors
encourages these investors to hold their stocks for longer periods of time in order to
avoid tax burden.
At this point, the less usage of dividend-induced capital monitoring might result in
severe agency problems, as Turkish firms have a highly concentrated ownership
structure, especially dominated by families who can potentially expropriate wealth from
minority shareholders. Accordingly, regulators should take this potential danger into
account and maintain the high quality of corporate governance, transparency and
disclosure standards or even improve towards better shareholder protection. This could
be done by an efficient monitoring on family-controlled firms and the imposition of
appropriate regulations, encouraging independent and non-executive board members to
be more active in making corporate decisions, increasing the monitoring role of foreign
and institutional shareholders, and providing better protection for minority shareholders.
Furthermore, the results of this thesis can help investors gain a broad understanding of
the different roles and preferences of policy makers and various shareholders, in
shaping their corporate dividend policies. In addition, findings show that profitability,
firm size and firm age have significantly positive effects, whereas debt and investment
opportunities have significantly negative impacts on dividend payments in the emerging
Turkish market. This will help investors determine their investment strategies related to
their dividend preferences.
Finally, the results of this enquiry show that dividend policy decisions of companies in
an emerging market differ significantly, based on the process of liberalisation or
integration undertaken in the emerging market in which they operate. Accordingly, this
thesis suggests that, in line with Bekaert and Harvey (2002), researchers should report
whether the emerging market examined passes laws for financial liberalisation or
attempts to implement serious economic and structural reforms to integrate with world
markets, while examining dividend polices of different emerging markets.
Birkbeck University of London Page 324
6.4 Study Limitations and Further Research
This doctoral thesis has several limitations and further research is required to explore
more about the dividend puzzle. First, the study is limited to a sample of industrial
companies by excluding financial firms and utilities, since they are governed by
different regulations and follow arguably different financial policies. Further research,
therefore, could be conducted by incorporating financial and utility sector companies
listed on the ISE in order to identify their dividend policy behaviour after the
implementation of major reforms in Turkey in the fiscal year 2003. This would provide
a more complete picture of dividend policy behaviour of all companies trading in the
ISE.
Another limitation involves the nature of the research methodology. Although the study
covers appropriate econometrics and various alternative regression analysis techniques
(the pooled and panel logit/probit, tobit, pooled OLS, random and fixed effects, and
system GMM models), the empirical results of the regression analyses on secondary
data only reveal whether or not any correlation exists between dependent variable and
independent variables. They do not, however, explain why a correlation exists. Hence,
further research on primary data, such as interviews and questionnaire surveys
conducted from the ISE managers, would be useful in understanding their perceptions
about dividend policy. This would also increase the explanatory power of the various
dividend theories and models as well as providing an additional perspective from the
managers, who are actually responsible for making dividend policy decisions of the ISE
firms.
Corporate dividend policy literature mainly focuses on explaining cash dividend
payments behaviour of companies by various theories and voluminous empirical
research, since cash dividends are the most common way of distributing profits to
shareholders. This thesis is also limited to the analyses of cash dividend behaviour of
the ISE-listed firms. However, dividend policy may consist of other types of payouts,
such as stock dividends or share repurchases. Considering the major reforms
implemented and recent developments of regulatory changes of dividend policy in
Turkey, it is worth conducting further research on stock dividends and share
repurchases in order to find out whether they can be alternative payout policies for cash
dividends for the ISE firms.
Birkbeck University of London Page 325
Finally, this thesis is limited to the firms listed on the ISE. The implementation of major
reforms and regulatory changes, however, may produce different results in different
emerging markets. Therefore, conducting further research on dividend policy behaviour
of other emerging markets is also suggested, and these future studies should not be
limited to regulatory liberalisation of these markets but should extend to the periods
when they make serious attempts for economic and structural reforms to integrate with
world markets. In this respect, conducting parallel studies in the context of different
emerging markets and making relevant comparisons between the findings would be
worthwhile in strengthening the empirical results, to generalise these results for such
markets.
This doctoral thesis, after all, extends the empirical research on dividend policy into an
emerging market, which has not only passed laws for financial liberalisation, but
implemented serious reforms to integrate with world markets by using a large panel
dataset from Turkey. Surely, further empirical work is vital for further knowledge
generation, and scholars are encouraged to carry on future studies in both Turkish
market and other emerging markets. However, it is believed that this thesis can be a
valuable benchmark for further longitudinal and cross-country research on this aspect of
the dividend puzzle.
Birkbeck University of London Page 326
BIBLIOGRAPHY
Abdullah, A. (2007). Empirical Analysis of Corporate Governance and Firm
Performance, PhD Thesis, Accounting and Law Department, Business School,
University of Portsmouth.
Adaoglu, C. (1999). Regulation Influence on the Dividend Policy of the Istanbul Stock
Exchange (ISE) Corporations, The Istanbul Stock Exchange (ISE) Review –
Quarterly Economics and Finance Review 3 (11), pp. 1-19.
Adaoglu, C. (2000). Instability in the Dividend Policy of the Istanbul Stock Exchange
(ISE) Corporations: Evidence from an Emerging Market, Emerging Markets
Review 1 (3), pp. 252-270.
Adaoglu, C. (2008). Dividend Policy of the ISE Industrial Corporations: The Evidence
Revisited (1986-2007), Journal of BRSA Banking and Financial Markets 2 (2),
pp. 113-135.
Agrawal, A. and Jayaraman, N. (1994). The Dividend Policies of All-Equity Firms: A
Direct Test of the Free Cash Flow Theory, Managerial and Decision Economics
15 (2), pp. 139-148.
Aguenaou, S., Farooq, O, and Di, H. (2013). Dividend Policy and Ownership Structure:
Evidence from the Casablanca Stock Exchange, GSTF International Journal on
Business Review (GBR) 2 (4), pp. 116-121.
Aharony, J. and Swary, I. (1980). Quarterly Dividend and Earnings Announcements and
Stockholders’ Returns: An Empirical Analysis, American Finance Association
35 (1), pp. 1-12.
Aivazian, V., Booth, L. and Cleary, S. (2003a). Dividend Policy and the Organisation of
Capital Markets, Journal of Multinational Financial Management 13 (2),
pp.101-121.
Aivazian, V., Booth, L. and Cleary, S. (2003b). Do Emerging Market Firms Follow
Different Dividend Policies from US Firms?, Journal of Financial Research 26
(3), pp. 371-387.
Akhigbe, A. and Madura, J. (1996). Dividend Policy and Corporate Performance,
Jornal of Business Finance and Accounting 23 (9-10), pp. 1267-1287.
Aksu, M, and Kosedag, A. (2006). Transparency and Disclosure Scores and their
Determinants in the Istanbul Stock Exchange, Corporate Governance 14 (4), pp.
277-296.
Al-Ajmi, J. and Abo Hussain, H. (2011). Corporate Dividends Decisions: Evidence
from Saudi Arabia, Journal of Risk Finance 12 (1), pp. 41-56.
Allen, F. and Michaely, R. (1995). Dividend Policy, in Jarrow, R. A., Maksimovic, V.
and Ziemba, W. T. (Eds.), Finance, Handbooks in Operations Research and
Management Science 9, pp. 793-839, Amsterdam, Elsevier.
Al-Malkawi, H-A. N., Bhatti, M. I. and Magableh, S. I. (2014). On the Dividend
Smoothing, Signalling and the Global Financial Crisis, Economic Modelling 2,
pp. 159-165.
Al-Najjar, B. (2008). Modelling Capital Structure, Dividend Policy, and Corporate
Governance: Evidence from Jordanian Data, PhD Thesis, Bristol Business
School, University of the West of England, Bristol.
Birkbeck University of London Page 327
Al-Najjar, B. (2009). Dividend Behaviour and Smoothing: New Evidence from
Jordanian Panel Data, Studies in Economics and Finance 26 (3), pp. 182-197.
Alli, K. L., Khan, A. Q. and Ramirez, G. G. (1993). Determinants of Corporate
Dividend Policy: A Factorial Analysis, Financial Review 28 (4), pp.523-547.
Anderson, R. C. and Reeb, D. (2003). Founding-Family Ownership and Firm
Performance: Evidence from the S&P 500, Journal of Finance 58 (3),
pp.1301-1328.
Ang, J. S., Cole, R. A. and Lin, J. W. (2000). Agency Costs and Ownership Structure,
Journal of Finance 55 (1), pp. 81-106.
Antonios, A., Guney, Y. and Paudyal, K. (2006). The Determinants of Debt Maturity
Structure: Evidence from France, Germany and the UK, European Financial
Management 12 (2), pp. 161-194.
Ararat, M., Orbay, H. and Yurtoglu, B. B. (2011). The Effects of Board Independence
in Controlled Firms: Evidence from Turkey, paper presented at the 3rd
International Conference on Corporate Governance in Emerging Markets (28-
29 May 2011, Seoul - Korea), Korea University Business School.
Ararat, M. and Ugur, M. (2003). Corporate Governance in Turkey: An Overview and
Some Policy Recommendations, Corporate Governance 3, pp. 58-75.
Arellano, M. and Bond, S. (1991). Some Tests of Specification for Panel Data:
Monte Carlo Evidence and an Application to Employment Equations, Review of
Economic Studies 58 (2), pp. 277-297.
Aytac, Z. (1998). Dividend Distribution by Publicly Owned Joint Stock Corporations,
15th
Anniversary Symposium on the Capital Markets Law (in Turkish), CMB
Publication no: 119, May 1998, pp. 35-94.
Baker, H. K., Dutta, S. and Saadi, S. (2008). Impact of Financial and Multinational
Operations on Manager Perceptions on Dividends, Global Finance Journal
19 (2), pp. 171-186.
Baker, H. K., Farrelly, G. E. and Edelman, R. B. (1985). A Survey of Management
Views on Dividend Policy, Financial Management 14, pp. 78-84.
Baker, H. K. and Powell, G. E. (1999). How Corporate Managers View Dividend
Policy, Quarterly Journal of Business and Economics 38 (2), pp.17-35.
Baker, H. K., Powell, G. E. and Veit, E. T. (2002). Revisiting Managerial Perspectives
on Dividend Policy, Journal of Economics and Finance 26 (2), pp. 267-283.
Baker, H. K. and Smith, D. H. (2006). In Search of a Residual Dividend Policy,
Review of Financial Economics 15, pp. 1-18.
Baker, M. and Wurgler, J. (2004a). A Catering Theory of Dividends, Journal of
Finance 59 (3), pp. 1125-1165.
Baker, M. and Wurgler, J. (2004b). Appearing and Disappearing Dividends: The Link
to Catering Incentives, Journal of Financial Economics 73, pp. 271-288.
Baltagi, B. H. (2002). Econometrics, 3rd
edition, Berlin, Springer-Verlag Germany.
Bekaert, G. (1995). Market Integration and Investment Barriers in Emerging Equity
Markets, World Bank Economic Review 9 (1), pp. 75-107.
Birkbeck University of London Page 328
Bekaert, G. and Harvey, C. R. (2002). Research in Emerging Markets Finance: Looking
to the Future, Emerging Markets Review 3, pp. 429-448.
Bell, L. and Jenkinson, T. (2002). New Evidence of the Impact of Dividend Taxation
and on the Identity of the Marginal Investor, Journal of Finance 57 (3), pp.
1321-1346.
Benartzi, S., Michaely, R. and Thaler, R. (1997). Do Changes in Dividends Signal the
Future or the Past?, American Finance Association 52 (3), pp. 1007-1034.
Berispek, C. (2012). The New CMB Communiqué on Corporate Governance, Legal
News Bulletin Turkey 1, pp. 28-30.
Berle, A. and Means, G. (1932). The Modern Corporation and Private Property, New
York, MacMillan Press.
Bhattacharya, S. (1979). Imperfect Information, Dividend Policy, and “The Bird in the
Hand” Fallacy, Bell Journal of Economics 10 (1), pp.259-270.
Birol, O. H. (2011). The Effects of the Global Economic Crisis on Turkey’s Economy
and the Recent Tilt in Her International Relations, International Journal of
Business and Management Studies 3 (2), pp. 227-236.
Bishop, S. R., Harvey, R. C., Robert, W. F. and Garry, J. T. (2000). Corporate Finance,
Sydney, Prentice Hall Inc.
Black, F. (1976). The Dividend Puzzle, Journal of Portfolio Management 2 (2), pp.5-8.
Black, F. and Scholes, M. S. (1974). The Effects of Dividend Yield and Dividend
Policy on Common Stock Prices and Returns, Journal of Financial
Economics 1, pp. 1-22.
Blume, M. E. (1980). Stock Returns and Dividend Yields: Some More Evidence,
Review of Economics and Statistics 62, pp. 567-577.
Blundell, R. and Bond, S. (1998). Initial Conditions and Moment Restrictions in
Dynamic Panel Data Model, Journal of Econometrics 87 (1), pp. 115-143.
Born, J. A. and Rimbey, J. N. (1993). A Test of the Easterbrook Hypothesis Regarding
Dividend Payments and Agency Costs, Journal of Financial Research 16 (3),
pp. 251-260.
Brav, A., Graham, J. R., Harvey, C. R. and Michaely, R. (2005). Payout Policy in the
21st Century, Journal of Financial Economics 77, pp. 483-527.
Brealey, A. and Myers, S. (2003). Principles of Corporate Finance, 7th
edition, New
York, McGraw-Hill.
Brennan, M. (1970). Taxes, Market Valuation and Corporate Financial Policy, National
Tax Journal 23, pp. 417-427.
Breusch, T. and Pagan, A. (1980). The LM Test and Its Applications to Model
Specification in Econometrics, Review of Economic Studies 47, pp. 239-254.
Brittain, J. A. (1964). The Tax Structure and Corporate Dividend Policy, American
Economic Review 54, pp.272-287.
Brittain, J. A. (1966). Corporate Dividend Policy, Washington DC, The Brookings
Institution.
Birkbeck University of London Page 329
BRSA (2010). From Crisis to Financial Stability - Turkey Experience, Working Paper,
3rd
edition, Ankara, 3 September 2010, Banking Regulation and Supervision
Agency, Department of Strategy Development.
Caliskan, N. and Icke, T. (2011). Turkish Corporate Governance Principles and Its
Implications for ISE Corporate Governance Index Companies, Journal of
Accounting and Finance 11 (1), pp. 60-75.
Cameron, A. C. and Trivedi, P. K. (2010). Microeconometrics Using Stata,
Revised edition, Texas, Stata Press.
Caixe, D. F. and Krauter, E. (2013). The Influence of Ownership and Control Structure
on Corporate Market Value in Brazil, Revista Contabilidade & Financas