Page 1
COOLING THE STEAM POWER PLANT CONDENSER USING A VAPOR COMPRESSION
REFRIGERATION SYSTEM
By
Yahya Ali Rothan
A DISSERTATION
Submitted to
Michigan State University
in partial fulfillment of the requirements
for the degree of
Mechanical Engineering- Doctor of Philosophy
2017
Page 2
ABSTRACT
COOLING THE STEAM POWER PLANT CONDENSER USING A VAPOR COMPRESSION
REFRIGERATION SYSTEM
By
Yahya Ali Rothan
Steam power plants represent the largest segment of the world’s electricity production.
With developing and foreseeable shortages of adequate water sources in the arid regions and
increasing regulatory restrictions, alternate technologies are being sought for heat rejection. The
U.S. Environmental Protection Agency has recently proposed that power plants that consume more
than 7.6 x 10⁶ L/day of water for cooling (equivalent plant capacity >250 MW) must consider
alternate technologies to determine the best available technology for rejecting the waste heat. A
steam condenser is an essential part of a steam power plant. Steam condensation occurs in a steam
condenser using either wet cooling, dry cooling, or a combination of both. The use of wet cooling
therefore results in a detrimental impact on the environment.
In the current proposed work an alternate method other than water or air, for cooling the
steam power plant’s condenser will be investigated theoretically, numerically, and experimentally.
The proposed method is a condenser-configuration using refrigerant in a closed-loop-cycle. The
refrigeration will be a vapor compression cycle. The vapor compression refrigeration cycle system
is a highly well-established technology forming the basis of many important industrial and
agricultural and household applications.
The main goal of this proposed work is to test the feasibility and verify the proposed idea
of using vapor compression refrigeration cycle as a condenser coolant, thereby replacing the
environmentally polluting conventional water cooling and the low efficiency and costly air cooling
methods. The current proposed project will also be able to compare the use of different refrigerants
Page 3
on the basis of performance, cost, and environmental impact with the conventional water and air
cooling systems.
Page 4
iv
ACKNOWLEDGMENTS
First and foremost, I must acknowledge and give thanks to God Almighty who gives
me the health and strength to overcome all difficulties sustained during this process.
I would like to express my sincerest gratitude to my mentor and dissertation committee
chair Dr. Abraham Engeda. You are a great educator in every sense of the word. You have
influenced and modeled me into the person I am today. Thank you for the encouragement, patience,
enormous feedback, attention to details, and gentle guidance. Thank you professor for who you
are.
I am highly indebted to Dr. Khaled Yousif for his guidance and support in the analysis part
of this dissertation and for running the experiments. Special thanks to my dissertation committee
members, Dr. Norbert Muller, Dr. Wei Liao, and Dr. Andre Benard for not giving up on me when
the times were tough. I want to thank you for the extraordinary support and the way you helped to
build and maintain confidence in my ability to complete this research. I am grateful to all faculty
and staff of the Department of Mechanical Engineering for their remarkable concern superb
interaction. I would like to extend my thanks to Dr. Ahmed Hejazi HIS valuable advice.
Finally, I wish to thank my family. My appreciation extend to my parents, brothers and
sisters for their engorgement and support, not only because they support me through my education
life, as well as during my study, but also they provide me good living and working conditions.
Page 5
v
TABLE OF CONTENTS
LIST OF TABLES………………………………………………………………………… viii
LIST OF FIGURES………………………………………………………………………... x
KEY TO SYMBOLS AND ABBREVIATIONS…………………………………………. xvi
1 Introduction to the Steam Power Plant……………………………………………….. 1
1.1 The Rankine Cycle and the Steam Power Plant……………………………………… 1
1.1.1 Efficiency of the Steam Power Plant…………………………………………... 5
1.2 Refrigeration and Heat Pump………………………………………………………… 7
1.3 The Reversed Carnot Cycle…………………………………………………………... 8
1.3.1 The Energy Analysis of Carnot Cycle…………………………………………. 9
1.4 The Ideal Vapor Compression Refrigeration Cycle………………………………….. 9
1.5 The Actual Vapor Compression Refrigeration Cycle………………………………… 10
1.6 Cascade Refrigeration System……………………………………………………….. 11
1.7 Multistage Compression Refrigeration System………………………………………. 11
1.8 Multipurpose Refrigeration System with a Single Compressor……………………… 12
2 The Objective of this Present Work and Literature Review…………………………. 13
2.1 Problem Definition………………………………………………………………….. 13
2.2 Studies on Steam Power Plant Condenser…………………………………………... 15
2.2.1 Studies on the Wet Cooling of a Steam Power Plant Condenser…………….. 16
2.2.2 Studies on Dry/Air Cooling of a Steam Power Plant Condenser…………….. 18
2.3 Studies on Factors Affecting the Performance of Dry/Air Cooled Condenser……… 19
2.4 Studies on Vapor Compression Refrigeration Systems…………………………….. 23
2.4.1 Studies on Exergy Analysis of Vapor Compression Refrigeration Systems…. 23
2.4.2 Studies on Refrigerant Heat Transfer………………………………………… 24
3 The Condenser in the Steam Power Plant…………………………………………….. 27
3.1 Introduction………………………………………………………………………….. 27
3.2 Surface Contact Condensers………………………………………………………… 27
3.2.1 Water Cooled Condenser……………………………………………………… 27
3.2.1.1 Shell- and-Tube Condenser: Horizontal Type………………………... 28
3.2.1.2 Shell- and-Tube Condenser: Vertical Type………………………….... 29
3.3 Theoretical Basis to Guide Experiment…………..…………………………………. 29
3.4 Heat Transfer Analysis for Power Plant Condensers………………………………….. 30
3.4.1The Governing Equations for the Heat Transfer Analysis……………………… 32
3.4.1.1 Heat Transfer inside the Condenser…………………………………… 32
3.4.1.2 Overall Heat Transfer Coefficient…………………………………….. 35
3.4.1.3 Coolant Film Thermal Resistance…………………………………….. 37
3.4.1.4 Tube Wall Thermal Resistance……………………………….……….. 38
Page 6
vi
3.4.1.5 Condensate Film Thermal Resistance…………………….…………… 38
3.4.1.6 Non-Condensable Gases Thermal Resistance………………………… 42
3.4.2 Relations for the Heat Transfer and Energy Analysis…………………………….. 47
3.5 Exergy Analysis of Steam Power Plant Condensers…………………………………… 48
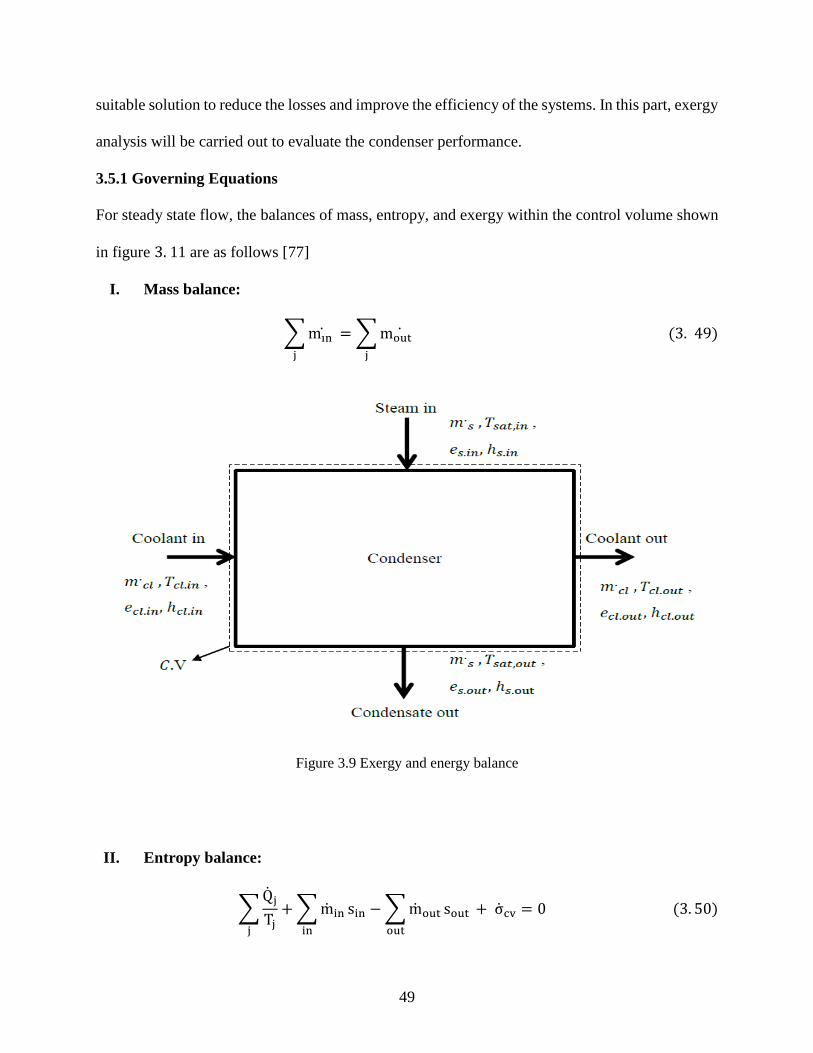
3.5.1 Governing Equations…………………………………………………………….. 49
3.5.2 Energetic and Exergy Efficiency for the Power Plant Condenser……………….. 51
4 Experimental Studies to Verify the Concept of a Refrigerant Cooled Condenser…... 53
4.1 Introduction…………………………………………………………………………… 53
4.2 Experimental System Description…………………………………………………….. 59
4.2.1 Steam Loop……………………………………………………………………… 62
4.2.1.1 Steam Generator………………………………………………………… 62
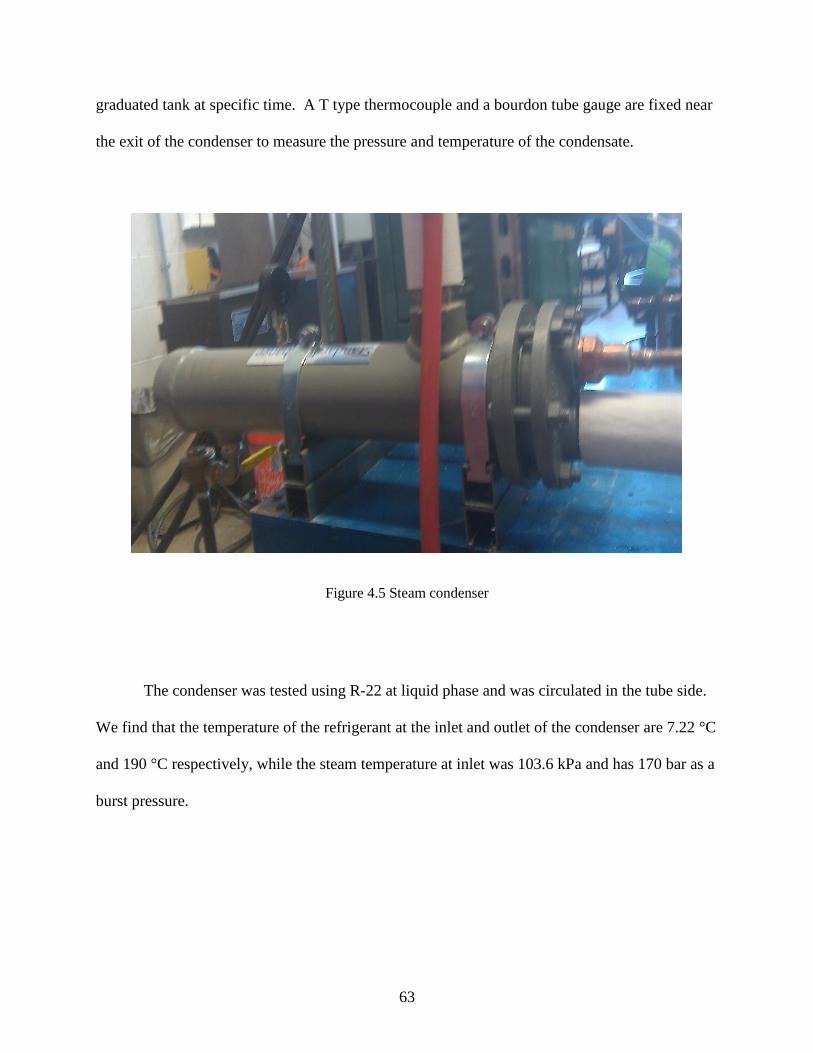
4.2.1.2 Steam Condenser………………………………………………………... 62
4.2.2 Water Loop……………………………………………………………………… 64
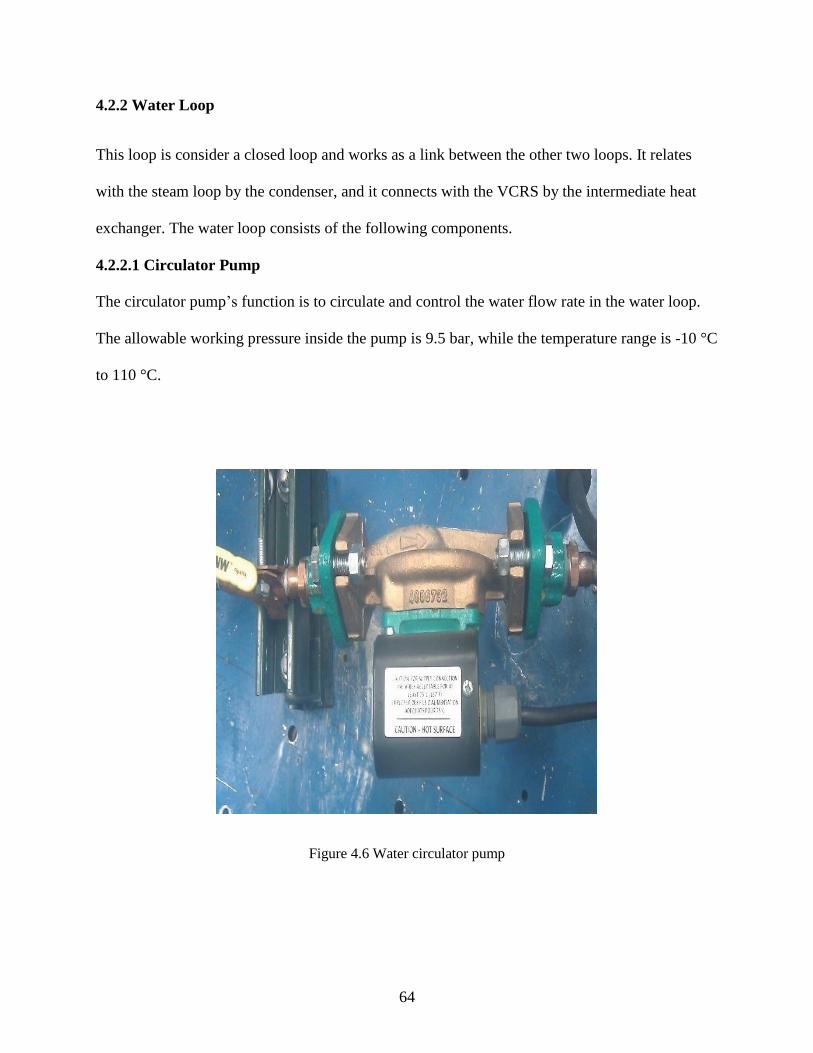
4.2.2.1 Circulator Pump………………………………………………………… 64
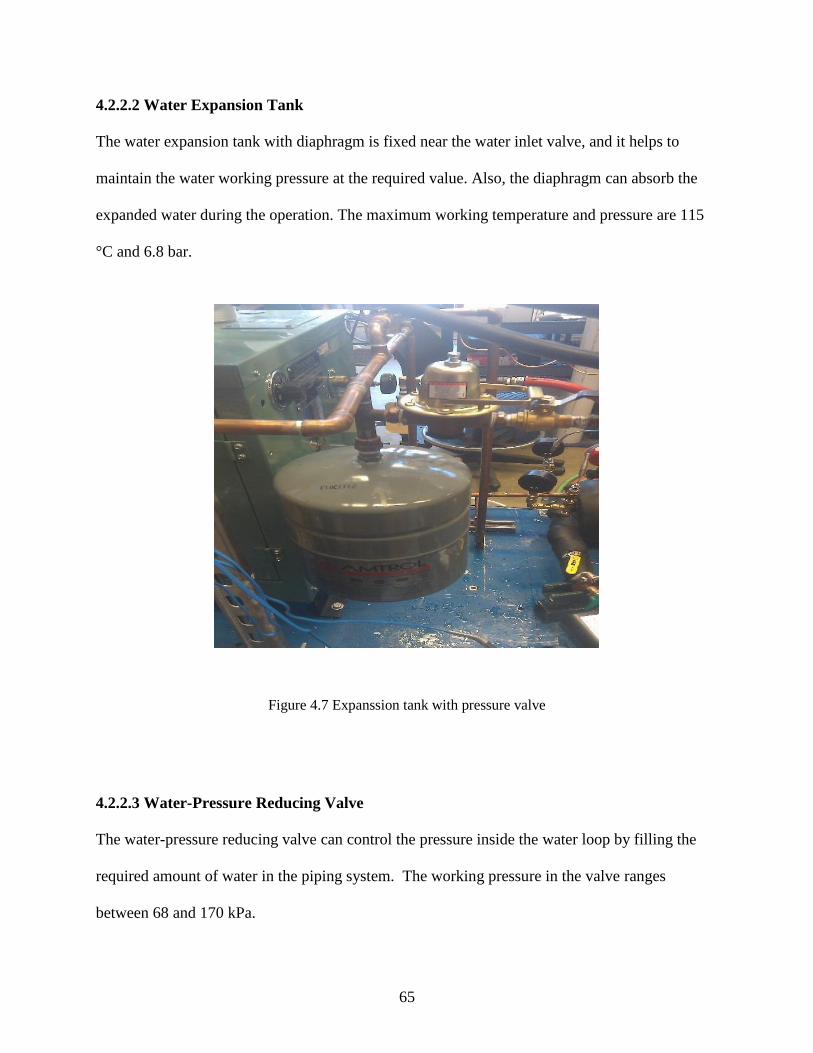
4.2.2.2 Water Expansion Tank………………………………………………….. 65
4.2.2.3 Water-Pressure Reducing Valve………………………………………… 65
4.2.2.4 Water-Pressure Relief Valve……………………………………………. 66
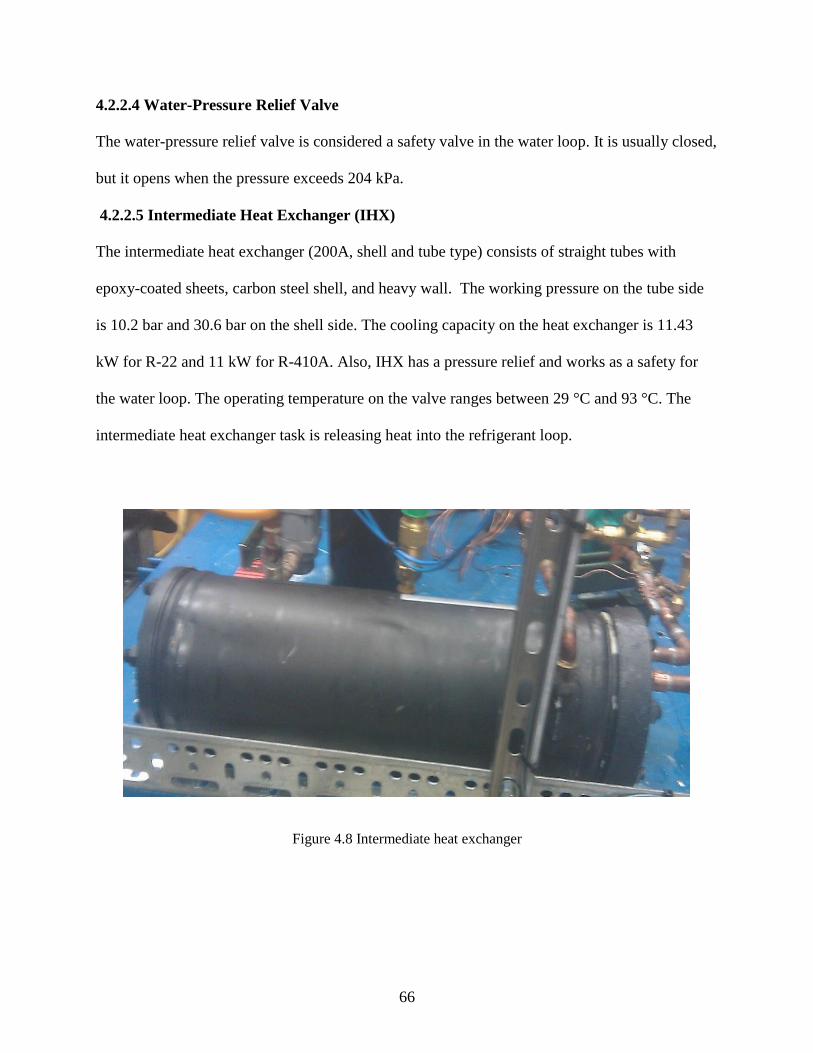
4.2.2.5 Intermediate Heat Exchanger (IHX)…………………………………….. 66
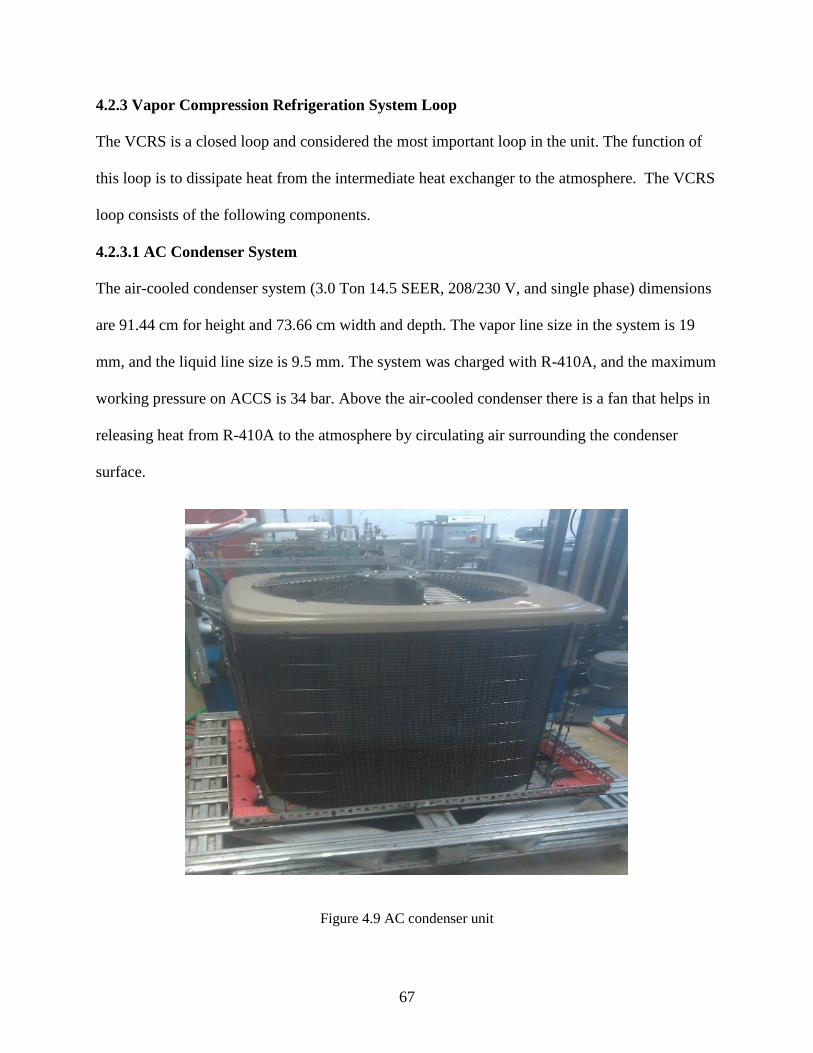
4.2.3 Vapor Compression Refrigeration System Loop………………………………… 67
4.2.3.1 AC Condenser System………………………………………………….. 67
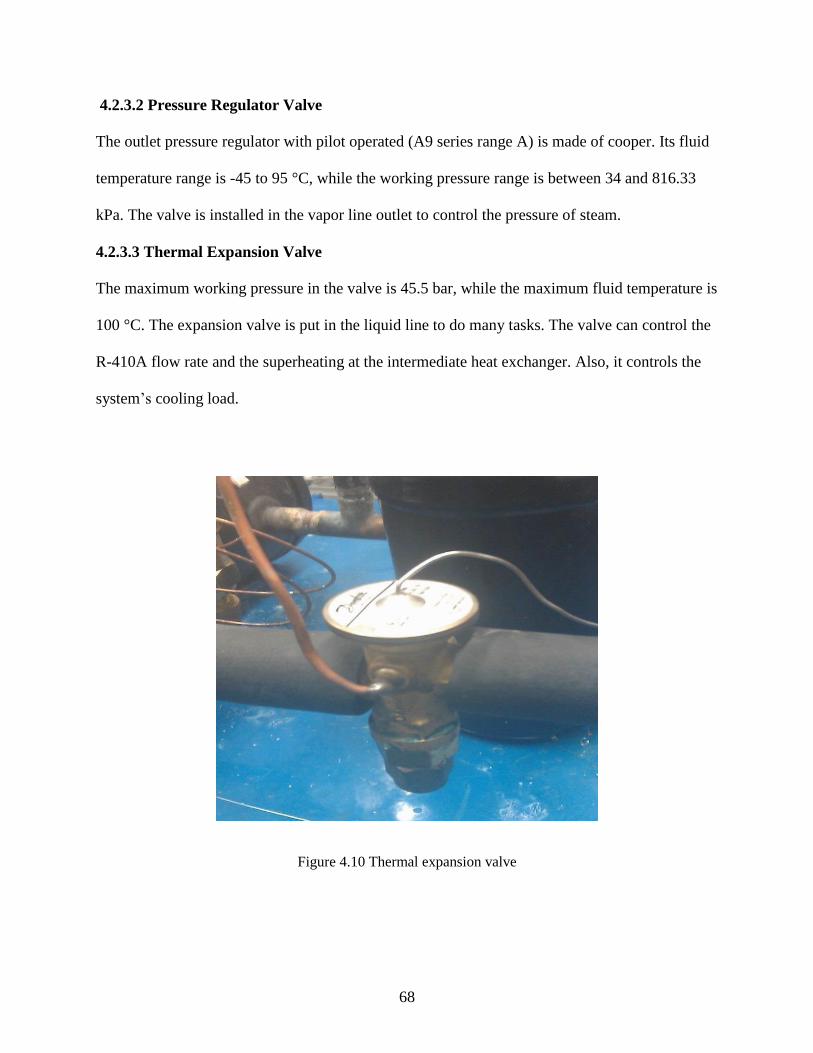
4.2.3.2 Pressure Regulator Valve……………………………………………….. 68
4.2.3.3 Thermal Expansion Valve………………………………………………. 68
4.2.3.4 Suction Line Accumulator………………………………………………. 69
4.2.3.5 Vapor and Liquid Lines Filter Drier…………………………………….. 69
4.2.4 Electrical Switches and Control………………………………………………… 70
4.2.4.1 The High R-410A Pressure Switch……………………………………... 71
4.2.4.2 The Low R-410A Pressure Switch……………………………………… 72
4.2.4.3 The High Water Pressure Switch……………………………………….. 72
4.2.4.4 The Low Water Temperature Switch…………………………………… 72
4.2.5 Measurement Devices…………………………………………………………… 72
4.2.5.1 Thermocouple………………………………………………………….. 72
4.2.5.2 Bourdon Tube Gauge……………………………………………………. 72
4.2.5.3 Rotameter……………………………………………………………….. 73
4.3 System Operational Challenges………………………………………………………… 73
5 Performance Evaluating of Steam Power Plant Condenser Cooled by a Vapor
Compression Refrigeration System Using Aspen-HYSYS……………………………….. 75
5.1 Introduction……………………………………………………………………………. 75
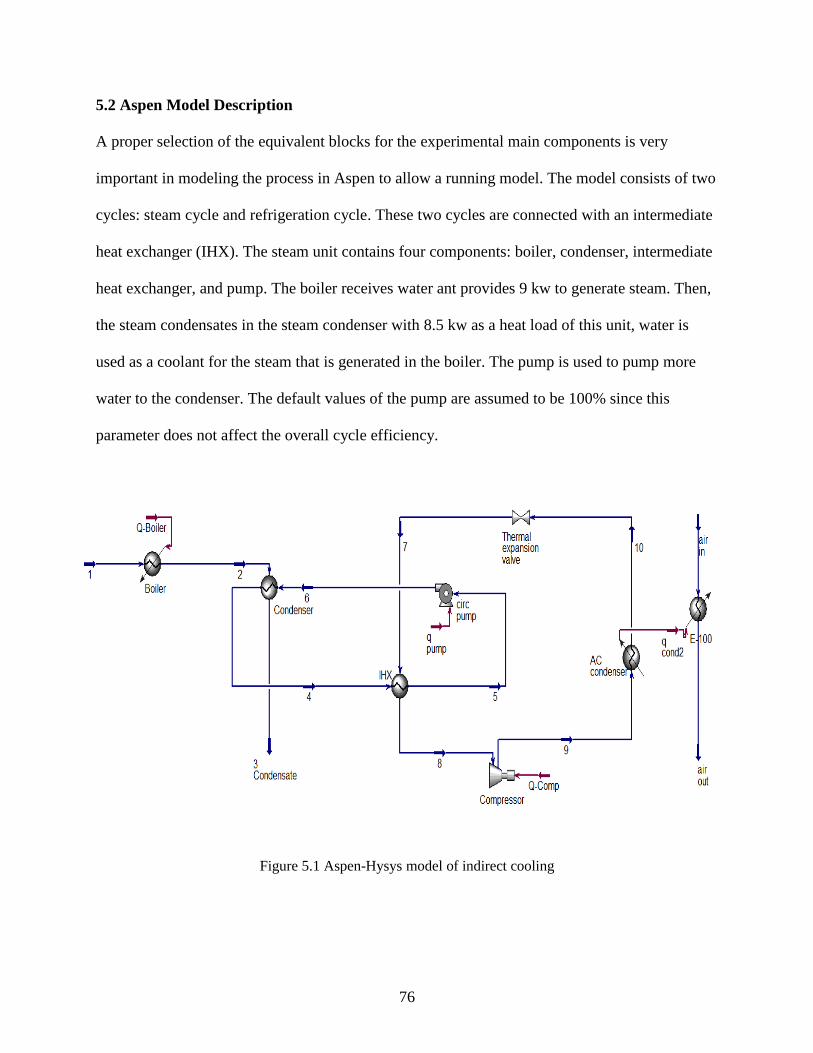
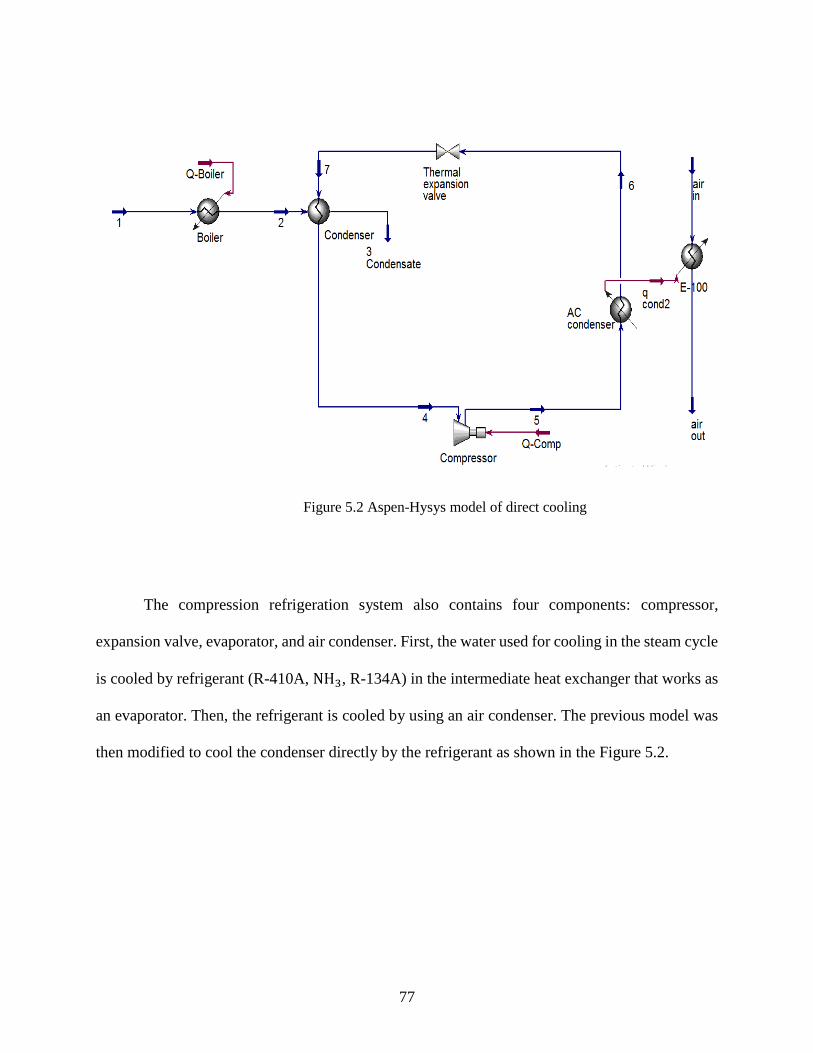
5.2 Aspen Model Description……………………………………………………………… 76
5.3 Result and Discussion………………………………………………………………….. 78
6 Theoretical Study of Using a Vapor Compression Refrigeration System for Cooling the
Condenser of a Steam Power Plant………………………………………………………. 113
6.1 Introduction………………………………………………………………………….. 113
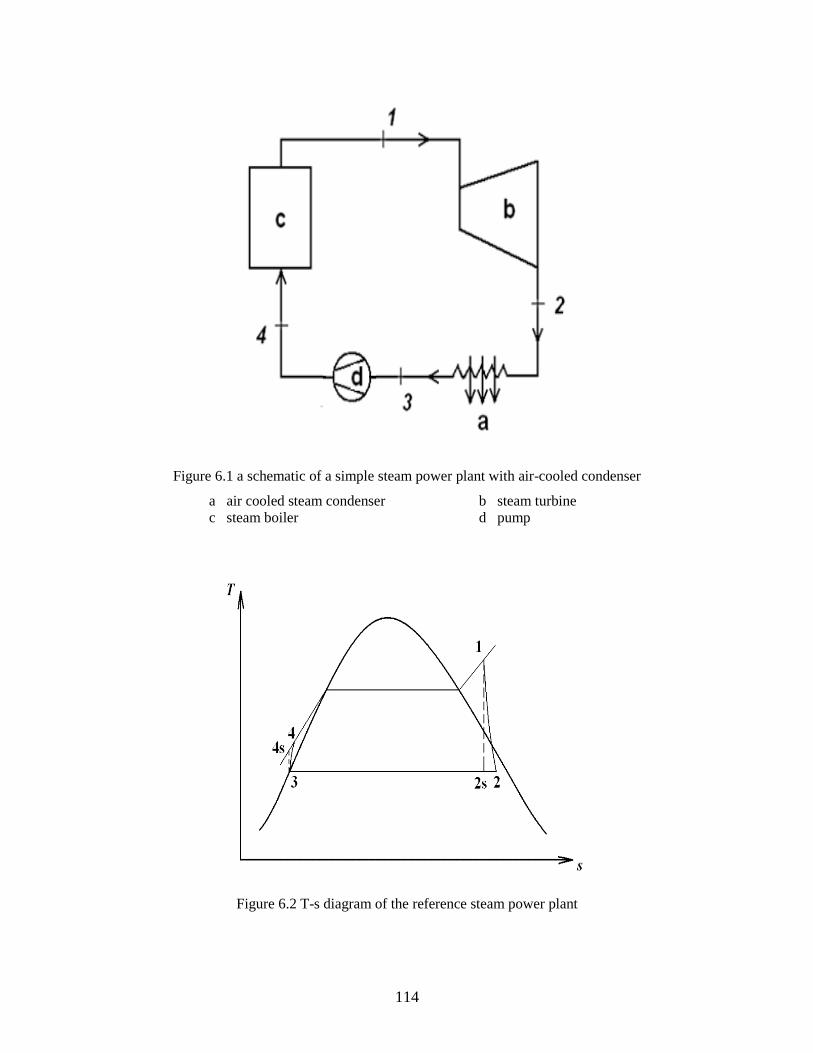
6.2 The Steam Power Plant System (Reference System)………………………………… 113
Page 7
vii
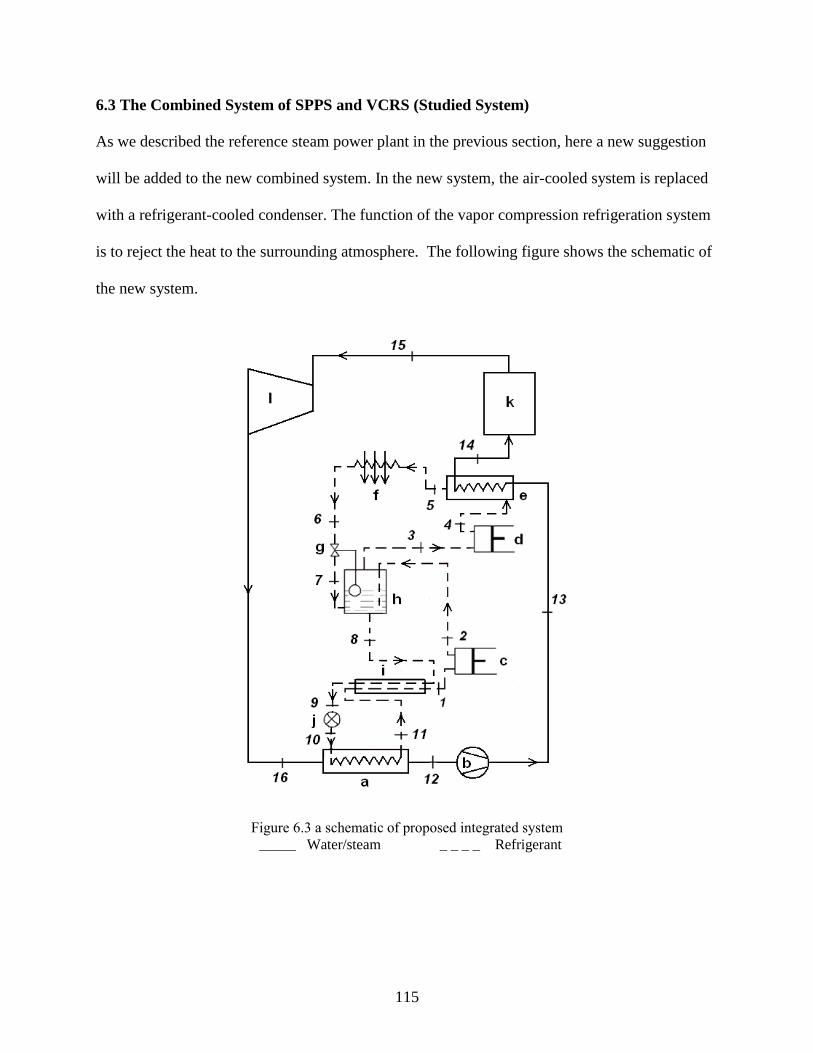
6.3 The Combined System of SPPS and VCRS (Studied System)……………………... 115
6.4 Energy Analysis of the Reference System and the Studied System………………… 118
6.5 Results and Discussion………………………………………………………………. 120
7 Conclusions and Recommendations for Future Work………………………………… 127
7.1 Conclusions…………………………………………………………………………… 127
7.2 Recommendations for Future Work………………………………………………….. 128
APPENDICES……………………………………………………………………………… 129
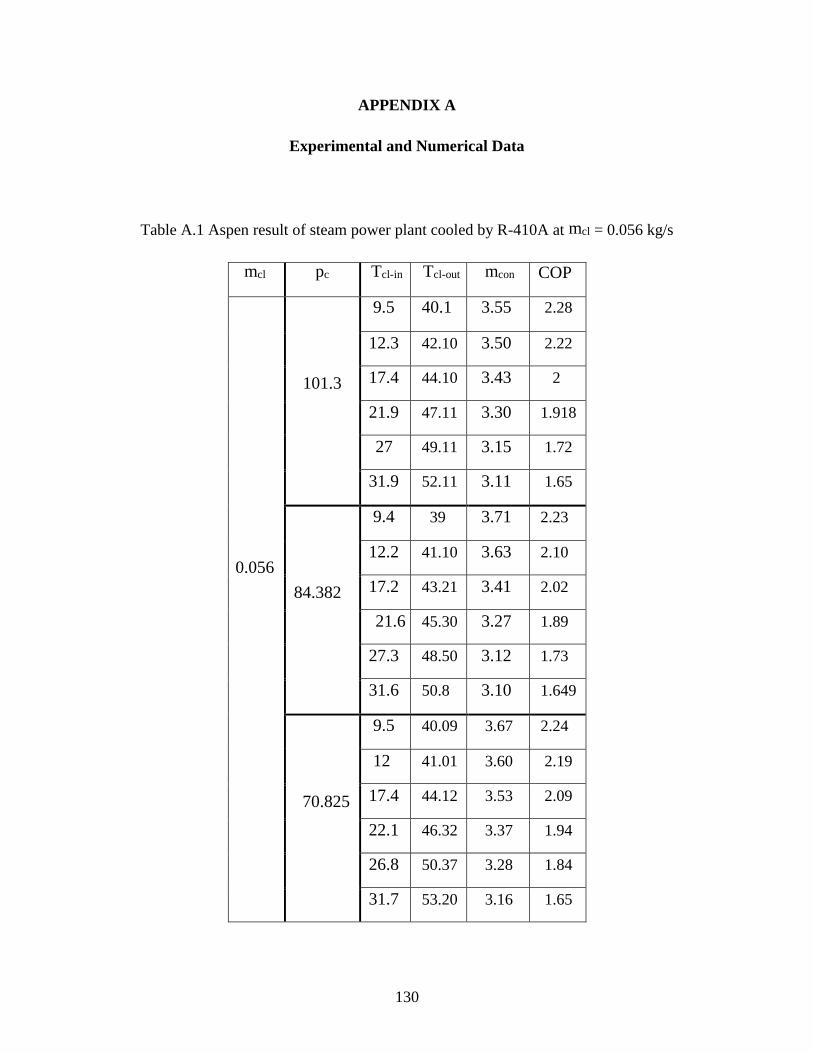
APPENDIX A: Experimental and Numerical Data………………………………………. 130
APPENDIX B: Theoretical Study Data………………………………………………….. 145
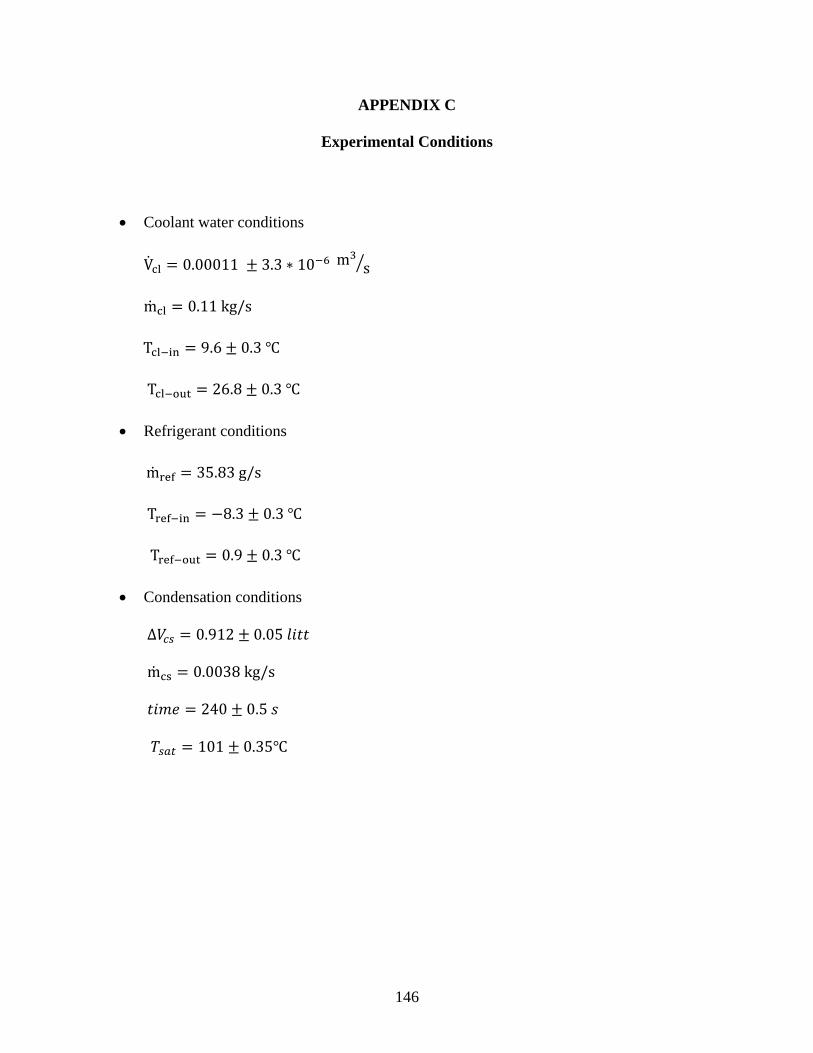
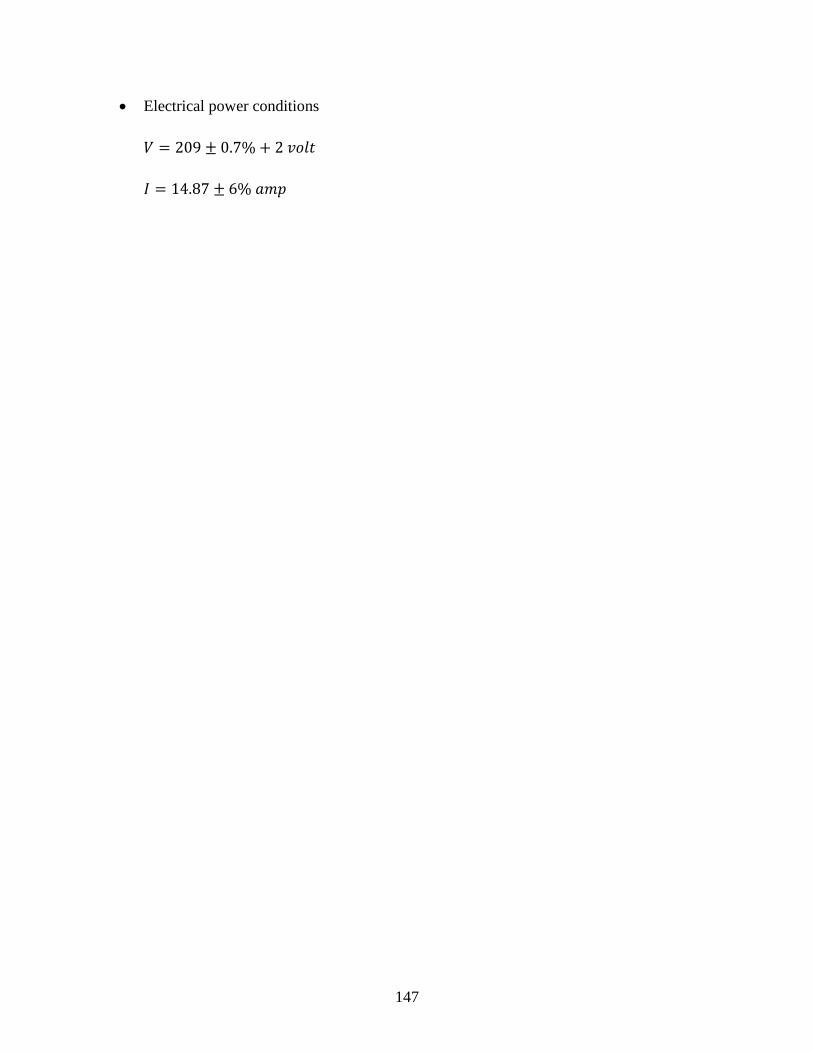
APPENDIX C: Experimental Conditions………………………………………………… 146
APPENDIX D: Thermo-physical Properties……………………………………………… 148
REFERENCES……………………………………………………………………………… 149
Page 8
viii
LIST OF TABLES
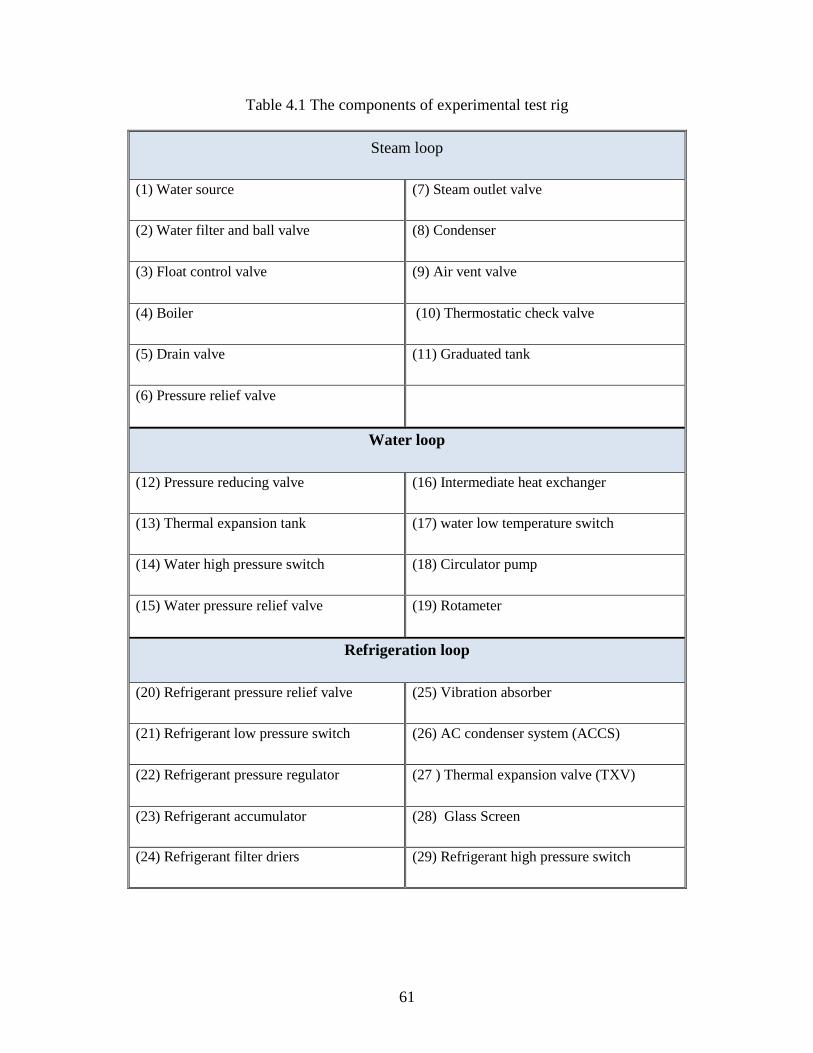
Table 4.1 The components of experimental test rig………………………………………….. 61
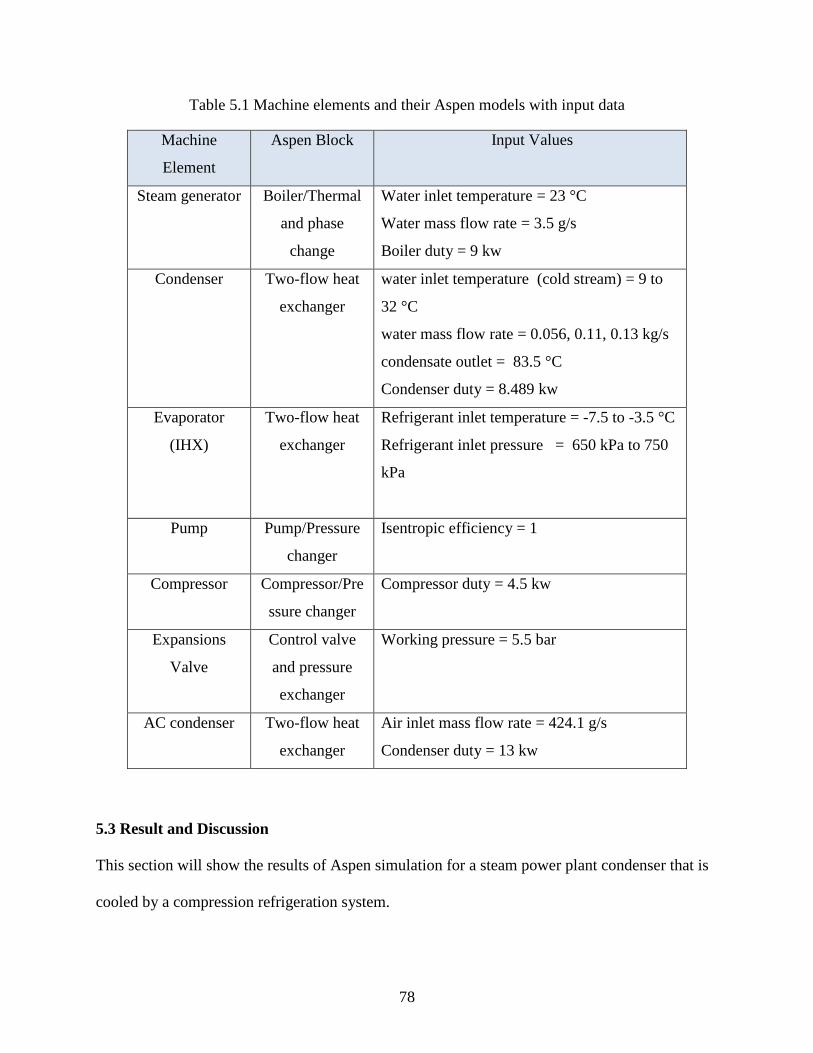
Table 5.1 Machine elements and their Aspen models with input data………………………… 78
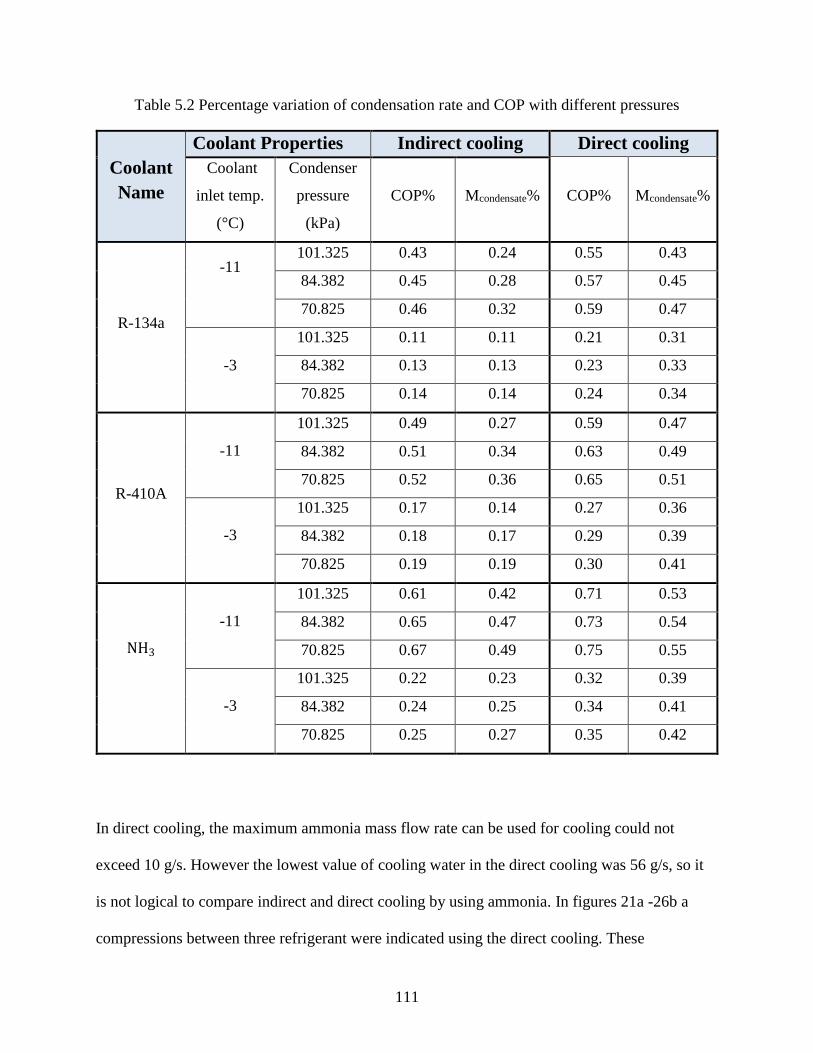
Table 5.2 Percentage variation of condensation rate and COP with different pressures…….. 111
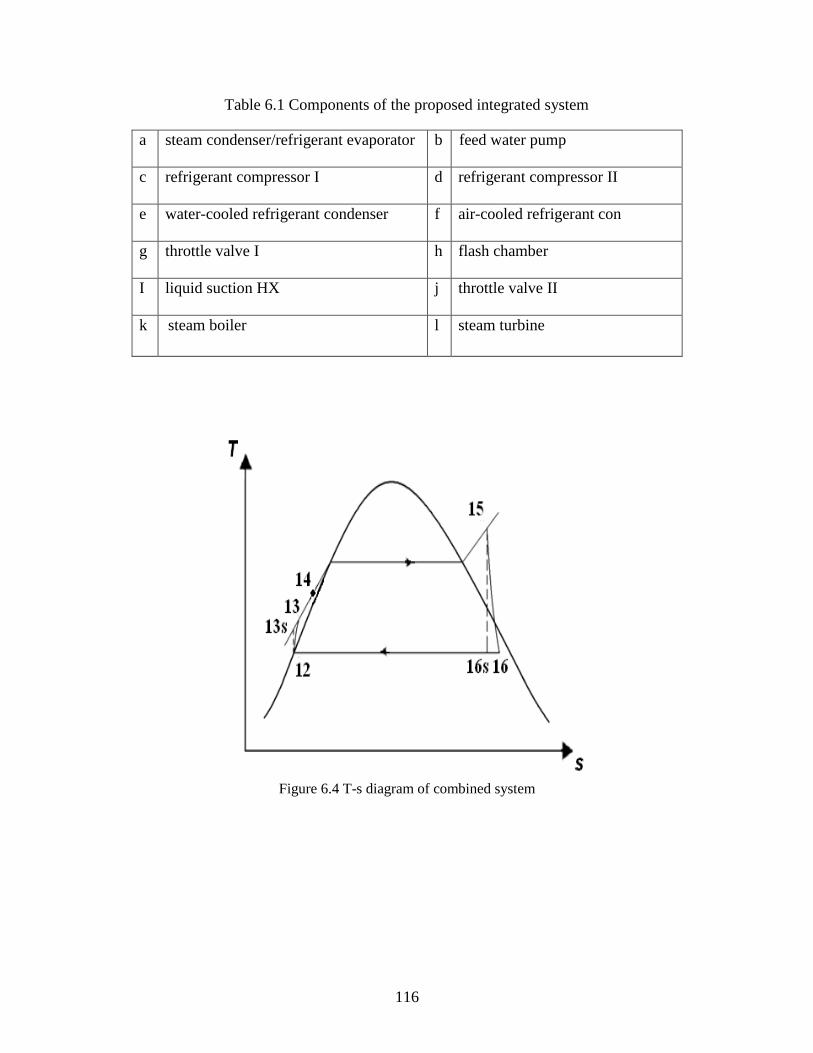
Table 6.1 Components of the proposed integrated system……………………………………. 116
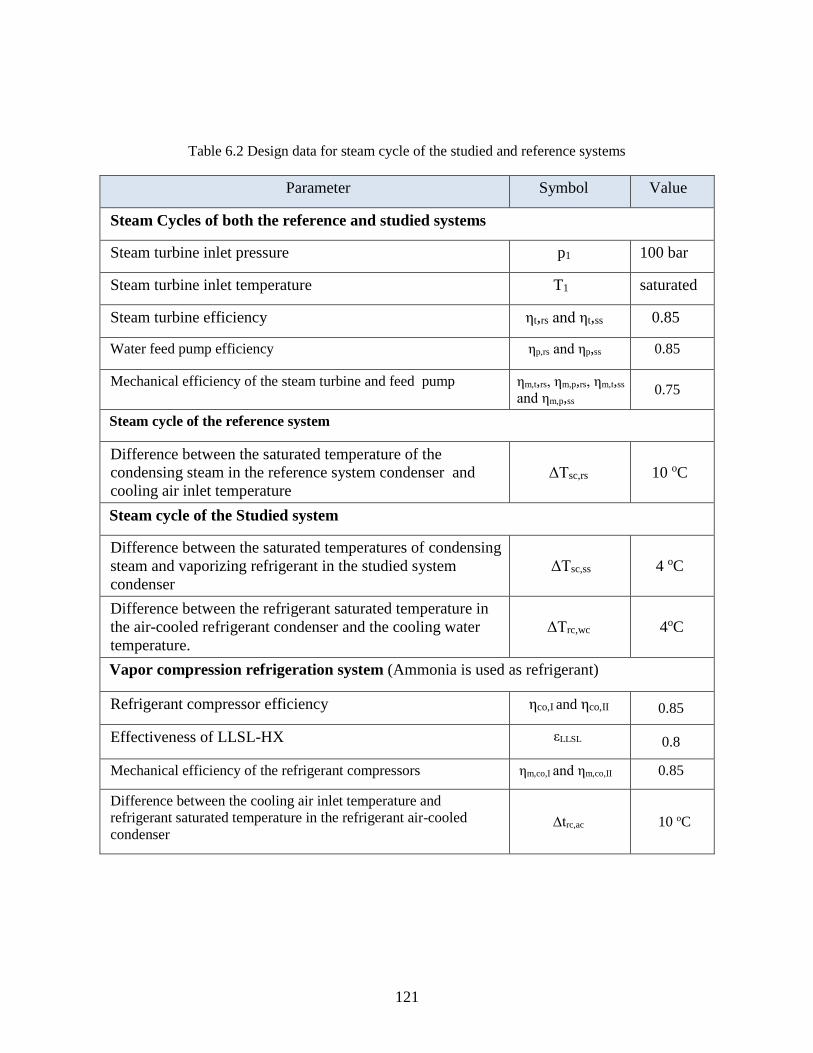
Table 6.2 Design data for steam cycle of the studied and reference systems………………… 121
Table A.1 Aspen result of steam power plant cooled by R-410A at mcl = 0.056 kg/s……….. 130
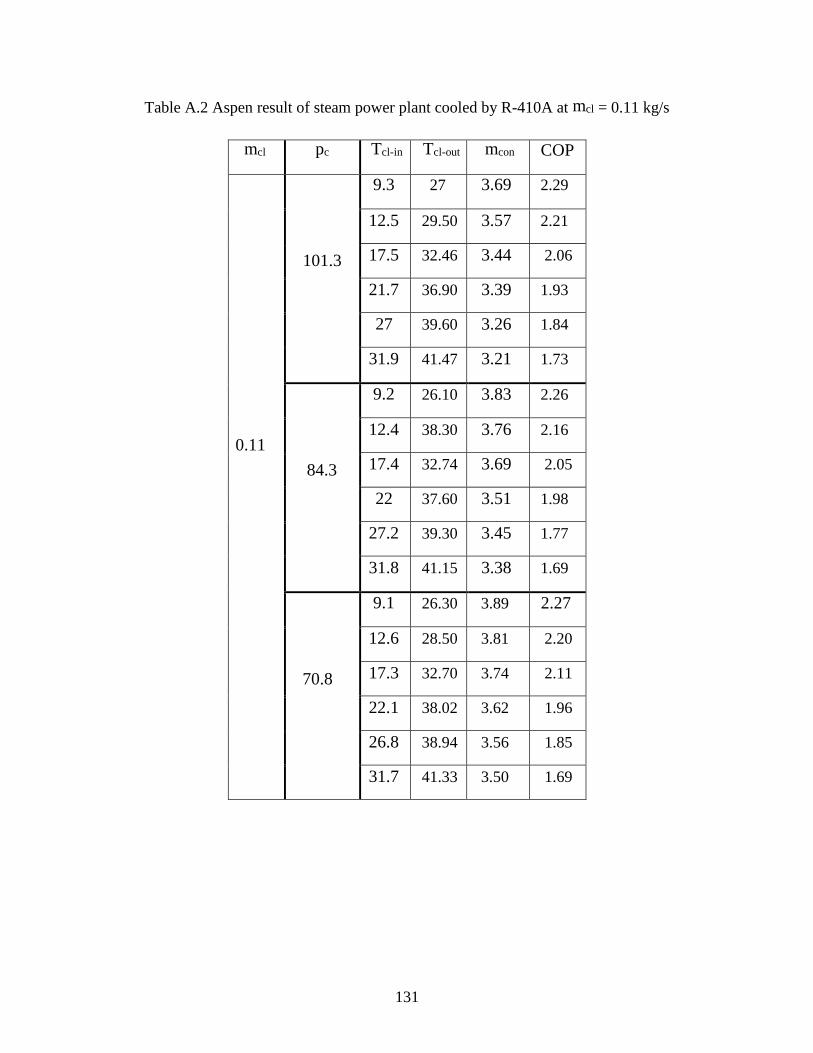
Table A.2 Aspen result of steam power plant cooled by R-410A at mcl = 0.11 kg/s………… 131
Table A.3 Aspen result of steam power plant cooled by R-410A at mcl = 0.131 kg/s……….. 132
Table A.4 Aspen result of steam power plant cooled by R-134a at mcl = 0.056 kg/s………... 133
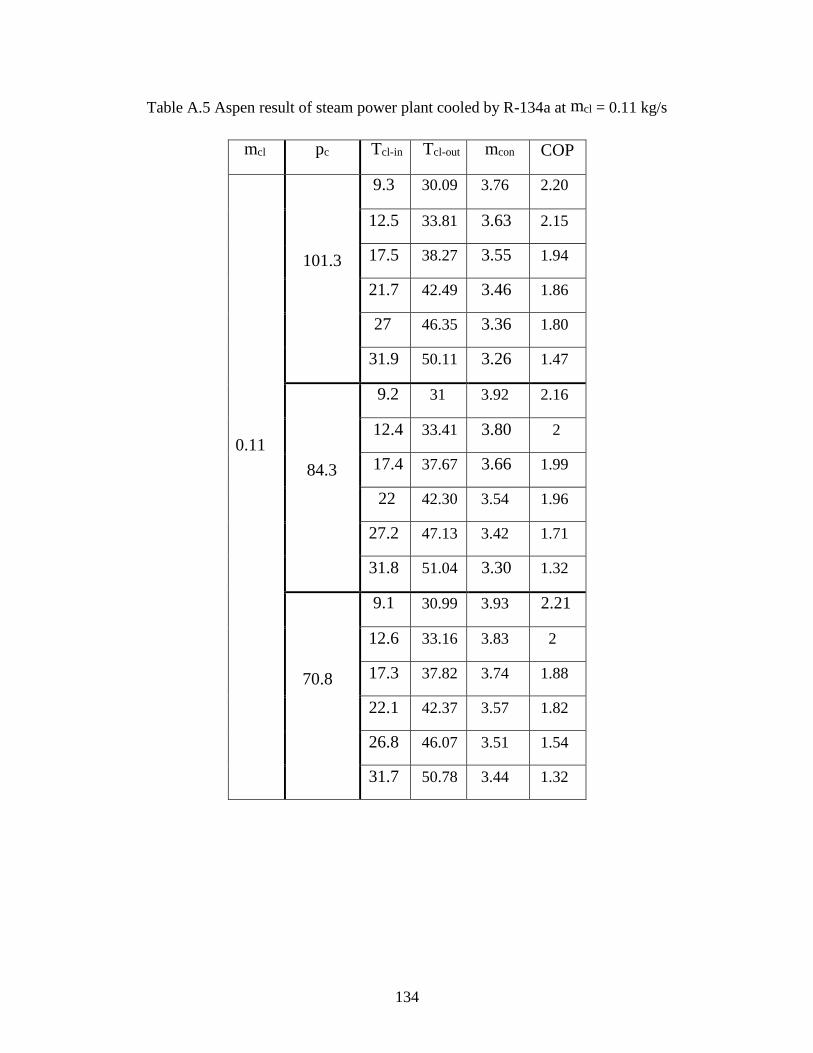
Table A.5 Aspen result of steam power plant cooled by R-134a at mcl = 0.11 kg/s…………. 134
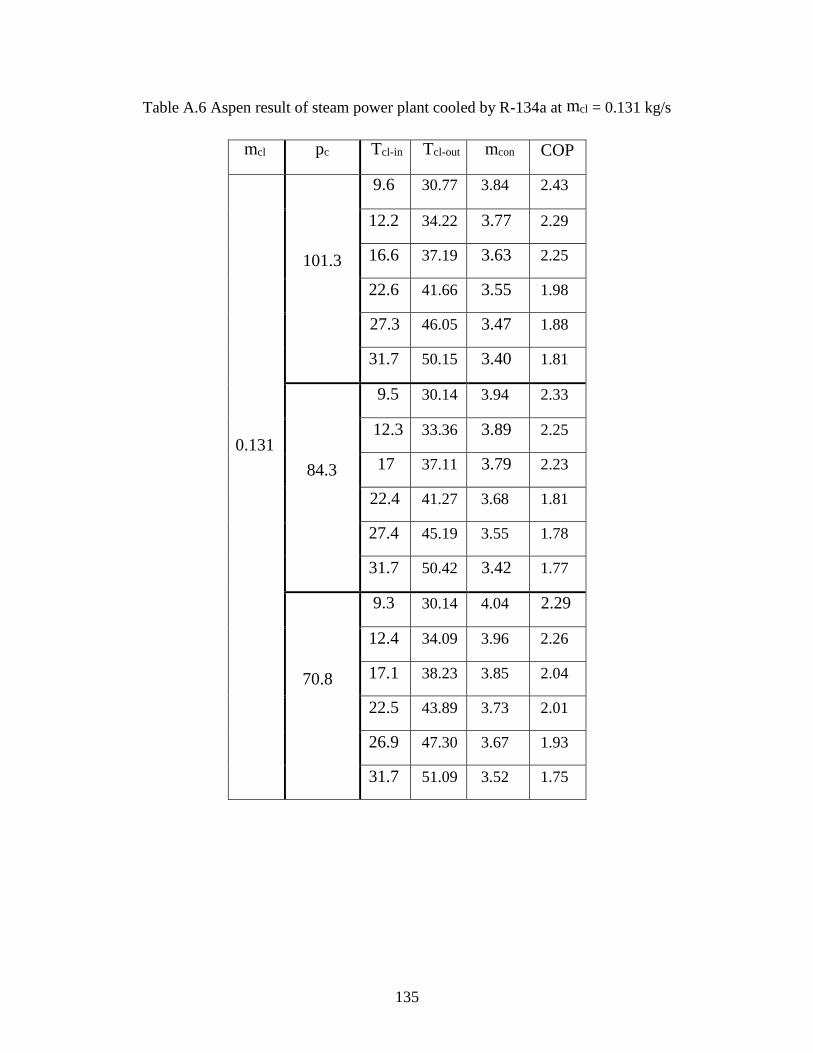
Table A.6 Aspen result of steam power plant cooled by R-134a at mcl = 0.131 kg/s ……….. 135
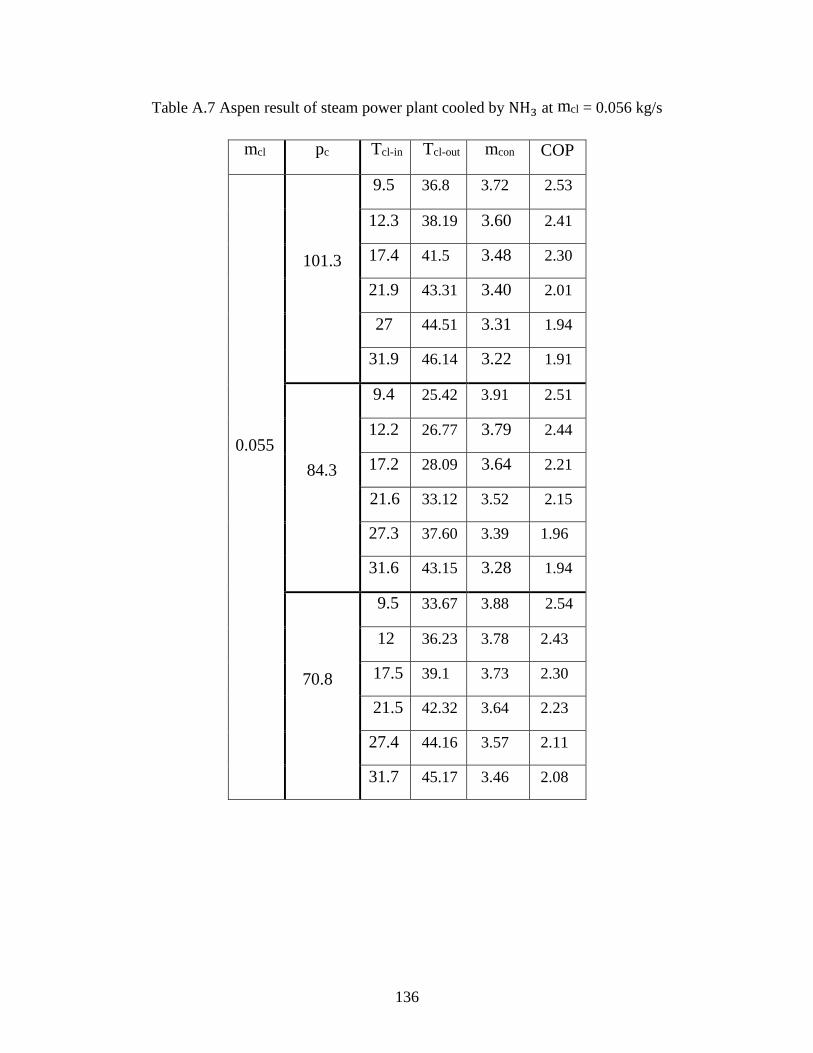
Table A.7 Aspen result of steam power plant cooled by NH3 at mcl = 0.056 kg/s…………… 136
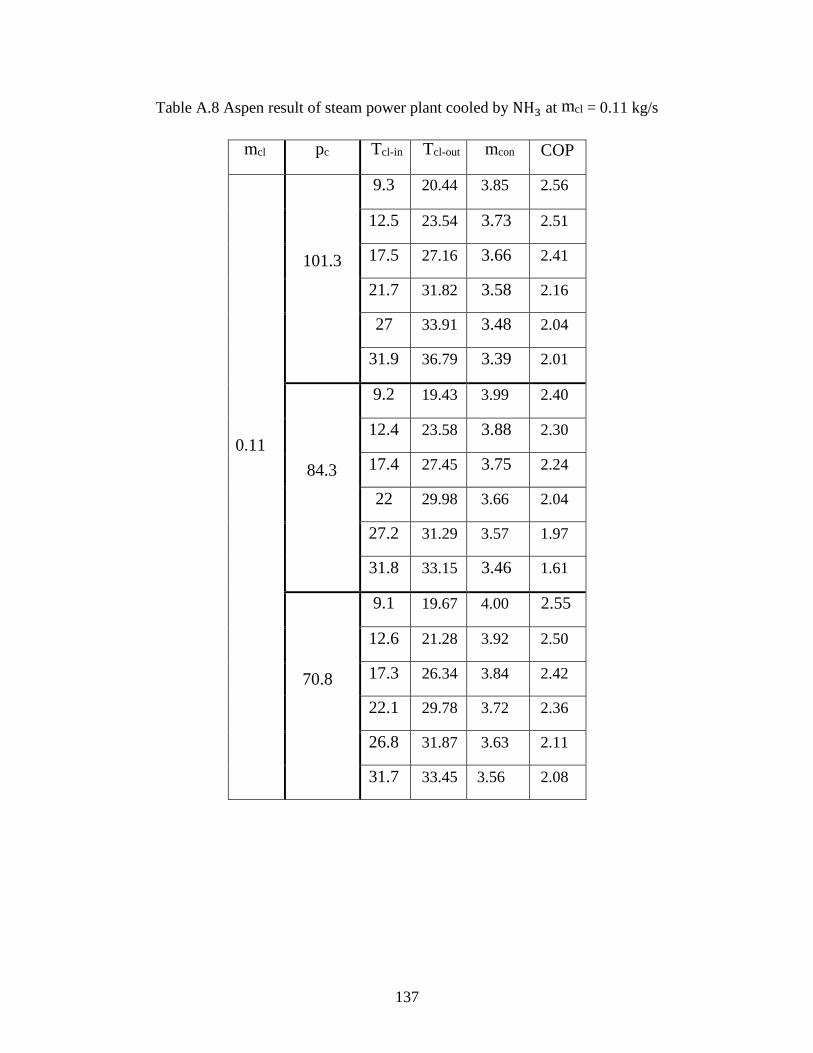
Table A.8 Aspen result of steam power plant cooled by NH3 at mcl = 0.11 kg/s……………. 137
Table A.9 Aspen result of steam power plant cooled by NH3 at mcl = 0.131 kg/s………….. 138
Table A.10 Aspen result of steam power plant cooled by R-407C at mcl = 0.056 kg/s……... 139
Table A.11 Aspen result of steam power plant cooled by R-407C at mcl = 0.11 kg/s………. 140
Table A.12 Aspen result of steam power plant cooled by R-407C at mcl = 0.13 kg/s………. 141
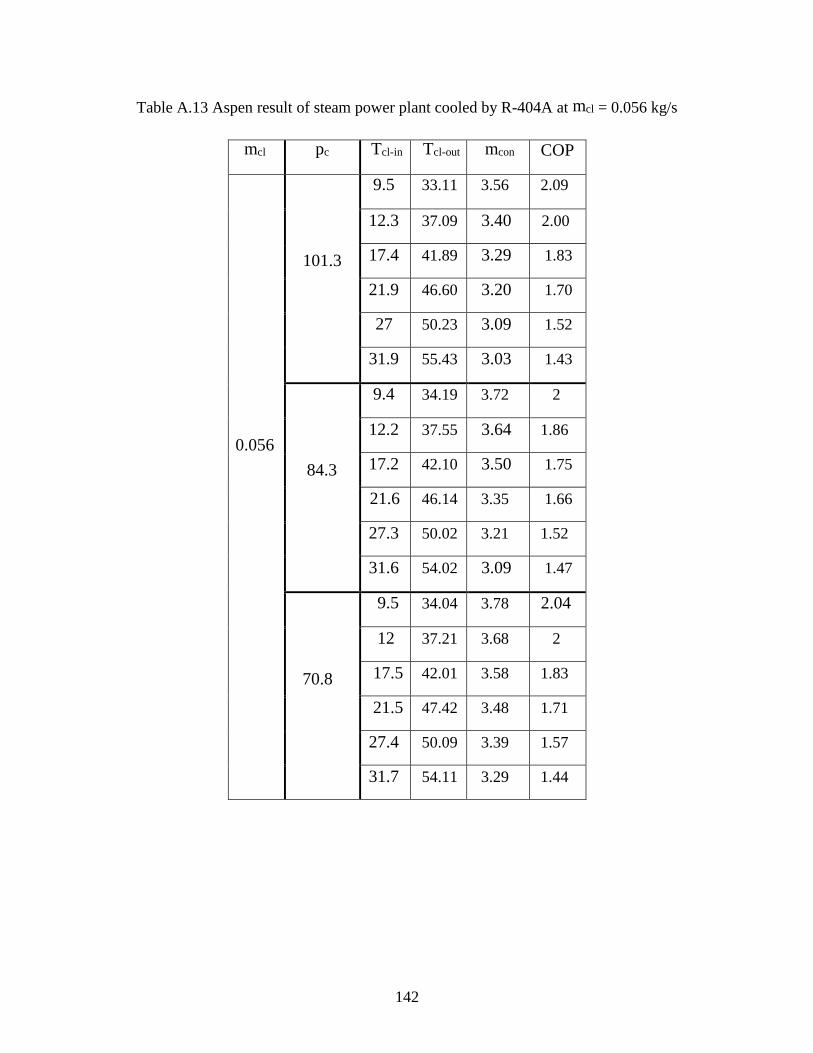
Table A.13 Aspen result of steam power plant cooled by R-404A at mcl = 0.056 kg/s…….. 142
Table A.14 Aspen result of steam power plant cooled by R-404A at mcl = 0.11 kg/s…….. 143
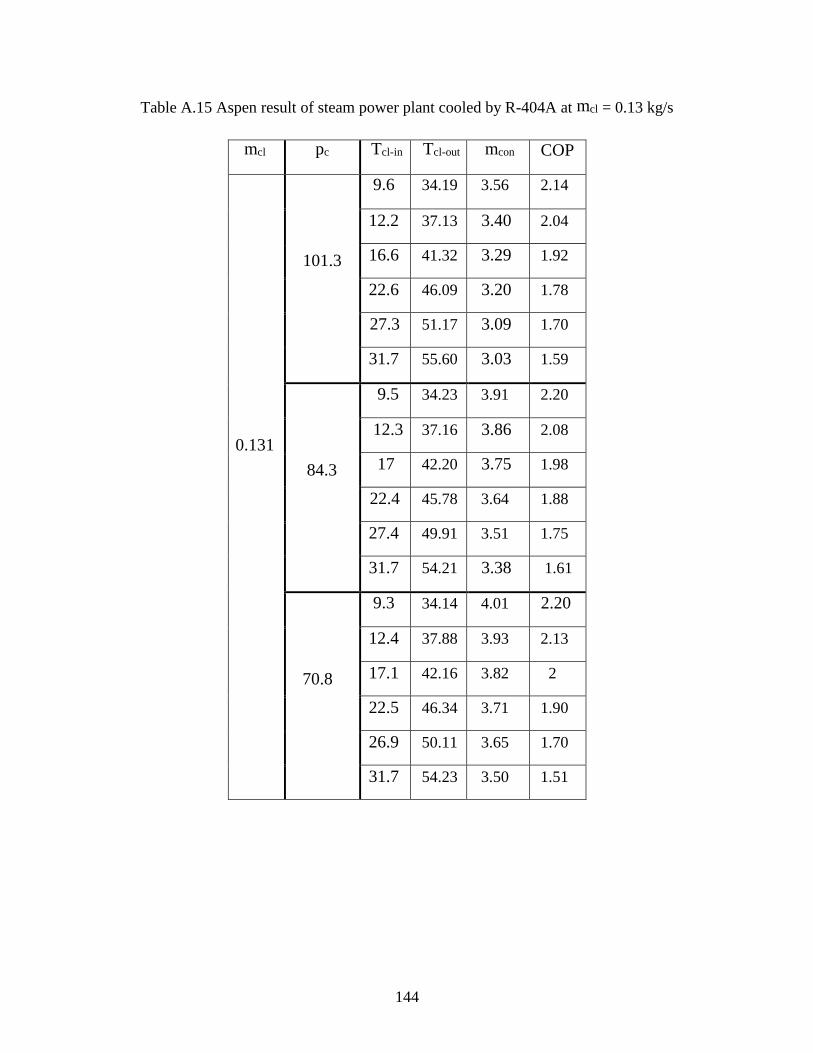
Table A.15 Aspen result of steam power plant cooled by R-404A at mcl = 0.13 kg/s……… 144
Page 9
ix
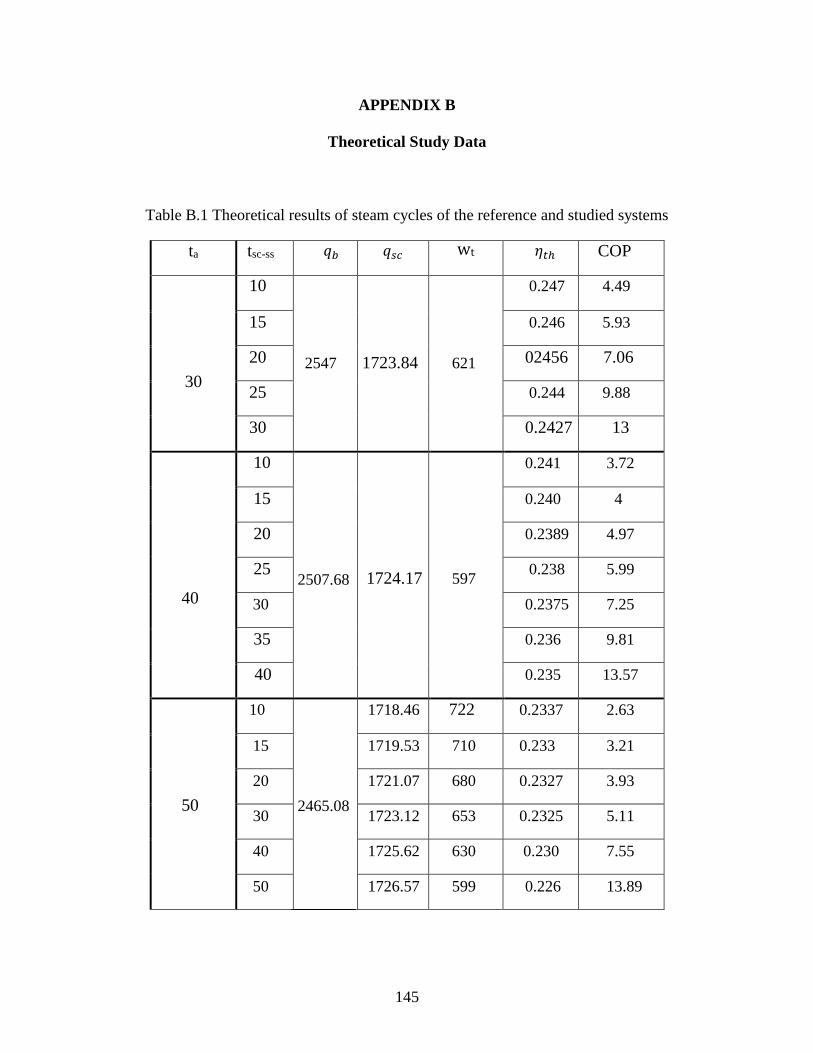
Table B.1 Theoretical results of steam cycles of the reference and studied systems……….. 145
Page 10
x
LIST OF FIGURES
Figure 1.1 Schematic of the steam power plant…………………………………………………. 2
Figure 1.2 Simple Rankine cycle of a steam power plant………………………………………. 3
Figure 1.3 The effect of lowering the condenser pressure on the ideal Rankine cycle………… 6
Figure 1.4 Schematic and T-s diagram of reversed Carnot cycle……………………………… 8
Figure 3.1 Single-pass and double-pass condenser……………………………………………. 28
Figure 3.2 Up-flow and down-flow vertical condenser……………………………………… 30
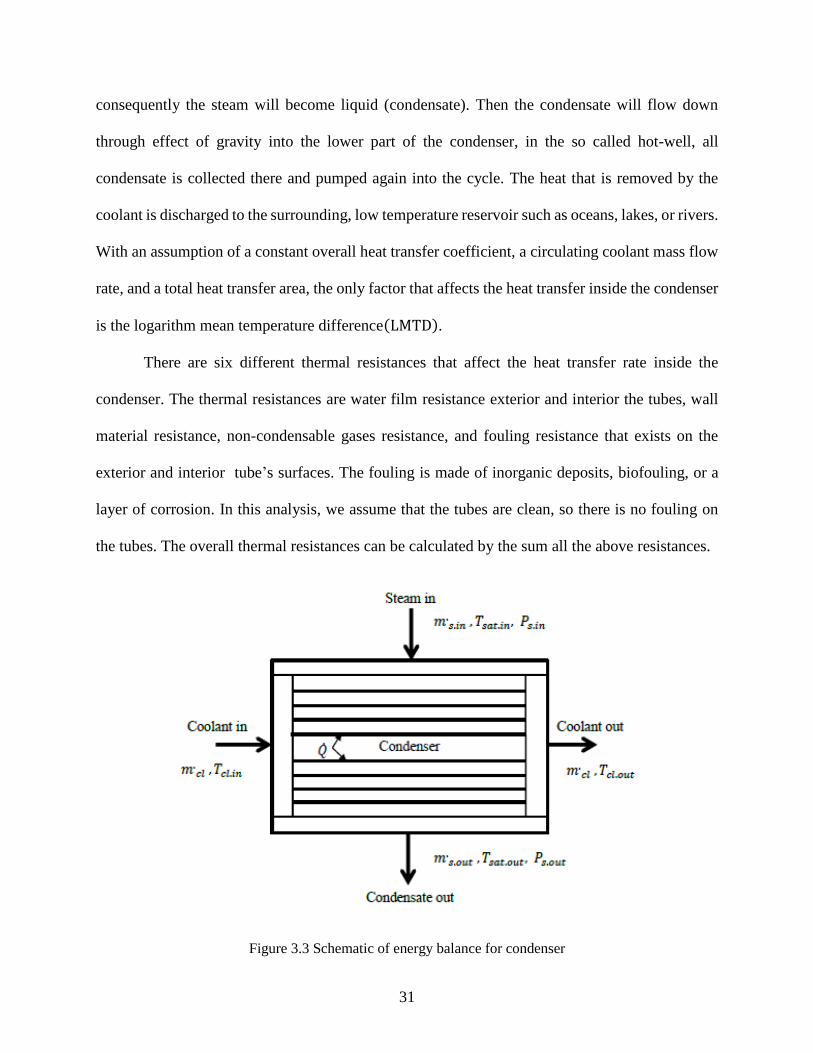
Figure 3.3 Schematic of energy balance for condenser………………………………………. 31
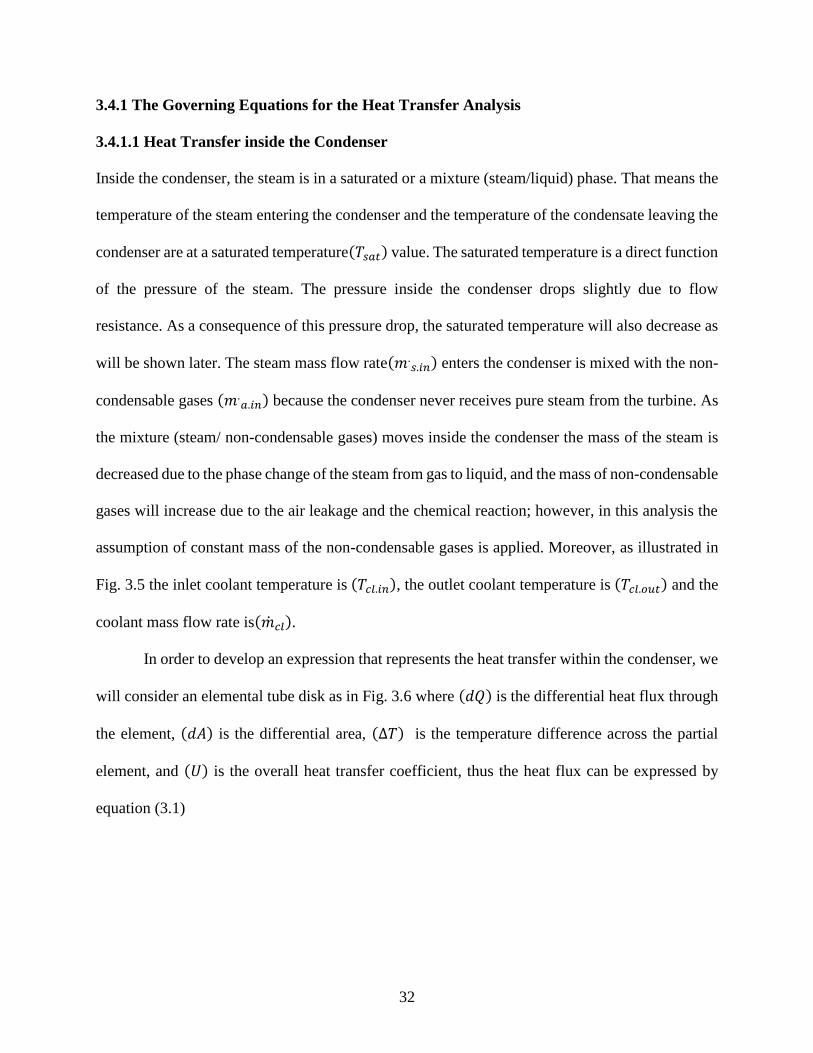
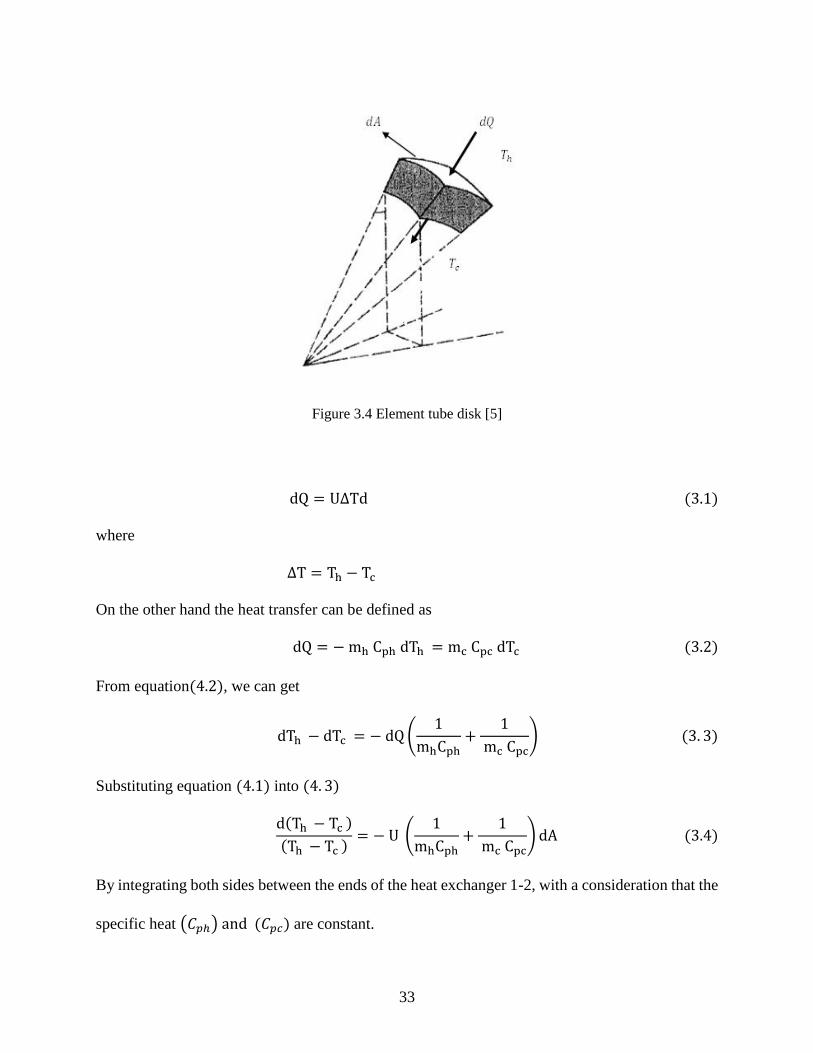
Figure 3.4 Element tube disk…………………………………………………………………… 33
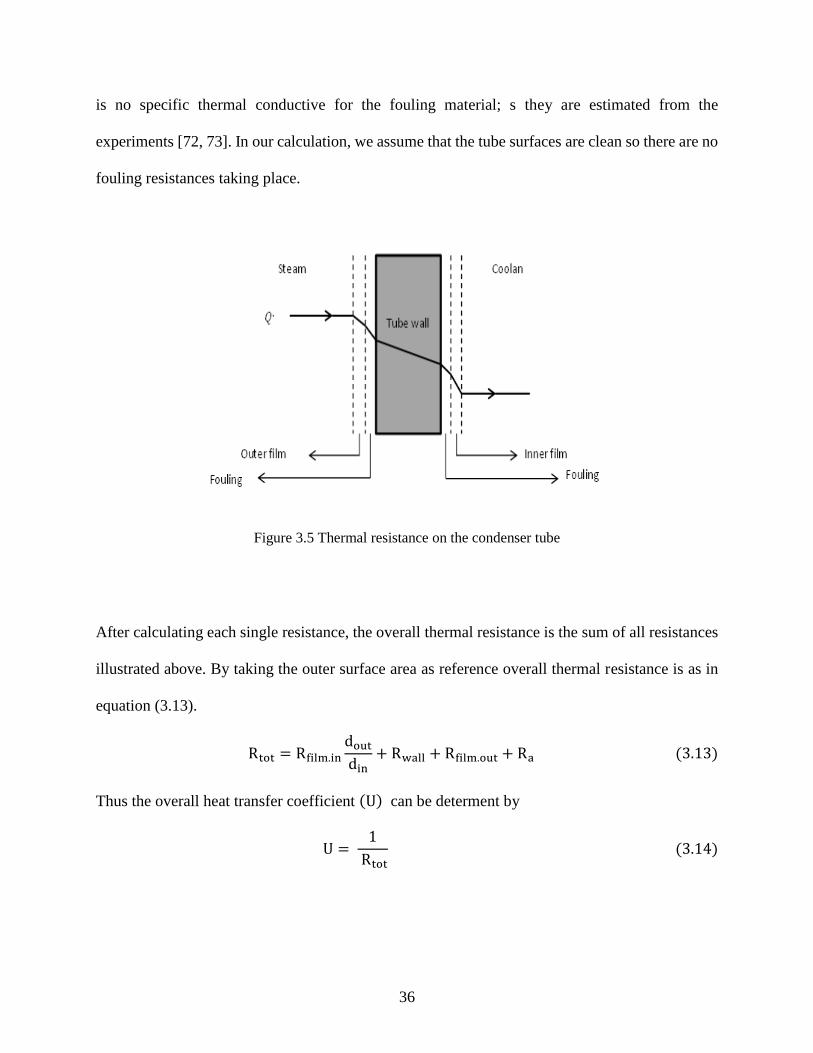
Figure 3.5 Thermal resistance on the condenser tube………………………………………….. 36
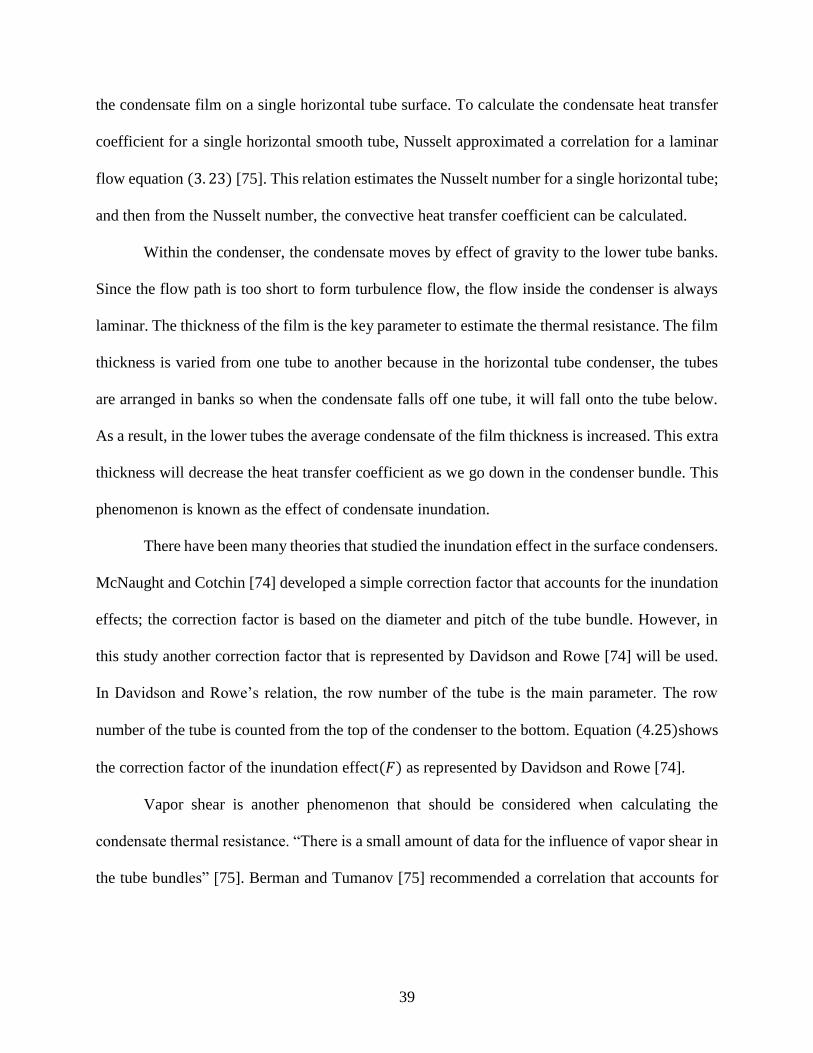
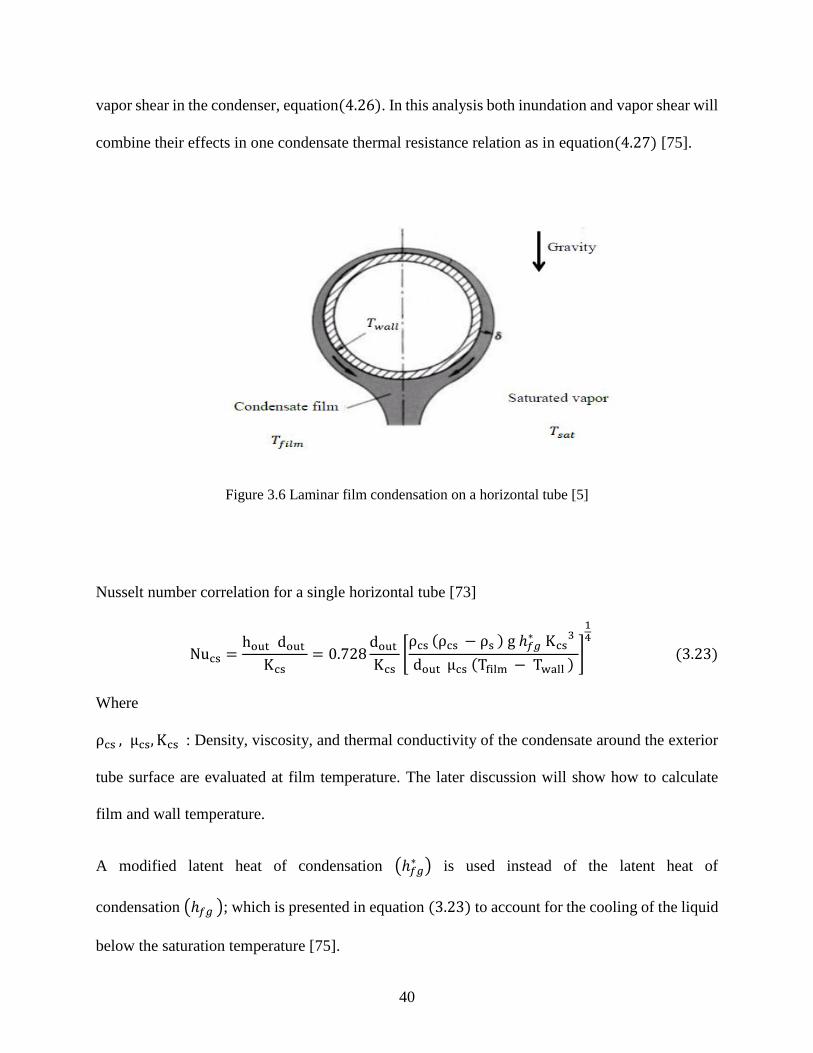
Figure 3.6 Laminar film condensation on a horizontal tube…………………………………… 40
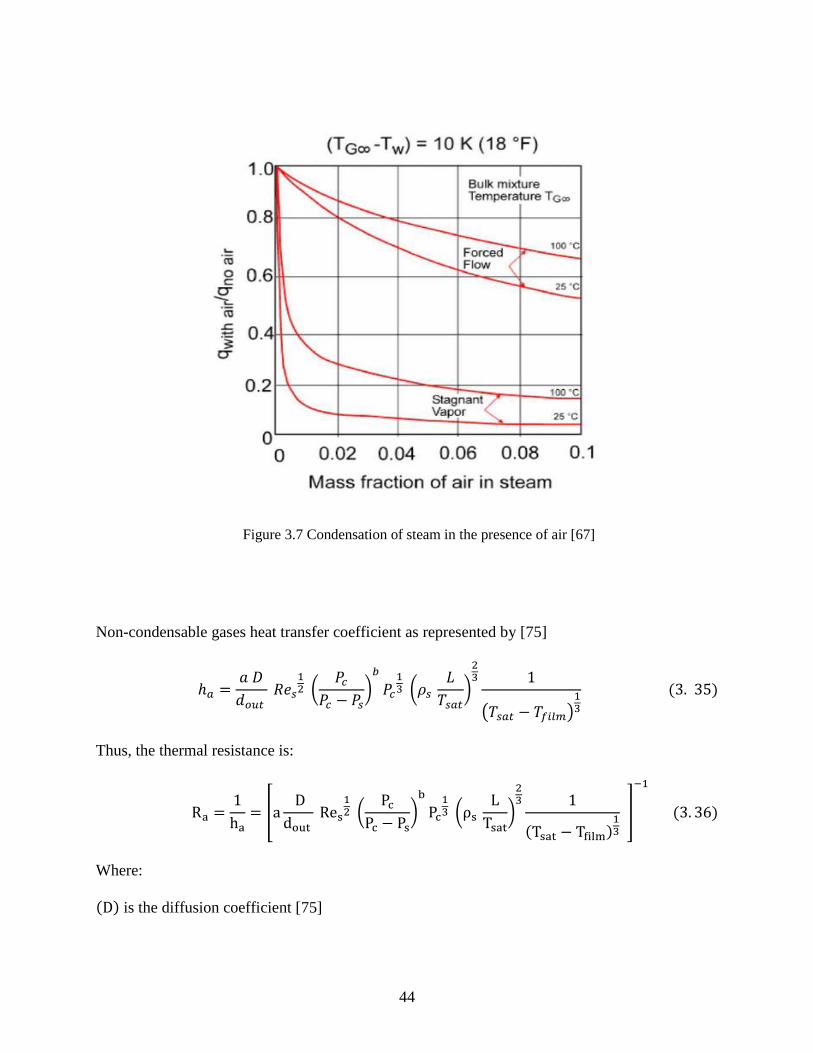
Figure 3.7 Condensation of steam in the presence of air………………………………………. 44
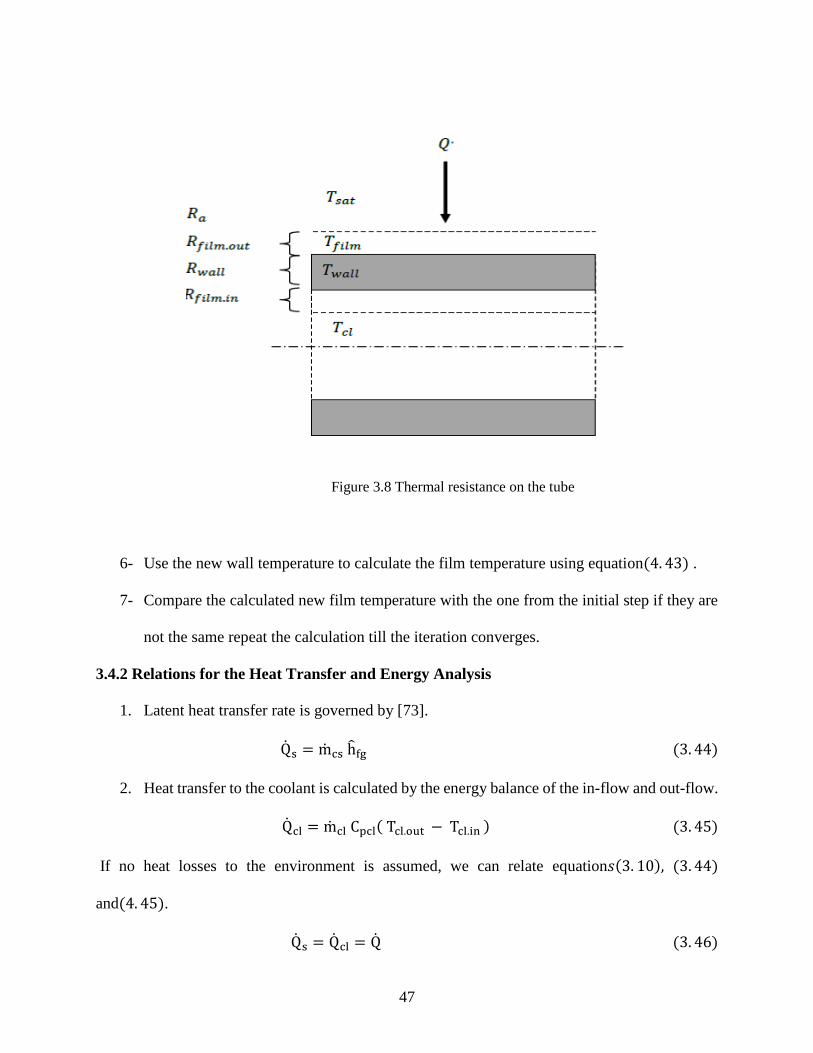
Figure 3.8 Thermal resistance on the tube……………………………………………………… 47
Figure 3.9 Exergy and energy balance………………………………………………………... 49
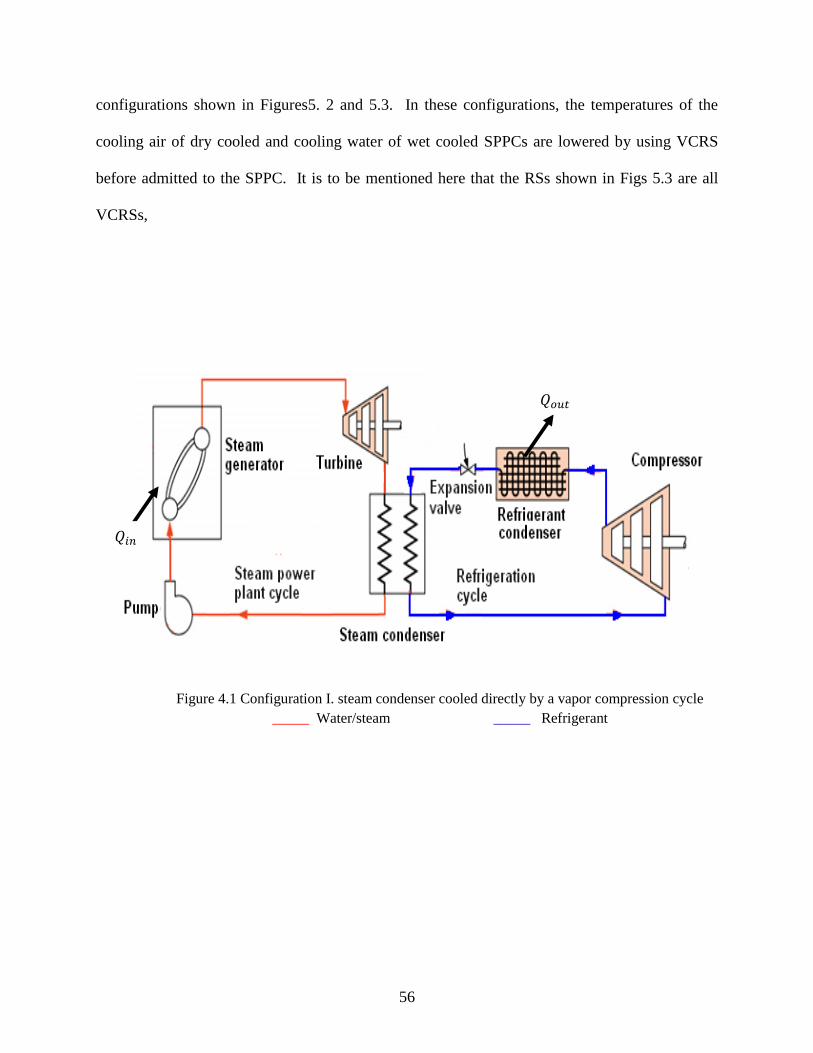
Figure 4.1 Configuration I. steam condenser cooled directly by a vapor compression cycle…. 56
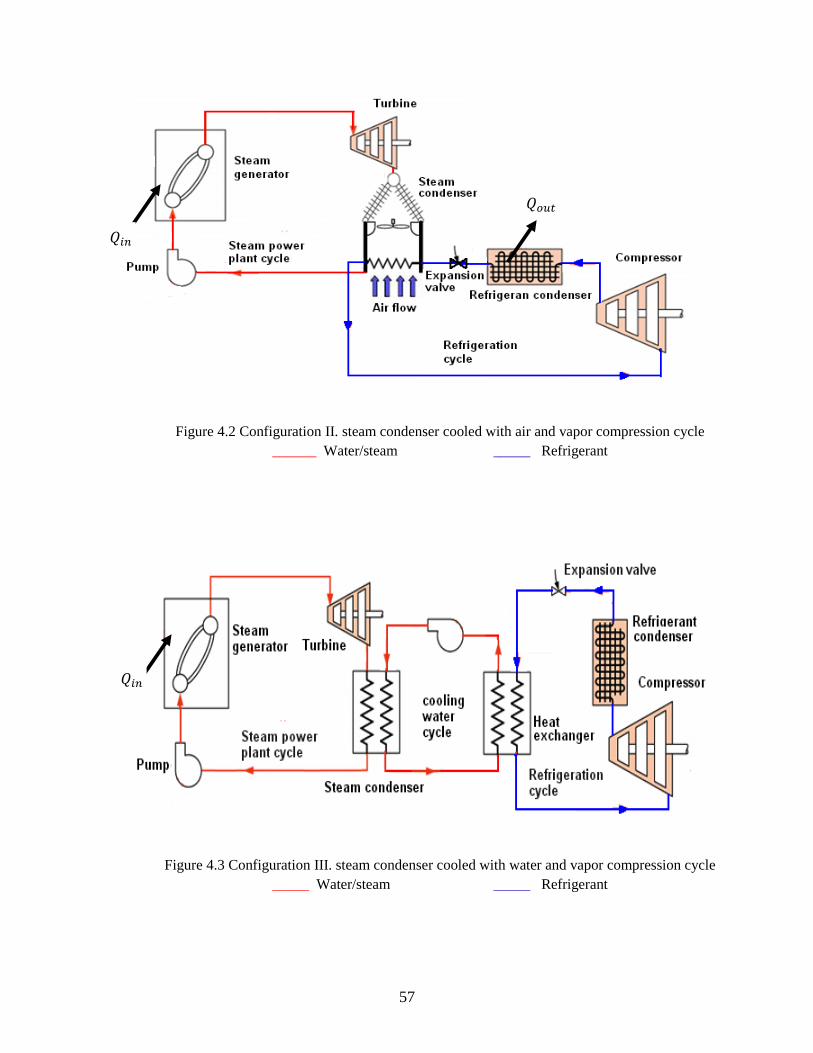
Figure 4.2 Configuration II. steam condenser cooled with air and vapor compression cycle… 57
Figure 4.3 Configuration III. steam condenser cooled with water and vapor compression cycle
…………………………………………………………………………………………………. 57
Figure 4.4 The experimental setup to model the refrigerant-cooled-condenser of the steam power
plant……………………………………………………………………………………………. 60
Figure 4.5 Steam condenser……………………………………………………………………. 63
Figure 4.6 Water circulator pump…………………………………………………………….... 64
Figure 4.7 Expanssion tank with pressure valve……………………………………………….. 65
Page 11
xi
Figure 4.8 Intermediate heat exchanger………………………………………………………… 66
Figure 4.9 AC condenser unit…………………………………………………………………... 67
Figure 4.10 Thermal expansion valve………………………………………………………….. 68
Figure 4.11 R-410A accumulator……………………………………………………………… 69
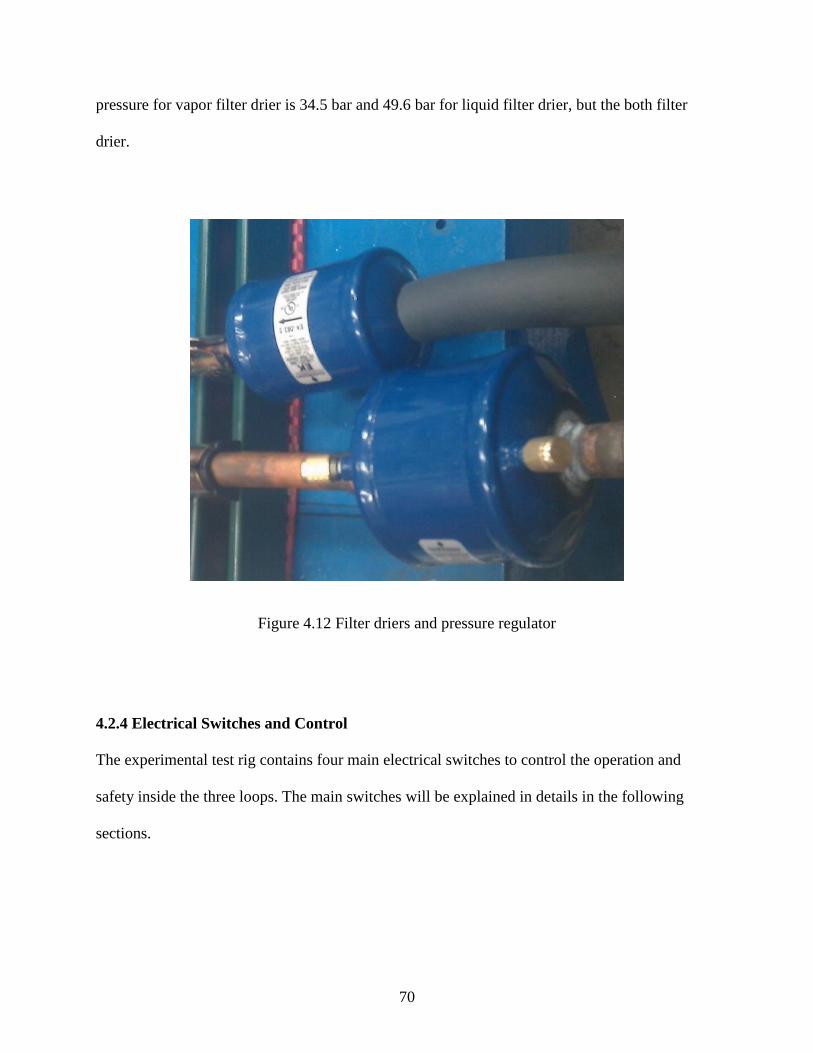
Figure 4.12 Filter driers and pressure regulator……………………………………………….. 70
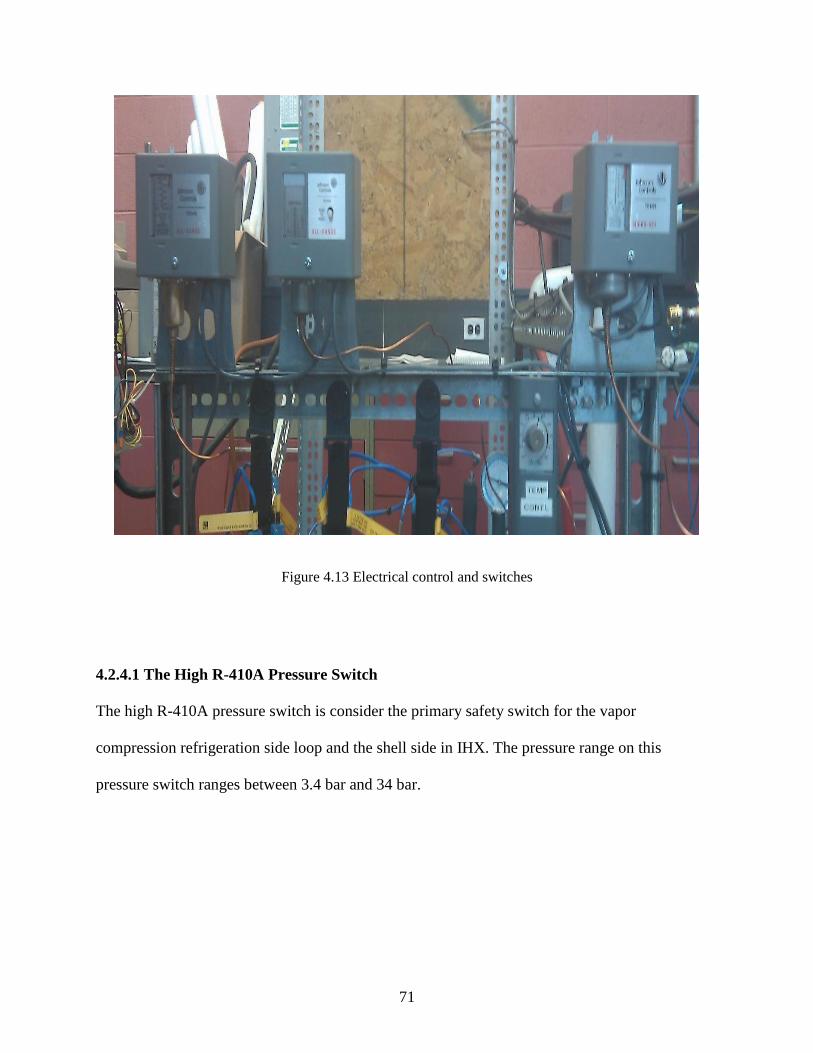
Figure 4.13 Electrical control and switches…………………………………………………… 71
Figure 5.1 Aspen-Hysys model of indirect cooling………..…………………………………. . 76
Figure 5.2 Aspen-Hysys model of direct cooling…………..………………………………….. 77
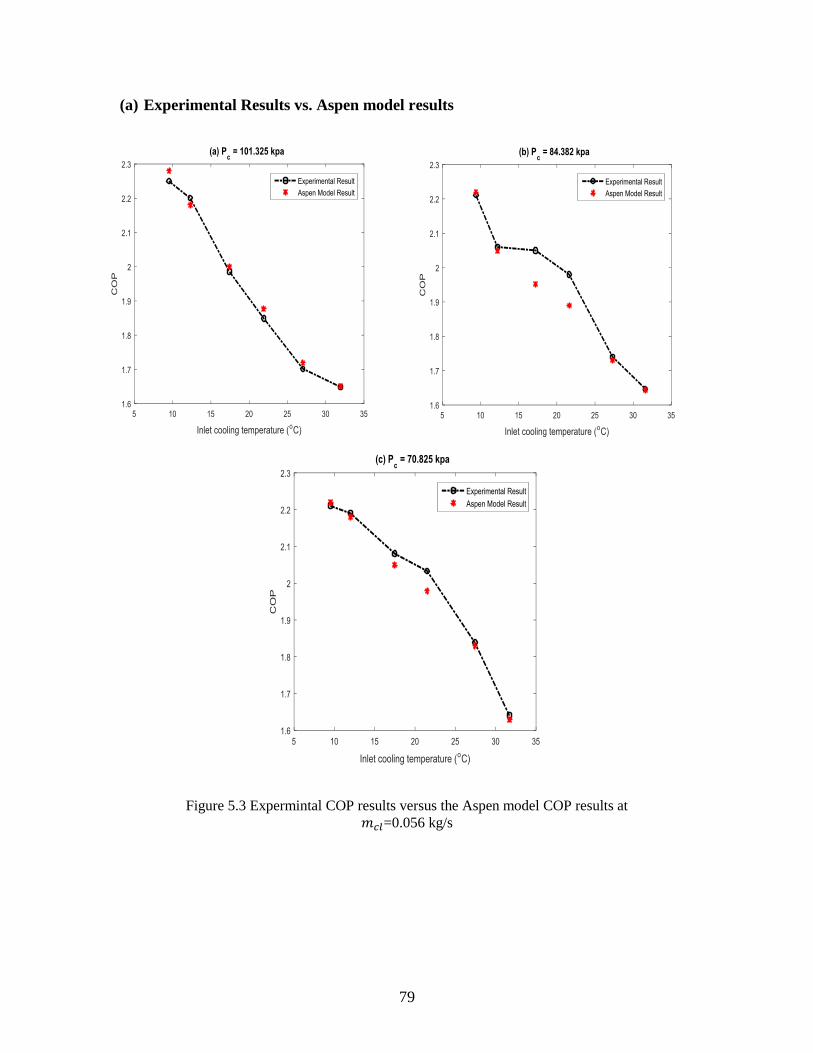
Figure 5.3 Expermintal COP results versus the Aspen model COP results at mcl=0.056 kg/s… 79
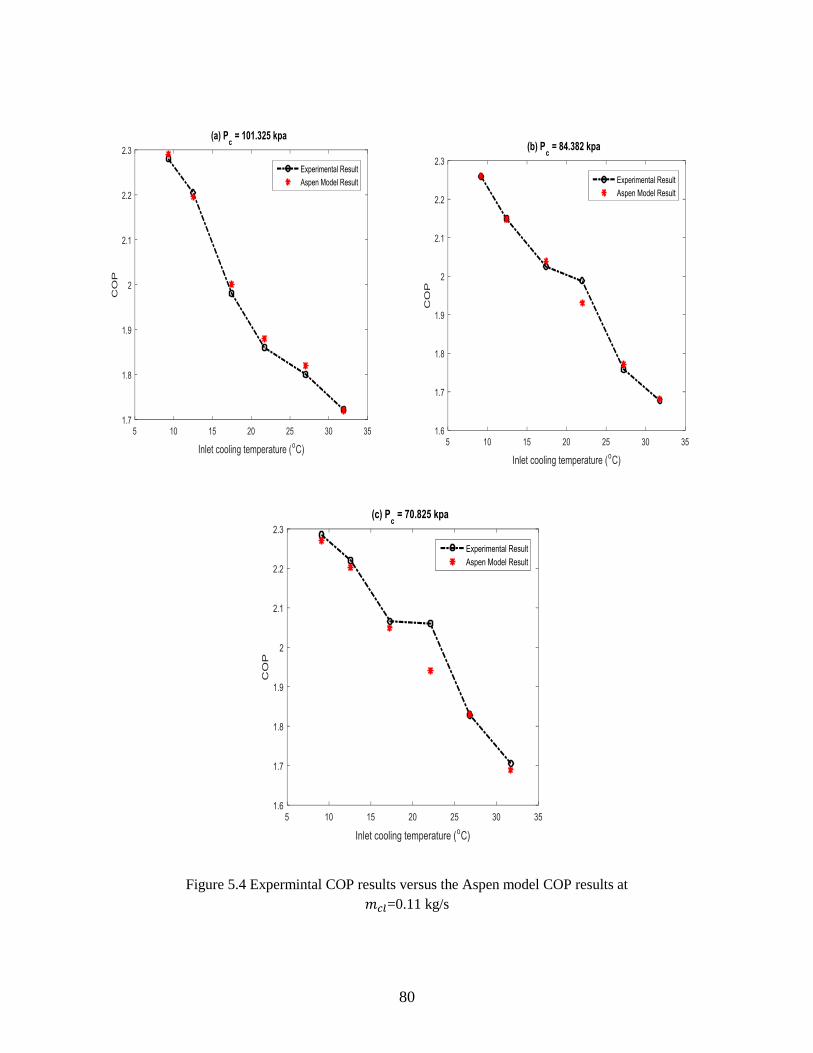
Figure 5.4 Expermintal COP results versus the Aspen model COP results at mcl=0.11 kg/s… 80
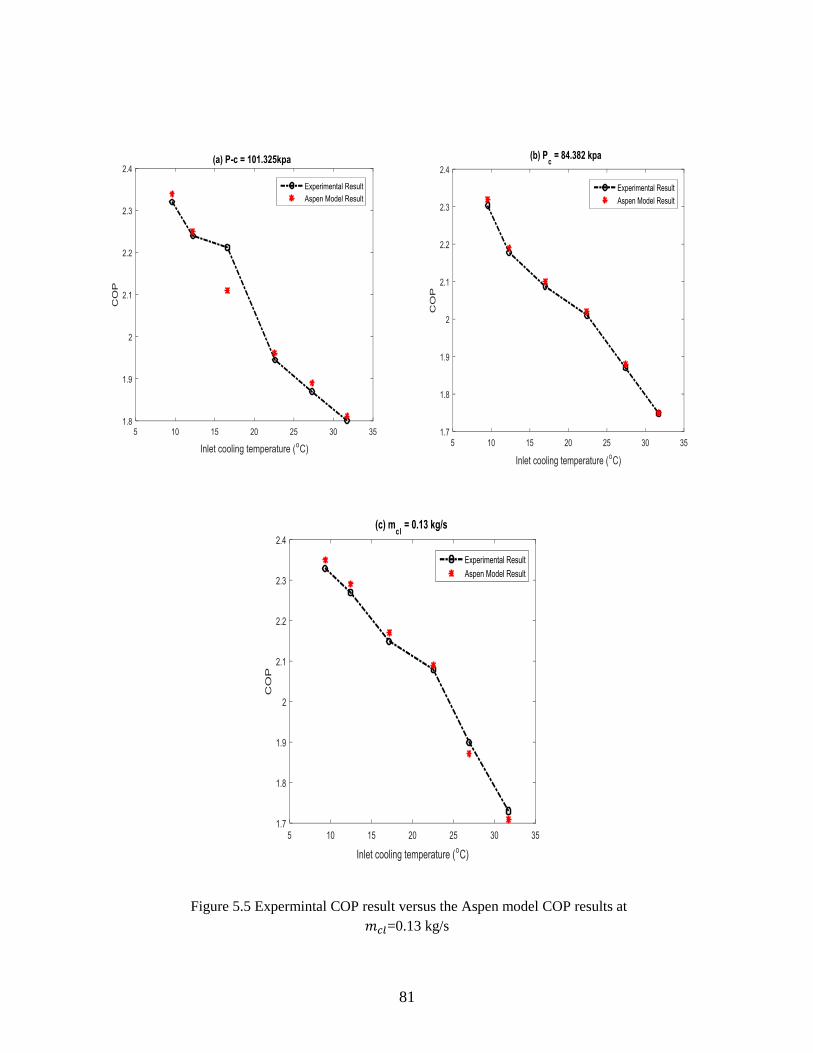
Figure 5.5 Expermintal COP results versus the Aspen model COP results at mcl=0.13 kg/s…. 81
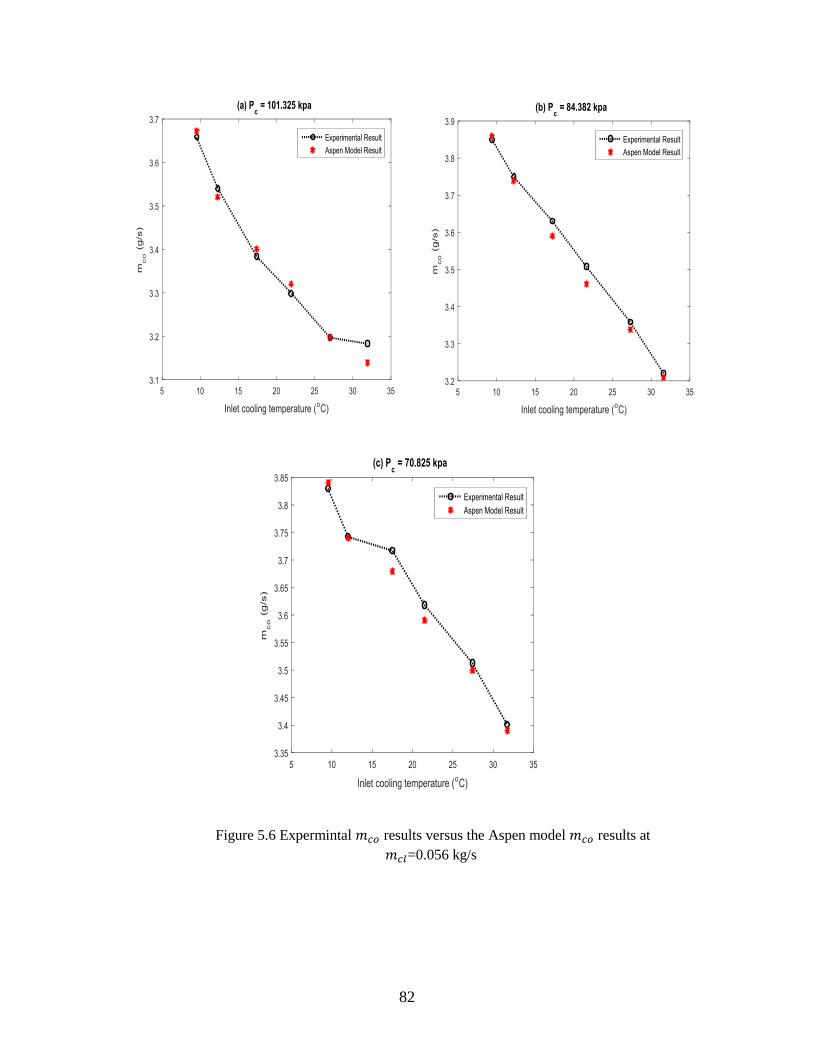
Figure 5.6 Expermintal 𝑚𝑐𝑜 results versus the Aspen model 𝑚𝑐𝑜 results at mcl=0.056 kg/s…. 82
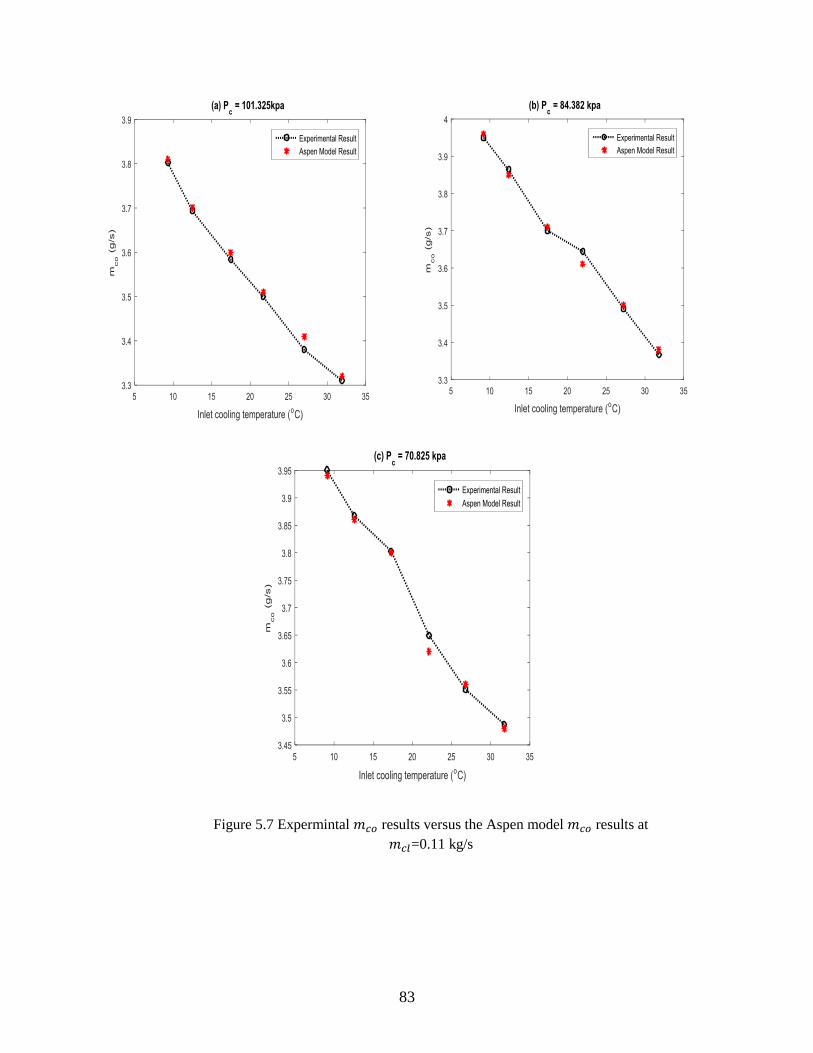
Figure 5.7 Expermintal 𝑚𝑐𝑜 results versus the Aspen model 𝑚𝑐𝑜 results at mcl=0.11 kg/s…… 83
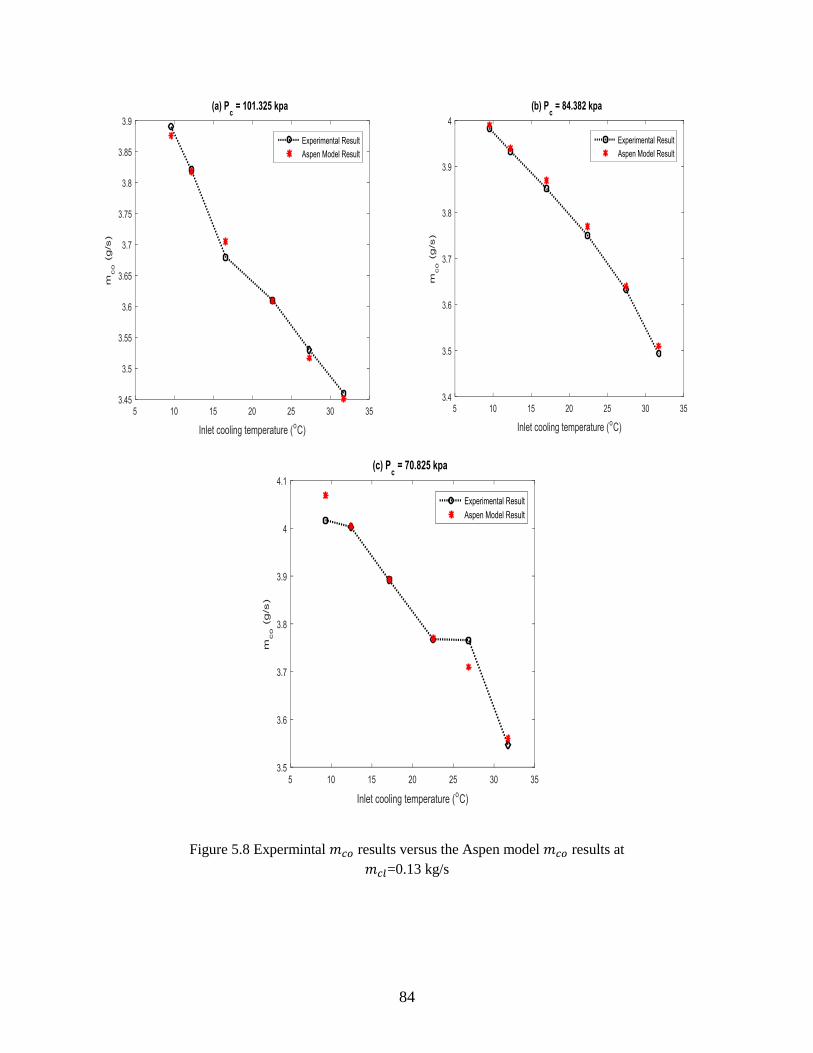
Figure 5.8 Expermintal 𝑚𝑐𝑜 results versus the Aspen model 𝑚𝑐𝑜 results at mcl=0.13 kg/s…… 84
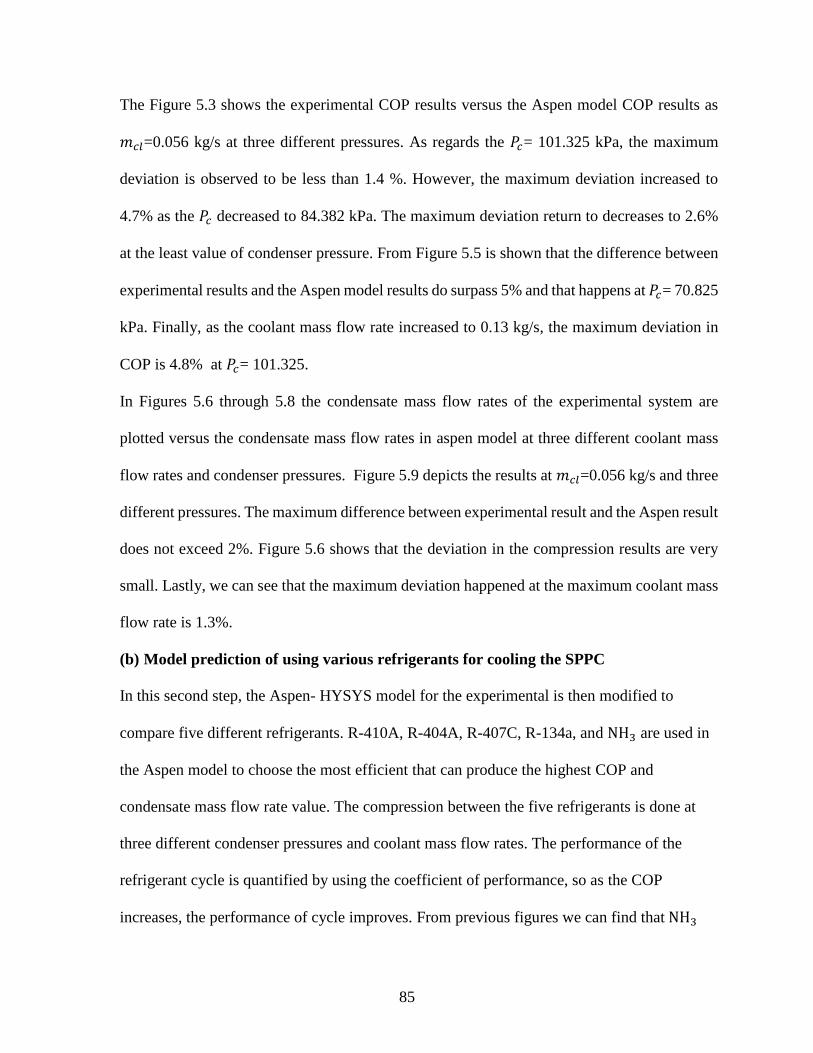
Figure 5.9a Coefficient of performance of SPP with different refrigerants at 𝑚𝑐𝑙=0.056 kg/s and
𝑃𝑐= 101.325 kPa……………………………………………………………………………….. 86
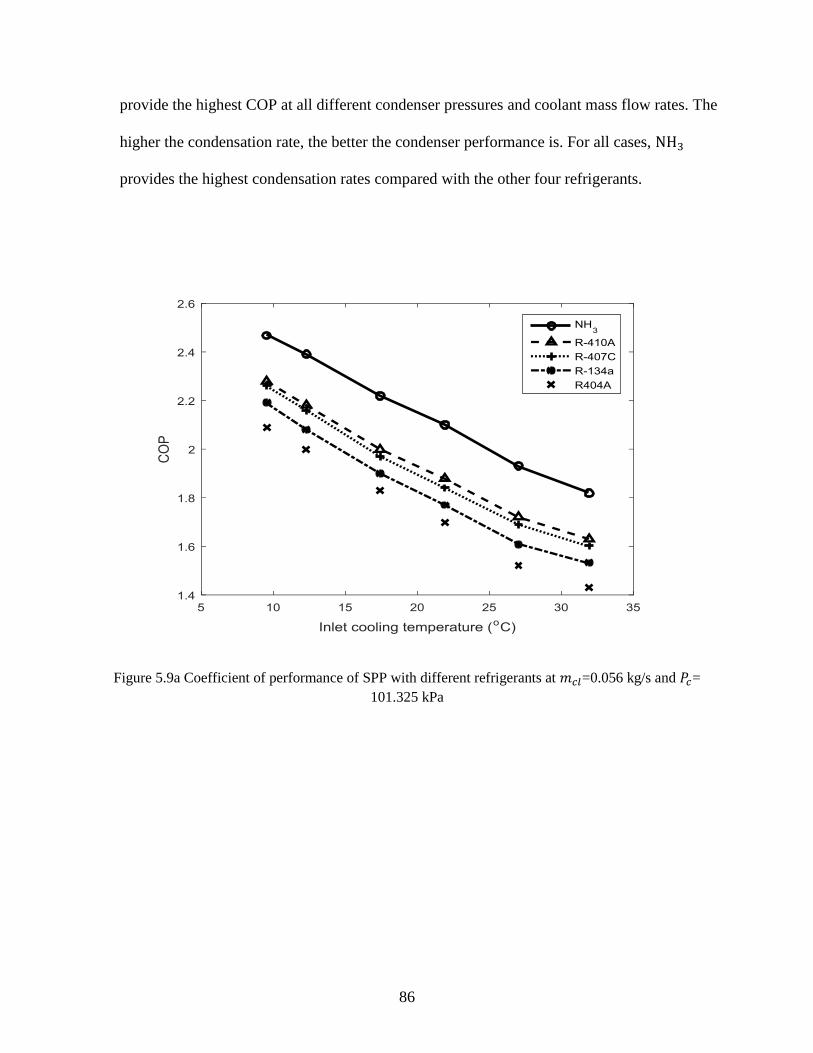
Figure 5.9b Coefficient of performance of SPP with different refrigerants at 𝑚𝑐𝑙=0.11 kg/s and
𝑃𝑐= 101.325 kPa……………………………………………………………………………….. 87
Figure 5.9c Coefficient of performance of SPP with different refrigerants at 𝑚𝑐𝑙=0.131 kg/s and
𝑃𝑐= 101.325 kPa……………………………………………………………………………….. 87
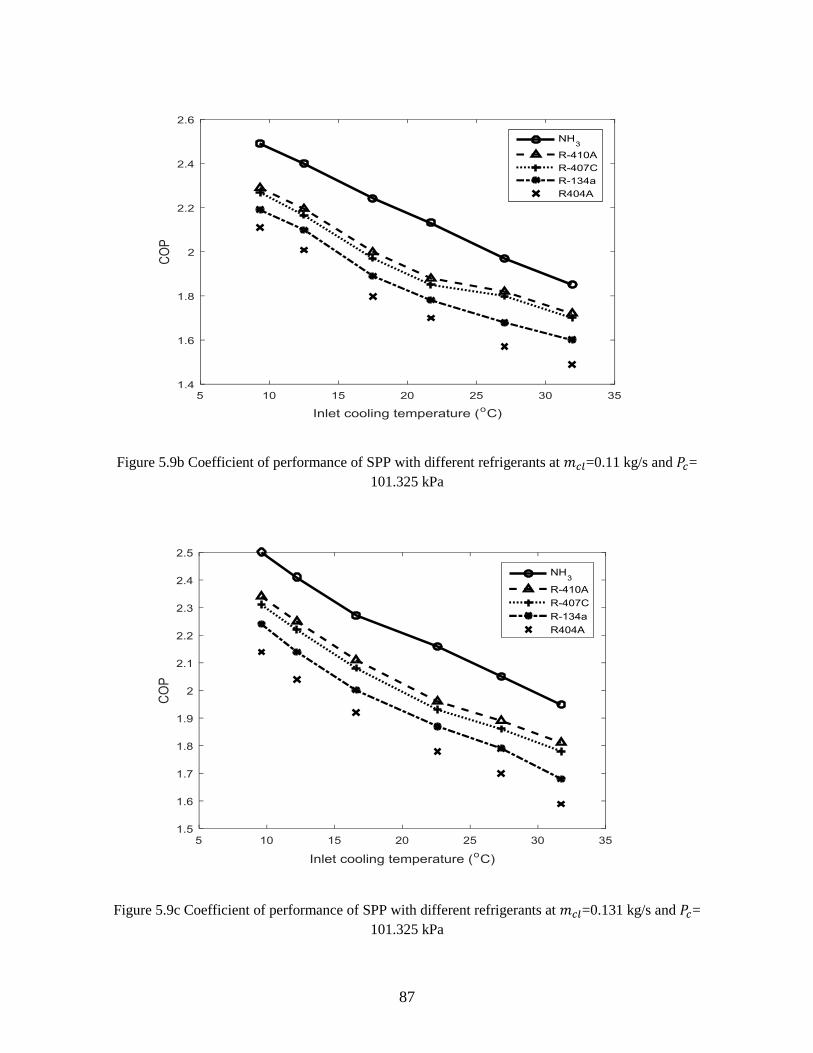
Figure 5.10a Coefficient of performance of SPP with different refrigerants at 𝑚𝑐𝑙=0.056 kg/s and
𝑃𝑐= 84.385 kPa…………………………………………………………………………………. 88
Figure 5.10b Coefficient of performance of SPP with different refrigerants at 𝑚𝑐𝑙=0.11 kg/s and
𝑃𝑐= 84.385 kPa…………………………………………………………………………………. 88
Figure 5.10c Coefficient of performance of SPP with different refrigerants at 𝑚𝑐𝑙=0.13 kg/s and
𝑃𝑐= 84.385 kPa…………………………………………………………………………………. 89
Page 12
xii
Figure 5.11a Coefficient of performance of SPP with different refrigerants at 𝑚𝑐𝑙=0.056 kg/s and
𝑃𝑐= 70.825 kPa………………………………………………………………………………… 89
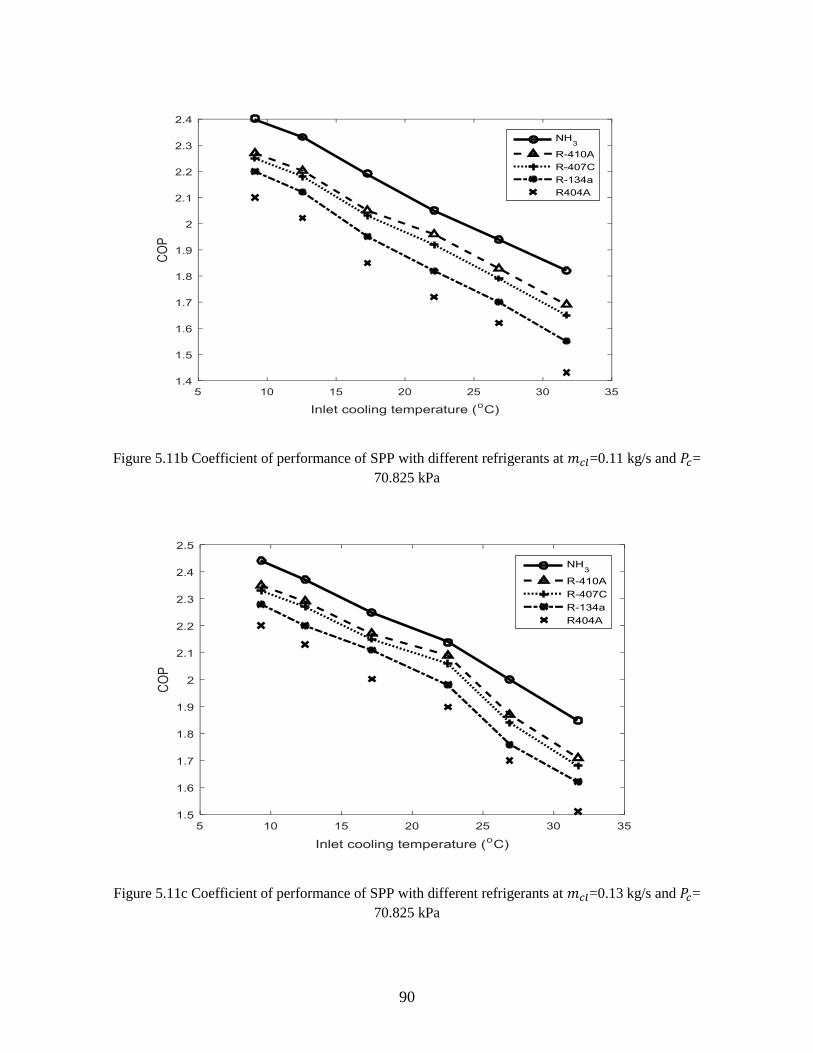
Figure 5.11b Coefficient of performance of SPP with different refrigerants at 𝑚𝑐𝑙=0.11 kg/s and
𝑃𝑐= 70.825 kPa………………………………………………………………………………… 90
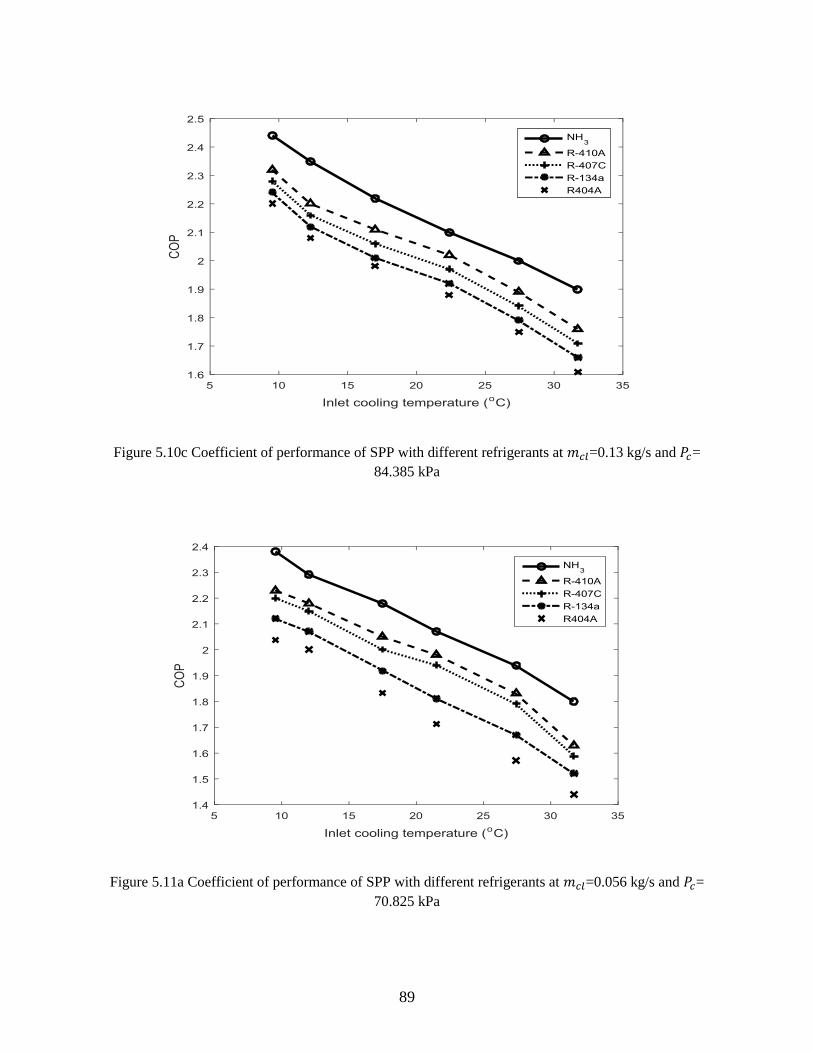
Figure 5.11c Coefficient of performance of SPP with different refrigerants at 𝑚𝑐𝑙=0.13 kg/s and
𝑃𝑐= 70.825 kPa………………………………………………………………………………… 90
Figure 5.12a Condensation rate in SPP with different refrigerants at 𝑚𝑐𝑙=0.05 kg/s and 𝑃𝑐=
101.325 kPa……………………………………………………………………….................. 91
Figure 5.12b Condensation rate in SPP with different refrigerants at 𝑚𝑐𝑙=0.11 kg/s and 𝑃𝑐=
101.325 kPa…………………………………………………………………………………..... 91
Figure 5.12c Condensation rate in SPP with different refrigerants at 𝑚𝑐𝑙=0.13 kg/s and 𝑃𝑐=
101.325 kPa………………………………………………………………………………….... 92
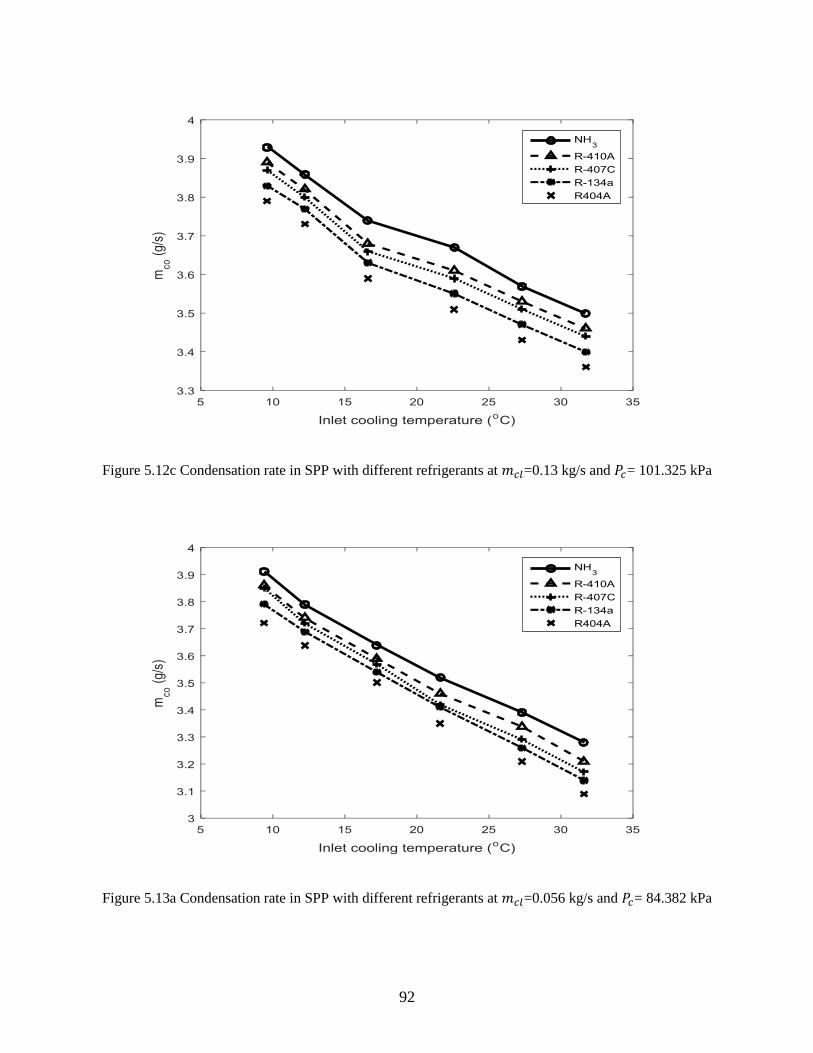
Figure 5.13a Condensation rate in SPP with different refrigerants at 𝑚𝑐𝑙=0.056 kg/s and 𝑃𝑐=
84.382 kPa…………………………………………………………………………………….. 92
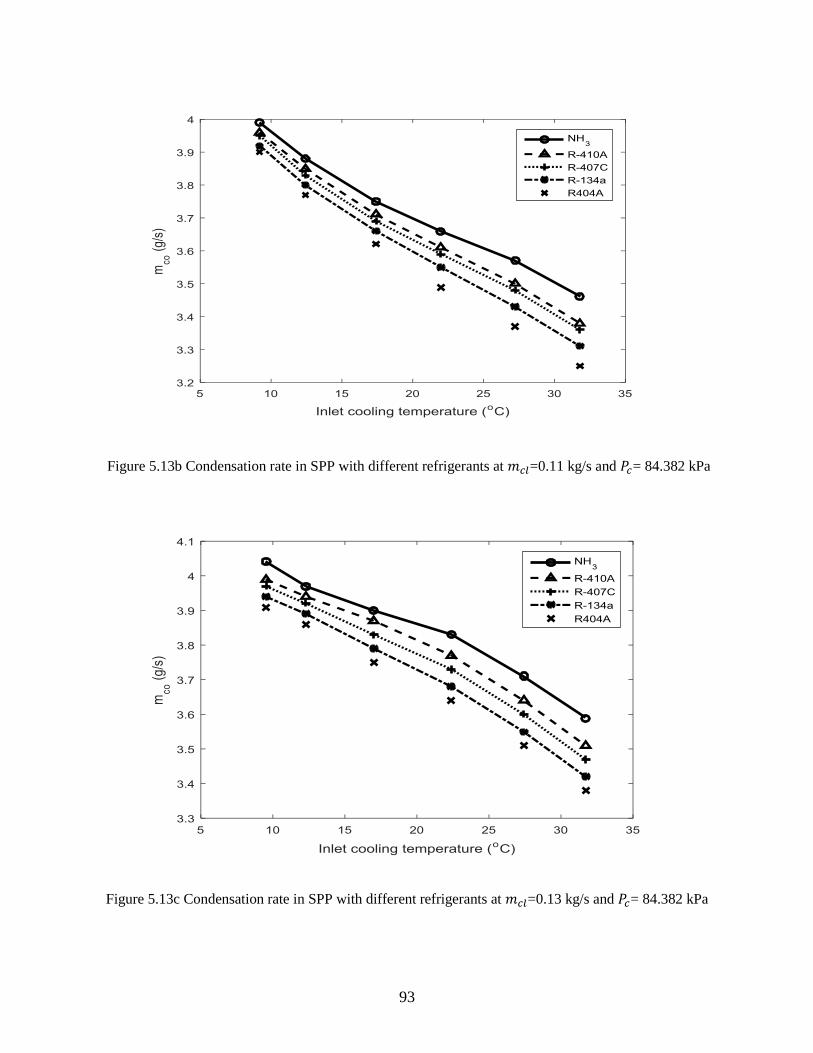
Figure 5.13b Condensation rate in SPP with different refrigerants at 𝑚𝑐𝑙=0.11 kg/s and 𝑃𝑐= 84.382
kPa…………………………………………………………………………………………….. 93
Figure 5.13c Condensation rate in SPP with different refrigerants at 𝑚𝑐𝑙=0.13 kg/s and 𝑃𝑐= 84.382
kPa…………………………………………………………………………………………….. 93
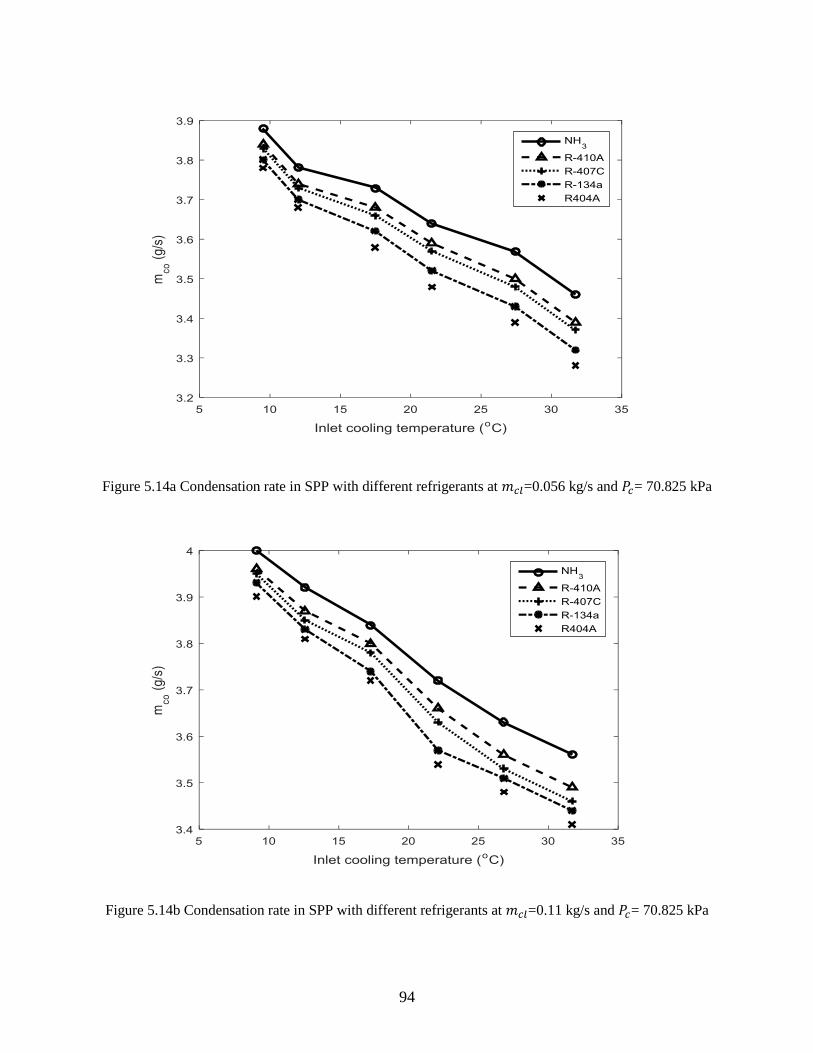
Figure 5.14a Condensation rate in SPP with different refrigerants at 𝑚𝑐𝑙=0.056 kg/s and 𝑃𝑐=
70.825 kPa……………………………………………………………………………………... 94
Figure 5.14b Condensation rate in SPP with different refrigerants at 𝑚𝑐𝑙=0.11 kg/s and 𝑃𝑐= 70.825
kPa……………………………………………………………………………………………… 94
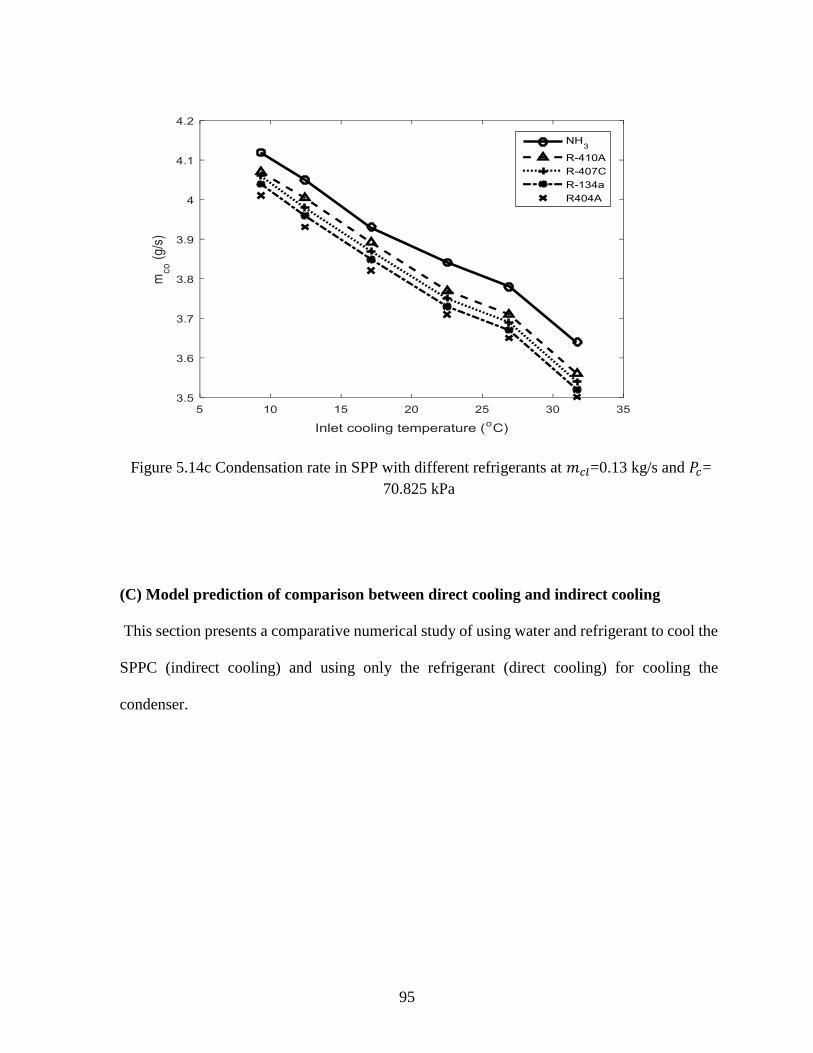
Figure 5.14c Condensation rate in SPP with different refrigerants at 𝑚𝑐𝑙=0.13 kg/s and 𝑃𝑐= 70.825
kPa…………………………………………………………………………………………….. 95
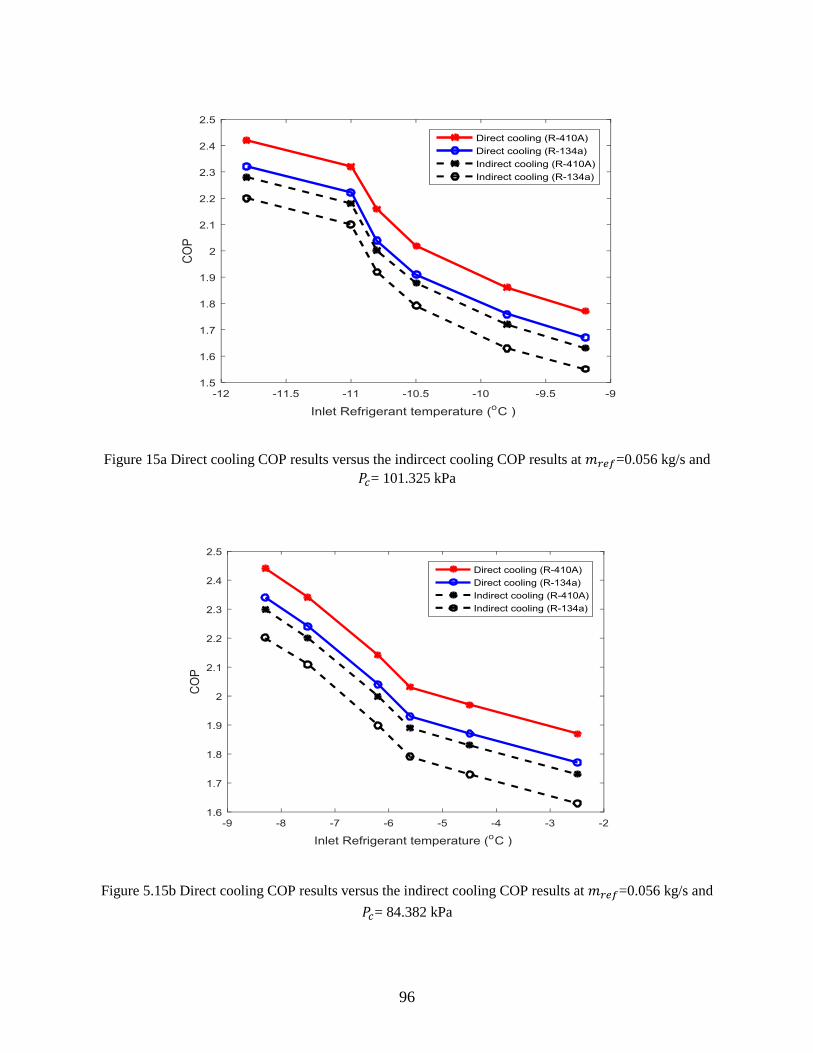
Figure 5.15a Direct cooling COP results versus the indirect cooling COP results at 𝑚𝑟𝑒𝑓=0.056
kg/s and 𝑃𝑐= 101.325 kPa……………………………………………………………………… 96
Figure 5.15b Direct cooling COP results versus the indirect cooling COP results at 𝑚𝑟𝑒𝑓=0.11 kg/s
and 𝑃𝑐= 84.382 kPa…………………………………………………………………………..... 96
Figure 5.15c Direct cooling COP results versus the indirect cooling COP results at 𝑚𝑟𝑒𝑓=0.056
kg/s and 𝑃𝑐= 70.825 kPa………………………………………………………………………. 97
Page 13
xiii
Figure 5.16a Direct cooling COP results versus the indirect cooling COP results at 𝑚𝑟𝑒𝑓=0.11 kg/s
and 𝑃𝑐= 101.325 kPa…………………………………………………………………………… 97
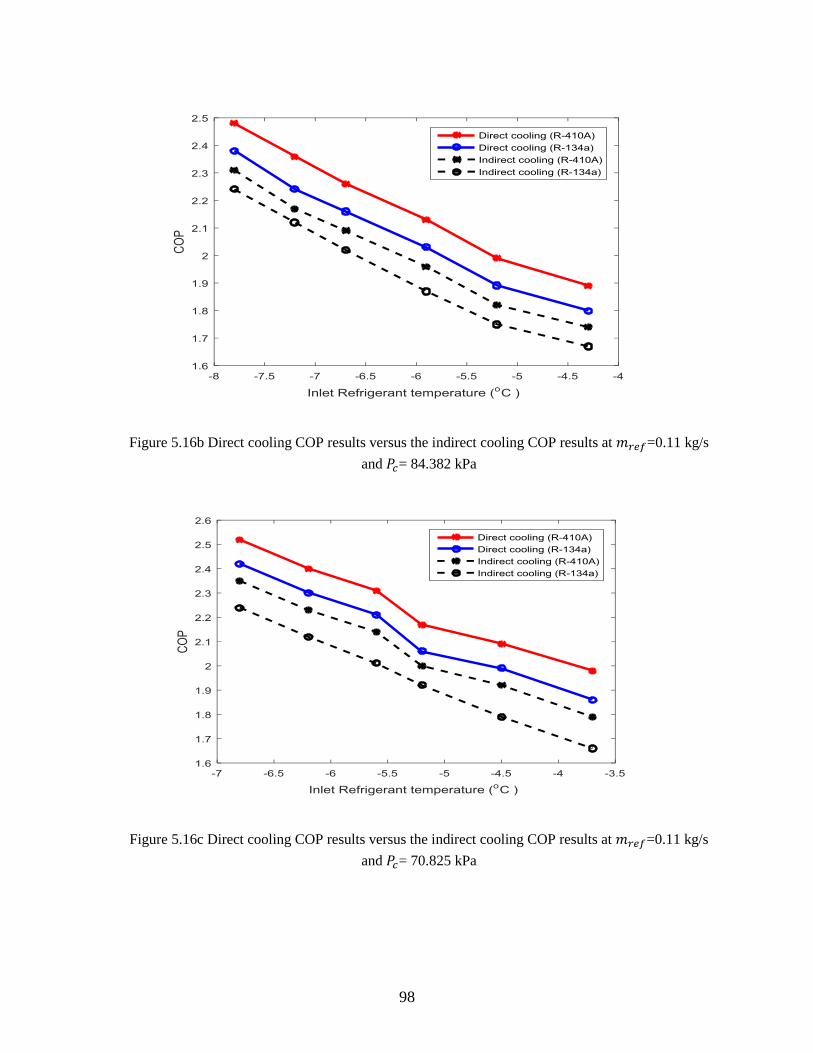
Figure 5.16b Direct cooling COP results versus the indirect cooling COP results at 𝑚𝑟𝑒𝑓=0.11 kg/s
and 𝑃𝑐= 84.382 kPa…………………………………………………………………………….. 98
Figure 5.16c Direct cooling COP results versus the indirect cooling COP results at 𝑚𝑟𝑒𝑓=0.11 kg/s
and 𝑃𝑐= 70.825 kPa…………………………………………………………………………… 98
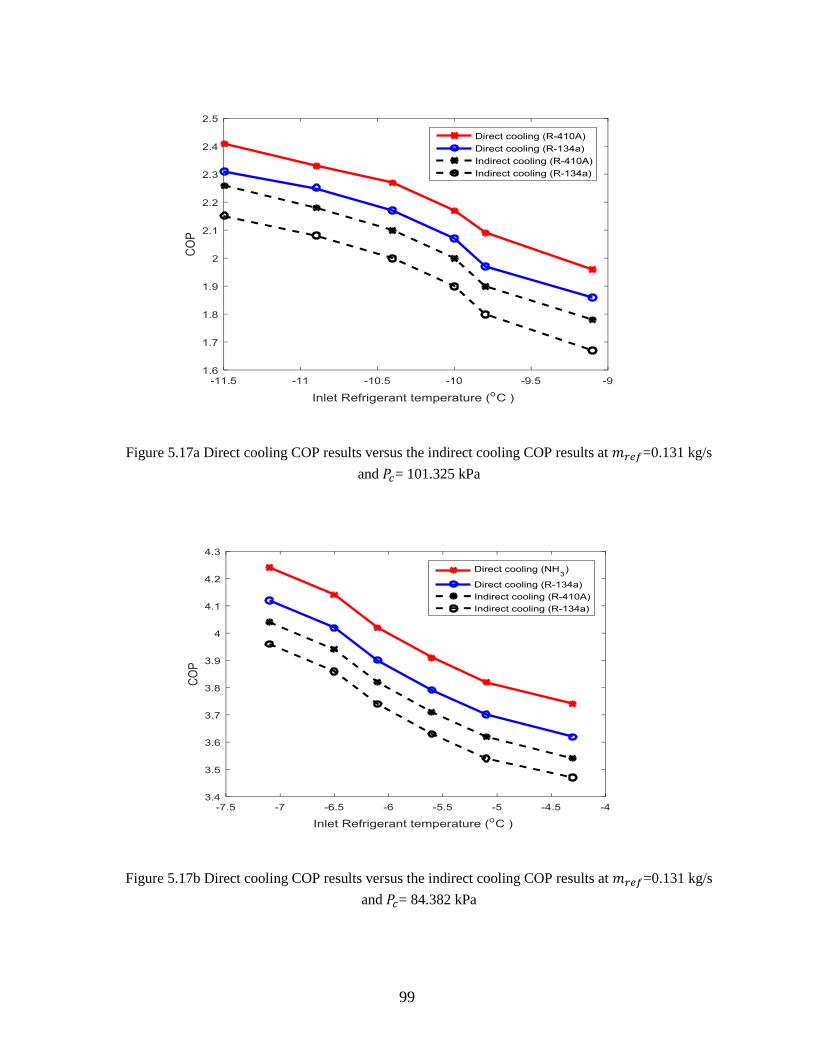
Figure 5.17a Direct cooling COP results versus the indirect cooling COP results at 𝑚𝑟𝑒𝑓=0.131
kg/s and 𝑃𝑐= 101.325 kPa…………………………………………………………………….. 99
Figure 5.17b Direct cooling COP results versus the indirect cooling COP results at 𝑚𝑟𝑒𝑓=0.131
kg/s and 𝑃𝑐= 84.382 kPa………………………………………………………………………. 99
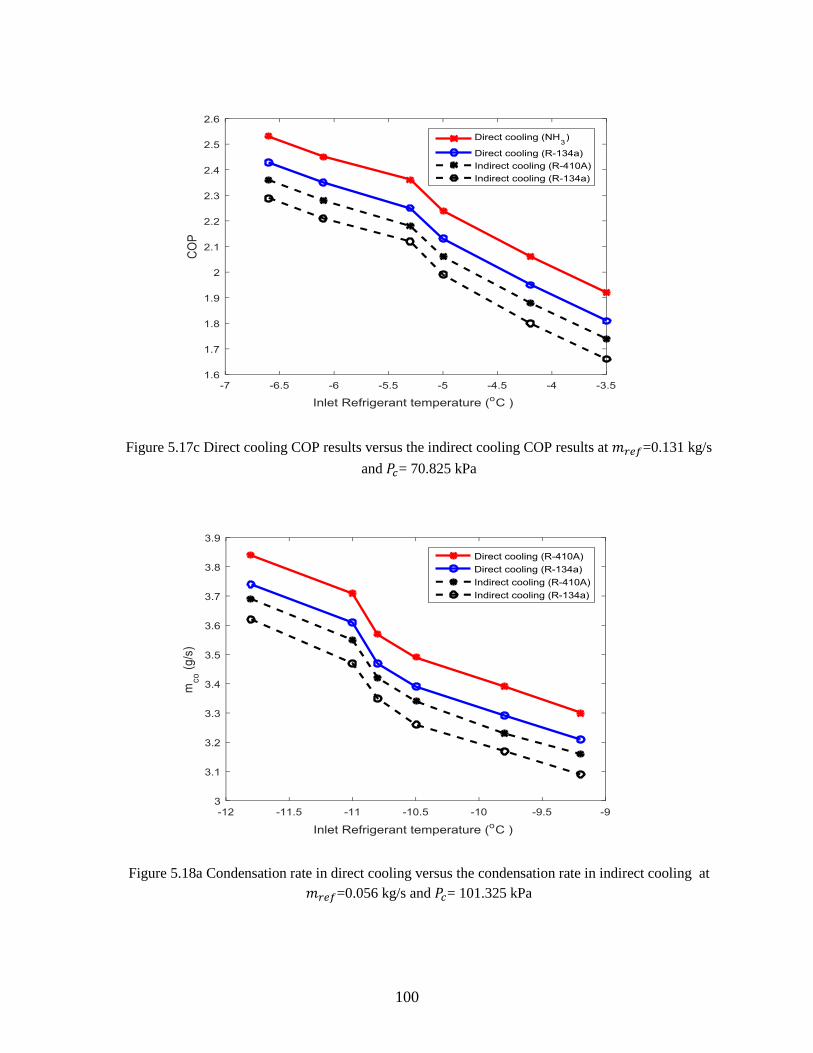
Figure 5.17c Direct cooling COP results versus the indirect cooling COP results at 𝑚𝑟𝑒𝑓=0.131
kg/s and 𝑃𝑐= 70.825 kPa……………………………………………………………………. 100
Figure 5.18a Condensation rate in direct cooling versus the condensation rate in indirect cooling
at 𝑚𝑟𝑒𝑓=0.056 kg/s and 𝑃𝑐= 101.325 kPa…………………………………………………….. 100
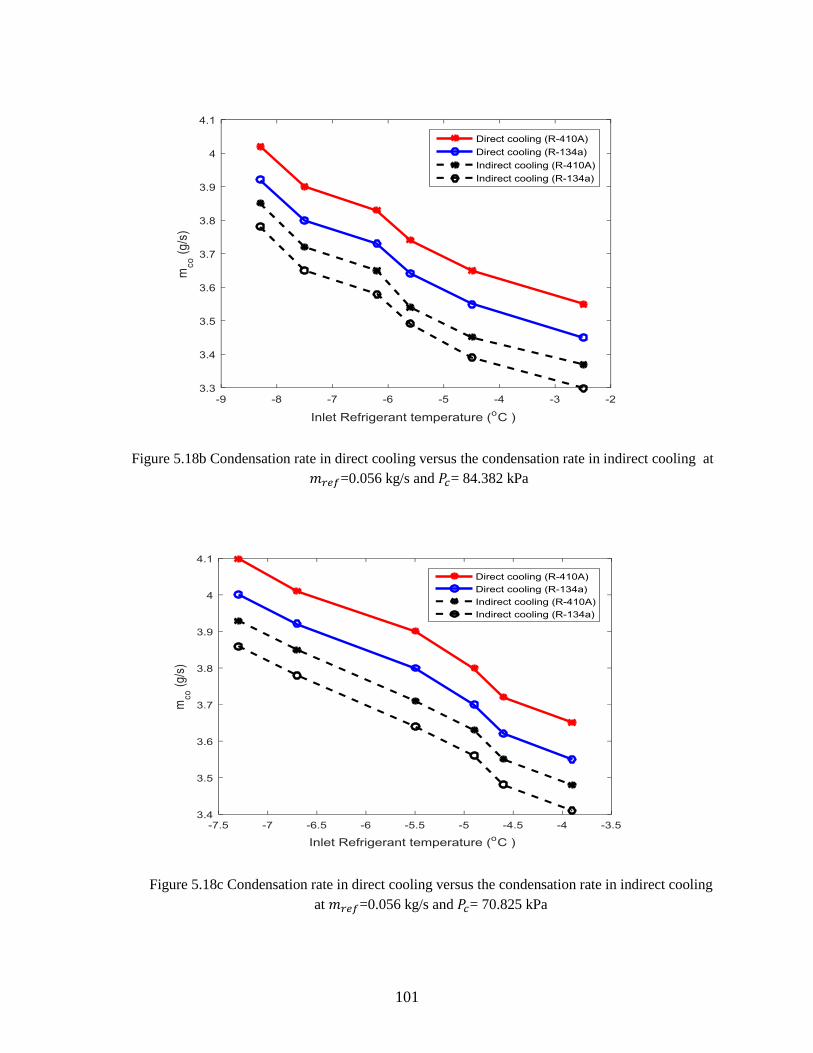
Figure 5.18b Condensation rate in direct cooling versus the condensation rate in indirect cooling
at 𝑚𝑟𝑒𝑓=0.056 kg/s and 𝑃𝑐= 84.382 kPa……………………………………………………… 101
Figure 5.18a Condensation rate in direct cooling versus the condensation rate in indirect cooling
at 𝑚𝑟𝑒𝑓=0.056 kg/s and 𝑃𝑐= 70.825 kPa……………………………………………………. 101
Figure 5.19a Condensation rate in direct cooling versus the condensation rate in indirect cooling
at 𝑚𝑟𝑒𝑓=0.11 kg/s and 𝑃𝑐= 101.325 kPa……………………………………………………. 102
Figure 5.19b Condensation rate in direct cooling versus the condensation rate in indirect cooling
at 𝑚𝑟𝑒𝑓=0.11 kg/s and 𝑃𝑐= 84.382 kPa……………………………………………………….. 102
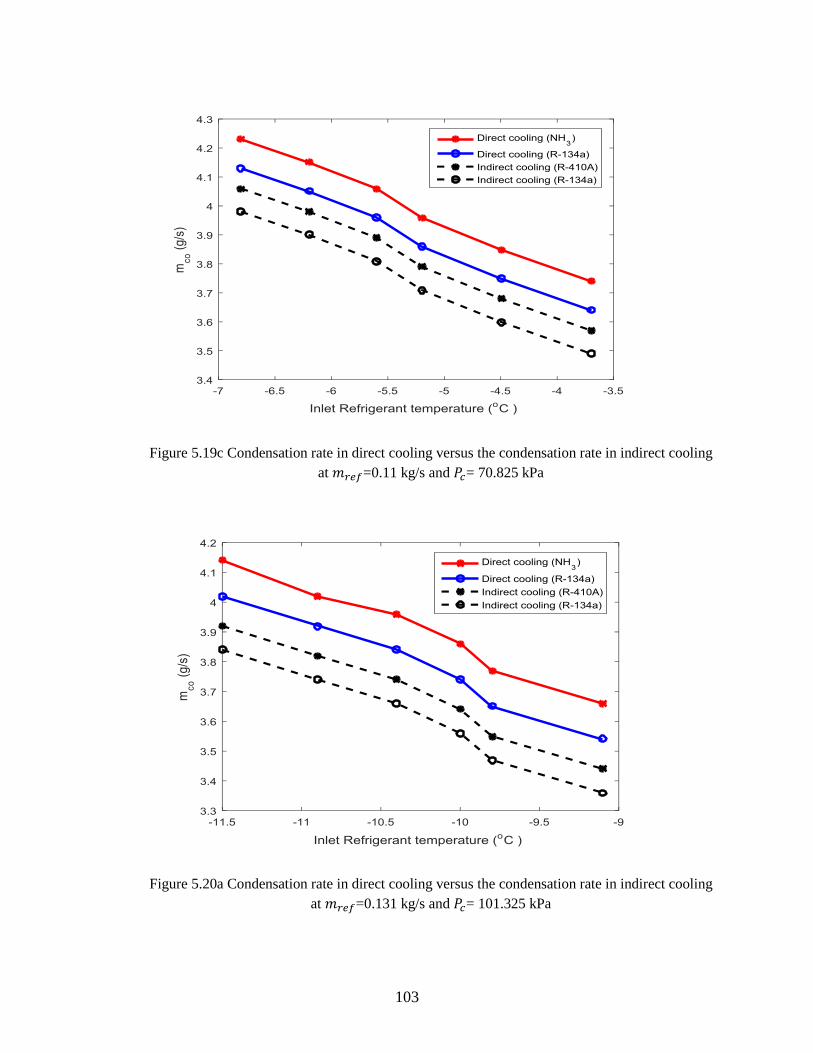
Figure 5.19c Condensation rate in direct cooling versus the condensation rate in indirect cooling
at 𝑚𝑟𝑒𝑓=0.11 kg/s and 𝑃𝑐= 70.825 kpa………………………………………………………. 103
Figure 5.20a Condensation rate in direct cooling versus the condensation rate in indircect cooling
at 𝑚𝑟𝑒𝑓=0.131 kg/s and 𝑃𝑐= 101.325 kPa…………………………………………………….. 103
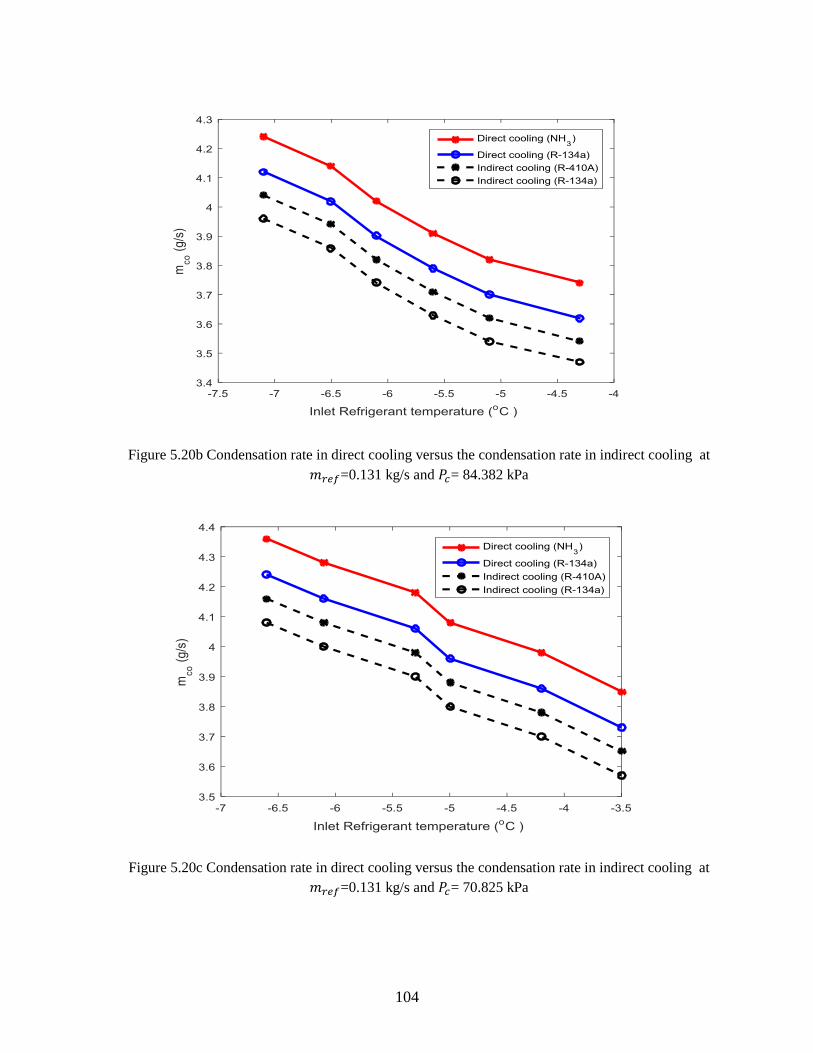
Figure 5.20b Condensation rate in direct cooling versus the condensation rate in indirect cooling
at 𝑚𝑟𝑒𝑓=0.131 kg/s and 𝑃𝑐= 84.382 kPa……………………………………………………… 104
Figure 5.20c Condensation rate in direct cooling versus the condensation rate in indirect cooling
at 𝑚𝑟𝑒𝑓=0.131 kg/s and 𝑃𝑐= 70.825 kPa……………………………………………………… 104
Page 14
xiv
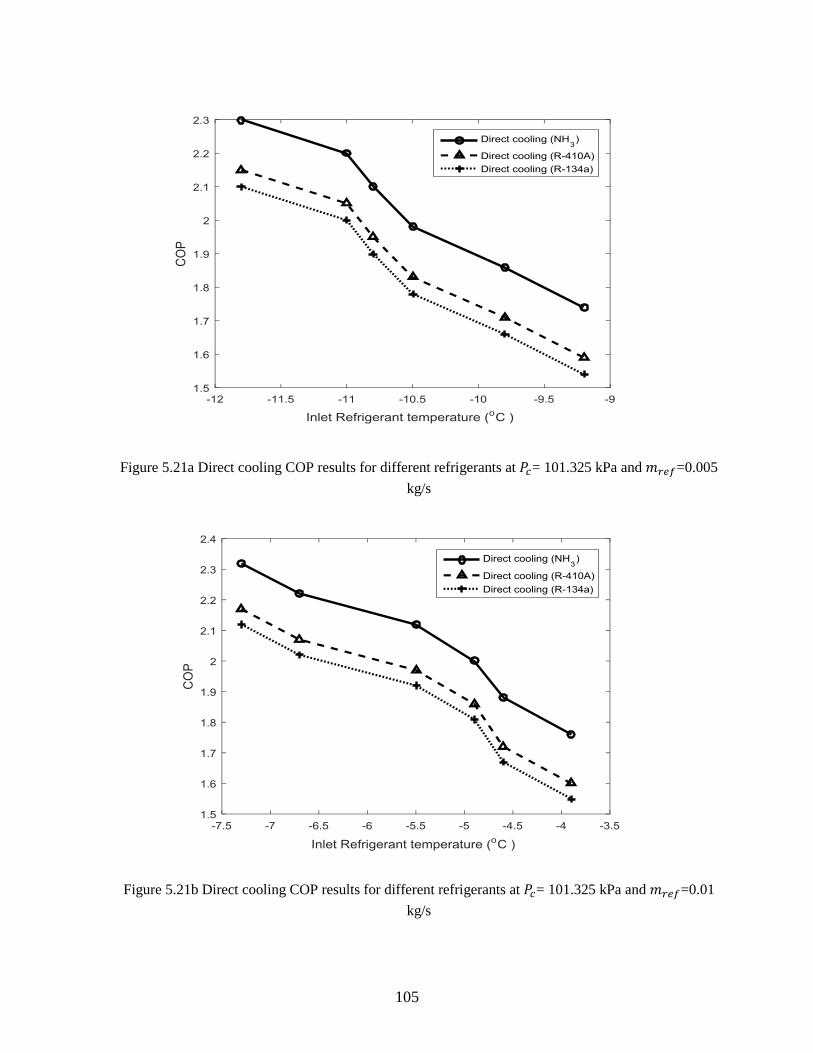
Figure 5.21a Direct cooling COP results for different refrigerants at 𝑃𝑐= 101.325 kPa and
𝑚𝑟𝑒𝑓=0.005 kg/s……………………………………………………………………………... 105
Figure 5.21b Direct cooling COP results for different refrigerants at 𝑃𝑐= 101.325 kPa and
𝑚𝑟𝑒𝑓=0.01 kg/s………………………………………………………………………………. 105
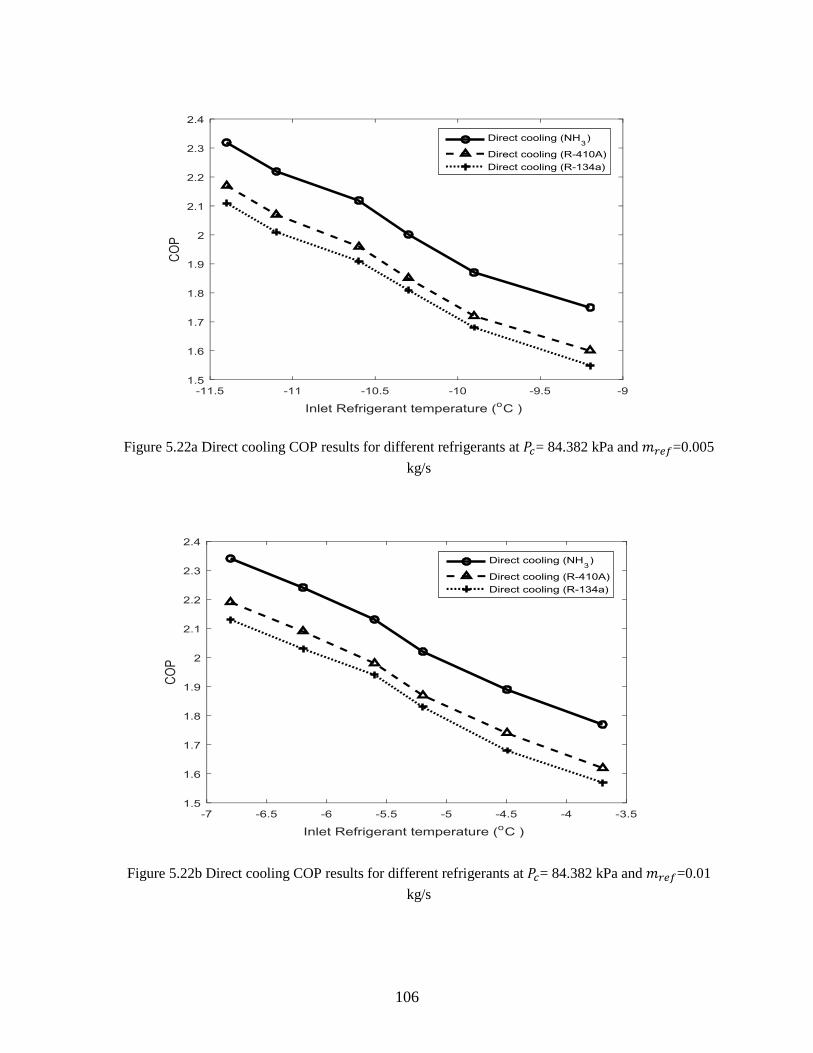
Figure 5.22a Direct cooling COP results for different refrigerants at 𝑃𝑐= 84.382 kPa and
𝑚𝑟𝑒𝑓=0.005 kg/s……………………………………………………………………………. 106
Figure 5.22b Direct cooling COP results for different refrigerants at 𝑃𝑐= 84.382 kPa and 𝑚𝑟𝑒𝑓=0.01
kg/s……………………………………………………………………………………………. 106
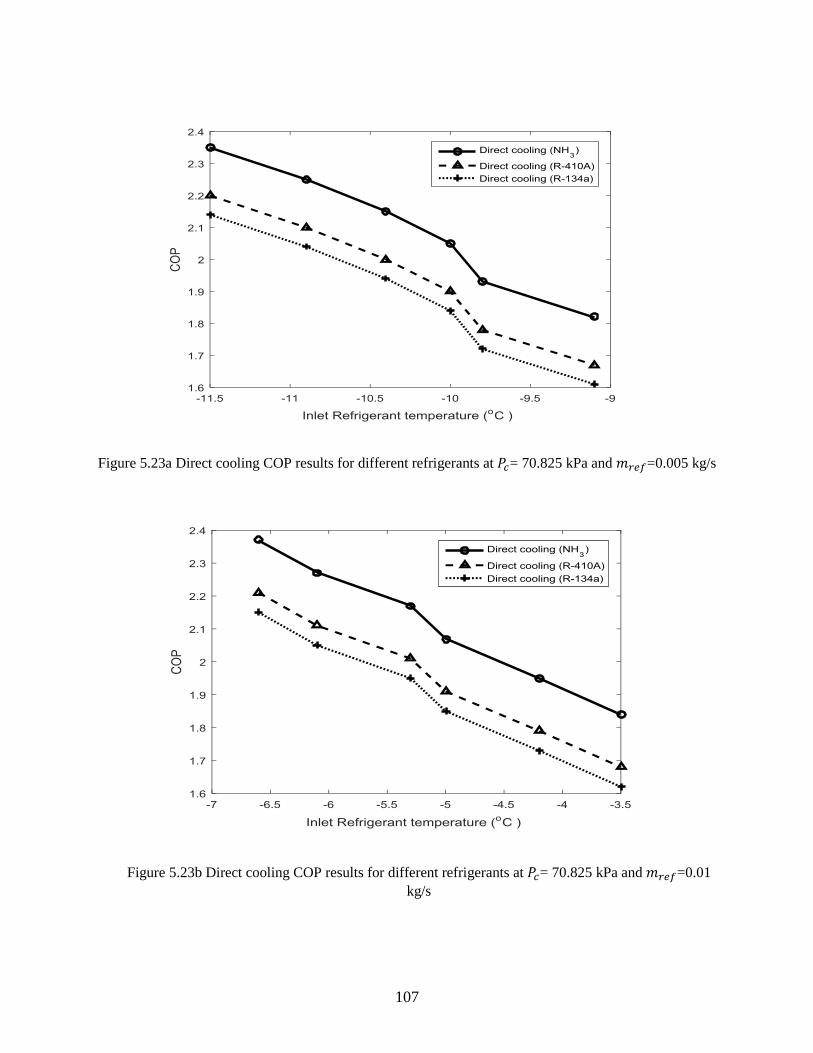
Figure 5.23a Direct cooling COP results for different refrigerants at 𝑃𝑐= 70.825 kPa and
𝑚𝑟𝑒𝑓=0.005 kg/s……………………………………………………………………………. 107
Figure 5.23b Direct cooling COP results for different refrigerants at 𝑃𝑐= 70.825 kPa and 𝑚𝑟𝑒𝑓=0.01
kg/s……………………………………………………………………………………………. 107
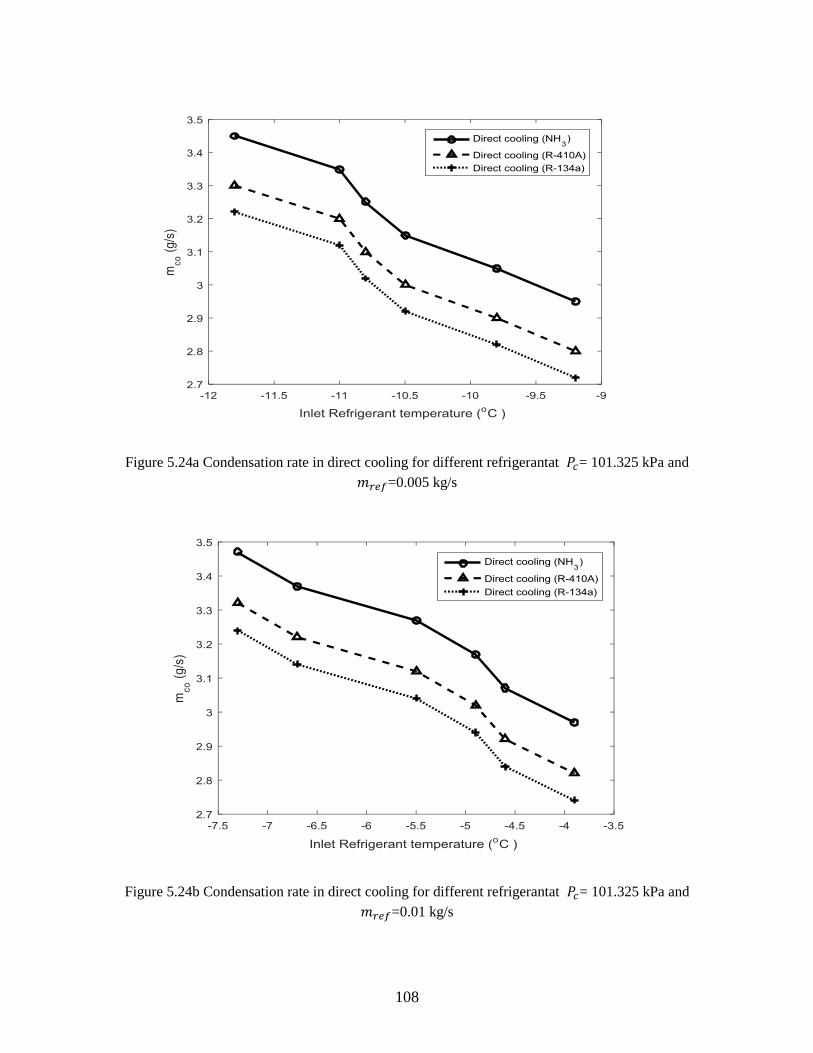
Figure 5.24a Condensation rate in direct cooling for different refrigerantat 𝑃𝑐= 101.325 kPa and
𝑚𝑟𝑒𝑓=0.005 kg/s……………………………………………………………………………… 108
Figure 5.24b Condensation rate in direct cooling for different refrigerantat 𝑃𝑐= 101.325 kPa and
𝑚𝑟𝑒𝑓=0.01 kg/s……………………………………………………………………………….. 108
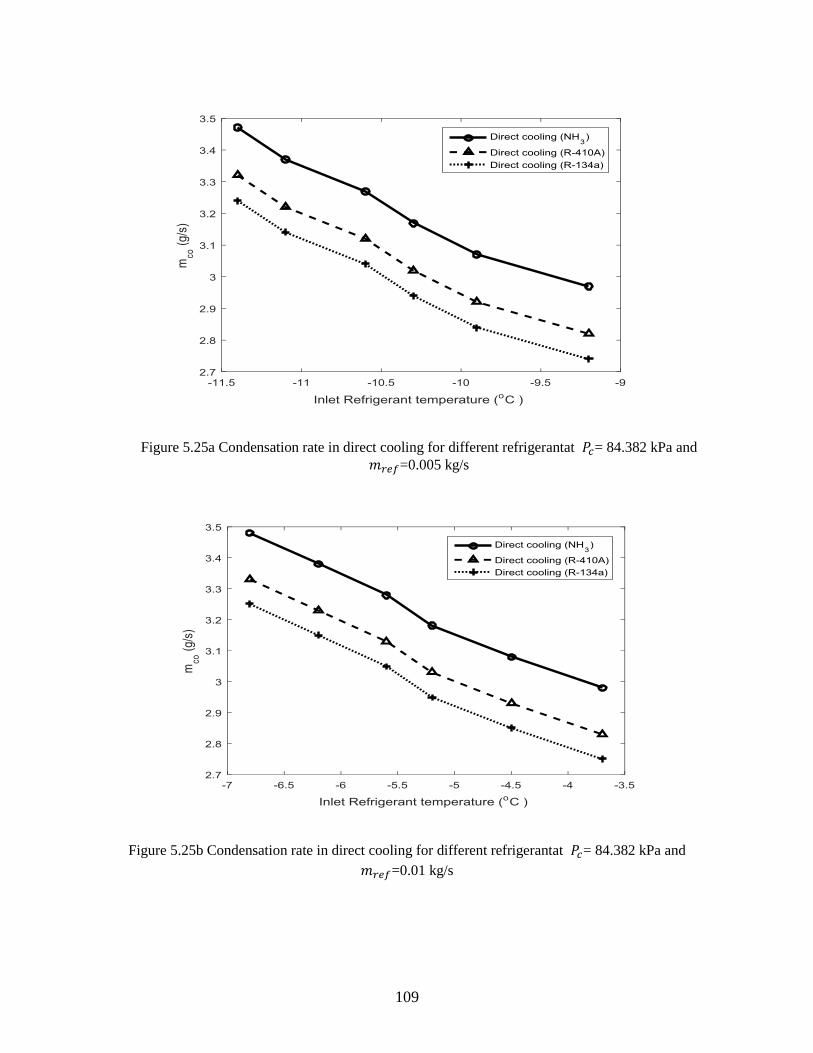
Figure 5.25a Condensation rate in direct cooling for different refrigerantat 𝑃𝑐= 84.382 kPa and
𝑚𝑟𝑒𝑓=0.005 kg/s……………………………………………………………………………… 109
Figure 5.25b Condensation rate in direct cooling for different refrigerantat 𝑃𝑐= 84.382 kPa and
𝑚𝑟𝑒𝑓=0.01 kg/s………………………………………………………………………………. 109
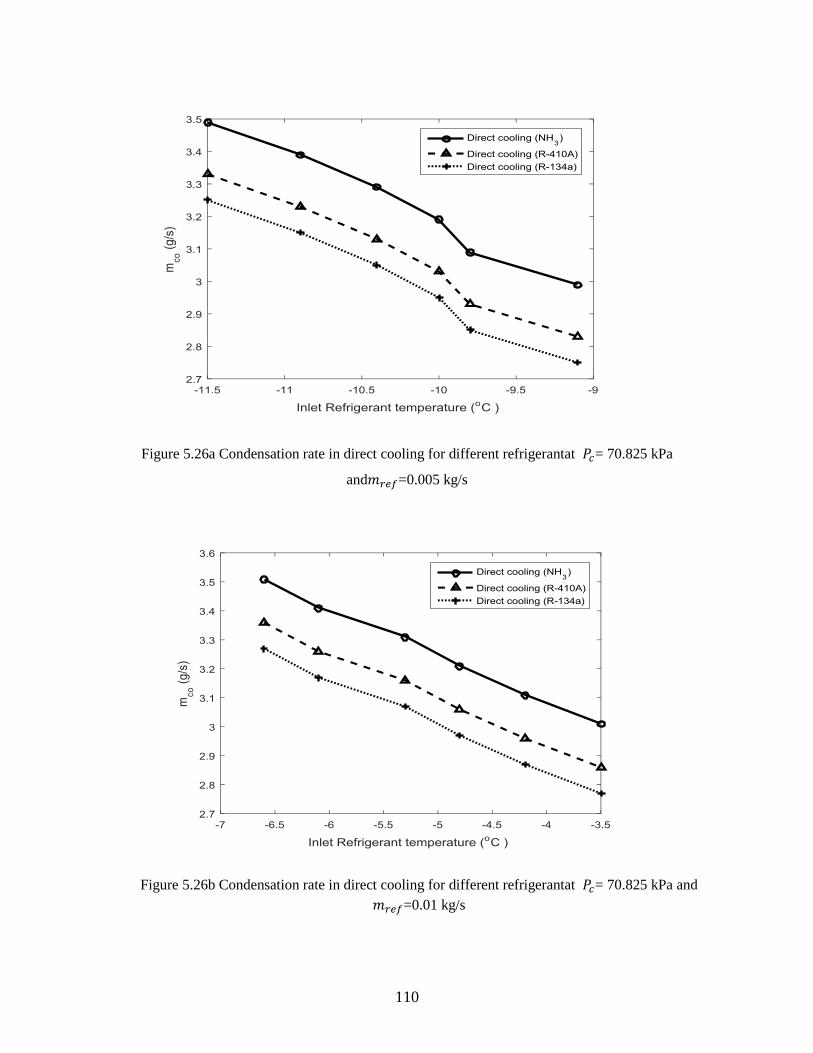
Figure 5.26a Condensation rate in direct cooling for different refrigerantat 𝑃𝑐= 70.825 kPa
and𝑚𝑟𝑒𝑓=0.005 kg/s…………………………………………………………………………. 110
Figure 5.26b Condensation rate in direct cooling for different refrigerantat 𝑃𝑐= 70.825 kPa
and𝑚𝑟𝑒𝑓=0.01 kg/s…………………………………………………………………………… 110
Figure 6.1 a schematic of a simple steam power plant with air-cooled condenser………….. 114
Figure 6.2 T-s diagram of the reference steam power plant…………………………………… 114
Figure 6.3 a schematic of proposed integrated system………………………………………. 115
Figure 6.4 T-s diagram of combined system………………………………………………….. 116
Page 15
xv
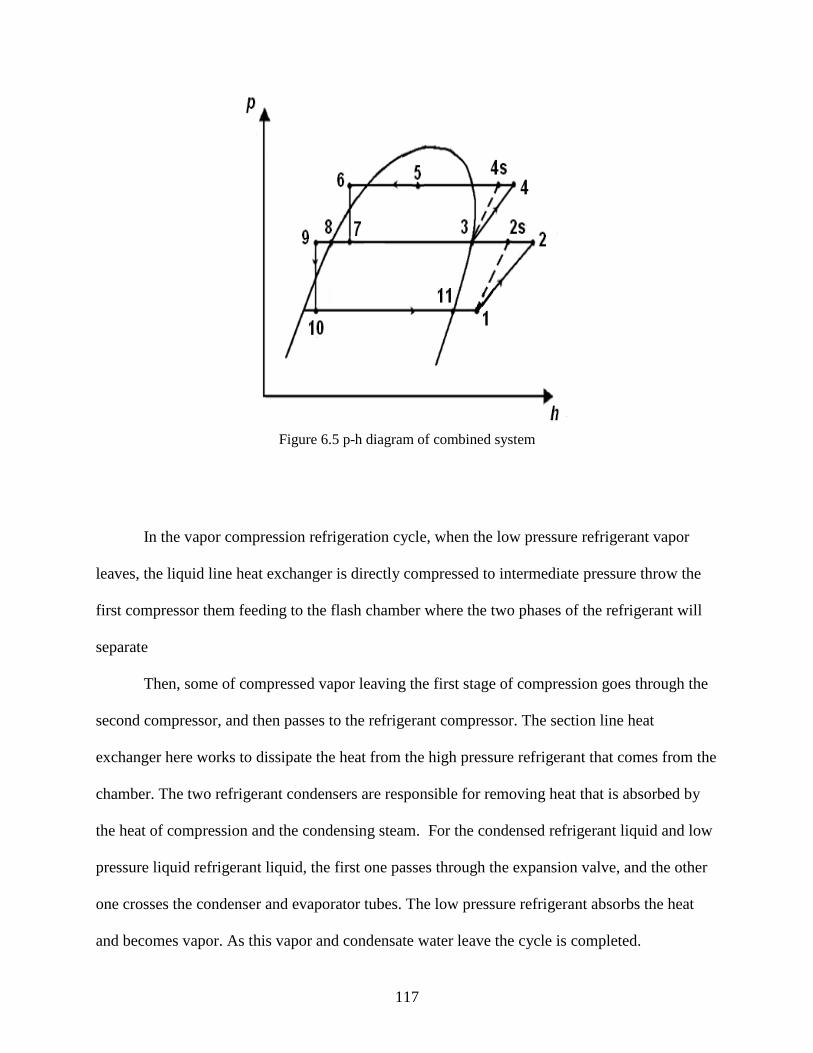
Figure 6.5 p-h diagram of combined system………………………………………………….. 117
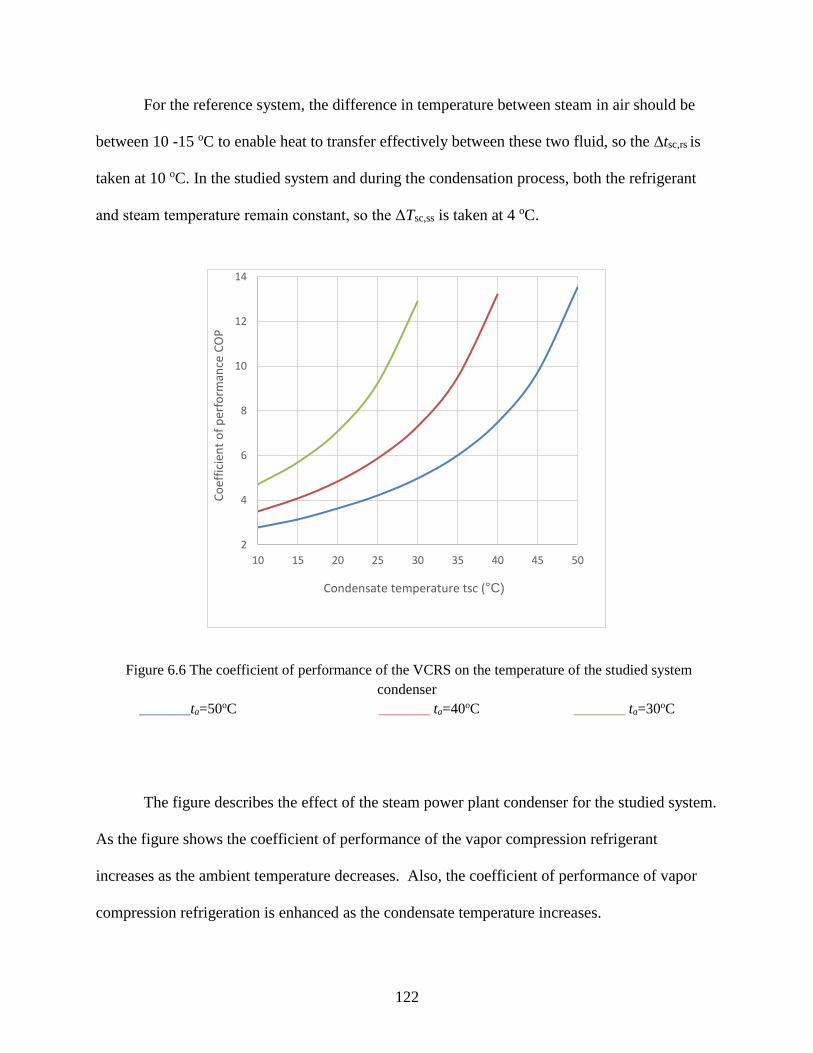
Figure 6.6 The coefficient of performance of the VCRS on the temperature of the studied system
condenser…………………………………………………………………………………….. 122
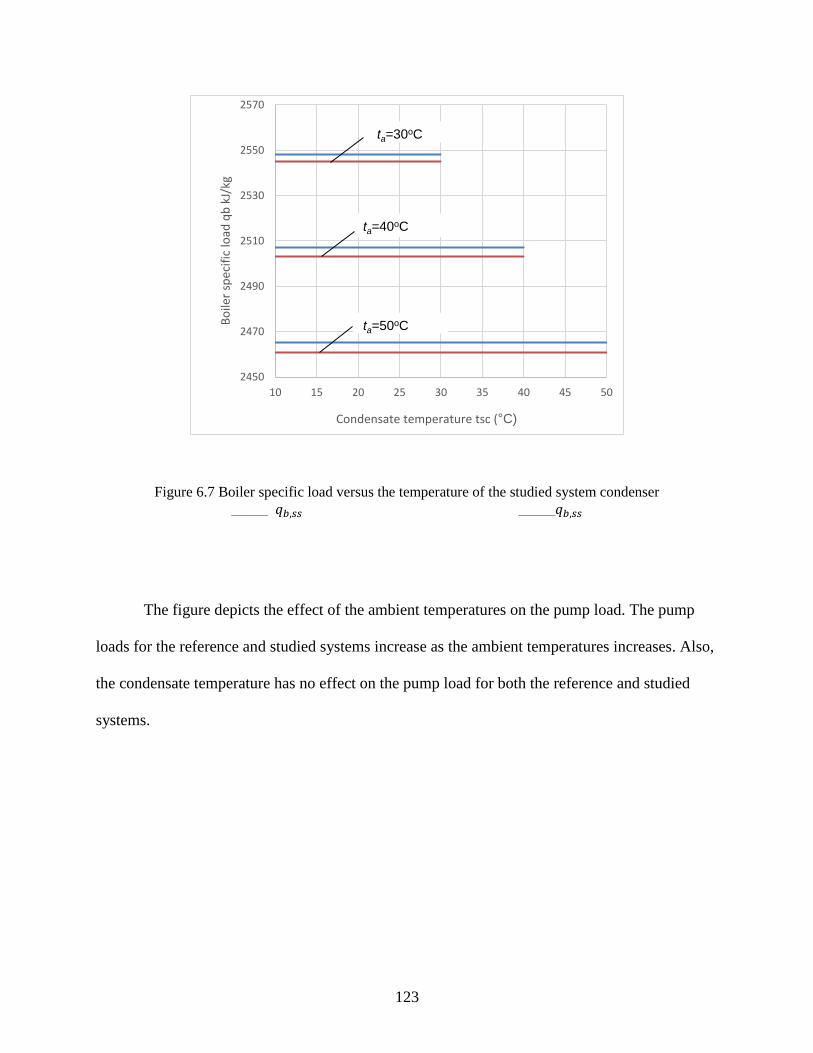
Figure 6.7 Boiler specific load versus the temperature of the studied system condenser……. 123
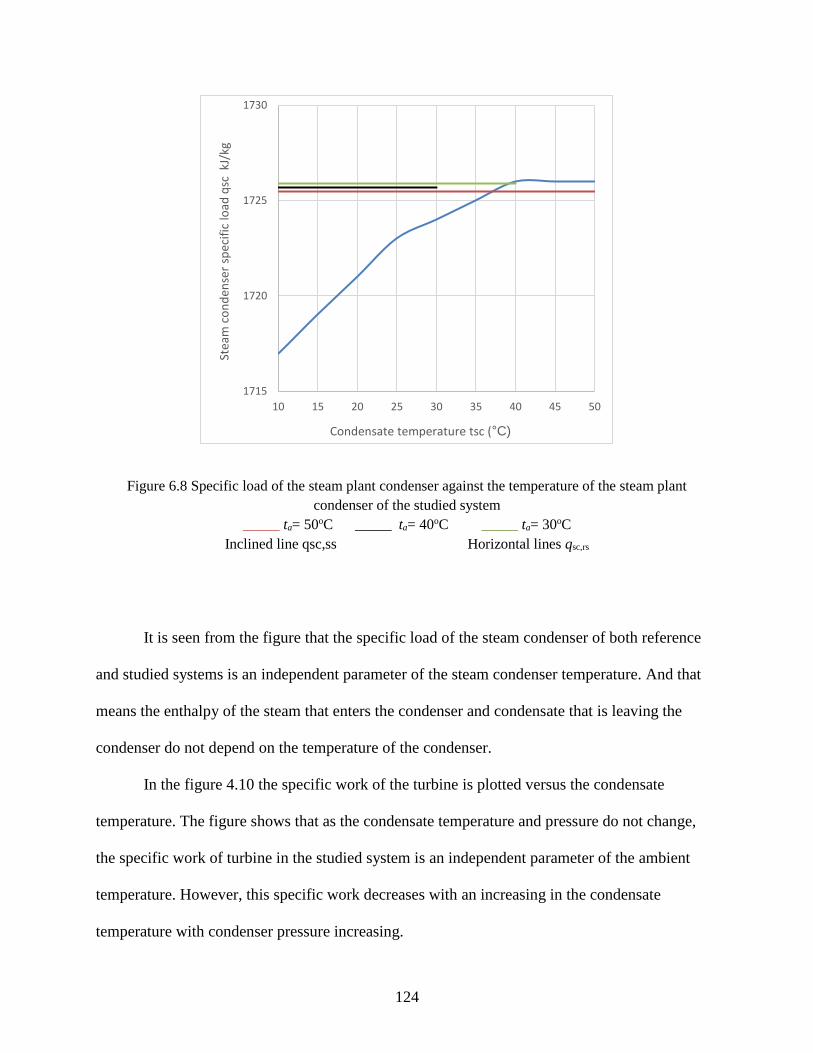
Figure 6.8 Specific load of the steam plant condenser against the temperature of the steam power
plant condenser of the studied system………………………………………………………... 124
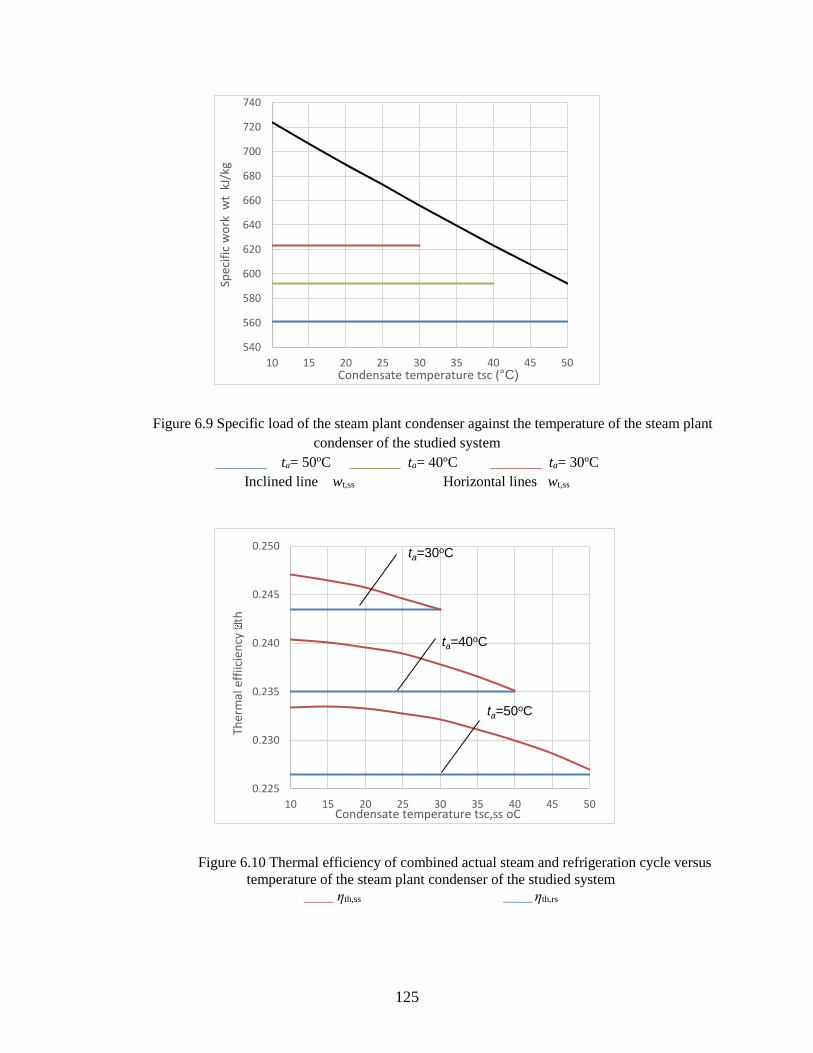
Figure 6.9 Specific load of the steam plant condenser against the temperature of the steam plant
condenser of the studied system……………………………………………………………… 125
Figure 6.10 Thermal efficiency of combined actual steam and refrigeration cycle versus
temperature of the steam plant condenser of the studied system……………………………. 125
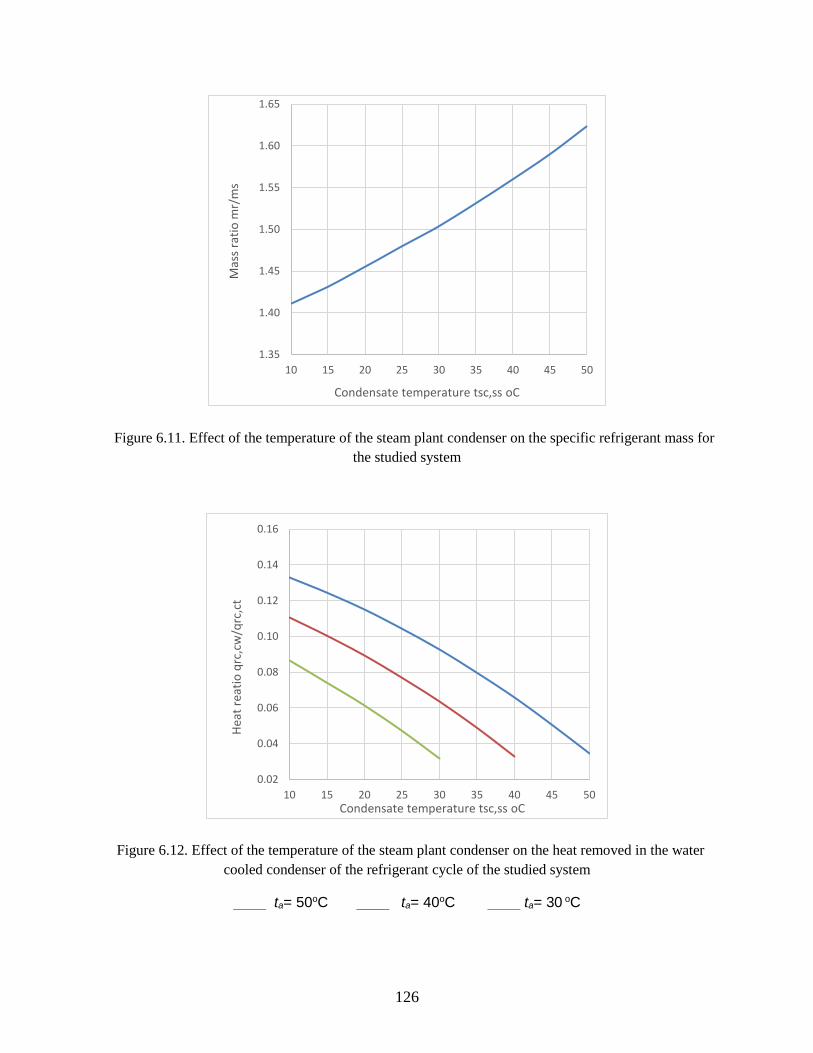
Figure 6.11 Effect of the temperature of the steam plant condenser on the specific refrigerant mass
for the studied system ……………………………………………………………………….. 126
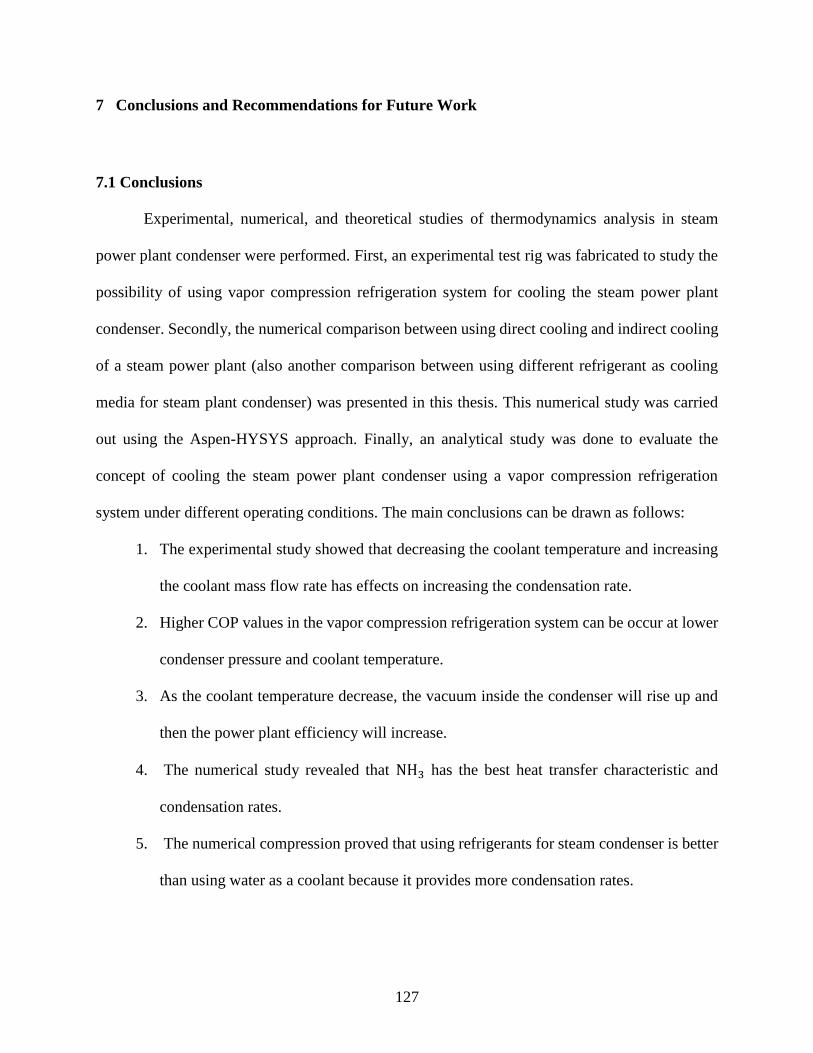
Figure 6.12 Effect of the temperature of the steam plant condenser on the heat removed in the
water cooled condenser of the refrigerant cycle of the studied system……………………… 126
Page 16
xvi
KEY TO SYMBOLS AND ABBREVIATIONS
Nomenclature
Asur Total heat transfer area at a given control volume
Amv Mean void area in the vapor space
Avd Cross-sectional area of the vapor duct
Cpcl Specific heat of the coolant
Cvg Vapor shear correction term
Cr Parameter defined by equation (3.40)
COP Coefficient of performance
D Diffusion coefficient
dout Outer tube diameter
din Inner tube diameter
ein Exergy per unit mass entering the control volume
eout Exergy per unit mass exiting the control volume
Ein Flow of the exergy into the control volume
Eout Flow of the exergy out of the control volume
Ed Destruction of exergy
F Inundation correction factor
g Gravity
ℎ𝑖𝑛 Convective heat transfer coefficient of the coolant
Page 17
xvii
ℎ𝑜𝑢𝑡 Convective heat transfer coefficient of the condensate
ℎ𝑎 Convective heat transfer coefficient of the non-condensable
ℎ𝑠,𝑖𝑛 Enthalpy of the steam entering the condenser
ℎ𝑠,𝑜𝑢𝑡 Enthalpy of the condensate exiting the condenser
ℎ𝑓𝑔 Latent heat of vaporization
ℎ𝑓𝑔∗ Modified latent heat of vaporization
ℎ0 Specific enthalpy evaluated at dead state conditions
𝑛 Row number of the tubes from the top of the tube bundle
𝐾𝑐𝑙 Thermal conductivity of the coolant
𝐾𝑚𝑒𝑡𝑎𝑙 Thermal conductivity of the tube material
𝐾𝑐𝑠 Thermal conductivity of the condensate
𝐿 Length of the condenser tube
LMTD Log Mean Temperature Difference
m Mass
��𝑎 Non-condensable gases mass flow rate
��𝑐𝑙 Coolant mass flow rate
��𝑐𝑠 Condensation flow rate
��𝑠 Steam mass flow rate
��𝑣 Mass velocity
𝑁 Number of tubes inside the condenser
𝑁𝑢𝑐𝑙 Nusselt number of the coolant
Page 18
xviii
𝑁𝑢𝑐𝑠 Nusselt number of the condensate
𝑁𝑇𝑅 Number of tubes in each row
𝑃𝑐 Condenser pressure
∆𝑃𝑐 Steam exhaust resistance or pressure drop inside the condenser
𝑃𝑠 Steam pressure
𝑃𝑎 Air (non-condensable gases) pressure
𝑃𝑣𝑎𝑐 Vacuum pressure
𝑃𝑎𝑡𝑚 Atmospheric pressure
𝑃𝑟𝑐𝑙 Prandtl number of the coolant
𝑃𝑡 Tube pitch
𝑃𝑇 Power of turbine
�� Heat transfer rate within the condenser
��𝑠 Heat transfer rate from the steam to the coolant
��𝑐𝑙 Coolant heat transfer rate
��𝑗 The rate of heat transfer across the control volume
𝑅𝑒𝑐𝑙 Reynolds number of the coolant
𝑅𝑒𝑚𝑖𝑥 Reynolds number of the mixture (steam/air)
𝑅𝑒𝑠 Reynolds number of the steam
𝑅𝑓𝑖𝑙𝑚,𝑖𝑛 Coolant film thermal resistance
𝑅𝑓𝑖𝑙𝑚,𝑜𝑢𝑡 Condensate film thermal resistance
𝑅𝑤𝑎𝑙𝑙 Wall thermal resistance
Page 19
xix
𝑅𝑎 Non-condensable gases thermal resistance
𝑅𝑡𝑜𝑡 Overall thermal resistance
𝑠 Specific entropy
𝑠0 Specific entropy evaluated at dead state conditions
t Temperature
T Absolute temperature
𝑇ℎ Hot stream temperature
𝑇𝑐 Cold stream temperature
𝑇𝑠𝑎𝑡 Saturated temperature
𝑇𝑤𝑎𝑙𝑙 Wall temperature
𝑇𝑓𝑖𝑙𝑚 Film (condensate) temperature
𝑇𝑐𝑙,𝑖𝑛 Inlet coolant temperature
𝑇𝑐𝑙,𝑜𝑢𝑡 Outlet coolant temperature
𝑇𝑏 Bulk Temperature
𝑇0 Dead state temperature
u Flow velocity
𝑇𝑗 Temperature on the boundary
𝑈 Overall heat transfer coefficient
𝑉 Coolant flow velocity
𝑉∞ Free stream velocity
𝑤𝑡𝑠 Width of the tube sheet
Page 20
xx
��𝑐.𝑣 Work done by steam
Greek Symbols
𝜇𝑐𝑙 Dynamic viscosity of the coolant
𝜇𝑐𝑠 Dynamic viscosity of the condensate
𝜇𝑚𝑖𝑥 Dynamic viscosity of the mixture vapor/air
𝜌𝑐𝑙 Density of the coolant
𝜌𝑐𝑠 Density of the condensate
𝜌𝑚𝑖𝑥 Density of the mixture
𝜌𝑠 Density of the steam
��𝑐.𝑣 The rate of entropy production
𝜀 Relative content of the gas/energetic efficiency
𝜂𝑒𝑥 Exegetic efficiency
𝜂𝑚 Mechanical efficiency
𝜂𝑡ℎ Thermal efficiency
Subscripts
A Per unit area
a Ambient
atm Atmosphere
ac Air cooled
b Boiler
c Condenser
Page 21
xxi
cl Coolant
co Compressor
cs Condensate
e Evaporator
j Phase index
m Mixture (water liquid- vapor/air)
mt Metal
mv Mean void area in the vapor space
out Outlet
ref Reference
p Pump
r Refrigerant
rc Refrigerant condenser
s Steam
sat Saturation
sc Steam condenser
sc-re Steam condenser/refrigerant evaporator
ss Studied system
t Turbine
tot Total
V Per unit volume
Page 22
xxii
v Vapor
vac Vacuum
w Wall
wc Water cooled
Abbreviation
ACCS Air cooled condenser system
LLSL-HX Liquid- line suction heat exchanger
SPP Steam power plant
SPPC Steam Power Plant Condenser
VCRC Vapor compression refrigeration cycle
VCRS Vapor compression refrigeration system
Page 23
1
1 Introduction to the Steam Power Plant
1.1 The Rankine Cycle and the Steam Power Plant
Steam power plants represent the largest segment of the world’s electricity production. With
developing and foreseeable shortages of adequate water sources in the arid regions and increasing
regulatory restrictions, alternate technologies are being sought for heat rejection. The U.S.
Environmental Protection Agency has recently proposed that power plants that consume more than
7.6 x 10⁶ L/day of water for cooling (equivalent plant capacity >250 MW) must consider alternate
technologies to determine the best available technology for rejecting the waste heat. The steam
condenser is an essential part of a steam power plant. Steam condensation occurs in a steam
condenser using either wet cooling, dry cooling, or a combination of both. Use of wet cooling
results in a detrimental impact on the environment, so that its implementation has been recently
limited in the USA. Yet, industry is reluctant to adopt dry cooling technology as the process of
choice due to higher initial costs and a slight loss of efficiency, especially at higher ambient air
temperatures.
The steam power plant works based on a Rankine cycle, which is the thermal cycle that
converts heat into work. Figure 1 shows a schematic view of a steam power plant configuration,
and Figure 1.2 shows the T-S diagram for the corresponding Rankine cycle. Steam condensation
occurs in the steam condenser by using either wet cooling, dry cooling or a combination of the
two.
Use of wet cooling results in a detrimental impact on the environment, so that its
implementation has been recently confined in the USA. In addition to increasing pollution, which
comes mainly from steam power plants concentrated around rivers, the cooling is very costly and
Page 24
2
gives rise to low thermal efficiency of the steam cycle. As a result, the need for finding new
alternative methods for cooling the steam condenser has emerged.
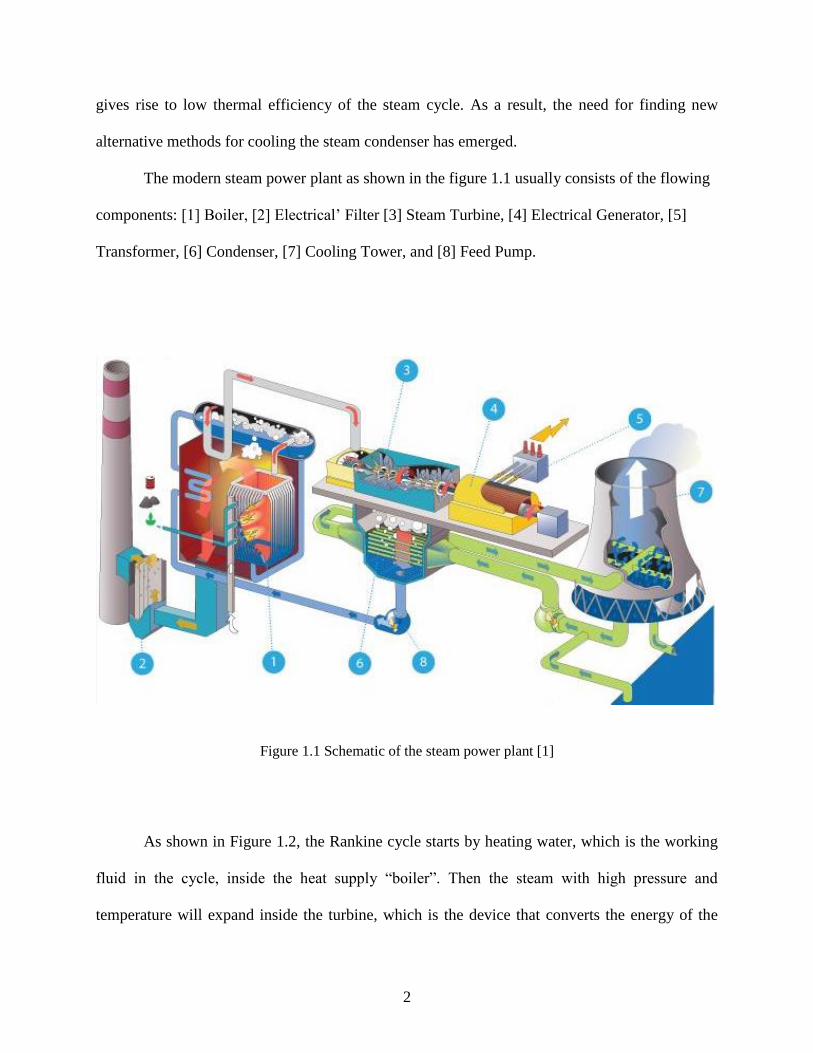
The modern steam power plant as shown in the figure 1.1 usually consists of the flowing
components: [1] Boiler, [2] Electrical’ Filter [3] Steam Turbine, [4] Electrical Generator, [5]
Transformer, [6] Condenser, [7] Cooling Tower, and [8] Feed Pump.
Figure 1.1 Schematic of the steam power plant [1]
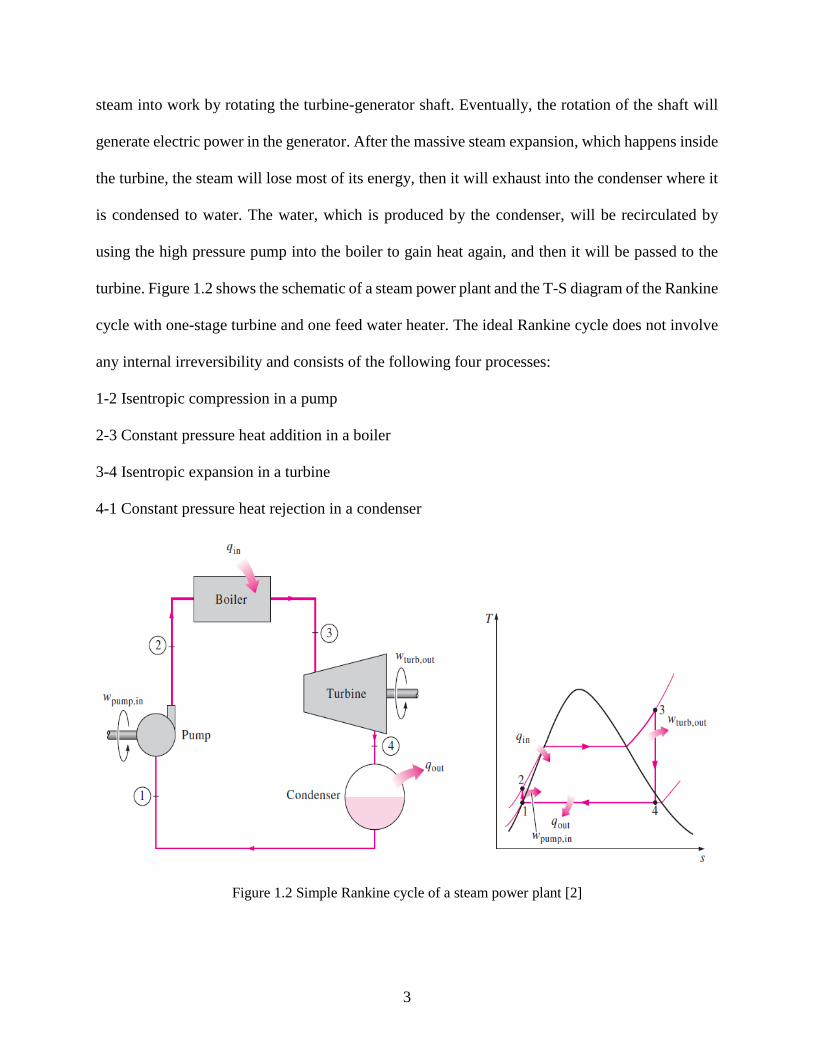
As shown in Figure 1.2, the Rankine cycle starts by heating water, which is the working
fluid in the cycle, inside the heat supply “boiler”. Then the steam with high pressure and
temperature will expand inside the turbine, which is the device that converts the energy of the
Page 25
3
steam into work by rotating the turbine-generator shaft. Eventually, the rotation of the shaft will
generate electric power in the generator. After the massive steam expansion, which happens inside
the turbine, the steam will lose most of its energy, then it will exhaust into the condenser where it
is condensed to water. The water, which is produced by the condenser, will be recirculated by
using the high pressure pump into the boiler to gain heat again, and then it will be passed to the
turbine. Figure 1.2 shows the schematic of a steam power plant and the T-S diagram of the Rankine
cycle with one-stage turbine and one feed water heater. The ideal Rankine cycle does not involve
any internal irreversibility and consists of the following four processes:
1-2 Isentropic compression in a pump
2-3 Constant pressure heat addition in a boiler
3-4 Isentropic expansion in a turbine
4-1 Constant pressure heat rejection in a condenser
Figure 1.2 Simple Rankine cycle of a steam power plant [2]
Page 26
4
In the ideal steam power plant cycles, it is assumed that the connection between other
components allow the working fluid to move between components by neglecting the intervening
changes in state. Since the pump, boiler, turbine, and the condenser are considered steady- flow
devices, we can analyze the processes that make up the Rankine cycle as the steady- flow process.
In the turbine, the steam expands reversibly and adiabatically. By applying the First Law of
Thermodynamic at steady- state condition we get
wt,out = hinlet(3) − hexit(4) (1.1)
Also, the power produced by the turbine to an external load (electrical generator) can be
calculated by using the following formula:
𝑃𝑇 = mswturb,out (1.2)
By applying the steady flow First Law of Thermodynamic, the steam generator load can be
obtained
qboiler,in = hexit(3) − hinlet(2) (1.3)
In the condenser where the heat rejection accurses, the phase usually changes according to the
amount of deception heat. By applying the steady- state First Law of Thermodynamics on the
fluids entering and leaving the condensers
qcon,out = hinlet(4) − hexit(1) (1.4)
As the condensation takes place in the condenser, the temperature of steam gets lower and the
coolant temperature rises
msqcon = mcCwater(Tout − Tin) (1.5)
Page 27
5
Depending upon the steady- state First Law of Thermodynamic, the pump work and power can
be calculated using the following equations:
wpump,in = hexit(2) − hinlet(1) (1.6)
𝑃𝑝 = mswp (1.7)
The net power produced by Rankine cycle is equal to the difference between the turbine power
and pump power. The pump power is very small in compression to the turbine, and this is one of
the others Rankine cycle advantages. The thermal efficiency of the Rankine cycle can be
calculated by using the following equation:
ηth =wnet
qin= 1 −
qout
qin (1.8)
1.1.1 Efficiency of the Steam Power Plant
Any small increase in thermal efficiency of a steam power plant can mean large savings from the
fuel requirements. Therefore, many efforts are made to improve the efficiency of the cycle. The
basic idea behind all the modifications to increase the thermal efficiency of a power cycle is the
same:
Increase the average temperature at which heat is transferred to the working fluid in the
boiler, or
Decrease the average temperature at which heat is rejected from the working fluid in the
condenser.
That is, the average fluid temperature should be as high as possible during heat addition and
as low as possible during heat rejection. There are three commonly practiced ways of improving
the Rankine cycle thermal efficiency.
Page 28
6
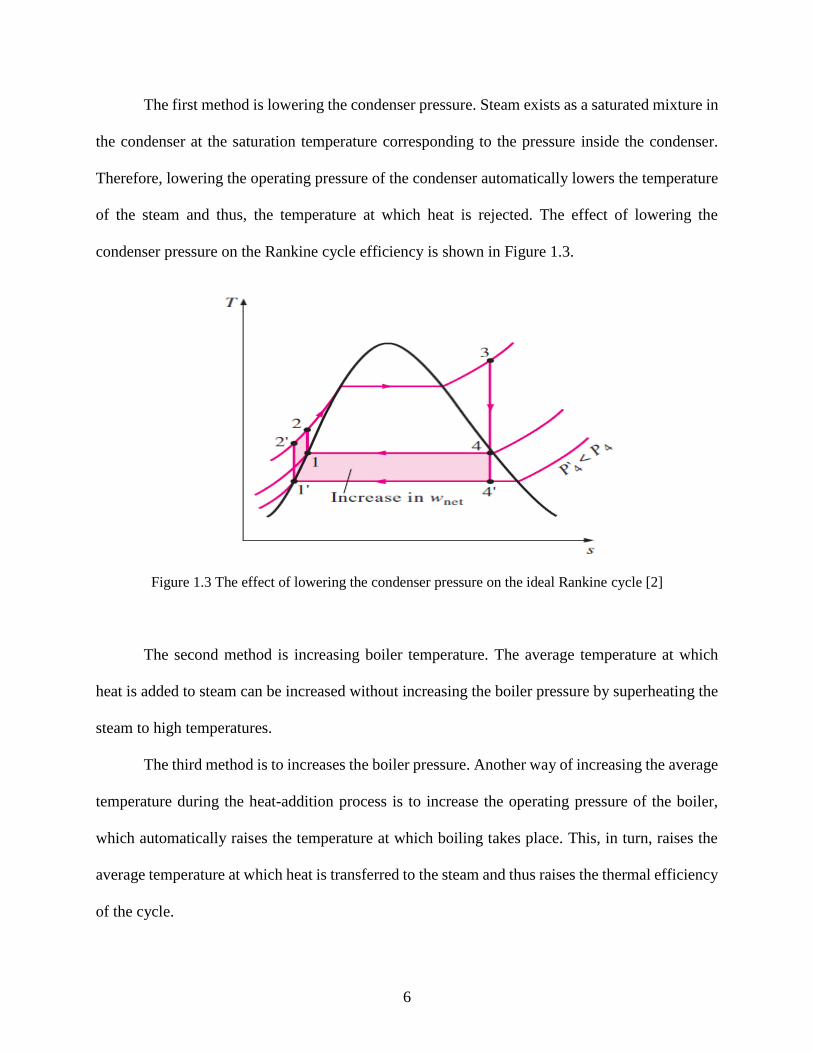
The first method is lowering the condenser pressure. Steam exists as a saturated mixture in
the condenser at the saturation temperature corresponding to the pressure inside the condenser.
Therefore, lowering the operating pressure of the condenser automatically lowers the temperature
of the steam and thus, the temperature at which heat is rejected. The effect of lowering the
condenser pressure on the Rankine cycle efficiency is shown in Figure 1.3.
Figure 1.3 The effect of lowering the condenser pressure on the ideal Rankine cycle [2]
The second method is increasing boiler temperature. The average temperature at which
heat is added to steam can be increased without increasing the boiler pressure by superheating the
steam to high temperatures.
The third method is to increases the boiler pressure. Another way of increasing the average
temperature during the heat-addition process is to increase the operating pressure of the boiler,
which automatically raises the temperature at which boiling takes place. This, in turn, raises the
average temperature at which heat is transferred to the steam and thus raises the thermal efficiency
of the cycle.
Page 29
7
1.2 Refrigeration and Heat Pump
Refrigeration and heat pump are two majors application area of thermodynamics. The
refrigerator is a cyclic device and use refrigerants as a working fluid. The main purpose of the
refrigerator and the heat pump is transferring heat from low- temperature region to high-
temperature one. However, we employ the refrigerant to maintain the refrigerated space at low
temperature, and the heat pump is employed to maintain the heated space at high temperature.
The refrigerator and the heat pump is shown schematically in the following chapter.
Air conditioning field, manufacture of ice, and reservation of foods are common
application of refrigeration. Each one of the previous applications need specific design to
maintain the require temperature. Each application requires a different temperature for the
refrigerated space, the determination of which is the first decision the engineers should make in
the design of a vapor compression refrigeration system.
Energy Source:
As we understand from the second law of thermodynamic that in order for the refrigeration
system to accomplished, the expense of work transfer from heat transfer from high-temperature
reservoir or work reservoir are needed.
Energy Sink:
The second law of thermodynamics also states that for the refrigeration system to operate
continuously, it needs to reject heat to an external reservoir.
Working Fluid and Cycle Selection:
Depending on the power cycle we can choose the working fluid. We usually need to look for the
best combination between the working fluid and cycle that will result in consume the minimum
power to produce the refrigeration.
Page 30
8
Component Selection:
Compressor is one of the most common component in the refrigeration cycle. The reciprocating
compressor and the centrifugal compressor are two general types of the compressor. The
centrifugal compressor are best adapted to high specific volumes and low pressure.
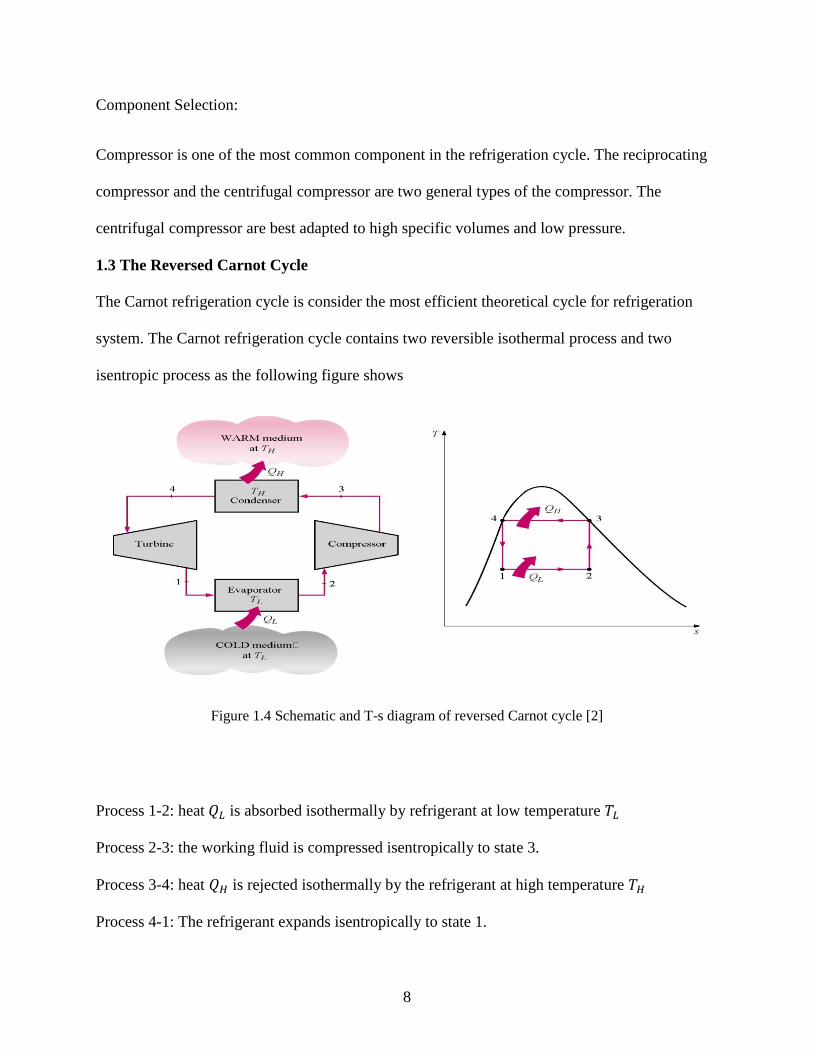
1.3 The Reversed Carnot Cycle
The Carnot refrigeration cycle is consider the most efficient theoretical cycle for refrigeration
system. The Carnot refrigeration cycle contains two reversible isothermal process and two
isentropic process as the following figure shows
Figure 1.4 Schematic and T-s diagram of reversed Carnot cycle [2]
Process 1-2: heat 𝑄𝐿 is absorbed isothermally by refrigerant at low temperature 𝑇𝐿
Process 2-3: the working fluid is compressed isentropically to state 3.
Process 3-4: heat 𝑄𝐻 is rejected isothermally by the refrigerant at high temperature 𝑇𝐻
Process 4-1: The refrigerant expands isentropically to state 1.
Page 31
9
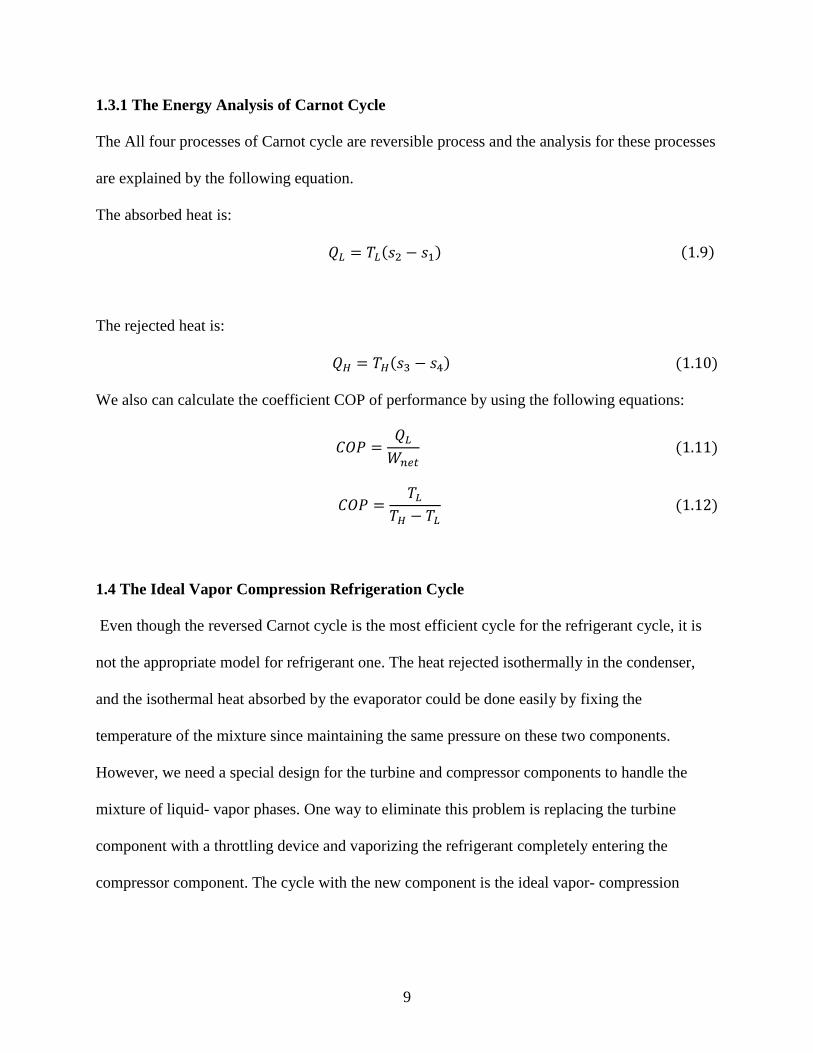
1.3.1 The Energy Analysis of Carnot Cycle
The All four processes of Carnot cycle are reversible process and the analysis for these processes
are explained by the following equation.
The absorbed heat is:
𝑄𝐿 = 𝑇𝐿(𝑠2 − 𝑠1) (1.9)
The rejected heat is:
𝑄𝐻 = 𝑇𝐻(𝑠3 − 𝑠4) (1.10)
We also can calculate the coefficient COP of performance by using the following equations:
𝐶𝑂𝑃 =𝑄𝐿
𝑊𝑛𝑒𝑡 (1.11)
𝐶𝑂𝑃 =𝑇𝐿
𝑇𝐻 − 𝑇𝐿 (1.12)
1.4 The Ideal Vapor Compression Refrigeration Cycle
Even though the reversed Carnot cycle is the most efficient cycle for the refrigerant cycle, it is
not the appropriate model for refrigerant one. The heat rejected isothermally in the condenser,
and the isothermal heat absorbed by the evaporator could be done easily by fixing the
temperature of the mixture since maintaining the same pressure on these two components.
However, we need a special design for the turbine and compressor components to handle the
mixture of liquid- vapor phases. One way to eliminate this problem is replacing the turbine
component with a throttling device and vaporizing the refrigerant completely entering the
compressor component. The cycle with the new component is the ideal vapor- compression
Page 32
10
refrigeration cycle. This cycle is usually used for air conditioning system, refrigerator and heat
pump.
1.5 The Actual Vapor Compression Refrigeration Cycle
Fluid friction and heat transfer the most common causes of irreversibility are the difference
between the ideal and actual vapor compression refrigeration cycle. In actual cycle, the very long
connection between the evaporator and compressor will lead to decrease the pressure by heat
transfer to the refrigerant from the surrounding and fluid friction. As a result, pressure drops and
specific volume increase. Because of increasing the specific volume the requirement power input
will increase.
Another difference between the ideal cycle and the actual cycle is the compression
process. In the ideal case the refrigerant is compressed isentropically (reversible and adiabatic),
however in the actual cycle the entropy increases by heat transfer and frictional effects.
In the ideal cycle, the refrigerant leaves the condenser in saturated liquid phase, but
taking the fluid friction affects and heat transfer in account can change the leaving refrigerant
phase. Also, in reality the refrigerant got subcooled before entering the expansion valve.
Therefore, the enthalpy of refrigerant in refrigerant decrease and the absorption of heat increases.
The ordinary vapor- compression refrigeration system has several advantage such as
maintenance- free, simple, reliable and inexpensive. For these reasons the simple vapor
refrigeration system is widely used, and it is sufficient for most of refrigeration applications.
While the simple vapor compression refrigeration system is not the appropriate one for large
industrial and other applications. Therefore, some innovations were done to meet industrials
requirements.
Page 33
11
1.6 Cascade Refrigeration System
The temperatures that some industrial applications needed are too large comparing to those
usually single vapor compression refrigeration involves. Therefore, low temperatures one of
other requirements that the ordinary vapor refrigeration system cannot introduce it into large
industrial applications. Cascade refrigeration cycle which consist of two or more refrigeration
cycle is the one way can used to deal with this situation.
The figure shows the two stage cascade refrigeration system. In this system, the heat exchanger,
which works as evaporator for the first cycle and as condenser for another one, connects the two
cycle in the middle. The ratio of mass flow rate and coefficient of performance for cascade can
be calculated using the following equations:
1.7 Multistage Compression Refrigeration System
The research managed some improvement on the cascade refrigeration system by replacing the
heat exchanger with a flash chamber, which has better heat transfer characteristic, and called it
the multistage compression refrigeration system.
In the multistage compression refrigeration system, the refrigerant liquid leaving the
condenser passing to the flash chamber through the first expansion valve. Since the flash
chamber has very good heat transfer characteristics, part of the liquid vaporize during that
process. The saturated vapor mixes with the superheated refrigerant that comes from low
pressure compressor. While the refrigerant liquid that leaves the flash chamber passes to
evaporator during the second expansion valve.
Page 34
12
1.8 Multipurpose Refrigeration System with a Single Compressor
When the applications need the refrigerants at different temperatures, the used system in this
situation should contains two separate expansion valves and as well as the compressors. Such a
system has two compressor will be uneconomical, some practical studies prefer to use a single
compressor and route all the compression process.
Page 35
13
2 The Objective of this Present Work and Literature Review
2.1. Problem Definition
In the current proposed work an alternate method (other than water or air) for cooling the steam
power plant’s condenser will be investigated theoretically, numerically, and experimentally. The
proposed method is a condenser-configuration using refrigerant in a closed-loop-cycle. The
refrigeration will be a vapor compression cycle. The vapor compression refrigeration cycle system
is a highly well-established technology forming the basis of many important industrial and
agricultural and household applications. Amongst these the heat pumping (cooling and/or heating
production), gas compression, air liquefaction, and separation and cryogenics. The power of
industrial vapor compression units ranges from less than 1 kW to above 100MW. There is vast
literature on the thermo-fluids-heat exchange analysis and principles of simple as well as modified
vapor compression refrigeration cycles used in industry.
The main goal of this proposed work is to test the feasibility and verify the proposed idea of
using a vapor compression refrigeration cycle as a condenser coolant, thereby replacing the
environmentally polluting conventional water cooling and the low efficiency and costly air cooling
methods. The current proposed project will also be able to compare the use of different refrigerants
on the basis of performance, cost, and environmental impact with the conventional water and air
cooling systems.
Hence, the objectives of the current proposal specifically are:
a) To develop a 1-D empirical-based theory for the thermal and fluid flow analyses, taking into
consideration the operating conditions of the power plant steam cycle and environment
Page 36
14
b) To create programmable algorithms, based on the analyses, for predicting the refrigeration
cycle’s performance under different operating conditions of the steam power plant cycle and
environment and when using different refrigerants
c) To conduct experiments on a model refrigerant-cooled-condenser, then to verify, supplement,
and complement the results obtained through the theoretical and numerical analysis and to
demonstrate the feasibility of integrating the refrigeration cycles into the condenser of the
steam power plant
d) To conduct cost analyses for the refrigerant cooled condenser
e) To be able to design and optimize a cost effective refrigerant-cooled-condenser unit for a
specific steam power plant using the knowledge gained.
One of the very important components in any steam power plant is the condenser. It receives
exhaust steam from turbine and condensates the vaporization by rejecting its heat to the cooling
fluids that pass through the condenser tubes. In the condensing of steam, a vacuum is created. The
vacuum reduces the backpressure on the turbine, and this reduction in backpressure increases the
efficiency of the turbine.
There are two types of the steam power plant condensers: direct contact condensers and
surface contact condensers. In the direct contact condensers, the exhaust steam from the turbine is
cooled by mixing it with the coolant. Whereas, the cooling fluid passing through a sort of tubes in
the surface contact condensers. According to the coolant perspective, the surface contact
condensers (commonly used in the modern power plant) can be classified into wet cooled
condensers, dry-cooled condensers, and hybrid condensers.
This chapter also provides some studies on steam power plant cooling, steam power plant
condensers, and configurations dry cooling of steam power plant condensers that are drawn from
Page 37
15
journals, books, conferences, academic theses, and workshop reports. Also, the most updated
research on the factors that may affect the performance of dry-cooled condensers will be passed.
2.2 Studies on Steam Power Plant Condenser
In all power plants a large amount of heat has to be rejected by cooling via the condenser in order
to sustain the thermodynamic cycle. Power plant cooling has been improved because it has a
direct effect on the power plant efficiency. Conventional, power-plant, cooling-system
recirculated, cooling water is sprayed over a horizontal tube bundle, while air is drawn over the
bundle and steam in the turbine is condensed.
Wie et al. [7] designed and analyzed the variable working condition evaporative condenser
for steam condensing of a steam feeding water pump for a 1000 MW air- cooled unit. The results
showed that the condensing temperature decreased as the water flow decreased and the wind
velocity increased; the water evaporation capacity increased as the wind velocity increased.
Parker and Treybal’s model (the first practical design used to evaluate the evaporative
coolers) was employed to detect the relationship between mass and heat transfer at the fluid’s
interfaces.
A new way to improve power plant efficiency with varying the condenser pressure was
inducted by Vosough et al. [13]. They analyzed the energy and exergy for ideal Rankine cycle
with reheat. The study showed that the condenser pressure played a prominent role in changing
power plant exergy efficiency where the maximum energy losses mainly occurred in the
condenser.
Najjar and Abubaker [11] investigated a new system for inlet air cooling called the indirect
evaporative cooling system. A combination of a humidifier and vapor compression are included
in this system. The results of this study revealed that this new system was able to cool down and
Page 38
16
decrease the relative humidity in hot humid weather. Therefore, the IECS system played an
essential role in increasing the power plant efficiency.
A numerical investigation of water spray for inlet air pre-cooling to enhance the
performance in Natural Draft Dry Cooling Towers was performed by Alkheadhair et al. [12]. They
generated a 3-D model numerical model to analyze the evaporation through a single nozzle. The
model analyzed showed that spraying water into the inlet air can improve cooling by increasing
the heat transfer rate. Also, the air velocity has an essential influence on droplet evaporation and
transport. Moreover, the correct nozzle arrangement plays an important role to improve cooling.
In this section, a review for both cooling methods (wet-cooling condenser and dry-cooling
condenser) will be accomplished.
2.2.1 Studies on the Wet Cooling of a Steam Power Plant Condenser
Several researches discussed the effect of cooling-water flow rates on the power plant’s costs and
efficiencies. Anozie and Odejob [17] developed a theoretical study for simulation of a model for
a thermal power plant with different rates of circulation condenser cooling water flow. The goals
of this study was find the relationship between the flow rate and power plant efficiency, heat
transfer area requirement, the operating cost of plant, and the fuel consumption. The study showed
that minimizing the cooling-water flow rates reduces the heat transfer area and, therefore, the
condenser size and annualized power plant’s capital coast decreasing. Also, the analysis of the
thermal power plant showed that decreasing the cooling mass flow rate decreases the fuel
consumption with a slight increase in the power plant efficiency.
Haseli et al. [18] introduced a theoretical study to evaluate the optimum temperatures of
cooling water during condensation in a shell and tube through minimization of exergy destruction.
The optimization results showed that (as the steam mass flow rates increases) the optimal inlet
Page 39
17
cooling water temperature and exergy efficiency decrease, whereas exergy destruction increases.
However, the results are higher for optimum values at higher condensation temperature in
compression with the lower condensation temperature.
The condensation heat transfer for ammonia-water mixture in horizontal single pass shell
and tube water cooled condenser was experimentally determined by Philpott and Deans [20]. The
reason for adding ammonia is to enhance heat transfer rate in pure steam condensation. The results
revealed that the condensate film disturbances increased the heat transfer through the film.
However, the heat transfer enhancement was partially offset because of adding the thermal
resistance of the vapor film, producing higher local condensation heat transfer coefficients of that
predicted for pure steam only. The Marangoni effect (surface tension gradient along the
condensation film) caused that enhancement and produced a disturbed, turbulent banded
condensate film.
A modeling of steam condensation from the steam-air mixture in the inclined tubes of an
air-cooled condenser was analyzed by Artemov et al. [19]. They stated that the value of the heat
transfer coefficient controls the calculation of the effective coefficient of heat transfer.
A new equation to calculate the distribution temperature and velocity was derived by
Dukler [25]. He calculated the condensing heat transfer coefficients; he also numerically calculated
the liquid film thickness at the turbulent region with low Reynolds numbers.
Yousef et al. [26] investigated a compression analytical study using water and R-134a as
cooling medium in the condenser of a steam power plant. The results showed that R-134a generates
a higher condensation and heat transfer rate than water and, therefore, increases the cycle
efficiency. In addition, using R-134a instead of water decreases the size of the condenser and
increases its life time.
Page 40
18
2.2.2 Studies on Dry/Air cooling of a Steam Power Plant Condenser
Because of the enhanced concerns about water use and water supply priorities, dry-cooling systems
for thermal power plants are receiving increased consideration; even though the power plant with
dry cooled condenser costs 10-15% more than a power plant with water cooled condenser [27].
Maulbetsch and DiFilippo [28] conducted a comparative study on the cost of wet cooling and dry-
cooling on four different 500 MW gas-fired, combined-cycle power plants located in California.
They found that the annual water consumption is reduced to 96% in dry cooling, but the plant cost
is 5% to 15% higher than a wet-cooling power plant. Hassan et al. [29] provided studied the
performance of the condenser in Al-Nassiriyah power plant in Iraq. He reported that the dry
cooling of power plants can be used as an alternative to wet cooling since water conservation and
environmental protection are critical issues. Also, Rebetez et al. [31] reported that due to water
shortages in Europe in the summer periods of years 2003 and 2006, there was throttling in many
steam power plants. Mideksa and Kallbekken [32] reported that using fresh water as a coolant in
a condenser influences the electricity generation from a steam power plant due to the climate
change in hot days and that makes the steam power plants incapable of producing the desired
electrical power.
Direct air-cooled condenser units in power plants usually consist of finned tubes arranged
in the form of a delta A-frame to drain condensate effectively, reduce distribution steam duct
lengths, and minimize the required ground surface area. Conradie and Kroger [37, 44] reported a
comparative study for two methods that can enhance the thermal performance of an air condenser:
deluging the air-side surface of the air cooled condenser and cooling air entering the air-cooled
condenser with adiabatic spray. Deluging the condenser with cooling water or spraying water into
the inlet air can improve the rate of heat transfer.
Page 41
19
Wen et al. [46] investigated a numerical simulation of flow and heat transfer of a direct air-
cooled condenser cell in a power plant. This simulation described the mechanism of flow and heat
transfer in the A-shaped frame condenser. The results showed that some flow phenomena such as
backward flow and biased flow were gained throw the coupled calculation.
A study of flow distribution from an air-cooled condenser module in a ~4000MW power
plant is presented by Grimes et al. [49]. The results showed the existence of inhomogeneous
distribution of cooling on the condenser fan due to the fan and heat exchanger interaction.
Hassan [50] conducted experimentally the effect of tube arrangement and condensate flow
rate on a small, tube bundle in the presence of condensate inundation where a steam condenser
simulation with air and artificial water is used. He tested two staggered tube arrangements having
the same dimensions. The experimental results proved that the suggested tube arrangement has a
less pressure drop coefficient than the conventional arrangement, but the suggested staggered tube
arrangement has a less condensation rate than the conventional one.
Fischer and Ripley [51] reported a study of improving air-cooled condenser performance
at the Yellowstone power plant by utilizing an innovative cleaning technology and a new finned
tube. The results showed that using an effective cleaning technology and tracer gas inspection
contributed to improving the air-cooled condenser.
2.3 Studies on Factors Affecting the Performance of Dry/Air Cooled Condenser
Maulbetsch and DiFilippo [43] conducted an adiabatic enhancement of air-cooled condenser
power plants in California. They investigated test on different arrangements for various low-
pressure nozzles. Also, they studied the effect of unevaporated droplets in the tube bundle. The
results showed that the accumulation of unevaporated water droplets reduced the rate of heat
transfer, and the nozzles tests showed that between 60% to 70% of the spry water is evaporated.
Page 42
20
Esterhuyse and Kroger [36] conducted an experimental study to examine whether using
electrostatic force can prevent or reduce droplets on the finned surface. They found that the wetting
is reduced as the induction voltage is applied to the condenser.
Wen et al. [51] numerically investigated the influence of the ambient temperature on a
direct air-cooled condenser with A-shaped frame. They found that the average inlet air velocity of
the finned tube decreased as the ambient temperature increased. Owen and Kroger [44] reported
that an increase in fan inlet temperatures above the reference temperature will result in a decrease
in the ACC performance below its design value and cause subsequent reduction in turbine
performance.
Maulbetsch et al [43] presented a study on the effects of wind on air-cooled condensers
performance for power plants where it considered one of the significant challenges associated with
air-cooled condensers design and performance. They tested an air- cooled condenser under
different wind conditions to determine its operation and performance; then they compared their
field data with the results of CFD modeling. The results showed that air recirculation can help in
increasing the inlet temperature by 3 to 6℉, and the hot air recirculation has a lesser effect on the
fan performance. They also found that the cross-flow over the fan inlet plan leads to a reduction
in the flow in the affected cells. These effects increased the turbine exhaust pressure more than the
ideal performance curves values.
A reliable numerical method for evaluating the performance of an air-cooled condenser
was investigated by Owen and Kroger [47]. They presented a correlation between numerical
results and test data of the air-cooled condenser at the El Dorado Power Plant under wind effect.
They showed that the increase of the wind speed can lead to irregular speed flow at the inlet of
fan; and, hence, the air-cooled condenser performance reduced. Also, Rooyen and Kroger [45]
Page 43
21
numerically investigated in a study that modeled the thermal-flow of air through and about air-
cooled steam condenser. The model analyzed showed that the flow distortions and low-pressure
region at the upstream edge fan reduced the air-cooled condenser as the wind speed increased.
However, the volumetric effectiveness of certain downstream fans increased as the wind speed
increased.
He et al. [55] proposed a numerical model of an air-cooled power plant to provide the
mechanism of flow through an air-cooled steam condenser using a User Defined Function (UDF).
The results showed that the wind speed played an essential role in changing the pressure
distribution, increasing the wind speed leads to an increase in the stable back pressure and, hence,
the rate of heat transfer reduces.
Computational fluid dynamics is used by Owen and Kroger [56] to investigate the effect
of porous wind screens on an air-cooled steam condenser’s performance under windy conditions
at the El Dorado Power Plant in United States. They found that the installation of a wind screen
below the air-cooled condenser fan platform, in a cross-type arrangement, showed that the
performance of a fan upstream improved due to the stagnation effect of the screen on flow.
Yang et al. [51] reported that ambient winds may deteriorate the thermo-flow performances
of air-cooled condensers, so it is of use to measure against the adverse impacts of winds upon the
air- cooled condensers in a power plant. They proposed a computational model of a new
trapezoidal array of air-cooled condensers at various wind speeds and directions. A comparative
CFD simulation for trapezoidal array and rectangular was provided. The results showed that the
inverted flow that happened due to high wind speed disappeared in the trapezoidal array of the air-
cooled condenser; and, hence, the inlet cooling air temperature decreased as heat rejection
increased.
Page 44
22
O’Donovan et al. [49] performed a series of tests on condensers under vacuum conditions
where they concentrated on the steam-side characterization of a Modular air-cooled condenser.
The results from the vacuum measurements indicated that the fan has a direct influence on the
condenser conditions and, hence, affect turbine work and the power plant efficiency. For a given
steam, mass-flow rate, the condenser pressure and temperature decrease as the fan’s rotational
speed increases.
Ma et al. [53] established a numerical simulation and thermal calculation model of the dry
cooling tower to study the effects of ambient temperature and crosswind on thermos-flow
performance of the tower under the energy balance of the indirect dry-cooling system. They found
that the temperature of the outlet water of the tower is changed linearly with the ambient
temperature, whereas it changed nonlinearly with crosswind speed.
A new theoretical model to predict the part-load thermal performance of natural draft dry
cooling towers (NDDCT) was investigated by Ma et al. [50]. The model is appropriate to calculate
the heat rejection of the tower at different ambient temperatures but unsuitable under crosswind
velocities higher than critical wind velocity. Based on the observed results, it can be concluded
that at a high temperature difference, the tower has a larger resistance to crosswind, and there was
a slight decrease in cooling efficiency.
He et al. [55] investigated a numerical simulation with Computational Fluid Dynamics
(CFD) for hot air recirculation in an air-cooled condenser under various ambient conditions. Wind
speed and wind direction were the two mechanism of hot air that were simulated. They found that
the air recirculation increased with wind speed. Also, the rate of heat transfer decreased; and,
hence, the hot air recirculation has a adverse influence on the air-cooled steam condenser
performance.
Page 45
23
2.4 Studies on Vapor Compression Refrigeration Systems
As the previous studies proved, the refrigerants have much lower temperatures and much higher
heat transfer rates than air and water, so the refrigerants are optimized instead of water/air as a
coolant for steam power plant condenser.
2.4.1 Studies on Exergy Analysis of Vapor Compression Refrigeration Systems
There are many factors that can lead to an increase in the exergy efficiency and minimize the
exergy losses. Increasing the reference temperature and reducing the temperature difference
between condensing and evaporating temperature can improve the exergy efficiency [54].
An exergy analysis for a simple vapor compression regeneration system was reported by
Kumar et al. [57]. They found that the compressor has the most exergy loss compared with other
components; however, using multistage compression may help to reduce the exergy losses.
Based on exergy analysis, Yumrutas et al. [58] introduced a computational model to realize
the effects of the evaporating and condensing temperatures on the exergy losses, the pressure
losses, and the coefficient of performance (COP) of a vapor compression refrigeration cycle. This
study indicated that the lowest pressure with air flow and the largest one with air flow takes place
in the evaporator due to the increasing evaporating temperature. Also, the results showed that the
exergy losses decrease with the evaporator and increase in the condenser with an increase of
evaporator temperatures.
Arora and Kaushik developed a theoretical exergy analysis of a vapor compression
refrigeration system (VCR) with R404A, R502, and R507A [56]. The results indicated that R502
shows the maximum COP and energetic efficiency among all the refrigerants according to
condenser temperature. However, the COP and energetic efficiency of both R507A and R404A
can be proved by the subcooling of the condensed liquid refrigerant.
Page 46
24
Kabul et al. [59] introduced a study for energy and exergy analysis of a vapor compression
refrigeration system with an internal heat exchanger using R600a. The results showed that the
value of COP, the efficiency ratio, and the energetic efficiency increase with the increase of the
evaporator temperature; whereas, the irreversibility decreases. Also, the results showed that the
increase in condenser temperature can decrease the exegetic efficiency, the efficiency ratio, and
the value of COP. However, the total irreversibility rate increases with an increase in the condenser
temperature.
2.4.2 Studies on Refrigerant Heat Transfer
More researchers have started studying the concept of SPPC cooling by a refrigeration system to
investigate this cooling method’s performance in the steam power plant in different ambient
conditions. Traditional chlorofluorocarbon (CFC) and hydrochlorofluorocarbon (HCFC) are
commonly used in the development and commercial application of hydrofluorocarbon (HFC)
refrigerants. One of the reasons why researchers have substituted the HCFC-22 with the CFC in
recent years is its chemical structure. The CFC refrigerant has a chlorine that combines with ozone
in the atmosphere. Therefore, the alternative refrigerants whom researchers prefer to use in the
existing facilities should not only have low ozone depletion potential (ODP) but also should have
low global warming potential (GWP), be less flammable, be safe, be reliable, and finally be
economical [60].
Recently researchers have replaced R-22 by HFC-410A because of its appropriate
thermodynamics of heat transfer and environment friendliness. HFC- 410A, which is a mixture
of HFC-32 and HFC-125, has been used widely in air conditioning system applications and in high
operating pressure equipment. In a domestic refrigeration and mobile air conditioning system
Page 47
25
HFC-134a has become the alternative for CFC-12 in chillers and heat pumps. Whereas HCFC-22
has been replaced by HFC-407C; which is mixture of HFC-32, HFC-134a, and HFC-125 [62].
Many researchers have studied the heat transfer and flow characteristics of refrigerants. An
experimental study of heat transfer and the pressure gradient of hydrocarbon refrigerants R-600aR-
290, R-1270, and HCFC, R-22 inside a horizontal double-pipe, heat exchanger during a
condensation and evaporating process is presented by Lee et al. [61]. The results show that the
heat transfer coefficient of R-22 is lower than the other hydrocarbon refrigerants. Also, increasing
the mass flux usually leads to an increase in the average heat transfer coefficient. Ebisu and
Torikoshi [64] presented a theoretical study of heat transfer characteristics of R-22, R-410A and
R-407C in a 6.4 mm diameter tube, while Wang et al. [65] discussed the pressure gradient for the
same refrigerants in small diameter tubes. The results showed that R-410A has a higher heat
transfer coefficient than other refrigerants, otherwise R-410A has a lower pressure gradient then
others. In addition, a theoretical study of the heat transfer coefficient and pressure drop for R-13a,
R-410A, and R-22 in micro and smooth tubes is reported by Christoffersen et al. [66]. The results
show that heat transfer rate in micro fin tubes is higher than the heat transfer over smooth tubes.
However, in the smooth tubes, R-410A has a higher heat transfer coefficient and lower pressure
drop than R-22.
Researchers noted some differences between R-410A and R-22. R-410A has higher
pressure than R-22 in both the suction and discharge section of the refrigeration system but has
lower temperature in the same situation. Another difference is that R-410A needs small diameter
tubing and then a high heat transfer coefficient with lower refrigerant, side-heat transfer exchange
surface area compared with R-22 [67].
Page 48
26
Several experimental studies for refrigerants pressure gradient and condensation heat
transfer were introduced by researchers in past years. One of studies discussed the condensation
heat transfer of R-22, R-125, R-410A, R-134a, and R-125 by Cavallini et al. [68]. The study
implied that R-134a has the lowest heat transfer coefficient and R-410A has the highest heat
transfer coefficient. Also, they did another study [69] to measure the pressure gradient and heat
transfer of R-125, R-134a, R-32, R-22, R-410A, and R-236ea inside a smooth tube. The result
revealed that the mass velocity plays an important role in heat transfer amount, where the heat
transfer coefficient increases as the mass velocity increases.
Page 49
27
3 The Condenser in the Steam Power Plant
3.1 Introduction
Power plant condensers have been improved since their use as a power plant component. The
performance of the condenser has been a main focus of interest for designers to develop because
the performance of the condenser directly affects the power plant efficiency. There were many
areas in which the performance of the condenser was enhanced. One of these areas is the type of
the condenser. Power plant condensers can be classified into two major types: direct contact
condensers and, surface contact condensers. In the direct contact condensers the steam, which is
exhausted from the turbine, is cooled by mixing it directly with the cooling fluid. On the other
hand, in the surface contact condensers the steam and the cooling fluid are not mixed directly,
there is a solid surface, such as tubes, which separate the steam and the cooling fluid.
3.2 Surface Contact Condensers
A surface contact condenser is commonly used in the modern steam power plant. This type of
power plant condenser is further classified based on the type of cooling fluid water cooled
condenser, air cooled condenser, and hybrid wet-dry condenser.
3.2.1 Water Cooled Condenser
The water cooled condenser is widely used. It is mainly a shell-and-tube type in which the steam
flows in the shell side and the water flows in the tube side. The cooling water can be drawn from
a source or what is called a low temperature reservoir, such as a sea, a lake, or a river. After it
cools the condenser, the water will return back to the source; this type of cooling system is called
once-through cooling system. The cooling water, moreover, can be recirculated by using cooling
tower systems. In the cooling tower, the cooling water is circulated in a closed cycle. The hot
Page 50
28
cooling water, which comes from the condenser, will be cooled down by evaporation in huge
towers, and remove the heat to the surrounding. Then it will be returned back to the condenser
again. This system is known as a recirculating wet cooling system. The shell-and-tube condenser
can further be divided into a horizontal type and a vertical type.
3.2.1.1 Shell-and-Tube Condenser: Horizontal Type
The tubes inside this type of condenser are arranged horizontally and supported by baffles. The
baffles are usually put with cut vertical to let the steam to flow from side to side to reach every
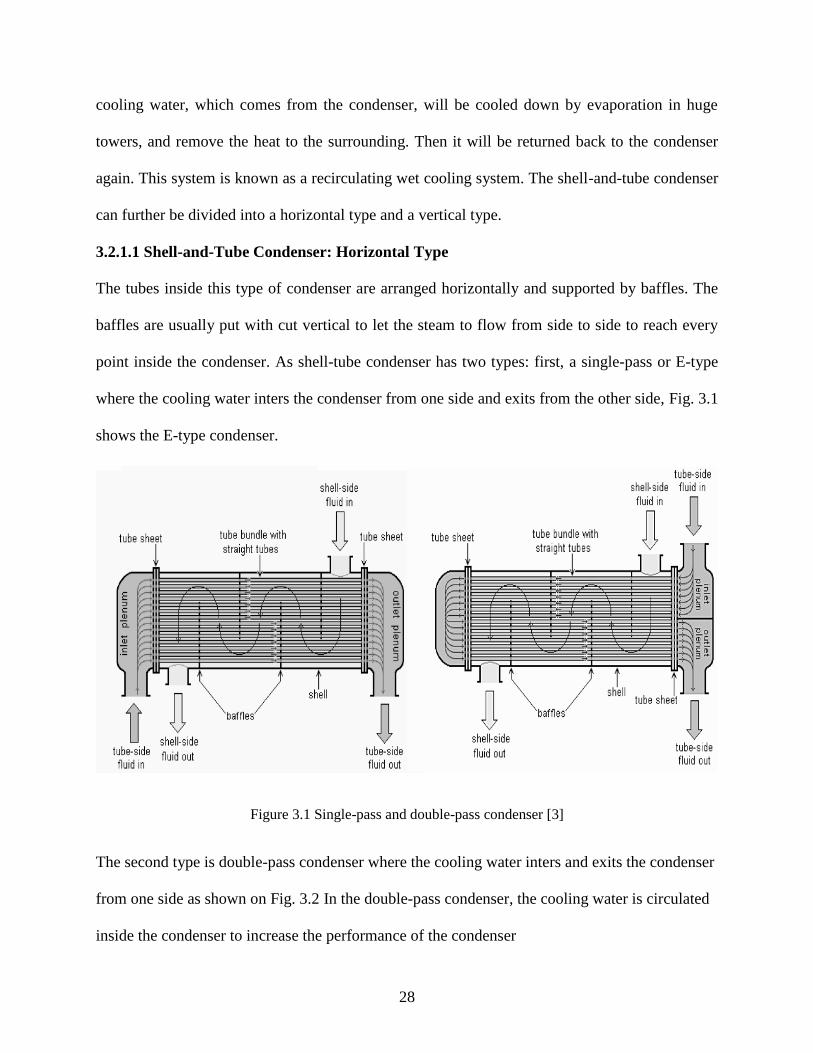
point inside the condenser. As shell-tube condenser has two types: first, a single-pass or E-type
where the cooling water inters the condenser from one side and exits from the other side, Fig. 3.1
shows the E-type condenser.
Figure 3.1 Single-pass and double-pass condenser [3]
The second type is double-pass condenser where the cooling water inters and exits the condenser
from one side as shown on Fig. 3.2 In the double-pass condenser, the cooling water is circulated
inside the condenser to increase the performance of the condenser
Page 51
29
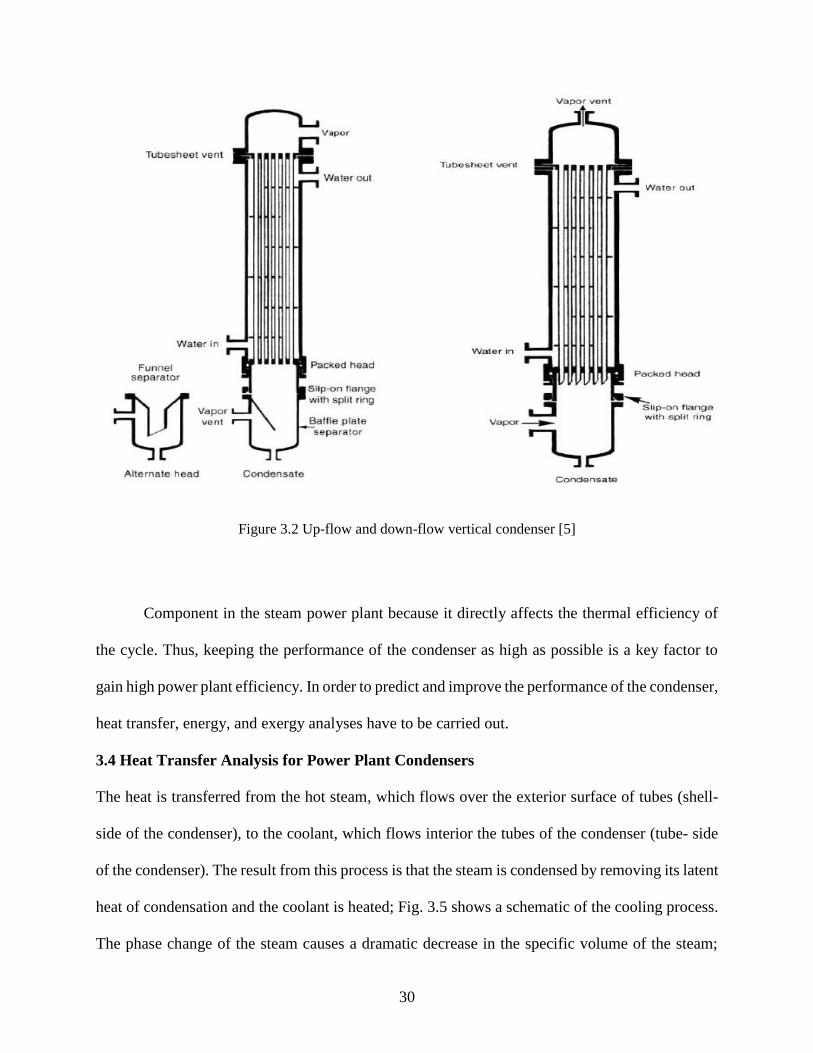
3.2.1.2 Shell-and-Tube Condenser: Vertical Type
In the vertical type, the tubes of the condenser are arranged vertically and supported by baffles.
The vapor can flow inside or outside the tubes and the cooling water as well. The vertical type is
further classified into two types: down-flow where the vapor inters from the top side of the
condenser, and the condensate drains down to the bottom of the condenser through the use of
gravity and vapor shear effects, as is shown on the Fig. 3.3. The second type is up-flow condenser.
In this type, vapor inters the condenser from the bottom side and flows upward inside the tubes,
while the condensate drains down the tubes through the effect gravity, Fig. 3.4 shows schematic
of the condenser.
3.3 Theoretical Basis to Guide Experiment
To help design the optimum experimental platform for this project, the required guiding theoretical
basis has to be developed first.
In the Rankine cycle, it is essential to have a low temperature reservoir to reject some of the heat
that is gained in the high temperature reservoir in order to complete the thermodynamic cycle.
Basically, the high temperature reservoir is the boiler, and the low temperature reservoir is the
condenser. In the condenser, heat transfer occurs between the hot steam and the coolant. The
condenser resaves “dead” steam from the final stage of the steam turbine. The steam will release
its latent heat condensation in order to change its phase to liquid. The condenser is a necessary
Page 52
30
Figure 3.2 Up-flow and down-flow vertical condenser [5]
Component in the steam power plant because it directly affects the thermal efficiency of
the cycle. Thus, keeping the performance of the condenser as high as possible is a key factor to
gain high power plant efficiency. In order to predict and improve the performance of the condenser,
heat transfer, energy, and exergy analyses have to be carried out.
3.4 Heat Transfer Analysis for Power Plant Condensers
The heat is transferred from the hot steam, which flows over the exterior surface of tubes (shell-
side of the condenser), to the coolant, which flows interior the tubes of the condenser (tube- side
of the condenser). The result from this process is that the steam is condensed by removing its latent
heat of condensation and the coolant is heated; Fig. 3.5 shows a schematic of the cooling process.
The phase change of the steam causes a dramatic decrease in the specific volume of the steam;
Page 53
31
consequently the steam will become liquid (condensate). Then the condensate will flow down
through effect of gravity into the lower part of the condenser, in the so called hot-well, all
condensate is collected there and pumped again into the cycle. The heat that is removed by the
coolant is discharged to the surrounding, low temperature reservoir such as oceans, lakes, or rivers.
With an assumption of a constant overall heat transfer coefficient, a circulating coolant mass flow
rate, and a total heat transfer area, the only factor that affects the heat transfer inside the condenser
is the logarithm mean temperature difference(LMTD).
There are six different thermal resistances that affect the heat transfer rate inside the
condenser. The thermal resistances are water film resistance exterior and interior the tubes, wall
material resistance, non-condensable gases resistance, and fouling resistance that exists on the
exterior and interior tube’s surfaces. The fouling is made of inorganic deposits, biofouling, or a
layer of corrosion. In this analysis, we assume that the tubes are clean, so there is no fouling on
the tubes. The overall thermal resistances can be calculated by the sum all the above resistances.
Figure 3.3 Schematic of energy balance for condenser
Page 54
32
3.4.1 The Governing Equations for the Heat Transfer Analysis
3.4.1.1 Heat Transfer inside the Condenser
Inside the condenser, the steam is in a saturated or a mixture (steam/liquid) phase. That means the
temperature of the steam entering the condenser and the temperature of the condensate leaving the
condenser are at a saturated temperature(𝑇𝑠𝑎𝑡) value. The saturated temperature is a direct function
of the pressure of the steam. The pressure inside the condenser drops slightly due to flow
resistance. As a consequence of this pressure drop, the saturated temperature will also decrease as
will be shown later. The steam mass flow rate(𝑚.𝑠.𝑖𝑛) enters the condenser is mixed with the non-
condensable gases (𝑚.𝑎.𝑖𝑛) because the condenser never receives pure steam from the turbine. As
the mixture (steam/ non-condensable gases) moves inside the condenser the mass of the steam is
decreased due to the phase change of the steam from gas to liquid, and the mass of non-condensable
gases will increase due to the air leakage and the chemical reaction; however, in this analysis the
assumption of constant mass of the non-condensable gases is applied. Moreover, as illustrated in
Fig. 3.5 the inlet coolant temperature is (𝑇𝑐𝑙.𝑖𝑛), the outlet coolant temperature is (𝑇𝑐𝑙.𝑜𝑢𝑡) and the
coolant mass flow rate is(��𝑐𝑙).
In order to develop an expression that represents the heat transfer within the condenser, we
will consider an elemental tube disk as in Fig. 3.6 where (𝑑𝑄) is the differential heat flux through
the element, (𝑑𝐴) is the differential area, (∆𝑇) is the temperature difference across the partial
element, and (𝑈) is the overall heat transfer coefficient, thus the heat flux can be expressed by
equation (3.1)
Page 55
33
Figure 3.4 Element tube disk [5]
dQ = U∆Td (3.1)
where
∆T = Th − Tc
On the other hand the heat transfer can be defined as
dQ = − mh Cph dTh = mc Cpc dTc (3.2)
From equation(4.2), we can get
dTh − dTc = − dQ (1
mhCph+
1
mc Cpc) (3. 3)
Substituting equation (4.1) into (4. 3)
d(Th − Tc )
(Th − Tc )= − U (
1
mhCph+
1
mc Cpc) dA (3.4)
By integrating both sides between the ends of the heat exchanger 1-2, with a consideration that the
specific heat (𝐶𝑝ℎ) and (𝐶𝑝𝑐) are constant.
Page 56
34
Ln ((Th2 − Tc2 )
(Th1 − Tc1 )) = − U A (
1
mhCph+
1
mc Cpc) (3.5)
Also integrating equation (4.2) between 1-2
Q = − mh Cph (Th2 − Th1 ) = mc Cpc (Tc2 − Tc1 ) (3. 6)
Solving for (𝑚ℎ𝐶𝑝ℎ) and (𝑚𝑐𝐶𝑝𝑐) on equation (4.6)
mhCph =Q
(Th1 − Th2 )
mcCpc =Q
(Tc2 − Tc1 )
Substituting these equations into equation (4.5)
Q = UA(Th2 – Tc2 )– (Th1 – Tc1 )
Ln ((Th2 – Tc2 )(Th1 – Tc1 )
) (3. 7)
The second term on the R.H.S is called Log Mean Temperature Difference (𝐿𝑀𝑇𝐷).
LMTD =(Th2 – Tc2 )– (Th1 – Tc1 )
Ln ((Th2 – Tc2 )(Th1 – Tc1 )
) (3. 8)
This expression is valid for a counter-flow heat exchanger or for a heat exchanger where the
temperature of one of the flows is constant during the condensation process which is the case in
the power plant condensers. Consider the following:
Since the change between Tsat.in 𝑎𝑛𝑑 Tsat.out is very small, we assume that Tsat.in = Tsat.out =
Tsat in this case.
Th1 = Th2 = Tsat
Tc1 = Tcl.in
Tc2 = Tcl.out
Thus equation (4. 8) becomes
Page 57
35
LMTD =(Tsat − Tcl.out ) − (Tsat − Tcl.in )
Ln ((Tsat − Tcl.out )(Tsat − Tcl.in )
)=
( Tcl.out − Tcl.in )
Ln ((Tsat − Tcl.out )(Tsat − Tcl.in )
) (3.9)
We can write equation (4.7) as
Q = U Asur LMTD (3.10)
The (LMTD) is an important parameter to design the condenser or to predict the performance of
the condenser. It relates the heat transfer within the condenser with quantities such as saturated
steam temperature, inlet and outlet coolant temperature, overall heat transfer coefficient, and total
heat transfer surface area. If the desire is to calculate the condenser geometry, the designer should
have an idea about the(𝐿𝑀𝑇𝐷), as the total surface area can be determent from equation (3.11).
Asur =Q
U LMTD (3.11)
By knowing the total heat transfer area, the geometric parameters of the condenser and the number
of tubes can be estimated by equation(3.12). These parameters are needed and must be optimized
to suit the design criteria.
Asur = π dout L N (3. 12)
3.4.1.2 Overall Heat Transfer Coefficient
The thermal resistances inside the condenser are difficult to estimate due to the geometry of the
tubes and the resistances being represented by the solid and liquid. As mentioned previously, in
the condenser there are six thermal resistances as illustrated in Fig. 3.7 Two are liquid resistances
by water film inside and outside the wall of the tubes; these resistances will be determined by
calculating the convective heat transfer coefficient for both water films. The non-condensable
gases resistance is one of the thermal resistances inside the condenser that should be accounted
for. The other three are solid resistances: wall material resistance and two fouling resistances.
Fouling resistances are difficult to determine because they do not have uniform geometry and there
Page 58
36
is no specific thermal conductive for the fouling material; s they are estimated from the
experiments [72, 73]. In our calculation, we assume that the tube surfaces are clean so there are no
fouling resistances taking place.
Figure 3.5 Thermal resistance on the condenser tube
After calculating each single resistance, the overall thermal resistance is the sum of all resistances
illustrated above. By taking the outer surface area as reference overall thermal resistance is as in
equation (3.13).
Rtot = Rfilm.in
dout
din+ Rwall + Rfilm.out + Ra (3.13)
Thus the overall heat transfer coefficient (U) can be determent by
U = 1
Rtot (3.14)
Page 59
37
3.4.1.3 Coolant Film Thermal Resistance
The coolant film resistance is a thermal resistance that is formed on the interior surface of the
tubes. When the coolant flows inside the tube, it creates a thin boundary layer on the tube wall.
This layer will build a thermal resistance in the direction of the heat flow. The coolant film
resistance is a function of flow velocity, temperature, density, specific heat, tube diameter, and
viscosity [72]. It is known from convective heat transfer analysis that in order to compute the fluid
thermal resistance, the convective heat transfer coefficient must be determined. There are many
empirical correlations that estimate the convective heat transfer coefficient. One of these
correlations is by Ozisik [72] who derived it from Nusselt. Ozisik found from experimental data
that convective heat transfer coefficient is proportional to the diameter to length ratio of the
tube(𝑑𝑖𝑛
𝐿) . He developed an empirical correlation that relates Nusselt number to Reynolds number,
Prandtl number, and the diameter to length ratio [73]. This correlation estimates the interior
thermal resistance of the circular tube by obtaining convective heat transfer coefficient from
equation (3.16).
Nucl =hin din
Kcl= 0.036 Recl
0.8 Prcl
13 (
L
din)
−0.054
(3.15)
ℎ𝑖𝑛 = 0.036 𝑘𝑐𝑙
𝑑𝑖𝑛 𝑅𝑒𝑐𝑙
0.8 𝑃𝑟𝑐𝑙
13 (
𝐿
𝑑𝑖𝑛)
−0.054
(3. 16)
𝑅𝑓𝑖𝑙𝑚.𝑖𝑛 =1
ℎ𝑖𝑛
Rfilm.in = [0.036 kcl
din Recl
0.8 Prcl
13 (
L
din)
−0.054
]
−1
(3. 17)
This relation is valid in the range of 10 < 𝐿
𝑑𝑖𝑛< 400
where
Page 60
38
Prcl =μcl Cpcl
Kcl (3.18)
Recl = ρcl din V
μc l
(3. 19)
V =mcl
ρcl N din
2
4 π
(3. 20)
All properties of the coolant are evaluated at bulk temperature (𝑇𝑏) ,which is the average between
the inlet coolant temperature and the outlet coolant temperature [72].
Tb =( Tcl.in + Tcl.out )
2 (3.21)
3.4.1.4 Tube Wall Thermal Resistance
The second thermal resistance is the resistance of the material of the tube or the tube wall thermal
resistance. This resistance is accurately and easily obtained because it is a direct function of the
thermal conductivity of the material of the tube. The thermal conductivity of various materials are
known and well documented. The wall resistance is a small amount compared to the fluid
resistances because the tube thickness is small and the thermal conductivity of the metal is high.
The relation that governs the wall resistance can be found in different conductive heat transfer
textbooks [74].
Rwall =dout
2 Kmetal ln (
dout
din) (3.22)
3.4.1.5 Condensate Film Thermal Resistance
The third thermal resistance that exists inside the condenser. When the hot steam contacts the cold
exterior surface of the tubes, the steam temperature will drop to the wall temperature. Because of
the phase change, a thin film of water (condensate) forms the outer the tube surface; this film
creates a thermal resistance for the heat to transfer from the steam to the coolant, Fig. 3.8 shows
Page 61
39
the condensate film on a single horizontal tube surface. To calculate the condensate heat transfer
coefficient for a single horizontal smooth tube, Nusselt approximated a correlation for a laminar
flow equation (3. 23) [75]. This relation estimates the Nusselt number for a single horizontal tube;
and then from the Nusselt number, the convective heat transfer coefficient can be calculated.
Within the condenser, the condensate moves by effect of gravity to the lower tube banks.
Since the flow path is too short to form turbulence flow, the flow inside the condenser is always
laminar. The thickness of the film is the key parameter to estimate the thermal resistance. The film
thickness is varied from one tube to another because in the horizontal tube condenser, the tubes
are arranged in banks so when the condensate falls off one tube, it will fall onto the tube below.
As a result, in the lower tubes the average condensate of the film thickness is increased. This extra
thickness will decrease the heat transfer coefficient as we go down in the condenser bundle. This
phenomenon is known as the effect of condensate inundation.
There have been many theories that studied the inundation effect in the surface condensers.
McNaught and Cotchin [74] developed a simple correction factor that accounts for the inundation
effects; the correction factor is based on the diameter and pitch of the tube bundle. However, in
this study another correction factor that is represented by Davidson and Rowe [74] will be used.
In Davidson and Rowe’s relation, the row number of the tube is the main parameter. The row
number of the tube is counted from the top of the condenser to the bottom. Equation (4.25)shows
the correction factor of the inundation effect(𝐹) as represented by Davidson and Rowe [74].
Vapor shear is another phenomenon that should be considered when calculating the
condensate thermal resistance. “There is a small amount of data for the influence of vapor shear in
the tube bundles” [75]. Berman and Tumanov [75] recommended a correlation that accounts for
Page 62
40
vapor shear in the condenser, equation(4.26). In this analysis both inundation and vapor shear will
combine their effects in one condensate thermal resistance relation as in equation(4.27) [75].
Figure 3.6 Laminar film condensation on a horizontal tube [5]
Nusselt number correlation for a single horizontal tube [73]
Nucs =hout dout
Kcs= 0.728
dout
Kcs[ρcs (ρcs − ρs ) g ℎ𝑓𝑔
∗ Kcs3
dout μcs (Tfilm − Twall )]
14
(3.23)
Where
ρcs , μcs, Kcs : Density, viscosity, and thermal conductivity of the condensate around the exterior
tube surface are evaluated at film temperature. The later discussion will show how to calculate
film and wall temperature.
A modified latent heat of condensation (ℎ𝑓𝑔∗ ) is used instead of the latent heat of
condensation (ℎ𝑓𝑔 ); which is presented in equation (3.23) to account for the cooling of the liquid
below the saturation temperature [75].
Page 63
41
ℎ𝑓𝑔∗ = hfg + 0.68 Cpcs
(Tsat − Twall ) (3. 24)
The correction factor of the inundation effect(𝐹) for (𝑁𝑡ℎ) tubes is in equation (3.25)[73]
F = n34 − (n − 1)
34 (3.25)
The vapor shear correlation or correction term as presented by [75] is as in(3.26).
Cvg= 1 + 0.0095 Remix
11.8
√Nucs (3.26)
The correlation for the condensate thermal resistance that is combined with both inundation and
vapor shear effects for (𝑁𝑡ℎ) tubes is presented as follows. From equations (3.23), (3.24),
(3.25), and (3. 26)
Rfilm.out = [Kcs
dout Nucs (1 + 0.0095 Remix
11.8
√Nucs) F]
−1
(3. 27)
Where
Remix = ρmix dout V∞
μmix (3. 28)
Free stream velocity (V∞)depends on the location inside the condenser where (V∞) in the first row
is different from (V∞) in the other rows [75].
a- (V∞ )in the first row
V∞(n=1) =ms + ma
ρs Avd (3.29)
where
𝐴𝑣𝑑 = 𝑤𝑡𝑠 𝐿
b- (V∞) in the other rows
V∞(n+1) =(m.
s + m.a) − ∑ mcs,i
n1
ρmix Amv (3. 30)
where
Page 64
42
𝐴𝑚𝑣 = 𝐿 (𝑁𝑇𝑅 − 1) (𝑃𝑡 −𝜋 𝑑𝑜𝑢𝑡
2
2√3 𝑃𝑡
)
3.4.1.6 Non-Condensable Gases Thermal Resistance
Non-condensable gases commonly exist in numerous heat exchanger applications. In the case of
the power plant condenser, a small fraction of gases, which is dissolved in the feed-water will
reach the condenser with the dead steam [76]. Thus, the condenser never receives pure steam from
the turbine. The other source of non-condensable gases is that the condenser being under the
vacuum, which lets the gases to leak into the condenser from the atmosphere. And also, gases such
as oxygen and hydrogen can resulted from water decomposition because of the thermal or chemical
reaction inside the condenser [77].
The non-condensable gases have two main effects inside the condenser; first of all, it will
raise the operating pressure of the condenser if not being vented. The condenser pressure (Pc) is
the sum of steam partial pressure (Ps) and the gases partial pressure(Pa), equation (3. 31). As more
gases leak or form inside the condenser, the relative content of the gases (ε) in the mixture
(steam/gases) will increase; as result the partial pressure of the gases will increase. Equation (3. 33)
shows the relation. This increase pressure of the gases will block the steam to the flow into the
condenser from the turbine; and, thus, the steam will not completely expand in the turbine. As a
result the turbine output will decrease and the plant efficiency will decrease as well.
The second effect of the non-condensable gases is that the gases will blanket the outer
surface of the tubes, which will cause a thermal resistance (Ra)for the heat to transfer from the hot
steam to the coolant [77]. Marto [75] found an “empirical expression for the mass transfer
coefficient in a tube bundle downward flow of a steam-gas mixture”. This correlation can be an
equivalent to non-condensable gases heat transfer coefficient, which will add another thermal
resistance inside the condenser, equation (3. 35) [75].
Page 65
43
Even a small friction of gases inside the condenser will cause a significant heat resistance.
Fig. 3.9 by Collier and Thome [76] shows the relation between the mass fraction of the gases and
the heat transfer with the presence of gases and the heat transfer with pure steam. The chart
compares the heat transfer for both quiescent vapor and forced vapor conditions. It shows that for
the quiescent vapor, even a small fraction of gases will have a dramatic impact of the heat transfer.
On the other hand for the forced vapor, the impact is a little bit less. In this study the calculations
are based on the region that is very close to zero. The mass fraction of the gases(ε) is assumed to
be constant throughout the condenser and equals to (0.00012), adapted from a previous study [73].
Pc = Ps + Pa (3. 31)
𝜀 = ��𝑎
��𝑎 (3. 32)
From the gas low with consideration that the volumes and temperature are the same, one can get
Pa
Ps= 0.622 ε (3. 33)
From (3. 31)𝑎𝑛𝑑 (3. 33)
Ps = Pc
1 + 0.622 ε (3. 34)
Page 66
44
Figure 3.7 Condensation of steam in the presence of air [67]
Non-condensable gases heat transfer coefficient as represented by [75]
ℎ𝑎 =𝑎 𝐷
𝑑𝑜𝑢𝑡 𝑅𝑒𝑠
12 (
𝑃𝑐
𝑃𝑐 − 𝑃𝑠)
𝑏
𝑃𝑐
13 (𝜌𝑠
𝐿
𝑇𝑠𝑎𝑡)
23 1
(𝑇𝑠𝑎𝑡 − 𝑇𝑓𝑖𝑙𝑚)13
(3. 35)
Thus, the thermal resistance is:
Ra =1
ha= [a
D
dout Res
12 (
Pc
Pc − Ps)
b
Pc
13 (ρs
L
Tsat)
23 1
(Tsat − Tfilm)13
]
−1
(3. 36)
Where:
(D) is the diffusion coefficient [75]
Page 67
45
D =0.926
Pc (
T2.5
T + 245) (3. 37)
where
T = (Tsat + Tfilm)
2 in (K), and Pc in (Pa) (3. 38)
(a) and (b) in equations (4. 37)and (4. 38) are constants and they depend on (Res):
a = 0.52 and b = 0.7 for Res ≤ 350
a = 0.82 and b = 0.6 for Res > 350
Now we reach to the point where we can calculate all thermal resistances that are occurred inside
the surface condenser, and therefore, we can determine the overall heat transfer coefficient by
using equation(3. 14).
Condenser pressure (𝑃𝑐) :
The condenser pressure is not constant inside the condenser as we always assume; it is slightly
lowered. It decreases because of increasing of the resistance to the flow of the steam [13]. As the
steam moves across the rows of the condenser, the pressure is slightly lowered. To calculate the
amount of pressure in each row, consider relation (3. 41) [75]. According to [78], “the pressure
drop from the inlet to the exit of the condenser is called the steam exhaust resistance of the
condenser” equation(3. 40).
𝑃𝑐(𝑛+1)= 𝑃𝑐(𝑛)
− [(0.2 𝐶𝑟2 ��𝑣
2
𝜌𝑠 )
𝑛
− ((��𝑣
2
𝜌𝑠 )
𝑛
− (��𝑣
2
𝜌𝑠 )
𝑛+1
)] (3. 39)
where
Cr =Avd
Amv
��𝑣 = ρs V∞
The steam exhaust resistance is
Page 68
46
∆Pc = Pc − Pce (3. 40)
There is another relation which is useful to assess the condenser performance. This relation is the
vacuum pressure inside the condenser [9]. It is a relation between the condenser pressure and the
atmospheric pressure.
Pvac = [(Patm − Pc)
Patm] × 750.061 (3. 41)
where:
Patm, Pc are in (bar) , and Pvac is in (mmHg )
Wall and film temperature(Twall , Tfilm ):
The wall temperature and the outer film temperature are unknown. The best method to calculate
these temperatures is the iterative approach [78]. The steps of the iteration are described below.
Tfilm = Tsat −3
4 (Tsat − Twall ) (3. 42)
1- Assume initial film temperature.
2- Evaluate all properties of the condensate at the assumed film temperature.
3- Use (4. 46) to find the initial wall temperature.
4- Use the properties of the condensate to find the condensate heat transfer coefficient(ℎ𝑜𝑢𝑡 )
and the overall heat transfer coefficient (𝑈) as described previously.
5- Calculate the wall temperature by using the heat transfer equation as follows.
houtAsur(Tsat − Twall ) = AsurU(Tsat − Tb )
Thus
Twall = Tsat − [Asur U
hout Asur] (Tsat − Tb ) (3. 43)
Page 69
47
Figure 3.8 Thermal resistance on the tube
6- Use the new wall temperature to calculate the film temperature using equation(4. 43) .
7- Compare the calculated new film temperature with the one from the initial step if they are
not the same repeat the calculation till the iteration converges.
3.4.2 Relations for the Heat Transfer and Energy Analysis
1. Latent heat transfer rate is governed by [73].
Qs = mcs hfg (3. 44)
2. Heat transfer to the coolant is calculated by the energy balance of the in-flow and out-flow.
Qcl = mcl Cpcl( Tcl.out − Tcl.in ) (3. 45)
If no heat losses to the environment is assumed, we can relate equation𝑠(3. 10), (3. 44)
and(4. 45).
Qs = Qcl = Q (3. 46)
Page 70
48
3. From (3, 9), (3, 10), and (3, 45), (Tcl.out) can be calculated by knowing the saturated
temperature of the steam, the inlet temperature of the coolant, overall heat transfer
coefficient, the given heat surface area, and the coolant mass flow rate [75].
m.cl Cpcl( Tcl.out − Tcl.in ) = U Asur
( Tcl.out − Tcl.in )
Ln ((Tsat − Tcl.out )(Tsat − Tcl.in )
)
Thus
Tcl.out = Tsat −(Tsat − Tcl.in )
exp (U Asur
m.clCpcl
) (3. 47)
4. Condensation mass flow rate can be calculated using equation (4. 47) and the heat balance
analysis.
m𝑐𝑠 =U Asur(Tsat − Tb)
hfg ∗ (3. 48)
3.5 Exergy Analysis of Steam Power Plant Condensers
Literatures define exergy as the property that quantifies potential for use, or the energy that is
available to be used [4]. More precisely, exergy is “the maximum theoretical work obtainable from
an overall system consisting of a system and the environment as the system comes into the dead
state- equilibrium with the environment”[4]. Exergy, in contact to energy, is destroyed by
irreversibilities such as friction and heat transfer, and also it is transferred to and from the systems
[4]. Exergy destruction within the systems represented losses by the irreversibilities; therefore
when the exergy destruction is reduced in the systems, the use of energy will be increased. The
main purpose of exergy analysis is to identify the locations where the most exergy destructions
occur and rank order them for significance [4]. By doing this analysis, it will be easier to find a
Page 71
49
suitable solution to reduce the losses and improve the efficiency of the systems. In this part, exergy
analysis will be carried out to evaluate the condenser performance.
3.5.1 Governing Equations
For steady state flow, the balances of mass, entropy, and exergy within the control volume shown
in figure 3. 11 are as follows [77]
I. Mass balance:
∑ min
j
= ∑ mout
j
(3. 49)
Figure 3.9 Exergy and energy balance
II. Entropy balance:
∑Qj
Tjj
+ ∑ min
in
sin − ∑ mout
out
sout + σcv = 0 (3. 50)
Page 72
50
where
∑��𝑗
𝑇𝑗𝑗 : Entropy transferred by heat
𝑇𝑗: Temperature on the boundary where the heat transfer occurs
∑ �� 𝑠 : The rate of entropy transfer due to mass flow
III. Exergy balance:
∑ (1 −𝑇𝑜
𝑇𝑗)
𝑗
��𝑗 − ��𝑐.𝑣 + ∑ ��𝑖𝑛
𝑖𝑛
𝑒𝑖𝑛 − ∑ ��𝑜𝑢𝑡
𝑜𝑢𝑡
𝑒𝑜𝑢𝑡 − 𝐸𝑑 = 0 (3. 51)
The equation (3. 51) can be written
∑ Eqj −
j
Wc.v + Ein − Eout − Ed = 0 (3. 52)
Where:
��𝑞𝑗 = (1 −𝑇𝑜
𝑇𝑗) ��𝑗 : The rate of exergy transfer accompanying heat.
��𝑖𝑛 = ∑ ��𝑖𝑛 𝑒𝑖𝑛
𝑖𝑛
��𝑜𝑢𝑡 = ∑ ��𝑜𝑢𝑡 𝑒𝑜𝑢𝑡
𝑜𝑢𝑡
where
e = h − ho − To(s − so) +V2
2+ g Z
Specific flow of the exergy (J)
Page 73
51
(ℎ) 𝑎𝑛𝑑 (𝑠) are specific enthalpy and entropy evaluated at the inlets and exits, (ℎ𝑜) 𝑎𝑛𝑑 (𝑠𝑜) are
specific enthalpy and entropy evaluated at dead state conditions (𝑇𝑜) 𝑎𝑛𝑑 (𝑃𝑜), (𝑉2
2) is the kinetic
energy, and (𝑔 𝑍) is the potential energy.
𝐸𝑑 = 𝑇𝑜 𝜎𝑐.𝑣
: Destruction of exergy within the control volume due to irreversibility.
Notice:
In our analysis of the power plant condenser, the following assumptions are made, which are
reasonable assumptions for a thermal system like condensers:
1- Steady state flow.
2- No heat transfer to the surrounding that implies (��𝑗 = 0).
3- No work done within the control volume that means (��𝑐.𝑣 = 0).
4- The effects of motion and gravity are negligible(𝑉2
2= 𝑔 𝑍 = 0).
5- Dead-state conditions (𝑇𝑜 = 0.01 𝐾 𝑎𝑛𝑑 𝑃𝑜 = 1 𝑏𝑎𝑟).
Applying the above assumptions to equations(3. 50), (3. 51),we get
∑ min
in
sin − ∑ mout
out
sout + σcv = 0 (3, 53)
∑ min
in
ein − ∑ mout
out
eout − Ed = 0 (3, 54)
e = h − ho − To(s − so)
3.5.2 Energetic and Exergy Efficiency for the Power Plant Condenser
Energetic efficiency is the parameter that assesses the energy utilization in the system [4]. The
efficiency takes many different forms depend on the type of the thermal system which is applied
for. For the surface contact heat exchanger like the condenser, we can develop an expression for
Page 74
52
the energetic efficiency as follows [4]. Applying exergy balance to figure 3. 11 and using
equation(4. 54), we get
( mclecl.in − ms es.in) − (mcl ecl.out − mses.out) − Ed = 0 (3.55)
Ein = (mcl ecl.in + ms es.in)
Eout = (mcl ecl.out + mses.out)
Ed = Ein − Eout
Rearranging the first equation
mcl( ecl.in − ecl.out ) + ms( es.in − es.out) − Ed = 0
mcl( ecl.in − ecl.out ) = ms( es.out − es.in ) + Ed
Thus, the exegetic efficiency of the condenser is
ε =mcl( ecl.in − ecl.out )
ms( es.out − es.in ) (3. 56)
Moreover, some references defend another expression for the efficiency using the exergy analysis.
They call it exergy efficiency, and it has the following form as it is represented on references [77]
and [80].
ηex = 1 −Ed
Ein (3. 57)
Page 75
53
4 Experimental Studies to Verify the Concept of a Refrigerant Cooled Condenser
4.1 Introduction
The MSU Turbomachinery Lab has shown an analytical and experimental study in previous
research [26, 100] where the vapor compression refrigeration (VCRS) can be a possible method to
directly cool the steam condenser of a steam power plant (SPP). This result was based on 1-D
fluid flow and thermal and experimental analyses. But to be capable of predicting the performance
of the SPP in more realistic form, detailed fluid flow and thermodynamic analyses of the SPP need
to be conducted in more depth.
In the present thesis, programmable algorithms and codes will be created based on
advanced thermal and fluid flow. Based on these programs and simulation, performance of the
SPP configuration will be predicted. In the previous experimental work, a 10 kW model of
refrigerant-cooled-condenser was tested. The experiments carried out showed the need for a more
detailed study when using a refrigeration system to cool a steam power plant condenser. To be
able to find improved solutions to these problems, additional experiments will be carried out in the
present work. The experiments to be performed will also help verify, supplement, and complement
the results obtained through the theoretical analysis and demonstrate the feasibility of integrating
the refrigeration based cycles into the condenser of the SPP.
Steam power plants (SPPs) are the major providers of electrical energy in most areas of the
world. One of the main components of the SPP is the condenser. A steam power plant condenser
(SPPC) is typically a shell and tube, in which the steam leaving the turbine is converted into a
liquid by the transfer of latent heat to the coolant, which is in most cases water. Steam power
plants are one of the largest users of water, often requiring construction near large water sources.
Page 76
54
The reliance on natural water sources leads to a variation in power plant efficiency due to seasonal
changes in ambient conditions. Moreover, both the intake of fresh water and release of exhaust
hot water from the power plant can be detrimental to the survival of organisms in the aquatic
environment, particularly fish and crustaceans. In addition, cooling water is the major source of
wastewater generated by most thermal power plants. A 500-MW facility generates about 3800 m3
per day of wastewater, with about 70% of this wastewater coming from cooling tower blow down
[87]. This wastewater can alter the chemical composition and temperature of the water body into
which it is released, which can affect fish and other aquatic organisms, animals, and the local
habitat. Another adverse impact of re-circulating cooling is the effects of the visual plume of vapor
emitted from the cooling tower. Such plumes represent a vision disturbance and in cold conditions,
some tower designs allow ice to form, which may coat the ground or nearby surfaces. Another
possible problem is carryover, where salt and other contaminants may be present in the water
droplets.
Changes in climate have led to water shortages in several areas of the world, which have
impacted electrical power production [79, 104]. Throttling of power output of numerous power
plants due to water shortages in Europe was required during the summer months of the years 2003
and 2006 due to high water temperature caused by a hot and dry summer [105]. Recently, new
restrictions on the use of fresh water have been proposed. The combination of environmental
impact and government regulations have motivated a search for alternative cooling systems by
means other than water for SPPC [43].
The design and operation of wet-cooled SPPC has received greater research attention.
Several studies have concluded that the operating pressure of the condenser and inlet cooling
temperature are important parameters that affect output power, power potential, and thermal and
Page 77
55
exergy efficiency of the cycle [48, 13]. The Effect of a steam–ammonia mixture on steam
condensation heat transfer in a horizontal shell and tube condenser was reported in Ref. [111].
Blending ammonia with steam was found to disturb the condensate film, which enhanced the
condensation heat transfer within 14–34%.
Dry cooling, other coolants, and energy storage systems for SPPC have recently received
increased attention as alternatives to wet systems. Dry-cooling systems have been used in thermal
power plants in many sites, even though electric power from dry-cooled power plants currently
costs 10–15% more than power from wet-cooled plants [103]. Dry cooling has been the subject of
some research, which has focused on improved heat exchanger geometries for finned tube bundles
in air-cooled condensers [108,109], enhancement of the performance of air-cooled condensers with
the use of limited water [22, 110], the use of an evaporative condenser [21], and using double wet
and dry condensers where the heat from the wet condenser is dissipated into a cold-storage
container [95]. Some of the investigators of this proposal performed a theoretical study, which
determined that R-134a is a superior coolant to water in SPPC [26]. They then made a comparative
study between using R-410A, R-407C, R-22, and R-134a as cooling mediums to select the best
efficient refrigerants for SPPC [24]. Based on these two analytical studies, R-410A was determined
to be the best refrigerant for cooling SPPC.
The main goals of this present work are to study in more depth the feasibility of using
VCRS for cooling SPPC. There are three options to study this goal. Integration of the refrigerant
system (RS) into SPP can be brought about by using the cold refrigerant liquid of the RS to directly
cool the steam in the SPPC (Figure 5.1). This configuration of combined RS and SPP requires
replacement of the existing SPPCs with RS. This is very costly and can be avoided while
improving the existing SPPCs performance through implementing one of the of two other
Page 78
56
configurations shown in Figures5. 2 and 5.3. In these configurations, the temperatures of the
cooling air of dry cooled and cooling water of wet cooled SPPCs are lowered by using VCRS
before admitted to the SPPC. It is to be mentioned here that the RSs shown in Figs 5.3 are all
VCRSs,
Figure 4.1 Configuration I. steam condenser cooled directly by a vapor compression cycle
_____ Water/steam _____ Refrigerant
𝑄𝑜𝑢𝑡
𝑄𝑖𝑛
Page 79
57
Figure 4.2 Configuration II. steam condenser cooled with air and vapor compression cycle
______ Water/steam _____ Refrigerant
Figure 4.3 Configuration III. steam condenser cooled with water and vapor compression cycle
_____ Water/steam _____ Refrigerant
𝑄𝑜𝑢𝑡
𝑄𝑖𝑛
𝑄𝑖𝑛
Page 80
58
The undesirable environmental impacts of using surface and ground water for cooling the
steam power plants encourage researchers around the world to find cooling method for these
plants. Also, the steam power plants that use water for cooling their condensers must be built
around the water bodies. In addition to the previous reasons, many countries found restrictions
on using water as a coolant for steam power plant. Therefore, some technologies have been
found for cooling the steam power plants. The present work will show the experimental test rig
construction and the effect of using refrigerant R-410A as a coolant in steam power plant using
the vapor compression refrigeration system. In this experiment, the refrigerant will not be used to
cool the condenser directly, the R-410A will be used to cooling the water in an intermediate heat
exchanger for two reasons. The first reason is to avoid the thermal stress that can be found due to
the temperature difference between the steam and R-410A. The second reason is to avoid the
excessive static pressure that may be found in order to decrease the pressure difference between
the steam and R-410A. For experimental the set up, there are two heat exchangers available with
different properties. The first one has a design pressure of 10.2 bar for both shell and tube sides.
The second available heat exchanger has a design pressure of 35 bar for the shell side, and it has
a 10.2 bar as a maximum allowable pressure for the tube side. The first one will be used as a
condenser in the steam loop and serve to condensate steam using chilled water or other water
source. The second heat exchanger will be used as an intermediate heat exchanger since the
steam pressure that enters the shell side is usually less than the working pressure of R-410A
which may reach to 31 bar.
The experimental part of this work, will be conducted using a 10 kW refrigerant-cooled-steam
condenser, developed in the MSU Turbomachinery Lab, shown in figure 5.4. Hence, the
objectives of this study are:
Page 81
59
1. To develop a 1-D & 2-D empirically-based theory for the thermal and fluid flow analyses,
taking into consideration the operating conditions of the SPP cycle and environment
2. To model fluid flow and heat transfer into and out of cold storage system used for boosting
steam power plant output during peak-load-periods
3. To create programmable algorithms and codes, established on the analyses, for predicting
the refrigerant based cycle’s performance under design-level conditions and different
operating conditions (off-deign, day & night, seasonal, startup and shutdown), of the SPP
cycle and environment; when using different refrigerants
4. To conduct experiments on the 10kW models of refrigerant-cooled-condensers, then to
verify, supplement and complement the results obtained through the theoretical analysis
and to demonstrate the feasibility of integrating the refrigeration based cycles into the
condenser of the SPP
5. To conduct cost analyses for the refrigerant cooled condenser
6. To verify that the goals and mission of current SPP requirements are met
7. Using the knowledge gained, to be able to design and optimize a cost effective refrigerant-
cooled-condenser unit for a specific SPP
8. To cooperate with power and refrigeration industries and thus to pave the way for the
commercialization of the refrigerant based condenser cooling technology
4.2 Experimental System Description
An experimental model of a steam power plant is illustrated in the following figure. The system
consists of three interacting main loops: steam loop, water loop, and VCRS loop. The steam loop
interacts with water loop through the condenser (8). The water loop interact with the VCRS
through the intermediate heat exchanger (16). In the steam loop, the steam will be generated
Page 82
60
Figure 4.4 The experimental setup to model the refrigerant-cooled-condenser of the steam power plant
Page 83
61
Table 4.1 The components of experimental test rig
Steam loop
(1) Water source (7) Steam outlet valve
(2) Water filter and ball valve (8) Condenser
(3) Float control valve (9) Air vent valve
(4) Boiler (10) Thermostatic check valve
(5) Drain valve (11) Graduated tank
(6) Pressure relief valve
Water loop
(12) Pressure reducing valve (16) Intermediate heat exchanger
(13) Thermal expansion tank (17) water low temperature switch
(14) Water high pressure switch (18) Circulator pump
(15) Water pressure relief valve (19) Rotameter
Refrigeration loop
(20) Refrigerant pressure relief valve (25) Vibration absorber
(21) Refrigerant low pressure switch (26) AC condenser system (ACCS)
(22) Refrigerant pressure regulator (27 ) Thermal expansion valve (TXV)
(23) Refrigerant accumulator (28) Glass Screen
(24) Refrigerant filter driers (29) Refrigerant high pressure switch
Page 84
62
4.2.1 Steam Loop
The steam loop which is considered as an open loop represents the actual steam power plant. The
steam loop has the following components.
4.2.1.1 Steam Generator
Steam generator (CMB- 9A, 6gal volume, 240 volt, and 3- phase) is responsible for providing 9
kW of the heat rate to generate steam at different selectable temperatures and steam pressures.
Above the generator and beside the steam vent there is a pressure relief valve to prevent the
pressure inside the boiler from exceeding 680 kPa.
Also, there is another valve to control the level of water inside the boiler called the float
control valve. This valve works by maintaining the pressure difference between the water flows
from the water source and the steam return from the boiler, 68 kPa. Moreover, T types of
thermocouples and bourdon gauges are connected to the inlet and outlet of the boiler to measure
the steam and water properties.
4.2.1.2 Steam Condenser
The condenser used in the steam loop contains a cylindrical steel shell with 16.7 W/m.k as a
thermal conductivity, 110 mm as an inner diameter, 114 mm as an outer diameter and 737 mm as
the length of shell. Around the shells, there are six copper u-tubes with 387 W/m.k as a thermal
conductivity, 18.16 as inner diameter and 0.889 as a thickness of each tube. The steam that is
generated in the boiler enters the condenser through the upper hole diameter 88 mm. Then, the
steam passes through the shell and condensates due to the heat exchange with cooling water. The
condensate drains through lower hole diameter 44 mm. A thermostatic check valve was installed
at the exit of condensate to allow only the liquid to pass to the graduated tank. To find the mass
flow rate of the condensate a stop watch is needed to calculate the volume of condensate in the
Page 85
63
graduated tank at specific time. A T type thermocouple and a bourdon tube gauge are fixed near
the exit of the condenser to measure the pressure and temperature of the condensate.
Figure 4.5 Steam condenser
The condenser was tested using R-22 at liquid phase and was circulated in the tube side.
We find that the temperature of the refrigerant at the inlet and outlet of the condenser are 7.22 °C
and 190 °C respectively, while the steam temperature at inlet was 103.6 kPa and has 170 bar as a
burst pressure.
Page 86
64
4.2.2 Water Loop
This loop is consider a closed loop and works as a link between the other two loops. It relates
with the steam loop by the condenser, and it connects with the VCRS by the intermediate heat
exchanger. The water loop consists of the following components.
4.2.2.1 Circulator Pump
The circulator pump’s function is to circulate and control the water flow rate in the water loop.
The allowable working pressure inside the pump is 9.5 bar, while the temperature range is -10 °C
to 110 °C.
Figure 4.6 Water circulator pump
Page 87
65
4.2.2.2 Water Expansion Tank
The water expansion tank with diaphragm is fixed near the water inlet valve, and it helps to
maintain the water working pressure at the required value. Also, the diaphragm can absorb the
expanded water during the operation. The maximum working temperature and pressure are 115
°C and 6.8 bar.
Figure 4.7 Expanssion tank with pressure valve
4.2.2.3 Water-Pressure Reducing Valve
The water-pressure reducing valve can control the pressure inside the water loop by filling the
required amount of water in the piping system. The working pressure in the valve ranges
between 68 and 170 kPa.
Page 88
66
4.2.2.4 Water-Pressure Relief Valve
The water-pressure relief valve is considered a safety valve in the water loop. It is usually closed,
but it opens when the pressure exceeds 204 kPa.
4.2.2.5 Intermediate Heat Exchanger (IHX)
The intermediate heat exchanger (200A, shell and tube type) consists of straight tubes with
epoxy-coated sheets, carbon steel shell, and heavy wall. The working pressure on the tube side
is 10.2 bar and 30.6 bar on the shell side. The cooling capacity on the heat exchanger is 11.43
kW for R-22 and 11 kW for R-410A. Also, IHX has a pressure relief and works as a safety for
the water loop. The operating temperature on the valve ranges between 29 °C and 93 °C. The
intermediate heat exchanger task is releasing heat into the refrigerant loop.
Figure 4.8 Intermediate heat exchanger
Page 89
67
4.2.3 Vapor Compression Refrigeration System Loop
The VCRS is a closed loop and considered the most important loop in the unit. The function of
this loop is to dissipate heat from the intermediate heat exchanger to the atmosphere. The VCRS
loop consists of the following components.
4.2.3.1 AC Condenser System
The air-cooled condenser system (3.0 Ton 14.5 SEER, 208/230 V, and single phase) dimensions
are 91.44 cm for height and 73.66 cm width and depth. The vapor line size in the system is 19
mm, and the liquid line size is 9.5 mm. The system was charged with R-410A, and the maximum
working pressure on ACCS is 34 bar. Above the air-cooled condenser there is a fan that helps in
releasing heat from R-410A to the atmosphere by circulating air surrounding the condenser
surface.
Figure 4.9 AC condenser unit
Page 90
68
4.2.3.2 Pressure Regulator Valve
The outlet pressure regulator with pilot operated (A9 series range A) is made of cooper. Its fluid
temperature range is -45 to 95 °C, while the working pressure range is between 34 and 816.33
kPa. The valve is installed in the vapor line outlet to control the pressure of steam.
4.2.3.3 Thermal Expansion Valve
The maximum working pressure in the valve is 45.5 bar, while the maximum fluid temperature is
100 °C. The expansion valve is put in the liquid line to do many tasks. The valve can control the
R-410A flow rate and the superheating at the intermediate heat exchanger. Also, it controls the
system’s cooling load.
Figure 4.10 Thermal expansion valve
Page 91
69
4.2.3.4 Suction Line Accumulator
The accumulator consists of steel shell material and solid copper connections. The chosen
accumulator has a height of 228 mm, a diameter of 127 mm, and a volume of 2.41 liter. The
temperature range on the accumulator is -29 to 47 °C, and the maximum working pressure is
20.68 bar. The suction line accumulator is used to allow only the gas to pass into air cooled
condenser system.
Figure 4.11 R-410A accumulator
4.2.3.5 Vapor and Liquid Lines Filter Drier
The vapor and liquid filter drier is installed close to the air-cooled condenser on the vapor and
liquid line to drive out contamination and moisture from the refrigerant loop. The working
Page 92
70
pressure for vapor filter drier is 34.5 bar and 49.6 bar for liquid filter drier, but the both filter
drier.
Figure 4.12 Filter driers and pressure regulator
4.2.4 Electrical Switches and Control
The experimental test rig contains four main electrical switches to control the operation and
safety inside the three loops. The main switches will be explained in details in the following
sections.
Page 93
71
Figure 4.13 Electrical control and switches
4.2.4.1 The High R-410A Pressure Switch
The high R-410A pressure switch is consider the primary safety switch for the vapor
compression refrigeration side loop and the shell side in IHX. The pressure range on this
pressure switch ranges between 3.4 bar and 34 bar.
Page 94
72
4.2.4.2 The Low R-410A Pressure Switch
The low R-410A pressure switch is another safety switch that adjusts the pressure in the
refrigerant loop to the required minimum pressure and hence can control its temperature. The
pressure range for the low pressure switch is 3.4 bar to 34 bar.
4.2.4.3 The High Water Pressure Switch
The high pressure switch is used to control the water working pressure inside the water loop. The
pressure switch consists of a valve with a spring return and valve actuator. The valve temperature
range is 0 to 93 °C and the flow coefficient is 3.5. The valve working pressure range is 67.8 to
680 kPa.
4.2.4.4 The Low Water Temperature Switch
This switch is responsible for adjusting the water temperature at the intermediate heat exchanger
outlet. Therefore, the switch is used to prevent freezing inside the IHX and can provide more
safety for the tubes. The temperatures can range between -34 and 32 °C.
4.2.5 Measurement Devices
In this section different measurement devices that used to measure temperature, pressure, and
flow rate in the three loops will be briefly explained.
4.2.5.1 Thermocouple
The thermocouples (T type and 316 SS) are used to measure the temperatures inside the
experimental test rig loop. Thermocouples have probes made of stainless steel with a length of
17.78 cm and a diameter of 1.5 mm. They are able to measure temperature ranges between -185
and 370. All thermocouples are connected to a digital thermometer to do the digital reading.
4.2.5.2 Bourdon Tube Gauge
The pressure inside the loops are measured using the bourdon tubes’ gauges. These tubes’
Page 95
73
gauges have different ranges according to their locations. The bourdon tube gauges in the liquid
line have a higher range than these found in the vapor lines.
4.2.5.3 Rotameter
Rotameters are the devices that are used to measure the water flow rate and prevent the water
flowing back to the water loop. The rotameter can measure up to 14.7 L/min. The maximum
pressure on the rotameter is 13.8 bar, while the maximum temperature is 80.
4.3 System Operational Challenges
Many challenges may be met when using the vapor compression refrigeration system for cooling
a steam power plant. In this section, the main challenges met during design, construction, and
operation of the experiment will be clearly addressed and described.
During the system operation, the experimental test rig was exposed to a large number of
vibrations due to the vapor compression refrigeration system. Therefore, it became necessary to
place the vapor compression system on a separate cart instead of putting the whole system on
one cart. Then, the two carts were connected through a vibration absorber.
Large thermal stress that can be found in the condenser tube wall is one challenge we met
at startup. As the cold refrigerant passes directly to the steam power plant condenser, the
temperature difference between the condensing steam and the cooling refrigerant increases.
Hence, the thermal stress inside the condenser tube will increase, and it may lead to damage to
the condenser material. To overcome this problem, an adjustable pressure ratio throttle valve
were fitted in the vapor compression refrigeration system loop to control the refrigerant
temperature before it left to the condenser.
The last critical challenge that we met is filling the vapor compression refrigeration
system with R-410A and that is because there is no standard for this unique system. Several tests
Page 96
74
were gotten during charging the unit with the refrigerator to fulfil the optimal charge which
correspond with the working condition ranges.
Page 97
75
5 Performance Evaluating of Steam Power Plant Condenser Cooled by a Vapor
Compression Refrigeration System Using Aspen-HYSYS
5.1 Introduction
A steady-state simulation model of a steam power plant condenser cooled by a vapor
compression refrigeration system is developed and validated using Aspen. First, an appropriate
thermodynamic model should be selected to fit with the working fluid properties. Since the
simulation of the steam and refrigerant cycle can be affected by the chosen thermodynamic
properties method, it is essential to choose carefully a proper model to estimate the properties of
the seam and refrigerants.
In this chapter, a steady-state simulation model of the engine is then developed.
Components model of the steam power plant cooled with vapor compression refrigeration unit so
local thermodynamic balances (energy, entropy and mass balance) are respected. Also,
thermodynamic balances were used to determine the inlet and outlet states of each component.
The recent work the simulation model developed selecting the same conditions
(temperatures, pressures, and duties) that used in the experimental part. The result was taken at
different condenser pressures and different mass flow rates. The simulation results are found to
be in perfect agreement with the experimental results.
After the simulation showed good concordance with the experimental results, another
additional numerical studies for the same model with other refrigerants were used. The best
model was then be chosen according to the coefficient of performance.
Page 98
76
5.2 Aspen Model Description
A proper selection of the equivalent blocks for the experimental main components is very
important in modeling the process in Aspen to allow a running model. The model consists of two
cycles: steam cycle and refrigeration cycle. These two cycles are connected with an intermediate
heat exchanger (IHX). The steam unit contains four components: boiler, condenser, intermediate
heat exchanger, and pump. The boiler receives water ant provides 9 kw to generate steam. Then,
the steam condensates in the steam condenser with 8.5 kw as a heat load of this unit, water is
used as a coolant for the steam that is generated in the boiler. The pump is used to pump more
water to the condenser. The default values of the pump are assumed to be 100% since this
parameter does not affect the overall cycle efficiency.
Figure 5.1 Aspen-Hysys model of indirect cooling
Page 99
77
Figure 5.2 Aspen-Hysys model of direct cooling
The compression refrigeration system also contains four components: compressor,
expansion valve, evaporator, and air condenser. First, the water used for cooling in the steam cycle
is cooled by refrigerant (R-410A, NH3, R-134A) in the intermediate heat exchanger that works as
an evaporator. Then, the refrigerant is cooled by using an air condenser. The previous model was
then modified to cool the condenser directly by the refrigerant as shown in the Figure 5.2.
Page 100
78
Table 5.1 Machine elements and their Aspen models with input data
Machine
Element
Aspen Block Input Values
Steam generator Boiler/Thermal
and phase
change
Water inlet temperature = 23 °C
Water mass flow rate = 3.5 g/s
Boiler duty = 9 kw
Condenser Two-flow heat
exchanger
water inlet temperature (cold stream) = 9 to
32 °C
water mass flow rate = 0.056, 0.11, 0.13 kg/s
condensate outlet = 83.5 °C
Condenser duty = 8.489 kw
Evaporator
(IHX)
Two-flow heat
exchanger
Refrigerant inlet temperature = -7.5 to -3.5 °C
Refrigerant inlet pressure = 650 kPa to 750
kPa
Pump Pump/Pressure
changer
Isentropic efficiency = 1
Compressor Compressor/Pre
ssure changer
Compressor duty = 4.5 kw
Expansions
Valve
Control valve
and pressure
exchanger
Working pressure = 5.5 bar
AC condenser Two-flow heat
exchanger
Air inlet mass flow rate = 424.1 g/s
Condenser duty = 13 kw
5.3 Result and Discussion
This section will show the results of Aspen simulation for a steam power plant condenser that is
cooled by a compression refrigeration system.
Page 101
79
(a) Experimental Results vs. Aspen model results
Figure 5.3 Expermintal COP results versus the Aspen model COP results at 𝑚𝑐𝑙=0.056 kg/s
Page 102
80
Figure 5.4 Expermintal COP results versus the Aspen model COP results at
𝑚𝑐𝑙=0.11 kg/s
Page 103
81
Figure 5.5 Expermintal COP result versus the Aspen model COP results at
𝑚𝑐𝑙=0.13 kg/s
Page 104
82
Figure 5.6 Expermintal 𝑚𝑐𝑜 results versus the Aspen model 𝑚𝑐𝑜 results at
𝑚𝑐𝑙=0.056 kg/s
Page 105
83
Figure 5.7 Expermintal 𝑚𝑐𝑜 results versus the Aspen model 𝑚𝑐𝑜 results at
𝑚𝑐𝑙=0.11 kg/s
Page 106
84
Figure 5.8 Expermintal 𝑚𝑐𝑜 results versus the Aspen model 𝑚𝑐𝑜 results at
𝑚𝑐𝑙=0.13 kg/s
Page 107
85
The Figure 5.3 shows the experimental COP results versus the Aspen model COP results as
𝑚𝑐𝑙=0.056 kg/s at three different pressures. As regards the 𝑃𝑐= 101.325 kPa, the maximum
deviation is observed to be less than 1.4 %. However, the maximum deviation increased to
4.7% as the 𝑃𝑐 decreased to 84.382 kPa. The maximum deviation return to decreases to 2.6%
at the least value of condenser pressure. From Figure 5.5 is shown that the difference between
experimental results and the Aspen model results do surpass 5% and that happens at 𝑃𝑐= 70.825
kPa. Finally, as the coolant mass flow rate increased to 0.13 kg/s, the maximum deviation in
COP is 4.8% at 𝑃𝑐= 101.325.
In Figures 5.6 through 5.8 the condensate mass flow rates of the experimental system are
plotted versus the condensate mass flow rates in aspen model at three different coolant mass
flow rates and condenser pressures. Figure 5.9 depicts the results at 𝑚𝑐𝑙=0.056 kg/s and three
different pressures. The maximum difference between experimental result and the Aspen result
does not exceed 2%. Figure 5.6 shows that the deviation in the compression results are very
small. Lastly, we can see that the maximum deviation happened at the maximum coolant mass
flow rate is 1.3%.
(b) Model prediction of using various refrigerants for cooling the SPPC
In this second step, the Aspen- HYSYS model for the experimental is then modified to
compare five different refrigerants. R-410A, R-404A, R-407C, R-134a, and NH3 are used in
the Aspen model to choose the most efficient that can produce the highest COP and
condensate mass flow rate value. The compression between the five refrigerants is done at
three different condenser pressures and coolant mass flow rates. The performance of the
refrigerant cycle is quantified by using the coefficient of performance, so as the COP
increases, the performance of cycle improves. From previous figures we can find that NH3
Page 108
86
provide the highest COP at all different condenser pressures and coolant mass flow rates. The
higher the condensation rate, the better the condenser performance is. For all cases, NH3
provides the highest condensation rates compared with the other four refrigerants.
Figure 5.9a Coefficient of performance of SPP with different refrigerants at 𝑚𝑐𝑙=0.056 kg/s and 𝑃𝑐=
101.325 kPa
Page 109
87
Figure 5.9b Coefficient of performance of SPP with different refrigerants at 𝑚𝑐𝑙=0.11 kg/s and 𝑃𝑐=
101.325 kPa
Figure 5.9c Coefficient of performance of SPP with different refrigerants at 𝑚𝑐𝑙=0.131 kg/s and 𝑃𝑐=
101.325 kPa
Page 110
88
Figure 5.10a Coefficient of performance of SPP with different refrigerants at 𝑚𝑐𝑙=0.056 kg/s and 𝑃𝑐=
84.385 kPa
Figure 5.10b Coefficient of performance of SPP with different refrigerants at 𝑚𝑐𝑙=0.11 kg/s and 𝑃𝑐=
84.385 kPa
Page 111
89
Figure 5.10c Coefficient of performance of SPP with different refrigerants at 𝑚𝑐𝑙=0.13 kg/s and 𝑃𝑐=
84.385 kPa
Figure 5.11a Coefficient of performance of SPP with different refrigerants at 𝑚𝑐𝑙=0.056 kg/s and 𝑃𝑐=
70.825 kPa
Page 112
90
Figure 5.11b Coefficient of performance of SPP with different refrigerants at 𝑚𝑐𝑙=0.11 kg/s and 𝑃𝑐=
70.825 kPa
Figure 5.11c Coefficient of performance of SPP with different refrigerants at 𝑚𝑐𝑙=0.13 kg/s and 𝑃𝑐=
70.825 kPa
Page 113
91
Figure 5.12a Condensation rate in SPP with different refrigerants at 𝑚𝑐𝑙=0.05 kg/s and 𝑃𝑐= 101.325 kPa
Figure 5.12b Condensation rate in SPP with different refrigerants at 𝑚𝑐𝑙=0.11 kg/s and 𝑃𝑐= 101.325 kPa
Page 114
92
Figure 5.12c Condensation rate in SPP with different refrigerants at 𝑚𝑐𝑙=0.13 kg/s and 𝑃𝑐= 101.325 kPa
Figure 5.13a Condensation rate in SPP with different refrigerants at 𝑚𝑐𝑙=0.056 kg/s and 𝑃𝑐= 84.382 kPa
Page 115
93
Figure 5.13b Condensation rate in SPP with different refrigerants at 𝑚𝑐𝑙=0.11 kg/s and 𝑃𝑐= 84.382 kPa
Figure 5.13c Condensation rate in SPP with different refrigerants at 𝑚𝑐𝑙=0.13 kg/s and 𝑃𝑐= 84.382 kPa
Page 116
94
Figure 5.14a Condensation rate in SPP with different refrigerants at 𝑚𝑐𝑙=0.056 kg/s and 𝑃𝑐= 70.825 kPa
Figure 5.14b Condensation rate in SPP with different refrigerants at 𝑚𝑐𝑙=0.11 kg/s and 𝑃𝑐= 70.825 kPa
Page 117
95
Figure 5.14c Condensation rate in SPP with different refrigerants at 𝑚𝑐𝑙=0.13 kg/s and 𝑃𝑐=
70.825 kPa
(C) Model prediction of comparison between direct cooling and indirect cooling
This section presents a comparative numerical study of using water and refrigerant to cool the
SPPC (indirect cooling) and using only the refrigerant (direct cooling) for cooling the
condenser.
Page 118
96
Figure 15a Direct cooling COP results versus the indircect cooling COP results at 𝑚𝑟𝑒𝑓=0.056 kg/s and
𝑃𝑐= 101.325 kPa
Figure 5.15b Direct cooling COP results versus the indirect cooling COP results at 𝑚𝑟𝑒𝑓=0.056 kg/s and
𝑃𝑐= 84.382 kPa
Page 119
97
Figure 5.15c Direct cooling COP results versus the indircect cooling COP results at 𝑚𝑟𝑒𝑓=0.056 kg/s and
𝑃𝑐= 70.825 kPa
Figure 5.16a Direct cooling COP results versus the indircect cooling COP results at 𝑚𝑟𝑒𝑓=0.11 kg/s and
𝑃𝑐= 101.325 kPa
Page 120
98
Figure 5.16b Direct cooling COP results versus the indirect cooling COP results at 𝑚𝑟𝑒𝑓=0.11 kg/s
and 𝑃𝑐= 84.382 kPa
Figure 5.16c Direct cooling COP results versus the indirect cooling COP results at 𝑚𝑟𝑒𝑓=0.11 kg/s
and 𝑃𝑐= 70.825 kPa
Page 121
99
Figure 5.17a Direct cooling COP results versus the indirect cooling COP results at 𝑚𝑟𝑒𝑓=0.131 kg/s
and 𝑃𝑐= 101.325 kPa
Figure 5.17b Direct cooling COP results versus the indirect cooling COP results at 𝑚𝑟𝑒𝑓=0.131 kg/s
and 𝑃𝑐= 84.382 kPa
Page 122
100
Figure 5.17c Direct cooling COP results versus the indirect cooling COP results at 𝑚𝑟𝑒𝑓=0.131 kg/s
and 𝑃𝑐= 70.825 kPa
Figure 5.18a Condensation rate in direct cooling versus the condensation rate in indirect cooling at
𝑚𝑟𝑒𝑓=0.056 kg/s and 𝑃𝑐= 101.325 kPa
Page 123
101
Figure 5.18b Condensation rate in direct cooling versus the condensation rate in indirect cooling at
𝑚𝑟𝑒𝑓=0.056 kg/s and 𝑃𝑐= 84.382 kPa
Figure 5.18c Condensation rate in direct cooling versus the condensation rate in indirect cooling
at 𝑚𝑟𝑒𝑓=0.056 kg/s and 𝑃𝑐= 70.825 kPa
Page 124
102
Figure 5.19a Condensation rate in direct cooling versus the condensation rate in indirect cooling
at 𝑚𝑟𝑒𝑓=0.11 kg/s and 𝑃𝑐= 101.325 kPa
Figure 5.19b Condensation rate in direct cooling versus the condensation rate in indirect cooling at
𝑚𝑟𝑒𝑓=0.11 kg/s and 𝑃𝑐= 84.382 kPa
Page 125
103
Figure 5.19c Condensation rate in direct cooling versus the condensation rate in indirect cooling
at 𝑚𝑟𝑒𝑓=0.11 kg/s and 𝑃𝑐= 70.825 kPa
Figure 5.20a Condensation rate in direct cooling versus the condensation rate in indirect cooling
at 𝑚𝑟𝑒𝑓=0.131 kg/s and 𝑃𝑐= 101.325 kPa
Page 126
104
Figure 5.20b Condensation rate in direct cooling versus the condensation rate in indirect cooling at
𝑚𝑟𝑒𝑓=0.131 kg/s and 𝑃𝑐= 84.382 kPa
Figure 5.20c Condensation rate in direct cooling versus the condensation rate in indirect cooling at
𝑚𝑟𝑒𝑓=0.131 kg/s and 𝑃𝑐= 70.825 kPa
Page 127
105
Figure 5.21a Direct cooling COP results for different refrigerants at 𝑃𝑐= 101.325 kPa and 𝑚𝑟𝑒𝑓=0.005
kg/s
Figure 5.21b Direct cooling COP results for different refrigerants at 𝑃𝑐= 101.325 kPa and 𝑚𝑟𝑒𝑓=0.01
kg/s
Page 128
106
Figure 5.22a Direct cooling COP results for different refrigerants at 𝑃𝑐= 84.382 kPa and 𝑚𝑟𝑒𝑓=0.005
kg/s
Figure 5.22b Direct cooling COP results for different refrigerants at 𝑃𝑐= 84.382 kPa and 𝑚𝑟𝑒𝑓=0.01
kg/s
Page 129
107
Figure 5.23a Direct cooling COP results for different refrigerants at 𝑃𝑐= 70.825 kPa and 𝑚𝑟𝑒𝑓=0.005 kg/s
Figure 5.23b Direct cooling COP results for different refrigerants at 𝑃𝑐= 70.825 kPa and 𝑚𝑟𝑒𝑓=0.01
kg/s
Page 130
108
Figure 5.24a Condensation rate in direct cooling for different refrigerantat 𝑃𝑐= 101.325 kPa and
𝑚𝑟𝑒𝑓=0.005 kg/s
Figure 5.24b Condensation rate in direct cooling for different refrigerantat 𝑃𝑐= 101.325 kPa and
𝑚𝑟𝑒𝑓=0.01 kg/s
Page 131
109
Figure 5.25a Condensation rate in direct cooling for different refrigerantat 𝑃𝑐= 84.382 kPa and
𝑚𝑟𝑒𝑓=0.005 kg/s
Figure 5.25b Condensation rate in direct cooling for different refrigerantat 𝑃𝑐= 84.382 kPa and
𝑚𝑟𝑒𝑓=0.01 kg/s
Page 132
110
Figure 5.26a Condensation rate in direct cooling for different refrigerantat 𝑃𝑐= 70.825 kPa
and𝑚𝑟𝑒𝑓=0.005 kg/s
Figure 5.26b Condensation rate in direct cooling for different refrigerantat 𝑃𝑐= 70.825 kPa and
𝑚𝑟𝑒𝑓=0.01 kg/s
Page 133
111
Table 5.2 Percentage variation of condensation rate and COP with different pressures
Coolant
Name
Coolant Properties Indirect cooling Direct cooling
Coolant
inlet temp.
(°C)
Condenser
pressure
(kPa)
COP%
Mcondensate%
COP%
Mcondensate%
R-134a
-11
101.325 0.43 0.24 0.55 0.43
84.382 0.45 0.28 0.57 0.45
70.825 0.46 0.32 0.59 0.47
-3
101.325 0.11 0.11 0.21 0.31
84.382 0.13 0.13 0.23 0.33
70.825 0.14 0.14 0.24 0.34
R-410A
-11
101.325 0.49 0.27 0.59 0.47
84.382 0.51 0.34 0.63 0.49
70.825 0.52 0.36 0.65 0.51
-3
101.325 0.17 0.14 0.27 0.36
84.382 0.18 0.17 0.29 0.39
70.825 0.19 0.19 0.30 0.41
NH3
-11
101.325 0.61 0.42 0.71 0.53
84.382 0.65 0.47 0.73 0.54
70.825 0.67 0.49 0.75 0.55
-3
101.325 0.22 0.23 0.32 0.39
84.382 0.24 0.25 0.34 0.41
70.825 0.25 0.27 0.35 0.42
In direct cooling, the maximum ammonia mass flow rate can be used for cooling could not
exceed 10 g/s. However the lowest value of cooling water in the direct cooling was 56 g/s, so it
is not logical to compare indirect and direct cooling by using ammonia. In figures 21a -26b a
compressions between three refrigerant were indicated using the direct cooling. These
Page 134
112
compression were done at two different coolant mass flow rates (5 g/s and 10 g/s) and the same
direct cooling condenser pressures to show best refrigerant that can provide the highest COP and
condensate mass flow rates. The previous figures showed using ammonia at the same condition
in compression with R-410A and R-134a improves the COP in VCRS and increases the
condensate mass flow rate.
In the current study, a numerical study has been developed for possible use of vapor compression
refrigeration system to cool steam power plant condenser. First, the comparison showed good
agreement between the Aspen- HYSYS model results and the experimental results. Therefore, it
is concluded that the proposed Aspen-HYSYS model can be very useful tool for predicting the
condensation rates and the coefficients performance of the steam power plant condenser cooled
directly by VCRS.
Page 135
113
6 Theoretical Study of Using a Vapor Compression Refrigeration System for Cooling the
Condenser of a Steam Power Plant
6.1 Introduction
In this chapter, the analytical study of the thermodynamic of using R-410A as a coolant in a steam
power plant condenser. As known, the refrigerant can generate higher thermal loads due to its high
working pressure and low temperature. In addition, the refrigerant has a higher heat transfer rate
than air and water. Engineering Equation Solver and MATLAB with the axillary function is used
to analyze the thermodynamic properties of the combined systems.
6.2 The Steam Power Plant System (Reference System)
The reference steam power plant flows an idealized thermodynamic cycle is called a Rankine
cycle. The reference steam power plant consists of turbine, steam generator (boiler), condenser,
and feed water pump. In addition, high temperature and low temperature reservoirs are needed to
complete the steam power plant cycle. The figure shows the arrangement of steam power plant
components.
In the boiler high pressure steam is generated, and then the steam is expanded through the
turbine at low pressure. Work will be produced by the turbine then will be converted to electricity
and this is the function of the generator. The exhaust steam leaving the turbine will be condensed
in the condenser (water- air condenser). The pump will move the condensate fluid again to the
steam generator.
Page 136
114
Figure 6.1 a schematic of a simple steam power plant with air-cooled condenser
a air cooled steam condenser b steam turbine
c steam boiler d pump
Figure 6.2 T-s diagram of the reference steam power plant
Page 137
115
6.3 The Combined System of SPPS and VCRS (Studied System)
As we described the reference steam power plant in the previous section, here a new suggestion
will be added to the new combined system. In the new system, the air-cooled system is replaced
with a refrigerant-cooled condenser. The function of the vapor compression refrigeration system
is to reject the heat to the surrounding atmosphere. The following figure shows the schematic of
the new system.
Figure 6.3 a schematic of proposed integrated system
_____ Water/steam _ _ _ _ Refrigerant
Page 138
116
Table 6.1 Components of the proposed integrated system
a steam condenser/refrigerant evaporator b feed water pump
c refrigerant compressor I d refrigerant compressor II
e water-cooled refrigerant condenser f air-cooled refrigerant con
g throttle valve I h flash chamber
I liquid suction HX j throttle valve II
k steam boiler l steam turbine
Figure 6.4 T-s diagram of combined system
Page 139
117
Figure 6.5 p-h diagram of combined system
In the vapor compression refrigeration cycle, when the low pressure refrigerant vapor
leaves, the liquid line heat exchanger is directly compressed to intermediate pressure throw the
first compressor them feeding to the flash chamber where the two phases of the refrigerant will
separate
Then, some of compressed vapor leaving the first stage of compression goes through the
second compressor, and then passes to the refrigerant compressor. The section line heat
exchanger here works to dissipate the heat from the high pressure refrigerant that comes from the
chamber. The two refrigerant condensers are responsible for removing heat that is absorbed by
the heat of compression and the condensing steam. For the condensed refrigerant liquid and low
pressure liquid refrigerant liquid, the first one passes through the expansion valve, and the other
one crosses the condenser and evaporator tubes. The low pressure refrigerant absorbs the heat
and becomes vapor. As this vapor and condensate water leave the cycle is completed.
Page 140
118
6.4 Energy Analysis of the Reference System and the Studied System
Based in the thermodynamic analysis, the performance of cooling the steam power plant
condenser with the vapor compression refrigeration system and the performance of cooling of
the reference system at operating condition will be presented in this section. The two following
figures show the T-s diagrams for the reference system corresponding to the Rankine cycle, also
the diagram of studied system. In addition, there is a p-h diagram illustrating the vapor
compression refrigeration system of the studied system.
Many of the assumption are taken during the analysis study of these two systems. we
assume the ∆Tsc,rs is higher than air cooling at the inlet of the condenser. Then, we can calculate
the specific load of boiler qb,rs, specific work of turbine wt,rs , specific work of the pumpwp,rs,
and the specific load of condenser qsc,rs from the following equation:
qb,rs = h1 − h4 (6.1)
qc,rs = h2 − h3 (6.2)
wt,rs = (h1 − h2)/η𝑚,𝑡,𝑟𝑠 (6.3)
wp,rs = (h1 − h4)/η𝑚,𝑝,𝑟𝑠 (6.4)
Also, the thermal efficiency of the reference system can be calculated by
η𝑡ℎ,𝑟𝑠 = [[(h1 − h2)
η𝑚,𝑡,𝑟𝑠− (h1 − h4)/η𝑚,𝑝,𝑟𝑠]/(h1 − h4) (6.5)
On the other hand, for the studied system we assume that ∆Trc,ac is higher than the ambient
temperature. The characteristic parameters that describe the performance of the studied system
can then be calculated using the following equations:
qb,ss = h15 − h14 (6.6)
Page 141
119
qc,ss = h16 − h12 (6.7)
wt,ss = (h13 − h12)/η𝑚,𝑡,𝑠𝑠 (6.8)
wp,ss = (h13 − h12)/η𝑚,𝑝,𝑠𝑠 (6.9)
ηth,ss = ⌊(h15 − h16
ηm,t,ss) − (
h13 − h12
ηm,p,ss)⌋ /⌊(h1 − h4) + wco,I + wco,II⌋ (6.10)
Here are some characteristic parameters that are used to calculate the refrigeration cycle
mr
ms=
(h16 − h12)
(h11 − h10) (6.11)
𝑞𝑟𝑐,𝑤𝑐 =mr
ms
(h4 − h5) (6.12)
𝑞𝑟𝑐,𝑎𝑐 =mr
ms
(h5 − h6) (6.13)
wco,I =mr
msηm,co,I
(h2 − h1) (6.14)
wco,II =mr
msηm,co,II
(h4 − h3) (6.15)
𝑞𝑒 =mr
ms
(h11 − h10) (6.16)
COP =(h11 − h10)
⌊((h2 − h1)
ηm,co,I) + (
(h4 − h3)ηm,co,II
)⌋ (6.17)
Page 142
120
6.5 Result and Discussion
One advantage of using vapor compression refrigeration for cooling any steam power plant
condenser is controlling the condensate fluid temperature, depending on the surroundings
conditions. As the condensate fluid gets low, the turbine output power increases. Even though,
the lower condensate temperature increases the turbine produced power, the coefficient of
performance will decrease as the condensate temperature decreases. Thus, the vapor compression
system needs more power to keep its running.
Depending on the previous thermodynamic analysis and using various operation
conditions, the effects of decreasing the condensate temperatures on the reference and studied
system will be described in detail in this section. Also, a compression study between the
reference and studied systems will discuss bases on the vapor compression refrigeration system
by using the above table.
Page 143
121
Table 6.2 Design data for steam cycle of the studied and reference systems
Parameter Symbol Value
Steam Cycles of both the reference and studied systems
Steam turbine inlet pressure p1 100 bar
Steam turbine inlet temperature T1 saturated
Steam turbine efficiency ηt,rs and ηt,ss 0.85
Water feed pump efficiency ηp,rs and ηp,ss 0.85
Mechanical efficiency of the steam turbine and feed pump ηm,t,rs, ηm,p,rs, ηm,t,ss
and ηm,p,ss 0.75
Steam cycle of the reference system
Difference between the saturated temperature of the
condensing steam in the reference system condenser and
cooling air inlet temperature
ΔTsc,rs 10 oC
Steam cycle of the Studied system
Difference between the saturated temperatures of condensing
steam and vaporizing refrigerant in the studied system
condenser
ΔTsc,ss 4 oC
Difference between the refrigerant saturated temperature in
the air-cooled refrigerant condenser and the cooling water
temperature.
ΔTrc,wc 4oC
Vapor compression refrigeration system (Ammonia is used as refrigerant)
Refrigerant compressor efficiency ηco,I and ηco,II 0.85
Effectiveness of LLSL-HX εLLSL 0.8
Mechanical efficiency of the refrigerant compressors ηm,co,I and ηm,co,II 0.85
Difference between the cooling air inlet temperature and
refrigerant saturated temperature in the refrigerant air-cooled
condenser ∆trc,ac 10 oC
Page 144
122
For the reference system, the difference in temperature between steam in air should be
between 10 -15 oC to enable heat to transfer effectively between these two fluid, so the ∆tsc,rs is
taken at 10 oC. In the studied system and during the condensation process, both the refrigerant
and steam temperature remain constant, so the ΔTsc,ss is taken at 4 oC.
Figure 6.6 The coefficient of performance of the VCRS on the temperature of the studied system
condenser
_______ta=50oC _______ ta=40oC _______ ta=30oC
The figure describes the effect of the steam power plant condenser for the studied system.
As the figure shows the coefficient of performance of the vapor compression refrigerant
increases as the ambient temperature decreases. Also, the coefficient of performance of vapor
compression refrigeration is enhanced as the condensate temperature increases.
2
4
6
8
10
12
14
10 15 20 25 30 35 40 45 50
Co
effi
cien
t o
f p
erfo
rman
ce C
OP
Condensate temperature tsc (°C)
Page 145
123
Figure 6.7 Boiler specific load versus the temperature of the studied system condenser
_____ 𝑞𝑏,𝑠𝑠 _____𝑞𝑏,𝑠𝑠
The figure depicts the effect of the ambient temperatures on the pump load. The pump
loads for the reference and studied systems increase as the ambient temperatures increases. Also,
the condensate temperature has no effect on the pump load for both the reference and studied
systems.
2450
2470
2490
2510
2530
2550
2570
10 15 20 25 30 35 40 45 50
Bo
iler
spec
ific
load
qb
kJ/
kg
Condensate temperature tsc (°C)
ta=30oC
ta=40oC
ta=50oC
Page 146
124
Figure 6.8 Specific load of the steam plant condenser against the temperature of the steam plant
condenser of the studied system
_____ ta= 50oC _____ ta= 40oC _____ ta= 30oC
Inclined line qsc,ss Horizontal lines qsc,rs
It is seen from the figure that the specific load of the steam condenser of both reference
and studied systems is an independent parameter of the steam condenser temperature. And that
means the enthalpy of the steam that enters the condenser and condensate that is leaving the
condenser do not depend on the temperature of the condenser.
In the figure 4.10 the specific work of the turbine is plotted versus the condensate
temperature. The figure shows that as the condensate temperature and pressure do not change,
the specific work of turbine in the studied system is an independent parameter of the ambient
temperature. However, this specific work decreases with an increasing in the condensate
temperature with condenser pressure increasing.
1715
1720
1725
1730
10 15 20 25 30 35 40 45 50
Stea
m c
on
den
ser
spec
ific
load
qsc
kJ/
kg
Condensate temperature tsc (°C)
Page 147
125
Figure 6.9 Specific load of the steam plant condenser against the temperature of the steam plant
condenser of the studied system
_______ ta= 50oC _______ ta= 40oC _______ ta= 30oC
Inclined line wt,ss Horizontal lines wt,ss
Figure 6.10 Thermal efficiency of combined actual steam and refrigeration cycle versus
temperature of the steam plant condenser of the studied system
____ ηth,ss ____ ηth,rs
540
560
580
600
620
640
660
680
700
720
740
10 15 20 25 30 35 40 45 50
Spec
ific
wo
rk w
t k
J/kg
Condensate temperature tsc (°C)
0.225
0.230
0.235
0.240
0.245
0.250
10 15 20 25 30 35 40 45 50
Ther
mal
eff
iicie
ncy
th
Condensate temperature tsc,ss oC
ta=50oC
ta=40oC
ta=30oC
Page 148
126
Figure 6.11. Effect of the temperature of the steam plant condenser on the specific refrigerant mass for
the studied system
Figure 6.12. Effect of the temperature of the steam plant condenser on the heat removed in the water
cooled condenser of the refrigerant cycle of the studied system
____ ta= 50oC ____ ta= 40oC ____ ta= 30 oC
1.35
1.40
1.45
1.50
1.55
1.60
1.65
10 15 20 25 30 35 40 45 50
Mas
s ra
tio
mr/
ms
Condensate temperature tsc,ss oC
0.02
0.04
0.06
0.08
0.10
0.12
0.14
0.16
10 15 20 25 30 35 40 45 50
Hea
t re
atio
qrc
,cw
/qrc
,ct
Condensate temperature tsc,ss oC
Page 149
127
7 Conclusions and Recommendations for Future Work
7.1 Conclusions
Experimental, numerical, and theoretical studies of thermodynamics analysis in steam
power plant condenser were performed. First, an experimental test rig was fabricated to study the
possibility of using vapor compression refrigeration system for cooling the steam power plant
condenser. Secondly, the numerical comparison between using direct cooling and indirect cooling
of a steam power plant (also another comparison between using different refrigerant as cooling
media for steam plant condenser) was presented in this thesis. This numerical study was carried
out using the Aspen-HYSYS approach. Finally, an analytical study was done to evaluate the
concept of cooling the steam power plant condenser using a vapor compression refrigeration
system under different operating conditions. The main conclusions can be drawn as follows:
1. The experimental study showed that decreasing the coolant temperature and increasing
the coolant mass flow rate has effects on increasing the condensation rate.
2. Higher COP values in the vapor compression refrigeration system can be occur at lower
condenser pressure and coolant temperature.
3. As the coolant temperature decrease, the vacuum inside the condenser will rise up and
then the power plant efficiency will increase.
4. The numerical study revealed that NH3 has the best heat transfer characteristic and
condensation rates.
5. The numerical compression proved that using refrigerants for steam condenser is better
than using water as a coolant because it provides more condensation rates.
Page 150
128
6. The analytical results indicated that using VCRS for cooling the steam power plant
condenser can improve the thermal efficiency compared to the steam plant when the
condenser is cooled using ambient temperature.
7. The studies showed that the maximum coefficient of heat transfer between the steam and
the refrigerant is achieved and the condenser becomes compact.
8. The restrictions of using fresh, river, and sea water for a cooling steam power plant can
be solved by using the VCRS.
7.2 Recommendations for Future Work
For future work, the following recommended.
1. Develop a 3D CFD model for condensation of water vapor in steam condenser.
2. Conduct cost analyses for the refrigerant cooled condenser.
3. Using the knowledge gained, design and optimize a cost effective refrigerant-cooled-
condenser unit for a specific steam power plant.
Page 152
130
APPENDIX A
Experimental and Numerical Data
Table A.1 Aspen result of steam power plant cooled by R-410A at mcl = 0.056 kg/s
mcl pc Tcl-in Tcl-out mcon COP
0.056
101.3
9.5 40.1 3.55 2.28
12.3 42.10 3.50 2.22
17.4 44.10 3.43
2
21.9 47.11 3.30 1.918
27 49.11 3.15 1.72
31.9 52.11 3.11 1.65
84.382
9.4 39 3.71 2.23
12.2 41.10 3.63 2.10
17.2 43.21 3.41 2.02
21.6 45.30 3.27 1.89
27.3 48.50 3.12 1.73
31.6 50.8 3.10 1.649
70.825
9.5 40.09 3.67 2.24
12 41.01 3.60 2.19
17.4 44.12 3.53 2.09
22.1 46.32 3.37 1.94
26.8 50.37 3.28 1.84
31.7 53.20 3.16 1.65
Page 153
131
Table A.2 Aspen result of steam power plant cooled by R-410A at mcl = 0.11 kg/s
mcl pc Tcl-in Tcl-out mcon COP
0.11
101.3
9.3 27 3.69 2.29
12.5 29.50 3.57 2.21
17.5 32.46 3.44 2.06
21.7 36.90 3.39 1.93
27 39.60 3.26 1.84
31.9 41.47 3.21 1.73
84.3
9.2 26.10 3.83 2.26
12.4 38.30 3.76 2.16
17.4 32.74 3.69 2.05
22 37.60 3.51 1.98
27.2 39.30 3.45 1.77
31.8 41.15 3.38 1.69
70.8
9.1 26.30 3.89 2.27
12.6 28.50 3.81 2.20
17.3 32.70 3.74 2.11
22.1 38.02 3.62 1.96
26.8 38.94 3.56 1.85
31.7 41.33 3.50 1.69
Page 154
132
Table A.3 Aspen result of steam power plant cooled by R-410A at mcl = 0.131 kg/s
mcl pc Tcl-in Tcl-out mcon COP
0.131
101.3
9.6 25.34 3.79 2.34
12.2 27.80 3.73 2.25
16.6 30.16 3.65 2.11
22.6 35.67 3.57 1.96
27.3 39.45 3.46 1.89
31.7 44.51 3.38 1.81
84.3
9.5 25.13 3.86 2.32
12.3 27.23 3.80 2.19
17 32.12 3.71 2.10
22.4 36.14 3.67 1.02
27.4 41.01 3.57 1.88
31.7 43.51 3.45 1.75
70.8
9.3 25.11 4.017 2.35
12.4 27.13 4.003 2.29
17.1 30.78 3.892 2.17
22.5 36.53 3.768 2.09
26.9 39.17 3.658 1.91
31.7 42.90 3.547 1.75
Page 155
133
Table A.4 Aspen result of steam power plant cooled by R-134a at mcl = 0.056 kg/s
mcl pc Tcl-in Tcl-out mcon COP
0.056
101.3
9.5 30.10 3.60 2.20
12.3 33.90 3.45 2.17
17.4 37.76 3.33 1.91
21.9 40.47 3.24 1.87
27 45.16 3.13 1.67
31.9 48.09 3.07 1.63
84.3
9.4 30.11 3.79 2.17
12.2 34.41 3.69 2.06
17.2 37.91 3.54 1.87
21.6 41.15 3.41 1.86
27.3 44.11 3.26 1.73
31.6 47.90 3.09 1.63
70.8
9.5 32.15 3.80 2.16
12 35.03 3.70 2
17.5 39.43 3.62 1.93
21.5 42.32 3.52 1.83
27.4 45.02 3.43 1.73
31.7 48.37 3.32 1.66
Page 156
134
Table A.5 Aspen result of steam power plant cooled by R-134a at mcl = 0.11 kg/s
mcl pc Tcl-in Tcl-out mcon COP
0.11
101.3
9.3 30.09 3.76 2.20
12.5 33.81 3.63 2.15
17.5 38.27 3.55 1.94
21.7 42.49 3.46 1.86
27 46.35 3.36 1.80
31.9 50.11 3.26 1.47
84.3
9.2 31 3.92 2.16
12.4 33.41 3.80 2
17.4 37.67 3.66 1.99
22 42.30 3.54 1.96
27.2 47.13 3.42 1.71
31.8 51.04 3.30 1.32
70.8
9.1 30.99 3.93 2.21
12.6 33.16 3.83 2
17.3 37.82 3.74 1.88
22.1 42.37 3.57 1.82
26.8 46.07 3.51 1.54
31.7 50.78 3.44 1.32
Page 157
135
Table A.6 Aspen result of steam power plant cooled by R-134a at mcl = 0.131 kg/s
mcl pc Tcl-in Tcl-out mcon COP
0.131
101.3
9.6 30.77 3.84 2.43
12.2 34.22 3.77 2.29
16.6 37.19 3.63 2.25
22.6 41.66 3.55 1.98
27.3 46.05 3.47 1.88
31.7 50.15 3.40 1.81
84.3
9.5 30.14 3.94 2.33
12.3 33.36 3.89 2.25
17 37.11 3.79 2.23
22.4 41.27 3.68 1.81
27.4 45.19 3.55 1.78
31.7 50.42 3.42 1.77
70.8
9.3 30.14 4.04 2.29
12.4 34.09 3.96 2.26
17.1 38.23 3.85 2.04
22.5 43.89 3.73 2.01
26.9 47.30 3.67 1.93
31.7 51.09 3.52 1.75
Page 158
136
Table A.7 Aspen result of steam power plant cooled by NH3 at mcl = 0.056 kg/s
mcl pc Tcl-in Tcl-out mcon COP
0.055
101.3
9.5 36.8 3.72 2.53
12.3 38.19 3.60 2.41
17.4 41.5 3.48 2.30
21.9 43.31 3.40 2.01
27 44.51 3.31 1.94
31.9 46.14 3.22 1.91
84.3
9.4 25.42 3.91 2.51
12.2 26.77 3.79 2.44
17.2 28.09 3.64 2.21
21.6 33.12 3.52 2.15
27.3 37.60 3.39 1.96
31.6 43.15 3.28 1.94
70.8
9.5 33.67 3.88 2.54
12 36.23 3.78 2.43
17.5 39.1 3.73 2.30
21.5 42.32 3.64 2.23
27.4 44.16 3.57 2.11
31.7 45.17 3.46 2.08
Page 159
137
Table A.8 Aspen result of steam power plant cooled by NH3 at mcl = 0.11 kg/s
mcl pc Tcl-in Tcl-out mcon COP
0.11
101.3
9.3 20.44 3.85 2.56
12.5 23.54 3.73 2.51
17.5 27.16 3.66 2.41
21.7 31.82 3.58 2.16
27 33.91 3.48 2.04
31.9 36.79 3.39 2.01
84.3
9.2 19.43 3.99 2.40
12.4 23.58 3.88 2.30
17.4 27.45 3.75 2.24
22 29.98 3.66 2.04
27.2 31.29 3.57 1.97
31.8 33.15 3.46 1.61
70.8
9.1 19.67 4.00 2.55
12.6 21.28 3.92 2.50
17.3 26.34 3.84 2.42
22.1 29.78 3.72 2.36
26.8 31.87 3.63 2.11
31.7 33.45 3.56 2.08
Page 160
138
Table A.9 Aspen result of steam power plant cooled by NH3 at mcl = 0.131 kg/s
mcl pc Tcl-in Tcl-out mcon COP
0.131
101.3
9.6 21.33 3.93 2.73
12.2 24.44 3.86 2.69
16.6 28.97 3.74 2.55
22.6 32.83 3.67 2.35
27.3 34.18 3.57 2.21
31.7 37.55 3.50 2.10
84.3
9.5 22.13 4.04 2.67
12.3 25.17 3.97 2.57
17 29.20 3.90 2.55
22.4 32.77 3.83 2.49
27.4 35.73 3.71 2.34
31.7 38.40 3.59 2.19
70.8
9.3 21.18 4.12 2.68
12.4 24.56 4.05 2.58
17.1 28.34 3.93 2.37
22.5 32.13 3.84 2.31
26.9 35.17 3.78 2.20
31.7 38.37 3.64 2
Page 161
139
Table A.10 Aspen result of steam power plant cooled by R-407C at mcl = 0.056 kg/s
mcl pc Tcl-in Tcl-out mcon COP
0.056
101.3
9.5 44.23 3.65 2.26
12.3 46.76 3.50 2.16
17.4 49.37 3.38 1.79
21.9 51.48 3.30 1.84
27 51.98 3.17 1.69
31.9 54.12 3.12 1.60
84.3
9.4 42.19 3.85 2.18
12.2 45.34 3.72 2.01
17.2 48.27 3.57 1.91
21.6 51.17 3.42 1.85
27.3 53.09 3.29 1.70
31.6 55.23 3.17 1.61
70.8
9.5 42.13 3.83 2.20
12 44.28 3.73 2.15
17.5 47.41 3.66 2.00
21.5 49.09 3.57 1.94
27.4 53.07 3.48 1.79
31.7 56.16 3.37 1.59
Page 162
140
Table A.11 Aspen result of steam power plant cooled by R-407C at mcl = 0.11 kg/s
mcl pc Tcl-in Tcl-out mcon COP
0.11
101.3
9.3 30.11 3.80 2.27
12.5 33.55 3.66 2.16
17.5 37.13 3.58 1.97
21.7 39.78 3.49 1.85
27 42.19 3.39 1.80
31.9 45.12 3.29 1.70
84.3
9.2 30.17 3.94 2.23
12.4 33.01 3.83 2.11
17.4 36.87 3.68 2.00
22 39.08 3.57 1.90
27.2 42.13 3.46 1.73
31.8 45.66 3.34 1.65
70.8
9.1 30.13 3.95 2.25
12.6 32.99 3.85 2.18
17.3 35.18 3.78 2.03
22.1 38.17 3.63 1.92
26.8 42.06 3.53 1.79
31.7 45.61 3.46 1.65
Page 163
141
Table A.12 Aspen result of steam power plant cooled by R-407C at mcl = 0.13 kg/s
mcl pc Tcl-in Tcl-out mcon COP
0.131
101.3
9.6 26.63 3.87 2.31
12.2 28.51 3.80 2.22
16.6 33.41 3.66 2.08
22.6 37.35 3.59 1.93
27.3 40.47 3.51 1.86
31.7 44.20 3.44 1.78
84.3
9.5 26.80 3.97 2.28
12.3 28.31 3.92 2.16
17 32.47 3.83 2.06
22.4 35.19 3.73 1.97
27.4 38.09 3.60 1.84
31.7 42.19 3.47 1.71
70.8
9.3 23.81 4.06 2.33
12.4 26.49 3.98 2.27
17.1 31.27 3.87 2.15
22.5 35.07 3.75 2.05
26.9 38.90 3.69 1.84
31.7 41.24 3.54 1.68
Page 164
142
Table A.13 Aspen result of steam power plant cooled by R-404A at mcl = 0.056 kg/s
mcl pc Tcl-in Tcl-out mcon COP
0.056
101.3
9.5 33.11 3.56 2.09
12.3 37.09 3.40 2.00
17.4 41.89 3.29 1.83
21.9 46.60 3.20 1.70
27 50.23 3.09 1.52
31.9 55.43 3.03 1.43
84.3
9.4 34.19 3.72 2
12.2 37.55 3.64 1.86
17.2 42.10 3.50 1.75
21.6 46.14 3.35 1.66
27.3 50.02 3.21 1.52
31.6 54.02 3.09 1.47
70.8
9.5 34.04 3.78 2.04
12 37.21 3.68 2
17.5 42.01 3.58 1.83
21.5 47.42 3.48 1.71
27.4 50.09 3.39 1.57
31.7 54.11 3.29 1.44
Page 165
143
Table A.14 Aspen result of steam power plant cooled by R-404A at mcl = 0.11 kg/s
mcl pc Tcl-in Tcl-out mcon COP
0.11
101.3
9.3 32.89 3.73 2.11
12.5 36.54 3.60 2.01
17.5 41.47 3.50 1.80
21.7 46.04 3.42 1.70
27 50.23 3.33 1.57
31.9 54.01 3.23 1.49
84.3
9.2 32.15 3.90 2.05
12.4 35.04 3.77 1.97
17.4 39.17 3.62 1.88
22 44.56 3.49 1.76
27.2 50.34 3.37 1.63
31.8 55.20 3.25 1.52
70.8
9.1 32.15 3.90 2.10
12.6 35.41 3.81 2.02
17.3 39.38 3.72 1.84
22.1 46.15 3.54 1.72
26.8 49.12 3.48 1.62
31.7 54.11 3.41 1.43
Page 166
144
Table A.15 Aspen result of steam power plant cooled by R-404A at mcl = 0.13 kg/s
mcl pc Tcl-in Tcl-out mcon COP
0.131
101.3
9.6 34.19 3.56 2.14
12.2 37.13 3.40 2.04
16.6 41.32 3.29 1.92
22.6 46.09 3.20 1.78
27.3 51.17 3.09 1.70
31.7 55.60 3.03 1.59
84.3
9.5 34.23 3.91 2.20
12.3 37.16 3.86 2.08
17 42.20 3.75 1.98
22.4 45.78 3.64 1.88
27.4 49.91 3.51 1.75
31.7 54.21 3.38 1.61
70.8
9.3 34.14 4.01 2.20
12.4 37.88 3.93 2.13
17.1 42.16 3.82 2
22.5 46.34 3.71 1.90
26.9 50.11 3.65 1.70
31.7 54.23 3.50 1.51
Page 167
145
APPENDIX B
Theoretical Study Data
Table B.1 Theoretical results of steam cycles of the reference and studied systems
ta tsc-ss 𝑞𝑏 𝑞𝑠𝑐 wt
𝜂𝑡ℎ COP
30
10
2547
1723.84
621
0.247 4.49
15 0.246 5.93
20 02456 7.06
25 0.244 9.88
30 0.2427 13
40
10
2507.68
1724.17
597
0.241 3.72
15 0.240 4
20 0.2389 4.97
25 0.238 5.99
30 0.2375 7.25
35 0.236 9.81
40 0.235 13.57
50
10
2465.08
1718.46 722 0.2337 2.63
15 1719.53 710 0.233 3.21
20 1721.07 680 0.2327 3.93
30 1723.12 653 0.2325 5.11
40 1725.62 630 0.230 7.55
50 1726.57 599 0.226 13.89
Page 168
146
APPENDIX C
Experimental Conditions
Coolant water conditions
Vcl = 0.00011 ± 3.3 ∗ 10−6 m3
s⁄
mcl = 0.11 kg/s
Tcl−in = 9.6 ± 0.3 ℃
Tcl−out = 26.8 ± 0.3 ℃
Refrigerant conditions
mref = 35.83 g/s
Tref−in = −8.3 ± 0.3 ℃
Tref−out = 0.9 ± 0.3 ℃
Condensation conditions
∆𝑉𝑐𝑠 = 0.912 ± 0.05 𝑙𝑖𝑡𝑡
mcs = 0.0038 kg/s
𝑡𝑖𝑚𝑒 = 240 ± 0.5 𝑠
𝑇𝑠𝑎𝑡 = 101 ± 0.35℃
Page 169
147
Electrical power conditions
𝑉 = 209 ± 0.7% + 2 𝑣𝑜𝑙𝑡
𝐼 = 14.87 ± 6% 𝑎𝑚𝑝
Page 170
148
APPENDIX D
Thermo-physical Properties
Cp−cl = 4.190 ± 0.001 kj kg. k⁄
Cp−ref−in = 1.48 ± 0.0025 kj kg. k⁄
Cp−ref−out = 1 ± 0.0035 kj kg. k⁄
ρcs = 990 ± 2.5 kg m3⁄
ρcl = 990 ± 2.5 kg m3⁄
ρs = 0.598 ± 0.0015 kg m3⁄
hfg−s = 2261 ± 5.4 kj/kg
hfg−ref = 228.3 ± 1.5 kj/kg
𝜇𝑐𝑠 = 591 ± 16 ∗ 10−6 𝑝𝑎. 𝑠
𝑘𝑐𝑠 = 0.638 ± 5 ∗ 10−4 𝑝𝑎. 𝑠
Page 172
150
REFERENCES
[1] Nirmalakhandan N., Gadhamshetty V. and Mummaneni A., “Improving Combined Cycle
Power Plant Performance in Arid Regions”, 6th International Conference on Heat Transfer Fluid
Mechanics and Thermodynamics, HEFAT2008.
[2] E. B. Woodruff, H. B. Lammers, T. F. Lammers, 2010 , Steam Plant Operation, John Wiley
& Sons, 10th edition.
[3] R. K. Kapooria, S. Kumar, and K. S. Kasans, “An analysis of a Thermal Power Plant
Working on a Rankine Cycle: A Theoretical Investigation”, Journal of energy in Southern Africa,
Vol. 19, No. 1, pp. 77-83, 2008.
[4] Michael J. Moran, and Howard N. Shapiro, 2007, Fundamentals of Engineering
Thermodynamics, John Wiley & Sons, INC, 6th edition.
[5] Frank P. Incropera and David P. DeWitt, 2007, Fundamentals of heat and mass transfer”,
John Wiley & Sons, INC, 5th edition.
[6] J. P. Holman “Heat Transfer”, McGraw Hill Company, 10th edition, 2010.
[7] Gaosheng Wei, Jingqiu Ren, Wenpeng Hong, “Scheme Design and Analysis of Variable
Condition of Evaporative Condenser for Steam Condensing of Feeding Water Pump for 1000MW
Air-Cooled Unit”, Energy Procedia Vol. 17, pp. 1177-1184, 2012.
[8] R. E. Pearce, “A Computational Model of Steam surface Condenser Performance”, PhD
thesis, Faculty of the Graduate School University of Missouri Kansas city USA, 2005.
[9] Hong Gang Hu, and Chao Zhan, 2008, “A New Inundation Correlation for the Prediction
of Heat Transfer in Steam Condensers”, Numerical Heat Transfer, Part A: Applications: An
International Journal of Computational and Methodology.
[10] M. Rebetez, O. Dupont, M. Giroud, “An analysis of the July 2006 heatwave extent in
Europe compared to the record year of 2003”, Theoretical and Applied Climatology, 2008. DOI
10.1007/s00704-007-0370-9.
[11] Yousef S.H. Najjar and Ahmed M. Abubaker, “Indirect Evaporative Combined Inlet Air
Cooling with Gas Turbine for Green Power Technology”, International Journal of Refrigeration,
Vol. 59, pp. 235-250, 2015.
[12] Abdullah Alkhedhair, Hal Gurgenic, Ingo jahn, Zhiqiang Guan and Suoying He,
“Numerical simulation of Water spray for Pre- Cooling of Inlet air in Natural Draft Dry Cooling
Towers”, Applied Thermal Engineering, Vol. 61, pp.416-424. 2013.
Page 173
151
[13] A. Vosough, A. Falahat, S. Vosough, H. N. Esfehani, A. Behjat , and R. N. Rad,
"Improvement Power Plant Efficiency with Condenser Pressure", International Journal of
Multidisciplinary Science and Engineering, Vol. 2, No. 3, pp. 38-43, 2011.
[14] R. Abdullah, J. R. Cooper, A. Briggs, and J. W. Rose,” Condensation of Steam and
R113 on a Bank of Horizontal Tubes in the Presence of a Noncondensing Gas”,
Experimental Thermal and Fluid Science, Vol. 10, pp. 298-306, 1995.
[15] H. G. Hu, and C. Zhang, "A New Inundation Correlation for the Prediction of Heat
Transfer in Steam Condensers", Numerical Heat Transfer, Part A, Vol. 54, pp. 34-46, 2008.
[16] M. Zebisch, T. Grothmann, D. Schröter, C. Hasse, U. Fritsch, and W. Cramer, “Climate
change in Germany: vulnerability and adaptation of climate-sensitive sectors”, Potsdam Institute
for Climate Impact Research, Research Report 201 41 253, UBA-FB 000844, 2005.
[17] A. N. Anozie, and O. J. Odejobi, "The Search for Optimum Condenser Cooling Water
Flow Rate in a Thermal Power Plant", Applied Thermal Engineering, Vol. 31, pp. 4083-4090,
2011.
[18] Y. Haseli, I. Dincer, and G. F. Naterer, "Optimum Temperatures in A shell and Tube
Condenser with Respect to Exergy", International Journal of Heat and Mass Transfer, Vol.
51, pp. 2462-2470, 2008.
[19] V.I. Artemov, K. B. Minko, and G. G. Yan’kov, “Modeling Steam Condensation from
Steam- Air Mixture in the Inclined Tubes of an Air- Cooled Condenser”, Thermal Engineer, Vol.
61, No. 1pp. 30-40, 2014.
[20] C. Philpott, and J. Deans, "The Enhancement of Steam Condensation Heat Transfer
in A horizontal shell and Tube Condenser by Addition of Ammonia", International Journal of
Heat and Mass Transfer, Vol. 47, pp. 3683-3693, 2004.
[21] H. Forster, and J. Lilliestam, “Modeling thermoelectric power generation in view of
climate change”, Regional Environmental Change, Vol. 10, No. 4, pp. 327-338, 2010.
[22] B. V. Lakshmi, T. Subrahmanyam, V. D. Rao, and K. V. Sharma, “ Turbulent Film
Condensation of Pure Vapor Flowing Normal to A horizontal Condenser Tube-Constant Heat
Flux at the Tube Wall”, International Journal of Automotive and Mechanical Engineering
(IJAME), Vol. 4, pp. 455-470, December 2011.
[23] I. H. Aljundi,” Energy and Exergy Analysis of a Steam Power Plant in Jordan”, Applied
Thermal Engineering, Vol. 29, pp. 324-328, 2009.
[24] H. Koch, and S. Vögele, “Dynamic modeling of water demand, water availability and
adaptation strategies for power plants to global change” Ecological Economics, Vol. 68, pp.
2031-2039, 2009.
Page 174
152
[25] A. E. Dukler, “Fluid Mechanics and Heat Transfer in Vertical Falling-film Systems”,
Chemical Engineering Progress Symposium Series No. 30, Vol. 56, pp. 1-10, 1960.
[26] Yousif, K. A., A. Assefa, Hegazy A. S. and Engeda, A., 2014, "Comparative study of using
water and R-134a as a cooling medium in the condenser of a steam power plant, ASME Turbo
Expo 2014, GT2014-25034, Düsseldorf, Germany (2014) 25034, 1–9.
[27] Kroeger, D. G., 1998, Air-Cooled Heat Exchanger and Cooling Tower, New York: Begell
House.
[28] Maulbetsch, Michael N. DiFilippo, Michael Own and Detlev G. Kroger, “ Wind Effects on
Air- Cooled Condenser for Power Plant Cooling”, 14th International Heat Transfer
Conference,2010, IHTC14-23250.
[29] Hassan, K. N., Rishack, Q. A., and Mohammed, A. K., “Study of the Condenser
Performance in Al-Nassiriyah Thermal Power Plant”, Journal for Engineering Sciences, Thi-Qar
University, Iraq, Vol. 2, No. 3, 2011.
[30] T. B. Chang and F. J. Wang, “Forced Convection Film Condensation of Downward-
Flowing Vapor on A horizontal Tube with Wall Suction Effect”, Journal of Marine Science
and Technology, Vol. 21, No. 5, pp. 501-507, 2013.
[31] M. Rebetez, O. Dupont, M. Giroud, “An analysis of the July 2006 heatwave extent
in Europe compared to the record year of 2003”, Theoretical and Applied Climatology, 2008.
DOI 10.1007/s00704-007-0370-9.
[32] T. K. Mideksa, and S. Kallbekken, “The impact of climate change on the electricity
market: A review”, Energy Policy, Vol. 38, pp. 3579-358, 2010.
[33] S. S. Kutateladze, and I. I. Gogonin, “Heat Transfer in Condensation of Flowing Vapor on
A single Horizontal Cylinder”, International Journal of Heat and Mass Transfer, Vol. 28, pp.
1019-1030, 1985.
[34] A. E .Conradie, J. D. Buys, and D. G. Kröger, “Performance Optimization of Dry-
Cooling Systems for Power Plants Through SQP Methods”, Applied Thermal Engineering, Vol.
18, No. 1–2, pp. 25–45, 1998.
[35] J. W. Rose, “Approximate Equations for Force Convection Condensation in the Presence
of a Non-Condensation Gas on a Flat Plate and Horizontal Tube”, International Journal of Heat
and Mass Transfer, Vol. 23, pp. 539-546, 1980.
[36] H. G. Hu, and C. Zhang, "A New Inundation Correlation for the Prediction of Heat
Transfer in Steam Condensers", Numerical Heat Transfer, Part A, Vol. 54, pp. 34-46, 2008.
Page 175
153
[37] M.T.F. Owen, D.G Kroger, “The Effect of Screens on Air- Cooled Steam Condenser
Performance Under windy Conditions”, Applied Thermal Engineering Vol. 30, pp. 2610-2615,
2010.
[38] Juan wen, Dawei Tang, Zhicheng Wang, Jing Zhang, Yanjun Li, Fangyuan Sun, “Numerical
Simulation of Flow and Heat Transfer of Direct Air- Cooled Condenser Cell in Power Plant”,
ASME Heat Transfer Summer Conference, HT3013-17718.
[39] W.F. He, Y.P. Dai, J.F. Wang, M.Q. Li, Q.Z. Ma, “Performance Prediction of an Air-
Cooled Steam Condenser Using UDF Method”, Applied Thermal Engineering, Vol 50, pp. 1339-
1350, 2013.
[40] T. Fujii, H. Uehara, K. Hirata, K. Oda, “Heat Transfer and Flow Resistance in
Condensation of Low Pressure Steam Flowing through Tube Banks”, International Journal
of Heat and Mass Transfer, Vol. 15, pp. 247-260, 1972.
[41] T. Fujii, H. Honda, and K. Oda, “Condensation of steam on a horizontal tube – the
influence of oncoming velocity and thermal conditions at the wall”, Condensation Heat
Transfer, Proceedings of the 18th National Heat Transfer Conference, 35-43, 1979.
[42] T. Fujii, "Vapor Shear and Condensate Inundation: An overview", Power Condenser Heat
Transfer Technology, P. J. Marto and R. H. Nunn Eds., Hemisphere Publishing Corporation,
New York, 1981.
[43] J. S. Maulbetsch, “Spray Enhancement of Air Cooled Condensers”, EPRI, Palo Alto, CA,
California Energy Commission, Sacramento, CA, and Crockett Cogeneration, Crockett, CA: Final
Report September 2003, 1005360. John S.
[44] M. T. F. Owen and D. G. Kroger, “An Investigation of Air- Cooled Steam Condenser
Performance Under Windy Condition Using Computational Fluid Dynamics”, Journal of
Engineering for Gas Turbine and Power, Vol. 133 pp. 064502-1, 2011.
[45] J. A. van Rooyen and D. G. Kroger, “Performance Trends of an Air- Cooled Steam
Condenser Under Windy Conditions” Journal of Engineering for Gas Turbine and Power, Vol.
130, pp. 023006-1, 2008.
[46] W. C. Lee and J. W. Rose, “Forced Convection Film Condensation on A horizontal
Tube with and without Non-condensing Gases”, International Journal of Heat and Mass
Transfer, Vol. 27, pp. 519-528, 1984.
[47] Michael Owen, Detlev G. Kroger, “Contributors to Increased Fan Inlet Temperature at an
Air- Cooled Steam Condenser”, Applied Thermal Engineering, Vol. 50, pp. 1149-1156, 2013.
[48] Y. Haseli, I. Dincer and G. F. Naterer, Optimum temperatures in a shell and tube condenser
with respect to exergy, Int. J. Heat Mass Transfer 51 (2008) 2462–2470.
Page 176
154
[49] Alan O’Donovan and Ronan Grimes, “A Theoretical and Experimental Investigation into
the Thermodynamic Performance of a 50 MW Power Plant with a Novel Modular Air- Cooled
Condenser,” Applied Thermal Engineering, Vol. 71 pp. 119-129, 2014.
[50] Hunan Ma, Fengqi Si, Lan Li, Wensheng Yan Kangping Zhuu, “Effects of Ambient
Temperature and Crosswind on Thermo-flow Performance of the Tower Under Energy Balance of
the Indirect Dry Cooling System” ,Applied Thermal Engineering Vol. 78, pp. 90-100,2015.
[51] S. Chen, Z. Yang, Y. Duan, Y. Chen, and Di Wu, “Simulation of Condensation flow in a
Rectangular Microchannel”, Chemical Engineering and Processing, Vol. 76, pp. 60-69, 2014.
[52] Alan O’Donovan and Ronan Grimes, “A Theoretical and Experimental Investigation into
the Thermodynamic Performance of a 50 MW Power Plant with a Novel Modular Air-Cooled
Condenser”, Applied Thermal Engineering Vol. 71, pp. 119-129, 2014.
[53] Huan Ma, Fengqi Si, Yu Kong, Kangping Zhu, wensheng Yan, “A new theoretical Method
for Predicating the Part-Load Performance of Natural Draft Dry Cooling Towers”, Applied
Thermal Engineering”, Vol. 91, pp. 1106-1115, 2015.
[54] Amir vosough, Alireza falahat, Sadegh vosough Hasan nasr esfeani, Azam behjat and Roya
nasri rad, “Improvement Power Plant Efficiency with Condenser Pressure”, International Journal
of Multidisciplinary Sciences and Engineering, Vol.2,No.3, June 2011.
[55] Weifeng He, Qingzhong Ma, Yiping Dai, Danmei Xie, “Numerical Investigation of Hot Air
Recirculation in an Air- Cooled Steam Condenser Under Ambient Conditions”, Proceeding of The
ASME Power Conference, Power2011-55055, 2011.
[56] D. Rübbelke and S. V€ogele, Impacts of climate change on European critical infrastructures:
The case of the power sector, Environ. Sci. Policy 14 (2011) 53–63.
[57] R. Kumar, H. K. Varma, B. Mohanty, and K. N. Agrawal,” Augmentation of Outside
Tube Heat and Mass Transfer During Condensation of Steam over Horizontal Copper Tubes”,
International Communications in Heat and Mass Transfer, Vol. 25, No. I, pp. 81-91, 1998.
[58] M. Lees, “The Economics of Wet Versus Dry Cooling for Combined Cycle”,
Proceedings of the Institution of Mechanical Engineers, Journal of Power and Energy Part A
209, pp. 37–44, 1995.
[59] M. Fatouh A. B. Helali, M. A. M. Hassan, and A. Abdala, "Heat Transfer
Characteristics of R410A during its Evaporation inside Horizontal Tube", International Journal
of Energy and Environment (IJEE), Vol. 2, No. 4, pp. 701-716, 2011.
[60] M. K. Chandel, L. F. Praston and R. B. Jackson, The potential impact of climate-change
policy on fresh water use in thermoelectric power generation, Energy Policy 39 (2011) 6234- 6242.
Page 177
155
[61] H. S. Lee, J. I. Yoon, J. D. Kim, and P. K. Bansal, "Evaporating Heat Transfer and Pressure
Drop of Hydrocarbon Refrigerants in 9.52 and 12.70 mm Smooth Tube", International Journal of
Heat and Mass Transfer, Vol. 48, pp. 2351– 2359, 2005.
[62] Refrigeration Service Engineers Society, "Refrigerant 410A", 620-108 Section 3, 2001.
[63] H. S. Lee, J. I. Yoon, J. D. Kim, and P. K. Bansal, “Condensing Heat Transfer and
Pressure Drop Characteristics of Hydrocarbon Refrigerants", International Journal of Heat
and Mass Transfer, Vol. 49, pp. 1922–1927, 2006.
[64] T. Ebisu, and K. Torikoshi, "Heat Transfer Characteristics and Correlations for R-410A
Flowing inside a Horizontal Smooth Tube", ASHRAE transactions, Vol. 104, part 2, 1998.
[65] C. C. Wang, S. K. Chiang, Y. J. Chang, and T. W. Chung, " Two Phase Flow Resistance
of Refrigerants R-22, R-410A, and R407C in Small Diameter Tubes", Institution of Chemical
Engineers, Trans IChemE, Vol. 79, Part A, pp. 553-560, 2001.
[66] B. R. Christoffersen, J. C. Chato, J. P. Wattelet, and A. L. de Souza, "Heat Transfer
and Flow Characteristics of R-22, R-32/R-125 and R-134a in Smooth and Micro-Fin Tubes", Air
Conditioning and Refrigeration Center (ACRC), University of Illinois, ACRC Project 1, 1993.
[67] K. Seo, Y. Kim, K. J. Lee, and Y. C. Park, " An Experimental Study on Convective
Boiling of R-22 and R-410A in Horizontal Smooth and Micro-fin tubes", KSME International
Journal, Vol. 15, No. 8, pp. 1156-1164, 2001.
[68] A Cavallini, D. C. Del, L. Doretti, L. Rossetto, and G. A. Longo, "Condensation Heat
Transfer of New Refrigerants: Advantages of High Pressure Fluids”, International Refrigeration
and Air Conditioning Conference. Paper 480, 2000.
[69] Y. Kim, K. Seo, and J. T. Chung, "Evaporation Heat Transfer Characteristics of R-410A
in 7 and 9.52 mm Smooth/Micro-Fin Tubes", International Journal of Refrigeration, Vol. 25, pp.
716–730, 2002.
[70] Magnus Holmgren, 2006, “X Steam for Matlab: Free Steam Thermodynamic
Tables” Last Modified Aug. 2007.
http://www.mathworks.com/matlabcentral/fileexchange/9817.
[71] M. H. Kim, J. S. Shin, and B. H. Lim, "Evaporating Heat Transfer Of R22 and R410A in
9.52 mm Smooth and Micro Fin Tubes", International Refrigeration and Air Conditioning
Conference, Paper 565, 2002.
[72] Richard, Pearce. 2005. “A Computational Model of Steam surface Condenser Performance.”
PhD diss., University of Missouri.
[73] Hong Gang Hu, and Chao Zhan, 2008, “A New Inundation Correlation for the Prediction of
Heat Transfer in Steam Condensers”, Numerical Heat Transfer, Part A: Applications: An
Page 178
156
International Journal of Computation and Methodology, 54:1, 34–46, Taylor & Francis Group.
[74] Frank P. Incropera and David P. DeWitt, 2007, Fundamentals of heat and mass transfer”,
John Wiley & Sons, INC, 5th edition.
[75] Wolverine Tube, INC, 2007,” Engineering Data Book III”, Chapter 7: Condensation on
External Surfaces, Engineering Thermal Innovation.
http://www.wlv.com/products/databook/db3/data/db3ch7.pdf
[76] Vosough, A., Falahat, A., Vosough, S., Esfehani, H., Behjat, A., and Rad, R., 2011,
“Improvement Power Plant Efficiency with Condenser Pressure”, International Journal of
Multidisciplinary Sciences and Engineering, Vol 2: NO. 3.
[77] S. A. Al-Sanea, N. Rhodes, and T. S. Wilkinson, 1985, “Mathematical Modeling of Two-
Phase Condenser Flows”, Paper presented at the 2nd Int. Conf. on Multi-phase Flow, London, U.K.,
pp. 169–182, BHRA, the Fluid Engineering Centre.
[78] H. Forster and J. Lilliestam, Modeling thermoelectric power generation in view of climate
change, Regional Environ. Change 10 (2010) 327–338.
[79] A. Rashad, and A. El Maihy, 2009, “Energy and Exergy Analysis of a Steam Power Plant in
Egypt”, Paper presented at the 13th International Conference on aerospace sciences and aviation
technology, Cairo, Egypt, May 26th – 28th.
[80] Tao, J., Liu, H., Li, J., Yin, Y., Zhou Y., and Jia, J., 2010, “Optimization Analysis of
Multiple Steam Turbines and Condensers in Paper Mill Power Plant”, Paper presented at the 10th
International Conference on Renewable Energies and Power Quality, Granada, Spain, March 23th
- 25th.
[81] John S. Maulbetsch, 2002, “Comparison of Alternate Cooling Technologies for
California Power Plants Economic, Environmental and Other Tradeoffs”, EC/EPRI, Final Report,
No. 500-02-079F, Atherton, California.
[82] Khalid N. Hassan, Qais A. Rishack, and Ahmed K. Mohammed, 2011, “Study of the
Condenser Performance in Al-Nassiriyah Thermal Power Plant”, Thi-Qar University Journal for
Engineering Sciences,Iraq, Vol.2- No.3, http://thiqaruni.org/thi_qar/2011-09-17-09-56-54/2011-
09-17-10-23-57/2012-03-11-08-22-09/130-2012-03-10-19-34-04/859-eng-vol2-no3-2011.html
[83] A. W. Bush, G. S. Marshall, and T. S. Wilkinson, 1990, “the Prediction of Steam
Condensation Using a Three Component Solution Algorithm”, Paper presented at the 2nd Int.
Symp. On Condensers and Condensation, University of Bath, UK, pp. 223–234.
[84] Magnus Holmgren, 2006, “X Steam for Matlab: free steam thermodynamic tables” last
modified Aug. 2007. http://www.mathworks.com/matlabcentral/fileexchange/9817.
[85] Adam J. Buchoff, 2009, “A Thermodynamic Material Properties Library for MATLAB,
Page 179
157
FreeSteam+”, http://code.google.com/p/freesteamplus/downloads/list.
[86] Maulbetsch, J. and Zammit, K., 2003, “Cooling System Retrofit Costs," EPA Workshop on
Cooling Water Intake Technologies, Arlington, Virginia, May 6.
[87] Feeley, T. J., et al., July 2005, "Department of Energy/ Office of Fossil Energy’s Power Plant
Water Management R&D Program,".
http://www.netl.gov/technologies/IEP_Power_Plant_R&D_Fina_1.pdf.
[88] Mauelbetsch, J., February 2002, "Comparison of Alternate Cooling Technologies for
California Power Plants: Economic, Environment and Other Tradeoffs, Public Energy Research
Program,” Final Report, CEC/EPRI.
[89] Johnson, B. M., et al., 1976, "Dry Cooling of Power Generating Station: a Summary of the
Economic Evaluation of Several Advanced Concepts via a Design and Cost Estimate," Technical
Report No. BNWL-21120, Battelle Pacific Northwest Labs., Richland, WA (USA).
[90] Bonger, R. and Chandron, R., 1995, "New Developments in Air-cooled Steam Condensing,"
Palo Alto, CA: EPRI: Paper 18.
[91] Maulbetsch, J. S. and Di Filippo, M. N., 2001, "Spray Cooling Enhacement of Air-Cooled
Condensers,” Proceedings of the XIIth International Conference on Cooling Towers; Sydney,
Australia. International Association of Hydraulic Research.
[92] Hutton, D., Feb 1999, "Improved Power Plant Performance with Evaporative Steam
Condensing," Technical Pape TP99-08, CTI Bulletin PRM – 103 (08).
[93] Conradie, A. E.; Buys, J. D. and Kröger D. G., 1998," Performance Optimization of Dry-
Cooling Systems for Power Plants through SQP Methods," J. of Applied Thermal Engineering;
18(1-2): pp. 25-45.
[94] Hegazy, A. S., 2008, "Use of Cooling Thermal Storage as a Heat Sink for Steam Power
plant," JSME J. of Thermal Science and Technology, Vol. (3), No. (2): pp. 330-341.
[95] Allemann, R. T.; Johnson, B. M. and Werry, E. V., Jan. 1987, "Wet-Dry Cooling
Demonstration: A Transfer of Technology," Palo Alto, CA: Electric Power Research Institute;
EPRI CS-5016.
[96] Allemann, R. T. et al., May 1986, "Wet-Dry Cooling Demonstration: Test Results," Palo
Alto, CA: Electric Power Research Institute; EPRI CS-4321.
[99] Hegazy, A. S., “Improving Performance of Refrigerant Cooled Steam Power Plant Using
Cooling Thermal Storage,” ASME J Gas Turbines Power, 131.
[98] A. S. Hegazy, “Use of Cooling Thermal Storage as a Heat Sink for Steam Power Plant”,
JSME Journal of Thermal Science and Technology, Vol. 3, No. 2, pp. 330-341, 2008.
Page 180
158
[99] Yousif, K. A., A. Assefa, Hegazy A. S. and Engeda, A., 2015, "Comparative Study of Using
R-410A, R-407C, R-22, and R-134a as Cooling Medium in the Condenser of a Steam Power
Plant", ASME J. Eng. Gas Turbines Power, Vol. 137.
[100] Yousif, K. A., Bolin, C., Hegazy, A. and Engeda, A., 2014, "Experimental Investigation of
A Refrigerant as A Coolant of A Power Plant Condenser", International Journal of Air-
Conditioning and Refrigeration Vol. 22, No. 4.
[101] Kiameh P., 2002. Power Generation Handbook: Selection, Applications, Operation,
Maintenance, McGraw-Hill Professional; 1 edition.
[102] B. M. Johnson, R. T. Allemann, D. W. Faletti, B. C. Fryer and F. R. Zaloudek, Dry cooling
of power generating station: A summary of the economic evaluation of several advanced concepts
via a design and cost estimate, Technical Report No. BNWL-21120, Battelle Paci Northwest Labs
(1976).
[103] Stoecker W. F., 1998, Industrial Refrigeration handbook, McGraw-Hill Education; 1
edition.
[104] T. K. Mideksa and S. Kallbekken, The impact of climate change on the electricity market:
A review, Energy Policy 38 (2010) 3579–3585.
[105] H. Koch and S. V€ogele, Dynamic modeling of water demand, water availability and
adaptation strategies for power plants to global change, Ecol. Econ. 68 (2009) 2031–2039.
[106] P. K. Nag, “Power plant engineering”, McGraw Hill Company, 2th edition, 2001.
[107] R. Bonger and R. Chandron,New developments in air cooled steam condensing, EPRI Paper
No. 18 (1995).
[108] A. E. Conradie, J. D. Buyst and D. G. Kr€oger, Performance optimization of dry-cooling
systems for power plants through SQP methods, Appl. Therm. Eng. 18 (1998) 25–45.
[109] A. Balogh and Z. Takacs, Developing indirect dry cooling systems for modern power plants
(1998), http://www.nemesis.at/publication/gpi 98 2/articles/ 33.html
[110] D. Hutton, Improved power plant performance with evaporative steam condensing,
Technical Paper No. TP99-08, CTI Bulletin PRM No. 103 (08) (1999).
[111] A Cavallini, D. C. Del, L. Doretti, L. Rossetto, and G. A. Longo, "Condensation Heat
Transfer of New Refrigerants: Advantages of High Pressure Fluids”, International Refrigeration
and Air Conditioning Conference. Paper 480, 2000.
Page 181
159
[112] Hegazy, A., Rothan, Y., Engeda, A., 2016, “ Feasibility of using vapor compression
refrigeration system for cooling steam power plant condenser”, Applied Thermal Engineering
Vol.57—578.
[113] R. K. Sinnott, 2005, Chemical Engineering Design, Coulson & Richardson’s, 4th edition.
[114] Yousef, Khaled. 2015. “Use of Vapor Compression Refrigeration System for Cooling Steam
Power Plant Condenser” PhD Diss., Manoufia University.
[115] S. K. Wang, 2011, handbook of Air Conditioning and Refrigeration, McGraw Hillis, 2nd
edition.
[116] R. J. Dossat and T. J. Horan, 2001, Principles of Refrigeration, Prentice Hall, 4th edition.