DNA Mutation and Methylation Quantification from Sanger Sequencing Traces with Mutation Surveyor Software Introduction Mutation, variation, and methylation status quantification of specific nucleotides of Sanger sequencing traces is valuable for a variety of applications including disease study and diagnosis 1,4 , quantification of drug resistance in a population, such as, antibiotic resistance in bacteria 2 , and heteroplasmy studies of mitochondrial DNA 3 . Quantification of allele ratios in gene expression and genomic analyses is useful for disease diagnosis and developing treatment protocols for patients in individualized medicine. Understanding the early stages of disease is invaluable since early detection is vital for efficacious treatment. Quantification of the presence of disease-causing markers can be used as a tool for early screening for diseases, such as, methylation status of genes associated with various cancers 1 and heteroplasmy in mitochondrial DNA 3 . Quantification of variant alleles can be used to monitor specific genes for drug-resistant mutations: BRC-ABL gene in CML patients and antiviral-target genes of hepatitis C virus (HCV) and human immunodeficiency virus (HIV). Mutation quantification can be used to measure antibiotic-resistant mutations in bacterial strains within a sample 2 , useful for monitoring infections and microbial source tracking. Determining the concentration of different alleles in DNA can be problematic. Two alleles of one gene may differ at only one position with sequence identity for all other positions of the gene. Mutation detection from cancer cells isolated from tumors may contain normal genes from co-isolated normal cells, resulting in a low frequency mutation allele. Promoter regions may be differentially or hyper-methylated and mtDNA may contain regions of heteroplasmy. Quantification of regions containing a high degree of variability may result in some positions not analyzed. Quantification of alleles that occur at low frequency may be below the detection limit of the technique used. The “Mutation Quantifier” function of Mutation Surveyor software solves the above problems. Mutation Surveyor software will align reference and sample sequences, detect mutations and quantify the wild type and variant alleles. Other methods used to determine such allelic variation may be just as robust but can be more expensive, such as, mass spectrometry, TaqMan ® assay, and 2nd generation sequencing using Illumina/Solexa 1G Genomic Analyzer or Roche/454 FLX Genome Sequencers. The “Mutation Quantifier” function will quantify the presence of multiple alleles at a specific location in the genome. Sanger sequencing traces are aligned to a reference sequence and mutations are identified (figure 1). Selecting the Mutation Quantifier function provides the quantity of the normal allele that is decreased at a specific locus in the sample and the quantity of the mutant allele that is gained at that position. Figure 1: Detection of mutations using Mutation Surveyor software—two variations are identified. The top trace is the reference trace, the middle trace is the sample trace, and the third trace is the mutation electropherogram displaying the differences between the reference and sample. The top text box shows the amino acid sequence for this gene--the reference sequence is the top amino acid string, the sample amino acid sequence is displayed below. The bottom chart is the mutation table displaying the reported variations. This human sample contains two variations. The quantification results of these variations using Mutation Surveyor are identical to Taqman measurement. Megan McCluskey, Shouyong Ni, David Hulce, Jonathan Liu SoftGenetics LLC 100 Oakwood Ave. Suite 350 State College, PA 16803 USA Phone: 814/237/9340 Fax 814/237/9343 www.softgenetics.com email: [email protected]Figure 1
Transcript
DNA Mutation and Methylation Quantification from Sanger Sequencing Traces with Mutation Surveyor Software
IntroductionMutation, variation, and methylation status quantification of specific nucleotides of Sanger sequencing traces is valuable for a variety of applications including disease study and diagnosis1,4, quantification of drug resistance in a population, such as, antibioticresistance in bacteria2, and heteroplasmy studies of mitochondrial DNA3.
Quantification of allele ratios in gene expression and genomic analyses is useful for disease diagnosis and developing treatment protocols for patients in individualized medicine. Understanding the early stages of disease is invaluable since early detection is vital forefficacious treatment. Quantification of the presence of disease-causing markers can be used as a tool for early screening for diseases, such as, methylation status of genes associated with various cancers1 and heteroplasmy in mitochondrial DNA3. Quantification of variant alleles can be used to monitor specific genes for drug-resistant mutations: BRC-ABL gene in CML patients and antiviral-target genes of hepatitis C virus (HCV) and human immunodeficiency virus (HIV). Mutation quantification can be used to measure antibiotic-resistant mutations in bacterial strains within a sample2, useful for monitoring infections and microbial source tracking.
Determining the concentration of different alleles in DNA can be problematic. Two alleles of one gene may differ at only one position with sequence identity for all other positions of the gene. Mutation detection from cancer cells isolated from tumors may containnormal genes from co-isolated normal cells, resulting in a low frequency mutation allele. Promoter regions may be differentially or hyper-methylated and mtDNA may contain regions of heteroplasmy. Quantification of regions containing a high degree of variability may result in some positions not analyzed. Quantification of alleles that occur at low frequency may be below the detection limit of the technique used. The “Mutation Quantifier” function of Mutation Surveyor software solves the above problems. Mutation Surveyorsoftware will align reference and sample sequences, detect mutations and quantify the wild type and variant alleles. Other methods used to determine such allelic variation may be just as robust but can be more expensive, such as, mass spectrometry, TaqMan® assay, and 2nd generation sequencing using Illumina/Solexa 1G Genomic Analyzer or Roche/454 FLX Genome Sequencers.
The “Mutation Quantifier” function will quantify the presence of multiple alleles at a specific location in the genome. Sanger sequencing traces are aligned to a reference sequence and mutations are identified (figure 1). Selecting the Mutation Quantifier function provides the quantity of the normal allele that is decreased at a specific locus in the sample and the quantity of the mutant allele that is gained at that position.
Figure 1: Detection of mutations using Mutation Surveyor software—two variations are identified. The top trace is the reference trace, the middle trace is the sample trace, and the third trace is the mutation electropherogram displaying the differences between the reference and sample. The top text box shows the amino acid sequence for this gene--the reference sequence is the top amino acid string, the sample amino acid sequence is displayed below. The bottom chart is the mutation table displaying the reported variations. This human sample contains two variations. The quantification results of these variations using Mutation Surveyor are identical to Taqman measurement.
Megan McCluskey, Shouyong Ni, David Hulce, Jonathan Liu
SoftGenetics LLC 100 Oakwood Ave. Suite 350 State College, PA 16803 USAPhone: 814/237/9340 Fax 814/237/9343
Using the Quantify function of Mutation Surveyor software
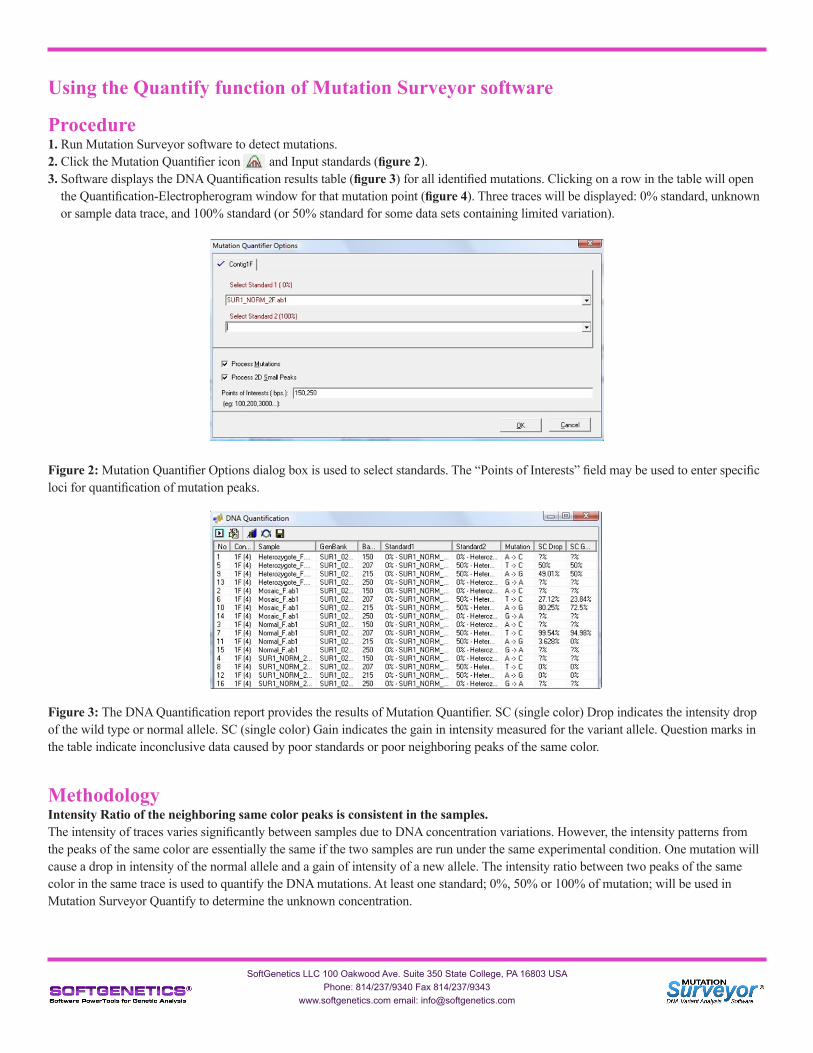
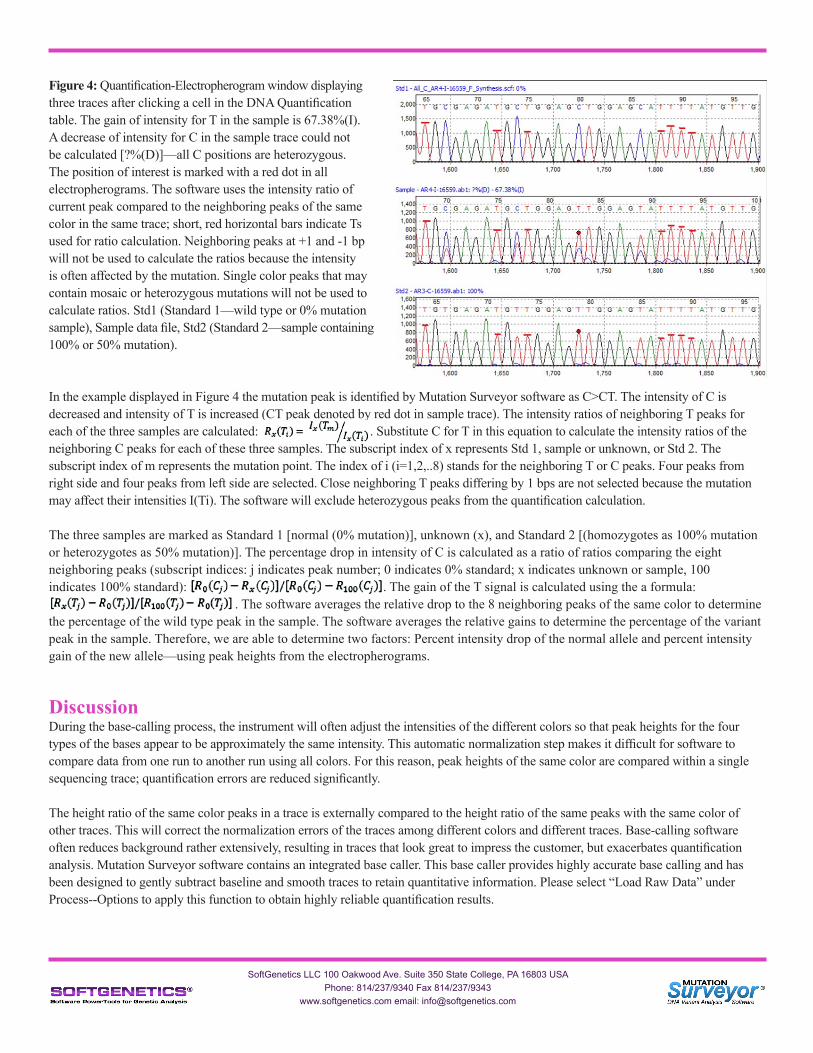
Procedure1. Run Mutation Surveyor software to detect mutations.2. Click the Mutation Quantifier icon and Input standards (figure 2).3. Software displays the DNA Quantification results table (figure 3) for all identified mutations. Clicking on a row in the table will open the Quantification-Electropherogram window for that mutation point (figure 4). Three traces will be displayed: 0% standard, unknown or sample data trace, and 100% standard (or 50% standard for some data sets containing limited variation).
Figure 2: Mutation Quantifier Options dialog box is used to select standards. The “Points of Interests” field may be used to enter specific loci for quantification of mutation peaks.
Figure 3: The DNA Quantification report provides the results of Mutation Quantifier. SC (single color) Drop indicates the intensity drop of the wild type or normal allele. SC (single color) Gain indicates the gain in intensity measured for the variant allele. Question marks in the table indicate inconclusive data caused by poor standards or poor neighboring peaks of the same color.
MethodologyIntensity Ratio of the neighboring same color peaks is consistent in the samples.The intensity of traces varies significantly between samples due to DNA concentration variations. However, the intensity patterns from the peaks of the same color are essentially the same if the two samples are run under the same experimental condition. One mutation will cause a drop in intensity of the normal allele and a gain of intensity of a new allele. The intensity ratio between two peaks of the same color in the same trace is used to quantify the DNA mutations. At least one standard; 0%, 50% or 100% of mutation; will be used in Mutation Surveyor Quantify to determine the unknown concentration.
SoftGenetics LLC 100 Oakwood Ave. Suite 350 State College, PA 16803 USAPhone: 814/237/9340 Fax 814/237/9343
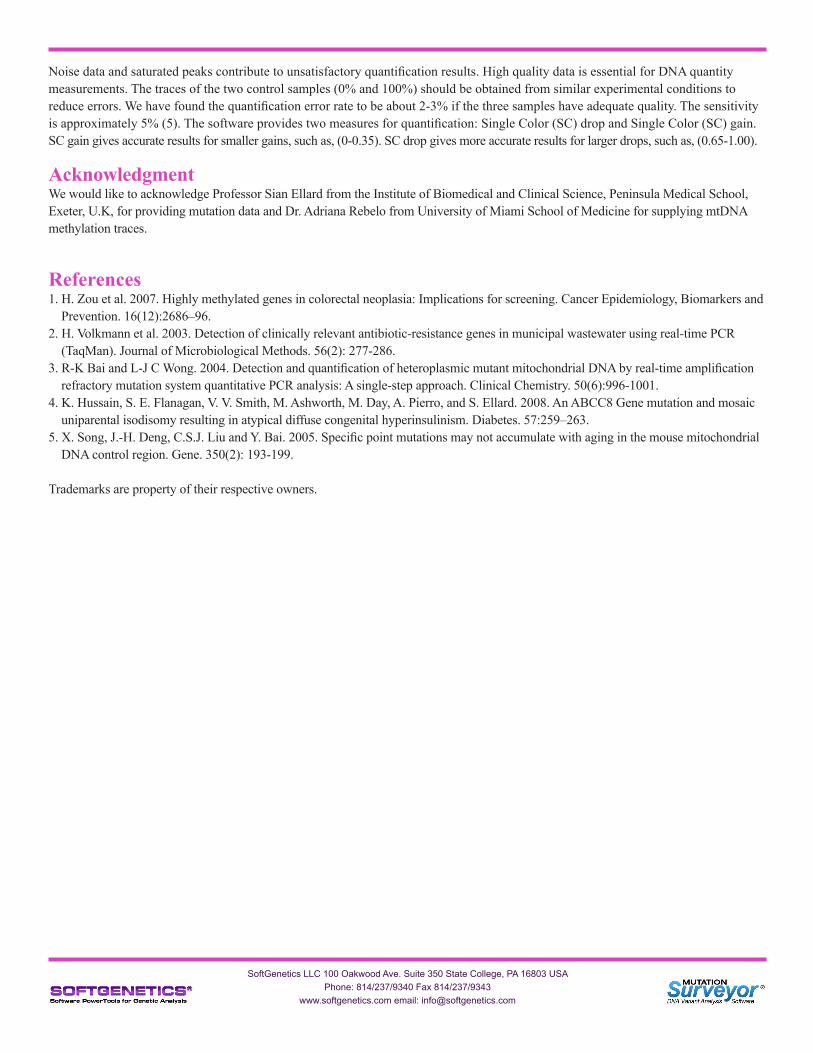
Figure 4: Quantification-Electropherogram window displaying three traces after clicking a cell in the DNA Quantification table. The gain of intensity for T in the sample is 67.38%(I). A decrease of intensity for C in the sample trace could not be calculated [?%(D)]—all C positions are heterozygous. The position of interest is marked with a red dot in all electropherograms. The software uses the intensity ratio of current peak compared to the neighboring peaks of the same color in the same trace; short, red horizontal bars indicate Ts used for ratio calculation. Neighboring peaks at +1 and -1 bp will not be used to calculate the ratios because the intensity is often affected by the mutation. Single color peaks that may contain mosaic or heterozygous mutations will not be used to calculate ratios. Std1 (Standard 1—wild type or 0% mutation sample), Sample data file, Std2 (Standard 2—sample containing 100% or 50% mutation).
In the example displayed in Figure 4 the mutation peak is identified by Mutation Surveyor software as C>CT. The intensity of C is decreased and intensity of T is increased (CT peak denoted by red dot in sample trace). The intensity ratios of neighboring T peaks for each of the three samples are calculated: . Substitute C for T in this equation to calculate the intensity ratios of the neighboring C peaks for each of these three samples. The subscript index of x represents Std 1, sample or unknown, or Std 2. The subscript index of m represents the mutation point. The index of i (i=1,2,..8) stands for the neighboring T or C peaks. Four peaks from right side and four peaks from left side are selected. Close neighboring T peaks differing by 1 bps are not selected because the mutation may affect their intensities I(Ti). The software will exclude heterozygous peaks from the quantification calculation.
The three samples are marked as Standard 1 [normal (0% mutation)], unknown (x), and Standard 2 [(homozygotes as 100% mutation or heterozygotes as 50% mutation)]. The percentage drop in intensity of C is calculated as a ratio of ratios comparing the eight neighboring peaks (subscript indices: j indicates peak number; 0 indicates 0% standard; x indicates unknown or sample, 100 indicates 100% standard): . The gain of the T signal is calculated using the a formula: . The software averages the relative drop to the 8 neighboring peaks of the same color to determine the percentage of the wild type peak in the sample. The software averages the relative gains to determine the percentage of the variant peak in the sample. Therefore, we are able to determine two factors: Percent intensity drop of the normal allele and percent intensity gain of the new allele—using peak heights from the electropherograms.
DiscussionDuring the base-calling process, the instrument will often adjust the intensities of the different colors so that peak heights for the four types of the bases appear to be approximately the same intensity. This automatic normalization step makes it difficult for software to compare data from one run to another run using all colors. For this reason, peak heights of the same color are compared within a single sequencing trace; quantification errors are reduced significantly.
The height ratio of the same color peaks in a trace is externally compared to the height ratio of the same peaks with the same color of other traces. This will correct the normalization errors of the traces among different colors and different traces. Base-calling software often reduces background rather extensively, resulting in traces that look great to impress the customer, but exacerbates quantification analysis. Mutation Surveyor software contains an integrated base caller. This base caller provides highly accurate base calling and has been designed to gently subtract baseline and smooth traces to retain quantitative information. Please select “Load Raw Data” under Process--Options to apply this function to obtain highly reliable quantification results.
SoftGenetics LLC 100 Oakwood Ave. Suite 350 State College, PA 16803 USAPhone: 814/237/9340 Fax 814/237/9343
Noise data and saturated peaks contribute to unsatisfactory quantification results. High quality data is essential for DNA quantity measurements. The traces of the two control samples (0% and 100%) should be obtained from similar experimental conditions to reduce errors. We have found the quantification error rate to be about 2-3% if the three samples have adequate quality. The sensitivity is approximately 5% (5). The software provides two measures for quantification: Single Color (SC) drop and Single Color (SC) gain. SC gain gives accurate results for smaller gains, such as, (0-0.35). SC drop gives more accurate results for larger drops, such as, (0.65-1.00). AcknowledgmentWe would like to acknowledge Professor Sian Ellard from the Institute of Biomedical and Clinical Science, Peninsula Medical School,Exeter, U.K, for providing mutation data and Dr. Adriana Rebelo from University of Miami School of Medicine for supplying mtDNA methylation traces.
References1. H. Zou et al. 2007. Highly methylated genes in colorectal neoplasia: Implications for screening. Cancer Epidemiology, Biomarkers and Prevention. 16(12):2686–96.2. H. Volkmann et al. 2003. Detection of clinically relevant antibiotic-resistance genes in municipal wastewater using real-time PCR (TaqMan). Journal of Microbiological Methods. 56(2): 277-286.3. R-K Bai and L-J C Wong. 2004. Detection and quantification of heteroplasmic mutant mitochondrial DNA by real-time amplification refractory mutation system quantitative PCR analysis: A single-step approach. Clinical Chemistry. 50(6):996-1001.4. K. Hussain, S. E. Flanagan, V. V. Smith, M. Ashworth, M. Day, A. Pierro, and S. Ellard. 2008. An ABCC8 Gene mutation and mosaic uniparental isodisomy resulting in atypical diffuse congenital hyperinsulinism. Diabetes. 57:259–263.5. X. Song, J.-H. Deng, C.S.J. Liu and Y. Bai. 2005. Specific point mutations may not accumulate with aging in the mouse mitochondrial DNA control region. Gene. 350(2): 193-199.
Trademarks are property of their respective owners.
SoftGenetics LLC 100 Oakwood Ave. Suite 350 State College, PA 16803 USAPhone: 814/237/9340 Fax 814/237/9343


![Establishment of a DNA methylation marker to evaluate ......ome-wide DNA methylation and TP53 mutation data of the 30 GCs were obtained from one of the studies [1]. Pe-ripheral leukocyte](https://static.documents.pub/doc/80x56/612de2861ecc515869427772/establishment-of-a-dna-methylation-marker-to-evaluate-ome-wide-dna-methylation.jpg)


