ED 375 745 AUTHOR TITLE INSTITUTION REPORT NO PUB DATE NOTE AVAILABLE FROM PUB TYPE EDRS PRICE DESCRIPTORS IDENTIFIERS ABSTRACT DOCUMENT RESUME HE 027 840 King, Gail Buchwalter, Ed.; And Others Fact Book on Theological Education: For the Academic Year 1993-94. Association of Theological Schools in the United States, Pittsburgh, PA. ISSN-C363-7735 94 190p. Association of Theological Schools in the United States and Canada, 10 Summit Park Drive, Pittsburgh, PA 15275-1103. Statistical Data (110) MFOI/PC08 Plus Postage. College Administration; College Faculty; *Compensation (Remuneration); *Donors; *Educational Finance; *Enrollment; Foreign Countries; Higher Education; *Institutional Characteristics; National Surveys; Scholarships; *Theological Education Canada; United States This publication provides comparative data on educational institutions that are members of the Association of Theological Schools (ATS) in. the United States and Canada. The tables and graphs are based on data supplied by the 219 ATS member schools on the 1993 ATS Annu41 Report Forms. Five chapters present data on: (1) institutional characteristics, such as the ratio of full-time (FT) faculty to part-time (PT) faculty, the ratio of full-time equivalent (FTE) students to FTE faculty, and the ratio of endowment to current fund expenditures; (2) enrollment, such as the ratio of applicants accepted to applicants matriculated the age of students by gender and degree; (3) personnel compensation, including administrator and faculty compensation by size, denomination, and type of school; (4) finances, including tuition, overall revenue structure, and scholarship aid; and (5) development, including sources and purposes of gifts. (MDM) *********************************************************************** Reproductions supplied by EDRS are the best that can be made * from the original document. ***********************************************************************
Transcript
ED 375 745
AUTHORTITLE
INSTITUTION
REPORT NOPUB DATENOTEAVAILABLE FROM
PUB TYPE
EDRS PRICEDESCRIPTORS
IDENTIFIERS
ABSTRACT
DOCUMENT RESUME
HE 027 840
King, Gail Buchwalter, Ed.; And OthersFact Book on Theological Education: For the AcademicYear 1993-94.Association of Theological Schools in the UnitedStates, Pittsburgh, PA.ISSN-C363-773594
190p.Association of Theological Schools in the UnitedStates and Canada, 10 Summit Park Drive, Pittsburgh,PA 15275-1103.Statistical Data (110)
MFOI/PC08 Plus Postage.College Administration; College Faculty;*Compensation (Remuneration); *Donors; *EducationalFinance; *Enrollment; Foreign Countries; HigherEducation; *Institutional Characteristics; NationalSurveys; Scholarships; *Theological EducationCanada; United States
This publication provides comparative data oneducational institutions that are members of the Association ofTheological Schools (ATS) in. the United States and Canada. The tablesand graphs are based on data supplied by the 219 ATS member schoolson the 1993 ATS Annu41 Report Forms. Five chapters present data on:
(1) institutional characteristics, such as the ratio of full-time(FT) faculty to part-time (PT) faculty, the ratio of full-timeequivalent (FTE) students to FTE faculty, and the ratio of endowmentto current fund expenditures; (2) enrollment, such as the ratio ofapplicants accepted to applicants matriculated the age of students by
gender and degree; (3) personnel compensation, includingadministrator and faculty compensation by size, denomination, andtype of school; (4) finances, including tuition, overall revenuestructure, and scholarship aid; and (5) development, includingsources and purposes of gifts. (MDM)
Deena Anundson, Information Systems ManagerMary McMillan, Layout and Design
The Association of Theological SchoolsIN THE UNITED STATES AND CANADA10 Summit Park DrivePittsburgh, Pennsylvania 15275-1103
ISSN 0363-7735
3
PresidentJames H. CostenPresident, Interdenominational Theological Center, Atlanta, GA
Vice PresidentDiane KennedyDean, Aquinas Institute of Theology, St. Louis, MO
SecretarySamuel T. Logan, Jr.President, Westminster Theological Seminary, Philadelphia, PA
TreasurerAnthony T. RugerConsultant, Wethersfield, CT
Executive Director
James L. WaitsAssociate Director for Accreditation
Daniel 0. AleshireAssistant Director of Accrediting
Michael Gilligan
Associate Director for Program Services
Gail Buchwalter King
Director of the Faculty Grants Resource Center
Cheryl TupperGrant Programs Coordinator
Gary GilbertDirector of the Business Office
Esther E. Brown
information Systems Manager
Deena A nundson
Editor of Publications
Nancy Merrill
4
Table of ContentsThe Association of Theological Schools in the United States and CanadaIntroduction: How to use this Fact Book i i i
Comparable Data ivATS Approved Degree ProgramsFull-Time Equivalency (FTE) viRacial/Ethnic Categories viiATS Denomination Codes viii
Chapter I Institutional CharacteristicsIntroductionDefinitions of Headings in Table 1.01 2Table 1.01A Total Number of Member Schools in 1993 3Table 1.01 Significant Institutional Characteristics of Each Member School 4Table 1.03 ATS Membership Status and Changes 14Table 1.02 Summary of Selected Institutional Characteristics 14Table 1.04A Distribution of Schools by Total EnrollmentHead Count (HC) 16Table 1.04B Distribution of Schools by Full-Time Equivalent (FTE) Enrollment 18Graph 1.04C HC/1- E for 1993 20Table 1.06 Educational Program Levels of Accredited Schools 20
Number of Applications, Acceptances, and Enrollees 24Number Initially Enrolled Each Year 24Admission Policies as Reported Regarding Undergraduate GPA and GRE Scores: Fall 1993 26Total Head Count (HC) Enrollment in Member Schools 28
2830
Total Full-Time Equivalent (FTE) Enrollment in Member Schools 30Comparative Enrollments: Total Past Year HC vs. Fall 1992 HC 32
32Comparable Enrollments: Same Institutions ReportingHC 34Comparison of Total EnrollmentTotal Individuals (HC) and FTE 34Total Enrollment by Degree TypesHC and FTE 36
3639
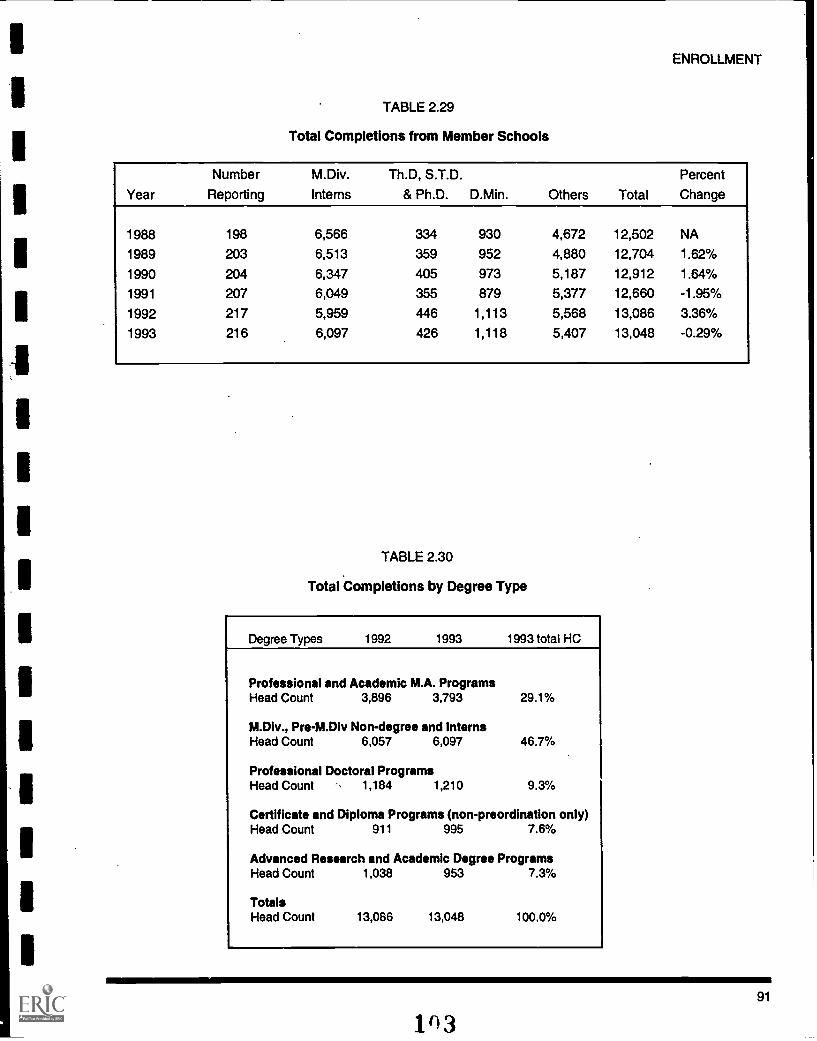
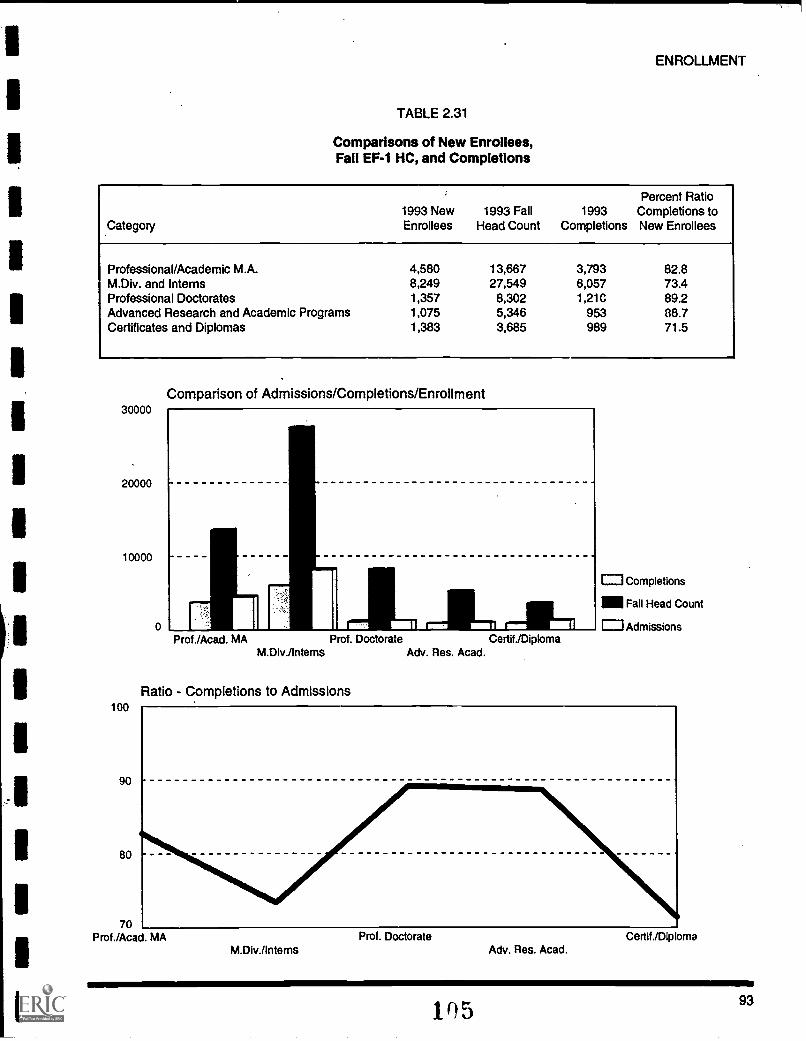
HC /l~ 1 Enrollment by Degree Type 39Enrollment by DegreeHC and FTE 40Enrollment by Degree Head Count 42Head Count/(FTE) Enrollment by Individual Degree Programs Total Enrollment Per School/Per Degree 42Enrollment Summary by Degree, Gender, and RaceHead Count 72Four-Year Enrollment Summary by Degree for Underrepresented Constituei.:ies 76Enrollment Summary by Degree, Gender, and AgeHead Count 82Denominational Affiliation of Current EnrollmentHead Count 86Total Completions from Member Schools 90Total Completions by Degree Type 90Comparisons Between New Enrollees and Completions 92
92
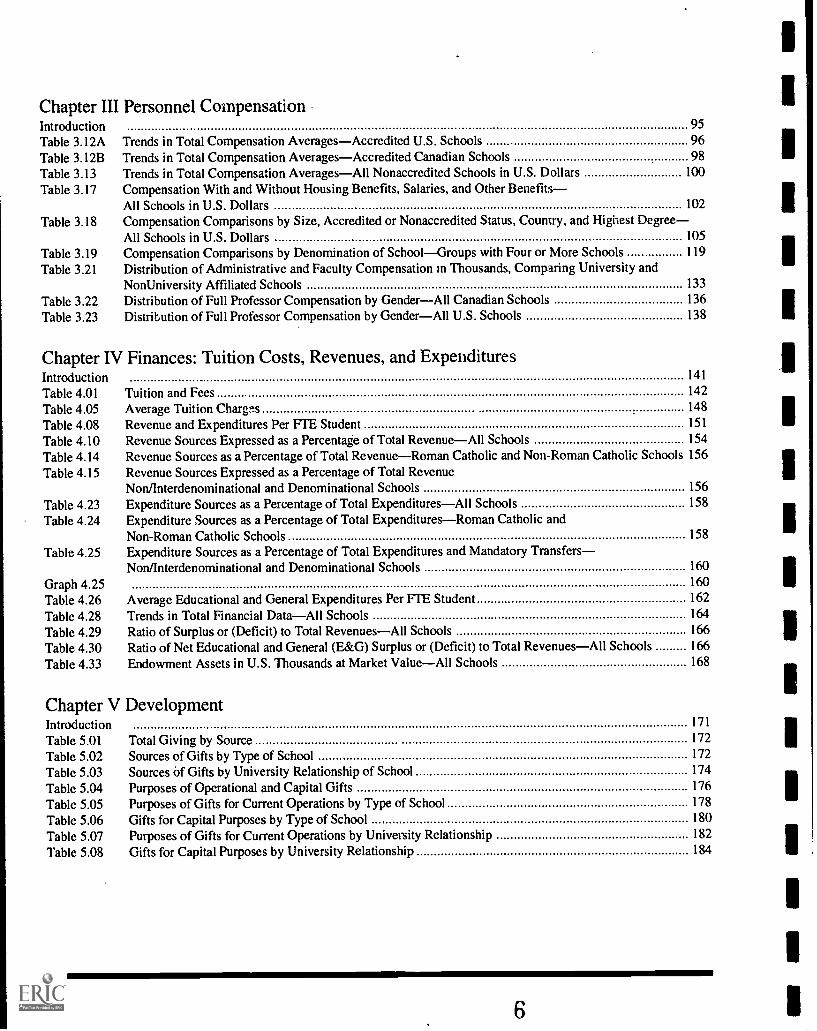
Chapter III Personnel CompensationIntroduction 95
Table 3.12A Trends in Total Compensation AveragesAccredited U.S. Schools 96Table 3.12B Trends in Total Compensation AveragesAccredited Canadian Schools 98
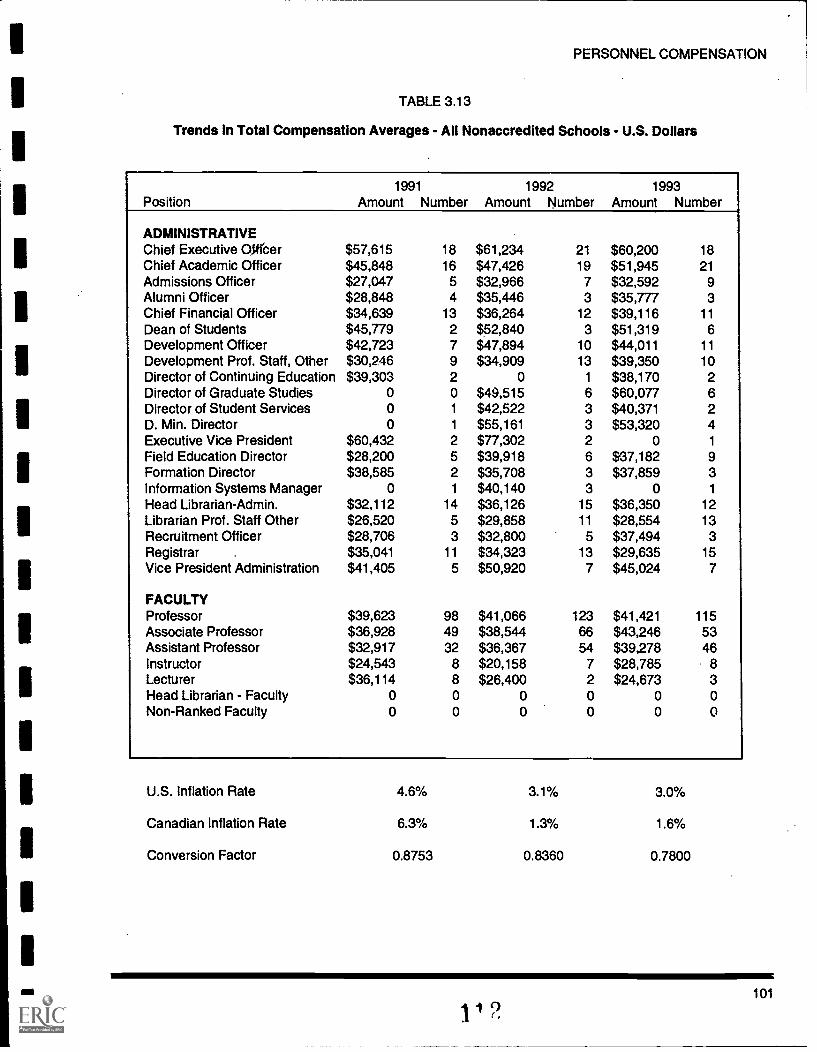
Table 3.13 Trends in Total Compensation AveragesAll Nonaccredited Schools in U.S. Dollars 100
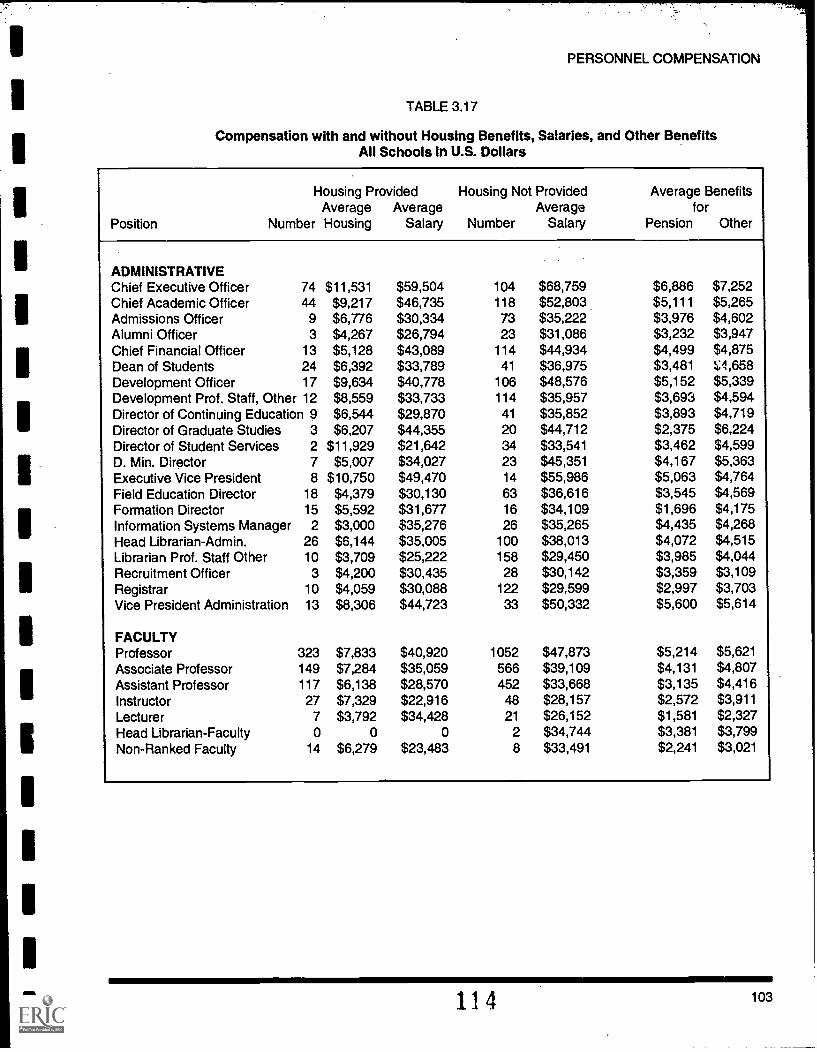
Table 3.17 Compensation With and Without Housing Benefits, Salaries, and Other BenefitsAll Schools in U.S. Dollars 102
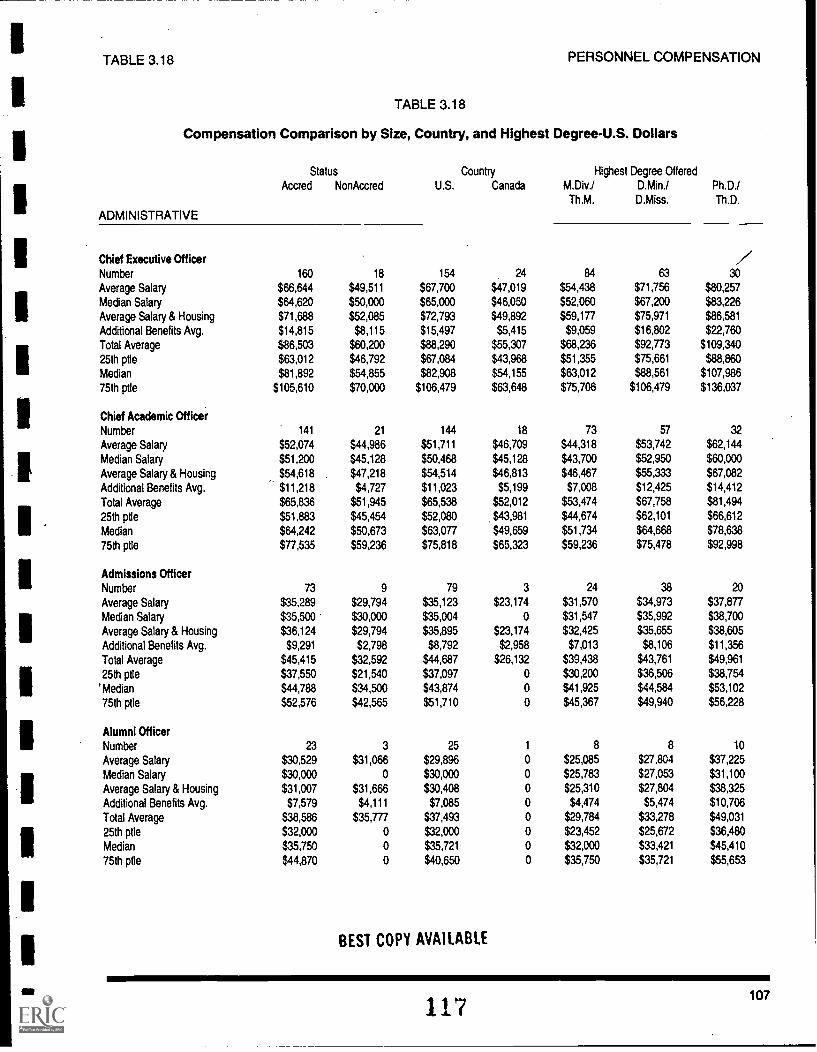
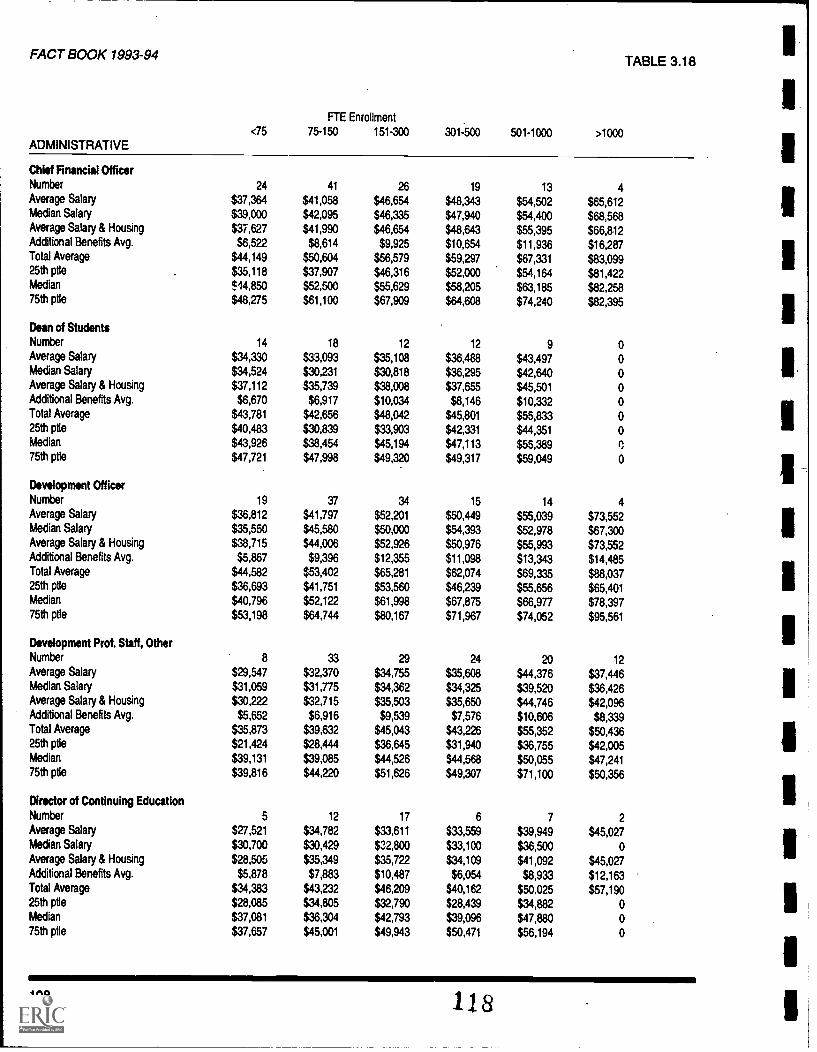
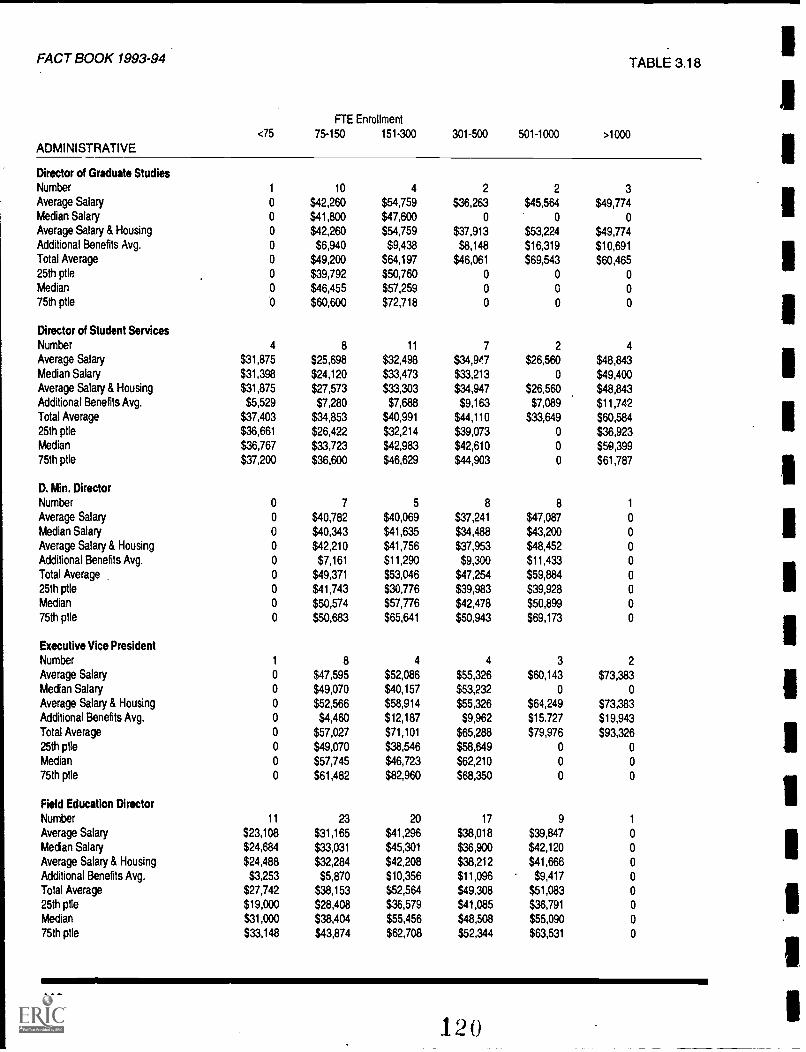
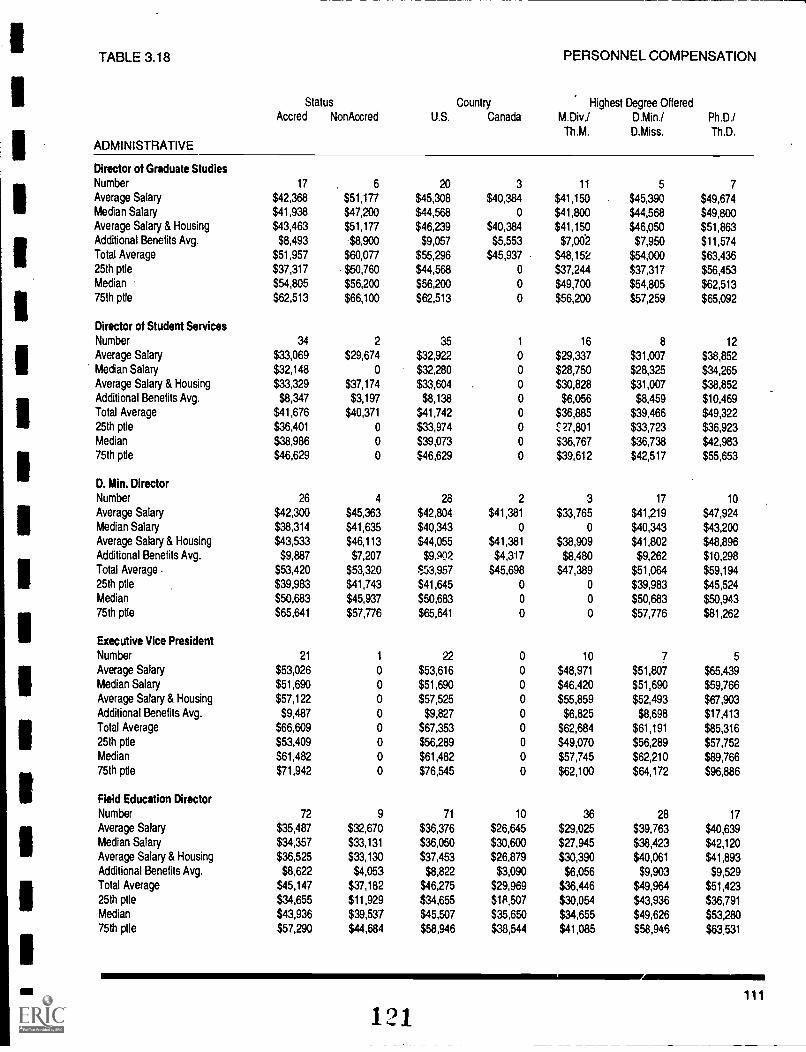
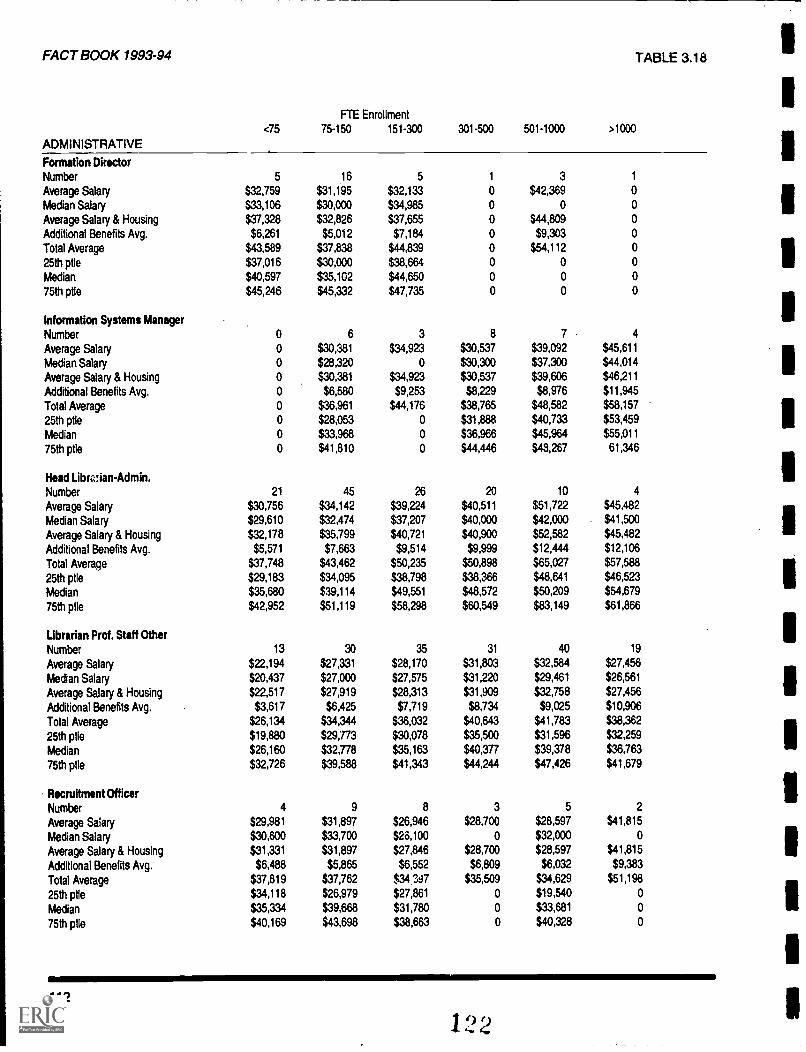
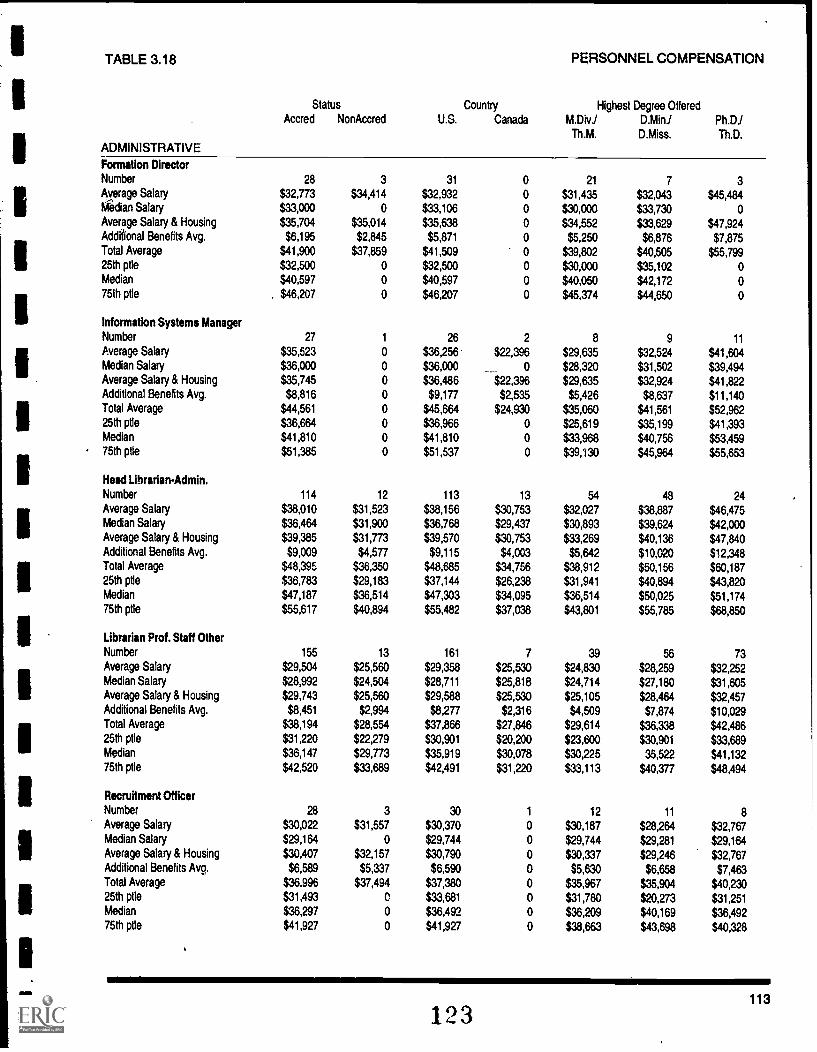
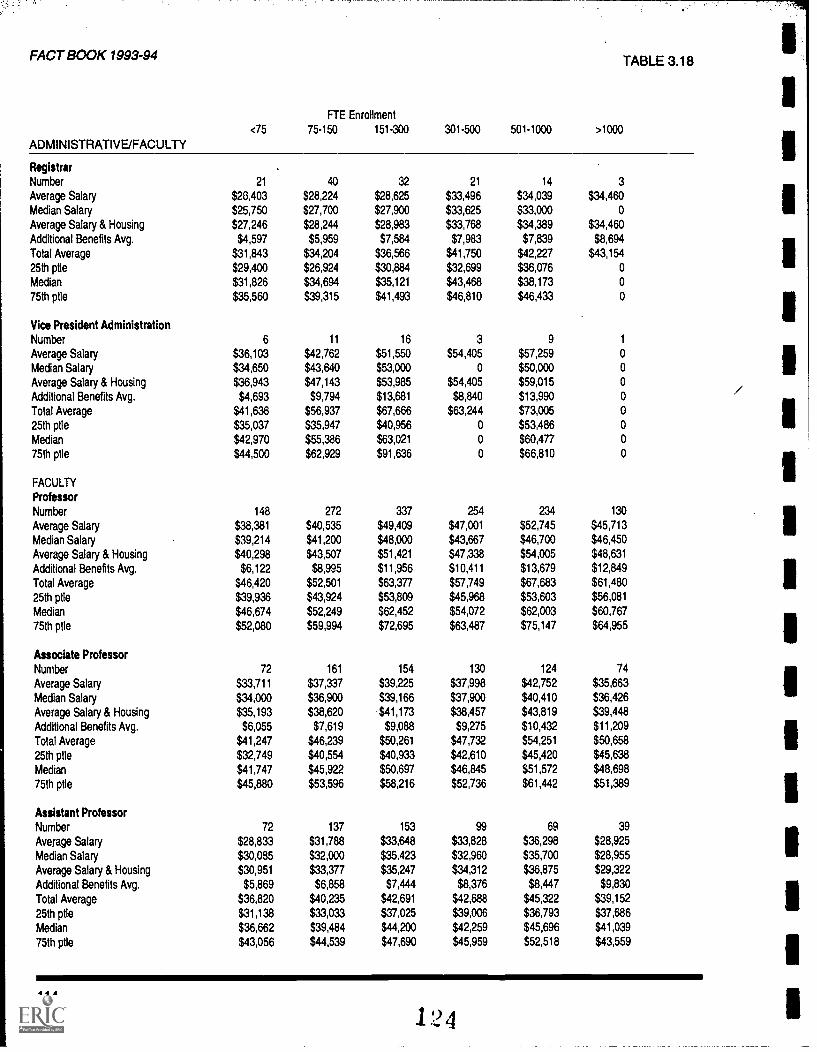
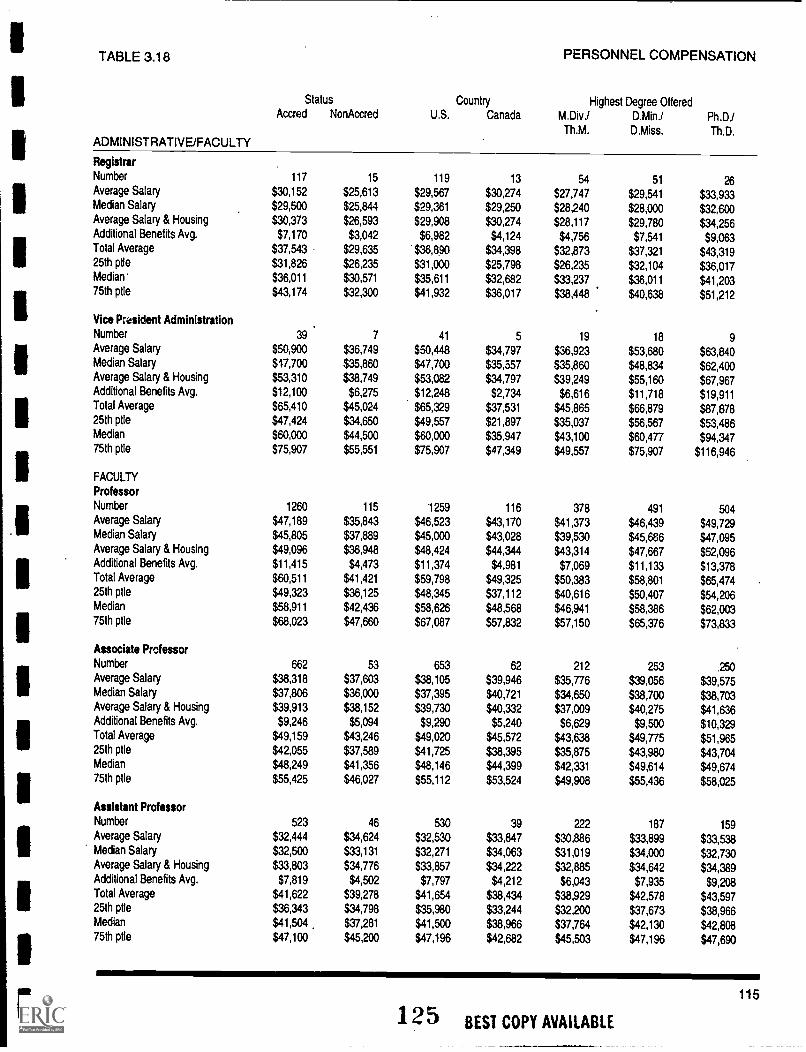
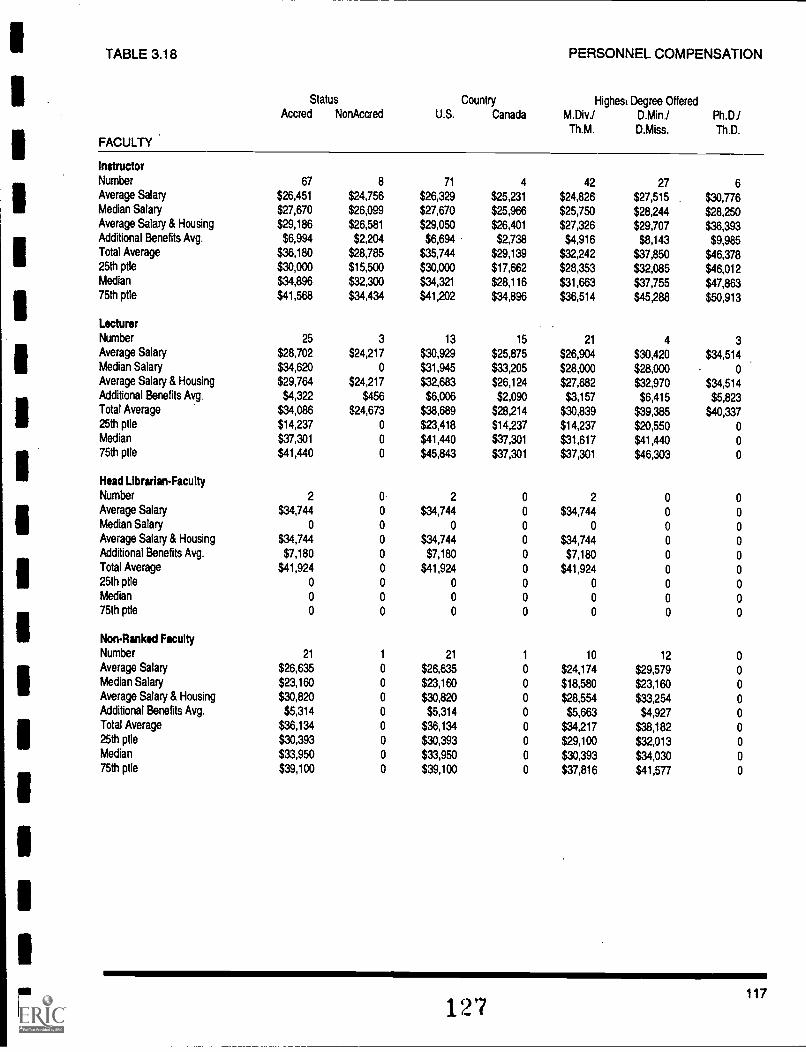
Table 3.18 Compensation Comparisons by Size, Accredited or Nonaccredited Status, Country, and Highest DegreeAll Schools in U.S. Dollars 105
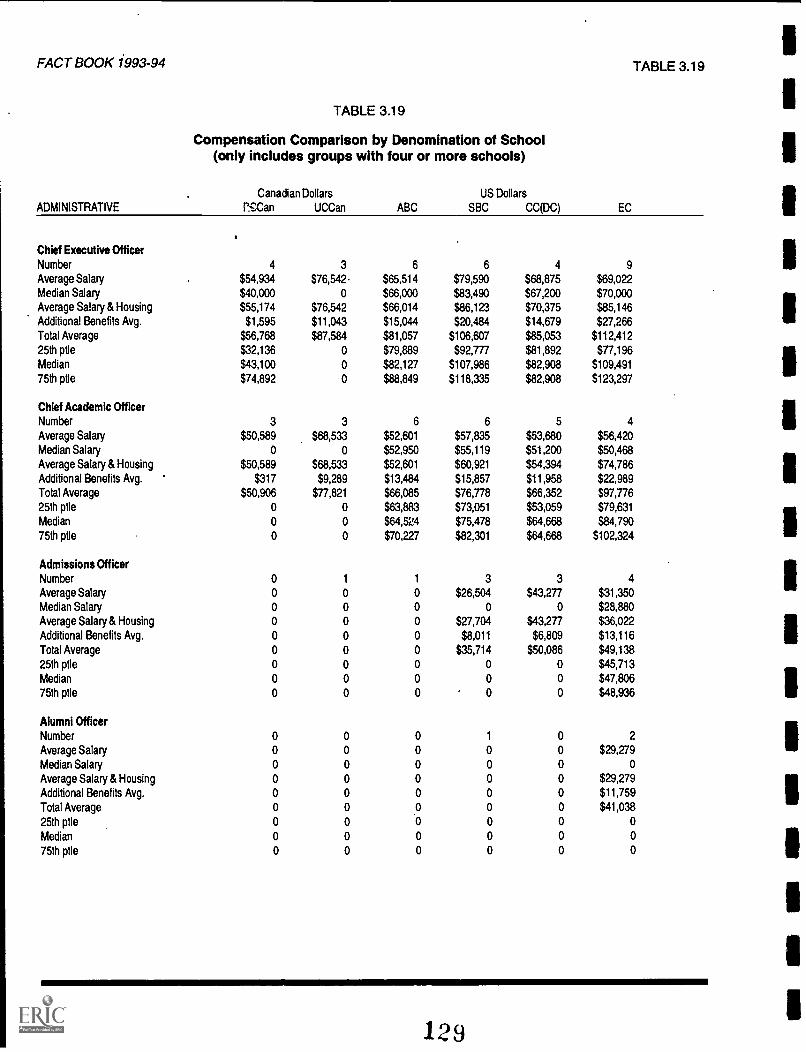
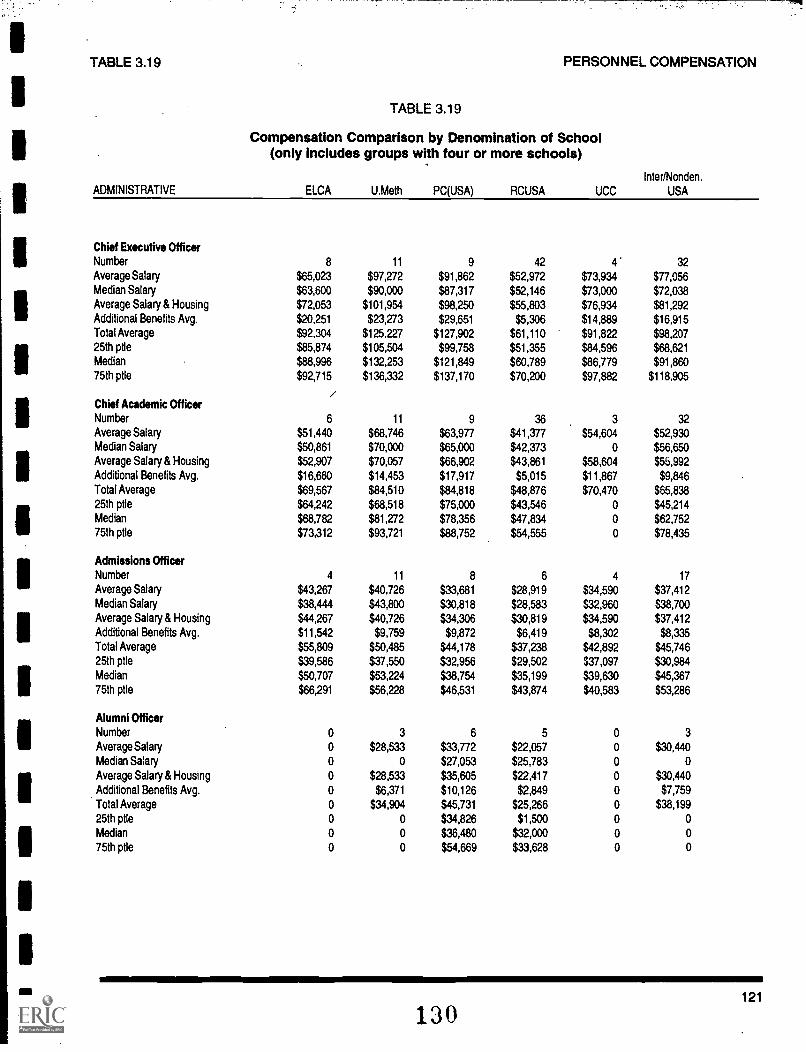
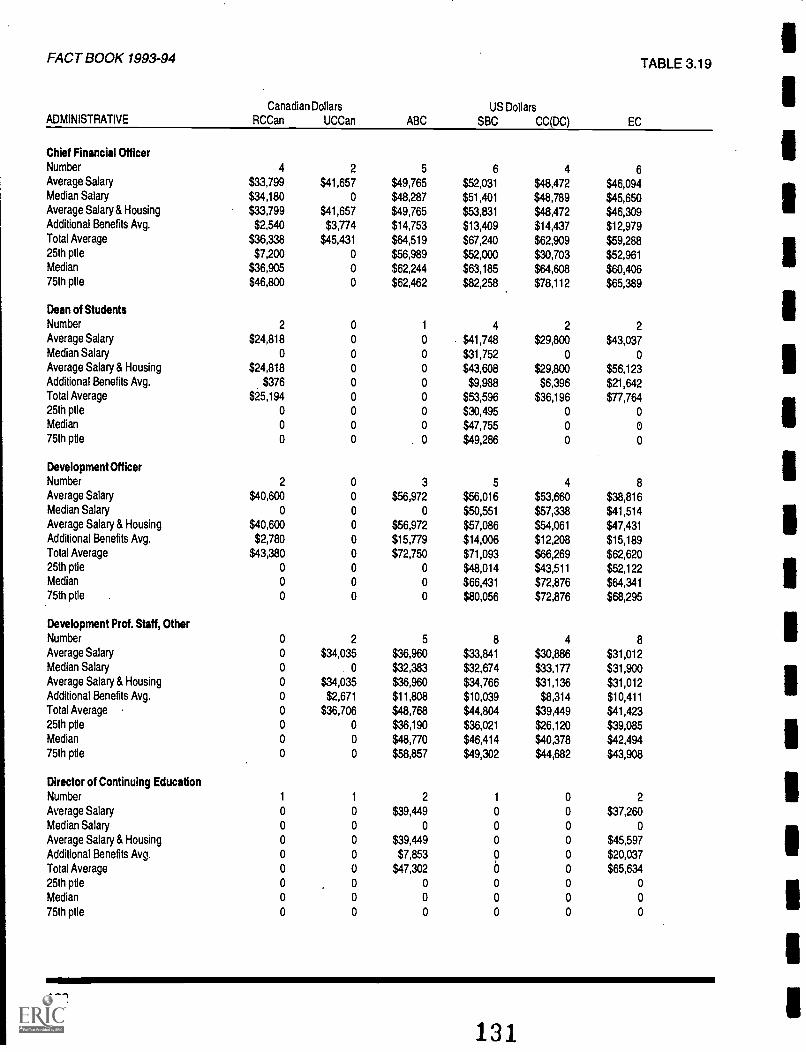
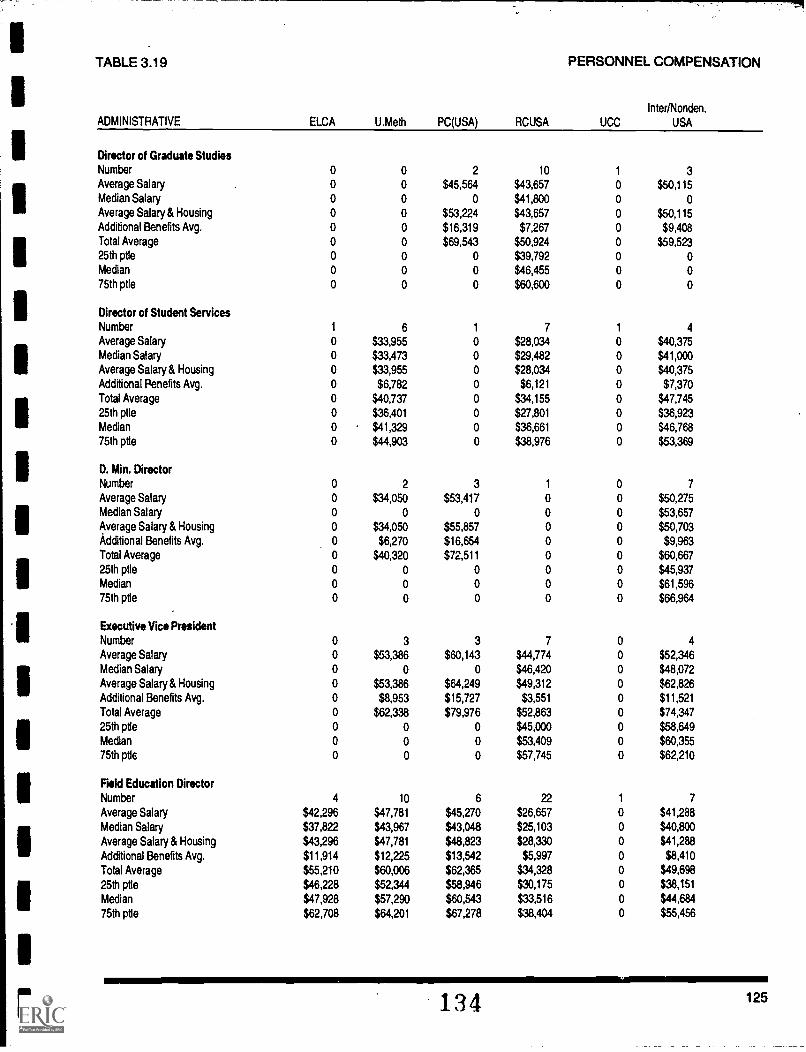
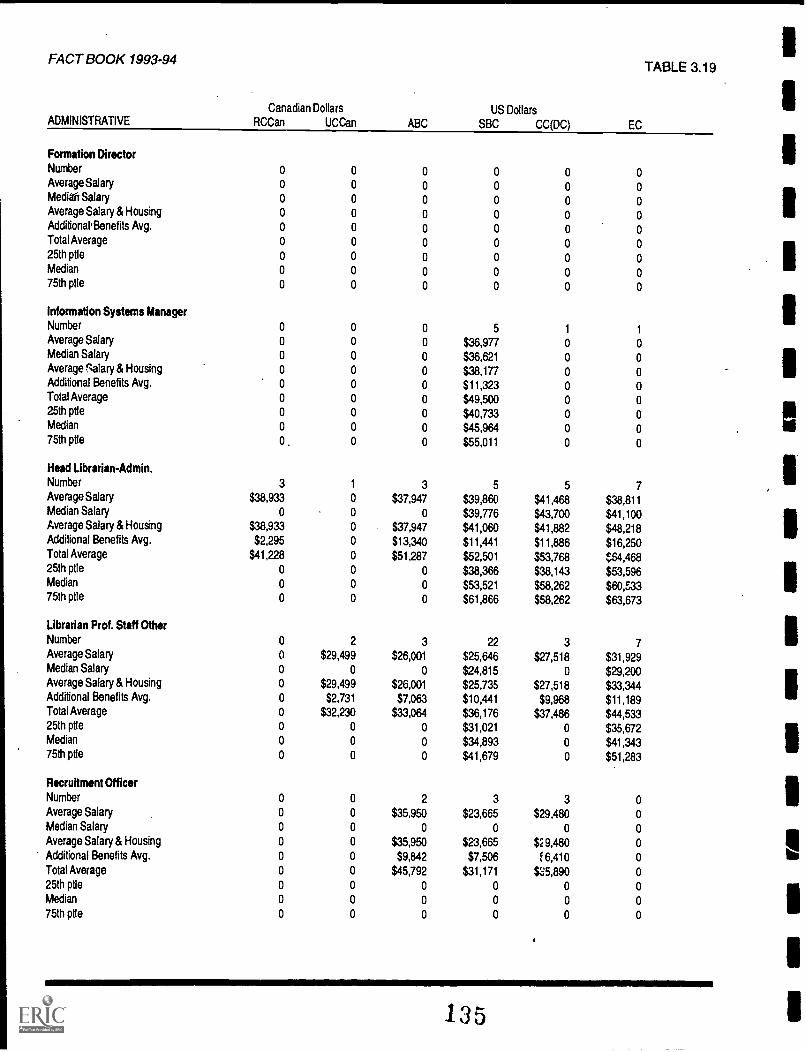
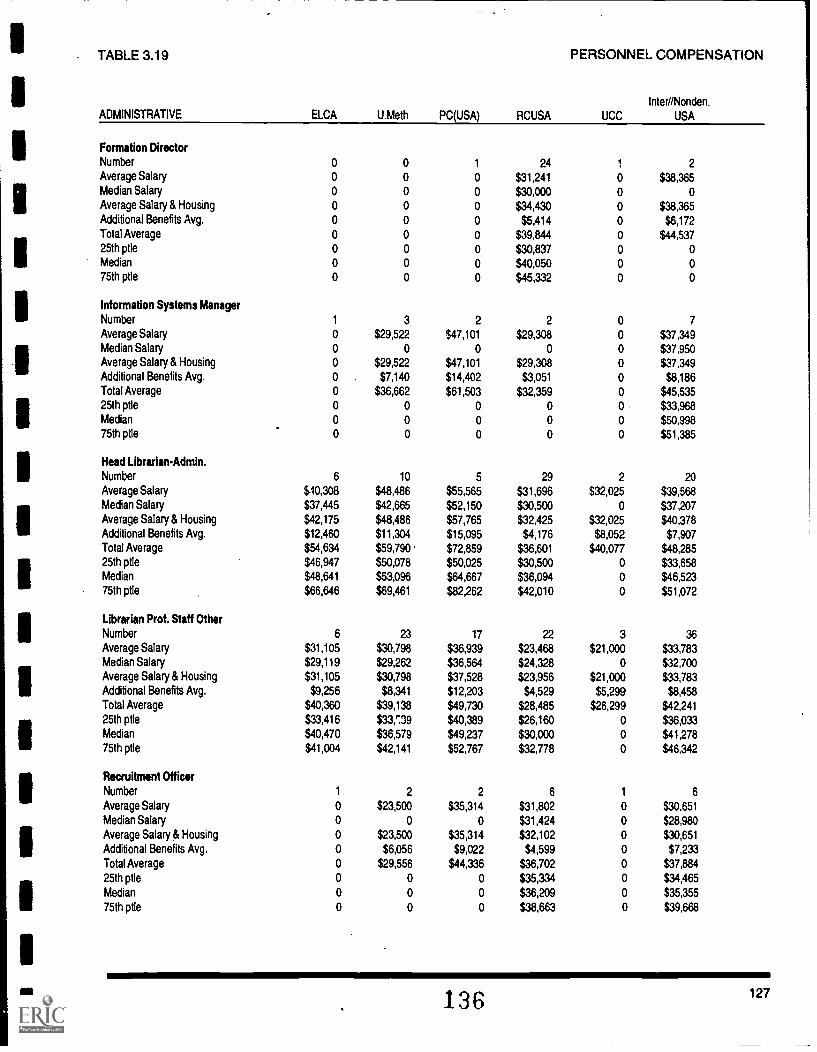
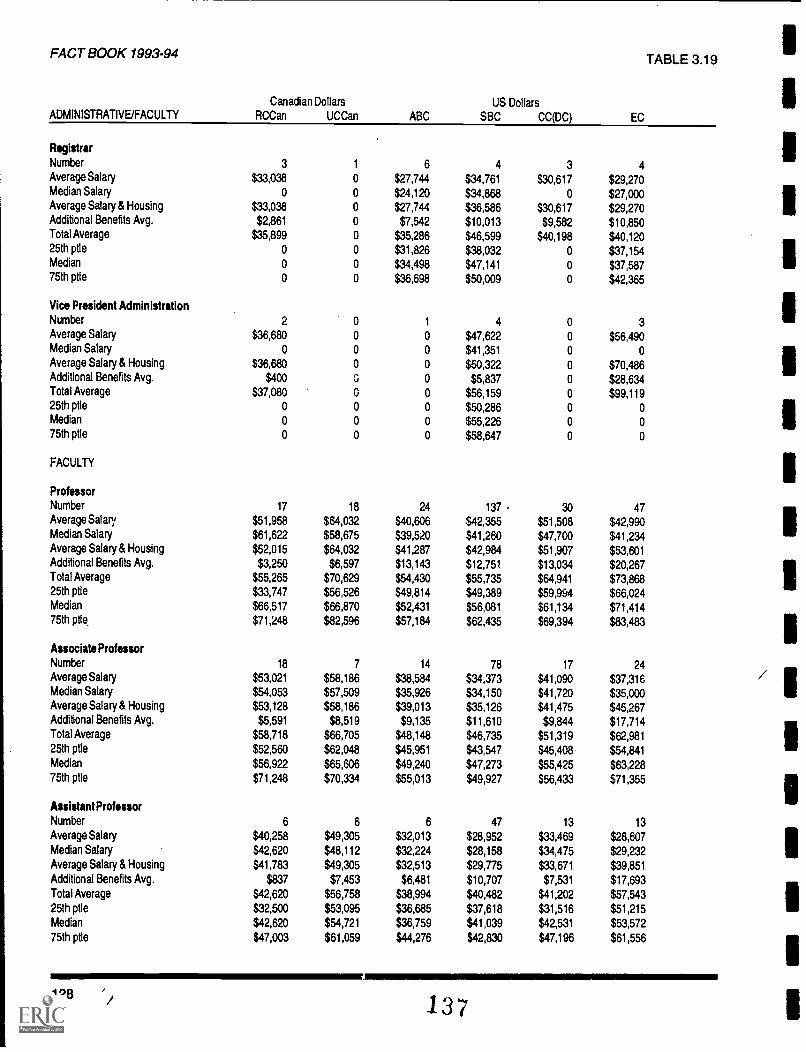
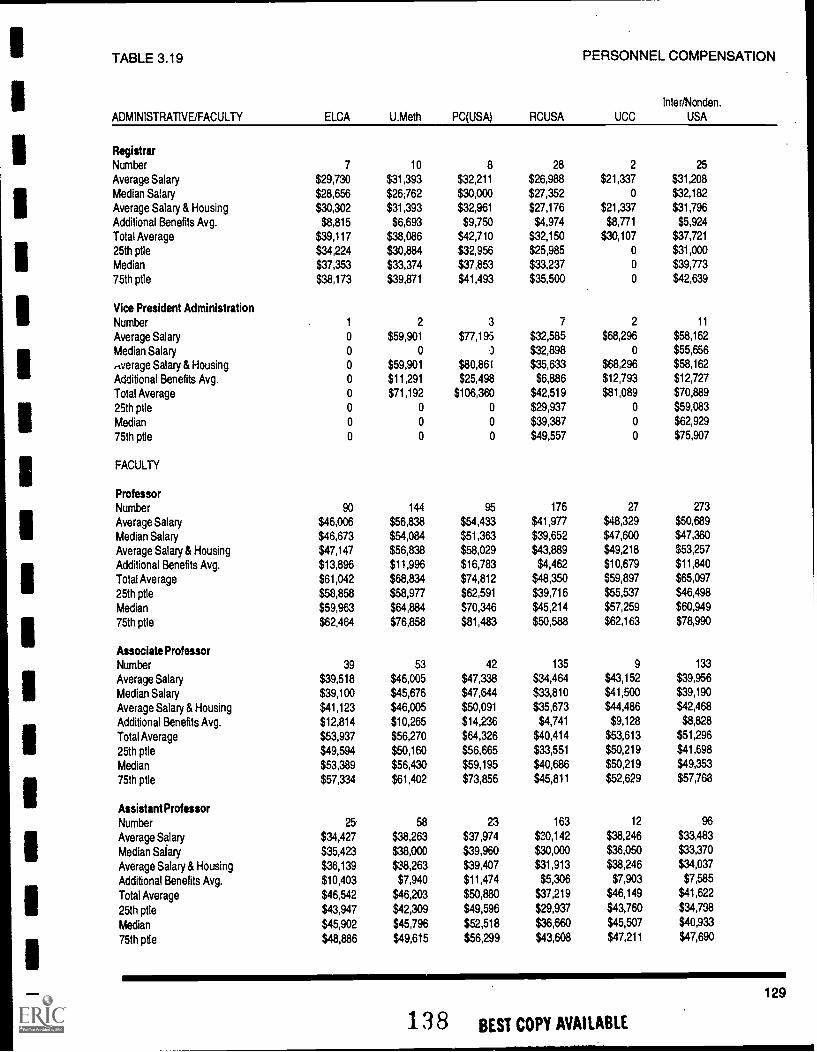
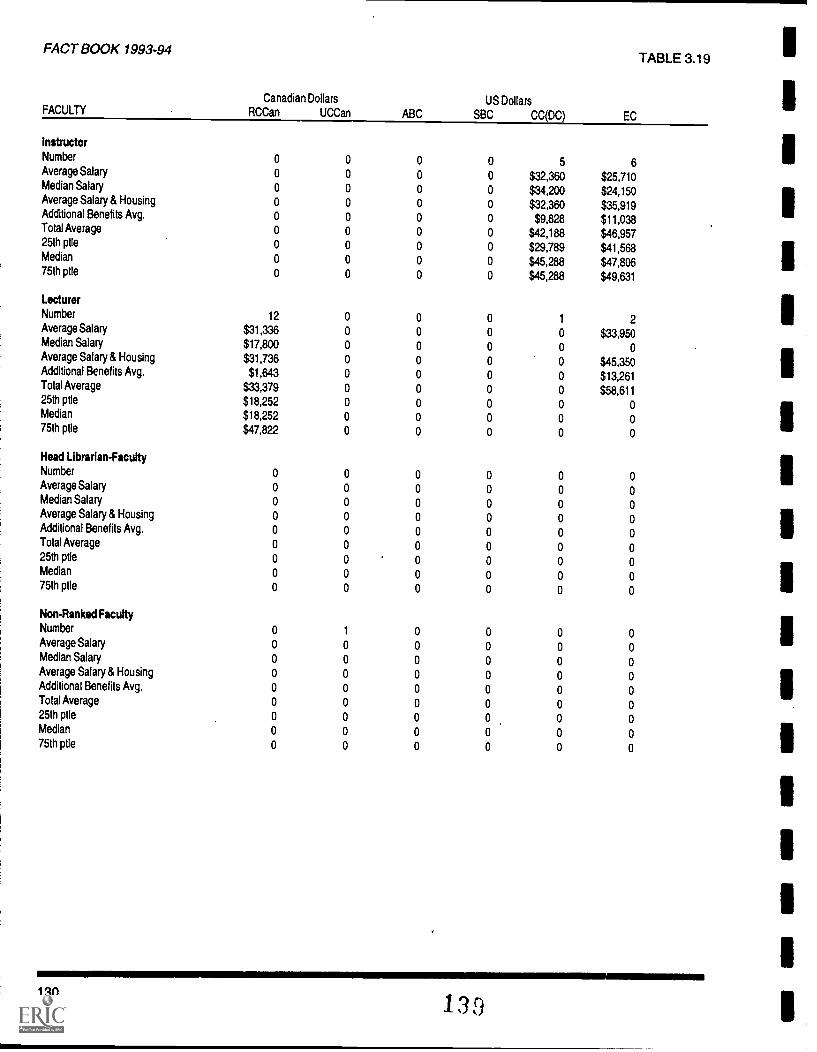
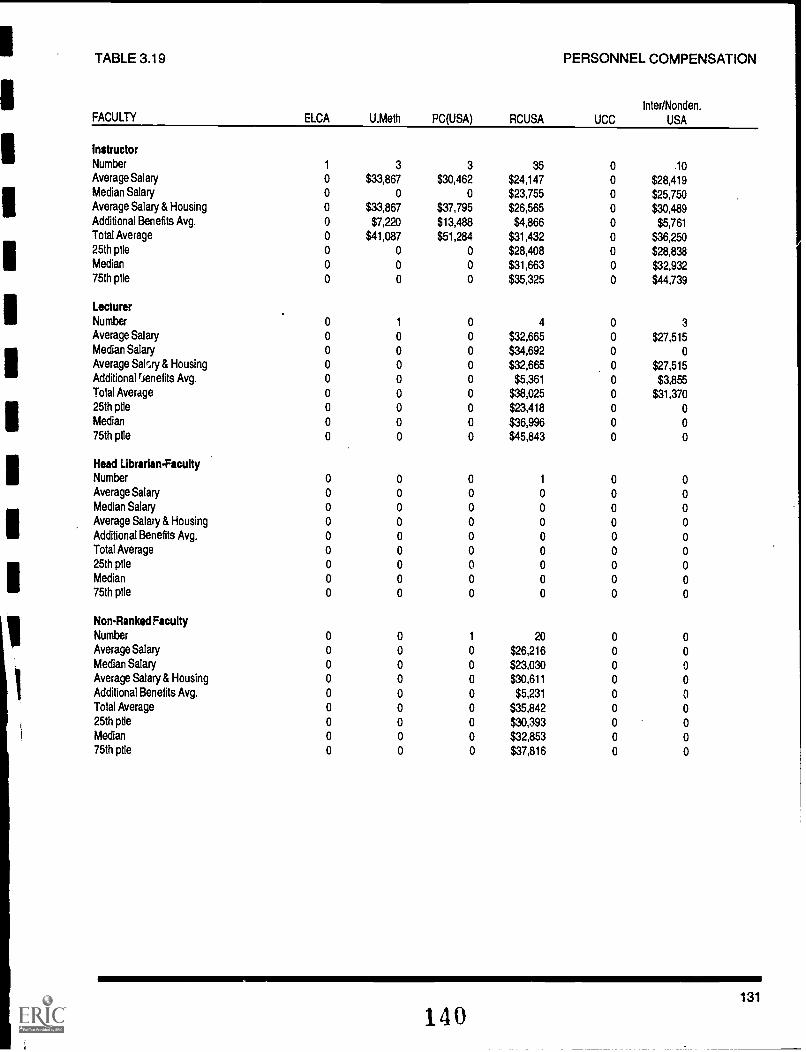
Table 3.19 Compensation Comparisons by Denomination of SchoolGroups with Four or More Schools 119
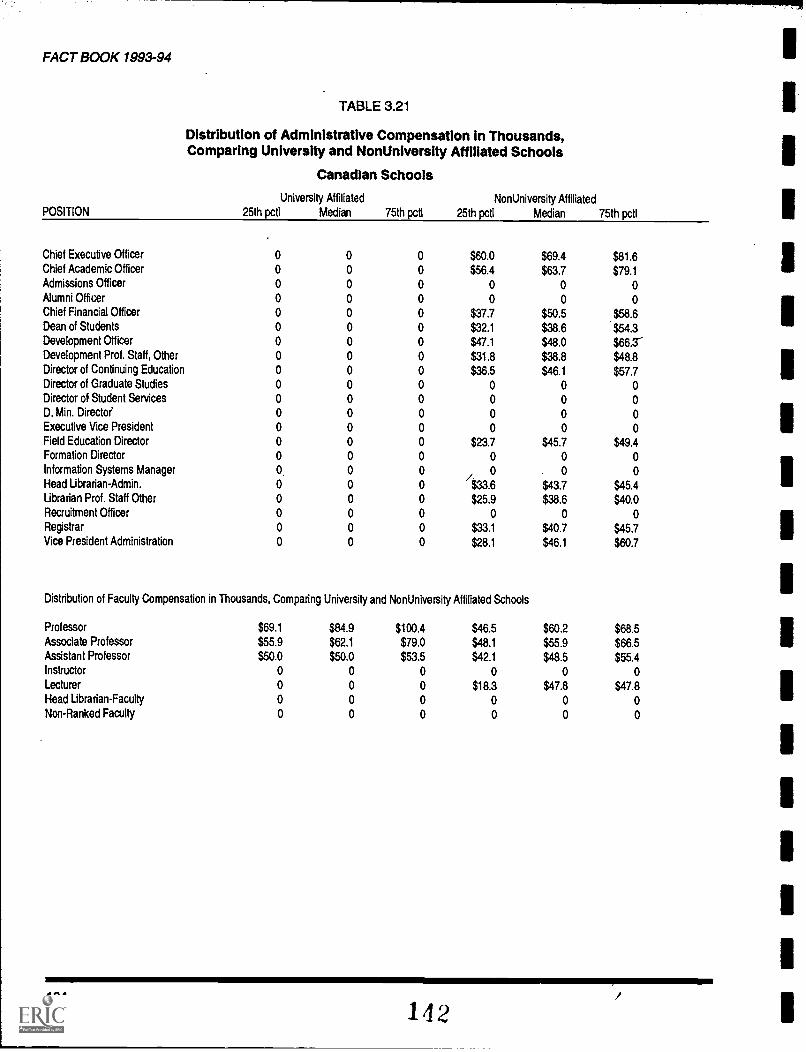
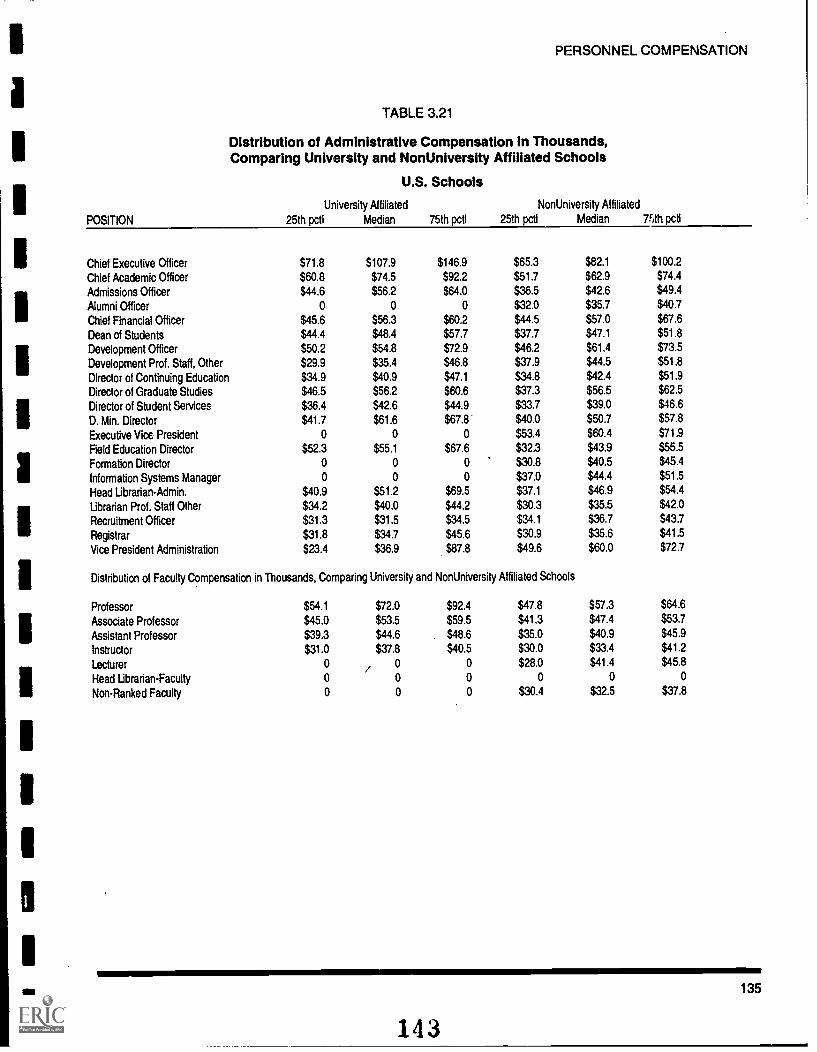
Table 3.21 Distribution of Administrative and Faculty Compensation in Thousands, Comparing University andNon University Affiliated Schools 133
Table 3.22 Distribution of Full Professor Compensation by GenderAll Canadian Schools 136
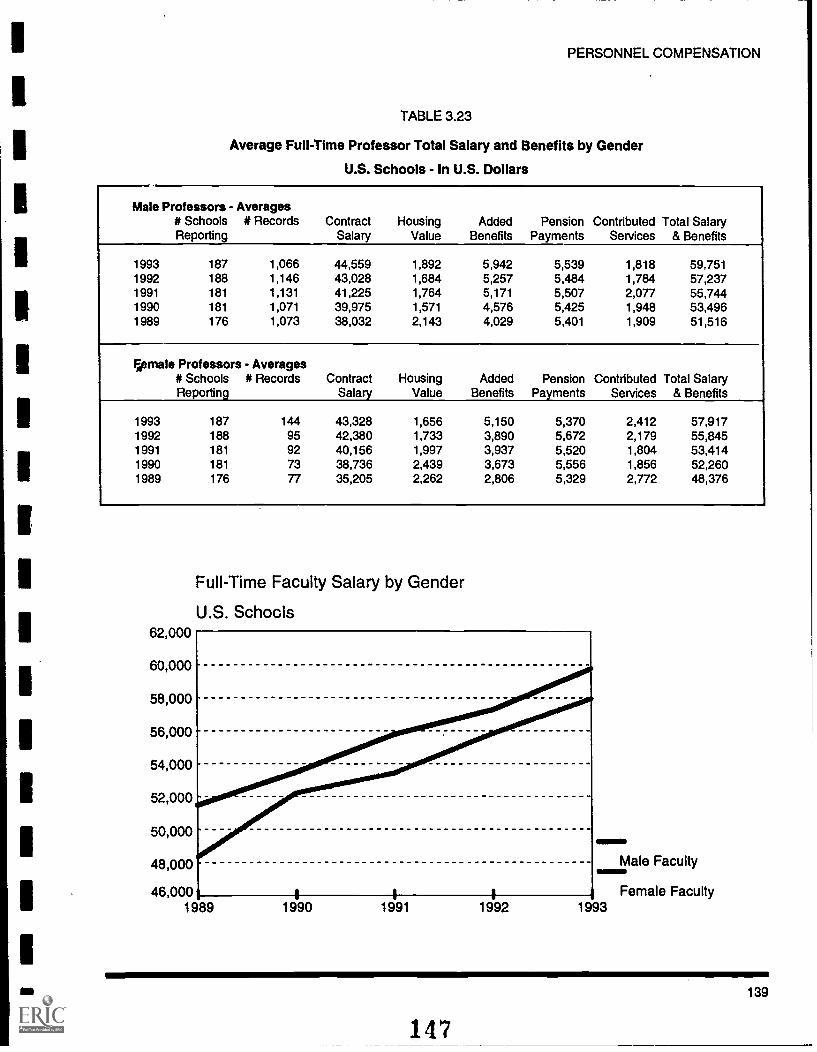
Table 3.23 Distribution of Full Professor Compensation by GenderAll U.S. Schools 138
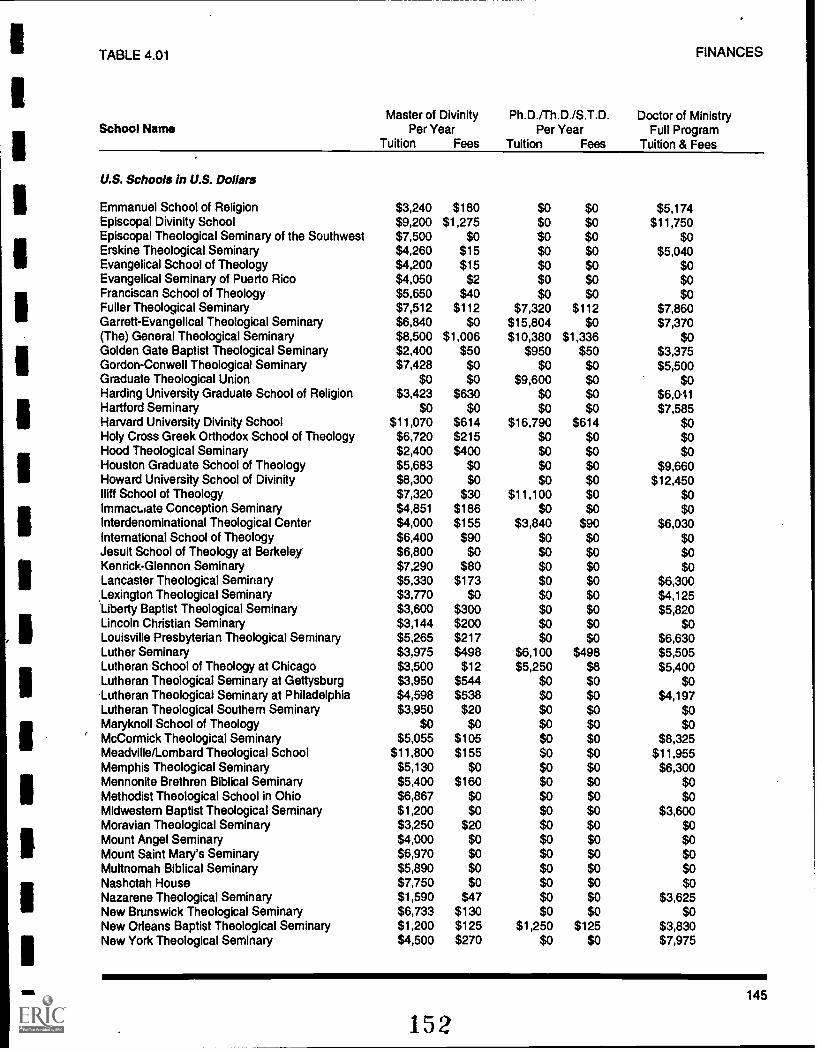
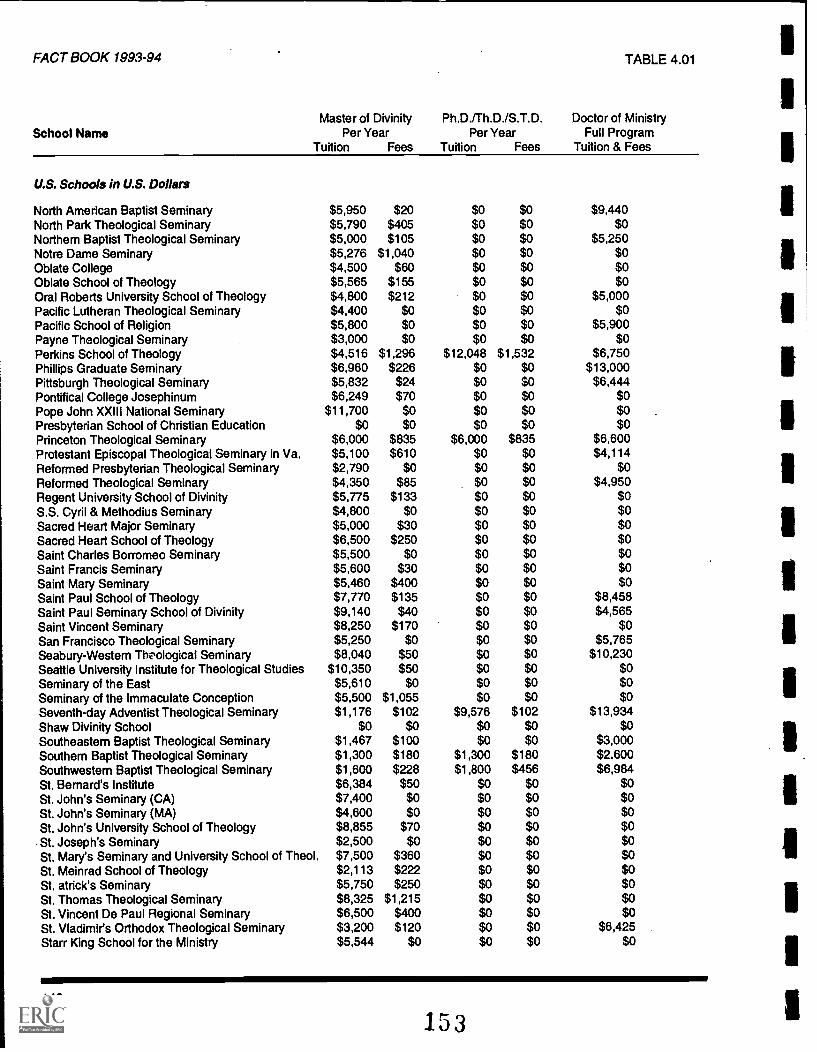
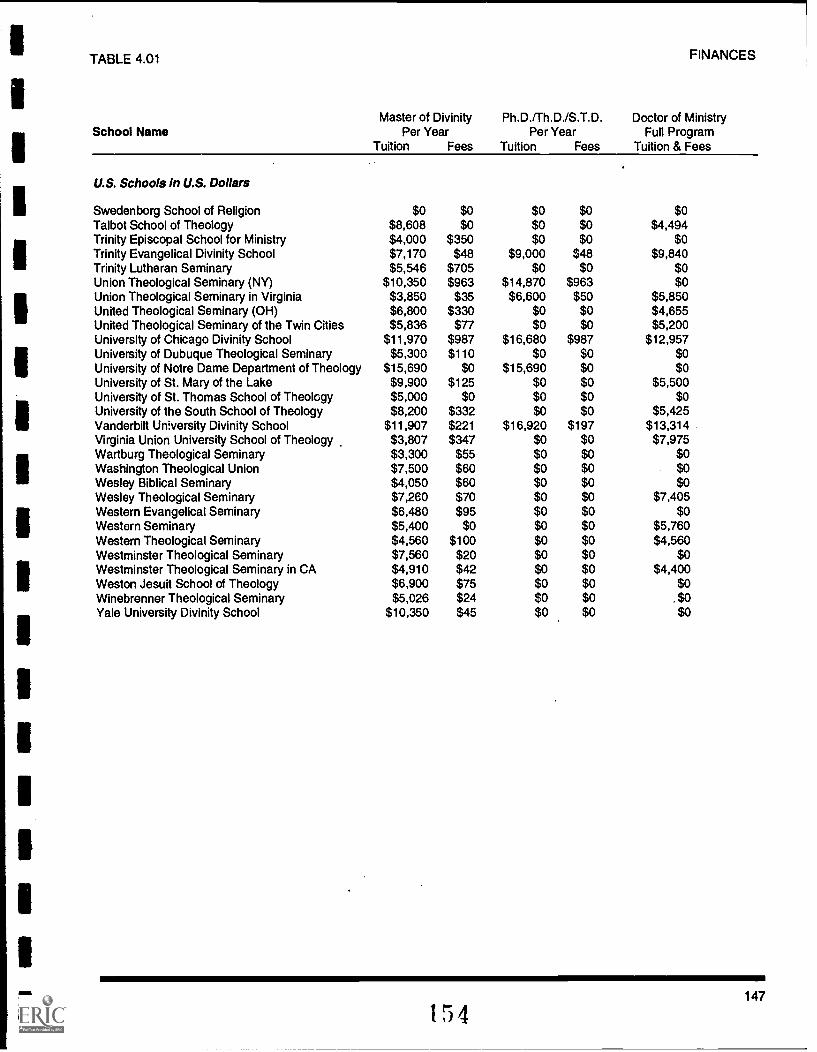
Chapter IV Finances: Tuition Costs, Revenues, and ExpendituresIntroduction 141
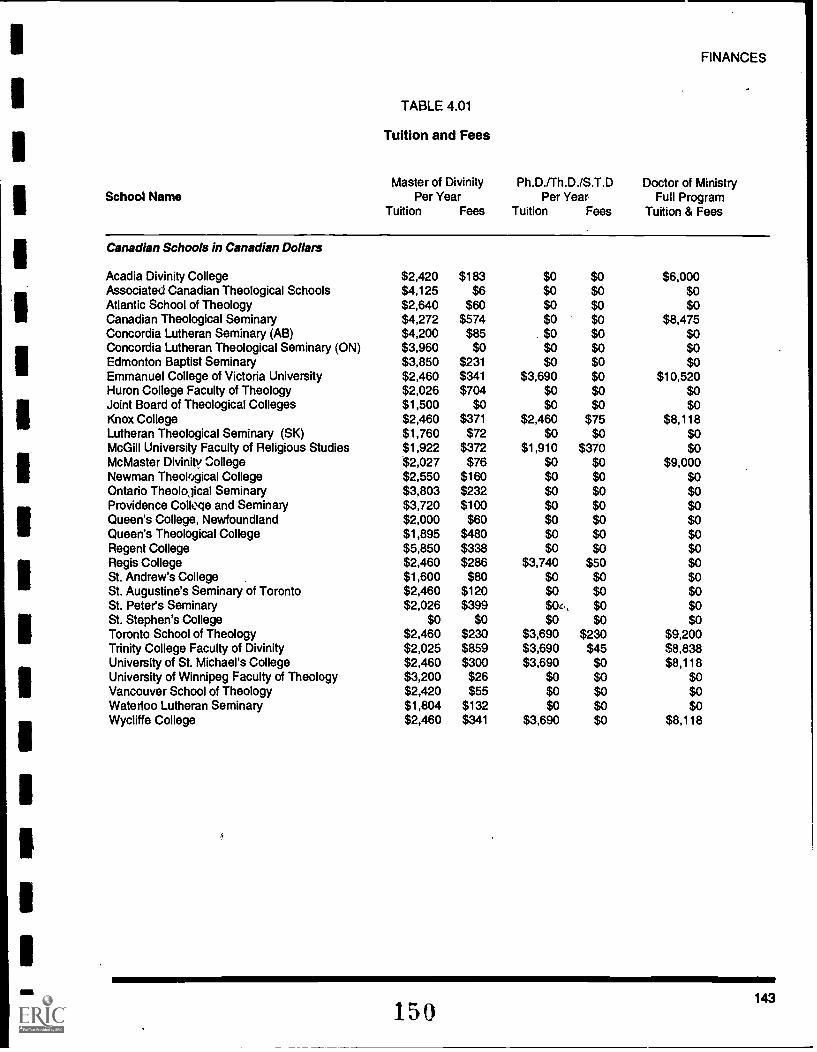
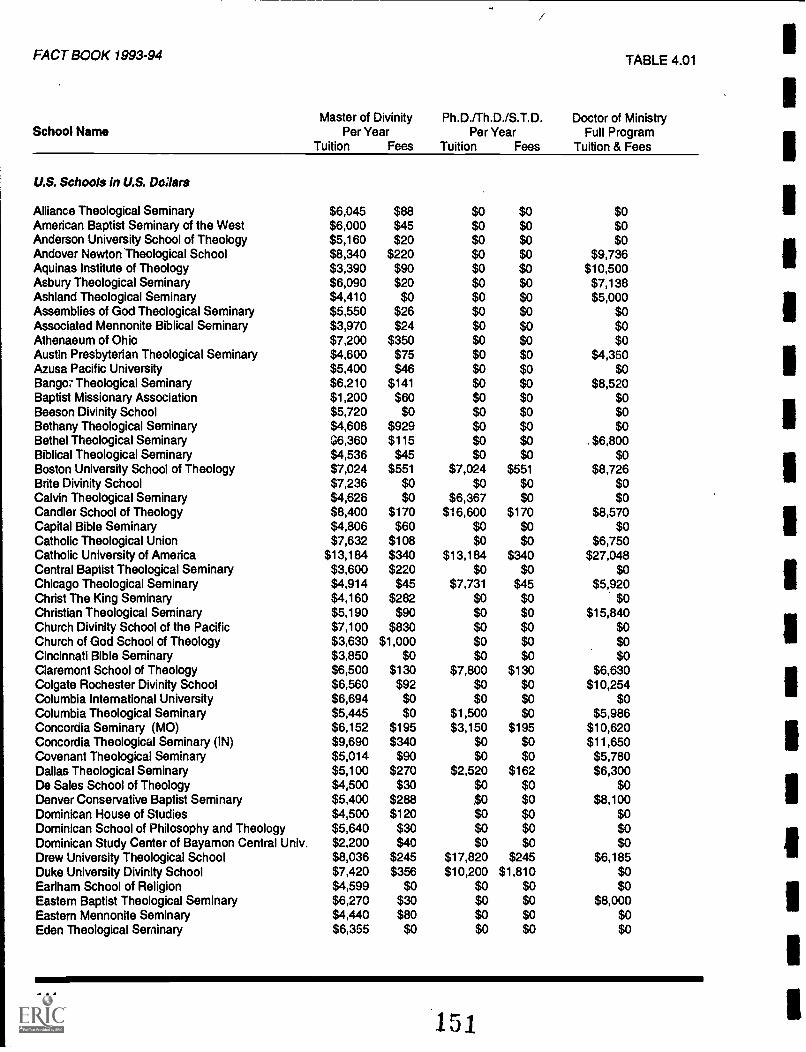
Tuition and Fees 142
Average Tuition Charges 148
Revenue and Expenditures Per FTE Student 151
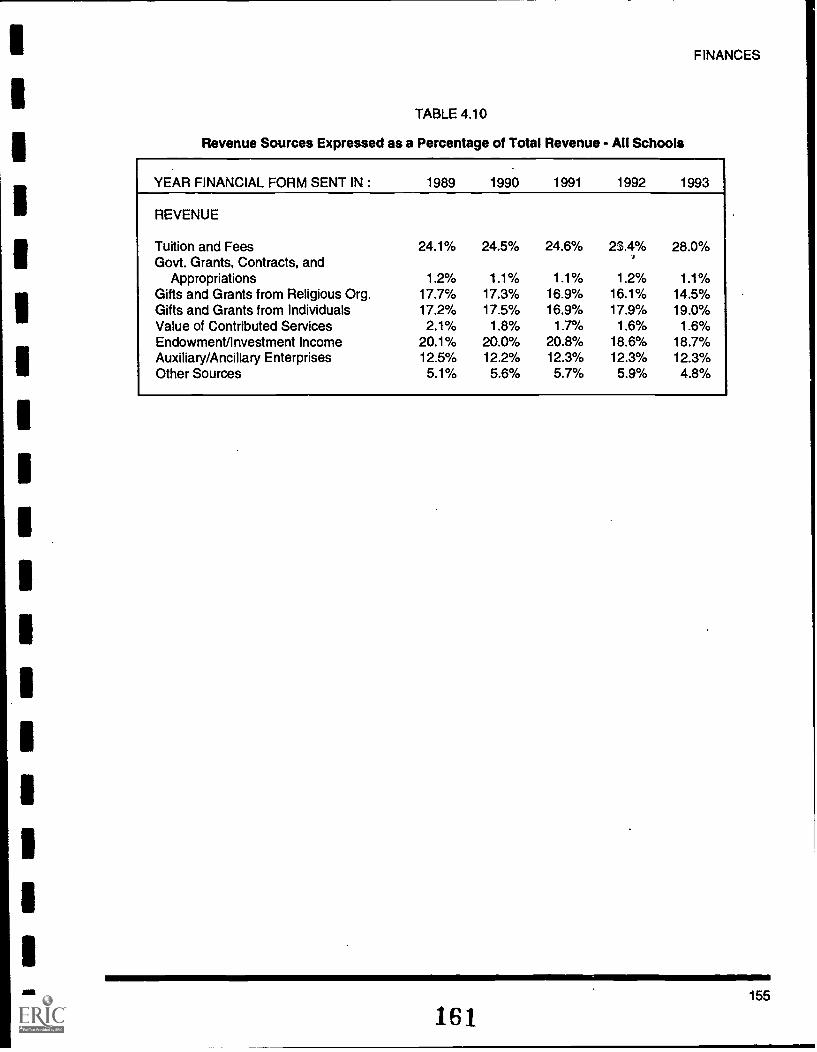
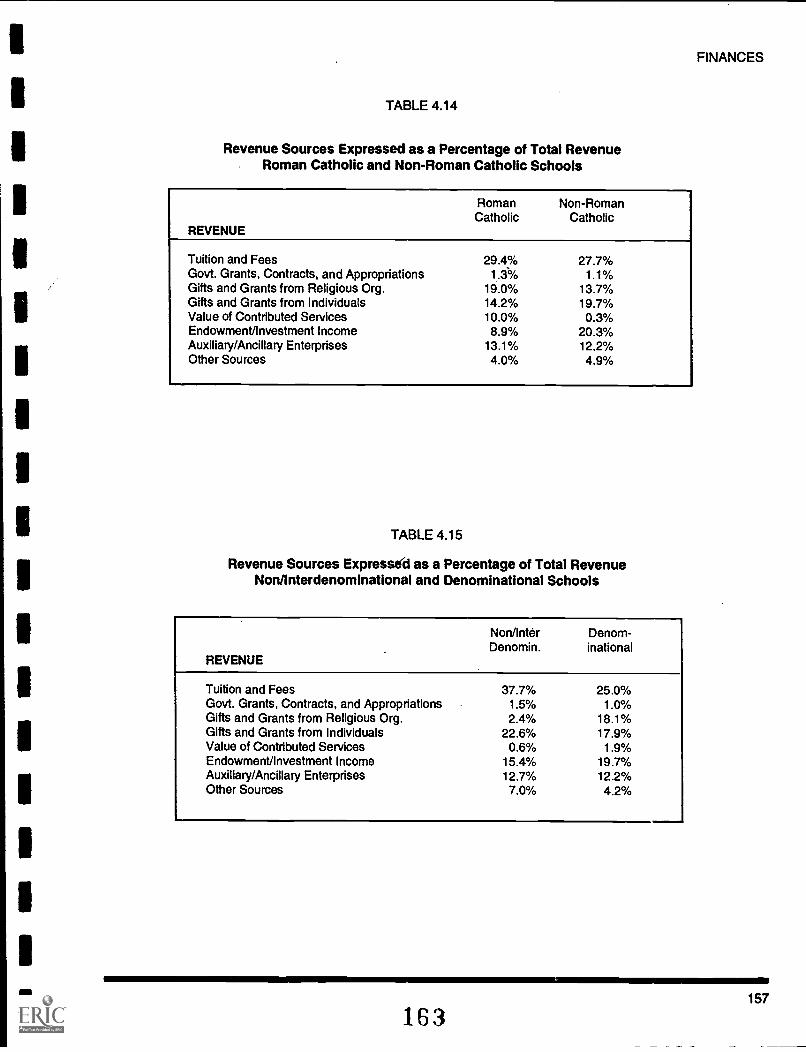
Revenue Sources Expressed as a Percentage of Total RevenueAll Schools 154
Revenue Sources as a Percentage of Total RevenueRoman Catholic and Non-Roman Catholic Schools 156Revenue Sources Expressed as a Percentage of Total RevenueNon/Interdenominational and Denominational Schools 156
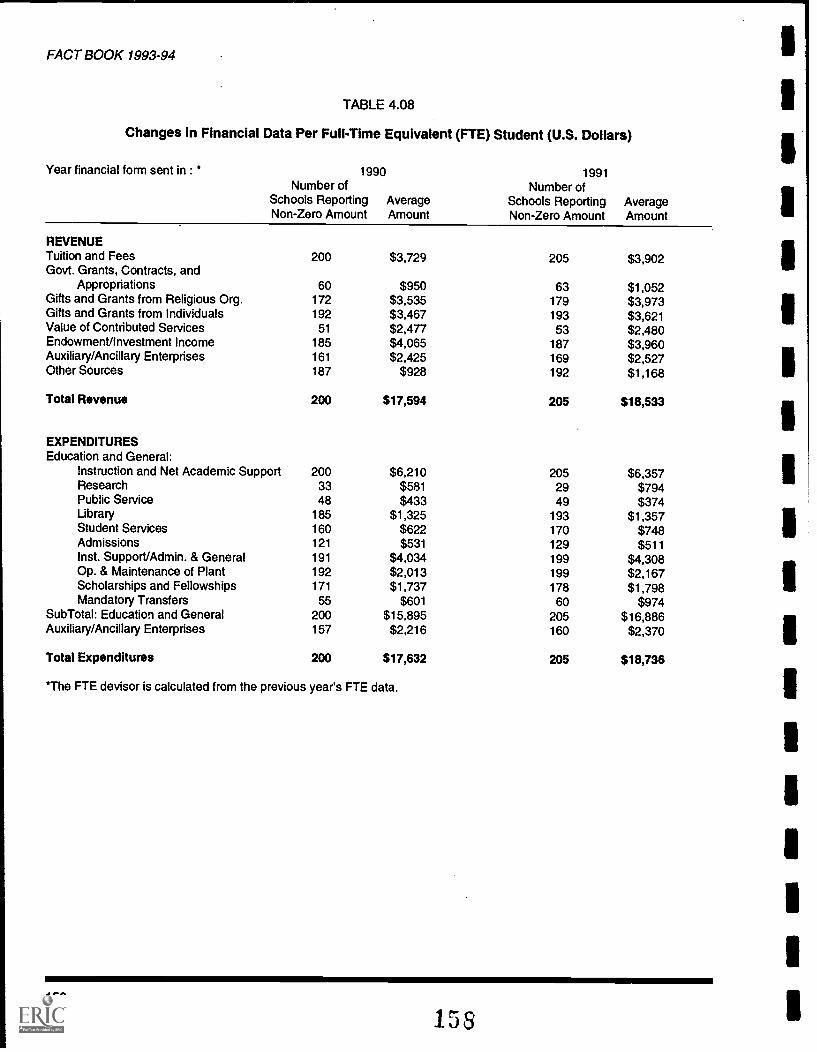
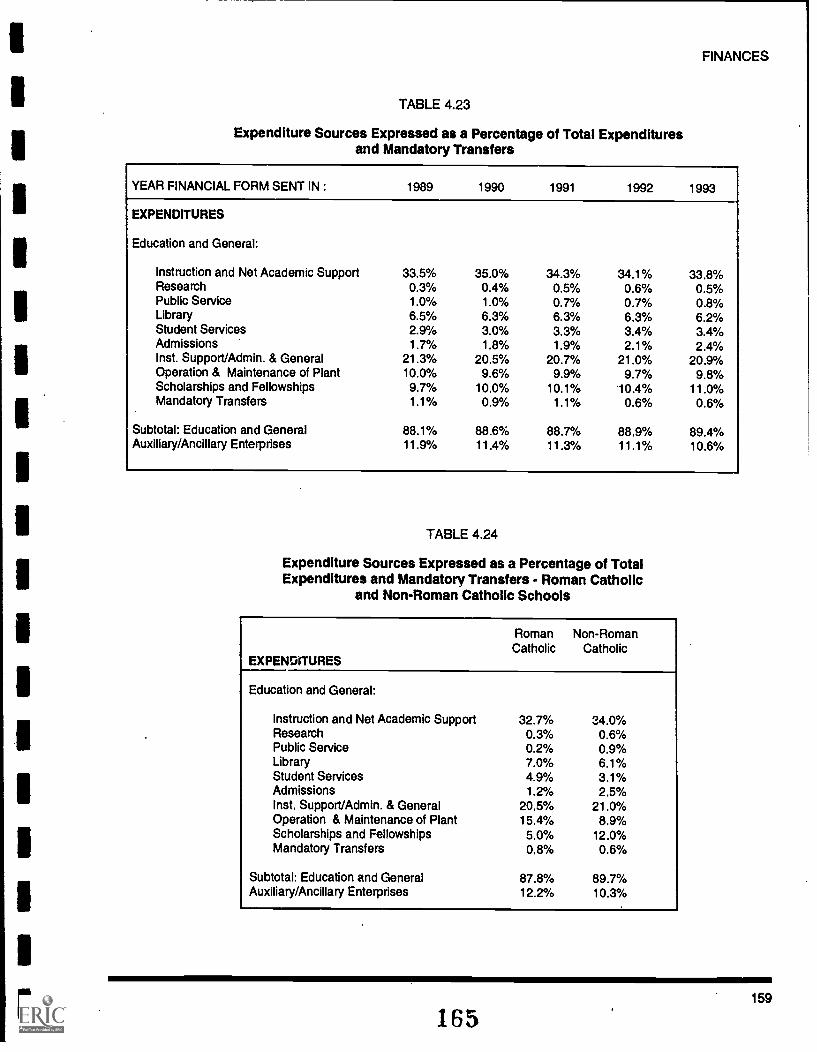
Table 4.23 Expenditure Sources as a Percentage of Total ExpendituresAll Schools 158
Table 4.24 Expenditure Sources as a Percentage of Total ExpendituresRoman Catholic andNon-Roman Catholic Schools 158
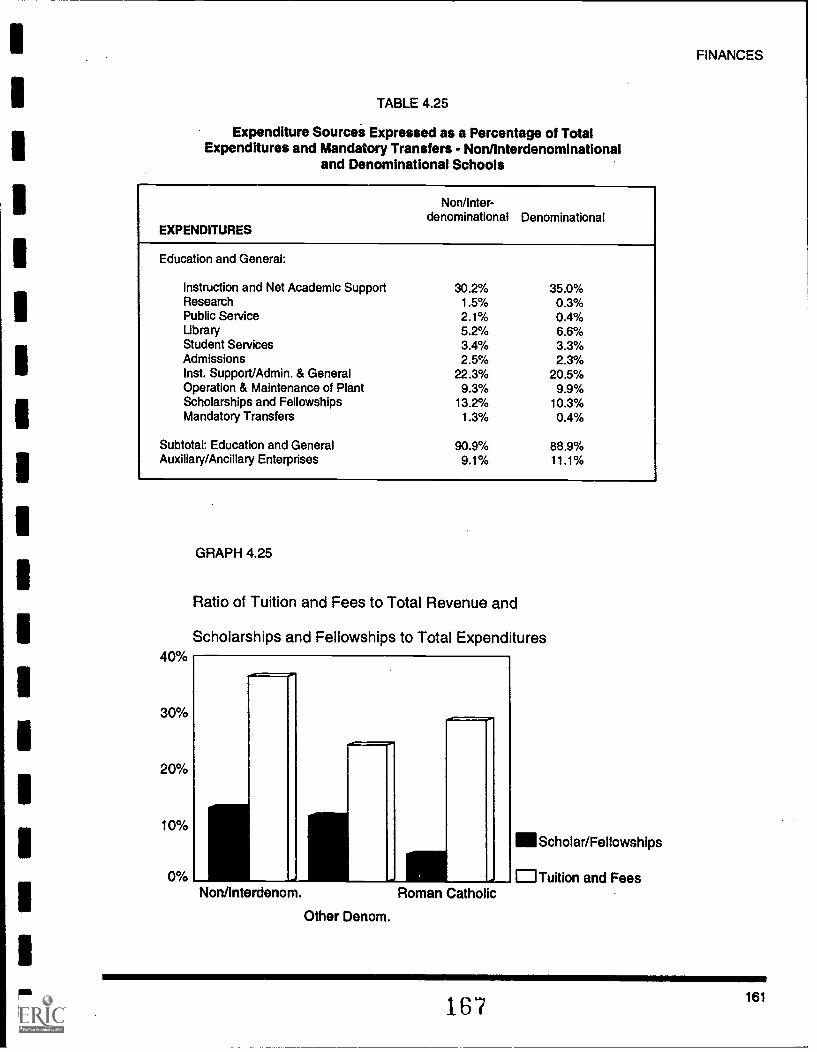
Table 4.25 Expenditure Sources as a Percentage of Total Expenditures and Mandatory TransfersNon/Interdenominational and Denominational Schools 160
Graph 4.25 160
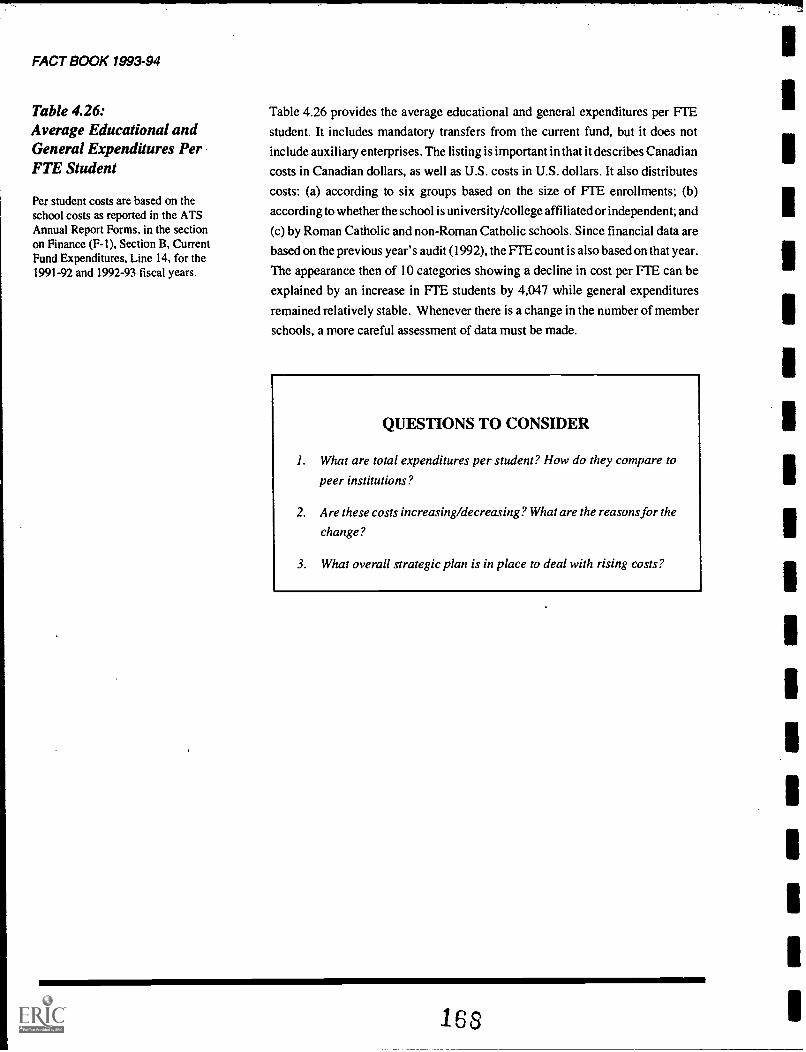
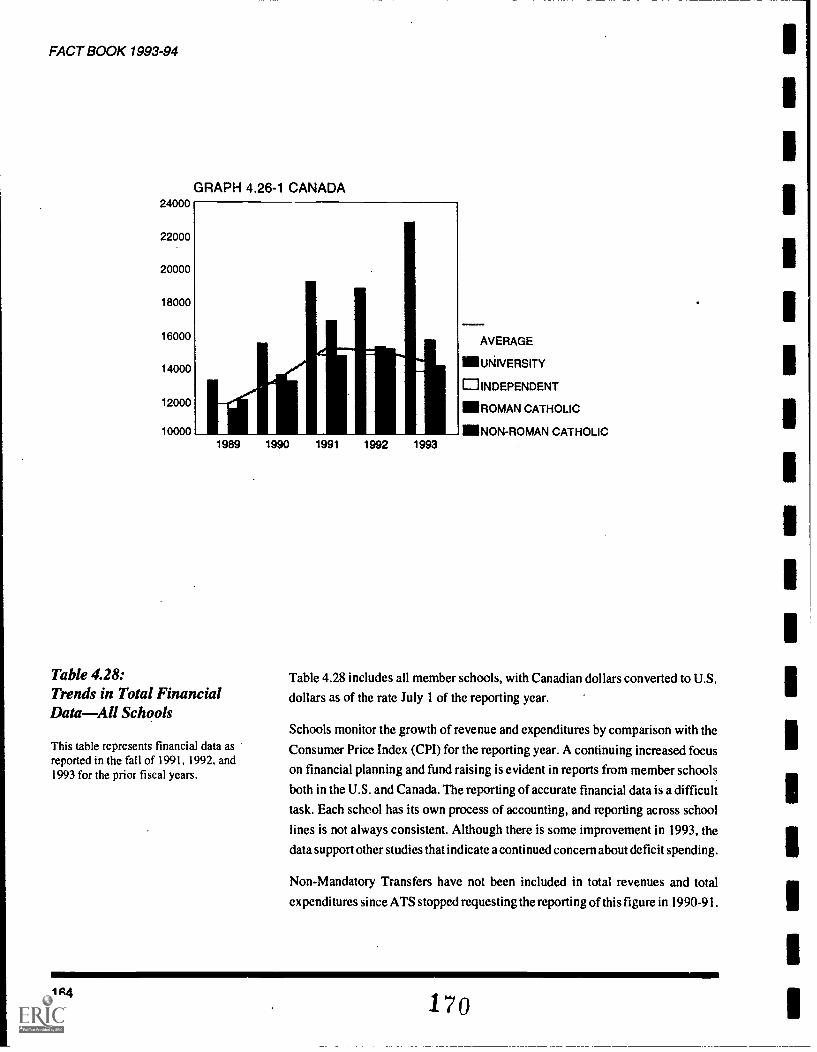
Table 4.26 Average Educational and General Expenditures Per FTE Student 162
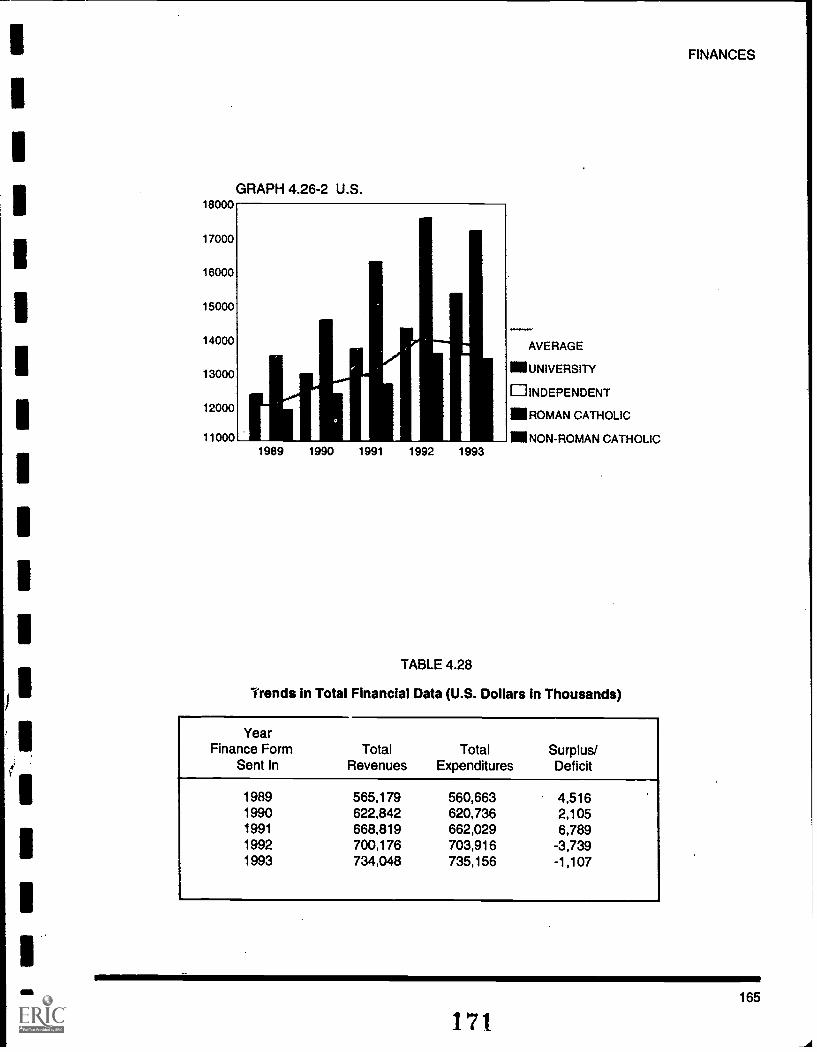
Table 4.28 Trends in Total Financial DataAll Schools 164
Table 4.29 Ratio of Surplus or (Deficit) to Total RevenuesAll Schools 166
Table 4.30 Ratio of Net Educational and General (E&G) Surplus or (Deficit) to Total RevenuesAll Schools 166
Table 4.33 Endowment Assets in U.S. Thousands at Market ValueAll Schools 168
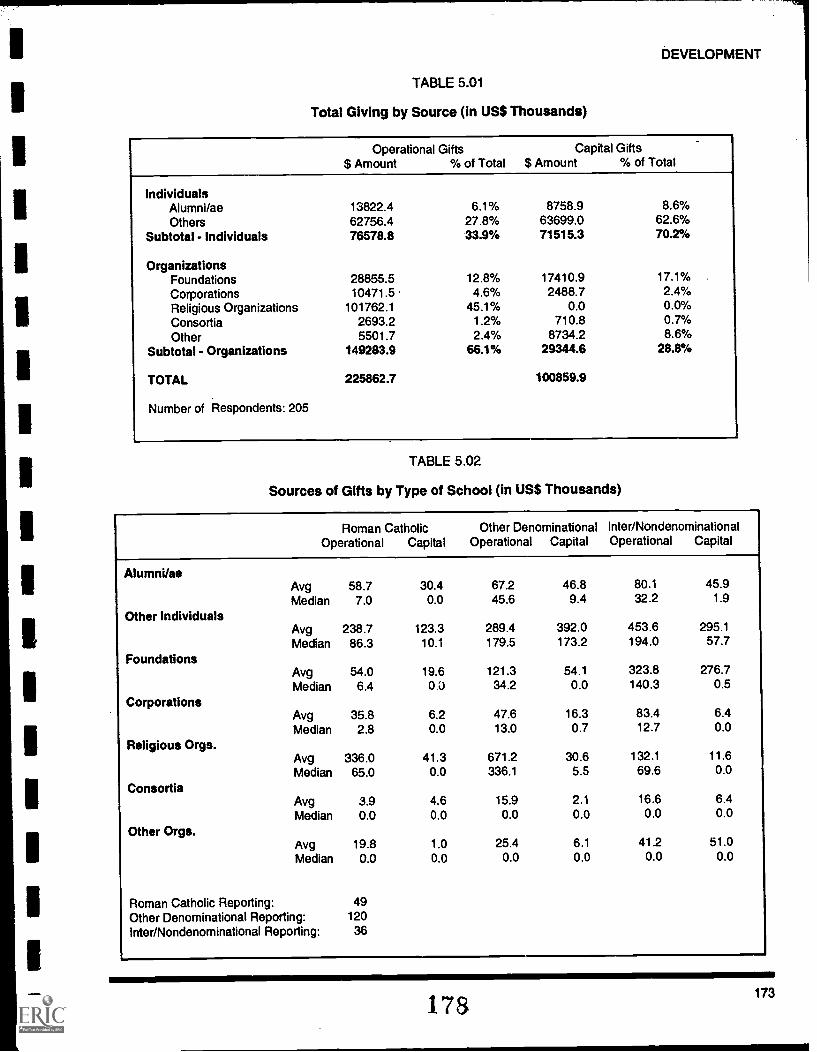
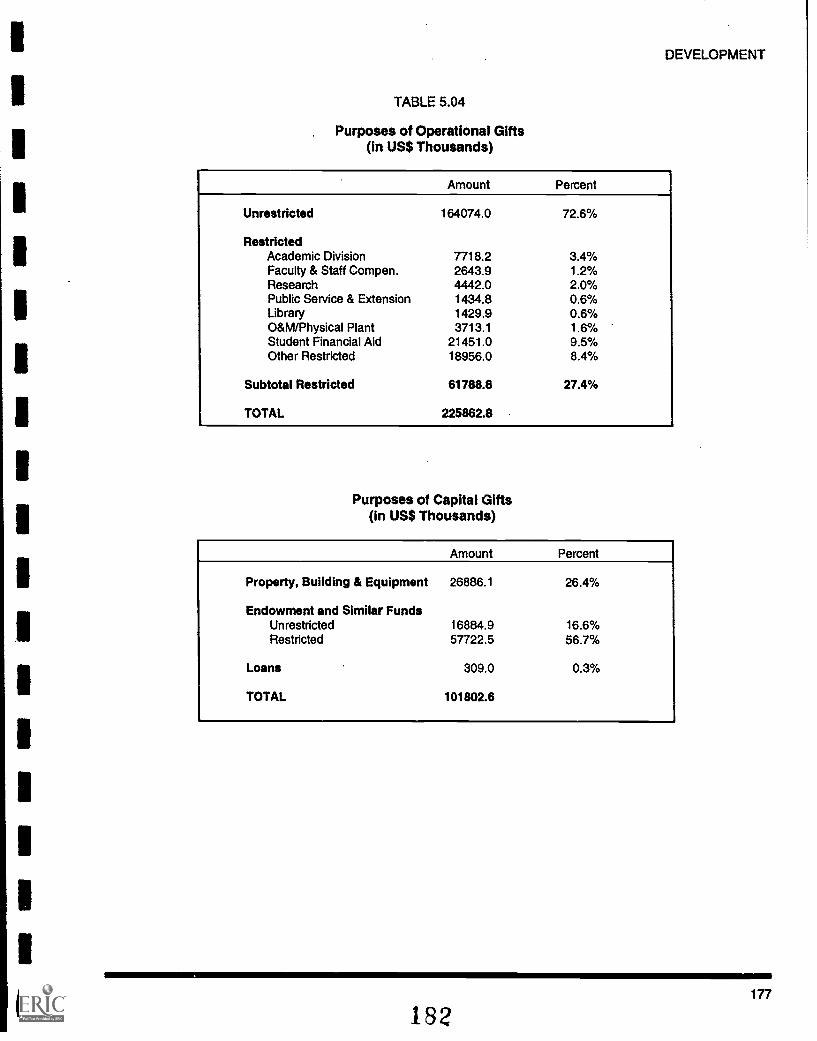
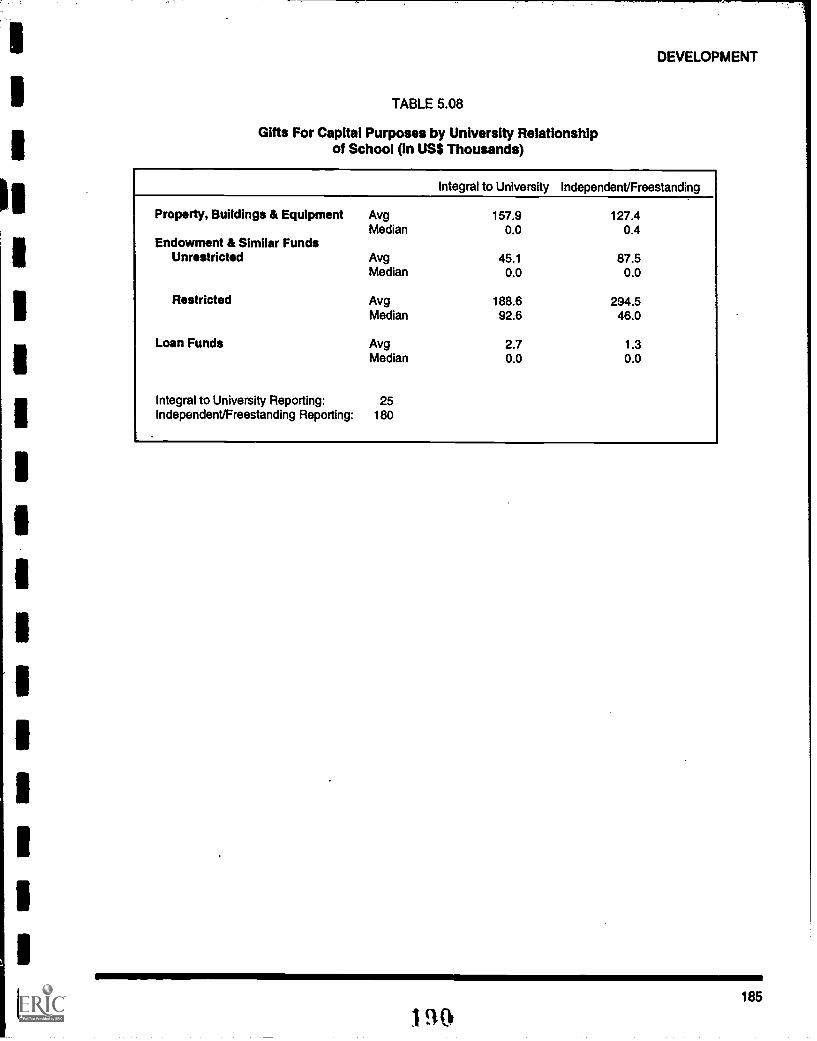
Total Giving by SourceSources of Gifts by Type of SchoolSources of Gifts by University Relationship of SchoolPurposes of Operational and Capital GiftsPurposes of Gifts for Current Operations by Type of SchoolGifts for Capital Purposes by Type of SchoolPurposes of Gifts for Current Operations by University RelationshipGifts for Capital Purposes by University Relationship
171
172172174176178180182184
1
The Association ofTheological Schoolsin the United Statesand CanadaThe Association of Theological Schools in the United States and Canada (ATS) is
recognized by the United States Department of Education and the Commission on
Recognition of Postsecondary Accreditation for the accreditation of graduate,
professional theological education. During the 1993-94 academic year, theAssociati'on's membership was comprised of 219 Protestant, Roman Catholic, and
Orthodox theological schools. During the 1994-95 academic year, its membership
included 226 theological schools that are representative of the broad spectrum of
denominational, ecclesiastical, and theological perspectives evident in North
America.
The purpose of the Association is the improvement of theological education. It
seeks to achieve this purpose through accreditation and program services for its
member schools. The Association began in 1918 as a conference of theological
schools that met biennially. In 1936, it became an association, adopted standards
for judging quality, and in 1938 established a list of accredited schools.
The Association provides numerous services to its members which are designed to
improve and enhance theological education. Some of these include grants and
fellowships for faculty scholarship and research, leadership development seminars
for presidents and trustees, data collection and information services on theological
education, a faculty grants resource center, publications, and numerous confer-
ences and seminars for theological school personnel.
The Fact Book on Theological Education has been published annually since 1969.
It provides statistical data on the ATS member schools in five areas: institutional
characteristics, enrollment, personnel compensation, finances, and development.
The Fact Book is compiled from annual reports submitted each year by the member
schools.
IntroductionHow to use this Fact Book
The Fact Book on Theological Education is published by The Association of
Theological Schools to provide data on its member institutions and information
that institutions can use for comparative analysis in relation to their peers. This
information can assist institutional efforts in planning and evaluation to assure
long-term viability and ongoing effectiveness.
The Fact Book is divided into five chapters that focus on areas considered to be
important for strategic planning and institutional evaluation. Depending on the
particular size, denominational family, and type of school, some areas are more
critical than others. It is important to study them in light of an institution's peer
group and past performance. Periodically, within the text, a set of questions is
offered to as the reader in his or her analysis of the data. Indicators within the
strategic areas include:
Institutional Characteristics
Ratio of Full-Time Faculty to Part-Time Faculty
Ratio of Fu :' -Time Equivalent (FTE) Students to FTE Faculty
Relation of Head Count (HC) to FTE Students
Ratio of Endowment to Current Fund Expenditures
Enrollment
Ratio of Applicants Accepted to Applicants Matriculated
Ratio of New Matriculated Students to Percent of Completions
Ratio of HC to FTE by Degree Program
Degree Program Enrollment in Relation to Mission Statement of Institution
Age by Gender and Degree
Diversity of Student Body in Relation to School's Mission
Personnel Compensation
Administrator Compensation Peer Analysis by Size, Denomination, and
Type of School
Introduction
iii
8
FACT BOOK 1993-94
Comparable Data
Faculty Compensation Peer Analysis by Rank in Relation to Size,
Denomination, and Type of School
Ratio of Salary in Relation to Housing and Other Benefits
Finances
Tuition by Degree Compared by Size, Denomination, and Region of School
Overall Revenue Structure
Overall ExpendituresProportional Spending
Excess (Deficit) of Current Fund Revenues over Current Fund Expenditures
Plant Operations and Maintenance Expenditures as a Percent of Total Current
Fund Expenditures
Scholarship Aid as a Percent of Tuition and Fees
Development
Sources of Giving by Categories in Relation to Denomination and School Type
Purposes of GiftsOperational and Capital by Denomination and School
Type
The tables and graphs are based on data supplied by the ATS member schools on
the 1993 ATS Annual Report Forms as required by the Association. Not all
information requested on the forms is reported in the Fact Book. Information is
reported as of the fall of 1993 on the following data: Enrollment (EF-1 through EF-
6), Admissions (A-1), Salaries (S-1), and Personnel (P-1). Information is reported
for the Fiscal Year 1992-93 on Development (D-1), Finance (F-1), Library (L-1),
and Completions (C-1). Both fall of 1993 and Fiscal Year 1992-93 data are reported
on the Institutional Characteristics (IC-1) form.
For further informztion on specific data, member school personnel may refer to the
ATS 1993 Annual Report Forms that provide definitions of categories. Where
possible, the forms from which data were retrieved are indicated for specific
chapters and tables.
The number of schools reporting enrollment data will always be at least three fewer
than the total number of member schools. One of these three is Toronto School of
Theology, the individual member schools of which report enrollment. The other
two (Berkeley and Bexley Hall), while they retain their corporate identity, are part
of larger institutions (Yale and Colgate Rochester, respectively) that report
enrollment.
Comparison of 1988-89 through 1993-94 editions of the Fact Book with those
editions published earlier should be done very carefully, if at all. Reporting on the
iv
ATS Annual Report Forms changed in 1988, and the data reflect these changes.
The number of member schools is not constant and some schools do not report all
data. Comparisons between Biennial Meeting years are potentially more accurate
because new members are not admitted between Biennial Meetings.
Because of variations in the calculation of Full-Time Equivalent enrollment (FTE)
since 1988, this edition of the Fact Book has recalculated FTE from prior years for
accuracy of comparison with the current data. These changes make comparisons
of FTE data in this Fact Book to earlier editions inaccurate.
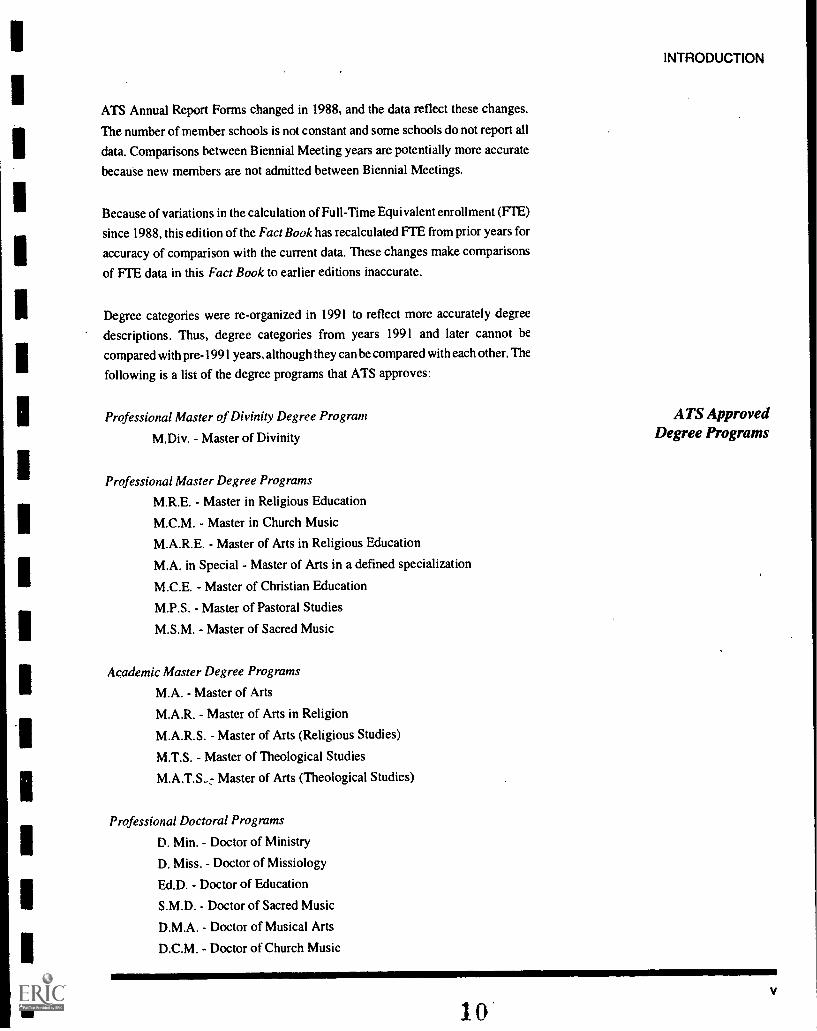
Degree categories were re-organized in 1991 to reflect more accurately degree
descriptions. Thus, degree categories from years 1991 and later cannot becompared with pre-1991 years, although they can be compared with each other. The
following is a list of the degree programs that ATS approves:
Professional Master of Divinity Degree Program
M.Di v. - Master of Divinity
Professional Master Degree Programs
M.R.E. - Master in Religious Education
M.C.M. Master in Church Music
M.A.R.E. - Master of Arts in Religious Education
M.A. in Special - Master of Arts in a defined specialization
M.C.E. - Master of Christian Education
M.P.S. - Master of Pastoral Studies
M.S.M. Master of Sacred Music
Academic Master Degree Programs
M.A. Master of Arts
M.A.R. Master of Arts in Religion
M.A.R.S. - Master of Arts (Religious Studies)
M.T.S. Master of Theological Studies
M.A.T.S-: Master of Arts (Theological Studies)
Professional Doctoral Programs
D. Min. - Doctor of Ministry
D. Miss. - Doctor of Missiology
Ed.D. - Doctor of Education
S.M.D. - Doctor of Sacred Music
D.M.A. - Doctor of Musical Arts
D.C.M. - Doctor of Church Music
INTRODUCTION
ATS ApprovedDegree Programs
V
1.0
FACT BOOK 1993-94
Full-Time Equivalency(FTE)
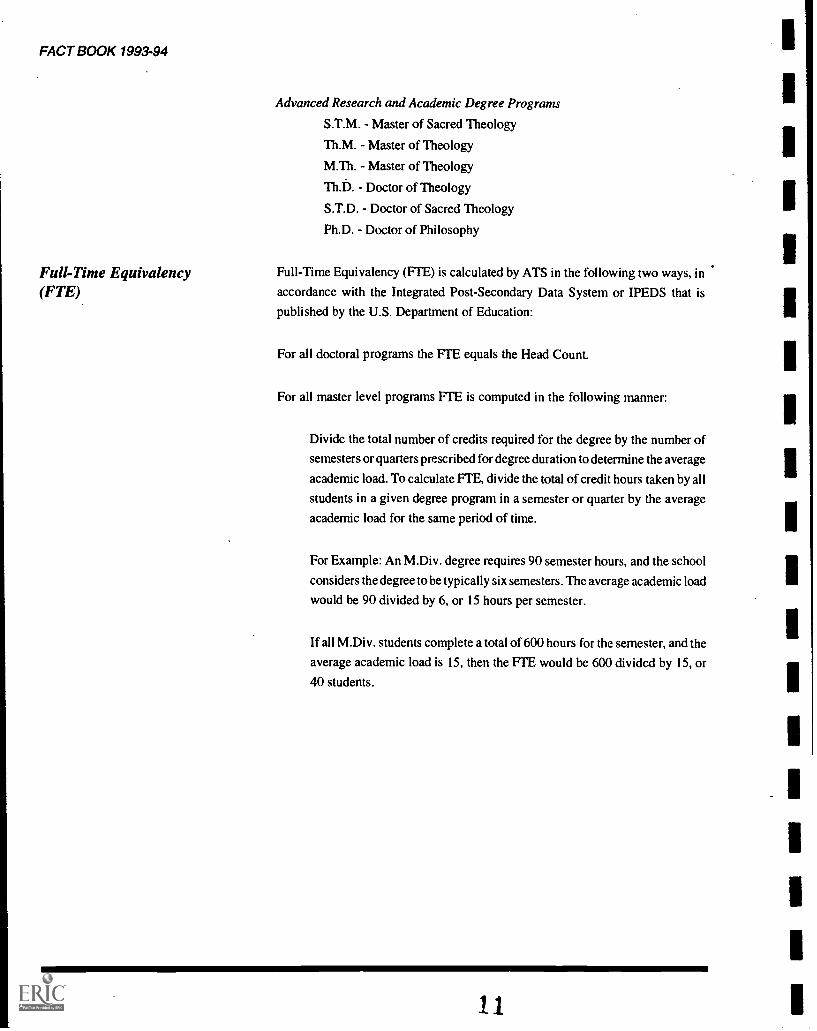
Advanced Research and Academic Degree Programs
S.T.M. - Master of Sacred Theology
Th.M. - Master of Theology
M.Th. - Master of Theology
Th.D. - Doctor of Theology
S.T.D. Doctor of Sacred Theology
Ph.D. - Doctor of Philosophy
Full-Time Equivalency (FTE) is calculated by ATS in the following two ways, in
accordance with the Integrated Post-Secondary Data System or IPEDS that is
published by the U.S. Department of Education:
For all doctoral programs the I-. I h, equals the Head Count.
For all master level programs FTE is computed in the following manner:
Divide the total number of credits required for the degree by the number of
semesters or quarters prescribed for degree duration to determine the average
academic load. To calculate FTE, divide the total of credit hours taken by all
students in a given degree program in a semester or quarter by the average
academic load for the same period of time.
For Example: An M.Div. degree requires 90 semester hours, and the school
considers the degree to be typically six semesters. The average academic load
would be 90 divided by 6, or 15 hours per semester.
If all M.Div. students complete a total of 600 hours for the semester, and the
average academic load is 15, then the FTE would be 600 divided by 15, or
40 students.
vi
INTRODUCTION
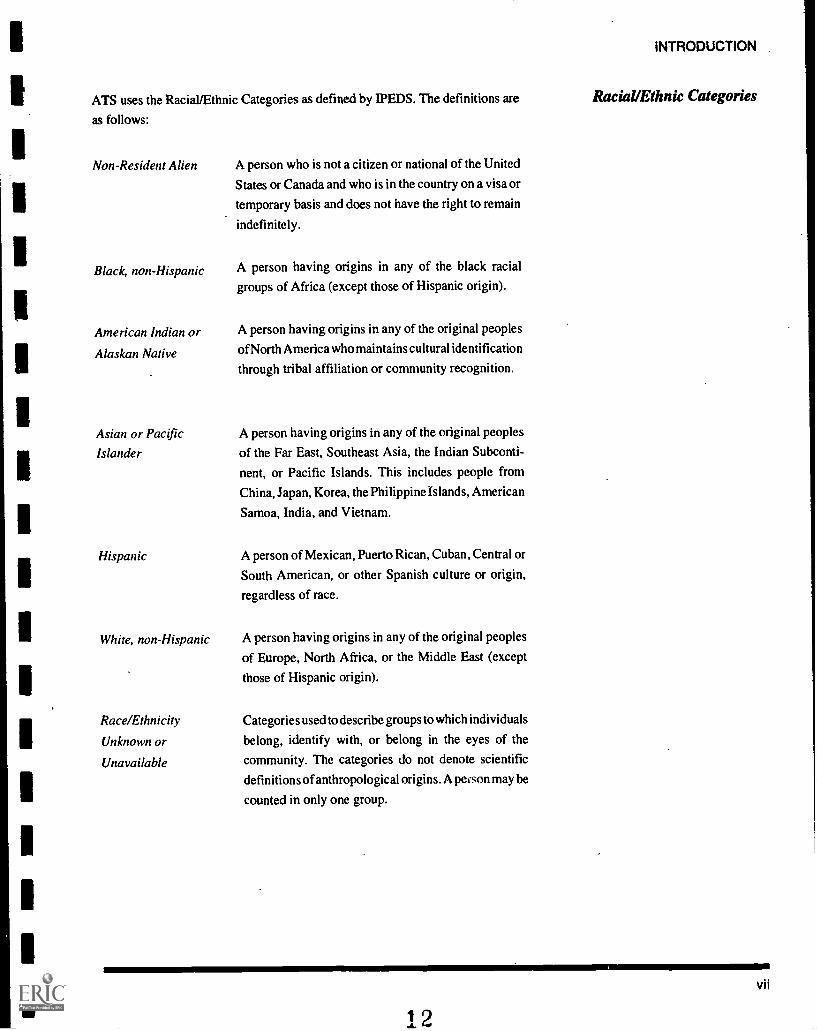
ATS uses the Racial/Ethnic Categories as defined by WEDS. The definitions are Racial/Ethnic Categories
as follows:
Non-Resident Alien A person who is not a citizen or national of the United
States or Canada and who is in the country on a visa or
temporary basis and does not have the right to remain
indefinitely.
Black, non-Hispanic
American Indian or
Alaskan Native
A person having origins in any of the black racialgroups of Africa (except those of Hispanic origin).
A person having origins in any of the original peoples
of North America who maintains cultural identification
through tribal affiliation or community recognition.
Asian or Pacific A person having origins in any of the original peoples
Islander of the Far East, Southeast Asia, the Indian Subconti-
nent, or Pacific Islands. This includes people from
China, Japan, Korea, the Philippine Islands, American
Samoa, India, and Vietnam.
Hispanic
White, non-Hispanic
Race/Ethnicity
Unknown or
Unavailable
A person of Mexican, Puerto Rican, Cuban, Central or
South American, or other Spanish culture or origin,
regardless of race.
A person having origins in any of the original peoples
of Europe, North Africa, or the Middle East (except
those of Hispanic origin).
Categories used to describe groups to which individuals
belong, identify with, or belong in the eyes of thecommunity. The categories do not denote scientific
definitions of anthropological origins. A person may be
counted in only one group.
vii
12
FACT BOOK 1993-94
ATS Denomination Codes ADCHCH
ADVSVD
AFRMEP
AFRMEZ
AMBCUS
ANGCHC
AREFPC
ASGSPC
ASYGOD
BPCVOQ
BPGNCF
Er'MSAA
BPUNWC
BRCHAO
BRCHCH
CBPFEL
CCHCHC
CCONCC
CFMENI
CGODAI
CGODCT
CGODGC
CGODIC
CHBRET
CHCHDC
CHMEEP
CHMSAL
CHPBRE
CHREFC
CHRNAZ
CHUCHR
CMPRCH
CNBPAA
EPISCH
EVCGCH
EVCHCA
EVCVCH
EVFORM
EVFRCA
EVFRCC
Advent Christian Church
Seventh-day Adventist
African Methodist Episcopal
African Methodist Episcopal Zion
American Baptist Churches in the USA*
Anglican Church of Canada
Associate Reformed Presbyterian Church
Associated Gospel Churches of Canada
Assemblies of God
Baptist Convention of Ontario and Quebec
Baptist General Conference
Baptist Missionary Association of America
Baptist Union of Western Canada
Brethren Church (Ashland, Ohio)
Brethren in Christ Church
Cooperative Baptist Fellowship
Christian Churches and Churches of Christ
Conference of Congregational Christian Churches
Conference of Mennonites
Church of God (Anderson, Indiana)
Church of God (Cleveland, Tennessee)
Churches of God, General Conference
Church of God in Christ
Church of the Brethren
Christian Church (Disciples of Christ)
Christian Methodist Episcopal
Christian and Missionary Alliance
Christian Brethren (Plymouth Brethren)
Christian Reformed Church
Church of the Nazarene
Churches of Christ
Cumberland Presbyterian Church
Conservative Baptist Association of America
Episcopal Church
Evangelical Congregational Church
Evangelical Church in Canada
Evangelical Covenant Church
Evangelical Formosan Church
Evangelical Free Church of America
Evangelical Free Church of Canada
viii13
1
1
1
EVLCAM Evangelical Lutheran Church in America*
EVLUCA Evangelical Lutheran Church in Canada
EVLUCH Evangelical Lutheran Church
EVPRCH Evangelical Presbyterian Church
FEVBCBC Fellowship of Evangelical Baptist Churches in Canada
FRMECH Free Methodist Church
FRRELS Friends, Religious Society oty
FSQGCH Foursquare Gospel Church
GBSCNC General Baptist State Convention, N.C.
GCNJER New Jerusalem, General Church of
GCSWED Swedenborgian Church, General Convention
GNCFMC General Conference Mennonite Church
GROXNS Greek Orthodox Archdiocese in N./S. America
INDBAP Independent Baptist
INMECH Independent Methodist
INTERDEN Interdenominational
JEWISH Jewish
LUCHCA Lutheran Church-Canada
LUCHMS The Lutheran Church-Missouri Synod
MBRCNA Mennonite Brethren Church in N.A.
MENCHU Mennonite Church
MENOTH Mennonite, Other
MISSCC Missionary Church in Canada
MNCHCA Mennonite Church (Canada)
MORCHA Moravian Church in America
MUSLIM Muslim
NA Not Available
NABPCF North American Baptist Conference
NDENOM Nondenominational
NTLBCV National Baptist Convention
OTHER Other
OXCHAM Orthodox Church in America
OXOTHR Orthodox, Other
OXPRES Orthodox Presbyterian
PENTAC Pentecostal Assemblies of Canada
PRCHAM Presbyterian Church in America
PRCHCA Presbyterian Church in Canada
PRCHUS Presbyterian Church (U.S.A.)*
RCOTH Roman Catholic, Other
RCTHCN Roman Catholic, Canada
INTRODUCTION
1 14ix
FACT BOOK 1993-94
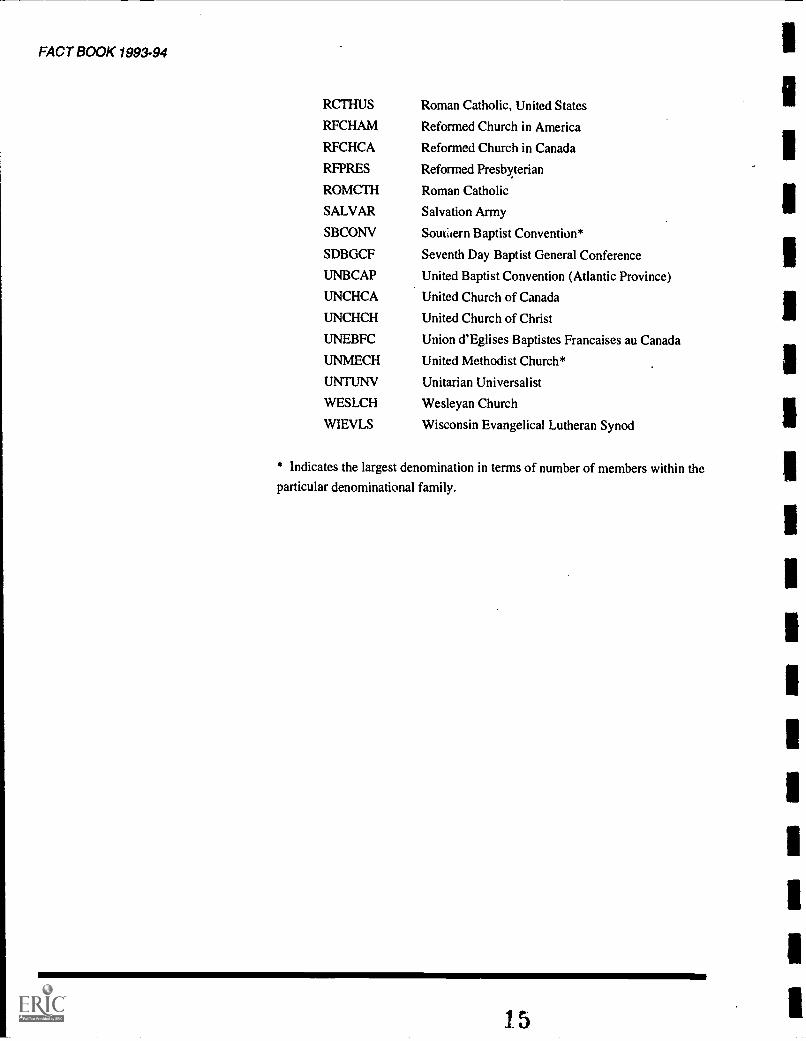
RCTHUS Roman Catholic, United States
RFCHAM Reformed Church in America
RFCHCA Reformed Church in Canada
RFPRES Reformed Presbyterian
ROMCTH Roman Catholic
SALVAR Salvation Army
SBCONV Souttern Baptist Convention*
SDBGCF Seventh Day Baptist General Conference
UNBCAP United Baptist Convention (Atlantic Province)
UNCHCA United Church of Canada
UNCHCH United Church of Christ
UNEBFC Union d'Eglises Baptistes Francaises au Canada
UNMECH United Methodist Church*
UNTUNV Unitarian Universalist
WESLCH Wesleyan Church
WIEVLS Wisconsin Evangelical Lutheran Synod
* Indicates the largest denomination in terms of number of members within the
particular denominational family.
x
15
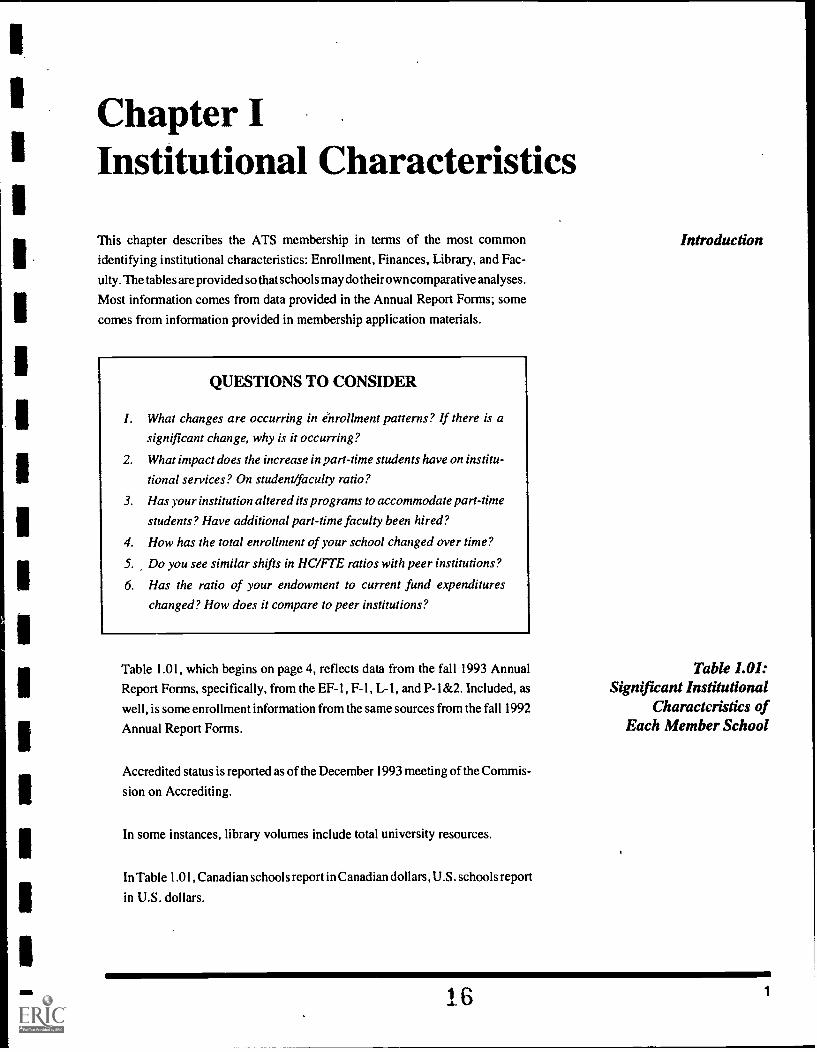
Chapter IInstitutional Characteristics
This chapter describes the ATS membership in terms of the most commonidentifying institutional characteristics: Enrollment, Finances, Library, and Fac-
ulty. The tables are provided so that schools may do their own comparative analyses.
Most information comes from data provided in the Annual Report Forms; some
comes from information provided in membership application materials.
QUESTIONS TO CONSIDER
I. What changes are occurring in enrollment patterns? If there is a
significant change, why is it occurring?
2. What impact does the increase in part-time students have on institu-
tional services? On student/faculty ratio?
3. Has your institution altered its programs to accommodate part-time
students? Have additional part-time faculty been hired?
4. How has the total enrollment of your school changed over time?
5. Do you see similar shifts in HC/FTE ratios with peer institutions?
6. Has the ratio of your endowment to current fund expenditureschanged? How does it compare to peer institutions?
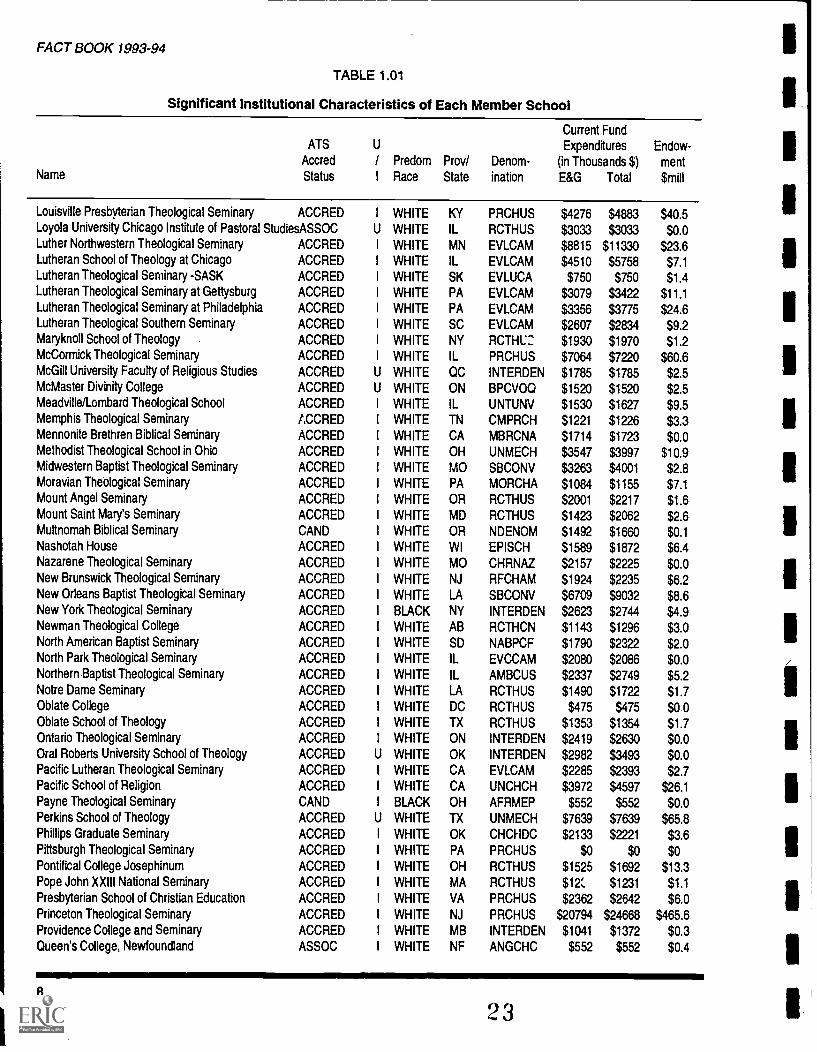
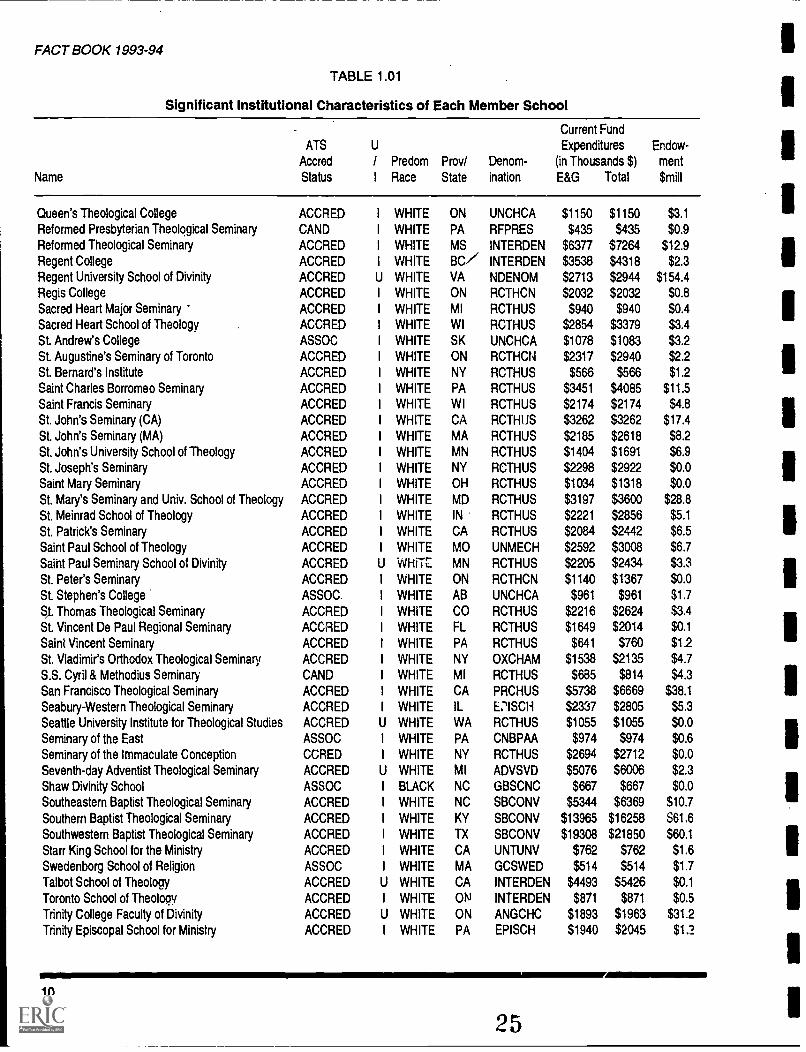
Table 1.01, which begins on page 4, reflects data from the fall 1993 Annual
Report Forms, specifically, from the EF-1, F-1, L-1, and P-1&2. Included, as
well, is some enrollment information from the same sources from the fall 1992
Annual Report Forms.
Accredited status is reported as of the December 1993 meeting of the Commis-
sion on Accrediting.
In some instances, library volumes include total university resources.
In Table 1.01, Canadian schools report in Canadian dollars, U.S. schools report
in U.S. dollars.
Introduction
Table 1.01:Significant Institutional
Characteristics ofEach Member School
16 1
FACT BOOK 1993-94
Definitions of Headings inTable 1.01
Current Fund data is taken from theATS Annual Report Form, Finance(F-I), Part B.
Canadian Schools report in CanadianDollars, U.S. Schools report in U.S.Dollars.
ATS Accreditation Status There are three classes of membership in theAssociation: Accredited, Candidate for Accredited Membership, and Associate
Member. Criteria for membership are listed in: ATS Constitution and DuesStructure, Bulletin 41, Part 1, and ATS Procedures, Standards, and Criteria for
Membership, Bulletin 41, Part 3. Status is reported as of the December 1993
meeting of the Commission on Accrediting.
U/I University/College Affiliated or Independent/Freestanding. The classifica-
tion of "University Affiliated" is restricted to schools of theology that are an integral
part of a larger institution that possesses at least two other professional schools or
departments at the graduate level. This is a category that has been used for many
years to indicate the broader level of resources available to those theological
schools.
Predominant Race Reflects the predominant racial/ethnic category of enrolled
students at the institution. For definitions of categories, see the Introduction to the
Fact Book.
Province/State Indicates geographical location, using U.S. Postal Code abbre-
viations.
Denomination Denomination is that listed by a school when it applies for
membership. A list of denominational codes is found in the Introduction. When
more than one denomination is indicated, the main denomination is listed or, in the
case of multiple listings, the identification is indicated as interdenominational.
Current Fund Expenditures
E & G Total Educational and General Expenditures and Transfers. This
includes Instruction & Net Academic Support, Research, Public Service,
Library, Student Services, Admissions, Institutional Support, Operation and
Maintenance of Plant, Mandatory Transfers and Debt Repayments, and
Scholarships and Fellowships.
Total Total Current Fund Expenditures and Transfers includes E & G plus
Auxiliary/Ancillary Enterprises.
Endowment The market value of endowment assets at the end of the fiscal year.
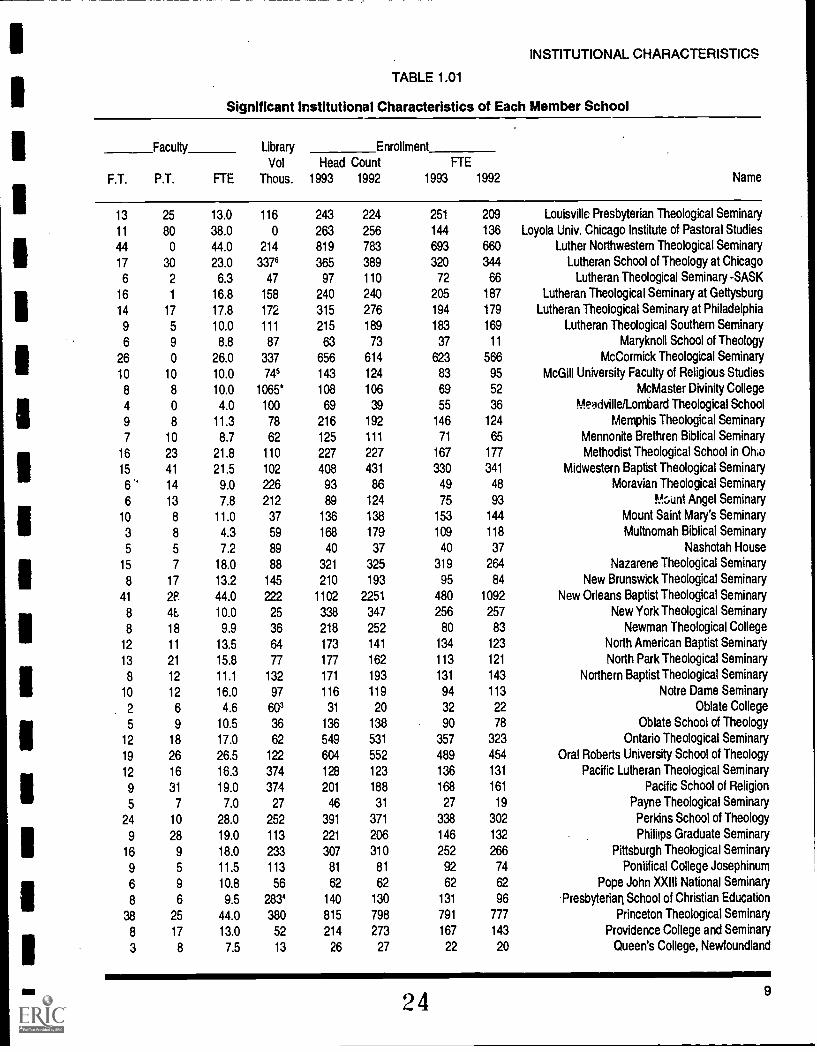
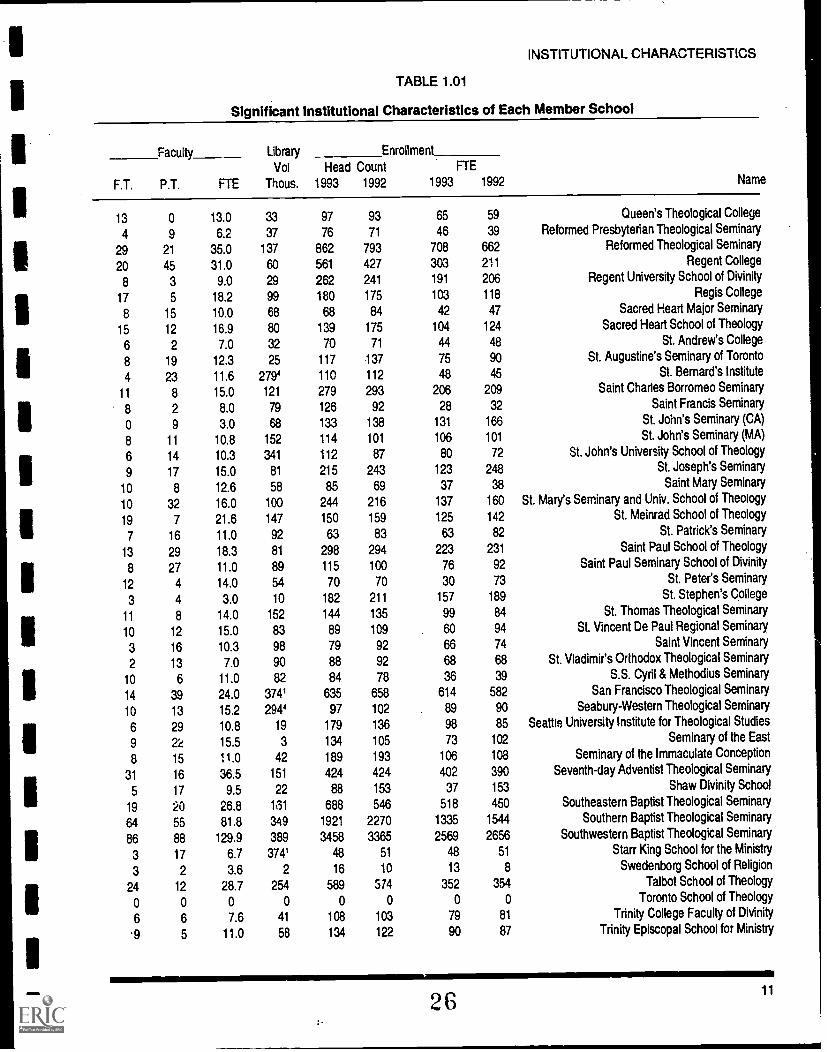
Full-Time and Part-Time Faculty These are listed as reported by the school
on the ATS Annual Report Forms P-1&2 (Part-Time Faculty). Full-Time Faculty
are those receiving a full-time salary at an ATS member school and who teach more
than 50% of the time. Part-Time Faculty are ( 1) those teaching on a part-time basis
2
INSTITUTIONAL CHARACTERISTICS
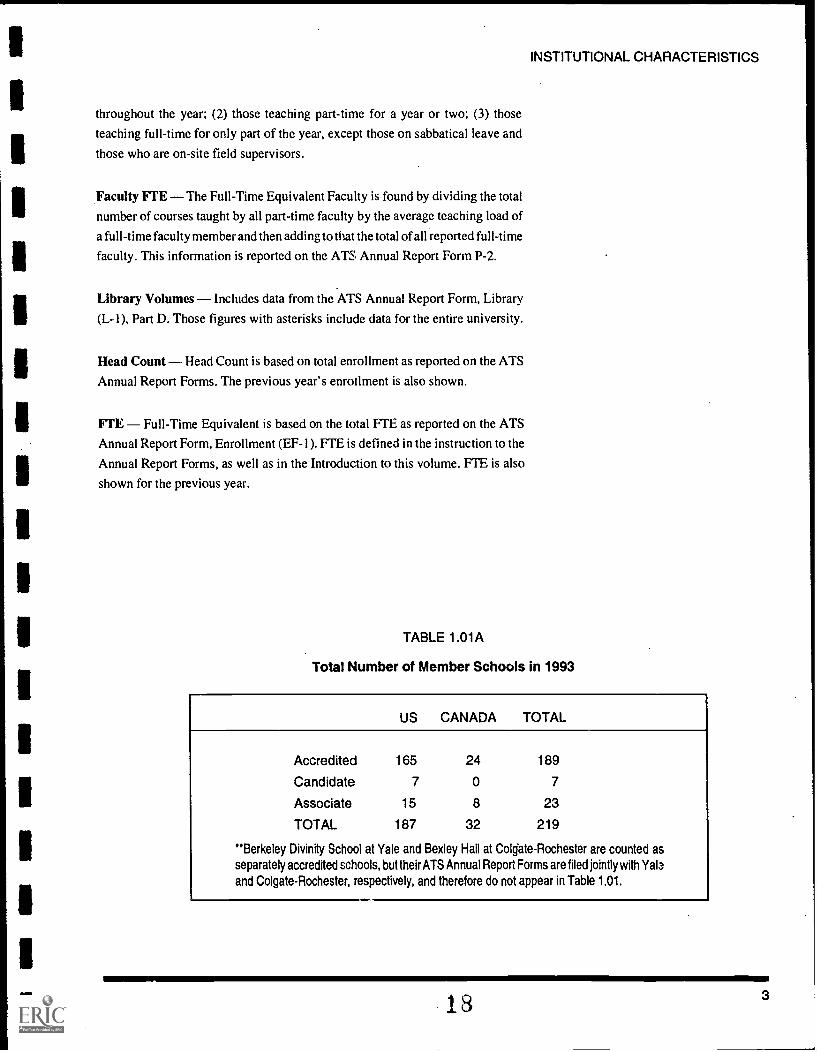
throughout the year; (2) those teaching part-time for a year or two; (3) those
teaching full-time for only part of the year, except those on sabbatical leave and
those who are on-site field supervisors.
Faculty FTE The Full-Time Equivalent Faculty is found by dividing the total
number of courses taught by all part-time faculty by the average teaching load of
a full-time faculty member and then adding to that the total of all reported full-time
faculty. This information is reported on the ATS Annual Report Form P-2.
Library Volumes Includes data from the ATS Annual Report Form, Library
(L-1), Part D. Those figures with asterisks include data for the entire university.
Head Count Head Count is based on total enrollment as reported on the ATS
Annual Report Forms. The previous year's enrollment is also shown.
FTE Full-Time Equivalent is based on the total 1- ib as reported on the ATS
Annual Report Form, Enrollment (EF-1). HE is defined in the instruction to the
Annual Report Forms, as well as in the Introduction to this volume. Fib is also
shown for the previous year.
TABLE 1.01A
Total Number of Member Schools in 1993
US CANADA TOTAL
Accredited 165 24 189
Candidate 7 0 7
Associate 15 8 23
TOTAL 187 32 219
"Berkeley Divinity School at Yale and Bexley Hall at Colgate- Rochester are counted asseparately accredited schools, but their ATS Annual Report Forms are filed jointly with Yal3
and Colgate-Rochester, respectively, and therefore do not appear in Table 1.01.
18 3
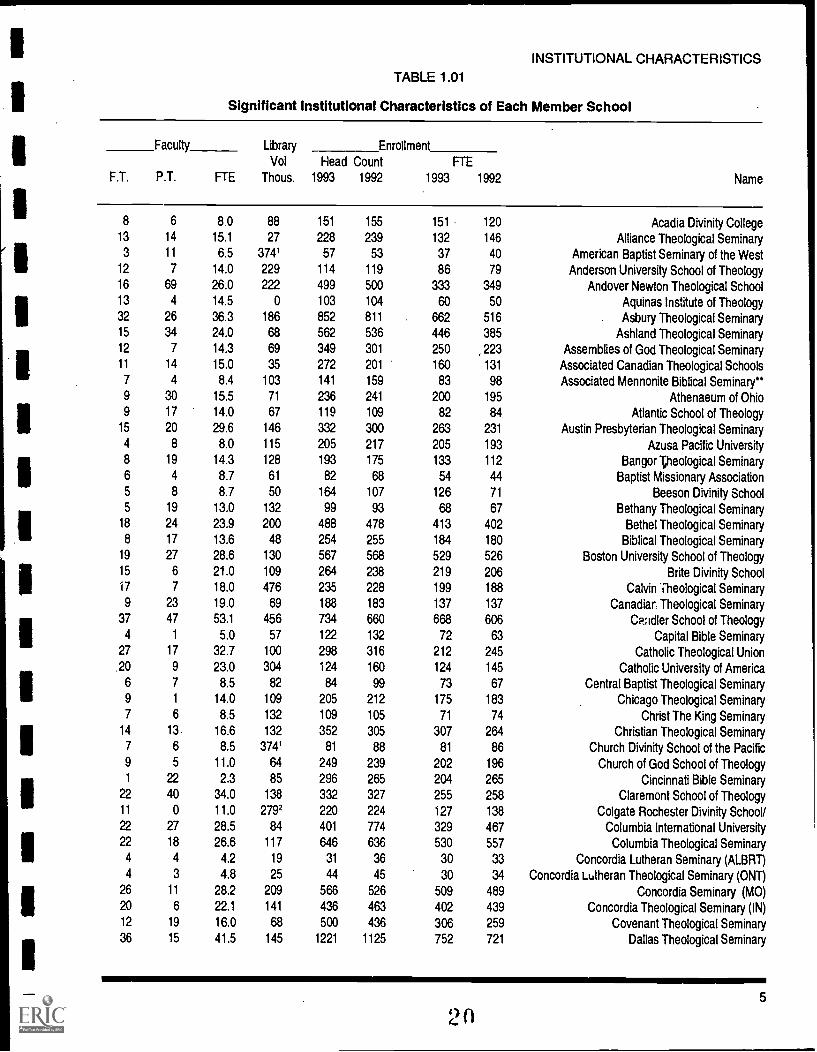
FACT BOOK 1993-94
TABLE 1.01
Significant Institutional Characteristics of Each Member School
Name
ATS
Accred
Status
U
/I
Predom
Race
Prov/
State
Denom-
ination
Current Fund
Expenditures
(in Thousands $)
E&G Total
Endow-
ment
$mill
Acadia Divinity College ACCRED I WHITE NS BPCVOQ $1884 $1884 $2.3
Alliance Theological Seminary ACCRED I WHITE NY CHMSAL $2114 $2244 $1.1
American Baptist Seminary of the West ACCRED I WHITE CA AMBCUS $1275 $1424 $4.3
Anderson University School of Theology ACCRED I WHITE IN CGODAI $1203 $1203 $0.0
Andover Newton Theological School ACCRED I WHITE MA AMBCUS $6373 $6727 $16.2
Aquinas Institute of Theology ACCRED I WHITE MO RCTHUS $1035 $1035 $0.6
Asbury Theological Seminary ACCRED i WHITE KY INTERDEN $8222 $9129 $66.3
Ashland Theological Seminary ACCRED U WHITE OH BRCHAO $2462 $2543 $3.1
Assemblies of God Theological Seminary ACCRED I WHITE MO ASYGOD $2042 $2113 $0.0
Associated Canadian Theological Schools ASSOC I WHITE BC EVFRCC $760 $804 $0.0
Associated Mennonite Biblical Seminary ACCRED I WHITE IN MENCHU $2317 $2451 $4.4
Athenaeum of Ohio ACCRED I WHITE OH RCTHUS $2245 $2489 $5.5
Atlantic School of Theology ACCRED I WHITE NS INTERDEN $1665 $1908 $0.3
Austin Presbyterian Theological Seminary ACCRED I WHITE TX PRCHUS $3927 $4310 $59.5
Azusa Pacific University ACCRED U WHITE CA INTERDEN $1243 $1243 $0.2
Bangor Theological Seminary ACCRED I WHITE ME UNCHCH $2257 $2294 $5.3
Baptist Missionary Association ASSOC I WHITE TX BPMSAA $569 $638 $0.4
Beeson Divinity School ASSOC U WHITE AL SBCONV $2124 $2124 $0.0
Bethany Theological Seminary ACCRED I WHITE IN CHBRET $1832 $1989 $4.6
Bethel Theological Seminary ACCRED I WHITE MN BPGNCF $3722 $4103 $0.0
Biblical Theological Seminary ASSOC I WHITE PA NDENOM $1454 $1552 $0.4
Boston University School of Theology ACCRED U WHITE MA UNMECH $4027 $4027 $24.7
Brite Divinity School ACCRED U WHITE TX CHCHDC $3327 $3466 $31.4
Calvin Theological Seminary ACCRED I WHITE MI CHREFC $2702 $2873 $2.8
Canadian Theological Seminary ACCRED I WHITE Sic CHMSAL $1205 $1407 $0.1
Candler School of Theology ACCRED U WHITE GA UNMECH $10523 $10830 $0.0
Capital Bible Seminary ASSOC I WHITE MD NDENOM $581 $766 $0.0
Catholic Theological Union ACCRED I WHITE IL RCTHUS $3049 $4013 $1.7
Catholic University of America ACCRED U WHITE DC RCTHUS $2160 $2382 $60.8
Central Baptist Theological Seminary ACCRED I WHITE KS AMBCUS $1470 $1582 $3.7
Chicago Theological Seminary ACCRED I WHITE IL UNCHCH $2347 $2592 $7.9
Christ The King Seminary ACCRED I WHITE NY RCTHUS $1355 $1561 $1.3
Christian Theological Seminary ACCRED I WHITE IN CHCHDC $4744 $5197 $50.8
Church Divinity School of the Pacific ACCRED I WHITE CA EPISCH $2671 $2929 $8.2
Church of God School of Theology ACCRED I WHITE TN CGODCT $1981 $1981 $1.5
Cincinnati Bible Seminary ASSOC I WHITE OH CCHCHC $1056 $1158 $0.0
Claremont School of Theology ACCRED I WHITE CA UNMECH $4785 $4988 $11.7
Colgate Rochester Divinity School/ ACCRED I WHITE NY AMBCUS $4072 $4514 $31.8
Columbia International University ACCRED I WHITE SC NDENOM $3481 $3951 $1.3
Columbia Theological Seminary ACCRED I WHITE GA PRCHUS $5621 $6387 $53.8
Concordia Lutheran Seminary (ALBRT) ASSOC I WHITE AB LUCHCA $637 $654 $0.0
Concordia Lutheran Theological Seminary (ONT) ASSOC I WHITE ON LUCHCA $768 $783 $0.0
Concordia Seminary (MO) ACCRED I WHITE MO LUCHMS $7417 $9221 $12.0
Concordia Theological Seminary (IN) ACCRED I WHITE IN LUCHMS $6653 $7841 $3.8
Covenant Theological Seminary ACCRED I WHITE MO PRCHAM $3200 $3393 $6.6
Dallas Theological Seminary CAND I WHITE TX NDENOM $10050 $11723 $1.5
4
13
1
1
1
INSTITUTIONAL CHARACTERISTICSTABLE 1.01
Significant institutional Characteristics of Each Member School
Faculty Library
Vol
Thous.
Enrollment
NameF.T. P.T. FTE
Head Count FTE
1993 1992 1993 1992
8 6 8.0 88 151 155 151 120 Acadia Divinity College13 14 15.1 27 228 239 132 146 Alliance Theological Seminary3 11 6.5 374' 57 53 37 40 American Baptist Seminary of the West
12 7 14.0 229 114 119 86 79 Anderson University School of Theology16 69 26.0 222 499 500 333 349 Andover Newton Theological School13 4 14.5 0 103 104 60 50 Aquinas Institute of Theology32 26 36.3 186 852 811 662 516 . Asbury Theological Seminary15 34 24.0 68 562 536 446 385 Ashland Theological Seminary12 7 14.3 69 349 301 250 223 Assemblies of God Theological Seminary11 14 15.0 35 272 201 160 131 Associated Canadian Theological Schools
37 47 53.1 456 734 660 668 606 Ca.;idler School of Theology4 1 5.0 57 122 132 72 63 Capital Bible Seminary
27 17 32.7 100 298 316 212 245 Catholic Theological Union20 9 23.0 304 124 160 124 145 Catholic University of America6 7 8.5 82 84 99 73 67 Central Baptist Theological Seminary9 1 14.0 109 205 212 175 183 Chicago Theological Seminary7 6 8.5 132 109 105 71 74 Christ The King Seminary
14 13 . 16.6 132 352 305 307 264 Christian Theological Seminary7 6 8.5 374' 81 88 81 86 Church Divinity School of the Pacific9 5 11.0 64 249 239 202 196 Church of God School of Theology1 22 2.3 85 296 265 204 265 Cincinnati Bible Seminary
22 40 34.0 138 332 327 255 258 Claremont School of Theology11 0 11.0 2792 220 224 127 138 Colgate Rochester Divinity School/22 27 28.5 84 401 774 329 467 Columbia International University22 18 26.6 117 646 636 530 557 Columbia Theological Seminary
Significant Institutional Characteristics of Each Member School
Name
ATS
Accred
Status
U
/I
Predom
Race
Prov/
State
Denom-
ination
Current Fund
Expenditures
(in Thousands $)
E&G Total
Endow-
ment
$mill
De Sales School of Theology ACCRED I WHITE DC RCTHUS $357 $357 $0.1
Denver Conservative Baptist Seminary ACCRED I WHITE . CO CNBPAA $3758 $4248 $3.7Dominican House of Studies ACCRED I WHITE DC RCTHUS $678 $1001 $2.6Dominican School of Philosophy and Theology ACCRED I WHITE CA RCTHUS $939 $939 $0.6Dominican Study Center of Bayamon Central Univ. ASSOC U HISPN PR RCTHUS $143 $143 $0.0Drew University Theological School ACCRED U WHITE NJ UNMECH $6217 $7406 $24.2
Duke University Divinity School ACCRED U WHITE NC UNMECH $7322 $7322 $0.0
Eariham School of Religion ACCRED I WHITE IN FRRELS $1144 $1262 $12.3
Eastern Baptist Theological Seminary ACCRED I WHITE PA AMBCUS $3175 $3293 $6.6
Eastern Mennonite Seminary ACCRED I WHITE VA MENCHU $1284 $1308 $0.7
Eden Theological Seminary ACCRED I WHITE MO UNCHCH $3749 $3956 8.1
Edmonton Baptist Seminary ASSOC I WHITE AB NABPCF $472 $565 $0.2
Emmanuel College of Victoria University ACCRED I WHITE ON UNCHCA $2768 $3042 $9.4
Emmanuel School of Religion ACCRED I WHITE TN CCHCHC $1655 $1738 $4.7
Episcopal Divinity School ACCRED I WHITE MA EPISCH $3781 $4095 $25.7
Episcopal Theological Seminary of the Southwest ACCRED I WHITE TX EPISCH $2070 $2339 $15.6
Erskine Theological Seminary ACCRED I WHITE SC AREFPC $916 $924 $1.8
Evangelical School of Theology ACCRED I WHITE PA EVCGCH $1110 $1110 $1.9
Evangelical Seminary of Puerto Rico ACCRED I HISPN PR INTERDEN $932 $948 $0.8
Franciscan School of Theology ACCRED I WHITE CA RCTHUS $992 $1051 $0.0
Fuller Theological Seminary ACCRED I WHITE CA INTERDEN $19964 $22214 $29.9
Garrett-Evangelical Theological Seminary ACCRED I WHITE IL UNMECH $5501 $6372 $17.9
(The) General Theological Seminary ACCRED I WHITE NY EPISCH $4007 $5066 $34.9
Golden Gate Baptist Theological Seminary ACCRED I WHITE CA SBCONV $4344 $5248 $4.8
Gordon-Conweli Theological Seminary ACCRED I WHITE MA NA $7719 $8887 $18.1
Graduate Theological Union ACCRED I WHITE CA INTERDEN $2358 $3398 $8.7
Harding Graduate School of Religion ASSOC I WHITE TN CHUCHR $1501 $1876 $0.0
Hartford Seminary ACCRED I WHITE CT INTERDEN $3294 $3503 $24.2
Harvard University Divinity School ACCRED U WHITE MA INTERDEN $12730 $12823 $114.2
Holy Cross Greek Orthodox School of Theology ACCRED I WHITE MA GROXNS $3868 $4688 $7.8
Hood Theological Seminary ASSOC I BLACK NC AFRMEZ $422 $422 $0.0
Houston Graduate School of Theology ASSOC I WHITE TX FRRELS $653 $680 $0.2
Howard University School of Divinity ACCRED U BLACK DC NDENOM $2812 $2812 $1.9
Huron College Faculty of Theology ACCRED I WHITE ON ANGCHC $841 $841 $4.0
Iliff School of Theology ACCRED I WHITE CO UNMECH $5017 $5269 $22.2
Immaculate Conception Seminary ACCRED U WHITE NJ RCTHUS $2893 $3065 $0.0
Interdenominational Theological Center ACCRED I BLACK GA INTERDEN $6105 $6176 $7.6
International School of Theology CAND I WHITE CA NDENOM $1380 $1497 $1.5
Jesuit School of Theology at Berkeley ACCRED I WHITE CA RCTHUS $2542 $2640 $0.0
Joint Board of Theological Colleges ACCRED I WHITE QC INTERDEN $0.0 $0.0 $0.0
Kenrick-Glennon Seminary ACCRED I WHITE MO RCTHUS $2088 $2292 $0.0
Knox College ACCRED I WHITE ON PRCHCA $1696 $2703 $4.0
Lancaster Theological Seminary ACCRED I WHITE PA UNCHCH $2623 $2673 $6.2
Lexington Theological Seminary ACCRED I WHITE KY CHCHDC $2610 $2829 $15.4
Liberty Baptist Theological Seminary ASSOC U WHITE VA INDBAP $0 $0 $0
Lincoln Christian Seminary ACCRED I WHITE IL CCHCHC $758 $940 $0.0
6 21
1
1
1
1
INSTITUTIONAL CHARACTERISTICS
TABLE 1.01
Significant Institutional Characteristics of Each Member School
Faculty LibraryVol
Thous.
Enrollment
NameF.T. P.T. FTE
Head Count FTE
1993 1992 1993 1992
7 7 9.0 603 45 47 28 26 De Sales School of Theology
6 5 7.7 97 230 213 118 106 Lincoln Christian Seminary
.227
FACT BOOK 1993-94
TABLE 1.01
Significant Institutional Characteristics of Each Member School
Name
ATS U
Accred
Status I
Predom
Race
Prov/
State
Denom-
ination
Current Fund
Expenditures(in Thousands $)
E&G Total
Endow-
ment$mill
Louisville Presbyterian Theological Seminary ACCRED WHITE KY PRCHUS $4276 $4883 $40.5Loyola University Chicago Institute of Pastoral StudiesASSOC WHITE IL RCTHUS $3033 $3033 $0.0Luther Northwestern Theological Seminary ACCRED WHITE MN EVLCAM $8815 $11330 $23.6Lutheran School of Theology at Chicago ACCRED WHITE IL EVLCAM $4510 $5758 $7.1Lutheran Theological Seminary -SASK ACCRED WHITE SK EVLUCA $750 $750 $1.4Lutheran Theological Seminary at Gettysburg ACCRED WHITE PA EVLCAM $3079 $3422 $11.1Lutheran Theological Seminary at Philadelphia ACCRED WHITE PA EVLCAM $3356 $3775 $24.6Lutheran Theological Southern Seminary ACCRED WHITE SC EVLCAM $2607 $2834 $9.2Maryknoll School of Theology ACCRED WHITE NY RCTFIL:2 $1930 $1970 $1.2McCormick Theological Seminary ACCRED WHITE IL PRCHUS $7064 $7220 $60.6McGill University Faculty of Religious Studies ACCRED WHITE QC INTERDEN $1785 $1785 $2.5McMaster Divinity College ACCRED WHITE ON BPCVOQ $1520 $1520 $2.5Meadville/Lombard Theological School ACCRED WHITE IL UNTUNV $1530 $1627 $9.5Memphis Theological Seminary t,CCRED WHITE TN CMPRCH $1221 $1226 $3.3Mennonite Brethren Biblical Seminary ACCRED WHITE CA MBRCNA $1714 $1723 $0.0Methodist Theological School in Ohio ACCRED WHITE OH UNMECH $3547 $3997 $10.9Midwestern Baptist Theological Seminary ACCRED WHITE MO SBCONV $3263 $4001 $2.8Moravian Theological Seminary ACCRED WHITE PA MORCHA $1084 $1155 $7.1Mount Angel Seminary ACCRED WHITE OR RCTHUS $2001 $2217 $1.6Mount Saint Mary's Seminary ACCRED WHITE MD RCTHUS $1423 $2062 $2.6Multnomah Biblical Seminary CAND WHITE OR NDENOM $1492 $1660 $0.1Nashotah House ACCRED WHITE WI EPISCH $1589 $1872 $6.4Nazarene Theological Seminary ACCRED WHITE MO CHRNAZ $2157 $2225 $0.0New Brunswick Theological Seminary ACCRED WHITE NJ RFCHAM $1924 $2235 $6.2New Orleans Baptist Theological Seminary ACCRED WHITE LA SBCONV $6709 $9032 $8.6New York Theological Seminary ACCRED BLACK NY INTERDEN $2623 $2744 $4.9Newman Theological College ACCRED WHITE AB RCTHCN $1143 $1296 $3.0North American Baptist Seminary ACCRED WHITE SD NABPCF $1790 $2322 $2.0North Park Theological Seminary ACCRED WHITE IL EVCCAM $2080 $2086 $0.0Northern Baptist Theological Seminary ACCRED WHITE IL AMBCUS $2337 $2749 $5.2Notre Dame Seminary ACCRED WHITE LA RCTHUS $1490 $1722 $1.7Oblate College ACCRED WHITE DC RCTHUS $475 $475 $0.0Oblate School of Theology ACCRED WHITE TX RCTHUS $1353 $1354 $1.7Ontario Theological Seminary ACCRED WHITE ON INTERDEN $2419 $2630 $0.0Oral Roberts University School of Theology ACCRED WHITE OK INTERDEN $2982 $3493 $0.0Pacific Lutheran Theological Seminary ACCRED WHITE CA EVLCAM $2285 $2393 $2.7Pacific School of Religion ACCRED WHITE CA UNCHCH $3972 $4597 $26,1Payne Theological Seminary CAND BLACK OH AFRMEP $552 $552 $0.0Perkins School of Theology ACCRED WHITE TX UNMECH $7639 $7639 $65.8Phillips Graduate Seminary ACCRED WHITE OK CHCFIDC $2133 $2221 $3,6Pittsburgh Theological Seminary ACCRED WHITE PA PRCHUS $0 $0 $0Pontifical College Josephinum ACCRED WHITE OH RCTHUS $1525 $1692 $13.3Pope John XXIII National Seminary ACCRED WHITE MA RCTHUS $12:. $1231 $1.1
Presbyterian School of Christian Education ACCRED WHITE VA PRCHUS $2362 $2642 $6,0Princeton Theological Seminary ACCRED WHITE NJ PRCHUS $20794 $24668 $465.6Providence College and Seminary ACCRED WHITE MB INTERDEN $1041 $1372 $0.3Queen's College, Newfoundland ASSOC WHITE NF ANGCHC $552 $552 $0,4
8
23
1
1
INSTITUTIONAL CHARACTERISTICS
TABLE 1.01
Significant institutional Characteristics of Each Member School
3 17 6.7 374' 48 51 48 51 Starr King School for the Ministry
3 2 3.6 2 16 10 13 8 Swedenborg School of Religion
24 12 28.7 254 589 514 352 354 Talbot School of Theology
0 0 0 0 0 0 0 0 Toronto School of Theology
6 6 7.6 41 108 103 79 81 Trinity College Faculty of Divinity
.9 5 11.0 58 134 122 90 87 Trinity Episcopal School for Ministry
2611
FACT BOOK 1993-94
TABLE 1.01
Significant Institutional Characteristics of Each Member School
Name
ATS
Accred
Status
U
/I
Predom
Race
Prov/
StateDenom-
ination
Current Fund
Expenditures
(in Thousands $)
E&G Total
Endow-
ment
$mill
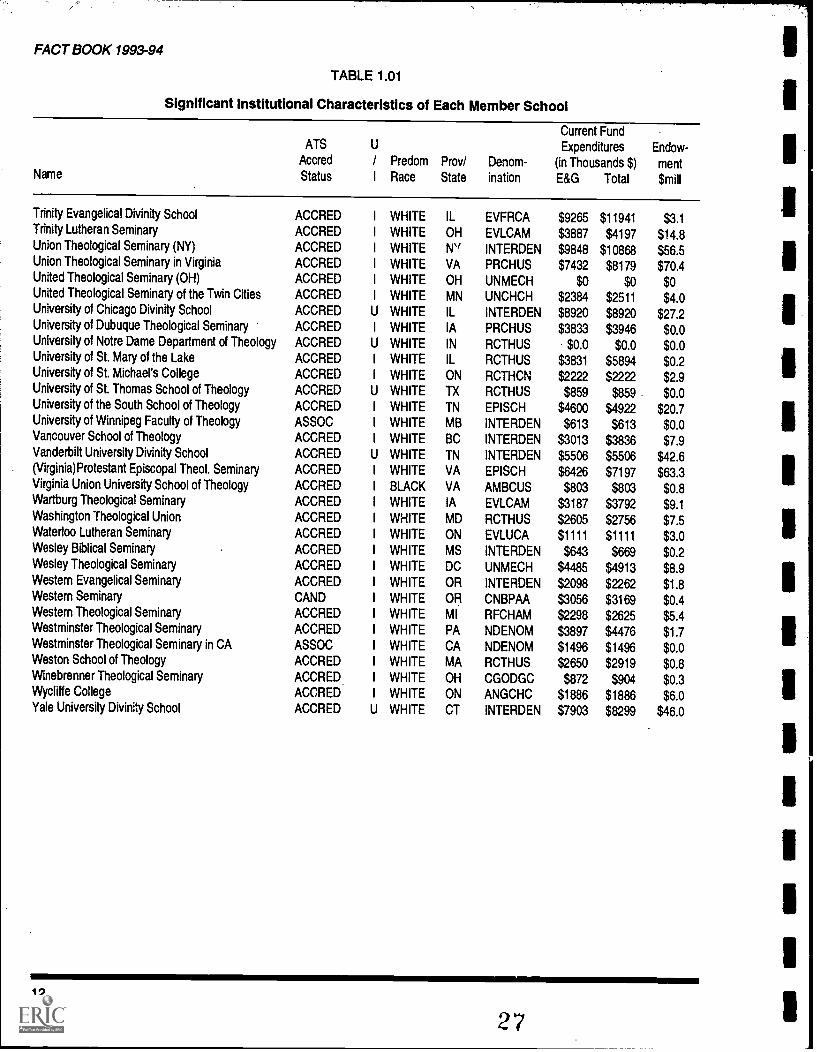
Trinity Evangelical Divinity School ACCRED I WHITE IL EVFRCA $9265 $11941 $3.1Trinity Lutheran Seminary ACCRED I WHITE OH EVLCAM $3887 $4197 $14.8Union Theological Seminary (NY) ACCRED I WHITE Nv INTERDEN $9848 $10868 $56.5Union Theological Seminary in Virginia ACCRED I WHITE VA PRCHUS $7432 $8179 $70.4United Theological Seminary (OH) ACCRED I WHITE OH UNMECH $0 $0 $0United Theological Seminary of the Twin Cities ACCRED I WHITE MN UNCHCH $2384 $2511 $4.0University of Chicago Divinity School ACCRED U WHITE IL INTERDEN $8920 $8920 $27.2University of Dubuque Theological Seminary ACCRED I WHITE IA PRCHUS $3833 $3946 $0.0University of Notre Dame Department of Theology ACCRED U WHITE IN RCTHUS $0.0 $0.0 $0.0University of St. Mary of the Lake ACCRED I WHITE IL RCTHUS $3831 $5894 $0.2University of St. Michael's College ACCRED I WHITE ON RCTHCN $2222 $2222 $2.9University of St. Thomas School of Theology ACCRED U WHITE TX RCTHUS $859 $859 $0.0University of the South School of Theology ACCRED I WHITE TN EPISCH $4600 $4922 $20.7University of Winnipeg Faculty of Theology ASSOC I WHITE MB INTERDEN $613 $613 $0.0Vancouver School of Theology ACCRED I WHITE BC INTERDEN $3013 $3836 $7.9Vanderbilt University Divinity School ACCRED U WHITE TN INTERDEN $5506 $5506 $42.6(Virginia)Protestant Episcopal Theol. Seminary ACCRED I WHITE VA EPISCH $6426 $7197 $63.3Virginia Union University School of Theology ACCRED I BLACK VA AMBCUS $803 $803 $0.8Wartburg Theological Seminary ACCRED I WHITE IA EVLCAM $3187 $3792 $9.1Washington Theological Union ACCRED I WHITE MD RCTHUS $2605 $2756 $7.5Waterloo Lutheran Seminary ACCRED I WHITE ON EVLUCA $1111 $1111 $3.0Wesley Biblical Seminary ACCRED I WHITE MS INTERDEN $643 $669 $0.2Wesley Theological Seminary ACCRED I WHITE DC UNMECH $4485 $4913 $8.9Western Evangelical Seminary ACCRED I WHITE OR INTERDEN $2098 $2262 $1.8Western Seminary CAND I WHITE OR CNBPAA $3056 $3169 $0.4Western Theological Seminary ACCRED I WHITE MI RFCHAM $2298 $2625 $5.4Westminster Theological Seminary ACCRED I WHITE PA NDENOM $3897 $4476 $1.7Westminster Theological Seminary in CA ASSOC I WHITE CA NDENOM $1496 $1496 $0.0Weston School of Theology ACCRED I WHITE MA RCTHUS $2650 $2919 $0.8Winebrenner Theological Seminary ACCRED I WHITE OH CGODGC $872 $904 $0.3Wycliffe College ACCRED I WHITE ON ANGCHC $1886 $1886 $6.0Yale University Divinity School ACCRED U WHITE CT INTERDEN $7903 $8299 $46.0
12
27
IIIIIII1
IIIIIIIIIII
INSTITUTIONAL CHARACTERISTICS
TABLE 1.01
Significant Institutional Characteristics of Each Member School
1 26 7.0 587 309 302 282 279 Union Theological Seminary (NY)17 11 20.7 283' 259 264 251 258 Union Theological Seminary in Virginia16 43 34.0 120 589 582 429 432 United Theological Seminary (OH)12 12 14.2 74 254 236 179 165 United Theological Seminary of the Twin Cities30 0 30.0 0 377 384 315 384 University of Chicago Divinity School
8 11 11.5 165 141 140 144 138 University of Dubuque Theological Seminary
36 3 38.3 226 207 161 207 161 University of Notre Dame Department of Theology17 18 20.0 180 213 268 227 289 University of St. Mary of the Lake14 18 16.0 111 278 271 217 200 University of St. Michael's College7 11 12.0 48 211 191 145 164 University of St. Thomas School of Theology7 10 10.0 120 152 150 133 127 University of the South School of Theology3 36 18.0 520* 237 266 96 64 University of Winnipeg Faculty of Theology
11 10 15.3 79 115 123 93 102 Vancouver School of Theology17 13 22.5 159 338 333 293 285 Vanderbilt University Divinity School19 22 23.0 117 222 206 207 198 (Virginia) Protestant Episcopal Theol. Seminary
6 8 8.8 283' 515 621 507 613 Virginia Union University School of Theology15 8 18.0 108 222 235 199 199 Wartburg Theological Seminary
18 16 21.0 385 392 401 361 367 Yale University Divinity School
# Schools that are members of a cluster and share library resources are
indicated by numbers from one to eight, with each number indicating a
different cluster.* Indicates that the school is reporting University library holdings.** HC/Frt, for 1992 is the combination of Goshen Biblical Seminary and
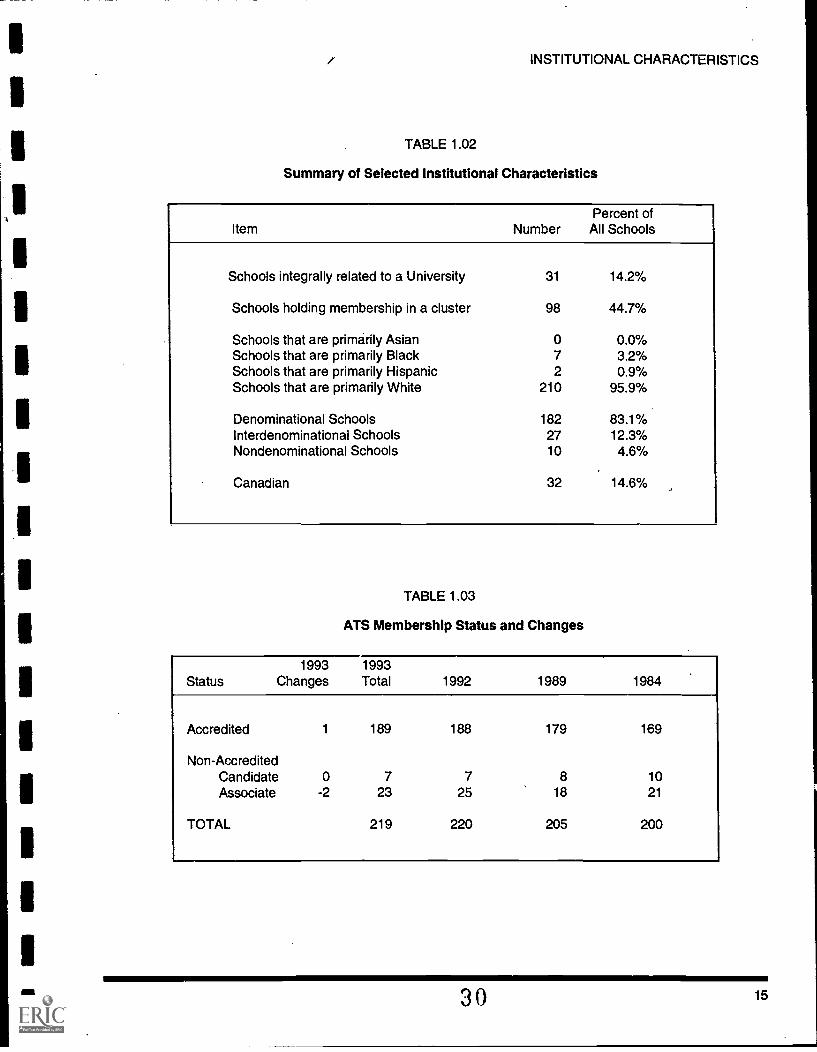
Table 1.02 shows data for several types of schools in both number and percentage.
It is based on all member schools. University-related schools are those related to a
larger institution with at least two other graduate level professional schools or
departments. Schools are classified as members of a cluster only if the relationship
includes at least two other schools of theology. The clusters in The Association of
Theological Schools are listed at the back of the ATS Directory. In addition, schools
indicate denomination upon applying for membership to the Association.
Table 1.03 reports changes in ATS membership status for the past 10 years. The
Association has three categories of membership. Accredited members are those
that, after self study and a comprehensive evaluation on the basis of Association
standards, are granted accreditation by the Commission on Accrediting. The
category of Candidate for Accredited Membership was initiated in 1980. Candi-
dates are those institutions that, after review on the basis of Association procedures
and standards, have been authorized by vote of the Commission on Accrediting to
begin the self-study proess leading to an accreditation review. Candidacy status is
normally granted for two years. Associate members are those that have met the
criteria for associate membership prescribed by the Association and have been
recommended by the Commission on Accrediting and elected by a two-thirds vote
of the accredited members at the Biennial Meeting. They must continue to meet
minimal requirements for membership and standards of education which satisfy
guidelines defined by the ATS.
14
29
INSTITUTIONAL CHARACTERISTICS
TABLE 1.02
Summary of Selected Institutional Characteristics
Item NumberPercent of
All Schools
Schools integrally related to a University 31 14.2%
Schools holding membership in a cluster 98 44.7%
Schools that are primarily Asian 0 0.0%Schools that are primarily Black 7 3.2%Schools that are primarily Hispanic 2 0.9%Schools that are primarily White 210 95.9%
Table 1.04B:Distribution of Schools byFull-Time Equivalent (FTE)Enrollment
FTE is now calculated by the twofollowing methods:1. For all doctoral programs the FTEequals the Head Count.2. For all masters' level programs FTEis computed in the following mannerfor ATS purposes.
Divide the total number of creditsrequired for the degree by the numberof semesters or quarters prescribed fordegree duration to determine theaverage academic load (AAL).
To calculate FTE, divide the total ofcredit hours taken by all students in agiven degree program in a semester, bythe AAL for the same period of time.
For example: An M.Div. degreerequires 90 semester hours, and theschool considers the degree to betypically six semesters. The AALwould be 90/6 = 15 hours persemester.
If all M.Div. students complete atotal of 600 hours for the semester, andthe AAL = 15, then the FTE = 600/15= 40.
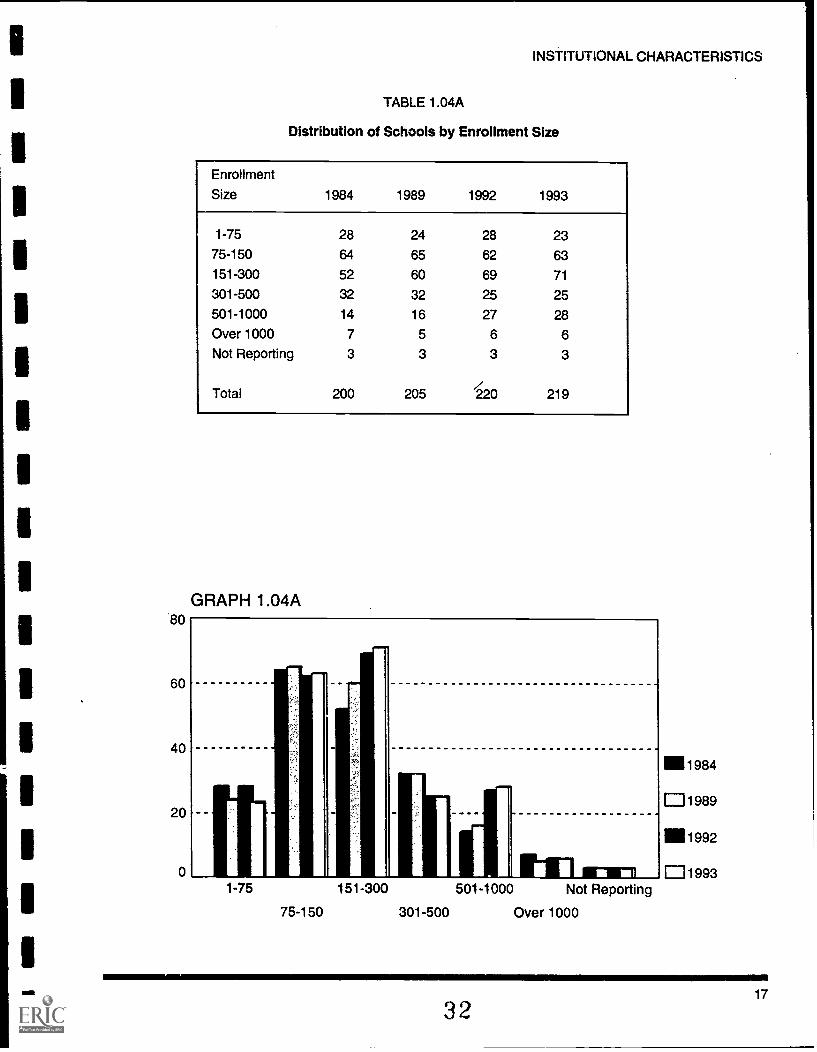
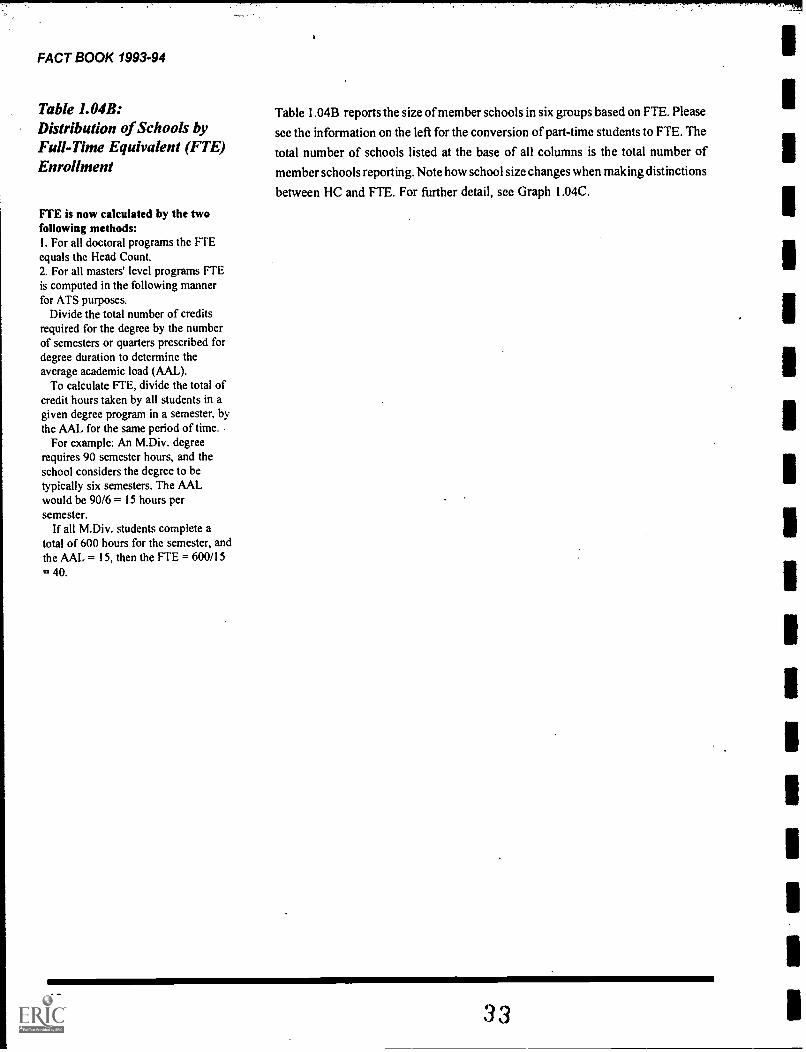
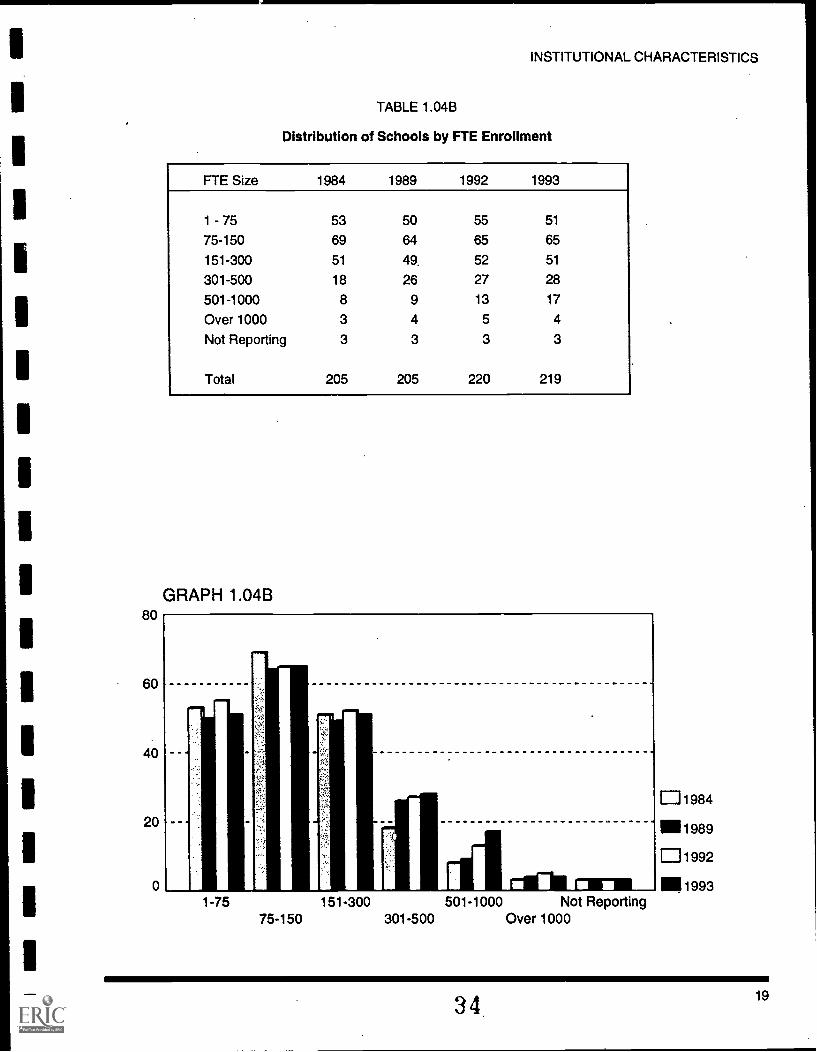
Table 1.04B reports the size of member schools in six groups based on FTE. Please
see the information on the left for the conversion of part-time students to FTE. The
total number of schools listed at the base of all columns is the total number of
member schools reporting. Note how school size changes when making distinctions
between HC and FTE. For further detail, see Graph 1.04C.
18
33
INSTITUTIONAL CHARACTERISTICS
TABLE 1.04B
Distribution of Schools by FTE Enrollment
FTE Size 1984 1989 1992 1993
1 - 75 53 50 55 51
75-150 69 64 65 65
151-300 51 49. 52 51
301-500 18 26 27 28
501-1000 8 9 13 17
Over 1000 3 4 5 4
Not Reporting 3 3 3 3
Total 205 205 220 219
GRAPH 1.04B
1-75 151-300 501-1000 Not Reporting75-150 301-500 Over 1000
0 1984
1/11989
01992
Ill 1993
34 19
FACT BOOK 1993-94
Graph 1.04C:HC/FTE for 1993
Graph 1.04C shows how the HOF h,ratios affect the size of the schoolcomparisons.
Table 1.06:Educational Program Levelsof Accredited Schools
Definitions of terms can be found inATS Procedures, Standards, andCriteria for Membership,Bulletin 41,Part 3, Standard XIII onNomenclature.
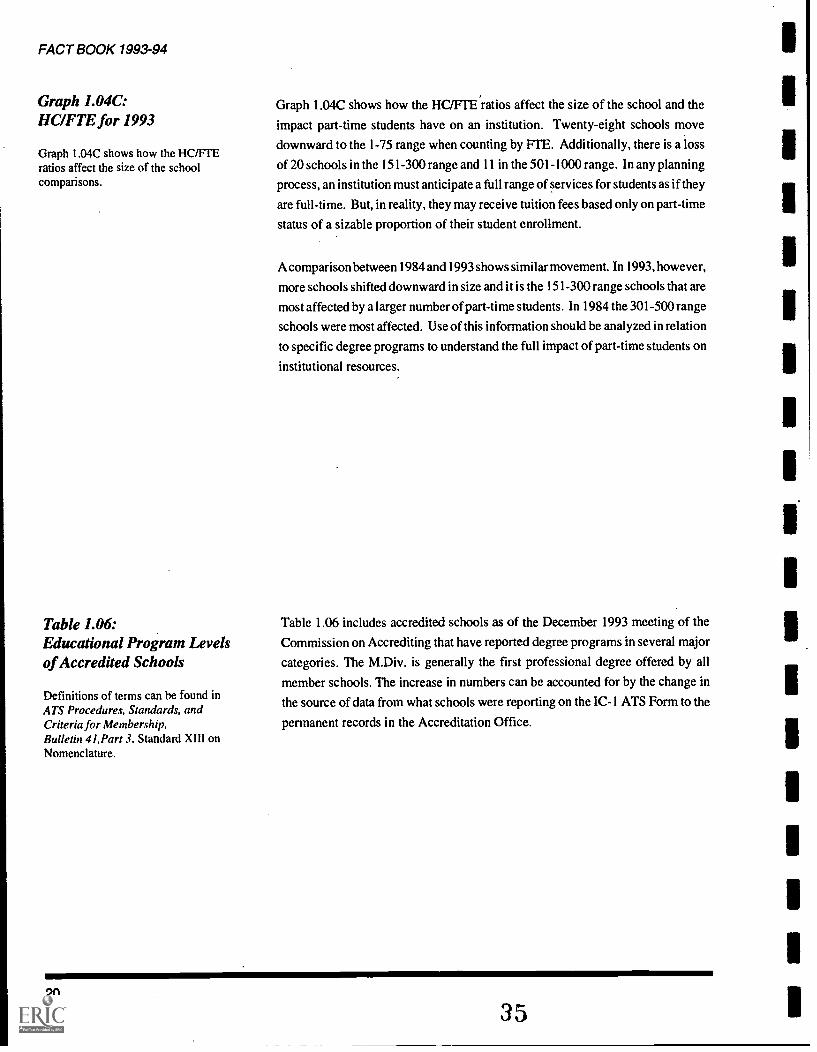
Graph 1.04C shows how the HC/P1E. ratios affect the size of the school and the
impact part-time students have on an institution. Twenty-eight schools move
downward to the 1-75 range when counting by FTE. Additionally, there is a loss
of 20 schools in the 151-300 range and 11 in the 501-1000 range. In any planning
process, an institution must anticipate a full range of services for students as if they
are full-time. But, in reality, they may receive tuition fees based only on part-time
status of a sizable proportion of their student enrollment.
A comparison between 1984 and 1993 shows similar movement. In 1993, however,
more schools shifted downward in size and it is the 151-300 range schools that are
most affected by a larger number of part-time students. In 1984 the 301-500 range
schools were most affected. Use of this information should be analyzed in relation
to specific degree programs to understand the full impact of part-time students on
institutional resources.
Table 1.06 includes accredited schools as of the December 1993 meeting of the
Commission on Accrediting that have reported degree programs in several major
categories. The M.Div. is generally the first professional degree offered by all
member schools. The increase in numbers can be accounted for by the change in
the source of data from what schools were reporting on the IC-1 ATS Form to the
permanent records in the Accreditation Office.
20
35
HC/FTE Comparison 1993
GRAPH 1.04C
INSTITUTIONAL CHARACTERISTICS
1711 raw1-75 151-300 501-1000 Not Reporting
75-150 301-500 Over 1000
TABLE 1.06
Educational Program Levels of Accredited Schools
HC
FTE
LevelNumber of Schools
at each level1993 1992
M.A. Academic/M.A.R./M.T.S. Degree 179 153M.A. Professional Degree/M.R.E. 95 80M.Div. 212 180D.Min./D.Miss./Ed.D./D.M.A. Degree 104 91
Enrollment trends are central to academic activity and institutional viability. IntroductionObserving enrollment indicators can assist schools in making quality decisions
about the addition or deletion of programs, shifting marketing strategy, oradjusting costs to attract and retain students.
The sections of the ATS Annual Report Forms on Admissions, Enrollment, and
Completions (A -1, EF- I through EF-6, and C-1) report Head Count (HC) and Full-
Time Equivalent (FIE) enrollment by age, race, and denomination, and enrollment
by specific degree programs, much of which is reflected in tables in this chapter.
This chapter also includes a report of completions by degree program, their number
and enroll gent, and the number of first-year students.
QUESTIONS TO CONSIDER
I. What impact does the changing enrollment picture have on faculty,
staff, housing, class scheduling, degree offerings, and services?
2. Does your school have a recruitment/enrollment strategy?
3. Has your institution done an assessment of its recruitment and
enrollment strategies?
4. Does your school use an enrollment management consultant ser-
vice?
The introduction to the Fact Book contains information on comparability of data
as well as a complete listing of all ATS approved degrees. Requirements for each
degree may be found in ATS Bulletin 41, Part 3, Procedures, Standards, and
Criteria for Membership.
23
37
FACT BOOK 1993-94
Table 2.01:Number of Applications,Acceptances, and Enrollees
Information for this table was takenfrom the section entitled Admissions(A-1) of the ATS 1993 Annual ReportForms.
Table 2.02:Number InitiallyEnrolled Each Year
Applicant A person formally requesting admission to a program.
Acceptance Formal notification of admittance by a school.
Enrollee A student who enrolls after being accepted.
Acceptance % The number of applicants accepted divided by the number of
applicants.
Enrollment % The number of enrollees divided by the number of applicants
accepted.
QUESTIONS TO CONSIDER
I. What selection policies are used at your school?
2. Do these policies differ according to degrees?
3. How does your institution's percentage of acceptances in relation-
ship to enrollment compare to ATS schools as a whole?
4. Is there any thought being given to a change in policy regarding your
school's selection process?
Table 2.02 makes use of the same data as Table 2.01 but presents the data as a five-
year trend. Additional years will be added from the ATS Annual Report Forms in
succeeding years. One sees a significant increase in the number of students over
time, particularly in the M.A. and M.Div. programs. The reader must keep in mind
that these increases are due in part to new schools that were admitted to ATS in 1990
and 1992. The 1993 data continues to show an increase in the M.A. programs.
Added in 1993 for the first time are the categories: Advanced Academic Degrees,
Certificate/Diploma Programs, and Special/Unclassified.
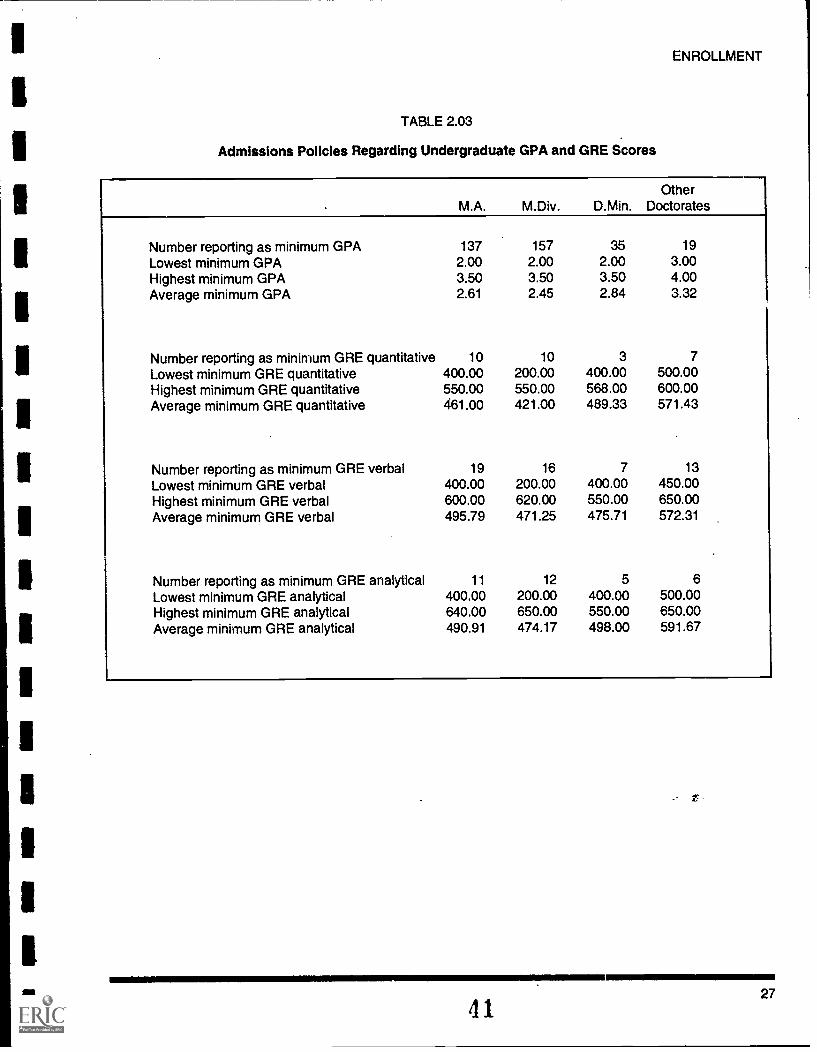
Number reporting as minimum GRE quantitative 10 10 3 7
Lowest minimum GRE quantitative 400.00 200.00 400.00 500.00Highest minimum GRE quantitative 550.00 550.00 568.00 600.00Average minimum GRE quantitative 461.00 421.00 489.33 571.43
Number reporting as minimum GRE verbal 19 16 7 13
Lowest minimum GRE verbal 400.00 200.00 400.00 450.00Highest minimum GRE verbal 600.00 620.00 550.00 650.00Average minimum GRE verbal 495.79 471.25 475.71 572.31
Number reporting as minimum GRE analytical 11 12 5 6
Lowest minimum GRE analytical 400.00 200.00 400.00 500.00Highest minimum GRE analytical 640.00 650.00 550.00 650.00Average minimum GRE analytical 490.91 474.17 498.00 591.67
r:
4127
FACT BOOK 1993-94
Table 2.04A:Total Head Count (HC)Enrollment inMember Schools
Please see the Introduction forcomparability of data.
Graph 2.04 A:
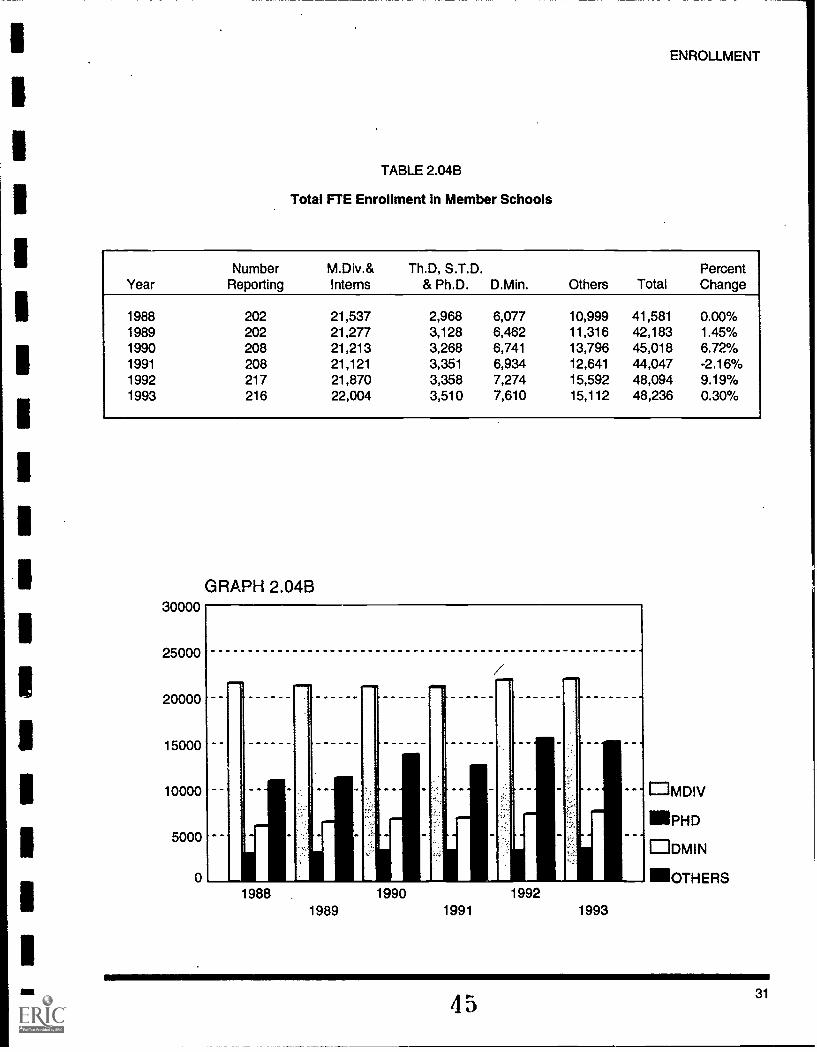
The "Schools Reporting" column of Table 2.04A shows the number of schools
reporting enrollment data for each year. The total enrollment is divided into four
categories that reflect three of the major degree programs, with all other programs
combined in the fourth category. The M.Div. and Interns category includes all
students reported as enrolled in a three- or four-year M.Div. program and those
reported as interns. Interns are reported as enrolled when the internship is under
the supervision of the school and is integral to the completion of the M.Div. degree.
The Th.D., S.T.D., and Ph.D. are the traditional academic doctorates thatconstitute the major source for faculty of graduate level theological schools. The
Doctor of Ministry is the highest level professional degree. With the number of
schools held constant, the D.Min. program is the only one showing a sizable
increase. The decline in "other" indicates shifts in Certificate programs. Institu-
tions may wish to compare these shifts with their own changes over time.
Graph 2.04A shows a slight decline in the M.Div. degree program in the early
1990s, with an increase again in 1992 and 1993. After some sizable increases in
"other degree programs" in the early 1990s, there is now indication of a decline.
These shifts reflect current discussions within some of our ATS schools as to
whether or not schools have diversified too much and ought to refocus on the
FTE is now calculated by the twofollowing methods:
1. For all doctoral programs the FTEequals the Head Count.
2. For all master level programs FTEis computed in the followingmanner for ATS purposes.
First compute the average academicload by dividing he total number ofcredits required for the degree by thenumber of semesters or quartersprescribed for degree duration.To calculate FTE, divide the total of
credit hours taken by all students in agiven degree program in a semester,by the average academic load for thesame period of time.
For example: an M.Div. degreerequires 90 semester hours, and theschool considers the degree to betypically six semesters, the averageacademic load would be 90/6 = 15hours per semester.
If all M.Div. students complete atotal of 600 hours for the semester,and the average academic load = 15,then the FTE = 600/15 = 40.
Graph 2.04B:
FTE enrollment statistics from pre-1988 editions of the Fact Book are not published
because the guidelines for calcul ating the FTE were amended for the 1988 and 1989
ATS Annual Report Forms.
If a number of students take an overload of courses, the school may report a higher
FTE than Head Count (HC). Instructions for pre-1988 ATS Annual Report Forms,
as well rs editions of the Fact Book prepared from these forms, indicated that the
FTE, should not be higher than the HC.
Comparing the HC with the FTE of M.Div. students gives one the clearest picture
of the impact of part-time students. In the category "other," spec ial/unclassified was
eliminated in 1991 because of the wide disparity of what constitutes a certificate
program. Schools, however, requested that it be reinstituted in 1992. The table
therefore shows an increase of 2951 students in 1992 but a decline of 480 in 1993.
For the sources of the data and the definitions of the four categories, please refer
We propose to track the sameinstitutions reporting for a period offive years, initiating a new groupevery five years. The trend analysisthat flows from this table offers anaccurate record of the growth ordecline of a control group of institu-tions.
Table 2.07:Comparison of TotalEnrollmentTotalIndividuals (HC) and FTE
Table 2.06 reports the change in-Head Count enrollment in the same number of
member institutions submitting Annual Report Forms for a constant number of
years. The first sequence of five years of data from 1985 to 1989 is for the same 191
schools. An analysis of this first sequence appears in the 1988-89 and 1989-90 Fact
Books. The first year of the second sequence of five years begins in 1990 with a base
of 206 schools. Any schools that drop out (by closing or not reporting) before 1995
will be eliminated from all calculations in any subsequent Fact Book Any schools
sending in their initial Annual Report Forms after 1990 were not included in this
table, nor is data included from schools admitted to the Association at the 1992
Biennial Meeting. If this table is compared with Table 2.04A, a clearer picture about
enrollment changes emerges. Table 2.04A (representing 216 schools) shows an
overall decrease in enrollment of .09%. Table 2.06, with an overall decrease of
.35%, presents an even pattern of student enrollment activity in ATS member
schools.
Table 2.07 provides an analysis of the ratio of Full-Time Equivalent to Head Count
enrollment for the number of member schools reporting Head Count for each year
reported. The statistics for this table are taken from the Total Head CountEnrollment in Table 2.04A and the Total FIE Enrollment in Table 2.04B.
Please refer to the Introduction to the Fact Book for comparability of data. With the
definitions stabilized, the percent change in both HC and FTE enrollment is very
slight. The FTE percent of HC seems to be holding at approximately 75%.
34
48
1
1
1
ENROLLMENT
TABLE 2.06
Comparable Enrollments: Same Institutions Reporting Head Count
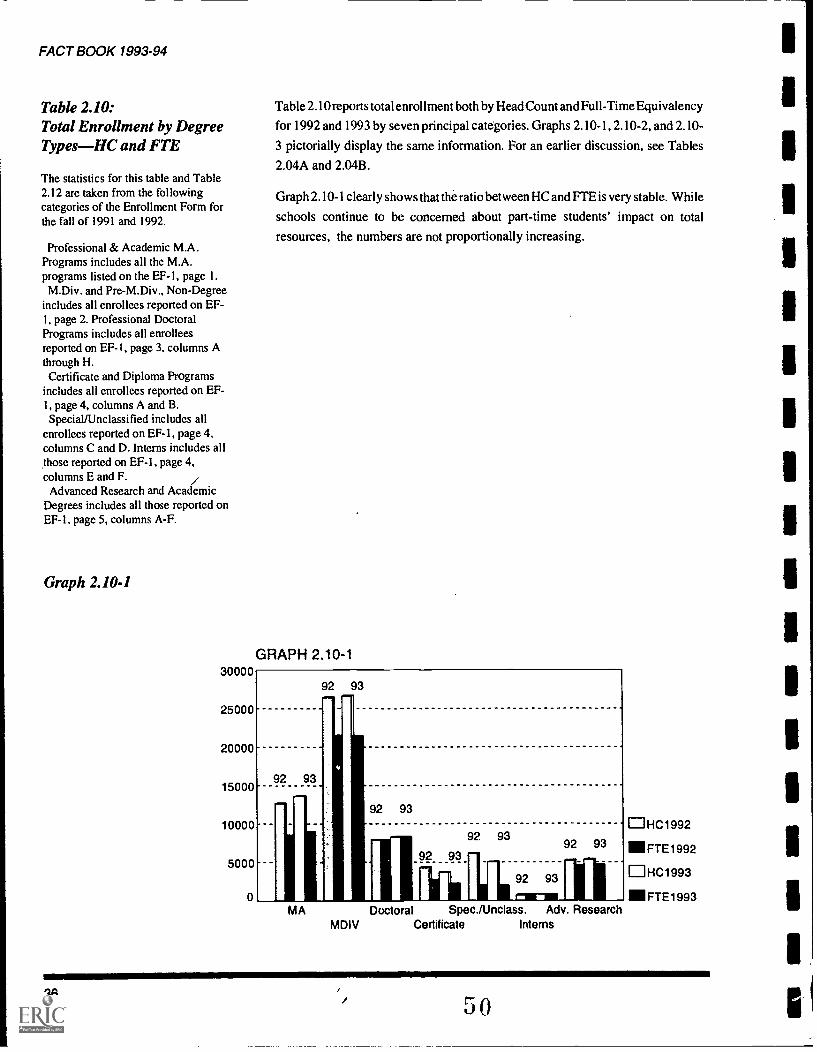
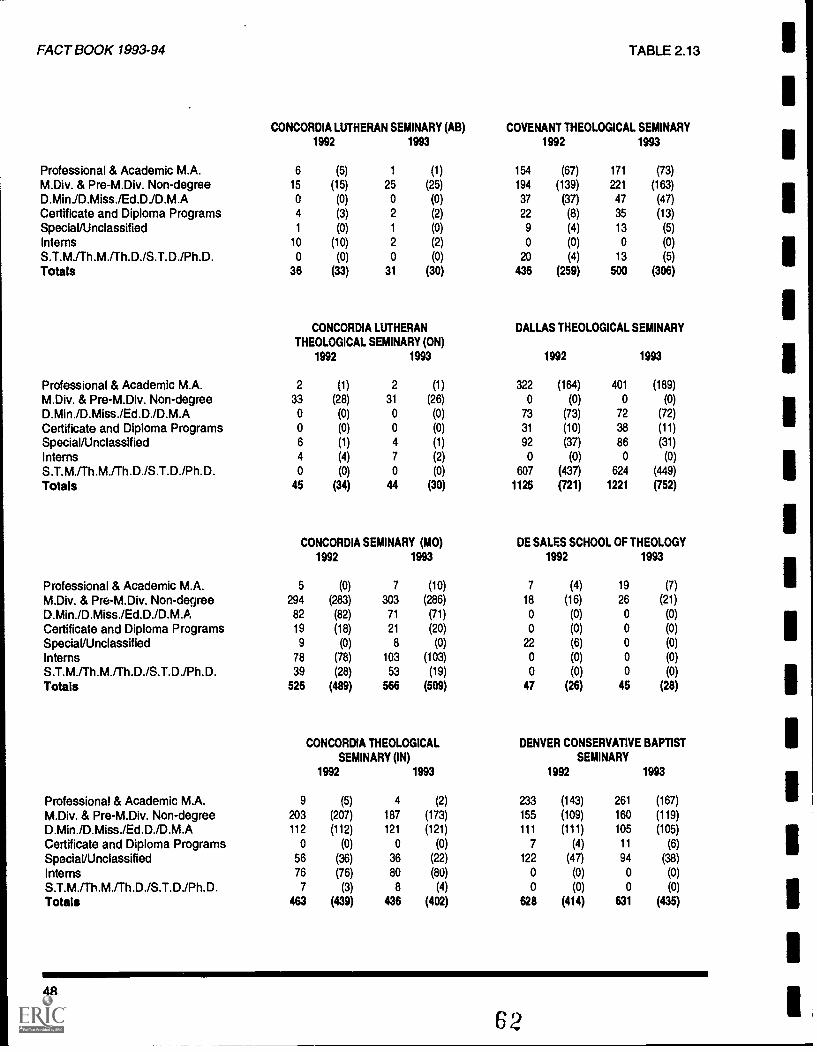
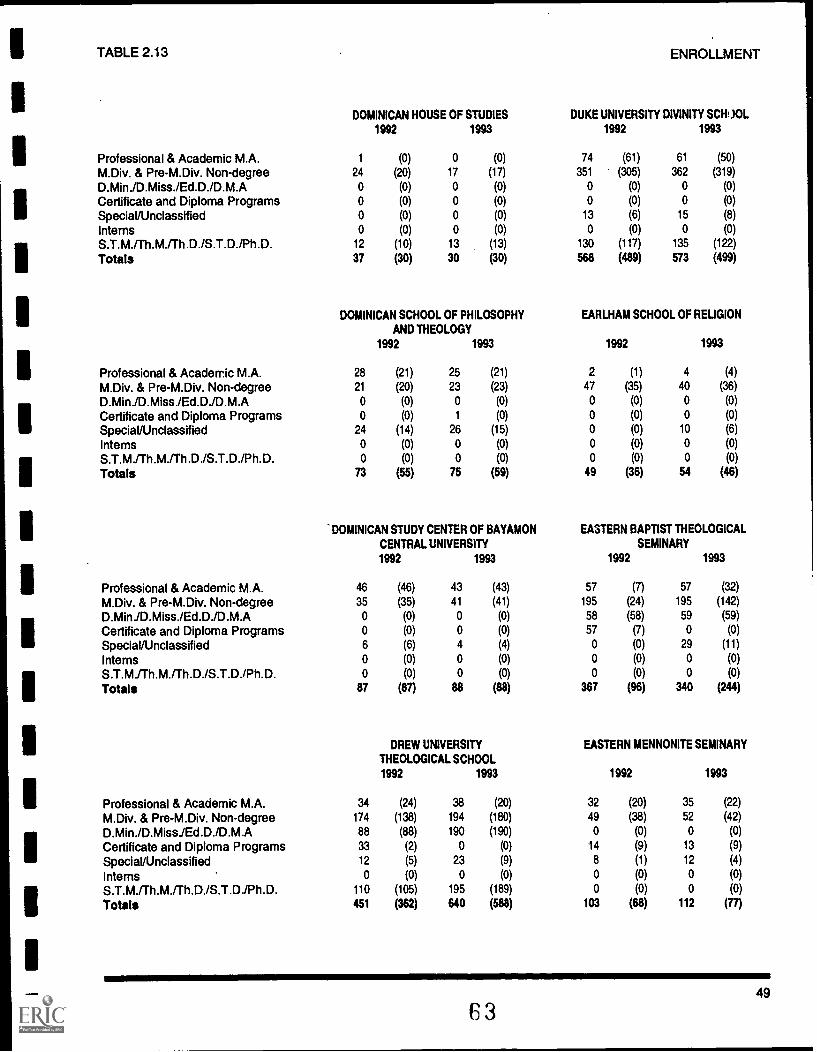
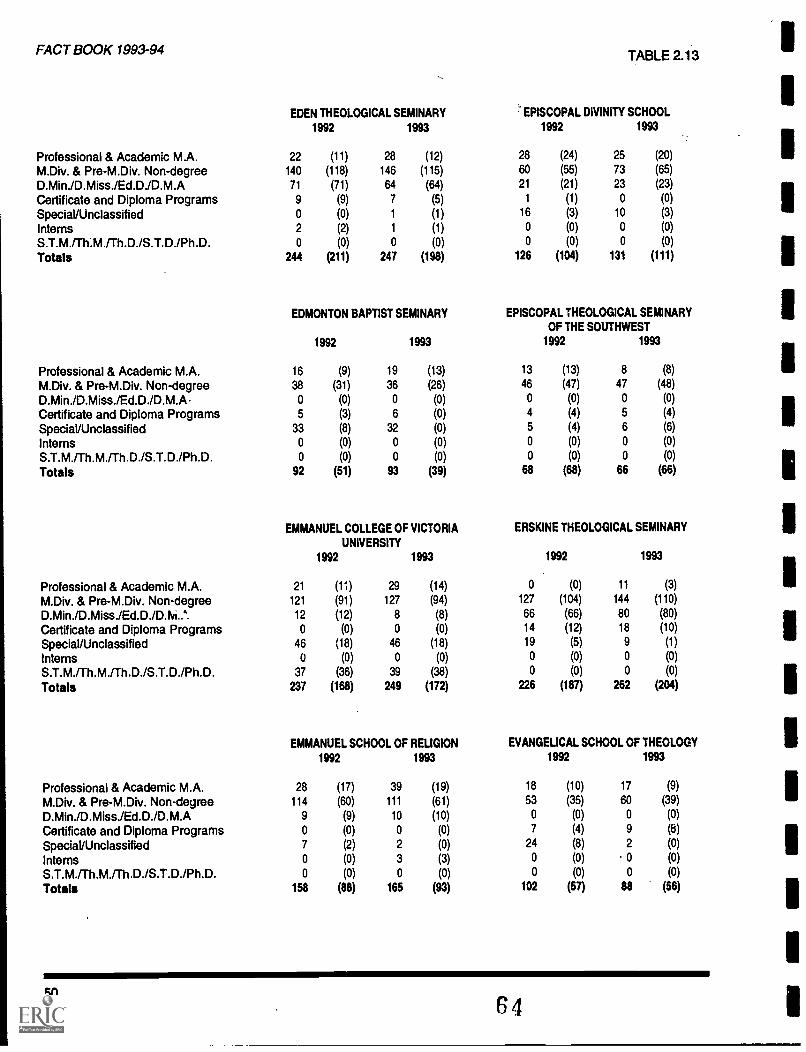
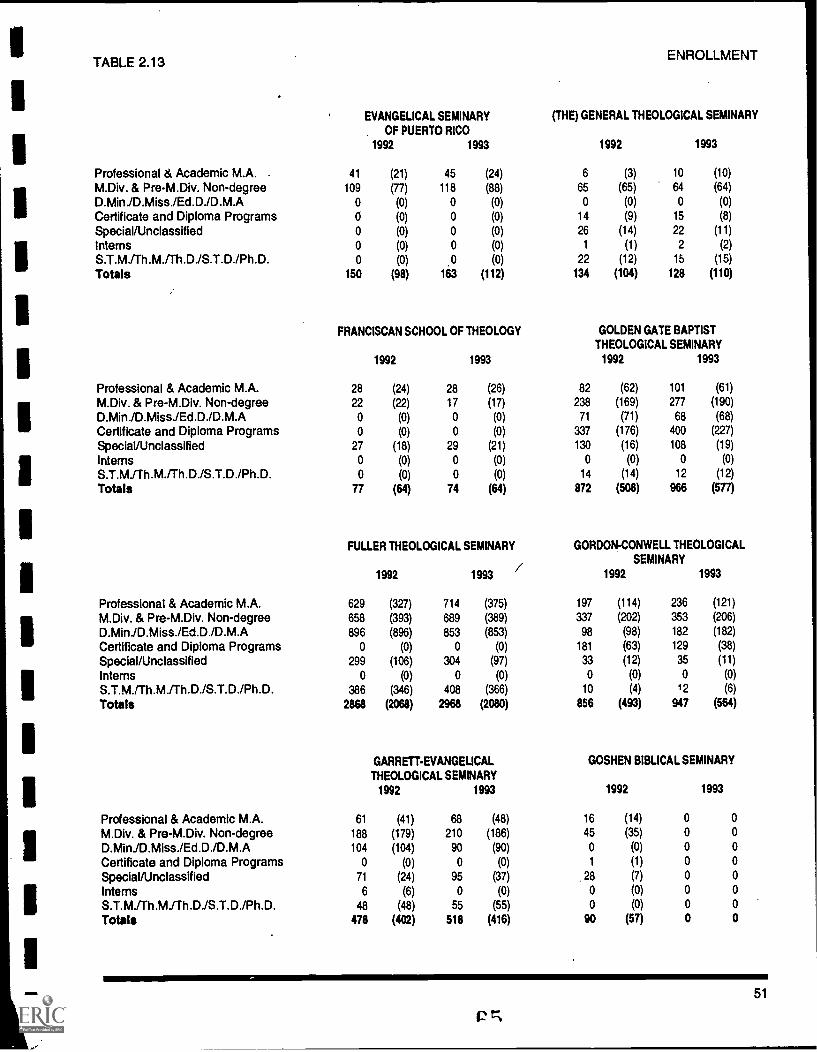
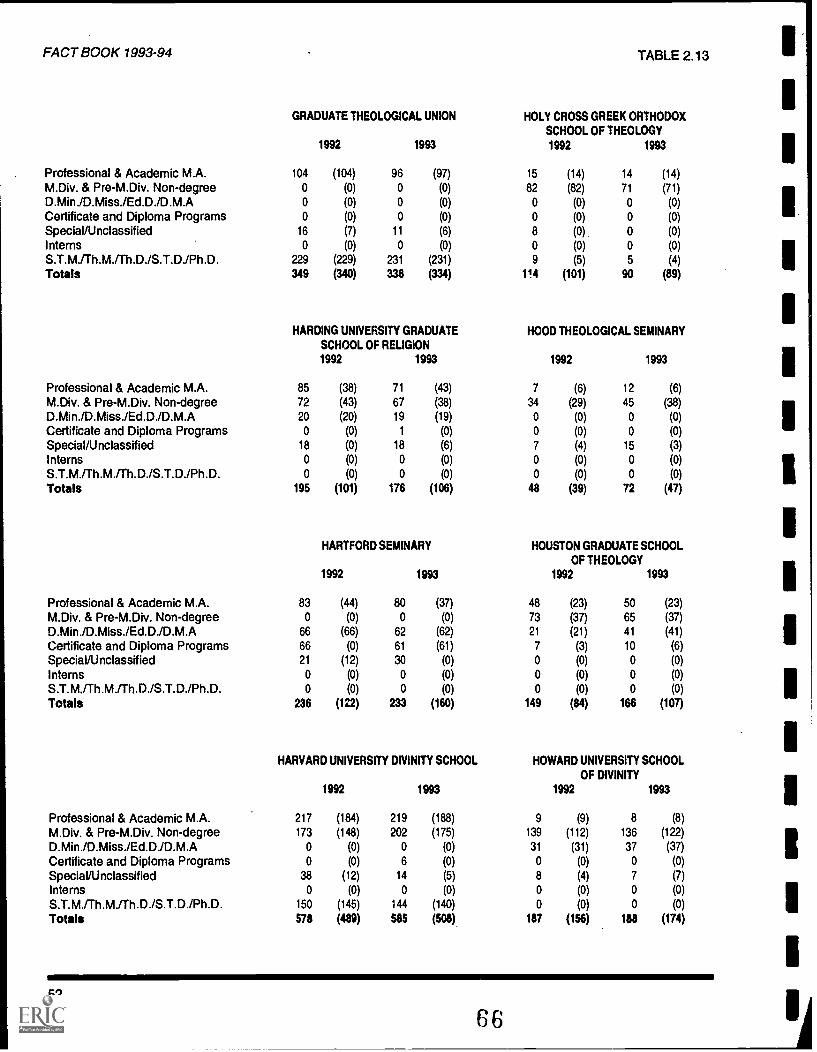
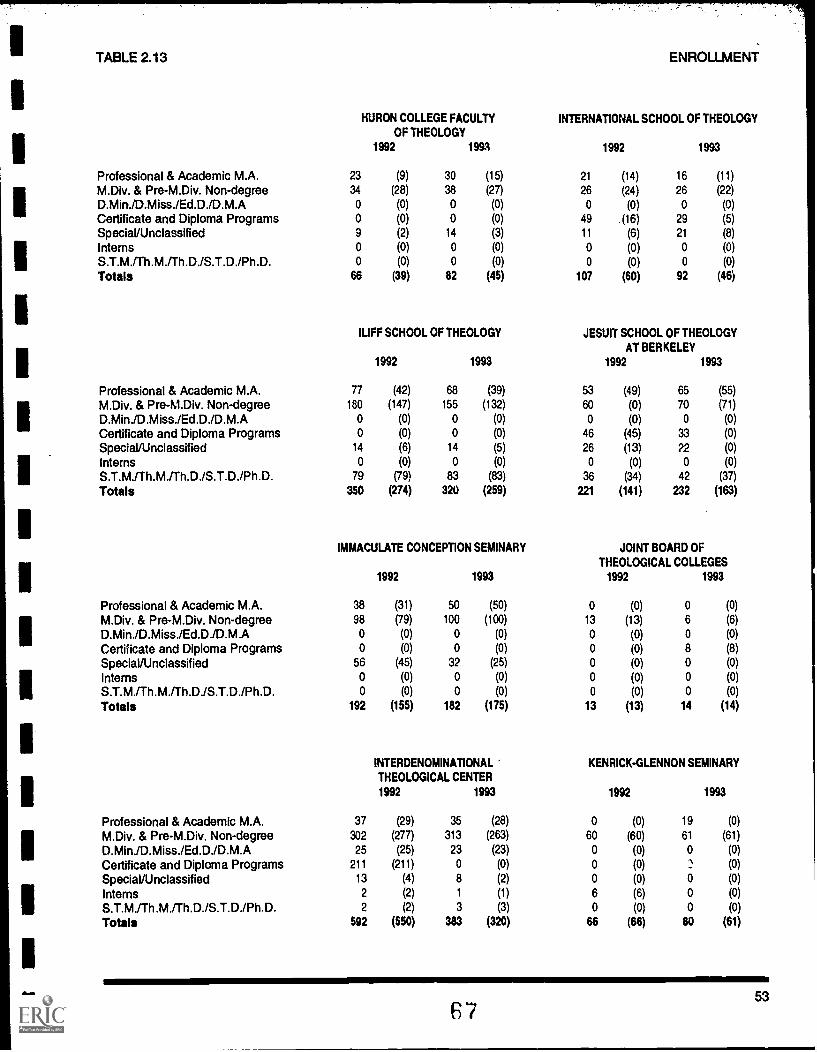
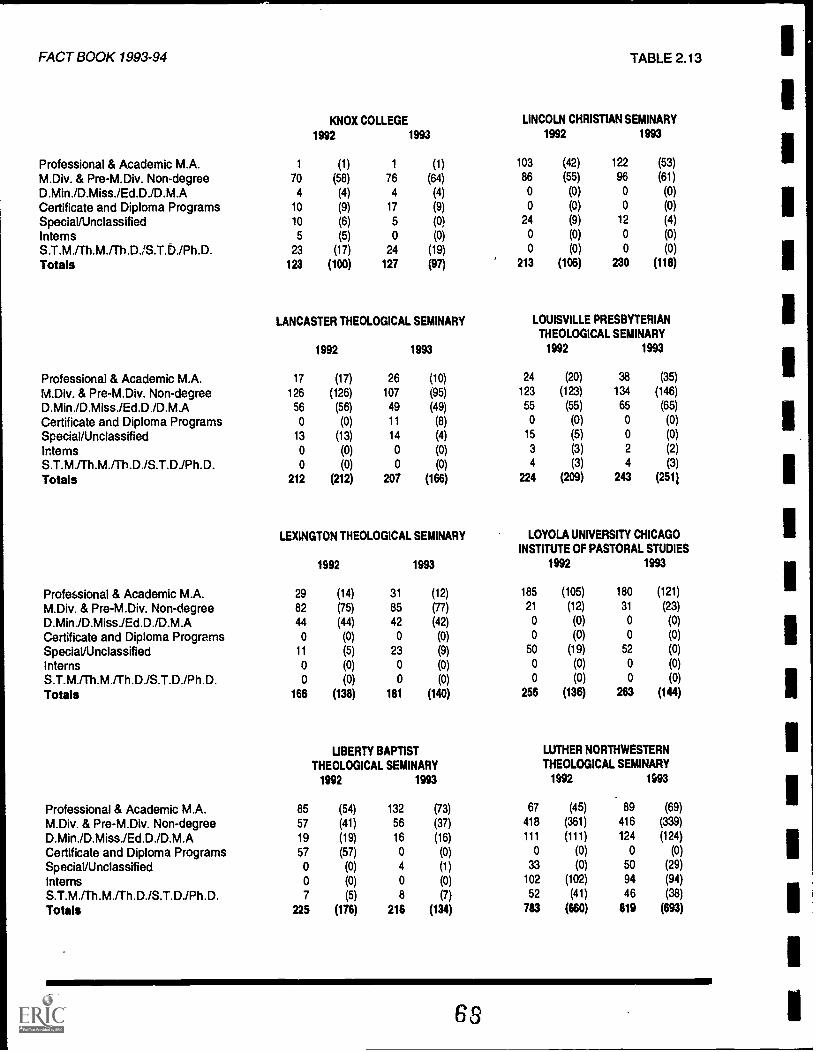
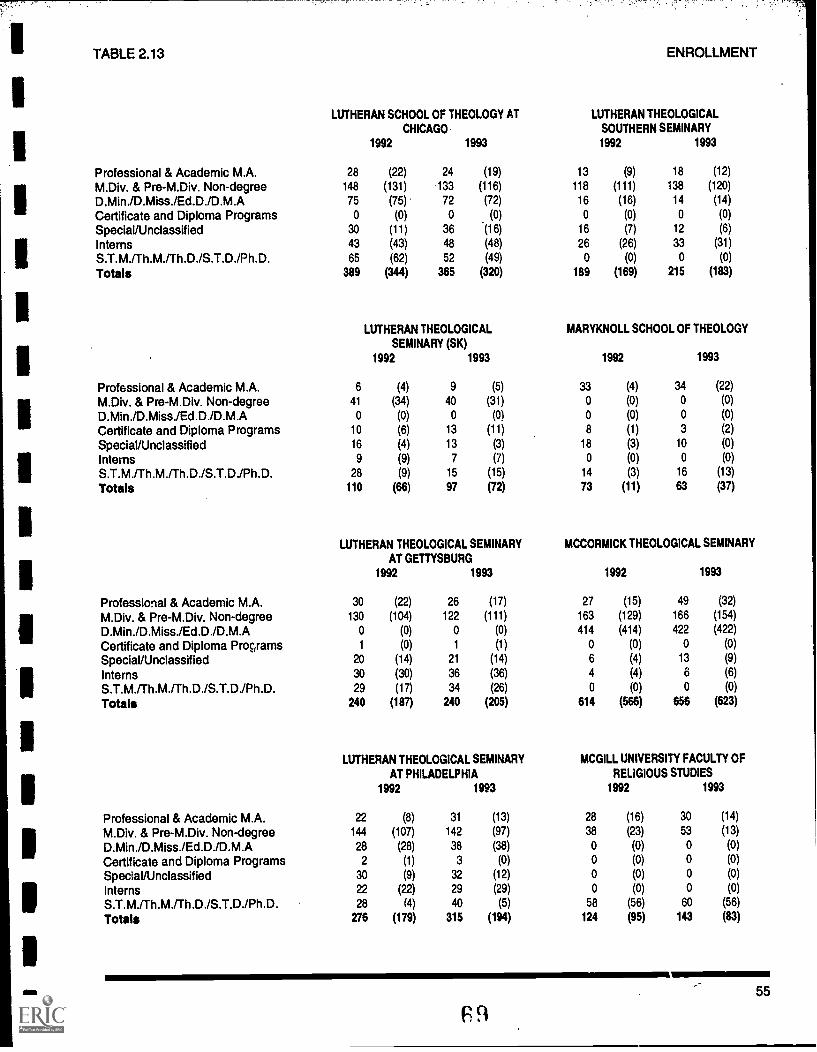
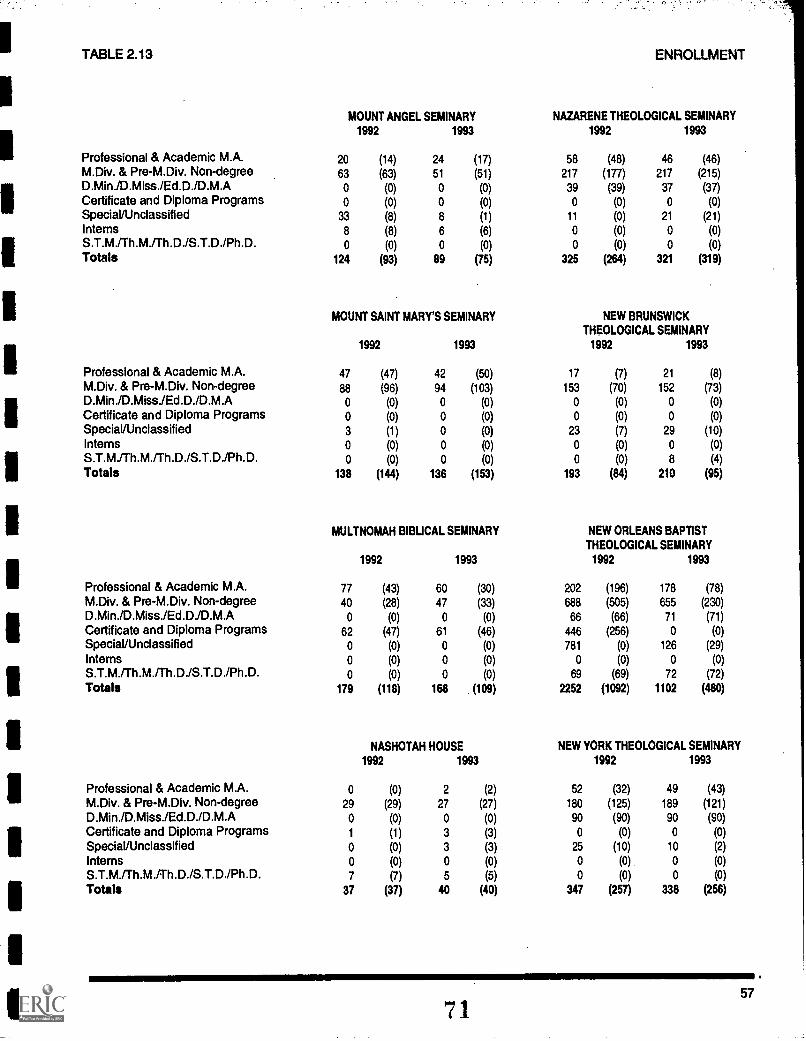
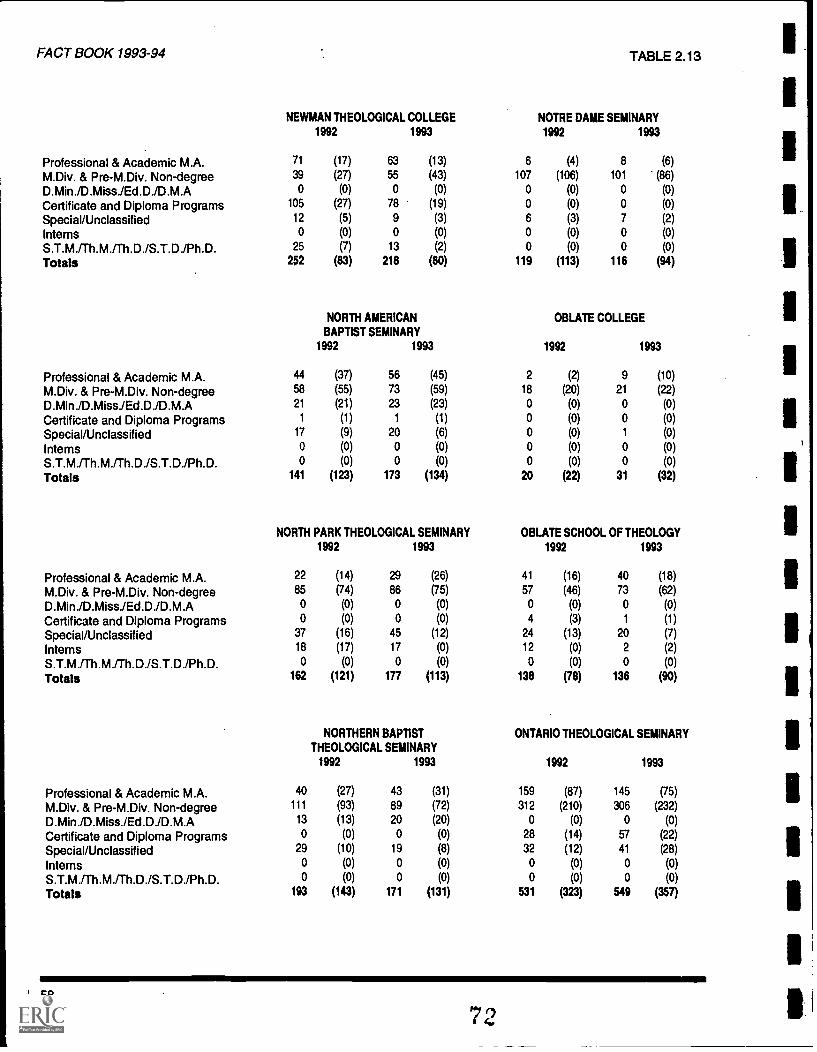
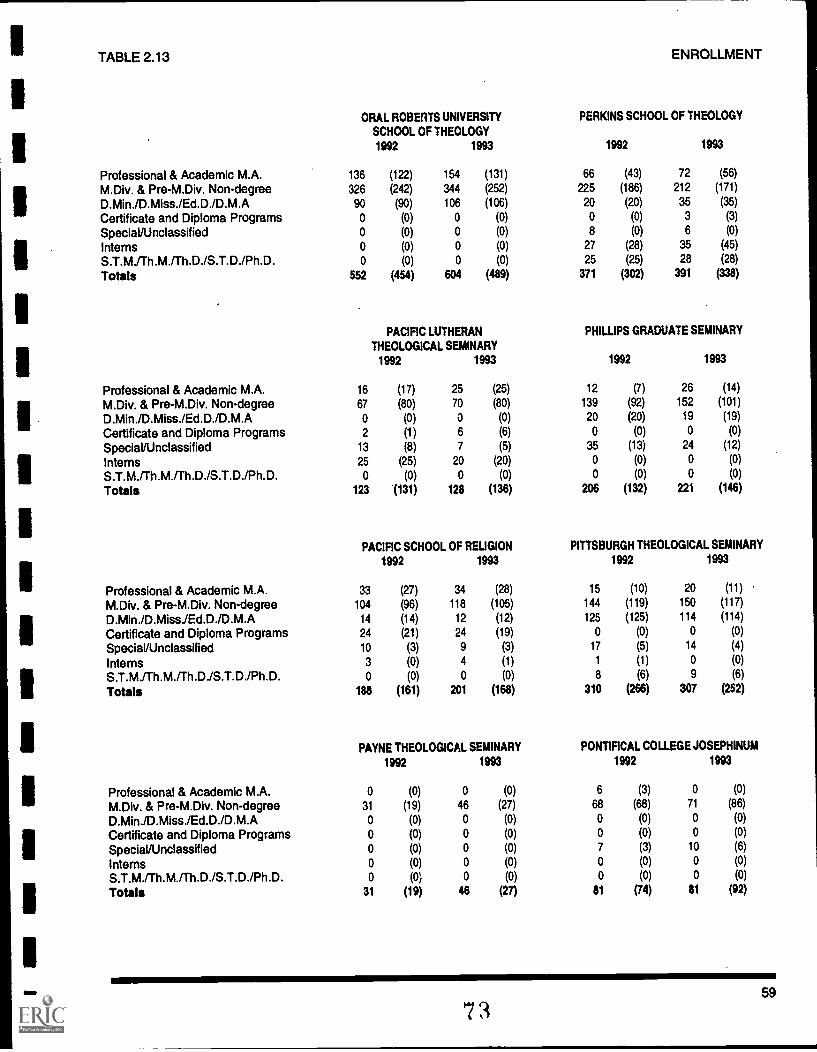
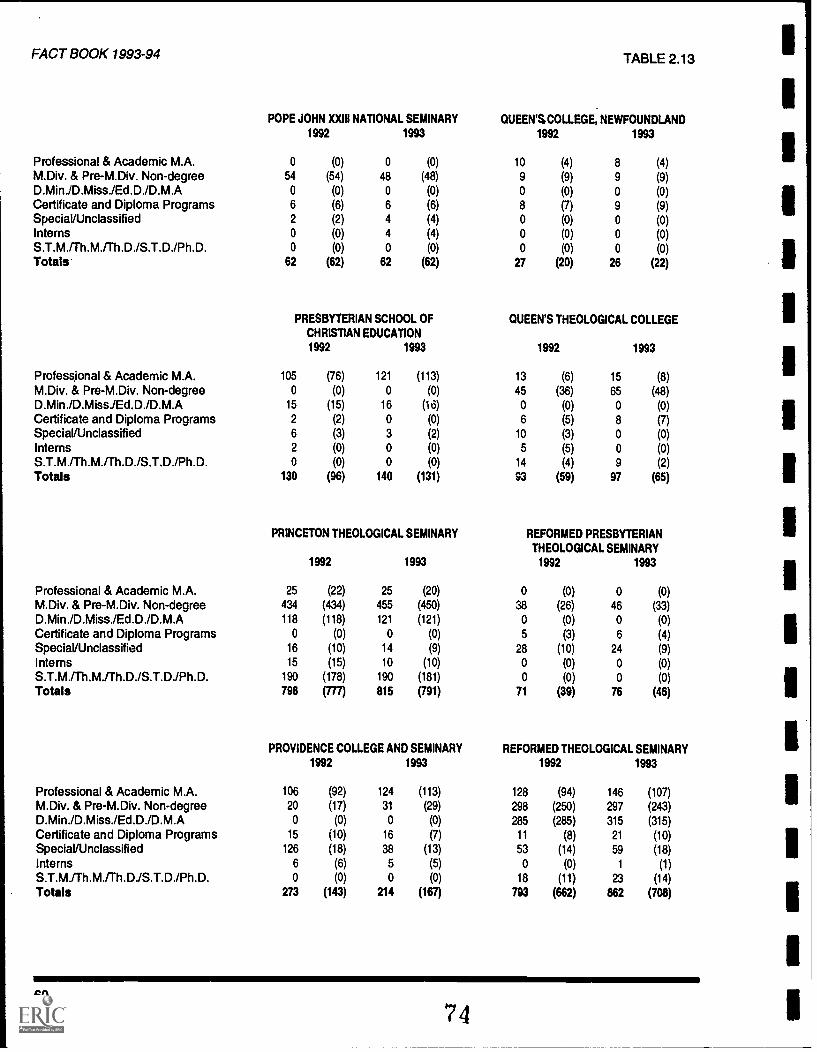
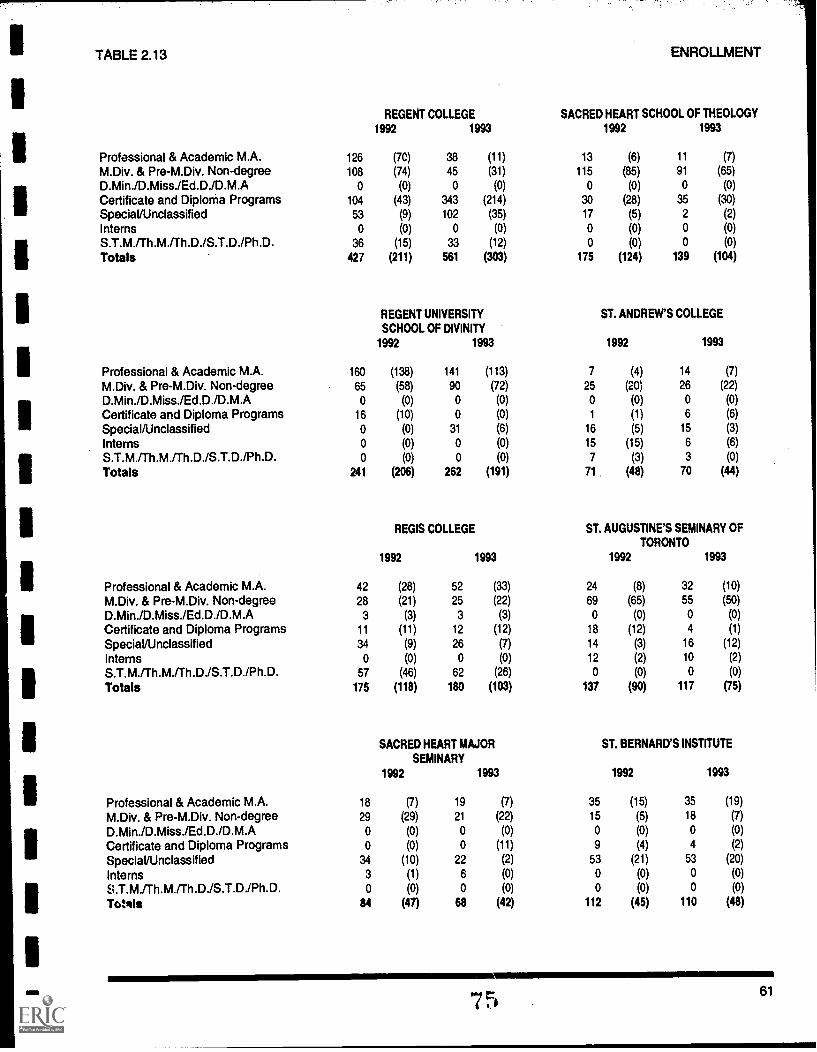
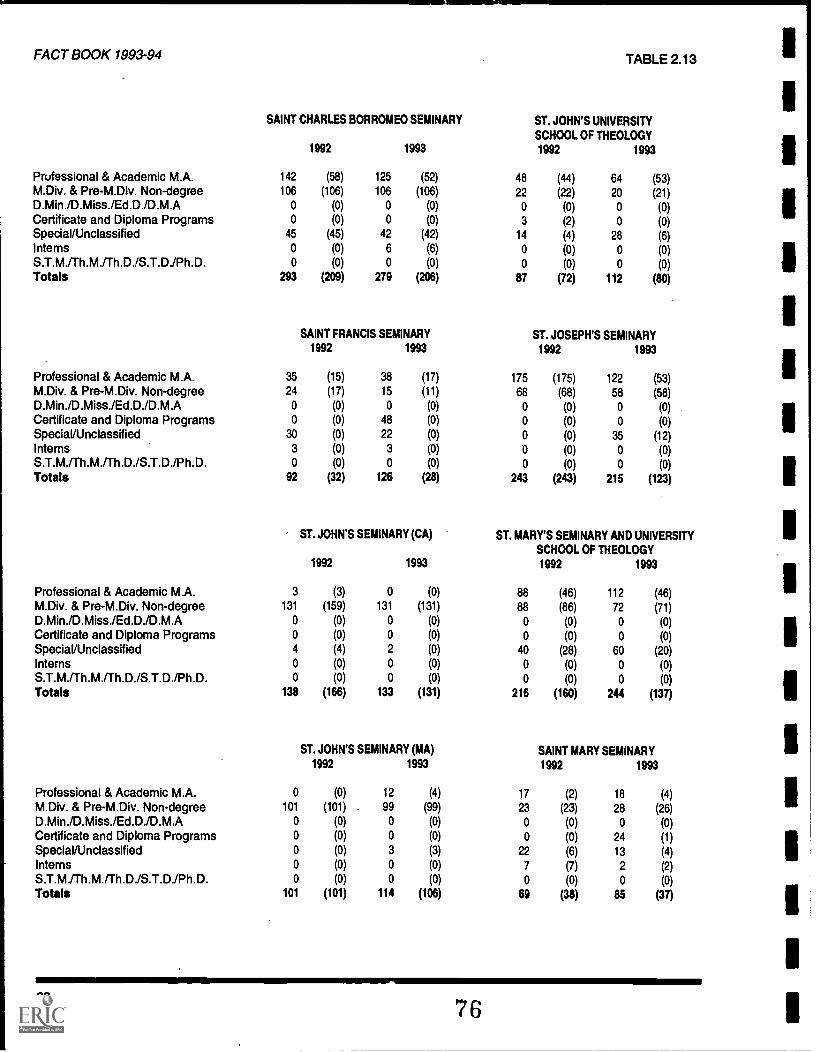
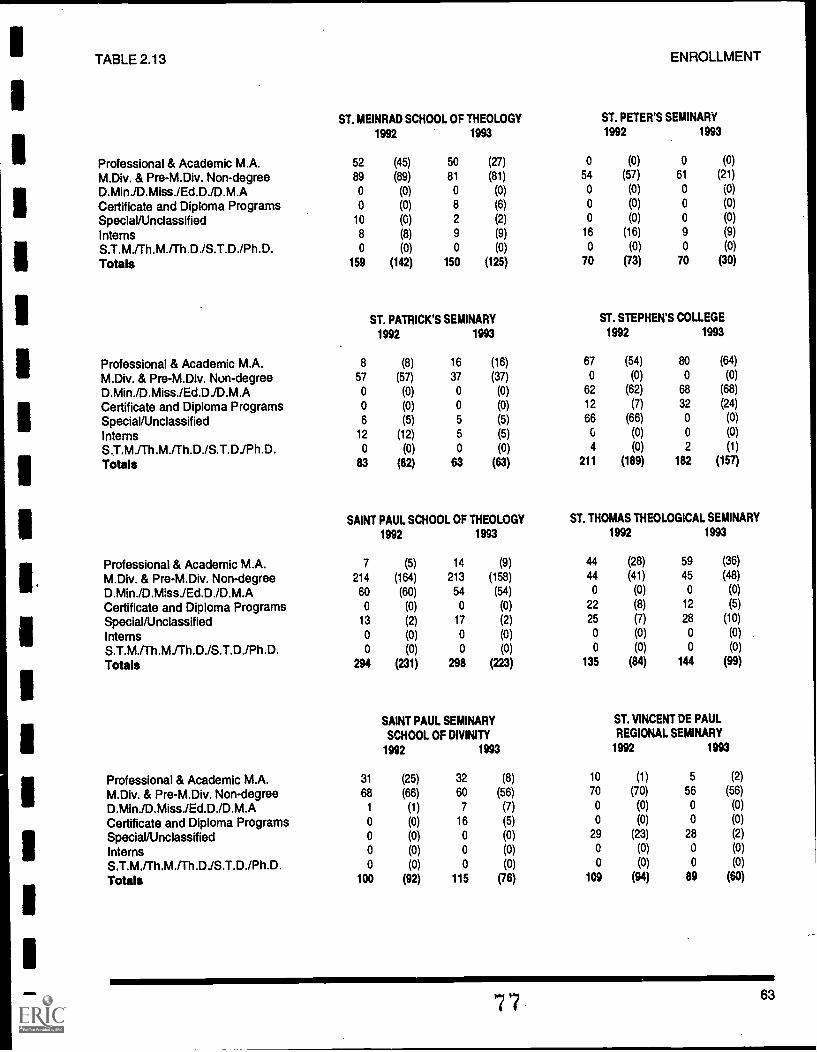
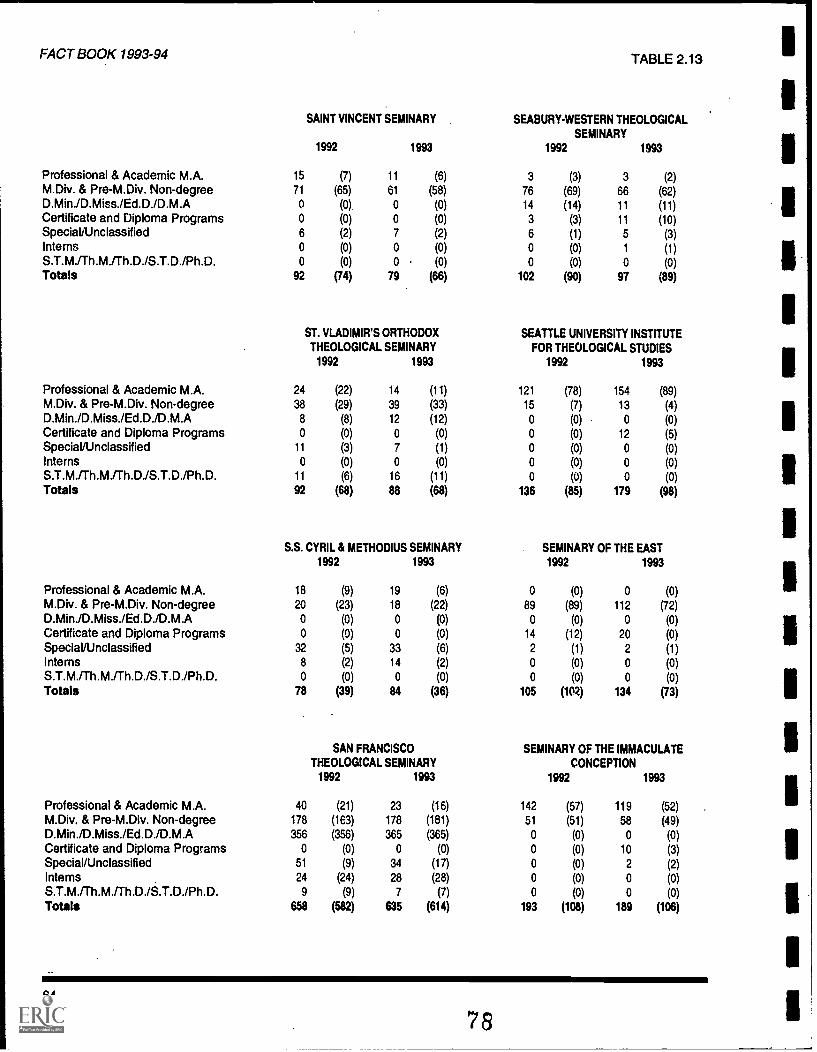
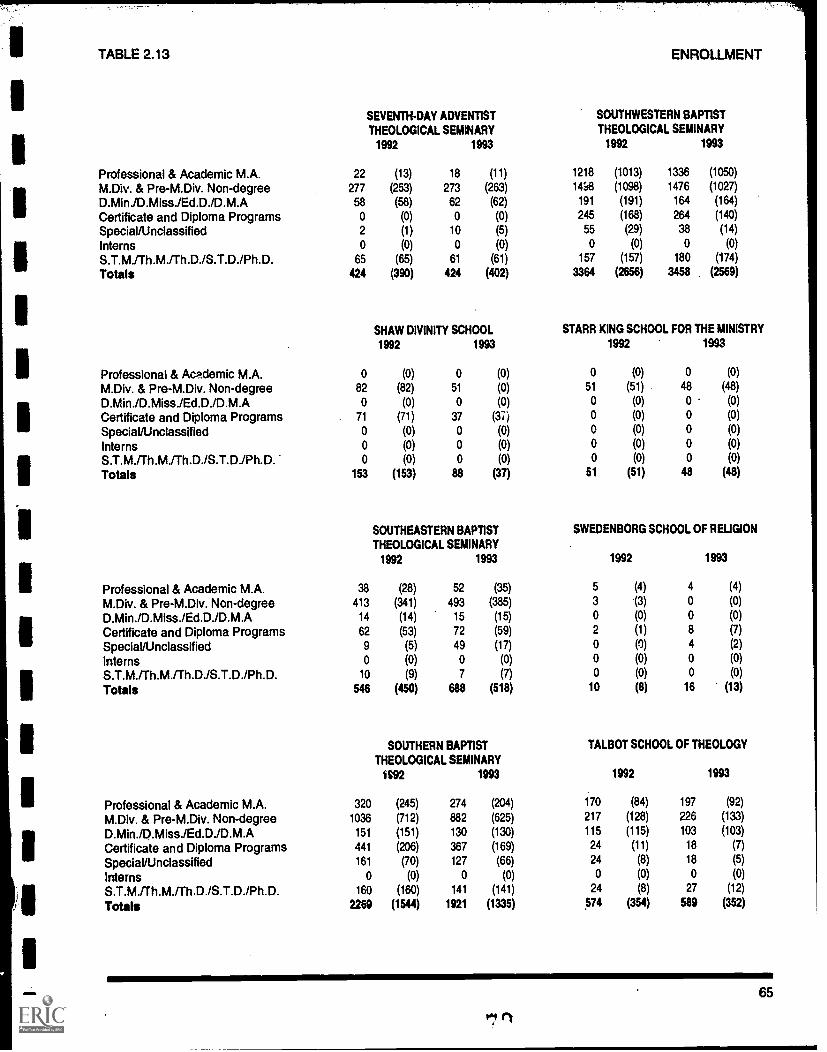
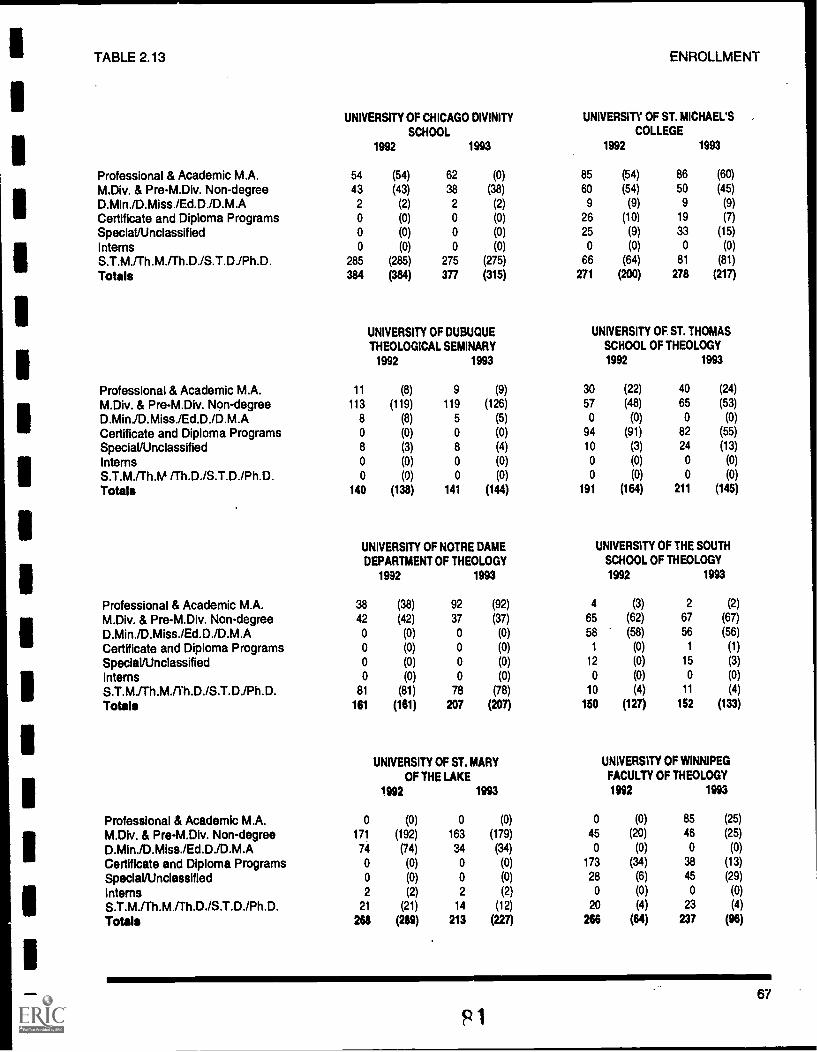
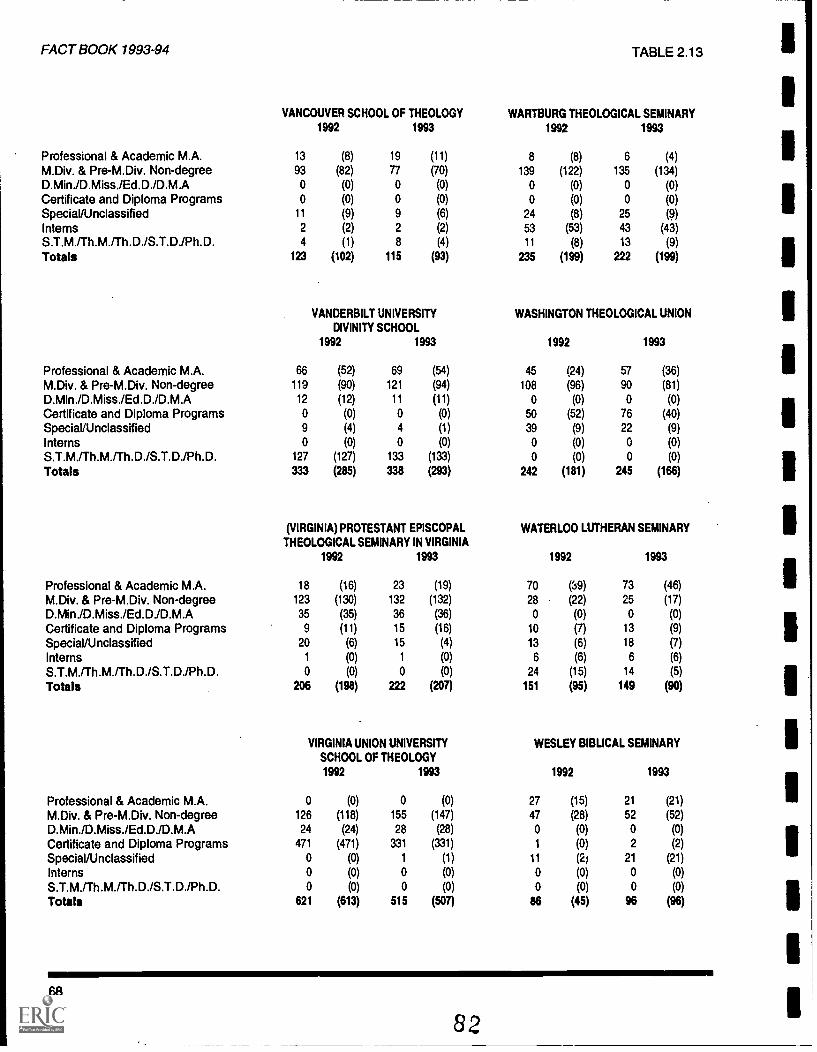
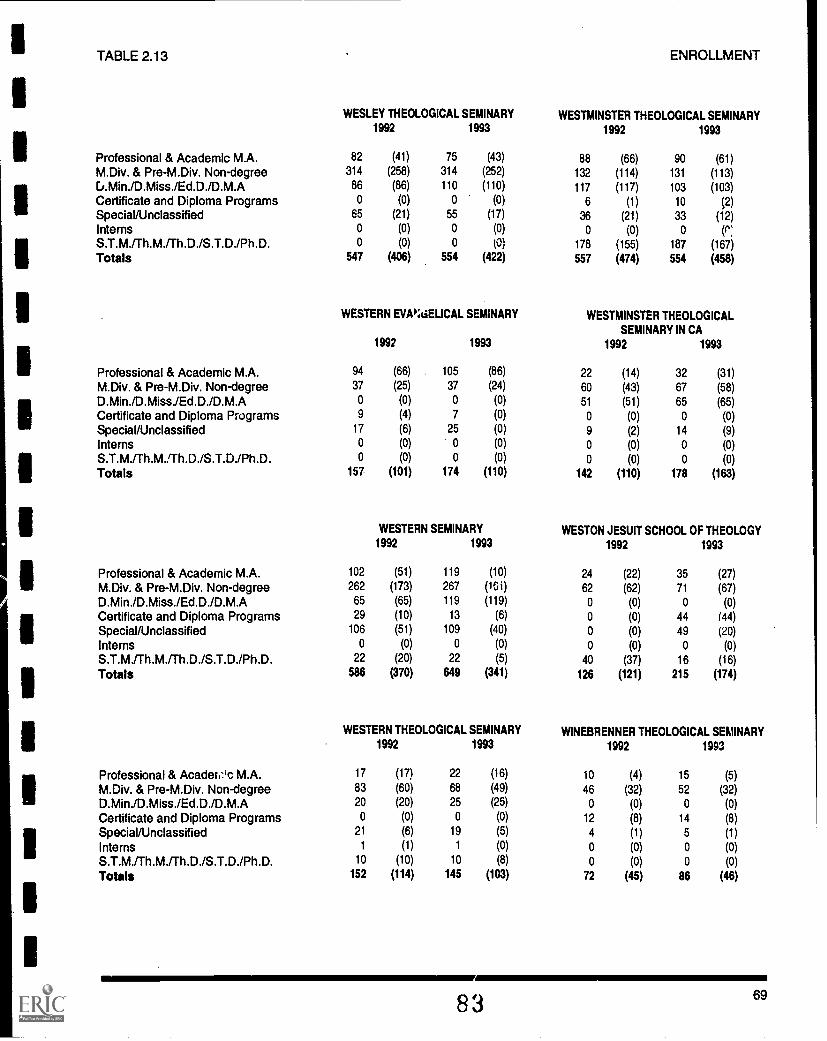
Table 2.10:Total Enrollment by DegreeTypesHC and FTE
The statistics for this table and Table2.12 are taken from the followingcategories of the Enrollment Form forthe fall of 1991 and 1992.
Professional & Academic M.A.Programs includes all the M.A.programs listed on the EF-1, page 1.M.Div. and Pre-M.Div., Non-Degree
includes all enrollees reported on EF-1, page 2. Professional DoctoralPrograms includes all enrolleesreported on EF-1, page 3, columns Athrough H.Certificate and Diploma Programs
includes all enrollees reported on EF-1, page 4, columns A and B.Special/Unclassified includes all
enrollees reported on EF-1, page 4,columns C and D. Interns includes allthose reported on EF-1, page 4,columns E and F.Advanced Research and Academic
Degrees includes all those reported onEF-1, page 5, columns A-F.
Graph 2.10-1
Table 2.10 reports total enrollment both by Head Count and Full-Time Equivalency
for 1992 and 1993 by seven principal categories. Graphs 2.10-1, 2.10-2, and 2.10-
3 pictorially display the same information. For an earlier discussion, see Tables
2.04A and 2.04B.
Graph 2.10-1 clearly shows that the ratio between HC and F I E is very stable. While
schools continue to be concerned about part-time students' impact on totalresources, the numbers are not proportionally increasing.
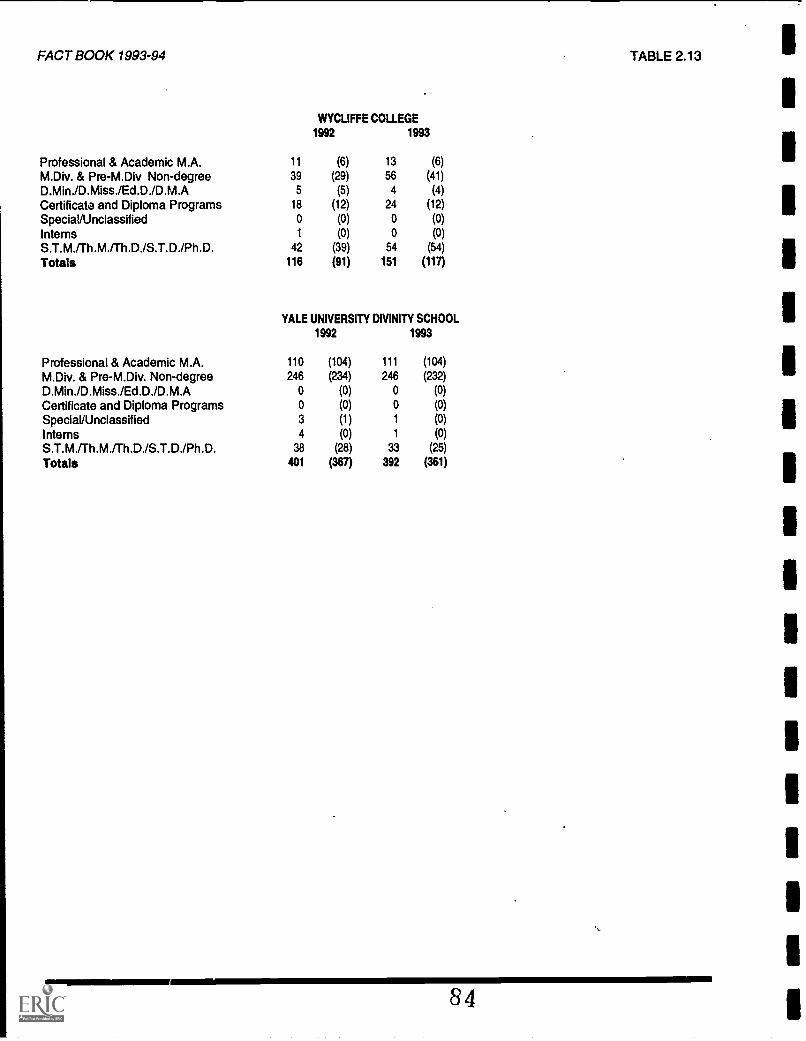
Professional & Academic M.A.M.Div. & Pre-M.Div. Non-degreeD.Min./D.Miss./Ed.D./D.M.ACertificate and Diploma ProgramsSpecial/UnclassifiedInternsS.T.M./Th.M./Th.D./S.T.D./Ph.D.Totals
Professional & Academic M.A.M.Div. & Pre-M.Div. Non-degreeD.Min./D.Miss./Ed.D./D.M.ACertificate and Diploma ProgramsSpecial/UnclassifiedInternsS.T.M./Th.M./Th.D./S.T.D./Ph.D.Totals
Professional & Academic M.A.M.Div. & Pre-M.Div. Non-degreeD.Min./D.Miss./Ed.D./D.M.ACertificate and Diploma ProgramsSpecial/UnclassifiedInternsS.T.M./Th.M./Th.D./S.T.D./Ph.D.Totals
Professional & Academic M.A.M.Div. & Pre-M.Div. Non-degreeD.Min./D.Miss./Ed.D./D.M.ACertificate and Diploma ProgramsSpecial/UnclassifiedInternsS.T.M./Th.M./Th.D./S.T.D./Ph.D.Totals
DOMINICAN HOUSE OF STUDIES
1992 1993
1 (0) 0 (0)
24 (20) 17 (17)
0 (0) 0 (0)
0 (0) 0 (0)
0 (0) 0 (0)
0 (0) 0 (0)
12 (10) 13 (13)
37 (30) 30 (30)
DOMINICAN SCHOOL OF PHILOSOPHY
AND THEOLOGY
1992 1993
28 (21) 25 (21)
21 (20) 23 (23)
0 (0) 0 (0)
0 (0) 1 (0)
24 (14) 26 (15)
0 (0) 0 (0)
0 (0) 0 (0)
73 (55) 75 (59)
DOMINICAN STUDY CENTER OF BAYAMON
CENTRAL UNIVERSITY
1992 1993
4635006
00
87
(46)
(35)
(0)
(0)
(6)
(0)
(0)
(87)
4341
00400
88
(43)
(41)
(0)
(0)
(4)
(0)
(0)
(88)
DREW UNIVERSITY
THEOLOGICAL SCHOOL
1992 1993
34 (24) 38 (20)
174 (138) 194 (180)
88 (88) 190 (190)
33 (2) 0 (0)
12 (5) 23 (9)
0 (0) 0 (0)
110 (105) 195 (189)
451 (362) 640 (588)
ENROLLMENT
DUKE UNIVERSITY DIVINITY SCHOOL
1992 1993
74 (61) 61 (50)
351 (305) 362 (319)
0 (0) 0 (0)
0 (0) 0 (0)
13 (6) 15 (8)
0 (0) 0 (0)
130 (117) 135 (122)
568 (489) 573 (499)
EARLHAM SCHOOL OF RELIGION
1992 1993
2 (1) 4 (4)
47 (35) 40 (36)
0 (0) 0 (0)
0 (0) 0 (0)
0 (0) 10 (6)
0 (0) 0 (0)
0 (0) 0 (0)
49 (36) 54 (46)
EASTERN BAPTIST THEOLOGICAL
SEMINARY
1992 1993
57 (7) 57 (32)
195 (24) 195 (142)
58 (58) 59 (59)
57 (7) 0 (0)
0 (0) 29 (11)
0 (0) 0 (0)
0 (0) 0 (0)
367 (96) 340 (244)
EASTERN MENNONITE SEMINARY
1992 1993
32 (20) 35 (22)
49 (38) 52 (42)
0 (0) 0 (0)
14 (9) 13 (9)
8 (1) 12 (4)
0 (0) 0 (0)
0 (0) 0 (0)
103 (68) 112 (77)
49
63
FACT BOOK 1993-94 TABLE 2.13
EDEN THEOLOGICAL SEMINARY = EPISCOPAL DIVINITY SCHOOL
1992 1993 1992 1993
Professional & Academic M.A. 22 (11) 28 (12) 28 (24) 25 (20)
Professional & Academic M.A.M.Div. & Pre-M.Div. Non-degreeD.Min./D.Miss./Ed.D./D.M.ACertificate and Diploma ProgramsSpecial/UnclassifiedInternsS.T.M./Th.M./Th.D./S.T.D./Ph.D.Totals
Professional & Academic M.A.M.Div. & Pre-M.Div. Non-degreeD.Min./D.Miss./Ed.D./D.M.ACertificate and Diploma ProgramsSpecial/UnclassifiedInternsS.T.M./Th.M./Th.D./S.T.D./Ph.D.Totals
1992 1993
24 (20) 38 (35)
123 (123) 134 (146)
55 (55) 65 (65)
0 (0) 0 (0)
15 (5) 0 (0)
3 (3) 2 (2)
4 (3) 4 (3)
224 (209) 243 (2511
LEXINGTON THEOLOGICAL SEMINARY
1992 1993
LOYOLA UNIVERSITY CHICAGOINSTITUTE OF PASTORAL STUDIES
1992 1993
29 (14) 31 (12) 185 (105) 180 (121)
82 (75) 85 (77) 21 (12) 31 (23)
44 (44) 42 (42) 0 (0) 0 (0)
0 (0) 0 (0) 0 (0) 0 (0)
11 (5) 23 (9) 50 (19) 52 (0)
0 (0) 0 (0) 0 (0) 0 (0)
0 (0) 0 (0) 0 (0) 0 (0)
166 (138) 181 (140) 256 (136) 263 (144)
LIBERTY BAPTIST LUTHER NORTHWESTERN
THEOLOGICAL SEMINARY THEOLOGICAL SEMINARY
1992 1993 1992 1993
85 (54) 132 (73) 67 (45) 89 (69)
57 (41) 56 (37) 418 (361) 416 (339)
19 (19) 16 (16) 111 (111) 124 (124)
57 (57) 0 (0) 0 (0) 0 (0)
0 (0) 4 (1) 33 (0) 50 (29)
0 (0) 0 (0) 102 (102) 94 (94)
7 (5) 8 (7) 52 (41) 46 (38)
225 (176) 216 (134) 783 (660) 819 (693)
5468
TABLE 2.13 ENROLLMENT
LUTHERAN SCHOOL OF THEOLOGY AT LUTHERAN THEOLOGICAL
CHICAGO SOUTHERN SEMINARY
1992 1993 1992 1993
Professional & Academic M.A. 28 (22) 24 (19) 13 (9) 18 (12)
Professional & Academic M.A.M.Div. & Pre-M.Div. Non-degreeD.Min./D.Miss./Ed.D./D.M.ACertificate and Diploma ProgramsSpecial/UnclassifiedInternsS.T.M./Th.M./Th.D./S.T.D./Ph.D.Totals
Professional & Academic M.A.M.Div. & Pre-M.Div. Non-degreeD.Min./D.Miss./Ed.D./D.M.ACertificate and Diploma ProgramsSpecial/UnclassifiedInternsS.T.M./Th.M./Th.D./S.T.D./Ph.D.Totals
Professional & Academic M.A.M.Div. & Pre-M.Div. Non-degreeD.Min./D.Miss./Ed.D./D.M.ACertificate and Diploma ProgramsSpecial/UnclassifiedInternsS.T.M./Th.M./Th.D./S.T.D./Ph.D.Totals
Professional & Academic M.A.M.Div. & Pre-M.Div. Non-degreeD.Min./D.Miss./Ed.D./D.M.ACertificate and Diploma ProgramsSpecial/UnclassifiedInternsS.T.M./Th.M./Th.D./S.T.D./Ph.D.Totals
TABLE 2.13
NEWMAN THEOLOGICAL COLLEGE NOTRE DAME SEMINARY1992 1993 1992 1993
Professional & Academic M.A.M.Div. & Pre-M.Div. Non-degreeD.MinJD.Miss./Ed.DID.M.ACertificate and Diploma ProgramsSpecial/UnclassifiedInternsS.T.M./Th.M./Th.D./S.T.D./Ph.D.Totals
Professional & Academic M.A.M.Div. & Pre-M.Div. Non-degreeD.Min./D.Miss./Ed.D./D.M.ACertificate and Diploma ProgramsSpecial/UnclassifiedInternsS.T.M./Th.M./Th.D./S.T.D./Ph.D.Totals
ST. MEINRAD SCHOOL OF THEOLOGY
1992 1993
ST. PETER'S SEMINARY1992 1993
52 (45) 50 (27) 0 (0) 0 (0)
89 (89) 81 (81) 54 (57) 61 (21)
0 (0) 0 (0) 0 (0) 0 (0)
0 (0) 8 (6) 0 (0) 0 (0)
10 (0) 2 (2) 0 (0) 0 (0)
8 (8) 9 (9) 16 (16) 9 (9)
0 (0) 0 (0) 0 (0) 0 (0)
159 (142) 150 (125) 70 (73) 70 (30)
ST. PATRICK'S SEMINARY ST. STEPHEN'S COLLEGE
1992 1993 1992 1993
8 (8) 16 (16) 67 (54) 80 (64)
57 (57) 37 (37) 0 (0) 0 (0)
0 (0) 0 (0) 62 (62) 68 (68)
0 (0) 0 (0) 12 (7) 32 (24)
6 (5) 5 (5) 66 (66) 0 (0)
12 (12) 5 (5) C, (0) 0 (0)
0 (0) 0 (0) 4 (0) 2 (1)
83 (82) 63 (63) 211 (189) 182 (157)
SAINT PAUL SCHOOL OF THEOLOGY ST. THOMAS THEOLOGICAL SEMINARY
Professional & Academic M.A.M.Div. & Pre-M.Div. Non-degreeD.Min./D.Miss./Ed.D./D.M.ACertificate and Diploma ProgramsSpecial/UnclassifiedInternsS.T.M./Th.M./Th.D./S.T.D./Ph.D.Totals
ST. VLADIMIR'S ORTHODOX
THEOLOGICAL SEMINARY1992 1993
24 (22) 14 (11)
38 (29) 39 (33)8 (8) 12 (12)
0 (0) 0 (0)
11 (3) 7 (1)
0 (0) 0 (0)
11 (6) 16 (11)
92 (68) 88 (68)
SEATTLE UNIVERSITY INSTITUTE
FOR THEOLOGICAL STUDIES
1992 1993
121 (78) 154 (89)15 (7) 13 (4)
0 (0) 0 (0)
0 (0) 12 (5)
0 (0) 0 (0)
0 (0) 0 (0)
0 (0) 0 (0)
136 (85) 179 (98)
S.S. CYRIL & METHODIUS SEMINARY SEMINARY OF THE EAST1992 1993 1992 1993
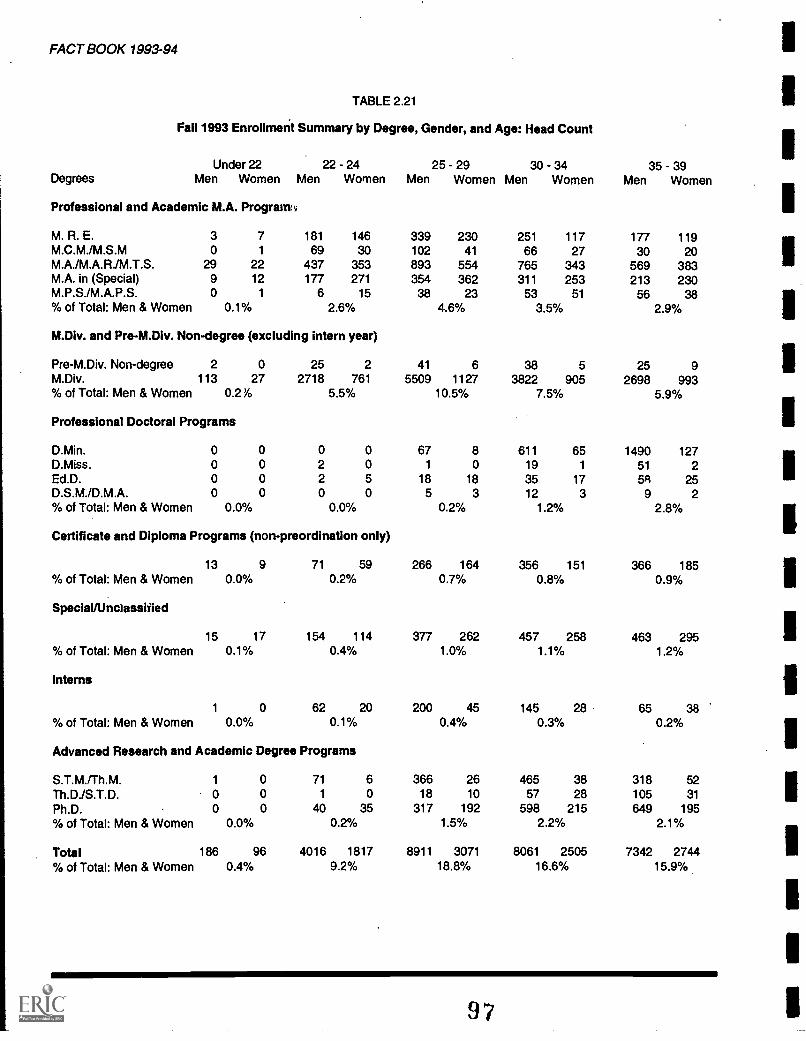
Table 2.20A:Enrollment Summary byDegree, Gender, and RaceHead Count
For definitions of racial/ethnicidentifications, please see the Introduc-tion to the Fact Book.
Although theological schools have made commitments to diversify their student
bodies, overall racial/ethnic enrollment lags behind the general population which
students are called to serve. An institution's location, mission statement, particu-
lar programs, and minority representation on the faculty all contribute to aperception c f whether or not a school is open to welcoming racial/ethnic students.
Statistics do indicate much greater progress in the recruitment and integration of
women students into the life of institutions.
QUESTIONS TO CONSIDER
1. What are the recent trends in enrollment by race and gender at your
institution?
2. Are changes based on conscious efforts or strategies by the institu-
tion? How well have these strategies worked?
3. Are racial/ethnic and women students concentrated in certaindegree programs? Why?
4. Do various ethnic groups present differing needs? How are these
met?
5. What specific efforts have been made to increase racial/ethnic and
women faculty and administrators?
6. What specific efforts are made to improve the experience ofseminary life for racial/ethnic and women students?
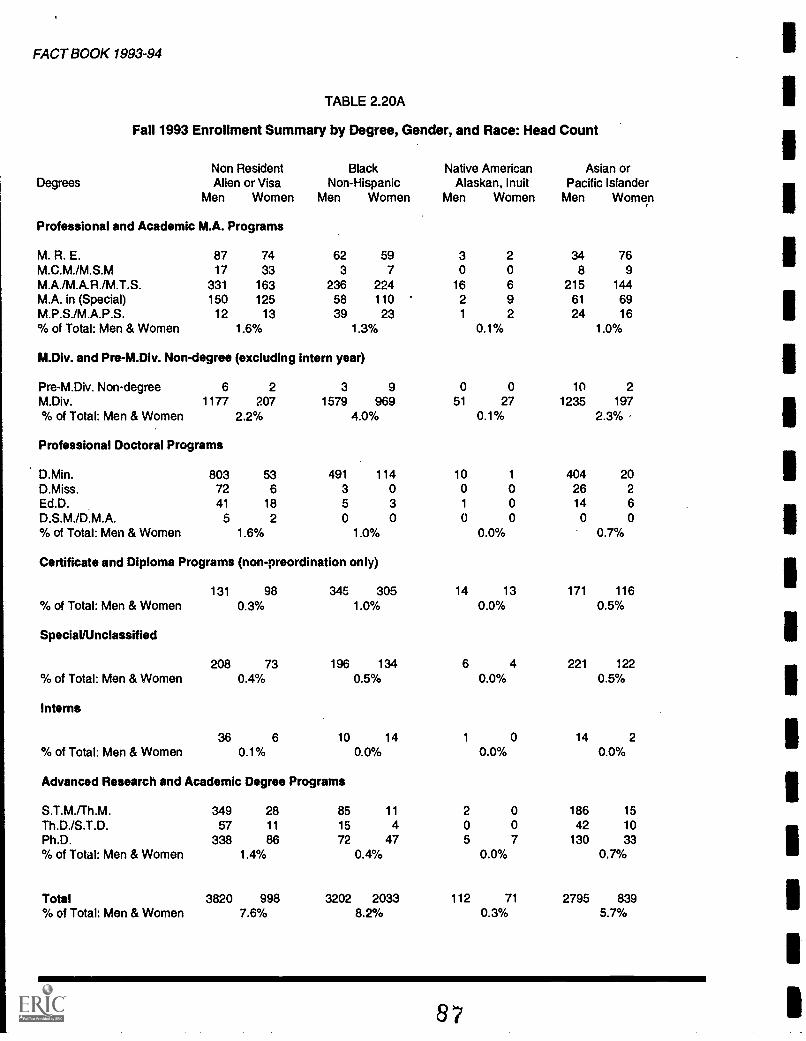
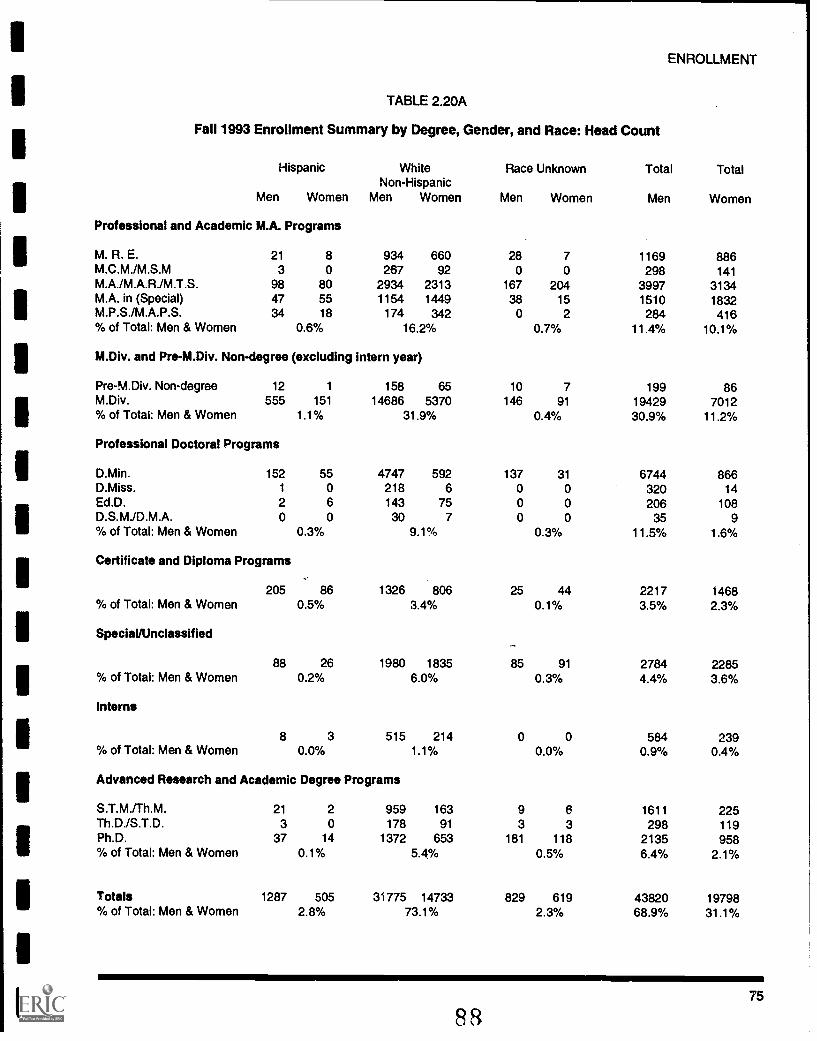
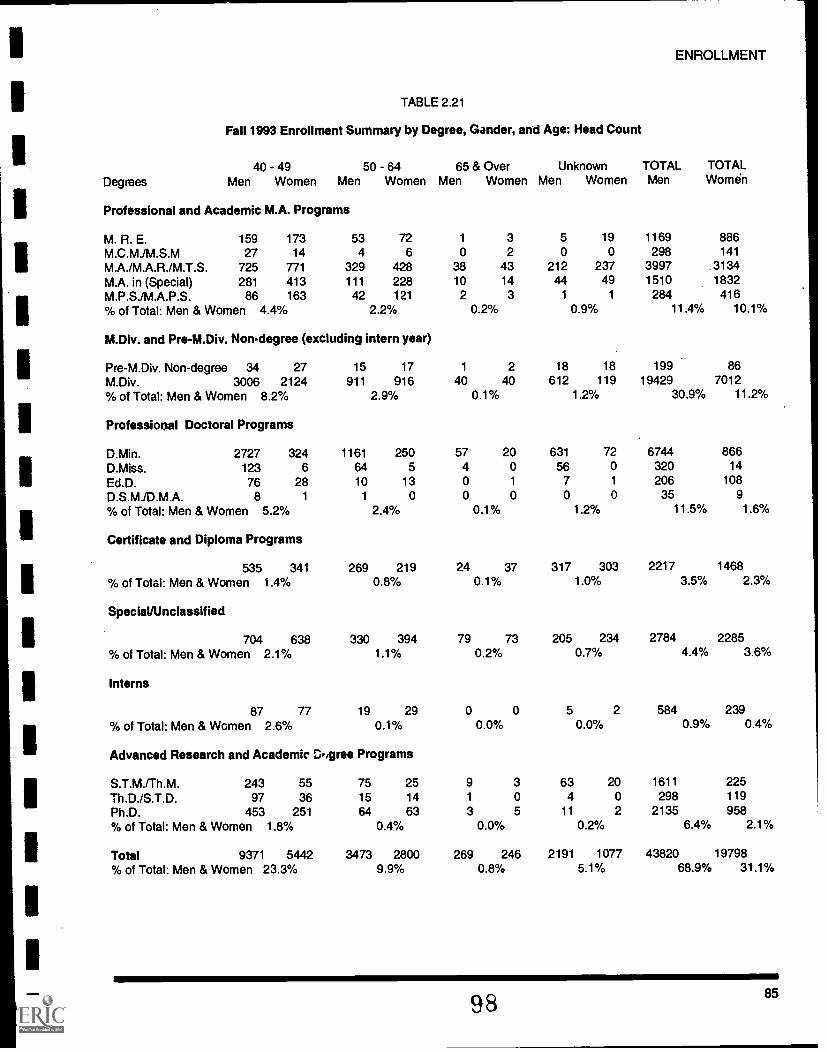
Table 2.20A presents in summary form enrollment by gender and race in all major
categories of programs and in the specific degree and nondegree programs as
reported by member schools in the ATS Annual Report Forms for fall 1993. The
data are taken from the section entitled Enrollment (EF-1) of the Annual Report
Forms. These tables present only the broader categories of degree and nondegree
programs. The revised 1988 Annual Report Forms and all later forms provide a
separate category for Non-Resident Alien or Visa students that did not exist in
earlier years. In prior years they were combined as "all others" because the
distinction was not as clearly drawn as at present. Some schools do not provide
racial breakdown of students, and therefore the category Race Unknown was added
in 1993.
72
Unknown
1448
GRAPH 2.20-1
ENROLLMENT
Non-resident Alier.
4818
Black
5235
Native American
183
Asian
3634
Hispanic
1792
1993 Enrollment Summary by Race-Head Count
8673
FACT BOOK 1993-94
TABLE 2.20A
Fall 1993 Enrollment Summary by Degree, Gender, and Race: Head Count
Non ResidentDegrees Alien or Visa
Men Women
Professional and Academic M.A. Programs
M. R. E. 87 74M.C.M./M.S.M 17 33M.A./M.A.R./M.T.S. 331 163M.A. in (Special) 150 125M.P.S./M.A.P.S. 12 13
BlackNon-Hispanic
Men Women
62 593 7
236 22458 11039 23
Native AmericanAlaskan, Inuit
Men Women
3 20 0
16 62 91 2
Asian orPacific Islander
Men Women
34 768 9
215 14461 6924 16
% of Total: Men & Women 1.6% 1.3% 0.1% 1.0%
M.Div. and Pre-M.Div. Non-degree (excluding intern year)
Pre-M.Div. Non-degree 6 2 3 9 0 0 10 2M.Div. 1177 207 1579 969 51 27 1235 197% of Total: Men & Women 2.2% 4.0% 0.1% 2.3%
Totals 1287 505 31775 14733 829 619 43820 19798% of Total: Men & Women 2.8% 73.1% 2.3% 68.9% 31.1%
75
88
FACT BOOK 1993-94
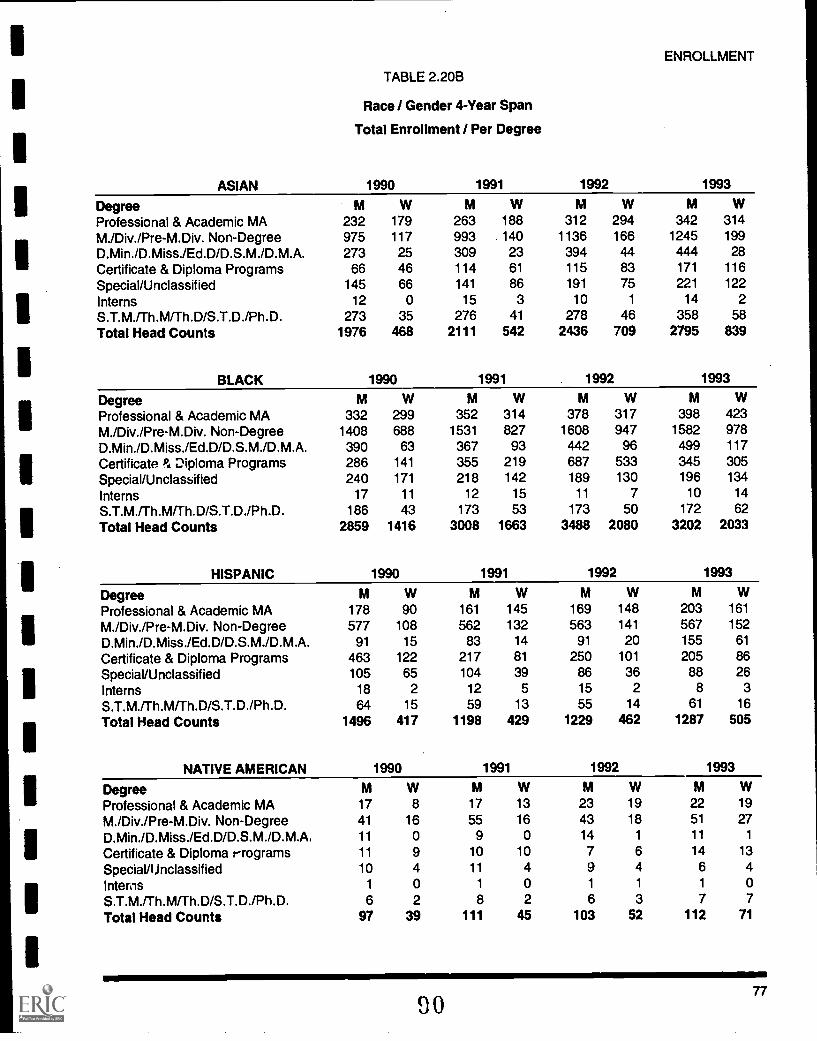
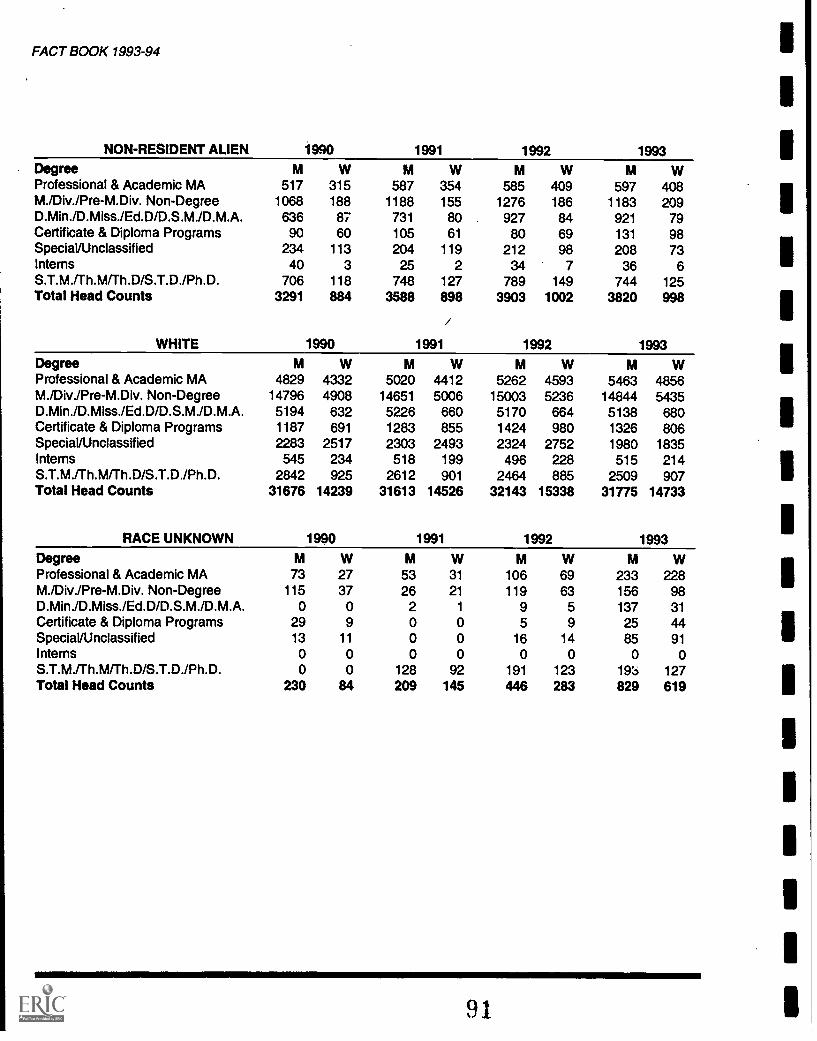
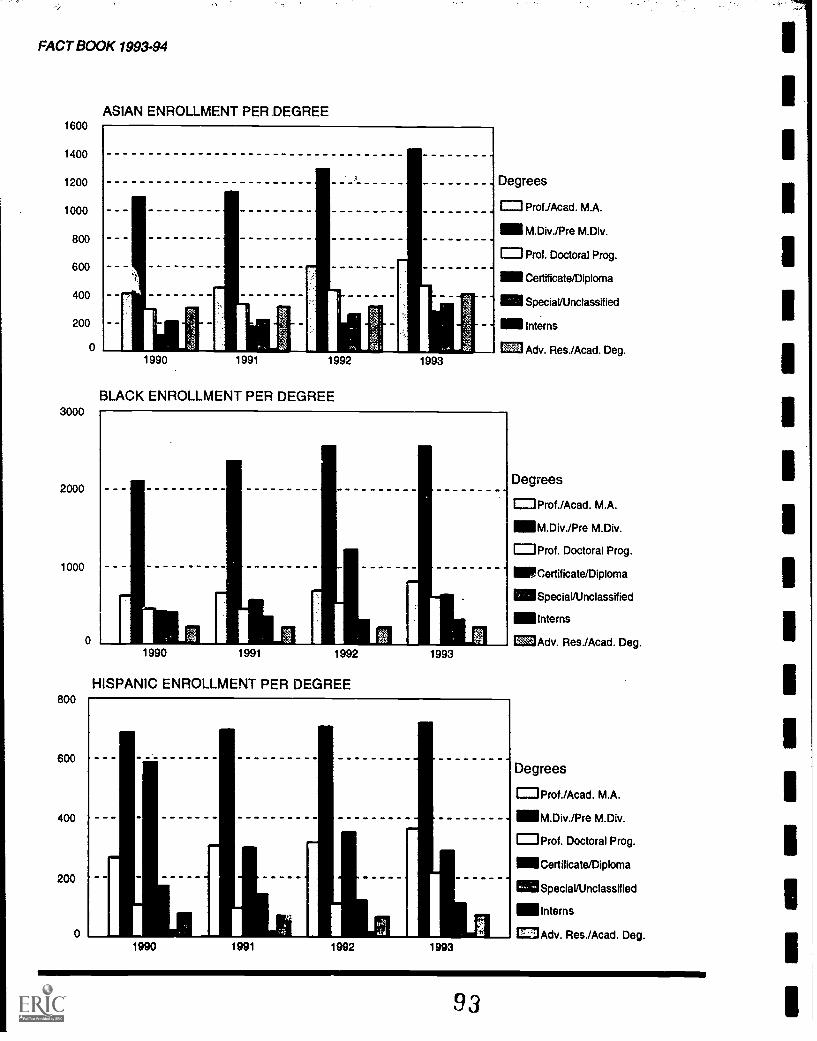
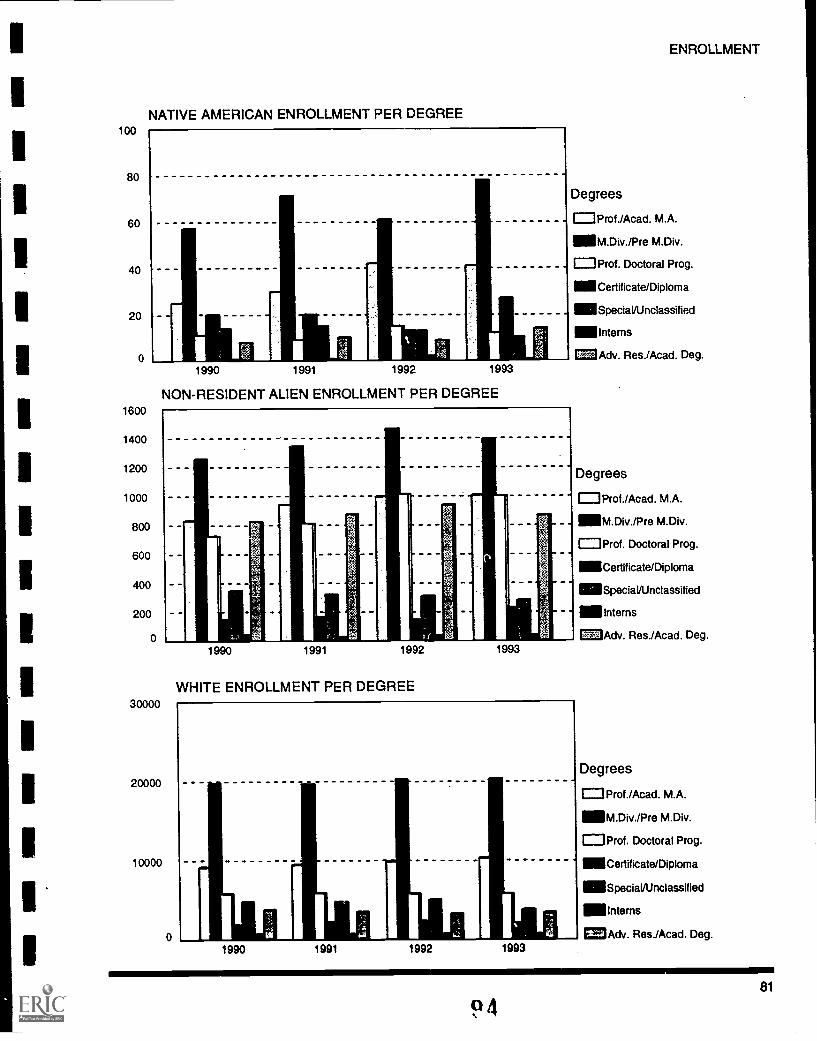
Table 2.20B:FourYear EnrollmentSummary by Degreefor UnderrepresentedConstituencies
Information for these tables is found onthe ATS Annual Report Forms, EF-1through EF-6. Graphs depicting thisinformation are found on the followingpages.
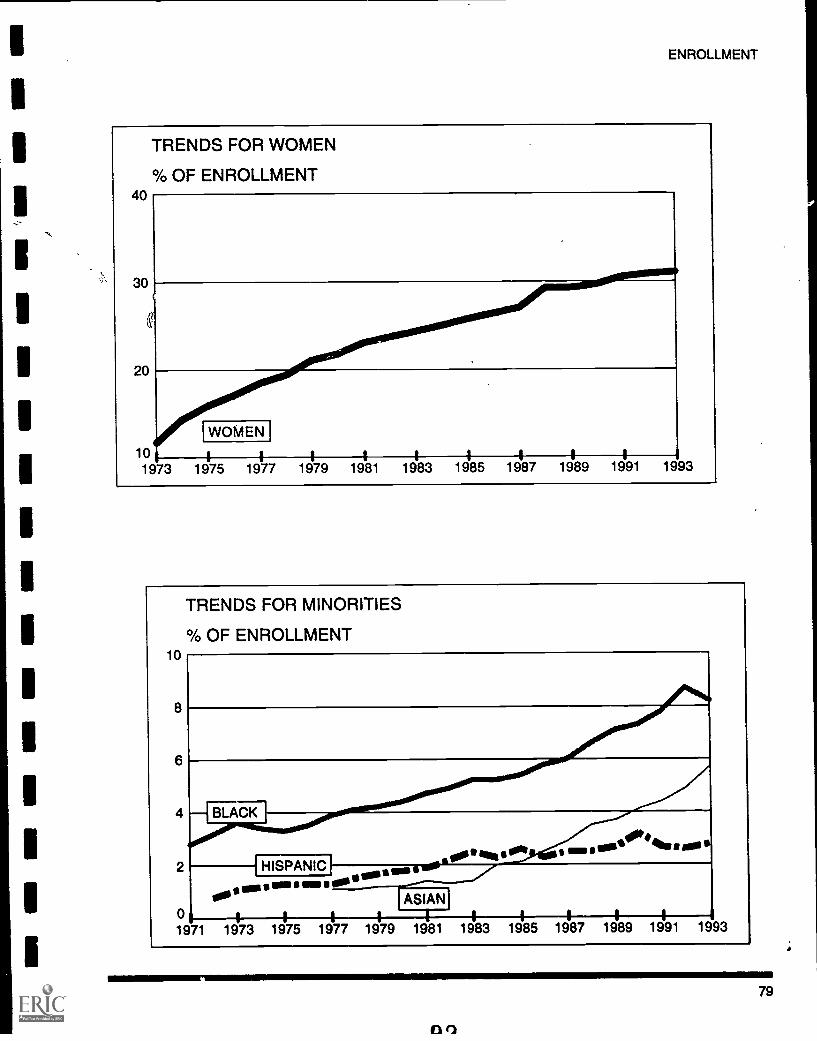
There is continued interest in the status of underrepresented constituencies within
ATS schools and within various degree programs. The following tables and graphs
provide extensive breakdowns for analysis. Please refer to the Introduction to the
Fact Book for detailed information regarding changes in the collection of data on
the Annual Report Forms.
In comparing this data with that of 1992, there are only two areas of signifidant
change. Two certificate programs designed for African-American students have
been discontinued resulting in a loss of 570 students. However, 237 additional
students enrolled in other degree programs reducing the total loss to 333 students.
Over the years enrollment in certificate programs is the least consistent and can
dramatically affect the total number count of racial/ethnic groupings when their
total numbers are already low. It is therefore important to note whether or not there
have been increases in other degree programs even if there is an overall decrease.
The increase in students in regular degree programs is a sign of encouragement and
can be observed among Hispanic students as well. The largest increase, 13.5%, is
that of Asian students whose enrollment distribution is across the range of ATS
schools. The large decrease of 973 enrollees is that of white students. This decrease
can be partially explained by tl.. increase from 775 reported in 1992 to 1448 in 1993
of those schools listing race unx Iwn. Even with that taken, into account, there
remains a slight decline proporticn;111} in the number of white students, most
notably among wori.en. In 1992 women made up 31.2% of the student body; in
1993, 31.1%.
76 89
ENROLLMENT
TABLE 2.20B
Race / Gender 4-Year Span
Total Enrollment / Per Degree
ASIAN 1990 1991 1992 1993
Degree M W M W M W M WProfessional & Academic MA 232 179 263 188 312 294 342 314
of Total: Men & Women 23.3% 9.9% 0.8% 5.1% 68.9% 31.1%
98 85
FACT BOOK 1993-94
Table 2.23:Denominational Affiliationof Current EnrollmentHC
The data are taken from the ATS 1992Annual Report Forms, from theSections on Enrollment (EF-3).
Table 2.23 reports the denominational status of enrollees in two categories. The
first is "First Professional Degrees" that includes all those who are enrolled in the
M.Div., Pre-M.Div. Non-Degree, or Intern programs. The other category, "All
Others," includes all students enrolled in other programs. The number of schools
in which students are enrolled in each category is on the left; the number of actual
students is shown to the right in each category. The last column lists the number
of unduplicated schools in which students of that denomination are enrolled.
The number of denominations listed in current editions of the ATS Fact Book is
more extensive than those listed before 1988. The expanded listing better repre-
sents the diversity of membership in the Association. The purpose of a separate
listing of those enrolled in first professional programs designed for full-time
ministry is to offer the denomination as accurate an accounting as possible of the
number enrolled from that denomination who are preparing for full-time ministry.
Students are placed in the category "other" if a school fails to identify theirenrollment by denomination.
86
98
ENROLLMENT
TABLE 2.23
Denominational Affiliation of Current Enrollment
DenominationFirst All
Professional Others Number of SchoolsSchools/Students Schools/Students Unduplicated
Advent Christian Church 3 4 5 13 6African Methodist Episcopal 50 300 52 177 71
African Methodist Episcopal Zion 18 64 19 52 28American Bapt. Churches in the USA* 72 633 80 622 96Anglican Church of Canada 20 221 38 280 39Assemblies of God 57 400 78 762 88Associate Reformed Presbyterian Church 8 35 8 27 11
Associated Gospel Churches of Canada 5 18 6 25 8Baptist Convention of Ontario and Quebec 5 78 13 81 14Baptist General Conference 31 176 33 339 44Baptist Missionary Association of America 24 58 26 91 35Baptist Union of Western Canada 4 6 11 40 11
Brethren Church (Ashland, Ohio) 3 20 8 35 8Brethren in Christ Church 10 28 10 17 16Christian Brethren (Plymouth Brethren) 9 22 11 48 14Christian Church (Disciples of Christ) 55 418 58 328 77Christian Churches and Churches of Christ 17 238 30 452 32Christian Methodist Episcopal 16 51 24 39 30Christian Reforme d Church 16 156 31 170 34Christian and Missionary Alliance 36 277 52 403 58Church of God (Anderson, Indiana) 25 95 37 133 45Church of God (Cleveland, Tennessee) 11 151 18 139 22Church of God in Christ 22 96 16 43 27Church of the Brethren 21 69 24 70 33Church of the Nazarene 34 279 52 254 61
Churches of Christ 26 108 42 223 52Churches of God, General Conference 25 60 27 63 37Conference of Congregational Christian Churches 20 39 27 70 36Conservative Baptist Association of America 14 160 23 272 25Cumberland Presbyterian Church 10 41 10 21 16Episcopal Church 77 963 109 1055 125Evangelical Church in Canada 0 0 5 8 5Evangelical Congregational Church 8 24 13 22 19Evangelical Covenant Church 23 149 33 133 36Evangelical Free Church of America 35 205 42 529 49Evangelical Lutheran Church 17 196 31 212 36Evangelical Lutheran Church in America* 52 1423 69 855 80Evangelical Lutheran Church in Canada 4 67 15 94 16Evangelical Presbyterian Church 19 83 23 177 31
Fellowship of Evangelical Baptist Churches 6 65 13 74 14
Foursquare Gospel Church 15 60 18 97 23Free Methodist Church 17 85 35 113 40Friends, Religious Society of 20 75 36 78 41
General Baptist State Convention, N.C. 3 35 5 20 7
10087
FACT BOOK 1993-94
DenominationFirst All
Professional Others Number of SchoolsSchools/Students Schools/Students Unduplicated
General Conference Mennonite Church 15 63 27 103 32Greek Orthodox Archdiocese in N./S. America 5 60 18 32 20Independent Baptist 47 356 49 565 59Independent Methodist 11 39 13 55 18Interdenominational 0 0 0 0 0Jewish 1 2 32 99 33Lutheran Church-Canada 6 48 17 44 20The Lutheran Church-Missouri Synod 20 716 45 412 53Mennonite Brethren Church in N.A. 9 56 15 110 17Mennonite Church 18 72 34 142 39Mennonite, Other 17 30 17 65 26Missionary Church in Canada 1 9 4 9 4Moravian Church in America 8 27 18 26 -22Muslim 1 1 5 14 6National Baptist Convention 46 288 49 167 61New Jerusalem, General Church of 1 1 1 1 2Nondenominational 68 832 78 1611 89North American Baptist Conference 9 47 21 108 21Orthodox Church in America 2 33 11 30 11Orthodox Presbyterian 9 29 10 45 12Orthodox, Other 8 28 25 58 29Other 132 1889 169 7156 174Pentecostal Assemblies of Canada 12 61 15 91 17Presbyterian Church (U.S.A.)* 82 1867 96 1898 103Presbyterian Church in America 36 481 51 596 57Presbyterian Church in Canada 14 148 28 125 33Reformed Church in America 28 151 39 155 49Reformed Church in Canada 2 14 6 16 6Reformed Presbyterian 3 9 7 12 9Roman Catholic, Canada 17 268 32 627 36Roman Catholic, Other 20 204 26 282 33Roman Catholic, United States 87 2569 118 3714 126Salvation Army 13 17 23 64 27Seventh Day Baptist General Conference 2 2 0 0 2Seventh-day Adventist 20 303 35 301 45Southern Baptist Convention* 71 4100 81 5097 91Swedenborgian Church, General Convention 0 0 1 15 1
Union d'Eglises Baptistes Francaises au Cana 0 0 1 1 1
Unitarian Universalist 33 294 39 130 56United Baptist Convention (Atlantic Province 2 47 6 68 7United Church of Canada 20 303 30 411 36United Church of Christ 69 735 64 564 84United Methodist Church* 97 3531 111 2217 126Wesleyan Church 21 87 28 73 33Wisconsin Evangelical Lutheran Synod 1 1 4 4 4
TOTAL 209 27549 209 36069 216
*These denominations have the largest membership within their denominational family.
88
AIM
101
FACT BOOK 1993-94
Table 2.29:Total Completionsfrom Member Schools
Data are taken from the ATS AnnualReport Form - Completions (C-1).
Table 2.30:Total Completionsby Degree Type
Table 2.29 reports the number of students who have completed degree programs
and were graduated from member schools. The statistics record completions for the
"number of students reporting" for each year. The M.Div. category includes all
those graduating with this degree as well as those who received the M.Div. upon
completion of their internship. The category "others" includes all the M.A. level
programs and the other doctoral level program completions. The table shows a
slight decrease in the number of students graduating.
Table 2.30 displays two years of completion data by degree to show both the
changes in numbers as well as the percentage proportions of graduates in relation
to the whole. Again, only a slight decrease is evident.
90102
ENROLLMENT
TABLE 2.29
Total Completions from Member Schools
Year
Number
Reporting
M.Div.
Interns
Th.D, S.T.D.
& Ph.D. D.Min. Others Total
Percent
Change
1988 198 6,566 334 930 4,672 12,502 NA
1989 203 6,513 359 952 4,880 12,704 1.62%
1990 204 6,347 405 973 5,187 12,912 1.64%
1991 207 6,049 355 879 5,377 12,660 -1.95%
1992 217 5,959 446 1,113 5,568 13,086 3.36%
1993 216 6,097 426 1,118 5,407 13,048 -0.29%
TABLE 2.30
Total Completions by Degree Type
Degree Types 1992 1993 1993 total HC
Professional and Academic M.A. ProgramsHead Count 3,896 3,793
M.Div., Pre-M.Div Non-degree and InternsHead Count 6,057 6,097
Professional Doctoral ProgramsHead Count 1,184 1,210
29.1%
46.7%
9.3%
Certificate and Diploma Programs (non-preordination only)Head Count 911 995 7.6%
Advanced Research and Academic Degree ProgramsHead Count 1,038 953 7.3%
TotalsHead Count 13,086 13,048 100.0%
91
103
FACT BOOK 1993-94
Table 2.31:Comparisons of NewEnrollees and Completions
Graphs 2.31A and2.31B
Table 2.31 and Graphs 2.31A & B are introduced to show comparisons of new
enrollees and compl etions. The comparisons are not exact, in that they compare two
different groups of students from one year rather than the same group over time.
The data, however, give the reader some ability to analyze retention rates. In future
years, ATS will track these percentages over time. For 1993, the M.Div. degree
program and the certificate programs are most affected. Since certificate programs
are concentrated in a few schools and the student numbers are dramatically affected
when a program ceases to exist, more consideration should be given to reasons for
such a low retention rate (73.4%) in the M.Div. program.
QUESTIONS TO CONSIDER
1. What is your school's student retention rate? How does it compare
to your acceptance and matriculation percentages?
2. Does the percentage of completions differ by degree?
3. Do retention rates differ by race, gender, age?
4. What programs are in place to encourage completion of degrees?
5. How large a factor is indebtedness to retention rates?
92104
ENROLLMENT
TABLE 2.31
Comparisons of New Enrollees,Fall EF-1 HC, and Completions
1993 New 1993 Fall 1993Percent Ratio
Completions toCategory Enrollees Head Count Completions New Enrollees
Professional/Academic M.A. 4,580 13,667 3,793 82.8M.Div. and Interns 8,249 27,549 6,057 73.4Professional Doctorates 1,357 8,302 1,21C 89.2Advanced Research and Academic Programs 1,075 5,346 953 88.7Certificates and Diplomas 1,383 3,685 989 71.5
30000
20000
10000
100
0
Comparison of Admissions/Completions/Enrollment
Prof./Acad. MA Prof. Doctorate Certif./DiplomaM.Div./Intems Adv. Res. Acad.
Ratio - Completions to Admissions
1:=3 Completions
1.11Fall Head Count
0 Admissions
80
70Prof./Acad. MA
M.Div./InternsProf. Doctorate
Adv. Res. Acad.Certif./Diploma
105 93
Chapter IIIPersonnel Compensation
Chapter III consists of seven tables that report data on compensation for adminis-
trators and faculty. Salaries for both administrators and faculty are reported in
categories and groupings that provide opportunities for comparison by country,
accrediting status, size, denomination, and type of school.
QUESTIONS TO CONSIDER
I. How does your school's administrative staffing compare to other
schools?
2. How do positions and salaries compare?
3. Does your school have compensation percentage ratios for topadministrative positions in relation to senior faculty positions?
4. How do your school's faculty salaries compare to others by size,
denomination, and type?
5. What is the balance between tenured and non-tenured faculty at your
school?
6. Does your school have an overall strategy for faculty replacement?
Readers should keep the following in mind:
Salaries are compared on the basis of size of school, accredited or nonaccredited
status, U.S. or Canadian school, and highest degree level (M.Div./Th.M.; D.Min.;
or Ph.D./Th.D.). They are also compared on the basis of denominational groupings
provided the denomination sponsors four or more schools. Table 3.21 compares
university/college affiliated and independent/freestanding schools.
Salaries are analyzed in terms of a full contract salaryincluding contributedservices, housing where provided, pension benefits, and other benefits, chiefly
medical. Table 3.17 separates out housing so that a comparison may be made
between contract salaries that include housing and those that do not.
Introduction
Personnel Compensation informationis supplied by schools on the ATS
Annual Report Form, Salary (S-1) foradministrative and faculty salaries.
Information is taken from the forms forthe academic years 1991-92, 1992-93,and 1993-94. Detailed data is reported
for the current academic year only.
95
FACT BOOK 1993-94
Table 3.12A:Trends in TotalCompensation AveragesAccredited U.S. Schools
Data are taken from the Administrativeand Faculty Salary sections (S-1) of theATS Annual Report Forms for the fallof 1991, 1992, and 1993.
The order in which salaried positions are reported is as follows:
For administrators: Chief Executive Officers, Chief Academic Officers,
and all others in alphabetical order.
For faculty: By rank
The comparative reporting of salaries by eight major geographical regions has been
discontinued. The comparison of U.S. and Canadian salaries remains. Analysis of
prior data indicated that regional categories were not useful in establishing salary
scales.
Figures for inflation rates are based on the Consumer Price Index. Figures for the
U.S. use 1983 as the base year, while figures for Canada use 1985 as the base year.
Table 3.12A reports average compensation for administrators and faculty for U.S.
accredited schools only. Averages are for the fall of 1991, 1992, and 1993 salaries.
The inflation rate in 1991 was + 4.6 percent; in 1992, + 3.1 percent; in 1993, +3.0
percent. The numbers reporting vary greatly but those reporting indicate salary
raises were well above inflation rates.
Total compensation includes the contract salary, contributed services, housing
allowance (if any) or the rental value of housing provided, pension payments, and
other benefits such as insurance and medical coverage.
96
107
PERSONNEL COMPENSATION
TABLE 3.12A
Trends in Total Compensation Averages - U.S. Accredited Schools
Position
ADMINISTRATIVEChief Executive OfficerChief Academic DeanAdmissions OfficerAlumni OfficerChief Financial OfficerDean of StudentsDevelopment OfficerDevelopment Prof. Staff, OtherDirector of Continuing EducationDirector of Graduate StudiesDirector of Student ServicesD. Min. DirectorExecutive Vice PresidentField Education DirectorFormation DirectorInformation Systems ManagerHead Librarian-Admin.Librarian Prof. Staff OtherRecruitment OfficerRegistrarVice President Administration
Table 3.12B:Trends in TotalCompensation AveragesAccredited CanadianSchools
Table 3.12B reports average compensation for administrators and faculty for
Canadian accredited schools only. Averages are for the fall of 1991, 1992, and 1993
salaries. The inflation rate in Canada as of July 1,1991 was + 6.3 percent, as of July
1, 1992, + 1.3 percent; as of July 1, 1993, + 1.6 percent.
This table offers similar information to Table 3.I2A, but can only be compared
taking into account the exchange rates for the time periods compared. Theconversion rate in 1991 was $0.8753; in 1992, $0.8360; and in 1993, $0.7800.
Perhaps because of the small number of schools reporting, the administrative
salaries do not show any consistent pattern of increase; in fact, there are indications
of decreases even when the number of schools is held constant. Faculty salaries do
show increases at least equal to the inflation rate but salaries remain below U.S.
schools when converted to U.S. dollars.
98
109
PERSONNEL COMPENSATION
I
1
TABLE 3.12B
Trends in Total Compensation Averages - Canadian Accredited Schools
Position
ADMINISTRATIVEChief Executive OfficerChief Academic OfficerAdmissions OfficerAlumni OfficerChief Financial OfficerDean of StudentsDevelopment OfficerDevelopment Prof. Staff, OtherDirector of Continuing EducationDirector of Graduate StudiesDirector of Student ServicesD. Min. DirectorExecutive Vice PresidentField Education DirectorFormation DirectorInformation Systems ManagerHead Librarian-Admin.Librarian Prof. Staff OtherRecruitment OfficerRegistrarVice President Administration
Table 3.13:Trends in TotalCompensation AveragesAll Nonaccredited Schoolsin U.S. Dollars
Table 3.13 reports compensation averages for all nonaccredited (associate and
candidate) schools. Canadian and U.S. schools are grouped together in this table
because of the relatively small number of schools whose reports constitute the data
base. Canadian dollars have been converted to U.S. dollars at the rate as of July 1
of each of the reporting years: for 1991, $0.8753 US; for 1992, $0.8360; and for
1993, $0.7800.
100
PERSONNEL COMPENSATION
TABLE 3.13
Trends in Total Compensation Averages - All Nonaccredited Schools - U.S. Dollars
Position
ADMINISTRATIVEChief Executive OffrcerChief Academic OfficerAdmissions OfficerAlumni OfficerChief Financial OfficerDean of StudentsDevelopment OfficerDevelopment Prof. Staff, OtherDirector of Continuing EducationDirector of Graduate StudiesDirector of Student ServicesD. Min. DirectorExecutive Vice PresidentField Education DirectorFormation DirectorInformation Systems ManagerHead Librarian-Admin.Librarian Prof. Staff OtherRecruitment OfficerRegistrar .
Table 3.17:Compensation With andWithout Housing Benefits,Salaries and Other BenefitsAll Schools in U.S.Dollars
Statistics are calculated in U.S. dollarswith Canadian dollars converted toU.S. dollars at the rate of $ 0.7800 US.
Table 3.17 recognizes the variety of salary patterns for the academic year in member
schools, some of which include housing benefits and others that do not. The total
salary as reported is the sum of several components. The first is that of contract
salary which, as reported here, includes contributed services, if any. Contributed
services are an equivalent dollar value calculated for services rendered by a person
to a school for which no monetary reimbursement is accepted. They may constitute
a portion or all of the equivalent contract salary that would normally be paid for a
given position. Housing includes a housing allowance or the rental value of housing
provided. This is not the pastor's nonreportable tax reduction for housing. The
caption "Average Benefits" reports separately the school's contribution to pension,
and then other benefits that include life insurance, medical coverage, autofurnished by the institution, etc. Each category of the components of the total salary
reports the average for the number of schools reporting in that category (which is
also listed).
102
113
PERSONNEL COMPENSATION
TABLE 3.17
Compensation with and without Housing Benefits, Salaries, and Other BenefitsAll Schools In U.S. Dollars
Table 3.18 reports compensation comparisons in terms of contract salary including
contributed services, contract salary plus housing, and additional benefits paid by
the school. It also details the average and median contract salary, the total average
salary, and the 25th percentile, median, and 75th percentile of the total salary where
median stands for the point at which 50 percent of schools are below that point and
50 percent above. No salary is reported if there is only one person reported in a
category. If only two or three are reported, the percentile distribution and median
are not reported in order to protect the privacy of individual salaries.
The categories that are used for comparison are those most commonly used by
schools for planning purposes. They include a distribution: (a) into six groups by
size of school, based on reported FTE enrollment; (b) by the accredited ornonaccredited status of the school (nonaccredited includes associate and candidate
members); (c) by country, i.e., Canada or U.S.; (d) highest degree offered in the
following categories: M.Div. and Advanced Academic Degrees, Professional
Doctoral Degrees, and Research Doctoral Degrees. Tables 3.19 and 3.21 with
comparisons by denominational groupings and by nonuniversity affiliation comple-
ment the present table by offering additional bases for comparison.
The categories of Highest Degree Offered include the following degrees:
Table 3.19 complements Table 3.18 in that it again reports compensation for
administrators and for faculty for comparison purposes, but now based on the
denominational affiliation of the school.
Only denominations with four or more schools are listed. There are 12 groupings:
2 for Canada and 10 for the U.S. Because the table distinguishes U.S. from
Canadian denominational groupings, Canadian dollars are reported and have not
been converted. U.S. schools declaring themselves as nondenominational or
interdenominational constitute a distinct U.S. grouping.
No salary is reported if there is only one person reported in a given category. If only
two or three are reported, the percentile distribution and the median are not reported
in order to protect the privacy of individual salaries.
Reported in Canadian Dollars:
RCCAN-Roman Catholic, CanadaUCCCAN-United Church of Canada
Reported in U.S. Dollars:
ABC-American Baptist Churches (USA)*SBC-Southern Baptist Convention*CC(DC)-Christian Churches and Churches of ChristEC-Episcopal ChurchELCA-Evangelical Lutheran Church in America*UMeth-United Methodist Church*PC(USA)-Presbyterian Church (USA)*RCUSA-Roman CatholicUCC-United Church of ChristINTERDEN-Inter- and Nondenominational
*Indicates the largest denomination in terms of number of members within theparticular denominational family.
PERSONNEL COMPENSATION
Table 3.19:Compensation Comparisons
by Denomination ofSchoolGroups with Four
or More Schools
Information regarding country anddenominational affiliation is takenfrom the ATS school master file asreported by the schools themselves.
Statistics are calculated with Canadiandollars converted to U.S. dollars at the
rate of $0.7800 US.
128 119
FACT BOOK 1993-94
TABLE 3.19
Compensation Comparison by Denomination of School(only includes groups with four or more schools)
Reporting Salary Value Benefits Payments Services & Benefits
1993 32 13 53,872 1,554 3,590 2,445 5,047 66,508
1992 32 10 47,964 1,982 3,638 3,990 2,167 59,471
1991 30 10 45,544 1,982 5,357 2,409 4,449 59,741
1990 30 4 41,854 0 2,260 0 3,503 47,617
1989 29 6 43,306 1,380 3,976 2,490 3,062 44,253
Full-Time Faculty Salary by Gender
Canadian Schools
1990 1991 1992
1111111011
Male Faculty411111111
1993Female Faculty
145137
FACT BOOK 1993-94
Table 3.23:Distribution of FullProfessor Compensation byGenderAll U.S. Schools
Table 3.23 breaks down salary by gender for full professors in all U.S. Schools.
Women's salaries have been consistently below that of their male col leagues but
have increased approximately at the same rate. What is of more interest is the 87%
increase in the number of women achieving the rank of full professor in four years.The number of men in the rank of full professor has declined reflecting retirement
statistics of white males. Their positions are most often filled by junior faculty.
138
146
PERSONNEL COMPENSATION
TABLE 3.23
Average Full-Time Professor Total Salary and Benefits by Gender
U.S. Schools - In U.S. Dollars
Male Professors - Averages# Schools # RecordsReporting
ContractSalary
HousingValue
AddedBenefits
Pension Contributed Total SalaryPayments Services & Benefits
University $9,295 $6,338 46.7%Independent $6,965 $5,703 22.1%
. 156 149
/
Table 4.08 reports both revenue sources and expenditures per FTE student for all
students attending ATS member schools for a four-year period. As revenue
declined in 1993 so did expenditures. There are three points worth noting:
Each source of revenue and each line item for expenditures is reported
with the average amount for the number of schools reporting a non-
zero amount for that line. The number of schools reporting is clearly
indicated, and varies from year to year.
Please note that the total per student revenue and the subtotal per
student educational and general expenditure, together with the total
per student expenditure, are likewise based on the number of schools
reporting. If the average amount for each line item were based on the
total 219 schools reporting, the amount would obviously be less.
Revenue and expenditures are recorded in U.S. dollars. Canadian
dollars have been converted to U.S. dollars using the exchange rate
as of July 1 of each year. For 1990, $0.8645; for 1991, $0.8753; for
1992, $0.8360; for 1993, $0.7800.
FINANCES
Table 4.08:Revenue and Expenditures
Per FTE Student
Data are based on the fall 1993 ATSAnnual Report Form,
Finance (F-1). Total Revenue:F-1, Part A, Line 9
Subtotal E & G Expenditure:F-1, Part B, Line 14Total Expenditures:F-1, Part B, Line 18
for the years 1990-1993.
Most comparisons of per-studentcosts are based on the FTE costs of
educational and general expenditures.
157151
FACT BOOK 1993-94
TABLE 4.08
Changes in Financial Data Per Full-Time Equivalent (FTE) Student (U.S. Dollars)
Year financial form sent in : 1990Number of
Schools Reporting AverageNon-Zero Amount Amount
1991Number of
Schools ReportingNon-Zero Amount
AverageAmount
REVENUETuition and Fees 200 $3,729 205 $3,902Govt. Grants, Contracts, and
Appropriations 60 $950 63 $1,052Gifts and Grants from Religious Org. 172 $3,535 179 $3,973Gifts and Grants from Individuals 192 $3,467 193 $3,621Value of Contributed Services 51 $2,477 53 $2,480Endowment/Investment Income 185 $4,065 187 $3,960Auxiliary/Ancillary Enterprises 161 $2,425 169 $2,527Other Sources 187 $928 192 $1,168
Total Revenue 200 $17,594 205 $18,533
EXPENDITURESEducation and General:
Instruction and Net Academic Support 200 $6,210 205 $6,357Research 33 $581 29 $794Public Service 48 $433 49 $374Library 185 $1,325 193 $1,357Student Services 160 $622 170 $748Admissions 121 $531 129 $511Inst. Support/Admin. & General 191 $4,034 199 $4,308Op. & Maintenance of Plant 192 $2,013 199 $2,167Scholarships and Fellowships 171 $1,737 178 $1,798Mandatory Transfers 55 $601 60 $974
Sub Total: Education and General 200 $15.895 205 $16,886Auxiliary/Ancillary Enterprises 157 $2,216 160 $2,370
Total Expenditures 200 $17,632 205 $18,736
*The FTE devisor is calculated from the previous year's FTE data.
152
156
FINANCES
TABLE 4.08
Changes in Financial Data Per Full-Time Equivalent (FTE) Student (U.S. Dollars)
Year financial form sent in : 1992Number of
Schools Reporting AverageNon-Zero Amount Amount
1993Number of
Schools ReportingNon-Zero Amount
Average'Amount
REVENUETuition and Fees 207 $4,543 213 $4,719Govt. Grants, Contracts, and
Appropriations 62 $1,159 66 $986Gifts and Grants from Religious Org. 183 $4,480 182 $4,238Gifts and Grants from Individuals 198 $3,954 206 $3,838Value of Contributed Services 52 $3,206 56 $2,693Endowment/Investment Income 189 $3,700 198 $3,539Auxiliary/Ancillary Enterprises 172 $2,757 173 $2,736Other Sources 186 $1,295 194 $1,061
Total Revenue 207 $20,284 213 $19,538
EXPENDITURESEducation and General:
Instruction and Net Academic Support 207 $6,897 213 $6,675Research 34 $865 33 $713Public Service 46 $452 54 $340Library 196 $1,554 204 $1,484Student Services 171 $961 174 $842Admissions 137 $703 147 $630Inst. Support/Admin. & General 202 $4,827 210 $4,398Op. & Maintenance of Plant 201 $2,295 207 $2,191Scholarships and Fellowships 186 $1,929 189 $1,999Mandatory Transfers 59 $609 58 $759
SubTotal: Education and General 207 $18,700 213 $17,834Auxiliary/Ancillary Enterprises 164 $2,352 167 $2,240
Total Expenditures 207 $20,563 213 $19,590
*The FTE devisor is calculated from the previous year's FTE data.
153
159
FACT BOOK 1993-94
Table 4.10:Revenue Sources Expressedas a Percentage of TotalRevenueAll Schools
The source of data for this table is thesame as for Table 4.08.
Table 4.10 provides a distribution of revenue for each line item as a percentage of
total revenue. The percentage for each line item is based on all ATS member
schools. Data are recorded for five years, that is for the fiscal years: 1988-89, 1989-
90, 1990-91, 1991-92, and 1992-1993. Percentages given in this table can easily
be converted to dollars by multiplying the total per FTE student revenue from Table
4.08 by the percentage in each line item. Consistent with other studies, Tuition
costs are rising while Gifts and Grants from Religious Organizations and Endow-
ment/Investment Income are declining. As a result, more and more effort is made
in seeking other resources, such as Gifts and Grants from Individuals.
QUESTIONS TO CONSIDER
I. What is the percentage ratio of tuition and fees to the total revenue?
How does it compare to peer institutions? How tuition driven is your
school?
2. What is the percentage ratio of gifts and grants from religiousorganizations to the total revenue? How does it compare to peerinstitutions?
3. Are gifts and grants from religious organizations increasing ordecreasing?
4. Are there strategies in place to enhance these relationships?
5. What is the percentage ratio of gifts and grants from individuals to
the total revenue? How does it compare to peer institutions?
6. Is there an overall development strategy to increase gifts and grants
from individuals?
7. What percent of the total revenue is attributed to endowmentsupport?
8. What is the percent of endowment support to current operations?
9. What is your school's spending policy?
10. What is the percentage ratio of auxiliary/ancillary enterprises to the
total revenue? How does it compare to peer institutions?
11. Are your school's auxiliary services making or losing money?
How can your school make these services more profitable?
12. How do you evaluate other revenue sources? Have you been able to
identify new sources?
154
160
FINANCES
TABLE 4.10
Revenue Sources Expressed as a Percentage of Total Revenue - All Schools
YEAR FINANCIAL FORM SENT IN : 1989 1990 1991 1992 1993
REVENUE
Tuition and Fees 24.1% 24.5% 24.6% 23.4% 28.0%Govt. Grants, Contracts, and
Appropriations 1.2% 1.1% 1.1% 1.2% 1.1%Gifts and Grants from Religious Org. 17.7% 17.3% 16.9% 16.1% 14.5%Gifts and Grants from Individuals 17.2% 17.5% 16.9% 17.9% 19.0%Value of Contributed Services 2.1% 1.8% 1.7% 1.6% 1.6%Endowment/Investment Income 20.1% 20.0% 20.8% 18.6% 18.7%Auxiliary/Ancillary Enterprises 12.5% 12.2% 12.3% 12.3% 12.3%Other Sources 5.1% 5.6% 5.7% 5.9% 4.8%
155
161
FACT BOOK 1993-94
Table 4.14:Revenue Sources as aPercentage of TotalRevenueRoman Catholicand Non-Roman CatholicSchools
The source of the data for this table isthe same as for Table 4.08
Table 4.15:Revenue Sources Expressedas a Percentage ofTotal RevenueNon/Interdenominationaland DenominationalSchools
Table 4.14 provides a separate distribution of revenue sources for Roman Catholic
theological seminaries and for non-Roman Catholic school. The separate tables
reflect the average higher percentage of contributed services in the RomanCatholic schools and lower percentage of endowment income. Contributed
Services are often referred to as "living endowment." It is interesting to note that
Contributed Services plus Endowment in the Roman Catholic schools comes to
almost the same percentage of revenue as endowment income in the othertheological schools. Subsetting the two groups shows more clearly the decline in
Gifts and Grants from Religious Organizations to non-Roman Catholic schools
and the need to balance that with an increase in Gifts and Grants from Individuals.
In Table 4.15, differences are more dramatically represented in the subsetting of
non/interdenominational schools and denominational schools. As expected, non/
interdenominational schools were considerably more dependent on tuition and
fees and on grants from individuals.
156
162
FINANCES
TABLE 4.14
Revenue Sources Expressed as a Percentage of Total RevenueRoman Catholic and Non-Roman Catholic Schools
REVENUE
RomanCatholic
Non-RomanCatholic
Tuition and Fees 29.4% 27.7%Govt. Grants, Contracts, and Appropriations 1.3% 1.1%Gifts and Grants from Religious Org. 19.0% 13.7%Gifts and Grants from Individuals 14.2% 19.7%Value of Contributed Services 10.0% 0.3%Endowment/Investment Income 8.9% 20.3%Auxiliary/Ancillary Enterprises 13.1% 12.2%Other Sources 4.0% 4.9%
TABLE 4.15
Revenue Sources Expresst(d as a Percentage of Total RevenueNon/Interdenominational and Denominational Schools
REVENUE
Non/InterDenomin.
Denom-inational
Tuition and Fees 37.7% 25.0%Govt. Grants, Contracts, and Appropriations 1.5% 1.0%Gifts and Grants from Religious Org. 2.4% 18.1%Gifts and Grants from Individuals 22.6% 17.9%Value of Contributed Services 0.6% 1.9%Endowment/Investment Income 15.4% 19.7%Auxiliary/Ancillary Enterprises 12.7% 12.2%Other Sources 7.0% 4.2%
157
163
FACT BOOK 1993-94
Table 4.23:Expenditure Sources as aPercentage of TotalExpendituresAll Schools
Data are calculated from the Finance(F-1) Section of the ATS AnnualReport Forms, Part B for the academicyears 1990-91, 1991-92, and 1992-93,as reported in the fall of 1991, 1992,and 1993. Canadian dollars have beenconverted to U.S. dollars.
Table 4.24:Expenditure Sources as aPercentage of TotalExpendituresRomanCatholic and Non-RomanCatholic Schools
This table is based on the same data asTable 4.23, elaborating on data for thefiscal year 1992-93 as reported in thefall of 1993.
Table 4.23 provides a distribution of expenditure sources as a percentage of total
expenditures. The expenditures include mandatory transfers in the Total Educa-
tion, General, and Auxiliary Enterprise Expenditure categories. The data are
presented for the five fiscal years of 1988-89, 1989-90, 1990-91, 1991-92, 1992-
93 for the sake of comparison. As noted in the table, very little shift has occurred
over time. As Education and General costs have risen, less is spent on Auxiliary/
Ancillary Enterprises. To find dollar amounts, convert the percentage by multi-
plying the total per FTE student expenditures from Table 4.08 by the percentage
in each line item.
QUESTIONS TO CONSIDER
1. What is the percentage ratio of instruction and net academicsupport to current funding expenditures? How does this compare to
peer institutions?
2. Is this amount increasing or decreasing? Is it adequate?
3. If additional resources were available, how would they be spent?
4. What is the ratio of tuition fees to scholarship aid? Has this shifted
over time?
Table 4.24 offers a comparison of Roman Catholic and non-Roman Catholic
schools. The table reflects higher proportionate costs in Roman Catholic schools
for plant operations. With smaller enrollments and larger residential facilities, the
operating costs for these schools tend to be higher. Costs for student services are
also higher for Roman Catholic schools and reflect the more intensive formation
programs. Reduced Scholarship/Fellowship grants for Roman Catholic schools
often reflect contributions by an or 'zr or diocese for a seminarian's education.
Instructional/Academic Support, LIS titutional Support/Administration, and Plant
expenses consume the largest proportion of an institution's resources.
158
164
FINANCES
TABLE 4.23
Expenditure Sources Expressed as a Percentage of Total Expendituresand Mandatory Transfers
YEAR FINANCIAL FORM SENT IN : 1989 1990 1991 1992 1993
EXPENDITURES
Education and General:
Instruction and Net Academic Support 33.5% 35.0% 34.3% 34.1% 33.8%Research 0.3% 0.4% 0.5% 0.6% 0.5%Public Service 1.0% 1.0% 0.7% 0.7% 0.8%Library 6.5% 6.3% 6.3% 6.3% 6.2%Student Services 2.9% 3.0% 3.3% 3.4% 3.4%Admissions 1.7% 1.8% 1.9% 2.1% 2.4%Inst. Support/Admin. & General 21.3% 20.5% 20.7% 21.0% 20.9%Operation & Maintenance of Plant 10.0% 9.6% 9.9% 9.7% 9.8%Scholarships and Fellowships 9.7% 10.0% 10.1% 10.4% 11.0%Mandatory Transfers 1.1% 0.9% 1.1% 0.6% 0.6%
Subtotal: Education and General 88.1% 88.6% 88.7% 88.9% 89.4%Auxiliary/Ancillary Enterprises 11.9% 11.4% 11.3% 11.1% 10.6%
TABLE 4.24
Expenditure Sources Expressed as a Percentage of TotalExpenditures and Mandatory Transfers - Roman Catholic
and Non-Roman Catholic Schools
EXPENDITURES
RomanCatholic
Non-RomanCatholic
Education and General:
Instruction and Net Academic Support 32.7% 34.0%Research 0.3% 0.6%Public Service 0.2% 0.9%Library 7.0% 6.1%Student Services 4.9% 3.1%Admissions 1.2% 2.5%Inst. Support/Admin. & General 20.5% 21.0%Operation & Maintenance of Plant 15.4% 8.9%Scholarships and Fellowships 5.0% 12.0%Mandatory Transfers 0.8% 0.6%
Subtotal: Education and General 87.8% 89.7%Auxiliary/Ancillary Enterprises 12.2% 10.3%
159
165
FACT BOOK 1993-94
Table 4.25:Expenditure Sources as aPercentage of TotalExpenditures andMandatory TransfersNon/Interdenominationaland DenominationalSchools
Graph 4.25
In Table 4.25, the breakout of non/interdenominational schools and denomina-
tional schools reveals fewer differences than those in Table 4.24. Non/Interdenominational schools spend less on Instruction/Academic Support and
more on Institutional Support/Administration. They also spend more on Scholar-
ship Aid.
QUESTIONS TO CONSIDER
1. What is the percentage ratio of institutional support/administration
to total current expenditures? How does this compare to peerinstitutions?
2. Have student services costs gone up over time ? What has contributed
to those costs?
3. How have part-time students affected this line item?
4. Does your school have an understanding of its deferred maintenance
needs?
5. What are the reasons for deferred maintenance?
6. What plans are there to deal with deferred maintenance?
7. What funding plans are in place to deal adequately with long-term
maintenance requirements and upkeep?
Graph 4.25 looks at the relationship between Tuition and Fees on the revenue side
and Scholarships and Fellowships on the expenditure side. While Table 4.25
combines Roman Catholics with other denominations, Graph 4.25 breaks the ratio
analysis into three groupings. This further breakdown is done because Roman
Catholic schools are more likely to get Scholarships and Fellowships from other
sources than the school itself.
160
166
TABLE 4.25
Expenditure Sources Expressed as a Percentage of TotalExpenditures and Mandatory Transfers - Non/Interdenominational
and Denominational Schools
EXPENDITURES
Non/Inter-denominational Denominational
Education and General:
Instruction and Net Academic Support 30.2% 35.0%Research 1.5% 0.3%Public Service 2.1% 0.4%Library 5.2% 6.6%Student Services 3.4% 3.3%Admissions 2.5% 2.3%Inst. Support/Admin. & General 22.3% 20.5%Operation & Maintenance of Plant 9.3% 9.9%Scholarships and Fellowships 13.2% 10.3%Mandatory Transfers 1.3% 0.4%
Subtotal: Education and General 90.9% 88.9%Auxiliary/Ancillary Enterprises 9.1% 11.1%
40%
30%
20%
10%
0%
GRAPH 4.25
Ratio of Tuition and Fees to Total Revenue and
Scholarships and Fellowships to Total Expenditures
Per student costs are based on theschool costs as reported in the ATSAnnual Report Forms, in the sectionon Finance (F-1), Section B, CurrentFund Expenditures, Line 14, for the1991-92 and 1992-93 fiscal years.
Table 4.26 provides the average educational and general expenditures per FTE
student. It includes mandatory transfers from the current fund, but it does not
include auxiliary enterprises. The listing is important in that it describes Canadian
costs in Canadian dollars, as well as U.S. costs in U.S. dollars. It also distributes
costs: (a) according to six groups based on the size of FTE enrollments; (b)according to whether the school is university/college affiliated or independent; and
(c) by Roman Catholic and non-Roman Catholic schools. Since financial data are
based on the previous year's audit (1992), the FIE count is also based on that year.
The appearance then of 10 categories showing a decline in cost per Fib can be
explained by an increase in FTE students by 4,047 while general expenditures
remained relatively stable. Whenever there is a change in the number of member
schools, a more careful assessment of data must be made.
QUESTIONS TO CONSIDER
I. What are total expenditures per student? How do they compare to
peer institutions?
2. Are these costs increasing/decreasing? What are the reasons for the
change?
3. What overall strategic plan is in place to deal with rising costs?
162
163
1
1
FINANCES
TABLE 4.26
Average Educational and General (E&G) ExpendituresPer FTE Student
Table 4.29:Ratio of Surplus or (Deficit)to Total RevenuesAll Schools
This table uses the same data asTable 4.28.
Table 4.30:Ratio of Net Educationaland General (E&G) Surplusor (Deficit) to TotalRevenuesAll Schools
The data for this table are taken fromParts A and 13 of the Finance section(F-1) of the ATS Annual Report Formsfor the fall of 1991, 1992, and 1993.based on the figures for the previousfiscal years.
Table 4.29, like Table 4.28, excludes non-mandatory transfers from the calculation
of total current fund expenditures. This exclusion improves the situation of the
school in that it lowers the reported expenditures and thus reduces any overall
deficit. In this way the school is not penalized for voluntary transfers from its
current fund. The table includes all member schools. The table distributes the ratio
of surplus or (deficit) to total revenues on a percentile scale so that the median
represents a point where half of the institutions are above and the other half below
the median ratio.
QUESTIONS TO CONSIDER
1. What is your school's operating surplus or deficit? How does it
compare to peer institutions?
2. What are the reasons for this surplus or deficit?
3. What is your school planning to do with excess funds?
4. What strategies are in place to deal with any deficit?
Table 4.30 reports the ratio of the net E&G surplus or deficit expenditures to total
revenues. This is the most commonly used basis for evaluating the overall health
of an institution, together with the level and adequacy of support in relation to its
programs. It probably reflects best the fiscal health of the institution. The table
distributes the ratios on a percentile scale. The calculation of net educational and
general revenue and expenditures does not include auxiliary enterprise revenue or
expenditures.
QUESTIONS TO CONSIDER
1. Is current fund balance increasing or decreasing?
Sources of Gifts by Type of School (in US$ Thousands)
Roman CatholicOperational Capital
Other DenominationalOperational Capital
Inter/NondenominationalOperational Capital
Alumni/aeAvg 58.7 30.4 67.2 46.8 80.1 45.9
Median 7.0 0.0 45.6 9.4 32.2 1.9
Other IndividualsAvg 238.7 123.3 289.4 392.0 453.6 295.1
Median 86.3 10.1 179.5 173.2 194.0 57.7
FoundationsAvg 54.0 19.6 121.3 54.1 323.8 276.7
Median 6.4 0.0 34.2 0.0 140.3 0.5
CorporationsAvg 35.8 6.2 47.6 16.3 83.4 6.4
Median 2.8 0.0 13.0 0.7 12.7 0.0
Religious Orgs.Avg 336.0 41.3 671.2 30.6 132.1 11.6
Median 65.0 0.0 336.1 5.5 69.6 0.0
ConsortiaAvg 3.9 4.6 15.9 2.1 16.6 6.4
Median 0.0 0.0 0.0 0.0 0.0 0.0
Other Orgs.Avg 19.8 1.0 25.4 6.1 41.2 51.0
Median 0.0 0.0 0.0 0.0 0.0 0.0
Roman Catholic Reporting: 49Other Denominational Reporting: 120Inter/Nondenominational Reporting: 36
178173
FACT BOOK 1993-94
Table 5.03:Sources of Gifts byUniversity Relationshipof School
Table 5.03 displays the same information as Table 5.01 but by university relation-ship of school. Development programs of schools integrally related to a universityare vastly different from freestanding institutions. Such programs are also verydifferent among university divinity schools; some have separate developmentcampaigns, others are related to the university as a whole. Because there are only25 university divinity schools reporting, comparisons are somewhat difficult. It isinteresting to note, however, that university divinity schools receive higheramounts from foundations and religious organizations than do freestanding
schools. Higher foundation support may be a result of greater name recognition inthe community; higher support from religious organizations may be a result of the
fact that nondenominational schools are included in the category offreestanding.Questions similar to those asked in relation to Table 5.02 may be asked again inthis context.
174
179
DEVELOPMENT
TABLE 5.03
Sources of Gifts by University Relationship of School(in US$ Thousands)
Endowment and Similar FundsUnrestricted 16884.9Restricted 57722.5
Loans 309.0
TOTAL 101802.6
16.6%56.7%
0.3%
177
182
FACT BOOK 1993-94
Table 5.05:Purposes of Gifts forCurrent Operations byType of School
Tables 5.05 displays the same information as the first section of Table 5.04 but by
type of school: Roman Catholic, Other Denominational, or Inter/Nondenomina-
tional. Roman Catholic schools are unique in their structural arrangements.Diocesan seminaries will show higher uses of gifts for Operation and Maintenance
of Physical Plant and lower uses for Student Financial Aid. This is because these
schools often have large physical plants and resources for student aid come directly
from the diocese.
Those institutions with ties to a particular denomination receive the highest amount
of unrestricted gifts and therefore have a greater capacity to control how resources
are spent. Inter/nondenominational schools are much more dependent on indi-
vidual gifts and tuition, and therefore it is expected that a higher proportion of their
gifts will be used for Student Financial Aid. It is hoped that such a breakdown makes
it possible to make closer peer comparisons.
QUESTIONS TO CONSIDER
I. What percent of your school's gifts are in the restricted category?
2. How does your school's distribution between unrestricted andrestricted giving compare with peer institutions?
3. Is restricted giving increasing or decreasing?
4. Is the balance between unrestricted and restricted intentional?
5. Is there consideration being given to increase unrestricted giving?
178
183
DEVELOPMENT
TABLE 5.05
Purposes of Gifts for Current Operations byCategory of School (in US$ Thousands)