Documenting the Justice Gap In America The Current Unmet Civil Legal Needs of Low-Income Americans America’s Partner For Equal Justice Legal Services Corporation An Updated Report of the Legal Services Corporation September 2009
Transcript
Documenting theJustice Gap In AmericaThe Current Unmet Civil Legal Needs of Low-Income Americans
America’s Partner For Equal JusticeLegal Services Corporation
An Updated Report of the Legal Services CorporationSeptember 2009
This report updates and expands the Legal Services Corporation’s groundbreaking 2005 reportDocumenting the Justice Gap in America: The Current Unmet Civil Legal Needs of Low-IncomeAmericans, first released in September 2005, which documented the enormous challenge thenation faces in providing civil legal assistance to low-income individuals and families.
This report, completed in September 2009, shows that a continuing, major justice gap exists inour nation: for every person helped by LSC-funded legal aid programs, another is turned away.That was the primary finding in 2005 and LSC’s collection of data from LSC-funded programsacross the country in 2009 reaffirms that finding. This report replicates the methodologies andanalysis used in 2005 and includes data on unrepresented litigants.
Since 2005, additional state legal needs studies have added to the body of knowledge that suggestsonly a fraction of the civil legal problems experienced by low-income Americans are addressedwith the help of a private attorney or a legal aid lawyer. New data also indicate that state courts,particularly family and housing courts, are facing increased numbers of unrepresented litigants,which raises concerns about equal access to justice. Significantly, the number of people in povertyhas increased because of the recession and high unemployment rate.
The 2005 Justice Gap Report helped shape the dialogue over equal access to justice and provideda better understanding of the need for enhanced funding for the Corporation. The LSC budgetprovided by the Congress has increased to $390 million in Fiscal Year 2009. LSC is deeplyappreciative of its bipartisan support in Congress.
Lack of resources, however, continues to be the major factor why LSC-funded programs turnaway half of those seeking help. Closing the justice gap will require a multifaceted approach thatincludes increased funding by federal and state governments, private funders and concerned private parties, and increased pro bono contributions by individual lawyers.
Our nation’s pledge of equal justice for all is far from being fulfilled. By working together, wecan come closer to realizing that ideal.
Helaine M. BarnettPresidentLegal Services Corporation
Executive Summary As the institution charged by Congress with the administration of the federally-funded civil legalassistance program for those who would otherwise be unable to afford adequate legal counsel, theLegal Services Corporation (LSC) has a responsibility to communicate to Congress what is requiredto secure necessary access to civil legal assistance—that is, the level of assistance that would berequired across the nation to respond appropriately to the civil legal needs of low-income indi-viduals and families.
The civil legal problems of low-income people involve essential human needs, such as protectionfrom abusive relationships, safe and habitable housing, access to necessary health care, disabilitypayments to help lead independent lives, family law issues including child support and custodyactions, and relief from financial exploitation.
The difference between the level of legal assistance available and the level that is necessary to meetthe needs of low-income Americans is the “justice gap.”
In September 2005, LSC issued a comprehensive report, Documenting the Justice Gap in America:The Current Unmet Civil Legal Needs of Low-Income Americans, which used a variety of methodolo-gies to document the justice gap and to quantify necessary access to civil legal assistance.
This report updates the 2005 Justice Gap Report, using new data. Analysis of this data confirmsthat the conclusion of the 2005 Justice Gap Report remains valid: there continues to be a majorgap between the civil legal needs of low-income people and the legal help that they receive.
n Data collected in the spring of 2009 show that for every client served by an LSC-fundedprogram, one person who seeks help is turned down because of insufficient resources.
n New state legal needs studies have added depth to a body of social science knowledge that hasproduced consistent findings for a decade and a half, documenting that only a small fractionof the legal problems experienced by low-income people (less than one in five) are addressedwith the assistance of either a private attorney (pro bono or paid) or a legal aid lawyer.
n Analysis of the most recent available figures on attorney employment shows that nationally,on the average, only one legal aid attorney is available for every 6,415 low-income people. Bycomparison, there is one private attorney providing personal legal services (those meeting thelegal needs of private individuals and families) for every 429 people in the general populationwho are above the LSC poverty threshold.
n New data indicate that state courts, especially those courts that deal with issues affecting low-income people, in particular lower state courts and such specialized courts as housing andfamily courts, are facing significantly increased numbers of unrepresented litigants. Studiesshow that the vast majority of people who appear without representation are unable to afford
“Equal justice under law is not merely a caption on the facade of the Supreme Court building. It is perhaps the most inspiring ideal of our society…it is fundamental that justiceshould be the same, in substance and availability, without regard to economic status.”
—U.S. Supreme Court Justice Lewis Powell, Jr.
Documenting the Justice Gap In America < 1
an attorney, and a large percentage of them are low-income people who qualify for legal aid.A growing body of research indicates that outcomes for unrepresented litigants are often lessfavorable than those for represented litigants.
The first three findings are derived from three different methodologies, which were also employedin the 2005 report. The fourth finding is derived from a review and analysis of data on litigantsappearing in court without representation, which was recommended in the 2005 report for whichLSC did not have sufficient data at that time.
n Methodology #1: Unable to Serve: National count of people seeking legal help from LSC-funded providers who are denied services because programs lack sufficient resources. LSC asked its137 grantee programs, with 918 offices, to document the number of people seeking assistancefrom the program who could not be served due to insufficient program resources. LSC-funded programs collected this data over a two-month period in March-May 2009, the sametime period during which this data was collected for the 2005 Justice Gap Report.
n Methodology #2: Continuing Documentation of Unmet Legal Needs: Analysis and com-parison of recent state legal needs studies. Since 2005, seven states have conducted legal needsstudies using similar methodologies. For this report, the methodologies and findings of theseven recent state studies were compared to one another to draw currently valid, nationallyapplicable conclusions from them. The findings of these studies were also compared to thenine state studies conducted during 2000-2005 that were discussed in the 2005 report andthe Comprehensive Legal Needs Study funded by the American Bar Association and releasedin 1994.
n Methodology #3: Attorneys Per Capita: Attorneys Per Capita: National count of legal aidattorneys; comparison of ratio of legal aid attorneys to low-income population and ratio of privateattorneys providing personal legal services to general population. The count of legal aid attorneysincluded attorneys in all programs providing civil legal help to low-income people, not justthose in LSC programs. The count of private attorneys providing personal legal services tothe general population was based on estimates obtained from the American Bar Association.This report used U.S. Census population figures and estimates for the number of attorneysfrom the year 2007, the most recent year for which all figures were available.
n New Data on Unrepresented Litigants: Although there are no national statistics on unrepre-sented litigants, data was obtained from a compilation prepared by the National Center forState Courts of reports from state and federal courts, as well as individual reports from severalstates. The impact of the current economic crisis on caseloads and unrepresented litigants wasdocumented by a survey of judges conducted by the Self-Represented Litigation Network inthe spring of 2009. The available social science research on this topic also was reviewed.
Closing the justice gap and securing necessary access to civil legal assistance will require a multifacetedapproach which will include a partnership of individual lawyers, the organized bar, federal and stategovernments, private funders and concerned private parties. In addition to increased funding forstaffed legal aid programs, closing the justice gap will require increased pro bono efforts by thenation’s lawyers. As the primary conduit for the federal government’s share, the Legal ServicesCorporation bears responsibility for leading the way.
The findings reported here suggest a phased approach to addressing the unmet need. First, LSC’s2005 and 2009 “Unable to Serve” data show that only half of those seeking legal help from LSC
2 < Documenting the Justice Gap In America
grantees are able to be served. As an initial critical goal, there must be enough funding to serve allof those currently seeking help from LSC grantees. This requires a doubling of LSC funds and adoubling of the state, local, and private funds that also support LSC grantees.
Second, state legal needs studies conducted from 2000 to 2009 generally indicate that less thanone in five low-income persons get the legal assistance they need. To fund this need, the federalshare must grow to be five times greater than it is now, or $1.6 billion. IOLTA and other state,local and private funding sources, which are being hard hit by the economic downturn at present,will also have to grow in the future to contribute their proportionate share of the increase necessaryto fund civil legal services.
In order to keep faith with our national commitment to equal access to justice, it is essential thatthe nation move toward the necessary funding levels in firm, measured strides that are designed toclose the justice gap as quickly as possible.
Documenting the Justice Gap In America < 3
4 < Documenting the Justice Gap In America
(intentionally blank)
IntroductionThe 2005 Justice Gap ReportIn September 2005, the Legal Services Corporation (LSC) issued a comprehensive report,Documenting the Justice Gap in America: The Current Unmet Civil Legal Needs of Low-IncomeAmericans, which used a variety of methodologies to document the civil legal needs of low-incomeindividuals and families and to quantify necessary access to civil legal assistance—that is, the level ofassistance that would be required across the nation to respond appropriately to those needs.
The civil legal problems of low-income people involve essential human needs, such as protectionfrom abusive relationships, safe and habitable housing, access to necessary health care, disabilitypayments to help lead independent lives, family law issues including child support and custodyactions, and relief from financial exploitation.
The difference between the level of legal assistance available and the level that is necessary to meetthe needs of low-income Americans is the “justice gap.”
The 2005 Justice Gap Report was the first nationwide report on the civil legal needs of low-incomepeople since the Comprehensive Legal Needs Study funded by the American Bar Association andreleased in 1994.1 The Justice Gap Report was based on data collected from LSC-funded programsin 2004 and 2005, as well as data from other state legal needs studies, the U.S. Census Bureau, andother sources covering the period 2000-2005. The report synthesized and compared the findingsof the existing studies from this period, as well as those from the 1994 ABA study.
LSC’s Responsibility to Assess Legal NeedsCongress, in creating the Legal Services Corporation in 1974, determined that there is “need toprovide equal access to the system of justice in our nation for those who would be otherwise unableto afford adequate legal counsel.” Congress explicitly recognized in the LSC Act that, “providinglegal assistance to those who face an economic barrier to adequate legal counsel will serve best theends of justice, assist in improving opportunities for low-income persons,” and “has reaffirmed faithin our government of laws.”
The goal of providing equal access to justice for those who cannot afford to pay an attorney remainsthe reason for LSC’s existence and the benchmark for its efforts. In developing the budget mark itsubmits to Congress, therefore, LSC has a duty to assess what has been accomplished in meetingthe need, what still needs to be achieved, and the role that federal funding should play in doing so.This was the basis for the determination by the LSC Board of Directors that LSC should under-take the 2005 Justice Gap Report.
The 2009 Justice Gap Report Since the first Justice Gap Report was issued in 2005, major developments have occurred that poten-tially affect levels of need for civil legal assistance and the ability of legal aid providers to meet it.
n The current economic crisis, with its attendant problems of high unemployment, home fore-closures and family stress, has resulted in legal problems relating to consumer credit, housing,employment, bankruptcies, domestic violence and child support, and has pushed many fam-ilies into poverty for the first time.
Documenting the Justice Gap In America < 5
1 “Report on the Legal Needs of the Low-Income Public: Findings of the Comprehensive Legal Needs Study,”American Bar Association, 1994.
6 < Documenting the Justice Gap In America
n Just before the 2005 report was issued, Hurricane Katrina struck the Gulf Coast, resulting inlegal needs that are still being experienced by low-income residents of Louisiana, Mississippi,and Texas, where many victims of the disaster have relocated. Hurricanes Ike and Gustav hitthis region in 2008, a year that also saw widespread, record floods in the Midwest.
n While a long-term trend of increased state funding for civil legal aid has continued, budgetcrises have put this funding at risk in some states. Revenues from state Interest on Lawyers’Trust Accounts (IOLTA) programs rose in some states with new revenue enhancement tech-niques, but have recently fallen precipitously in many states as a result of low interest ratesand the declining economy, reducing trust account deposits.
n According to the U.S. Census Bureau, the number of individuals living below 125 percent ofthe federal poverty level in the United States increased from 49.6 million in 2005 to 53.8million in 2008.2
n At the federal level, an increase of $40 million in LSC funding for FY 2009 was signed intolaw in March 2009. (The increase was reflected in LSC grants beginning in April 2009, andits impact is not reflected in any of the data in this report.)
This report updates the findings and analysis of the 2005 report. As in 2005, LSC President HelaineM. Barnett convened a Justice Gap Advisory Committee to assist in the preparation of the report.In addition to LSC staff, the committee included representatives of the ABA Standing Committeeon Legal Aid and Indigent Defendants (SCLAID) and the National Legal Aid and DefenderAssociation (NLADA), both of which have traditionally provided their own recommendations onLSC funding and have independently undertaken efforts to develop new data on the unmet legalneeds of low-income people, in addition to representatives of LSC-funded field programs and othermembers of the legal services community with expertise in documenting legal needs.3
The 2009 Justice Gap Advisory Committee concurred with the judgment of the 2005 group thatthe likely cost of more than $1 million to conduct a new national legal needs survey would not bejustified, and that the justice gap could best be illuminated by using the same three methodologiesemployed in the 2005 report, each of which has particular strengths and provides a different per-spective. In addition, as recommended in the 2005 Justice Gap Report, the committee alsoreviewed and analyzed available data and research on litigants appearing in court without repre-sentation. Together, these different sources offer a broad picture of the justice gap.
The information in this updated report confirms the findings of the 2005 Justice Gap Report andis consistent with a body of social scientific literature that has been growing for two decades. Ofthose people who seek assistance from LSC-funded legal aid programs, one is turned away becauseof limited resources for every one helped. Only a small fraction of the legal needs of low-incomepeople are addressed with the assistance of an attorney. There are more than ten times as many pri-vate lawyers providing personal legal services to persons in the general population above the LSC
2 “Income, Poverty, and Health Insurance Coverage in the United States: 2008,” U.S. Census Bureau, September 10,2009. The 2008 data reflect the initial effects of the recession and signal even larger increases for 2009 because ofhigh unemployment rates. 3 The Justice Gap Advisory Committee members were Jonathan Asher, executive director, Colorado Legal Services;Terry Brooks, legal counsel to SCLAID; Bob Echols, state support consultant at the ABA Resource Center for Access toJustice Initiatives; Deborah Hankinson, former chair of SCLAID; Melville D. Miller, Jr., president, Legal Services ofNew Jersey; Don Saunders, Civil Director, NLADA; Lois Wood, executive director, Land of Lincoln Legal AssistanceFoundation; and Anthony Young, executive director, Southern Arizona Legal Aid.
poverty threshold as there are legal aid attorneys in relation to the low-income population theyserve.4 State courts are being overwhelmed by a rising tide of unrepresented litigants, many of themlow-income people eligible for LSC-funded assistance who have been unable to obtain an attorney.
All of these findings support the conclusion that there remains a significant justice gap in theUnited States: the difference between the level of legal assistance available and the level that is nec-essary to meet the civil legal needs of low-income Americans.
4 LSC is required by law to establish maximum income levels for persons eligible for civil legal assistance. Under LSCregulations, the maximum level is equivalent to 125 percent of the federal poverty guidelines, which are issued annu-ally by the U.S. Department of Health and Human Services.
Documenting the Justice Gap In America < 7
8 < Documenting the Justice Gap In America
(intentionally blank)
Documenting the Justice Gap In America < 9
Methodology #1: Unable to ServeCount of People Seeking Assistance From LSC-Funded Programs WhoCannot be Served Due to Lack of Resources
To document the justice gap at the legal aid program level, LSC collected data on the number ofpeople currently seeking help from LSC-funded legal aid programs who cannot be served due toinsufficient program resources. Data was obtained from every state in the country.5
This count indicates that almost one million cases (944,376) per year are currently being rejectedbecause programs lack sufficient resources to handle them. This figure does not include the manypeople who do not reach an LSC-funded program to ask for help, for whatever reason. Other stud-ies indicate that those who seek help from legal aid programs represent only a fraction of the low-income people with legal needs.
Comparison of this data to statistics on cases handled in 2008 indicates that for every client servedby an LSC-funded program, at least one person seeking help will be turned down due to limitedresources. This conclusion is almost identical to the “Unable to Serve” finding of the 2005 study.
MethodologyLSC asked its grantee programs to collect data on numbers of people who could not be served dur-ing a two-month period, from Monday, March 16, through Friday, May 15, 2009. This periodreplicates that of the 2005 survey, which was taken March 14 through May 13, 2005.
Programs were asked to count the number of people who sought legal help from the program (inperson, by phone, or online) for problems within LSC’s statutory mandate and were denied serv-ices because the program lacked sufficient resources.6
It is important to keep in mind that the data yielded by this methodology is under-inclusive as arepresentation of the justice gap in several ways:
n Data was collected only from LSC-funded programs. The count does not include peoplewho may have sought help unsuccessfully from other programs. This limitation is particular-ly significant in a few states and grantee service areas where intake is not primarily performedby the LSC grantees, which could consequently count only a small percentage of the totalnumber of persons who were turned down for service.7
n The count of people who could not be served does not include clients who received someservice, but not the level of service that they actually needed. LSC programs frequently pro-vide advice and counsel to people when they cannot provide full representation. These cases
5 As in 2005, data from LSC-funded programs in the District of Columbia, Puerto Rico, Virgin Islands, Guam andMicronesia is also included. 6 The count did not include people who were denied services because they were financially or otherwise ineligible,because services were prohibited by LSC restrictions, or because their case was determined to have insufficient legalmerit to proceed. Nor were cases in which a program made a referral to another program with an expectation that theother program would provide substantial representation included in the count. The instructions provided by LSC to itsgrantees on completing the survey and other related documents can be viewed on-line athttps://grants.lsc.gov/Easygrants_Web_LSC/Implementation/Modules/Login/Controls/PDFs/2009_UTS_Study_Instructions.pdf7 In some places, other organizations do intake and do not send cases to the LSC-funded program when they know theprogram is not able to handle them.
do not appear as denials of service because the client has actually received a service (Adviceand Counsel or Limited Action).8
n Many people who were counted as turned away for a single legal problem are likely to havehad more than one legal problem. Legal aid programs regularly find that people who havecontacted them for assistance with one problem have other legal problems as well.9 Statelegal needs studies confirm that a large percentage of people with at least one legal problemhave more than one problem (see Methodology #2).10
n The count does not include people who sought unsuccessfully to reach LSC-funded pro-grams. Legal aid programs have a finite capacity to provide legal assistance to eligible clientsand, because of limited resources, often must limit intake to certain hours and a limitednumber of phone lines and intake advocates.11
n More broadly, the methodology does not capture people with serious legal needs who didnot contact any legal aid provider. Many factors may keep people from seeking help:
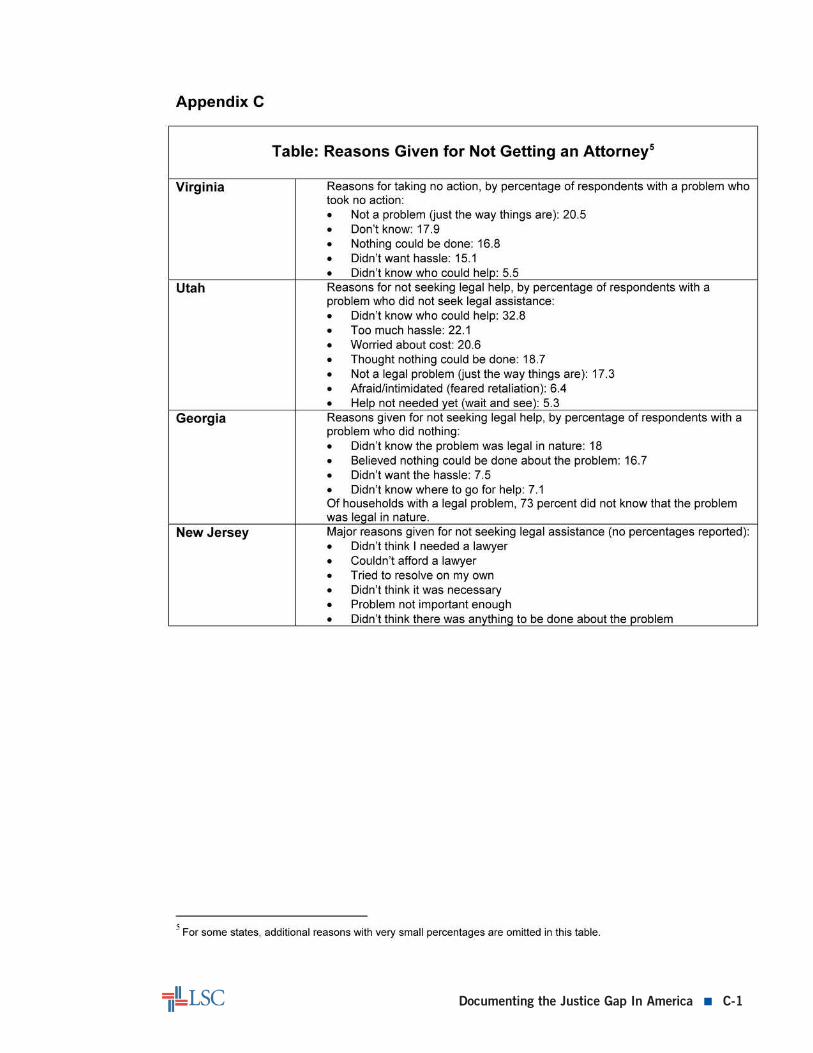
q People with legal problems frequently do not understand that they need legal help(see Appendix C).
q People with legal problems frequently do not know where to turn to obtain thathelp, or may not know that they are eligible for legal aid (see Appendix D).
q People who meet the eligibility requirements for free legal services may not seek helpfrom the program because they believe that the program will not be able to assistthem. Legal aid providers observe that calls for assistance involving particular prob-lem types tend to rise when the program is providing services in this area and to fallwhen intake is limited or closed in this area. A number of factors are typicallyinvolved in this phenomenon: for example, social services agencies and communityworkers are not making referrals; people are being told by others in the communitythat the program will not be able to help; and conversely, people are not hearingfrom others that they have obtained help from the program for a similar problem.Thus the number of calls tends to drop during periods when it is unlikely thatclients will be able to obtain help, reflecting the understanding of the communityabout whether services are likely to be available.
10 < Documenting the Justice Gap In America
8 As part of the research for this report, LSC grantees were asked to capture the number of clients that they assistedin a limited fashion where full extended representation would have been more likely to enable the client to obtain asatisfactory outcome. LSC grantees counted 82,500 such cases in the two-month period. This figure does not includecases where the programs judged that the advice and brief service provided was sufficient to resolve the problem pre-sented. Programs estimated that, during the two-month study period, 46,000 cases were resolved in this manner. 9 For example, Pine Tree Legal Assistance, Maine’s LSC grantee, asked people contacting the program in person(rather than by telephone) during the March-May period in which it collected “unable to serve” data whether they hadother legal problems. It found that 66 percent of the people contacting the program in person had at least one legalproblem beyond the one for which they were seeking immediate help, with an average of three additional problems.10 The Virginia legal needs study considered under Methodology #2 reported that the average number of legal needsamong households with at least one legal need was 3.62. The Alabama study reported that the average number oflegal needs among households with at least one legal need was 3.6. The New Jersey study reported that 51.5 percentof those respondents who experienced at least one problem experienced more than one problem. 11 Programs typically make legal information available in ways that are not dependent on talking directly with an advo-cate, such as through their websites, brochures, clinics, and other community education media.
q Other barriers, such as geographical distance and isolation, low literacy, physical ormental disability, limited English proficiency, culture and ethnic background, andapprehension about the courts and the legal system, also pose impediments.
This data provides specific documentation of the magnitude of unmet need. It is unique in that,through an extensive, nationwide sample, it documents legal problems for which people have actu-ally sought, and been denied, help. It is also understated because it does not include many otherpeople with pressing legal problems who also need assistance, but did not contact an LSC-fundedprogram.12
FindingsThe annualized figures for different case types are reported in Table 1.
Table 1: Unable to Serve
12 There is one way in which this data may be slightly over-inclusive, in that eligibility for LSC services was document-ed in most, but not all, cases. Eligibility was established for all cases in which the intake process was completed.People who were determined to be ineligible were not included in the count. However, the count of people who wereturned away does include some applicants for whom eligibility information was not collected because, before doingscreening, the program ascertained and informed the applicant that the type of case presented was not within the pro-gram’s case-handling priorities. Nevertheless, programs report that it is their experience that an overwhelming majorityof those who contact legal services offices are eligible for their services
Documenting the Justice Gap In America < 11
Type of Legal Unable to Serve Calendar Year 2008Problem Categories Twelve Month Projections Cases Closed
Consumer 98,214 108,404
Education 8,874 6,839
Employment 42,264 26,896
Family 391,038 312,046
Juvenile 18,780 15,143
Health 22,230 30,802
Housing (Other than Foreclosure) 113,706 219,592
Foreclosure 21,756 9,920
Income 49,236 98,257
Individual 39,216 13,250
Miscellaneous* 139,062 48,006
Total 944,376 889,155
*Includes such services as wills and estates, advance directives and powers of attorney.
To obtain an annualized figure, the data from the two-month survey was multiplied times six as aprojection for an entire year.13 For comparison, the number of cases in which service was providedby LSC-funded programs in 2008 is also set out in Table 1.14
The table shows that there will be roughly 944,000 people seeking legal help in 2009 that LSC pro-grams will be unable to serve at all. In comparison, approximately 889,000 people were served byLSC-funded programs in 2008.15 This means that for every client served by an LSC-funded program,at least one eligible person seeking help will be turned down.
This methodology yielded a similar ratio in the 2005 study, which estimated that 1,086,000 peo-ple would be turned away over the course of the year, while in the previous year, LSC programs hadserved 900,000 clients (see Appendix E, Table 2005-1).
The fact that the 2009 “Unable to Serve” survey did not show a national increased demand for serv-ice during a period when such an increase would have been expected, due to the economic crisis,may be attributable in part to several of the limitations of the survey identified above. In particu-lar, the limited intake capacity of many programs means that an increased number of callers wouldnot necessarily result in an increased number of callers who actually reach the program. Anotherfactor that may prevent increased demand from resulting in increased requests for assistance is thatmany potential clients and sources of referrals learn when legal aid programs are unable to acceptnew cases and stop calling or making referrals.
Conclusion to Methodology #1This methodology indicates that, as in 2005, roughly one-half of the people who seek help from LSC-funded legal aid providers are being denied service because of insufficient program resources. Almost onemillion cases will be rejected this year for this reason.
Because this figure does not include people seeking help from non-LSC-funded programs, peoplewho cannot be served fully, and people who for whatever reason are not seeking help from any legalaid program, it represents only a fraction of the level of unmet need. The methodology reported inthe next section provides information about the size of this larger group of low-income people withcivil legal needs.
12 < Documenting the Justice Gap In America
13 The hypothesis that this two-month count is approximately equal to one-sixth of a year’s intake was tested in 2005by asking 10 percent of LSC grantee programs to compare their 2004 April and May intake numbers with their totalintake for 2004. The 2004 April and May intake for these programs yielded a count of 19,926 cases. A 12-monthextrapolation from this figure would be 119,556 cases. The combined full-year 2004 totals for these programs was119,166, almost identical to the extrapolation. This confirms that the sample period in 2005 was likely to reflectaccurately one-sixth of a full-year total. The Justice Gap Committee did not repeat this test in 2009, relying on theassumption that the same results would hold true. 14 Case data from 2008 was used for comparison because 2009 data will not be available until March 2010. Pastexperience suggests that 2009 case totals will be within a few percentage points of those for 2008.15 Pro bono cases provided through programs’ private attorney involvement (PAI) requirement are included in the countof clients served. Roughly 7 percent of all cases closed by LSC-funded programs in 2008 were provided by pro bonoattorneys. Total PAI cases were more than 10 percent of LSC cases in 2008, with the additional cases being other PAIcases where private attorneys provide services at reduced fees paid by LSC programs.
Methodology #2: Continuing Documentation ofLegal Needs Analysis and Comparison of State Legal Needs Studies 2006-2009
Over the past four years, seven states have conducted large-scale, survey-based studies to determinethe kinds of legal problems experienced by low-income residents and the extent to which theseneeds are being met. These seven studies were conducted by independent research entities, accord-ing to rigorous social science survey standards. The states that produced these studies are Virginia(2007), Utah (2007), Wisconsin (2007), Nevada (2008), Alabama (2009), Georgia (2009) andNew Jersey (2009).
These seven studies add to a body of knowledge that has been building since the ABA study in1994. For this report, the methodologies and findings of these seven studies were compared to oneanother to determine the extent to which it is possible to draw nationally applicable conclusionsfrom them.16 The findings and methodologies were also compared to those in the nine state stud-ies considered in the 2005 Justice Gap Report, as well as those in the 1994 ABA study, to assess thecontinuing validity of the earlier findings.
In the six recent studies based on random telephone surveys, the sample size met the statisticalthreshold necessary to be able to generalize findings to the state low-income population (and inmost instances was well above it). These findings can thus be considered very reliable.17 Analysis ofthe seven recent state studies shows that their findings are broadly consistent with one another. Thisconsistency of findings from state to state (and researcher to researcher) reinforces their validity andindicates that they are likely to be predictive of needs at the national level.
Key points of comparison are as follows. (Each is described in more detail in a subsequent section.)
n The seven recent state studies found that low-income households experience a per-householdaverage of legal needs ranging up to three legal needs per year.
n All seven state studies found that only a small fraction of the legal problems experienced bylow-income people (less than one in five) is addressed with the assistance of a private or legalaid lawyer.
Documenting the Justice Gap In America < 13
16 Hawaii (2007) and the District of Columbia (2008) also conducted studies of legal needs and the extent to whichthey were being met; while these studies were based upon data from a variety of sources, those sources did notinclude a random survey of low-income people. In addition, Indiana (2008) conducted a survey-based study of legalneeds, but the questionnaire used did not solicit data about unmet legal needs . For this reason, these three studiescannot be compared directly to the other seven studies considered in this section. However, the findings on unmetlegal needs from these studies are reported in Appendix A. All of the studies discussed in this report, as well as allother state studies of the legal needs of low-income people released in 2000 and later and a list of studies releasedbefore 2000, are available online athttp://www.abanet.org/legalservices/sclaid/atjresourcecenter/compublicawareness.html (under “Public Awareness andCommunications”). 17 The one study using the “cluster sampling” methodology (Utah) is based on a sample of 1,185, somewhat smallerthan the 1,500 which is deemed to achieve maximum reliability. See Appendix B. However, the consistency of itsfindings with those in other states indicates that these findings can also be considered reliable.
n Those studies that ask respondents to rank the importance of the problems they experiencedshow that even if the legal problems included are limited to those considered to be “veryimportant” or “most serious” or that “caused trouble” by the household experiencing it, alarge majority of the problems are not addressed with the help of a lawyer.
These key findings of the seven recent state study findings are consistent with the analogous find-ings in the nine studies reported in the 2005 Justice Gap Report and the 1994 ABA study.
MethodologyTable 2 shows the studies considered in this report.
Table 2: State Legal Needs Surveys of Low-Income People 2006-2009
All seven of these state studies used a fundamentally similar methodology, based on the well-estab-lished social science survey methodology used in the 1994 ABA study. This is the same methodol-ogy used in the nine studies reported in the 2005 Justice Gap Report:
n A statistically valid sample of low-income households was identified either through a randomtelephone survey or, in Utah, according to an alternative “cluster sampling” methodology(for a description of this methodology, see Appendix B).
n In an interview (by telephone, in the states using a random telephone survey; in person, inUtah, according to the “cluster sampling” methodology), respondents were presented withdescriptions of various circumstances constituting potential legal problems and askedwhether anyone in their household had experienced these circumstances during the preced-ing year. The survey questionnaire was reviewed by attorneys to ensure that the situationsdescribed to the respondents contained a legal issue and met a threshold of seriousness.
14 < Documenting the Justice Gap In America
State Released Sponsor/Funder Survey/Analysis By
Virginia 2007 Legal Services Corporation Schulman, Ronca, & Bucuvalas, of Virginia Inc.
Utah 2007 Utah Legal Serices/ Sociology Department, Portland “And Justice for All” State University/D. Michael Dale
Wisconsin 2007 State Bar of Wisconsin Gene Kroupa & Associates
Nevada 2008 Supreme Court of Nevada Gene Kroupa & Associates; Access to Justice Commission Social Entrepreneurs, Inc.
Alabama 2009 Alabama Access to Justice Southeast Research, Inc. Commission/Alabama Bar Foundation
Georgia 2009 Georgia Supreme Court Equal A.L. Burruss Institute of Public Justice Commission, Service and Research, Kennesaw Committee on Civil Justice State University/D. Michael Dale
New Jersey 2009 Legal Services of New Jersey Schulman, Ronca, & Bucuvalas, Inc./Poverty Research Institute, Legal Services of New Jersey, in consultation with Institute for Survey Research, Temple University
n When respondents reported having experienced such circumstances, follow-up questionswere asked about what the household did (or did not do) about the situation and what con-tacts, if any, they had with the civil justice system.
As shown above in Table 2, the sponsors and funders of the studies were different in each state, andthe surveys on which they were based were conducted or overseen by a variety of different inde-pendent academic or private research entities. The survey questionnaires varied somewhat to reflectlocal circumstances and concerns. Other details of the methodology also varied somewhat. (SeeAppendix B for variations). However, in all seven states, the survey samples were broadly represen-tative of low-income people in the state and the survey questions about legal needs were sufficientlysimilar to allow the resulting findings to be compared meaningfully to one another.
Findings: Legal Needs The studies found that on the average low-income households experienced from 1.3 to 3.0 legalneeds per year, as shown in Table 3.18
Table 3: Legal Needs
Documenting the Justice Gap In America < 15
State Average number of legal needs in preceding year per low-income household
Virginia 2.4 Utah 1.319
Alabama 1.7 Georgia 3.0 State Average number of categories of legal needs in which low-income houselholds
experiencing at least one problem experienced a problem in the preceding year
Wisconsin 2.120
Nevada 2.421
State Average number of new legal needs in preceding year per low-income individual experiencing at least one problem
New Jersey 2.322
18 The most common types of problems reported in the seven studies were in the areas of housing (such as evictions,foreclosure, utility issues, unsafe housing conditions and homelessness), consumer (such as abusive debt collection,oppressive contract terms, bankruptcy, and consumer scams), family (such as divorce, domestic violence, child cus-tody, visitation, and support), employment (such as wage claims, unemployment, discrimination), health care (such asdisputes over charges, access to services, and nursing home problems), and government benefits (such as difficulty inapplying and denials). Although the distribution of problem types varied somewhat from state to state, these problemtypes appeared in all seven states. Other problem types reported at relatively high levels in at least one of the studies(but not a majority) were education, municipal services, and disability.19 The Utah study notes that this figure conservatively understates the number of problems experienced by low-incomeUtahns each year, since detailed information was only recorded for five legal problems per household. Research fromother states has shown that more than five problems occur with some frequency.20 The Wisconsin study reports that for the 45 percent of respondents who indicated that they or a household memberhad experienced at least one legal problem in the past year, the mean number of categories (out of thirteen) for whichthe household faced a problem or issue was 2.1. However, if a respondent experienced more than one problem withina particular category, only one problem was counted.21 The Nevada study reports that for the 68 percent of respondents who indicated that they or a household memberhad experienced at least one legal problem in the past year, the mean number of categories (out of nine) for which thehousehold faced a problem or issue was 2.4. However, if a respondent experienced more than one problem within aparticular category, only one problem was counted.22 The New Jersey study reported that 32.5 percent of lower-income respondents reported at least one new legal prob-lem during the preceding year.
Findings: Legal Help Sought/Received – Unmet Legal Needs All seven state studies found a similarly large gap between the level of legal needs reported by low-income households and the percentage of those needs for which legal help was received.
The various studies report their findings on this fundamental issue in somewhat different ways, asshown in Table 4. Some studies report a figure for legal help received, either by a percentage of over-all problems or by a percentage of respondents who obtained help (either individuals or households,depending on the study). Others report legal help received as a subset of legal help sought.23
Consequently, not all of the percentages shown are able to be compared directly to one another.However, the gap between the overall level of needs identified and the percentage of those for whichlegal help was received or sought is similarly large in each instance.
Table 4: Legal Help Received/Sought
Overall, what these studies demonstrate is that only a small fraction of the legal problems experi-enced by low-income people (less than one in five) are addressed with the assistance of a privateattorney or legal aid lawyer.
Findings: Importance of ProblemsSeveral of the state studies also collected data about the respondent’s assessment of the seriousnessof the problem involved and/or the respondent’s understanding of whether a lawyer was necessaryto resolve it, yielding data about percentages of the most immediate, serious problems.
n Utah: Respondents characterized 55.1 percent of the problems identified as “extremelyimportant” and an additional 27.3 percent as “very important.”
23 Several studies explored the reasons that many people did not seek legal help for their problems. See Appendix C;on the related issue of the lack of awareness of civil legal aid, see Appendix D. For comparable findings in the 2005Justice Gap Report, see Appendix E, Tables 2005-7 and 2005-8. Of the state studies analyzed there, several report afinding only for legal help sought, not received.
16 < Documenting the Justice Gap In America
State Received legal help (by percentage of problems)
Alabama 15.9 percent of problems, legal assistance received
Georgia 9.1 percent of problems, legal assistance receivedReceived legal help (by percentage of households with problems)
Utah 13.0 percent of households with problems received help from an attorney
Nevada 9 percent of households with problems received help from a lawyer for all the problems they identified; 20 percent received help for at least one, but not all of the legal problems they identified.
Virginia 17 percent of households with a legal need used a private lawyer or legal aid to assist them with that problemReceived legal help (by percentage of households with problems that sought help)
Wisconsin 37 percent of households with legal problems sought help from a lawyer for at least one problem; 27 percent of this group received help from a lawyer for at least one problem; 12 percent of this group received help for all the problems they identifiedReceived legal help (by percentage of individuals who sought help or believed they needed help from a lawyer); sought legal help (by percentage of problems)
New Jersey 30.6 percent of respondents who tried to get the help of a lawyer of believed they needed the help of a lawyer were able to get assistance; 19.4 percent of problems, help sought from a lawyer.
n Georgia: 40.4 percent of respondents reported that the problem had caused “significanttrouble” and almost 66 percent replied that their problem had caused some level of trouble.
n New Jersey: Respondents with lower incomes rated 58.2 percent of their legal problems as“most serious.”
Comparison of State Findings on Unmet Need 2006-2009 to State Findings onUnmet Need 2000-2005 and 1994 ABA Study The 2005 Justice Gap Report considered nine state legal needs studies issued from 2000-2005:Oregon (2000), Vermont (2001), New Jersey (2002), Connecticut (2003), Massachusetts (2003),Washington (2003), Tennessee (2004), Illinois (2005) and Montana (2005). These were the onlysurvey-based legal needs studies of low-income people released during this period.
Like those considered in this update, these nine studies were sponsored and funded by a varietyof different bar, court and funding entities, and the surveys on which they were based were con-ducted or overseen by different independent academic or private research entities. Like the 2006-2009 group of state studies, the sample size in all of the studies based on random surveys metthe statistical threshold necessary to be able to generalize findings to the state low-income pop-ulation (and in most instances was well above it). Again, especially given the consistency of find-ings from study to study, these findings can thus be considered very reliable. See Appendix E,Tables 2005-2 and 2005-5.
The findings of the seven studies considered here are wholly consistent with those of the nine stud-ies reported in the 2005 Justice Gap Report. They are also consistent with those of the 1994 ABAstudy, which remains the only national study ever undertaken of this subject.
n The findings on the average number of legal needs per low-income household per year arewithin the same range: in the 2006-2009 group, from 1.3 to 3.0; in the earlier group, from1.1 to 3.5 (See Appendix E, Table 2005-3). The ABA study found an annual average of 1.1needs per low-income household. Only one state study, Vermont (2001), found a level ofneed as low as that in the ABA study. The ABA study thus represents the lowest figure avail-able for estimating the number of legal needs experienced by low-income Americans.
n The findings on the level of unmet legal needs are within the same range: in all seven states,only a small fraction of the legal needs experienced by the household were addressed with theassistance of an attorney—less than one in five. In the 2000-2005 state studies that reportedthe percentage of total problems identified for which legal help was obtained (the most con-sistent way of measuring unmet legal need among the studies), the range was from 9 to 18.1percent. (See Appendix E, Table 2005-4). The ABA study, at the low end of the range ofstudy findings on unmet legal needs (i.e., showing a high percentage of met legal needs), con-cluded that roughly one out of every five of the legal needs of low-income people wasaddressed with the assistance of a private attorney or legal aid lawyer.
n As in the studies considered in 2005, those studies that asked respondents to rank the seri-ousness of their legal problems found that most people considered a majority of the prob-lems identified to be serious (see Appendix E, Table 2005-6).
Documenting the Justice Gap In America < 17
Conclusion to Methodology #2Each of the seven state legal needs studies considered in this section—as well as the nine state stud-ies considered in the 2005 Justice Gap Report—provides a full picture of the legal needs of low-income people in a particular state and the extent to which they are being met or not met. Thesestudies look at the full range of legal needs, including those that never reach an attorney’s office ora courthouse, and they consider legal services provided to low-income people from all sources,including pro bono attorneys and private attorneys charging full or reduced fees.
The seven new studies add to a body of knowledge that has been building since the ABA’s 1994national study. They confirm the findings of these earlier studies, all of which are consistent withone another, and support the conclusion that the findings of these state studies are generally appli-cable at the national level.
These studies confirm that only a small fraction of the legal problems experienced by low-income peo-ple (less than one in five) are addressed with the assistance of either a private attorney (pro bono or paid)or a legal aid lawyer.
18 < Documenting the Justice Gap In America
Methodology #3: Attorneys Per CapitaLegal Aid Lawyers Compared to Private Lawyers
Another perspective on the justice gap is provided by data on the numbers of legal aid attorneys serv-ing the nation’s low-income people. For this report, ABA and LSC staff collected data on the num-ber of legal aid attorneys in the country in 2007, the most recent year for which data is available inmost categories. A count was sought of all legal aid attorneys, not just those in LSC programs.
The count shows that despite the expansion of non-LSC funded programs since the mid-1990s, amajority of attorneys serving the poor still work in LSC-funded programs: there were 4,231 lawyersin LSC-funded programs (this figure includes all lawyers in the program, including those fundedwith state, private and other funds) and an estimated 3,700 in programs that do not receive LSCfunding. The LSC-funded network thus remains the major source—and in many areas, the onlysource—of civil legal aid for low-income Americans.
The number of legal aid attorneys available to serve the poor provides a simple demonstration ofthe justice gap when compared to the number of attorneys serving the general public. The num-ber of attorneys in private practice can be presumed to reflect a market response to the legal needsof the U.S. population. Nationally, there are well over ten times more private attorneys providing per-sonal legal services to people in the general population24 than there are legal aid attorneys servingthe poor. While there is only one legal aid lawyer (including all sources of funding) per 6,415 low-income people in the country, this report estimates that there is one lawyer providing personal legalservices (that is, services aimed at meeting the legal needs of private individuals and families) forevery 429 people in the general population.
MethodologyABA and LSC staff collected data on the number of legal aid attorneys in the country in 2007.“Legal aid attorneys” were not limited to those in LSC-funded programs; rather, the number of full-time-equivalent attorneys working in all programs providing free civil legal services to low-incomepeople was sought. Reports from LSC-funded programs (not limited to federally-funded attorneys)were used as a starting point. Additional information was sought from state IOLTA programs orother contacts in each state, with special priority given to states with substantial non-LSC funding.For states where it was not possible to obtain actual attorney counts, ABA staff made projectionsbased on resource data from the ABA Project to Expand Funding for Legal Services (PERLS), aninitiative of the ABA Standing Committee on Legal Aid and Indigent Defendants. The ratio oflegal aid attorneys to low-income people was calculated from the U.S. Census Bureau’s CurrentPopulation Survey estimate of the low-income population for 2007, using 125 percent of the fed-eral poverty guidelines as a definition of low-income.
For comparison, ABA estimates for the number of attorneys in private practice in the United Stateswere obtained for the year 2007.25 This yielded a count of 849,862 attorneys in private practice.
Documenting the Justice Gap In America < 19
24 The general population as used in this report excludes people at or below 125 percent of the federal poverty guide-lines, which makes them eligible for LSC-funded legal services.25 This was calculated as follows: The American Bar Association periodically conducts a census of lawyers by pollingstate bar associations or licensing agencies for a count of resident, active attorneys. Figures for 2007 indicate thatthere were a total of 1,130,136 attorneys in the 50 states that year. The American Bar Foundation (ABF) collects sta-tistics indicating the percentage of lawyers in each type of employment – private practice, federal judiciary, federalgovernment, state judiciary and state government, etc. In 2005 (the most recent year for which such calculations areavailable) 75.2% of lawyers were in private practice.
26 Calculated as follows: ABF calculated that in 2005 (the most recent year for which figures are available), 48.4% ofthe lawyers in private practice were solo, and that 38.8% of the lawyers in firms were in firms of 2-10 lawyers. Thus,of the estimated 849,862 lawyers in private practice, about 581,482, or 68%, were in firms of 1-10 lawyers.27 If all 849,862 attorneys in private practice are considered, not just those providing personal legal services, the ratiobecomes 1:292.
A rough estimate of the number of attorneys providing personal legal services to the general pop-ulation was made based on information from the American Bar Foundation, which has found that68 percent of attorneys in private practice are solo practitioners or in firms of ten attorneys orfewer.26 These attorneys are those most likely to specialize in meeting the personal legal needs ofprivate individuals and families. While some of these solo practitioners and small firm attorneysprovide criminal defense or services falling outside the area of personal legal services, this is offsetby the many attorneys in larger firms who do provide personal legal services in addition to corpo-rate services. This analysis indicates that there are roughly 577,906 attorneys in the U.S. providingpersonal legal services to the general population.
The attorney figures were compared to the population of the United States from the 2007 CurrentPopulation Survey to obtain the ratio of private attorneys per capita in the general population.
FindingsAs shown in Table 5, roughly 53 percent of all legal aid attorneys work in LSC-funded programs.The LSC network thus remains the major source of civil legal aid for low-income Americans. Inmany areas, the LSC-funded program is the only provider of civil legal aid.
Comparing the estimated number of legal aid attorneys in the nation in 2007 (7,931) to the num-ber of people estimated to be living at 125 percent of poverty or lower by the Current PopulationSurvey for 2007 (50,876,000) yields a ratio of one attorney per 6,415 low-income people.
In contrast, nationally, as calculated above, there were roughly 577,906 attorneys providing per-sonal legal services to the general population numbering 247,826,000 in 2007. This yields a ratioof one attorney per 429 people in the general population—well over ten times the ratio of legal aidattorneys to the population they serve.27 The difference between the level of resources available tothe general population and those available to the low-income population is enormous.
20 < Documenting the Justice Gap In America
Table 5: Total Number of Legal Aid Attorneys—7,931 (Calendar Year 2007)
53% (or 4,231) of all legal aid attorneyswork for LSC-funded organizations
47% (or 3,700) of all legal aid attorneyswork for non-LSC-funded organizations
Table 6: Comparison of Private Lawyers to General Population and Legal Aid Lawyers toLow-Income Population
Changes from 2005 Justice Gap ReportThe 2005 Justice Gap Report considered the number of legal aid attorneys in 2002, compared tothe number of attorneys serving the general population in 2000, the most recent year for which fig-ures were available.
Between 2002 and 2007, the number of attorneys working in LSC-funded programs increased by10 percent, from an estimated 3,845 to an estimated 4,231. The number of attorneys working innon-LSC-funded programs increased from an estimated 2,736 to an estimated 3,700. The overallestimated increase was 1,350, from 6,581 to 7,931, roughly 20 percent.
However, due to the growth of the U.S. poverty population, there was little change in the ratio oflegal aid lawyers to the low-income population: the 2002 ratio was 1:6586; the 2007 ratio was1:6415. The percentage of lawyers working in LSC-funded programs has fallen slightly, from 58percent to 53 percent.
Conversely, lawyers have grown in relation to the general population: the ratio of lawyers provid-ing legal services to the general population in 2007 was 1:429, compared to 1:525 in 2000. Thegap between the services available to the general public and the services available to low-incomepeople has increased.
Pro Bono EffortsAlthough this methodology does not include a count of the private attorneys who provided probono services to low-income individuals and families, pro bono assistance is essential to helpingclose the justice gap.28 Since the 2005 report, LSC has undertaken a major initiative to increase theinvolvement of private attorneys in LSC-funded programs. The LSC Board of Directors adopteda private attorney action plan, “Help Close the Justice Gap, Unleash the Power of Pro Bono,” whichincluded a call to grantees to adopt resolutions that recognize and celebrate the involvement of pri-vate attorneys in the delivery of civil legal services. LSC provided guidance in 2007 to grantees onresources and innovative approaches available to more effectively integrate private attorneys into the
Documenting the Justice Gap In America < 21
:
:PrivateLawyer
Legal Aid Lawyer
429 people in general population)
= 100 people
6,415 people inpoverty
()(
28 Pro bono services have been taken into consideration in the other two methodologies in this report. The contributionof pro bono attorneys is reflected in Methodology #1, at note 15, and Methodology #2 takes into consideration legalhelp provided by all attorneys, legal aid and private, pro bono and paid.
22 < Documenting the Justice Gap In America
delivery of civil legal assistance.29 LSC recommended that grantees develop long-term relationshipswith large law firms, corporate and government attorneys and offer support to small firms, solopractitioners and judicare attorneys so that they may more effectively provide services. In addition,the guidance encourages grantees to engage law schools and law students in pro bono services. Justas importantly, the American Bar Association has for many years sought to stimulate and supportpro bono contributions by private lawyers. Pro bono has always been and will continue to be animportant resource in closing the justice gap.30 But pro bono efforts by private attorneys alone willnot be enough to meet the legal needs of low-income individuals and families across the nation.Legal aid programs will need to have both the additional resources necessary to employ more staffand to enhance their efforts to engage the private bar in providing pro bono services.
Conclusion to Methodology #3Nationally, on the average, there is one legal aid attorney (including those funded by all sources)available to serve 6,415 poor people. This ratio has not changed significantly since the 2002 figurereported in the last report. In comparison, there is one private attorney providing personal legalservices for every 429 people in the general population.
Despite the expansion of non-LSC-funded programs in the past decade, a majority of attorneysserving the poor still work in LSC-funded programs. The LSC network thus remains the primarysource of civil legal aid for low-income Americans.
29 “Guidance to LSC Programs for the Development of Enhanced Private Attorney Involvement,” LSC Program Letter07-2, December 20, 2007. See: www.lsc.gov/program/program_letters.php30 In 1985, LSC adopted 45 CFR 1614, which requires each recipient of LSC funds to devote an amount equal to atleast 12.5 percent of those funds to involving members of the private bar in providing services to eligible clients. Someof these funds go toward supporting pro bono programs either directly or through sub-grants with third-party organiza-tions, such as bar associations. The infrastructure supported with these funds leverages public funding to involve thou-sands of private lawyers nationwide who donate pro bono services to address the legal problems of the poor.
Documenting the Justice Gap In America < 23
New Data on Unrepresented Litigants In the 2005 study, the Justice Gap Committee explored the possibility of obtaining data fromcourts and administrative agencies about the percentage of litigants who appear without represen-tation in particular categories of cases typically involving low-income people. LSC conducted apilot project involving four states to test the feasibility of collecting such data. However, the pilotstates were able to provide only isolated bits of data, and the 2005 Justice Gap Report identifiedanalysis of court data as a methodology that should be considered in future efforts.
Since the 2005 Justice Gap Report, more data has become available on this subject. In 2006, theNational Center for State Courts issued a compilation of reports on “self-represented”—or moreaccurately, unrepresented—litigants in lower state courts (the category of courts in which low-income people appear most frequently), as well as appellate state courts, and federal courts.31 Inaddition, reports from several states provide information about the income levels of unrepresentedlitigants.
In the spring of 2009, the Self-Represented Litigation Network, a coalition of major national organ-izations including the Conference of Chief Justices, Conference of State Court Administrators,National Association for Court Management, and LSC, hosted by the National Center for StateCourts, conducted a survey of judges and self-help programs to determine the impact of the currenteconomic downturn on the number of unrepresented litigants.32
Based on their own observations and currently available data, many judges, court administrators,members of the legal aid community, and commentators have raised concerns about unrepresent-ed litigants, arguing that most people who appear in court without an attorney do so because theycannot afford one, and that the outcome for the litigant (as well as the impact on the courts) canbe negative. A number of reports from state Supreme Court task forces and similar entities havecalled for increased funding for civil legal assistance as one response to the crisis in the courts causedby unrepresented litigants.
The following excerpts from reports by state blue-ribbon commissions in Iowa, New Hampshire,and Massachusetts all address the link between overburdened legal aid programs and the rise inunrepresented litigants, as well as the potentially overwhelming challenges that unrepresented liti-gants face in presenting their cases and the resulting impact on the court system.
n “Because of their unfamiliarity with the law and court procedures, pro se litigants have troublenegotiating the court system and require judicial staff to spend additional time explaining andassisting litigants through the process…. Legal services programs serving low-income Iowansare forced to routinely turn away large numbers of applicants for services due to limited staffor are only able to provide clients with advice over the telephone or through a pamphlet.
31 “Self-Represented Pro Se Statistics Memorandum,” September 25, 2006, National Center for State Courts,http://www.ncsconline.org/wc/publications/memos/prosestatsmemo.htm#other. The states from which lower state courtdata was reported (the most relevant data for the purposes of this report, as noted above), were California, Florida,Iowa, New Hampshire, Massachusetts, Utah, Washington, and Wisconsin.32 Surveys of judges and self-help programs were distributed by e-mail to contacts of the Self-Represented LitigationNetwork. Contacts included judges and others who had attended the Harvard Judicial Conference on the Self-Represented in 2007, the key contacts in every state of the Network, and those included in a national directory ofself-help centers. There were approximately 100 responses for each of the two surveys. For additional information onthe Self-Represented Litigation Network, see www.srln.org.
Although the increase in pro se litigants may be attributable to many factors, the limited anddecreasing availability of legal services to low-income Iowans is clearly a significant factor….While there are measures that can be taken and have been recommended to permit betteraccess to the courts for pro se litigants, representation by a competent attorney is still the bestalternative. However, decreased access to an attorney forces many desperate litigants toapproach the legal system pro se. Consequently, additional funding must be obtained toimprove the likelihood that those who are not financially able to hire a private attorney canaccess an attorney either through a legal services program or through a pro bono project.”
Report of the Joint Iowa Judges Association and Iowa State Bar Association
Task Force on Pro Se Litigation, May 2005
n “Recommendation #7: The State of New Hampshire should fully fund legal servicesstaffing for traditional civil legal services.The Commission recognizes that the current network of civil legal assistance is excellent, andin many ways a model in terms of the quality of representation and level of cooperationamong providers. That being said, the system is woefully overburdened…. The Commissionurges that this system be fully funded…. The rise in the number of pro se litigants presentsmany challenges: pro se parties are not trained in the law and hence often do an inadequatejob of representing themselves. Justice is therefore compromised, resulting in pro se litigantsbeing deprived of their full rights. The increase in the number of untrained litigants alsoundermines the smooth functioning of the courts by introducing delays and inefficiencies,adding further to legal costs for all.”
New Hampshire Citizens Commission on the State Courts, Report and Recommendations, June 2006
n “Studies have shown that, even though there may be other contributing factors, the primaryreason for the growth in self-representation is lack of financial resources. Because of budgetconstraints, legal services programs are forced to turn away many of those eligible for freelegal assistance…. Given the current economic downturn, there is every reason to expect thatstill more individuals will find it necessary to bring or defend civil cases of great personalimportance—involving family, housing, employment, and financial issues—without the ben-efit of counsel.”
Assessing the Needs of Self-Represented Litigants in Our Courts, Final Report and Recommendations
Massachusetts Supreme Judicial Court Steering Committee on Self-Represented Litigants, November 2008
Unrepresented by NecessityCurrently available data bears out these concerns, indicating that the vast majority of people whoappear without representation do so because they are unable to afford an attorney, and that a largepercentage of these are low-income people who qualify for legal aid.33 For example:
24 < Documenting the Justice Gap In America
33 Indeed, some people who represent themselves have received advice or written information about how to do so froma legal aid program; in many instances, these people actually need an attorney, but the legal aid program is able toprovide them only with these limited services. See discussion above at note 8.
n A 2005 study of unrepresented litigants in New York City Family and Housing Courtsfound that 57 percent had incomes under $20,000 per year and 83 percent had incomes ofunder $30,000 per year.34
n A 2003 California Report to the Legislature found that more than 90 percent of the450,000 people who use court self-help programs in the state each year earn less than $2,000per month.35
Growing Number of Unrepresented Litigants Although there is no national compilation of statistics on unrepresented litigants in court, datafrom some court systems shows extremely high numbers, often clustered in those courts in whichlow-income people are particularly likely to appear, such as family and housing courts:
n The state lower court data collected in the 2006 compilation from the National Center forState Courts demonstrates high numbers of people proceeding without representation in anumber of states.36 For example:
q A New Hampshire report found that one party was pro se in 85 percent of all civilcases in the district court and 48 percent of all civil cases in the superior court. Insuperior court domestic relations cases, almost 70 percent of cases had one pro separty, while in district court domestic violence cases, 97 percent of the cases haveone pro se party.
q A Utah study found that 49 percent of petitioners and 81 percent of respondents infamily law cases were unrepresented.
q A California study found that 67 percent of petitioners and 80 percent of respon-dents in family law cases were unrepresented; in unlawful detainer (eviction) cases,over 90 percent of defendants and 34 percent of petitioners at filing were unrepre-sented. In domestic violence restraining order cases, litigants are reported to be prose over 90 percent of the time.
q A Wisconsin study reported that 70 percent of litigants in family cases were unrepre-sented.
n More recently, the 2008 Massachusetts Supreme Judicial Court Steering Committee on Self-Represented Litigants Report estimated that at least 100,000 litigants were currently repre-senting themselves in civil matters. In the Probate and Family Court, as many as 80 percentof family law cases involved at least one unrepresented party. In the housing court, self-repre-sentation is the general rule among tenants and is increasing among landlords. Based on pastexperience and nationwide trends, the report predicts that these numbers will only increasein the future.37
Documenting the Justice Gap In America < 25
34 “Self-Represented Litigants: Characteristics, Needs, Services: the Results of Two Surveys,” Office of the DeputyChief Administrative Judge for Judicial Initiatives, December, 2005, Table 4, p. 4.35 “A Report to the California Legislature: Family Law Information Centers: An Evaluation Of Three Pilot Programs,”Judicial Council of California; Administrative Office of the Courts, 2003.36 Self-Represented Pro Se Statistics Memorandum, September 25, 2006, National Center for State Courts,http://www.ncsconline.org/wc/publications/memos/prosestatsmemo.htm#other.37 “Assessing the Needs of Self-Represented Litigants in Our Courts, Final Report and Recommendations,”Massachusetts Supreme Judicial Court Steering Committee on Self-Represented Litigants, November 2008.
n The 2008 District of Columbia legal needs study reported that 98 percent of both petition-ers and respondents in the Domestic Violence Unit of the DC Superior Court were unrepre-sented; approximately 77 percent of plaintiffs in divorce/custody/miscellaneous cases inFamily Court were unrepresented; more than 98 percent of respondents in paternity andchild support cases were unrepresented; 97 percent of respondents in housing court caseswere unrepresented.38
Recent Increases as a Result of the Economic CrisisWhile recent national court data on unrepresented litigants is not available, in a survey conductedin the spring of 2009 by the Self-Represented Litigation Network, 60 percent of the judgesresponding reported more unrepresented litigants in their courtrooms in that quarter than in thecorresponding quarter of the previous year.
Unrepresented Litigants and the Justice GapThe rising level of unrepresented litigants in state courts raises critically important questions relat-ing to LSC’s mandate of providing equal access to justice for those who cannot afford to pay anattorney. There is a growing body of research indicating that outcomes for unrepresented litigantsare often less favorable than those for represented litigants.39 Coordinated collection and analysis ofdata as well as additional research would be helpful to provide national information on how manypeople are appearing in court without representation, how many of them are doing so because theycannot afford or otherwise obtain counsel, the types of cases involved, and the impact of lack ofrepresentation on case outcomes.40 To the extent that litigants are proceeding without counselbecause they cannot afford an attorney, and the outcome of their case is being compromised by lackof representation, equal justice is at risk.
26 < Documenting the Justice Gap In America
38 “Justice for All? An Examination of the Civil Legal Needs of the District of Columbia’s Low-Income Community,”District of Columbia Access to Justice Commission, with the assistance of DLA Piper LLP, 2008.39 For a compilation of these studies, see Russell Engler, Connecting Self-Representation to Civil Gideon: WhatExisting Data Reveal About When Counsel is Most Needed, Fordham Urb. L.J. (forthcoming 2009).40 Specifically, key areas for potential research are: national figures on self-represented/unrepresented litigants, bystate, court and case type, distinguishing between those who receive support services and those who receive none; theconsequences of not having the full representation of an attorney and how these consequences vary by case type; andthe additional cost necessary to address the needs of the currently under-represented.
0
20%
40%
60%
80%
Table 7: Percentage of Judges Reporting an Impact of the Economic Crisis onUnrepresented Litigation (Survey by Self-Represented Litigation Network, Spring 2009)
Higher Caseload
56%60%
29%
Increase in Unrepresented No Impact
Documenting the Justice Gap In America < 27
Conclusion: Providing Necessary Access to Civil Legal Assistance
The challenge confronting the nation in providing equal access to justice is large, urgent and com-plex, as the research and analysis in this report shows. The serious shortage of civil legal assistanceidentified in the 2005 Justice Gap Report still exists. The progress that has been made in provid-ing civil legal assistance to the nation’s poor remains at risk because of a depressed economy and thecompetition for scarce government funds.
Legal aid clients are the most vulnerable among us and are as diverse as our nation, encompassingall races, ethnic groups and ages, including the working poor, homeowners and renters facing fore-closure or eviction, families with children, veterans, farmers, people with disabilities, victims of domes-tic violence and victims of natural disasters. Three out of four clients are women—many of whomare struggling to keep their children safe and their families together. According to the U.S. CensusBureau, nearly 54 million Americans are eligible for LSC-funded services. They are at or below 125percent of the federal poverty guidelines, an income of $27,563 a year for a family of four.41
The data in this report shows that:
n There is still a substantial justice gap. For every client served by an LSC-funded program, oneperson who seeks help is turned down because of insufficient resources. That was the conclu-sion of the 2005 Justice Gap Report, and the research for this report reaffirms that finding.
n There is now a substantial body of knowledge demonstrating that only a fraction of the legalproblems experienced by low-income individuals is addressed with the help of an attorney.State studies, sponsored by equal justice commissions, state bar associations and legal aid pro-grams, have drawn this conclusion, contribute to a body of work building since 1994, andreinforce a key finding of the 2005 Justice Gap Report.
n Nationally, on average, only one legal aid attorney is available to serve 6,415 low-incomepeople. In comparison, there is one private attorney providing personal legal services forevery 429 individuals in the general population.
n Most people who appear in state courts without an attorney do so because they cannot affordone, and the vast majority are low-income individuals who qualify for legal aid. The numberof unrepresented litigants, particularly in family and housing courts, is increasing—a criticalissue for courts and for LSC as it strives to ensure equal access to justice for all Americans.
As part of its mission, LSC has a responsibility to communicate to the public and the Congress onwhat is required to secure necessary access to civil legal assistance.
Accomplishing this goal will require a multifaceted approach which will include partnershipsamong federal and state governments, the organized bar, individual lawyers, private funders andconcerned private parties. LSC adopted an action plan in 2007—“Help Close the Justice Gap,Unleash the Power of Pro Bono”—to encourage greater private attorney involvement in the deliv-ery of civil legal assistance. The LSC Board of Directors approved a resolution in support ofenhanced private attorney involvement and urged LSC-funded programs to adopt similar local res-olutions to encourage pro bono services by the bar. More than 100 programs have done so. Across
41 Federal Register, Vol. 74, No. 19, January 30, 2009, page 5620.
the nation, the creation of Access to Justice Commissions has energized efforts to increase statefunding and pro bono support for civil legal aid. LSC has encouraged justices of state SupremeCourts and leaders of state bar associations to support the provision of high-quality civil legal serv-ices to low-income populations. LSC also has encouraged its grantees to help close the justice gapby carrying out their duties in the most efficient and economical way. In addition, LSC has urgedgrantees to enhance the services supported by federal funding through the use of technology andincreased collaborations with courts, law schools and community group. Legal services programs atthe state and local levels have increased funding for civil legal aid as a result of monetary contribu-tions from lawyers, the public, business entities and private foundations.
Since the 2005 Justice Gap Report, many state legislatures have recognized the need to help closethe justice gap in their states. During this period, 25 states and the District of Columbia adoptednew or increased funding for civil legal aid. Overall state legislative funding rose by 63 percent.42
In 2005, seven states had no state legislative funding for civil legal aid; in mid-2009, there are onlytwo. In addition, during these years, many state IOLTA programs also adopted new revenueenhancement measures that increased funding for civil legal aid.
However, these legislative and IOLTA increases only benefited the particular states involved. Thecurrent economic recession—and in particular, low interest rates and shortfalls in many statebudgets—is placing many of these gains at risk.
The federal government plays a vital role in providing a pathway to equal justice for all, consistentwith its role in maintaining the formal civil justice system and providing an orderly forum for theresolution of disputes. LSC serves as the primary conduit for the federal government’s share of civillegal assistance. It establishes the federal funding baseline, supporting and ensuring a backbone ofcivil legal aid providers throughout the country.
The findings in this report suggest a phased approach to addressing the unmet need. As a first, crit-ical goal, there must be enough funding to serve all of those currently seeking help from LSC-fund-ed programs. This requires a doubling of LSC funds and a doubling of the state, local and privatefunds that also support LSC grantees.
The long-term goal must be to develop resources sufficient to meet the civil legal needs of all eligi-ble low-income persons. Pro bono efforts need to be expanded substantially in the years ahead, buteven expanded pro bono contributions will not be enough to address a major portion of the unmetneed. As we observed in our 2005 report, to fund these needs, the federal share must grow to befive times greater than it is now, or $1.6 billion. IOLTA and other state, local and private fundingsources also will have to grow to address the overall needs.
In order to keep faith with our national commitment to equal access to justice, it is essential thatthe nation move toward the necessary funding levels and a renewed commitment to pro bonoefforts in firm, measured strides that are designed to close the justice gap as quickly as possible.Without such meaningful steps, the nation’s promise of equal justice for all will ring hollow for thenation’s poor.
28 < Documenting the Justice Gap In America
42 Based on resource data from the ABA Project to Expand Resources for Legal Services (PERLS), an initiative of theABA Standing Committee on Legal Aid and Indigent Defendants.
Appendices
Documenting the Justice Gap In America
Documenting the Justice Gap In America < A-1
A-2 < Documenting the Justice Gap In America
Documenting the Justice Gap In America < A-3
B-1 < Documenting the Justice Gap In America
Documenting the Justice Gap In America < C-1
D-1 < Documenting the Justice Gap In America
Documenting the Justice Gap In America < E-1
E-2 < Documenting the Justice Gap In America
Documenting the Justice Gap In America < E-3
E-4 < Documenting the Justice Gap In America
Documenting the Justice Gap In America < E-5
E-6 < Documenting the Justice Gap In America
Board of Directors
Frank B. Strickland, ChairmanMichael D. McKay, Vice ChairmanJonann C. ChilesThomas A. Fuentes Herbert S. Garten David Hall Thomas R. Meites Laurie Mikva Bernice Phillips-Jackson Sarah M. Singleton
President
Helaine M. Barnett
Legal Services Corporation3333 K Street, NW3rd FloorWashington, DC 20007202.295.1500 tel202.337.6797 faxwww.lsc.gov