Page 1
ORIGINAL RESEARCH
Does tautomerism influence the outcome of QSAR modeling?
Vijay H. Masand • Devidas T. Mahajan • Taibi Ben Hadda • Rahul D. Jawarkar •
Ahmed M. Alafeefy • Vesna Rastija • Mohamed Ashraf Ali
Received: 21 February 2013 / Accepted: 29 August 2013
� Springer Science+Business Media New York 2013
Abstract Tautomerism is an important aspect associated
with a variety of pharmacologically and biologically active
compounds. It is a challenge to account for tautomerism in
computer-aided drug designing (CADD). The estimations
and calculations of many physico-chemical properties and
theoretical descriptors of the molecules are sensitive to
tautomerism. In this study, we have attempted to analyze
the effect of tautomerism on feature selection and statistical
performance/characteristics of conventional quantitative
structure–activity relationship (QSAR) equations. These
equations are developed using 2D and 3D-descriptors
employing two different statistical methods, i.e., genetic
algorithm (GA) and stepwise regression (SR). Five datasets
of moderate sizes viz. (1) anti-malarial activity of synthetic
prodiginines against multi-drug resistant strain (N = 43),
(2) anti-malarial activity of bisaryl quinolones (N = 37),
(3) anti-malarial activity of phosphoramidate and phos-
phorothioamidate analogs of amiprophos methyl (N = 36),
(4) anti-proliferative activity of substituted N-phenyl urei-
dobenzenesulfonate derivatives (N = 44), and (5) anti-HIV
activity of indolylarylsulfones as HIV-1 non-nucleoside
reverse transcriptase inhibitors (N = 36) showing different
types of tautomerism were used in the study. In each case,
the developed model and the selected descriptors derived
using one tautomer were applied on other tautomeric forms
to understand the influence of tautomerism on QSAR
equations. Different parameters like R, R2, Radj2 , Rcv
2 , F,
S and Y-randomization were used for thorough validation
of all the models. The results revealed that tautomerism has
significant influence on feature selection. In addition, it was
found that tautomerism has a great influence on the per-
formance of QSAR models of the second and the third
datasets. However, no significant influence was observed
on the statistical characteristics of QSAR models for
datasets 1, 4, and 5. Therefore, it is suggested that separate
Electronic supplementary material The online version of thisarticle (doi:10.1007/s00044-013-0776-0) contains supplementarymaterial, which is available to authorized users.
V. H. Masand (&) � D. T. Mahajan
Department of Chemistry, Vidya Bharati College, Camp,
Amravati, Maharashtra, India
e-mail: [email protected] ; [email protected]
T. Ben Hadda
Laboratoire Chimie des Materiaux, Universite Mohammed
Premier, Oujda 60000, Morocco
R. D. Jawarkar
Department of Pharmaceutical Chemistry, P. Wadhwani College
of Pharmacy, Dhamangaon Rly. Road, Yavatmal, Maharashtra,
India
A. M. Alafeefy
Department of Pharmaceutical Chemistry, College of Pharmacy,
Salman Bin Abdulaziz University, P.O. Box 173, Alkharj 11942,
Saudi Arabia
V. Rastija
Department of Chemistry, Faculty of Agriculture, Josip Juraj
Strossmayer University of Osijek, Osijek 31000, Croatia
M. A. Ali
Pharmacogenetic and Pharmacogenomic Research, Institute for
Research in Molecular Medicine, Universiti Sains Malaysia,
Pennag 11800, Malaysia
123
Med Chem Res
DOI 10.1007/s00044-013-0776-0
MEDICINALCHEMISTRYRESEARCH
Page 2
models need to be developed for different tautomeric forms
of a dataset.
Keywords Tautomerism � QSAR � Statistical robustness �Stepwise regression � Genetic algorithm
Abbreviations
CADD Computer-aided drug design
QSAR Quantitative structure–activity relationship
CEU 2-Chloroethylurea
PIB-SO Phenyl-4-(2-oxoimidazolidin-1-yl)benzene
sulfonate
PUB-SO N-phenyl ureidobenzenesulfonate
PUB-SA N-phenylureidobenzenesulfonamide
CPU 3-Chloropropylurea
EU Ethylurea
Introduction
Developing a highly potent drug free from side effects for a
disease is the primary aim of drug designing and a large
number of molecules are synthesized and optimized to
realize this need. The conventional ‘trial and error’ method
that involves continuous cycles of ‘synthesis-testing’ is a
time taking, costly and laborious technique in drug
designing (Doweyko, 2008; Mahajan et al., 2012; Myint
and Xie, 2010; Scior et al., 2009). After synthesizing and
screening certain molecules, computer-aided drug design
(CADD) is employed in order to achieve high success rate
and reduce the time taken for the process. Quantitative
structure–activity relationship (QSAR), molecular model-
ing, molecular docking and pharmacophore modeling, each
having its own advantages and limitations, are major
thriving contemporary techniques in CADD (Masand et al.,
2010, 2012; Schwab, 2010; Van Drie, 2007).
QSAR is an established and widely appreciated diag-
nostic chemometric technique that correlates biological
activity with structural features (Baumann and Stiefl, 2004;
da Cunha et al., 2011; Golbraikh and Tropsha, 2002;
Gramatica and Papa, 2007; Gramatica et al., 2007; Kub-
inyi, 2002; Mahajan et al., 2013; Tropsha, 2010). The
conventional QSAR modeling involves the establishment
of an appropriately validated mathematical equation cor-
relating biological activity/response with one or more
molecular descriptors. These descriptors represent the
structural patterns/features having significant correlation
with the response (Beheshti et al., 2012; Consonni et al.,
2010; Mitra et al., 2011, 2012; Roy et al., 2008). For a
successful QSAR analysis, the developed equation must be
statistically robust with a minimum correlation (R \ 0.60)
among the descriptors. Appropriately validated QSAR
models are very useful for the prediction of activities even
before the synthesis of potential compounds. It has been
widely accepted that the development of statistically robust
QSAR models depend on the quality of experimental data,
selection of descriptors and statistical methods (Gramatica
and Papa, 2007; Gramatica et al., 2007; Huang and Fan,
2011; Mitra et al., 2011, 2012; Sahigara et al., 2012; Yi
and Zhang, 2012). Presently, plenty of advanced methods,
statistical algorithms and techniques are available for the
calculation and selection of descriptors, thereby, making
the process of building a statistically significant QSAR
model relatively simple and more straightforward.
Overall, a QSAR equation represents a simplified,
coherent, structure-based summary of patterns for a par-
ticular set of congeneric molecules apropos of a biological
activity/property in a statistical way. The understanding of
these patterns accelerates the process of finding new ther-
apeutic agents or successfully modifying the existing ones.
Many researchers carry out the QSAR analysis to find
patterns for lead optimization. During the QSAR analysis,
myriad numbers of QSAR equations are developed. The
analysis is followed by the selection of an appropriate
QSAR equation on the basis of its statistical performance
(Hawkins, 2004; Hawkins et al., 2008; Kiralj and Ferreira,
2009; Pratim Roy et al., 2009; Tropsha, 2010). The QSAR
equation is selected from various statistically acceptable
and equally feasible alternative QSAR equations.
The selection of a QSAR equation merely on the bases
of statistical parameters is very exigent and tricky. The
situation becomes more complicated when congeneric
molecules can exhibit tautomerization. Tautomers can
interchange due to the migration of a labile hydrogen atom
or proton (termed as prototropy). They are structural iso-
mers of organic compounds that interconvert with a rela-
tively low activation energy below ca. 20 kcal/mol. Many
pharmaceutically and biologically important molecules
exhibit prototropy. Tautomerism can transform H-donor to
H-acceptor and vice-versa (Oellien et al., 2006). Tautomers
usually have different physico-chemical properties like
pKa, logP, solubility, etc. (Martin, 2009, 2010). The tau-
tomeric form that is energetically favored in solution may
not be the ‘bioactive tautomeric form’ of a molecule that
can interact with a specific receptor. Molecules showing
tautomerism can have different interacting tendencies
toward receptors. A molecule may interact with different
receptors in different tautomeric forms (Trepalin et al.,
2003). For example, inside the DNA, adenine normally
pairs with thymine but the imino form of adenine pairs with
cytosine (Shugar and Kierdaszuk, 1985). The existence of a
particular tautomer depends on factors like dielectric con-
stant of medium, pH, lipophilicity, etc. Many computer-
based applications consider tautomers as different
Med Chem Res
123
Page 3
structures, resulting in small to significant changes in the
values of 2D- and 3D-descriptors, especially for the theo-
retically calculated descriptors (Thalheim et al., 2010; Zou
et al., 2007). Many researchers have emphasized that tau-
tomerism tends to complicate the calculation of molecular
descriptors/properties, which consequently, affects the
development of a QSAR equation for conventional 2D-
QSAR analysis (Pospisil et al., 2003; Zou et al., 2007).
Tautomerism can have a significant influence on CADD
(Oellien et al., 2006; Pospisil et al., 2003; Zou et al., 2007).
In this study, we have attempted to understand the effect
of tautomerism on feature selection and statistical perfor-
mance/characteristics of conventional QSAR equation
development using 2D- and 3D-descriptors using two dif-
ferent statistical methods.
Datasets
Dataset-1
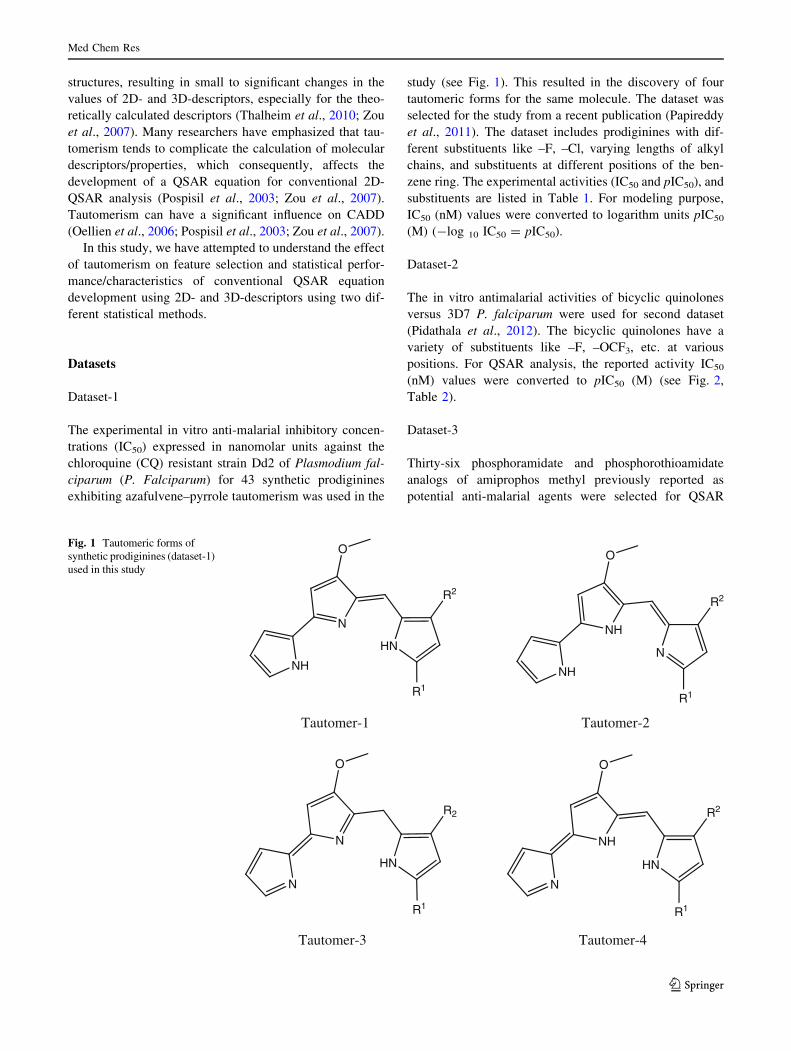
The experimental in vitro anti-malarial inhibitory concen-
trations (IC50) expressed in nanomolar units against the
chloroquine (CQ) resistant strain Dd2 of Plasmodium fal-
ciparum (P. Falciparum) for 43 synthetic prodiginines
exhibiting azafulvene–pyrrole tautomerism was used in the
study (see Fig. 1). This resulted in the discovery of four
tautomeric forms for the same molecule. The dataset was
selected for the study from a recent publication (Papireddy
et al., 2011). The dataset includes prodiginines with dif-
ferent substituents like –F, –Cl, varying lengths of alkyl
chains, and substituents at different positions of the ben-
zene ring. The experimental activities (IC50 and pIC50), and
substituents are listed in Table 1. For modeling purpose,
IC50 (nM) values were converted to logarithm units pIC50
(M) (-log 10 IC50 = pIC50).
Dataset-2
The in vitro antimalarial activities of bicyclic quinolones
versus 3D7 P. falciparum were used for second dataset
(Pidathala et al., 2012). The bicyclic quinolones have a
variety of substituents like –F, –OCF3, etc. at various
positions. For QSAR analysis, the reported activity IC50
(nM) values were converted to pIC50 (M) (see Fig. 2,
Table 2).
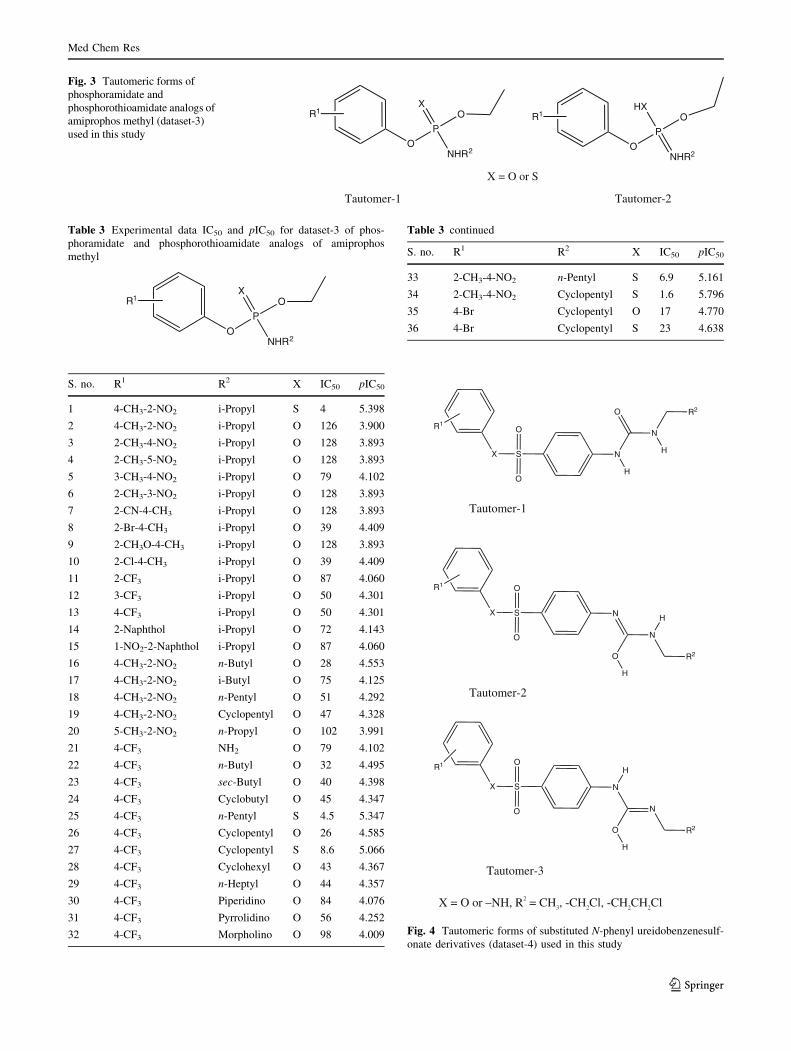
Dataset-3
Thirty-six phosphoramidate and phosphorothioamidate
analogs of amiprophos methyl previously reported as
potential anti-malarial agents were selected for QSAR
N
HN
O
R1
NH
R2
NH
N
O
R1
NH
R2
N
HN
O
R1
N
R2
NH
HN
O
R1
N
R2
Tautomer-2Tautomer-1
Tautomer-4Tautomer-3
Fig. 1 Tautomeric forms of
synthetic prodiginines (dataset-1)
used in this study
Med Chem Res
123
Page 4
Table 1 Experimental data IC50 and pIC50 for dataset-1 of synthetic prodiginines
R1
N HN
R3
R2
O
S. no. R1 R2 R3 IC50 (nM)
Dd2
pIC50
expt.
1 2-pyrolyl n-C4H9 H 1,590 5.799
2 2-pyrolyl n-C6H13 H 450 6.347
3 2-pyrolyl n-C8H17 H 130 6.886
4 2-pyrolyl n-C16H33 H 400 6.398
5 2-pyrolyl H CH2CH(CH3)2 230 6.638
6 2-pyrolyl H n-C4H9 18 7.745
7 2-pyrolyl H n-C6H13 7 8.155
8 2-pyrolyl H n-C8H17 1.8 8.745
9 2-pyrolyl H n-C10H21 10 8.000
10 2-pyrolyl H C6H5CH2 86 7.066
11 2-pyrolyl H 4-OCH3C6H4CH2 156 6.807
12 2-pyrolyl H 4-ClC6H4CH2 81 7.092
13 2-pyrolyl H 4-BrC6H4CH2 108 6.967
14 2-pyrolyl CH3 CH3 8,130 5.090
15 2-pyrolyl n-C6H13 n-C3H7 4.0 8.398
16 2-pyrolyl n-C8H17 n-C3H7 2.7 8.569
17 2-pyrolyl n-C3H7 1.3 8.886
18 2-pyrolyl n-C6H13 n-C6H13 1.1 8.959
19 2-pyrolyl n-C7H15 n-C6H13 1.2 8.921
20 2-pyrolyl n-C6H13 n-C8H17 2.0 8.699
21 2-pyrolyl n-C7H15 n-C8H17 2.9 8.538
22 2-pyrolyl n-C8H17 n-C8H17 129 6.889
23 2-pyrolyl 3.5 8.456
24 2-pyrolyl C2H5 4-ClC6H4CH2 6.2 8.208
25 2-pyrolyl n-C3H7 4-ClC6H4CH2 2.6 8.585
26 2-pyrolyl n-C6H13 4-ClC6H4CH2 1.8 8.745
27 2-pyrolyl n-C7H15 4-ClC6H4CH2 2.2 8.658
28 2-pyrolyl n-C8H17 4-ClC6H4CH2 12.0 7.921
29 2-pyrolyl 4-ClC6H4CH2 2.9 8.538
30 2-pyrolyl n-C6H13 4-FC6H4CH2 0.9 9.046
31 2-pyrolyl n-C8H17 4-FC6H4CH2 1.2 8.921
32 2-pyrolyl n-C6H13 4-BrC6H4CH2 2.8 8.553
33 2-pyrolyl n-C8H17 4-BrC6H4CH2 2.9 8.538
34 2-pyrolyl 4-ClC6H4CH2 4-ClC6H4CH2 4.8 8.319
35 2-pyrolyl 4-FC6H4CH2 4-FC6H4CH2 5.7 8.244
Med Chem Res
123
Page 5
Y NH
O
R1
X
A
R2
Y N
HO
R1
X
A
R2
Tautomer-2Tautomer-1
Fig. 2 Tautomeric forms of bisaryl quinolones (dataset-2) used in this study
Table 2 Experimental data IC50 and pIC50 for dataset-2 of bisaryl quinolones
Y NH
A
O
R1
R2
X
S.
no.
X Y R1 A R2 IC50 pIC50
1 H N –CH3 pCH2 OCF3 407 6.390
2 7-F CH –CH3 pCH2 OCF3 69 7.161
3 6-F, 7-F CH –CH3 pCH2 OCF3 24 7.620
4 H N –CH3 pCH2 F 506 6.296
5 H CH H pCH2 OCF3 48 7.319
6 6-F, 7-F CH H pCH2 OCF3 16 7.796
7 6-Cl, 7-Cl CH H pCH2 OCF3 28 7.553
8 6-F, 7-OMe CH H pC2 OCF3 39 7.409
9 N N6 CH H pCH2 OCF3 430 6.367
Table 1 continued
S. no. R1 R2 R3 IC50 (nM)
Dd2
pIC50
expt.
36 2-pyrolyl 4-BrC6H4CH2 4-BrC6H4CH2 11.0 7.959
37 2-pyrolyl 4-FC6H4CH2 4-ClC6H4CH2 6.1 8.215
38 2-pyrolyl 4-BrC6H4CH2 4-ClC6H4CH2 7.7 8.114
39 2-pyrolyl 4-BrC6H4CH2 4-FC6H4CH2 5.1 8.292
40 2-pyrolyl 2,4-Cl2C6H3CH2 2,4-Cl2C6H3CH2 11.0 7.959
41 2-pyrolyl 2,4-F2C6H3CH2 2,4-F2C6H3CH2 18.3 7.738
42 2-pyrolyl 3-FC6H4CH2 3-FC6H4CH2 6.7 8.174
43 2-pyrolyl 2-ClC6H4CH2 2-ClC6H4CH2 4.9 8.310
Med Chem Res
123
Page 6
analysis (Mara et al., 2011). The activity values IC50 (lM)
were converted to pIC50 (M) (see Fig. 3, Table 3). The
phosphoramidate and phosphorothioamidate analogs of
amiprophos methyl have a variety of substituents at various
positions.
Dataset-4
Forty-four substituted N-phenyl ureidobenzenesulfonate
derivatives that block cell cycle progression in S-phase
were selected (Turcotte et al., 2012). These substituted N-
phenyl ureidobenzenesulfonate derivatives have a variety
of substituents. The activity values IC50 (lM) were con-
verted to pIC50 (M) (see Fig. 4, Table 4).
Dataset-5
A set of 36 indolylarylsulfones previously reported as anti-
HIV-1 non-nucleoside reverse transcriptase inhibitors were
selected (La Regina et al., 2011). The activity values IC50
(nM) were converted to pIC50 (M) (see Fig. 5, Table 5).
Methodology
Tautomer equilibria in homologous structures depend on
the structure and the fractions of individual tautomers. The
equilibrium mixture varies from compound to compound in
the set. These fractions play an important role in deter-
mining the correct correlation equation. Detailed
Table 2 continued
S.
no.
X Y R1 A R2 IC50 pIC50
10N N7
CH H pCH2 OCF3 443 6.354
11 H CH H pCH2 CO2Me 272 6.565
12 H CH Cl pCH2 OCF3 19 7.721
13 H CH –CH3 pCH2 H 107 6.971
14 H CH –CH3 pCH2 OCF3 117 6.932
15 H CH –CH3 mCH2 OCF3 26 7.585
16 H CH –CH3 pCH2 F 83 7.081
17 H CH –CH3 pCH2 OMe 35 7.456
18 6-CF3 CH –CH3 pCH2 OCF3 654 6.184
19 7-CF3 CH –CH3 pCH2 OCF3 212 6.674
20 7-Cl CH –CH3 pCH2 OCF3 36 7.444
21 6-Cl, 7-F CH –CH3 pCH2 OCF3 70 7.155
22 6-F, 7-Cl CH –CH3 pCH2 OCF3 38 7.420
23 5-OMe CH –CH3 pCH2 OCF3 664 6.178
24 6-OMe CH –CH3 pCH2 OCF3 465 6.333
25 7-OMe CH –CH3 pCH2 OCF3 8 8.097
26 8-OMe CH –CH3 pCH2 OCF3 381 6.419
27 6-Cl CH –CH3 mCH2 OCF3 8.4 8.076
28 7-Cl CH –CH3 mCH2 OCF3 34 7.469
29 7-Cl CH –CH3 mCH2 F 105 6.979
30 7-Cl CH –CH3 pCH2 OCF3 30 7.523
31 H CH –CH3 pO OCF3 26 7.585
32 7-Cl CH –CH3 pO OCF3 73 7.137
33 H CH –CH3 pO Cl 230 6.638
34 6-OH CH –CH3 pCH2 OCF3 465 6.333
35 7-OH CH –CH3 pCH2 OCF3 139 6.857
36 8-OH CH –CH3 pCH2 OCF3 819 6.087
37 6-OAc CH –CH3 pCH2 OCF3 408 6.389
Med Chem Res
123
Page 7
O
P
NHR2
OX
R1
O
P
NHR2
OHX
R1
X = O or S
Tautomer-2Tautomer-1
Fig. 3 Tautomeric forms of
phosphoramidate and
phosphorothioamidate analogs of
amiprophos methyl (dataset-3)
used in this study
Table 3 Experimental data IC50 and pIC50 for dataset-3 of phos-
phoramidate and phosphorothioamidate analogs of amiprophos
methyl
O
P
NHR2
OX
R1
S. no. R1 R2 X IC50 pIC50
1 4-CH3-2-NO2 i-Propyl S 4 5.398
2 4-CH3-2-NO2 i-Propyl O 126 3.900
3 2-CH3-4-NO2 i-Propyl O 128 3.893
4 2-CH3-5-NO2 i-Propyl O 128 3.893
5 3-CH3-4-NO2 i-Propyl O 79 4.102
6 2-CH3-3-NO2 i-Propyl O 128 3.893
7 2-CN-4-CH3 i-Propyl O 128 3.893
8 2-Br-4-CH3 i-Propyl O 39 4.409
9 2-CH3O-4-CH3 i-Propyl O 128 3.893
10 2-Cl-4-CH3 i-Propyl O 39 4.409
11 2-CF3 i-Propyl O 87 4.060
12 3-CF3 i-Propyl O 50 4.301
13 4-CF3 i-Propyl O 50 4.301
14 2-Naphthol i-Propyl O 72 4.143
15 1-NO2-2-Naphthol i-Propyl O 87 4.060
16 4-CH3-2-NO2 n-Butyl O 28 4.553
17 4-CH3-2-NO2 i-Butyl O 75 4.125
18 4-CH3-2-NO2 n-Pentyl O 51 4.292
19 4-CH3-2-NO2 Cyclopentyl O 47 4.328
20 5-CH3-2-NO2 n-Propyl O 102 3.991
21 4-CF3 NH2 O 79 4.102
22 4-CF3 n-Butyl O 32 4.495
23 4-CF3 sec-Butyl O 40 4.398
24 4-CF3 Cyclobutyl O 45 4.347
25 4-CF3 n-Pentyl S 4.5 5.347
26 4-CF3 Cyclopentyl O 26 4.585
27 4-CF3 Cyclopentyl S 8.6 5.066
28 4-CF3 Cyclohexyl O 43 4.367
29 4-CF3 n-Heptyl O 44 4.357
30 4-CF3 Piperidino O 84 4.076
31 4-CF3 Pyrrolidino O 56 4.252
32 4-CF3 Morpholino O 98 4.009
Table 3 continued
S. no. R1 R2 X IC50 pIC50
33 2-CH3-4-NO2 n-Pentyl S 6.9 5.161
34 2-CH3-4-NO2 Cyclopentyl S 1.6 5.796
35 4-Br Cyclopentyl O 17 4.770
36 4-Br Cyclopentyl S 23 4.638
S
O
O
X N
H
O
N
H
R2
R1
S
O
O
X N
O
H
N
H
R2
R1
S
O
O
X N
H
O
H
N
R2
R1
Tautomer-1
Tautomer-2
Tautomer-3
X = O or –NH, R2 = CH3, -CH2Cl, -CH2CH2Cl
Fig. 4 Tautomeric forms of substituted N-phenyl ureidobenzenesulf-
onate derivatives (dataset-4) used in this study
Med Chem Res
123
Page 8
Table 4 Experimental data IC50 and pIC50 for dataset-4 of substituted N-phenyl ureidobenzenesulfonate derivatives
S
O
O
X N
H
O
N
H
R2
R1
S. no. X R1 R2 IC50 (lM)
(HT-29)
pIC50 (M)
(HT-29)
1 O 4-OH 4-CEU 1.5 5.824
2 O 2-Me 3-CEU 33 4.481
3 O 2-CH2-CH3 3-CEU 4.3 5.367
4 O 2-(CH2)2-CH3 3-CEU 15 4.824
5 O 4-OH 3-CEU 120 3.921
6 O 2-CH2-CH3 4-CEU 17 4.770
7 O 2-(CH2)2-CH3 4-CEU 2.5 5.602
8 NH 2-Me 3-CEU 71 4.149
9 NH 2-CH2-CH3 3-CEU 48 4.319
10 NH 2-(CH2)2-CH3 3-CEU 15 4.824
11 NH 2-Me 4-CEU 55 4.260
12 NH 2-CH2-CH3 4-CEU 40 4.398
13 NH 2-(CH2)2-CH3 4-CEU 21 4.678
14 O 2-Me 3-CPU 21 4.678
15 O 2-CH2-CH3 3-CPU 23 4.638
16 O 2-(CH2)2-CH3 3-CPU 14 4.854
17 O 4-OH 3-CPU 51 4.292
18 O 2-Me 4-CPU 26 4.585
19 O 2-CH2-CH3 4-CPU 15 4.824
20 O 2-(CH2)2-CH3 4-CPU 13 4.886
21 O 4-OH 4-CPU 50 4.301
22 NH 2-Me 3-CPU 42 4.377
23 NH 2-CH2-CH3 3-CPU 96 4.018
24 NH 2-(CH2)2-CH3 3-CPU 15 4.824
25 NH 2-Me 4-CPU 64 4.194
26 NH 2-(CH2)2-CH3 4-CPU 26 4.585
27 O 2-Me 4-CEU 4.7 5.328
28 O 2-Me 3-EU 44 4.357
29 O 2-CH2-CH3 3-EU 33 4.481
30 O 2-(CH2)2-CH3 3-EU 25 4.602
31 O 4-OH 3-EU 75 4.125
32 O 2-Me 4-EU 12 4.921
33 O 2-CH2-CH3 4-EU 12 4.921
34 O 2-(CH2)2-CH3 4-EU 2.4 5.620
35 O 4-OH 4-EU 12 4.921
36 O 3-Me 4-CEU 7.2 5.143
37 NH 2-Me 3-EU 102 3.991
38 NH 2-CH2-CH3 3-EU 15 4.824
39 NH 2-(CH2)2-CH3 3-EU 41 4.387
40 NH 2-CH2-CH3 4-EU 86 4.066
Med Chem Res
123
Page 9
information about the fractions can be obtained using
publicly available resources, such as SPARC web server
(https://archemcalc.com/sparc.html). Therefore, before
building the QSAR models, the possible fractions for dif-
ferent tautomeric forms for all datasets were checked using
SPARC web server. In all the datasets, the tautomeric form
that has been predicted to be most stable by the SPARC
web server, has been designated as tautomer form 1. In this
work, we have adopted a simplistic approach to check the
effect of tautomerism on feature selection, statistical
characteristics and performance of QSAR equations with
the assumption that the entire set of compounds is present
in the same tautomeric form.
The tautomeric structures were drawn using ACD
Chemsketch 12 freeware. The 3D conversion and geometry
optimization were carried out using a molecular mechanics
method available in the program VegaZZ, using Gasteiger
partial charges and Tripos force field (Liu and Long, 2009;
Tetko, 2005). To calculate various theoretical molecular
descriptors, the optimized structures were uploaded on
e-DRAGON server. For model building, stepwise regres-
sion (SR) and GA-MLR methods were used. The SR
Table 4 continued
S. no. X R1 R2 IC50
(lM)(HT-29)
pIC50
(M)(HT-29)
41 NH 2-(CH2)2-CH3 4-EU 32 4.495
42 O 4-Me 4-CEU 30 4.523
43 O 4-OMe 4-CEU 18 4.745
44 O 4-N(Me)2 4-CEU 39 4.409
CEU 2-chloroethylurea, PIB-SO phenyl-4-(2-oxoimidazolidin-1-yl)benzenesulfonate, PUB-SO N-phenyl ureidobenzenesulfonate, PUB-SA N-
phenylureidobenzenesulfonamide, CPU 3-chloropropylurea, EU ethylurea
NH
O
N
H
SO
OR2
R1
NH
HO
N
SO
OR2
R1
Tautomer-2Tautomer-1
Fig. 5 Tautomeric forms of indole-2-carboxamides (dataset-5) used
in this study
Table 5 Experimental data IC50 and pIC50 for dataset-5 of indole-2-
carboxamides
NH
O
N
H
SO
OR2
R1
S. no. R1 R2 IC50 (nM) pIC50 (M)
1 5-Cl
N
3.3 8.481
2 5-Br 1.3 8.886
3 5-NO2 2.5 8.602
4 5-Cl, 4-F 3.9 8.409
5 5-Cl
N
1.3 8.886
6 5-Br 3.7 8.432
7 5-NO2 3.1 8.509
8 5-Cl, 4-F 3.9 8.409
9 5-Cl
N O
1.9 8.721
10 5-Br 3.4 8.469
11 5-NO2 5.8 8.237
12 5-Cl, 4-F 2.5 8.602
13 5-Cl 5.7 8.244
14 5-Br 5.7 8.244
15 5-NO2 6.2 8.208
16 5-Cl, 4-F 5.8 8.237
Med Chem Res
123
Page 10
analysis involves forward and backward selection with
F = 4 and 3.5 for inclusion and exclusion, respectively.
For genetic algorithm (GA) analysis, default settings in
QSARINS were used. Minitab (for SR) and QSARINS (for
GA) were used to build multi-linear regression equations
(Liu and Long, 2009).
In this study, a QSAR equation built (using SR or GA)
successfully for one (parent) tautomeric form was per-
formed on other tautomeric forms to check the influence of
tautomerism on statistical reliability of the QSAR model.
For the further evaluation of the influence of tautomerism
on feature selection, a set of significant descriptors selected
using the parent tautomeric forms were used to build
QSAR equations for the parent form as well as other tau-
tomeric forms. This assured the correlation ability of the
selected descriptors. In an attempt to develop highly pre-
dictive and informative QSAR equation, minimum
orthogonal descriptors have been included in the equations.
Results and discussion
The results of the analyses on all the datasets are summarized
in Tables 2, 3, 4, 5, 6, 7, 8, 9, 10, 11, 12, 13, 14, and 15.
The high values of R, R2, Radj2 , Rcv
2 , and F with low
values of S and PRESS for different tautomeric forms
reveal that most of the equations are statistically robust
(Gramatica and Papa, 2007; Gramatica et al., 2007; Ma-
hajan et al., 2013; Masand et al., 2010, 2012, 2013a; Mitra
et al., 2011, 2012). The close values of R2 and Rcv2 reveal
that the equations are statistically stable apropos of inclu-
sion/exclusion of molecules in the dataset.
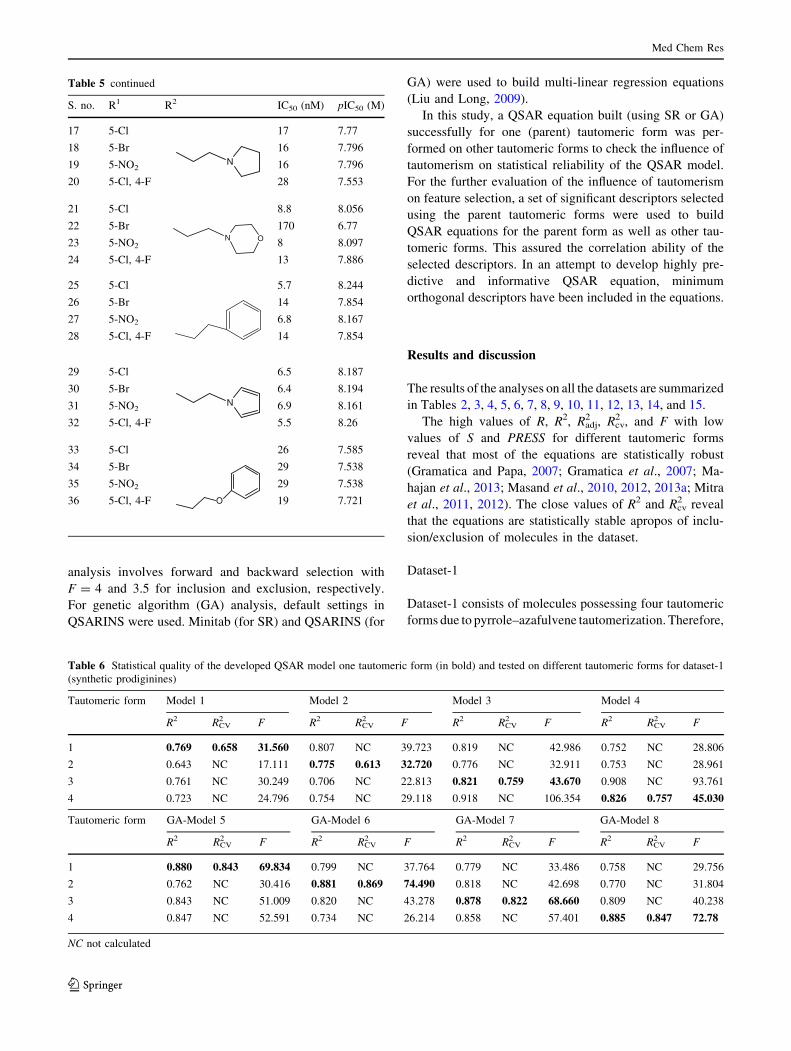
Dataset-1
Dataset-1 consists of molecules possessing four tautomeric
forms due to pyrrole–azafulvene tautomerization. Therefore,
Table 5 continued
S. no. R1 R2 IC50 (nM) pIC50 (M)
17 5-Cl
N
17 7.77
18 5-Br 16 7.796
19 5-NO2 16 7.796
20 5-Cl, 4-F 28 7.553
21 5-Cl
N O
8.8 8.056
22 5-Br 170 6.77
23 5-NO2 8 8.097
24 5-Cl, 4-F 13 7.886
25 5-Cl 5.7 8.244
26 5-Br 14 7.854
27 5-NO2 6.8 8.167
28 5-Cl, 4-F 14 7.854
29 5-Cl
N
6.5 8.187
30 5-Br 6.4 8.194
31 5-NO2 6.9 8.161
32 5-Cl, 4-F 5.5 8.26
33 5-Cl
O
26 7.585
34 5-Br 29 7.538
35 5-NO2 29 7.538
36 5-Cl, 4-F 19 7.721
Table 6 Statistical quality of the developed QSAR model one tautomeric form (in bold) and tested on different tautomeric forms for dataset-1
(synthetic prodiginines)
Tautomeric form Model 1 Model 2 Model 3 Model 4
R2 RCV2 F R2 RCV
2 F R2 RCV2 F R2 RCV
2 F
1 0.769 0.658 31.560 0.807 NC 39.723 0.819 NC 42.986 0.752 NC 28.806
2 0.643 NC 17.111 0.775 0.613 32.720 0.776 NC 32.911 0.753 NC 28.961
3 0.761 NC 30.249 0.706 NC 22.813 0.821 0.759 43.670 0.908 NC 93.761
4 0.723 NC 24.796 0.754 NC 29.118 0.918 NC 106.354 0.826 0.757 45.030
Tautomeric form GA-Model 5 GA-Model 6 GA-Model 7 GA-Model 8
R2 RCV2 F R2 RCV
2 F R2 RCV2 F R2 RCV
2 F
1 0.880 0.843 69.834 0.799 NC 37.764 0.779 NC 33.486 0.758 NC 29.756
2 0.762 NC 30.416 0.881 0.869 74.490 0.818 NC 42.698 0.770 NC 31.804
3 0.843 NC 51.009 0.820 NC 43.278 0.878 0.822 68.660 0.809 NC 40.238
4 0.847 NC 52.591 0.734 NC 26.214 0.858 NC 57.401 0.885 0.847 72.78
NC not calculated
Med Chem Res
123
Page 11
four different QSAR models were developed for each tau-
tomeric form. The developed QSAR model for the parent
tautomer was applied on other tautomeric forms. Interest-
ingly, for all the tautomeric forms, the statistical perfor-
mances of all the models are acceptable with close values of
R2 and F, thereby, indicating insensitivity of QSAR models
toward tautomerism.
Models 1 and 5 built using tautomeric form 1 (as parent
tautomeric form, shown in bold) showed a R2 = 0.769 and
Table 7 Statistical quality of the developed QSAR models using descriptors selected from one tautomeric form to other tautomeric forms for
dataset-1 (synthetic prodiginines)
Tautomeric form Descriptors from Model 1 Descriptors from Model 2 Descriptors from Model 3 Descriptors from Model 4
R6u?, R1u, EEig02r,
Mor18p
F06[C–N], R1u, RDF035p,
G(N..N)
BELp7, WA, SP01,
RDF150v
BELp7, WA, SP01,
RDF045u
R2 RCV2 F R2 RCV
2 F R2 RCV2 F R2 RCV
2 F
1 0.769 0.658 31.56 0.794 0.712 36.69 0.817 0.758 42.53 0.774 0.670 32.45
2 0.740 0.602 27.03 0.775 0.613 32.72 0.832 0.777 46.92 0.695 0.580 21.67
3 0.707 0.543 22.97 0.774 0.594 32.45 0.821 0.759 43.67 0.813 0.737 41.38
4 0.738 0.603 26.80 0.780 0.624 33.67 0.820 0.757 43.37 0.826 0.757 45.03
Tautomeric form Descriptors from GA-Model 5 Descriptors from GA-Model 6 Descriptors from GA-Model 7 Descriptors from GA-Model 8
ATS6e, VEe1,
RDF090p, HATS0u
SMTI, ATS6p,
EEig04d, RDF080m
TWC, ATS6v,
GATS2e, BELe7
SRW02, ATS6e,
RDF100v, HATS0e
R2 RCV2 F R2 RCV
2 F R2 RCV2 F R2 RCV
2 F
1 0.880 0.843 69.83 0.834 0.778 47.73 0.871 0.808 64.12 0.875 0.833 66.58
2 0.874 0.834 65.72 0.881 0.869 74.49 0.843 0.777 50.86 0.883 0.845 71.89
3 0.858 0.809 57.26 0.787 0.720 35.14 0.878 0.822 68.66 0.878 0.838 68.64
4 0.875 0.835 66.25 0.797 0.737 37.39 0.887 0.831 74.57 0.885 0.847 72.78
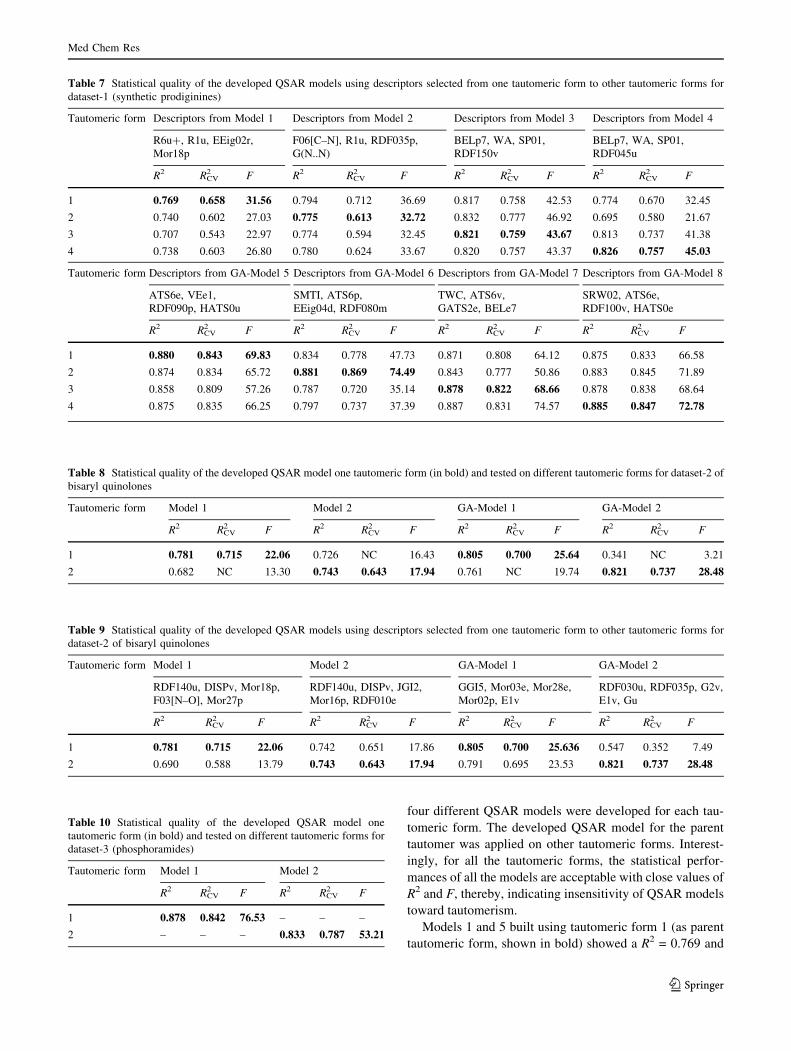
Table 8 Statistical quality of the developed QSAR model one tautomeric form (in bold) and tested on different tautomeric forms for dataset-2 of
bisaryl quinolones
Tautomeric form Model 1 Model 2 GA-Model 1 GA-Model 2
R2 RCV2 F R2 RCV
2 F R2 RCV2 F R2 RCV
2 F
1 0.781 0.715 22.06 0.726 NC 16.43 0.805 0.700 25.64 0.341 NC 3.21
2 0.682 NC 13.30 0.743 0.643 17.94 0.761 NC 19.74 0.821 0.737 28.48
Table 9 Statistical quality of the developed QSAR models using descriptors selected from one tautomeric form to other tautomeric forms for
dataset-2 of bisaryl quinolones
Tautomeric form Model 1 Model 2 GA-Model 1 GA-Model 2
RDF140u, DISPv, Mor18p,
F03[N–O], Mor27p
RDF140u, DISPv, JGI2,
Mor16p, RDF010e
GGI5, Mor03e, Mor28e,
Mor02p, E1v
RDF030u, RDF035p, G2v,
E1v, Gu
R2 RCV2 F R2 RCV
2 F R2 RCV2 F R2 RCV
2 F
1 0.781 0.715 22.06 0.742 0.651 17.86 0.805 0.700 25.636 0.547 0.352 7.49
2 0.690 0.588 13.79 0.743 0.643 17.94 0.791 0.695 23.53 0.821 0.737 28.48
Table 10 Statistical quality of the developed QSAR model one
tautomeric form (in bold) and tested on different tautomeric forms for
dataset-3 (phosphoramides)
Tautomeric form Model 1 Model 2
R2 RCV2 F R2 RCV
2 F
1 0.878 0.842 76.53 – – –
2 – – – 0.833 0.787 53.21
Med Chem Res
123
Page 12
0.880, respectively, for the parent form. For the other tau-
tomeric forms, R2 is statistically significant and comparable
with R2 of the parent tautomeric form (ranging from 0.643 to
0.769 for model 1, and from 0.762 to 0.880 for model 5) (see
Table 6). Parallel observations were found to be true for
models 2 and 6 as well. Interestingly, for models 3 and 7 built
using tautomeric form 3 (as parent tautomeric form, shown in
bold) consistently high values of R2 and F were observed for
parent form as compared to other tautomeric forms. This
indicates that the model 3, based on tautomeric form 3, would
be predictably more suitable for biological activity. In other
words, the descriptors and the structural features of tautomer
3 explain maximum variations in activity. This observation
is confirmed by the consistently high values of R2 and F for
parent and other tautomeric forms, when a set of significant
descriptors were selected using parent tautomeric form 3 to
build QSAR equations for all the tautomeric forms (see
Table 7). This result indicates that tautomeric form 3 could
be the ‘bioactive tautomer’ for antimalarial activity of
prodiginines.
Surprisingly, for tautomers 3 and 4, the best models 3
and 4 have three common descriptors (BELp7, WA, SP01)
and they are different with respect to only one descriptor
(RDF150v and RDF045u in models 3 and 4, respectively).
In addition, for model 3, highest R2 and F values were
observed when it was applied on the tautomer form 4.
Similar observations were found to be correct for model 4.
This observation can be plausibly associated with the
ability of the descriptors to recognize and discriminate the
tautomers. It appears that two descriptors from above-
mentioned models have an ability to discriminate tautom-
ers. One is BELp7, which belongs to the group of BCUT
descriptors and the other is a radial distribution function
(RDF) descriptor RDF045u. BCUT descriptors incorporate
the connectivity information and atomic properties (e.g.,
polarizability, atomic charge, etc.). BELp7 stands for the
highest eigen value 7 weighted by atomic polarizabilities.
Its positive contribution (see model 4) to the pIC50 suggests
that an increase of polarizabilities of diagonal elements in
adjacency matrix increases the anti-malarial activity of
synthetic prodiginines. RDF045u is a molecular descriptor
that is calculated using radial basis functions. It contains
information of probability distribution of atoms in a
spherical volume of radius 4.5 A. As opposed to BELp7,
increase in the values of RDF45u negatively affects the
observed activity. Surprisingly, the QSAR models are
again statistically robust with R2 and RCV2 ranging from
0.75 to 0.90 for various tautomeric forms. This reveals that
for these molecules QSAR is independent of tautomerism
(see Table 6).
Dataset-2
The bisaryl quinolones possess keto-enol tautomerism. All
the QSAR models performed well for the parent form with
R2 ranging from 0.743 to 0.821. The difference in R2
appears when they are tested on other tautomers, especially
for GA-model 2. Model 2 obtained by GA showed a dif-
ference in the statistical quality when it was tested on the
two tautomeric forms (R2 = 0.341 and 0.821). The devel-
oped models contain the following descriptors: RDF030u,
Table 11 Statistical quality of the developed QSAR models using
descriptors selected from one tautomeric form to other tautomeric
forms for dataset-3 (phosphoramides)
Tautomeric form Model 1 Model 2
GATS1m, nBR,
RDF030u
O-056, RDF050u,
RDF105m
R2 RCV2 F R2 RCV
2 F
1 0.878 0.842 76.53 – – –
2 – – – 0.833 0.787 53.21
‘–’ means not possible to calculate
Table 12 Statistical quality of the developed QSAR model one tautomeric form (in bold) and tested on different tautomeric forms for dataset-4
of substituted N-phenyl ureidobenzenesulfonate derivatives
Tautomeric form Model 1 Model 2 Model 3
R2 RCV2 F R2 RCV
2 F R2 RCV2 F
1 0.709 0.597 18.50 0.672 NC 15.57 0.705 NC 18.16
2 0.701 NC 17.82 0.688 0.569 16.77 0.700 NC 17.73
3 0.677 NC 15.93 0.643 NC 13.69 0.684 0.557 16.43
Tautomeric form GA-Model 1 GA-Model 2 GA-Model 3
R2 RCV2 F R2 RCV
2 F R2 RCV2 F
1 0.666 0.510 15.16 0.581 NC 10.54 0.686 NC 16.60
2 0.662 NC 14.89 0.664 0.505 14.99 0.686 NC 16.60
3 0.649 NC 14.05 0.587 NC 10.80 0.684 0.577 16.46
Med Chem Res
123
Page 13
RDF035p, G2v, E1v, and Gu. The statistical quality of the
models applied on the two tautomeric forms, and devel-
oped using the same descriptors, was also found to be
different (R2 = 0.547 and 0.821). Of the five descriptors,
three descriptors viz. RDF030u, RDF035p, and G2v were
found to be sensitive toward tautomerism in the case of
bicyclic quinolones. The two remaining RDF descriptors
viz. RDF030u and RDF035p reveal the importance of
distribution of atoms in the spherical volume of radius
3.0 A (RDF030u), and the distribution of atomic polariz-
abilities in the radius of 3.5 A (RDF035p). The rest of the
descriptors belong to the group of the WHIM descriptors,
and two of them are related to the atomic van der Waals
volumes (G2v, E1v).
Dataset-3
Phosphoramidate and phosphorothioamidate analogs of
amiprophos methyl show two tautomeric forms. Thereby,
two equations were obtained in this dataset. GA and the SR
gave identical equations. For the tautomeric form-1, O-056
represents the presence of alcoholic –OH. Since no mole-
cule in the tautomeric form-1 possesses alcoholic –OH
group, it cannot be calculated for the tautomeric form-1.
Table 13 Statistical quality of the developed QSAR models using descriptors selected from one tautomeric form to other tautomeric forms for
dataset-4 of substituted N-phenyl ureidobenzenesulfonate derivatives
Tautomeric form Descriptors from Model 1 Descriptors from Model 2 Descriptors from Model 3
F07[C–N], F05[C–C], Mor29u,
Mor03m, RDF095v
F07[C–N], F05[C–C], Mor29u, Mor16v,
RDF120m
F07[C–N], F05[C–C], Mor29e,
Mor03m, RDF095v
R2 RCV2 F R2 RCV
2 F R2 RCV2 F
1 0.709 0.597 18.50 0.673 0.545 15.64 0.710 0.596 18.59
2 0.705 0.592 18.19 0.688 0.569 16.77 0.707 0.593 18.33
3 0.682 0.556 16.32 0.653 0.503 14.28 0.684 0.557 16.43
Tautomeric form Descriptors from GA-Model 1 Descriptors from GA-Model 2 Descriptors from GA-Model 3
ESpm12d, BEHv2,
RDF140u, E3e, H7m
BELm1, BELv1,
RDF140u, Mor17m, H6e
RDF140v, RDF150v,
RDF030e, F03[C–N], F10[N–O]
R2 RCV2 F R2 RCV
2 F R2 RCV2 F
1 0.666 0.510 15.16 0.600 0.444 11.42 0.687 0.580 16.69
2 0.664 0.506 15.02 0.664 0.505 14.99 0.687 0.578 16.66
3 0.651 0.481 14.18 0.600 0.435 11.42 0.684 0.577 16.46
Table 14 Statistical quality of the developed QSAR model one tautomeric form (in bold) and tested on different tautomeric forms for dataset-5
(indole-2-carboxamides)
Tautomeric form Model 1 Model 2 GA-Model 1 GA-Model 2
R2 RCV2 F R2 RCV
2 F R2 RCV2 F R2 RCV
2 F
1 0.861 0.778 47.92 0.648 NC 14.27 0.821 0.746 35.54 0.835 NC 39.22
2 0.823 NC 36.04 0.822 0.723 35.89 0.829 NC 37.57 0.841 0.763 40.92
Table 15 Statistical quality of the developed QSAR models using descriptors selected from one tautomeric form to other tautomeric forms for
dataset-5 (indole-2-carboxamides)
Tautomeric form Model 1 Model 2 GA-Model 1 GA-Model 2
F07[C–S], H-048,
RDF105m, G2e
F07[C–S], H-048, RDF105m,
RDF040e
DECC, RDF105v, RDF045e,
F05[N–N]
BEHm7, RDF045e, HATS6p,
B02[N–N]
R2 RCV2 F R2 RCV
2 F R2 RCV2 F R2 RCV
2 F
1 0.861 0.778 47.92 0.824 0.726 36.29 0.821 0.746 35.54 0.832 0.751 38.42
2 0.788 0.684 28.83 0.822 0.723 35.89 0.836 0.765 39.47 0.841 0.763 40.92
Med Chem Res
123
Page 14
The same is true for GATS1m from the tautomeric form-1,
which cannot be calculated for the tautomeric form 2.
Interestingly, the negative coefficient of O-056 in Eq. 2
suggests that the conversion of the keto to the enol form is
unfavorable for anti-malarial activity for these molecules.
Consequently, the keto form is the dominating form that
decides and controls the biological activity of these mol-
ecules. It can be assumed that the keto form is the active
form which interacts with the ‘receptor.’ Such types of
mechanistic/pharmacophoric details are obtained when all
the possible tautomeric forms are considered while devel-
oping the QSAR models.
Dataset-4
The substituted N-phenyl ureidobenzenesulfonate deriva-
tives exhibit three tautomeric forms. Therefore, three
QSAR equations, one for each of the tauotmeric forms
were developed. The best QSAR models for anti-prolifer-
ative activity of the substituted N-phenyl ureidobenzene-
sulfonate derivatives were developed using SR and GA-
MLR for all the three tauotomeric forms. Other tautomeric
forms revealed very close values of statistical parameters
(Table 12). Also, the statistical qualities of QSAR models
developed using descriptors from the best models of one
tautomeric form and performed on other tautomeric forms
were found to be similar. This proves that the selected
descriptors are not sensitive toward the tautomerism of N-
phenyl ureidobenzenesulfonate derivatives. For many
models, the RCV2 values are consistently low (\0.60), which
is true for F values as well.
Dataset-5
Only model 2 developed using SR (Table 14) showed
difference in statistical quality (R2 = 0.822 and 0.648 for
the parent and the second form, respectively) (Table 14).
The difference was not observed when both the models
were built using the same descriptors (F07[C–S], H-048,
RDF105v, RDF045e, F05[N–N]) (Table 15). Two of these
descriptors (F07[C–S] and F05[N–N]) have the same
values for the two tautomeric forms. RDF descriptors viz.
RDF105v and RDF045e have an ability to discriminate
tautomers, but their relative importance is too low in the
developed models. This explains the partial insensitivity of
these models toward tautomerism.
This study has shown that some QSAR equations are
sensitive toward tautomerism and some are not. One reason
could be the identification of the appropriate set of
descriptors. Thus, feature selection becomes important
when the dataset contains compounds that exhibit tau-
tomerism. Once the appropriate set and number of
descriptors are identified, a good correlation is observed
between biological activity and descriptors, and tautomer-
ization, then, does not seem to have an effect on QSAR.
Another possible reason could be the contribution and
affinity of the tautomeric groups in the molecules toward
binding to the target protein. It may be possible to obtain
more information in this regard by examining the bound
conformation of the molecule in the active site of the target
protein. Further, the bound conformations could be
obtained from a crystal structure or docking simulations.
Docking simulations were not performed since the recep-
tors interacting with molecules (for dataset 1–4) are
unknown. For dataset 5, docking experiments of indolyla-
rylsulfones inhibitors to the reverse transcriptase enzyme
have been performed (La Regina et al., 2011; Masand
et al., 2013b) and it suggests a possible interaction of the
carboxamide group in both the keto and the enol forms
with active site residues. It can be assumed that the QSAR
models of this dataset are independent of tautomerism.
Moreover, tautomerization is a spontaneous, fast and
dynamic phenomenon, resulting in a rapid equilibrium
among the tautomers. This could be the reason for the
insensitivity of some of the descriptors in the identification
and discrimination of tautomers.
The 3D-descriptors from BCUT, RDF, and WHIM
group of descriptors appear relatively sensitive toward
tautomerism. Therefore, descriptors from these groups
could be used for the prediction of biological activity of
datasets that include molecules exhibiting tautomerism.
Conclusion
Although the datasets are found to be dominated by tau-
tomer 1, the presence of other tautomers cannot be
neglected, as it is very difficult to determine the exact
active tautomeric forms under physiological conditions.
Feature selection is found to be very important for the
selection of an optimum number and set of descriptors
while dealing with tautomerism during QSAR model
development. Tautomerism was found to have a significant
influence on the performance of some QSAR models for
second and third datasets. For dataset-1, 4 and 5, the QSAR
models for all the tautomeric forms are found to be sta-
tistically significant and independent of tautomerism.
In conclusion, tautomerism can influence the outcome of
QSAR modeling for a particular dataset and should be
taken into account during modeling studies.
Acknowledgments We are thankful to e-Dragon, Vega ZZ, ACD
ChemSketch, QSARINS, and RapidMiner developing teams for
providing free/trial versions of their softwares. We sincerely thank Dr.
Harsh Chauhan, Assistant Professor, Creighton University, Greater
Boston Area, USA for helpful discussions throughout this work.
Med Chem Res
123
Page 15
Sincere thanks to Dr. S.R. Nair, Head, Department of Languages,
Vidya Bharati College, Amravati for improving the English language.
References
Baumann K, Stiefl N (2004) Validation tools for variable subset
regression. J Comput Aided Mol Des 18(7–9):549–562
Beheshti A, Riahi S, Ganjali MR, Norouzi P (2012) Highlighting and
trying to overcome a serious drawback with QSPR studies; data
collection in different experimental conditions (mixed-QSPR).
J Comput Chem 33(7):732–747
Consonni V, Ballabio D, Todeschini R (2010) Evaluation of model
predictive ability by external validation techniques. J Chemomem
24:194–201
da Cunha EFF, Mancini DT, Ramalho TC (2011) Molecular modeling
of the Toxoplasma gondii adenosine kinase inhibitors. Med
Chem Res 21(5):590–600
Doweyko AM (2008) QSAR: dead or alive? J Comput Aided Mol Des
22(2):81–89
Golbraikh A, Tropsha A (2002) Beware of q2! J Mol Graph Model
20(4):269–276
Gramatica P, Papa E (2007) Screening and ranking of POPs for global
half-life: QSAR approaches for prioritization based on molecular
structure. Environ Sci Technol 41(8):2833–2839
Gramatica P, Pilutti P, Papa E (2007) Approaches for externally
validated QSAR modelling of nitrated polycyclic aromatic
hydrocarbon mutagenicity. SAR QSAR Environ Res
18(1–2):169–178
Hawkins DM (2004) The problem of overfitting. J Chem Inf Comput
Sci 44(1):1–12
Hawkins DM, Kraker JJ, Basak SC, Mills D (2008) QSPR checking
and validation: a case study with hydroxy radical reaction rate
constant. SAR QSAR Environ Res 19(5–6):525–539
Huang J, Fan X (2011) Why QSAR fails: an empirical evaluation
using conventional computational approach. Mol Pharm
8(2):600–608
Kiralj R, Ferreira MMC (2009) Basic validation procedures for
regression models in QSAR and QSPR studies: theory and
application. J Braz Chem Soc 20:770–787
Kubinyi H (2002) From narcosis to hyperspace: the History of QSAR.
Quant Struct Act Rel 21:348–356
La Regina G, Coluccia A, Brancale A, Piscitelli F, Gatti V, Maga G,
Samuele A, Pannecouque C, Schols D, Balzarini J, Novellino E,
Silvestri R (2011) Indolylarylsulfones as HIV-1 non-nucleoside
reverse transcriptase inhibitors: new cyclic substituents at indole-
2-carboxamide. J Med Chem 54(6):1587–1598
Liu P, Long W (2009) Current mathematical methods used in QSAR/
QSPR studies. Int J Mol Sci 10(5):1978–1998
Mahajan DT, Masand VH, Patil KN, Ben Hadda T, Jawarkar RD,
Thakur SD, Rastija V (2012) CoMSIA and POM analyses of
anti-malarial activity of synthetic prodiginines. Bioorg Med
Chem Lett 22(14):4827–4835
Mahajan DT, Masand VH, Patil KN, Hadda TB, Rastija V (2013)
Integrating GUSAR and QSAR analyses for antimalarial activity
of synthetic prodiginines against multi drug resistant strain. Med
Chem Res 22:2284–2292
Mara C, Dempsey E, Bell A, Barlow JW (2011) Synthesis and
evaluation of phosphoramidate and phosphorothioamidate ana-
logues of amiprophos methyl as potential antimalarial agents.
Bioorg Med Chem Lett 21(20):6180–6183
Martin YC (2009) Let’s not forget tautomers. J Comput Aided Mol
Des 23(10):693–704
Martin YC (2010) Tautomerism, Hammett sigma, and QSAR.
J Comput Aided Mol Des 24(6–7):613–616
Masand VH, Jawarkar RD, Patil KN, Nazerruddin GM, Bajaj SO
(2010) Correlation potential of Wiener index and molecular
refractivity vis-a-vis antimalarial activity of xanthone deriva-
tives. Org Chem Indian J 6(1):30–38
Masand VH, Jawarkar RD, Mahajan DT, Hadda TB, Sheikh J, Patil
KN (2012) QSAR and CoMFA studies of biphenyl analogs of the
anti-tuberculosis drug (6S)-2-nitro-6-{[4-(trifluoromethoxy) ben-
zyl]oxy}-6,7-dihydro-5H-imidazo[2,1-b][1,3]oxazine(PA-824).
Med Chem Res 21:2624–2629
Masand VH, Mahajan DT, Patil KN, Hadda TB, Youssoufi MH,
Jawarkar RD, Shibi IG (2013a) Optimization of anti-malarial
activity of synthetic prodiginines: QSAR, GUSAR and CoMFA
analyses. Chem Biol Drug Des 81(4):527–536
Masand VH, Mahajan DT, Ben Hadda T, Jawarkar RD, Chavan H,
Bandgar BP, Chauhan H (2013b) Molecular docking and
quantitative structure activity relationship (QSAR) analyses of
indolylarylsulfones as HIV-1 non-nucleoside reverse transcrip-
tase inhibitors. Med Chem Res (in press) doi:10.1007/s00044-
013-0647
Mitra I, Saha A, Roy K (2011) Chemometric QSAR modeling and in
silico design of antioxidant NO donor phenols. Sci Pharm
79(1):31–57
Mitra I, Saha A, Roy K (2012) Development of multiple QSAR
models for consensus predictions and unified mechanistic
interpretations of the free-radical scavenging activities of
chromone derivatives. J Mol Model 18(5):1819–1840
Myint KZ, Xie XQ (2010) Recent advances in fragment-based QSAR
and multi-dimensional QSAR methods. Int J Mol Sci
11(10):3846–3866
Oellien F, Cramer J, Beyer C, Ihlenfeldt WD, Selzer PM (2006) The
influence of tautomer forms on pharmacophore-based virtual
screening. J Chem Inf Model 46(6):2342–2354
Papireddy K, Smilkstein M, Kelly JX, Shweta, Salem SM, Alham-
adsheh M, Haynes SW, Challis GL, Reynolds KA (2011)
Antimalarial activity of natural and synthetic prodiginines.
J Med Chem 54(15):5296–5306
Pidathala C, Amewu R, Pacorel B, Nixon GL, Gibbons P, Hong WD,
Leung SC, Berry NG, Sharma R, Stocks PA, Srivastava A,
Shone AE, Charoensutthivarakul S, Taylor L, Berger O,
Mbekeani A, Hill A, Fisher NE, Warman AJ, Biagini GA,
Ward SA, O’Neill PM (2012) Identification, design and biolog-
ical evaluation of bisaryl quinolones targeting Plasmodium
falciparum type II NADH: quinone oxidoreductase (PfNDH2).
J Med Chem 55(5):1831–1843
Pospisil P, Ballmer P, Scapozza L, Folkers G (2003) Tautomerism in
computer-aided drug design. J Recept Signal Transduct Res
23(4):361–371
Pratim Roy P, Paul S, Mitra I, Roy K (2009) On two novel parameters
for validation of predictive QSAR models. Molecules
14(5):1660–1701
Roy KK, Dixit A, Saxena AK (2008) An investigation of structurally
diverse carbamates for acetylcholinesterase (AChE) inhibition
using 3D-QSAR analysis. J Mol Graph Model 27(2):197–208
Sahigara F, Mansouri K, Ballabio D, Mauri A, Consonni V,
Todeschini R (2012) Comparison of different approaches to
define the applicability domain of QSAR models. Molecules
17(5):4791–4810
Schwab CH (2010) Conformations and 3D pharmacophore searching.
Drug Discov Today Technol 7(4):e245–e253
Scior T, Medina-Franco JL, Do QT, Martinez-Mayorga K, Yunes
Rojas JA, Bernard P (2009) How to recognize and workaround
pitfalls in QSAR studies: a critical review. Curr Med Chem
16(32):4297–4313
Med Chem Res
123
Page 16
Shugar D, Kierdaszuk B (1985) New light on tautomerism of purines
and pyrimidines and its biological and genetic implications. Proc
Int Symp Biomol Struct Interact Suppl J Biosci 8(3):657–668
Tetko IV (2005) Computing chemistry on the web. Drug Discov
Today 10(22):1497–1500
Thalheim T, Vollmer A, Ebert R-U, Kuhne R, Schuurmann G (2010)
Tautomer identification and tautomer structure generation based
on the InChI code. J Chem Inf Model 50(7):1223–1232
Trepalin SV, Skorenko AV, Balakin KV, Nasonov AF, Lang SA,
Ivashchenko AA, Savchuk NP (2003) Advanced exact structure
searching in large databases of chemical compounds. J Chem Inf
Comput Sci 43(3):852–860
Tropsha A (2010) Best practices for QSAR model development,
validation, and exploitation. Mol Inf 29:476–488
Turcotte V, Fortin S, Vevey F, Coulombe Y, Lacroix J, Cote MF,
Masson JY, C-Gaudreault R (2012) Synthesis, biological
evaluation, and structure–activity relationships of novel substi-
tuted N-phenyl ureidobenzenesulfonate derivatives blocking cell
cycle progression in S-phase and inducing DNA double-strand
breaks. J Med Chem 55(13):6194–6208
Van Drie JH (2007) Computer-aided drug design: the next 20 years.
J Comput Aided Mol Des 21(10–11):591–601
Yi Z, Zhang A (2012) A QSAR study of environmental estrogens
based on a novel variable selection method. Molecules
17(5):6126–6145
Zou JW, Luo CC, Zhang HX, Liu HC, Jiang YJ, Yu QS (2007) Three-
dimensional QSAR of HPPD inhibitors, PSA inhibitors, and
anxiolytic agents: effect of tautomerism on the CoMFA models.
J Mol Graph Model 26(2):494–504
Med Chem Res
123