1 DOHERTY MODELLING INTERIM REPORT TO NATIONAL CABINET 17 TH SEPTEMBER 2021 TABLE OF CONTENTS Executive summary 2 Background 6 Sensitivity analysis on scenarios in the Technical Report and Addendum (10 th August 2021) 6 Completed effective coverage and single dose recipients at each threshold 6 Size of seeding outbreak 7 Epidemic dynamics 7 Clinical outcomes 11 Initial transmission potential (TP) 16 Implications for TTIQ and other measures 16 Currency of proposed next phase work plan 17 Critical importance of data-informed optimisation and targeting of TTIQ response 17 Real world evaluation of impact of social measures at small area level 17 Small area requirements for augmented vaccine coverage and delivery 17 Timeliness and prioritisation of 12-15 years program extension 17 Additional implications of jurisdictional TP for border risk tolerance 17 APPENDIX Extension of full epidemic course, low seeding epidemics, 70/80%, partial TTIQ 18 Overlay of PHSMs on partial TTIQ scenarios reduces clinical outcomes 18 Coding error in AZ dosing interval in simulations up to an including 10 th August 2021 20 Bundles of public health and social measures (PHSMs) 24
Transcript
1
DOHERTY MODELLING INTERIM REPORT TO NATIONAL CABINET 17TH SEPTEMBER 2021
TABLE OF CONTENTS
Executive summary 2
Background 6
Sensitivity analysis on scenarios in the Technical Report and Addendum (10th August 2021) 6
Completed effective coverage and single dose recipients at each threshold 6
Size of seeding outbreak 7
Epidemic dynamics 7
Clinical outcomes 11
Initial transmission potential (TP) 16
Implications for TTIQ and other measures 16
Currency of proposed next phase work plan 17
Critical importance of data-informed optimisation and targeting of TTIQ response 17
Real world evaluation of impact of social measures at small area level 17
Small area requirements for augmented vaccine coverage and delivery 17
Timeliness and prioritisation of 12-15 years program extension 17
Additional implications of jurisdictional TP for border risk tolerance 17
APPENDIX
Extension of full epidemic course, low seeding epidemics, 70/80%, partial TTIQ 18
Overlay of PHSMs on partial TTIQ scenarios reduces clinical outcomes 18
Coding error in AZ dosing interval in simulations up to an including 10th August 2021 20
Bundles of public health and social measures (PHSMs) 24
2
EXECUTIVE SUMMARY
Sensitivity analyses were undertaken in response to queries raised at National Cabinet about the scenarios represented in the Doherty Modelling Technical Report and Addendum (10th August 2021);
• We have provided assurance that delays to full efficacy of two dose completion are incorporated in our dynamic assumptions, and clarified that coverage achieved at threshold cut points is further augmented by single dose completions to that date;
• Robustness of recommendations regarding 70% and 80% coverage scenarios to the number of infections seeding epidemics was assessed. We considered three levels of introduction in the order of low (tens, approximately 10-100), medium (hundreds, approximately 300-1,000) or high (thousands, approximately 1,000-4,500) initial cases;
o At the 70% coverage threshold with baseline PHSMs and partial TTIQ, an increase from tens to hundreds of seeded infections results in a leftward shift of timing of the epidemic meaning that it completes within the reporting window of 180 days but does not differ in overall impact;
o At the 70% coverage threshold with baseline PHSMs and partial TTIQ, seeding of thousands of infections shifts both the timing and peak of the epidemic significantly. Overall size is notably increased. This is because the window in time between 70 and 80% coverage is sufficient to allow early epidemic growth from high numbers, resulting in ‘overshoot’ (Figure ES1);
o Much less impact on the overall size of epidemics is observed when these seeding scenarios (tens, hundreds, thousands) are introduced from the 80% coverage timepoint, with baseline PHSMs and partial TTIQ (Figure ES1);
o For all of the above scenarios, infections and corresponding harms are markedly reduced by application of either 1) optimal TTIQ (Figure ES2); or 2) ‘low’ PHSMs and partial TTIQ (Figure ES3), (Table ES1).
• Given the observed sensitivity to ‘high’ seeding infections at 70%, ongoing application of ‘medium’ PSHMs at the time of transition to Phase B is deemed prudent in such cases, at least until the 80% coverage threshold is achieved (Figure ES3)(Table ES2);
• At high caseloads, maintenance of optimal TTIQ is unlikely to be possible. In such instances, flexibility to strengthen PHSMs generally or locally will be needed (as envisaged in the National Plan) to regain epidemic control. The required intensity and duration of measures should be informed by ongoing situational assessment of transmission and its related health impacts.
The scenarios in this report representing a single national COVID-19 epidemic are clearly (and deliberately) artificial and serve to inform high level policy strategy. Their key message is to highlight the importance of a combination of timely public health responses (TTIQ) and ongoing social and behavioural measures (PHSMs) to constrain transmission, even in highly immunised populations;
• In reality, the national COVID-19 epidemic has been and will continue to be a ‘fire’ fought on multiple fronts. Bridging of this high-level strategy to implementation requires attention to localised risk determinants, differential impact of PHSMs, small area reporting of vaccine coverage and optimisation of TTIQ and public health responses to address focal outbreaks;
o The next phase of modelling work will focus on addressing these issues in consultation with jurisdictions and relevant committees to define evidence based and sustainable approaches;
• Previous findings of the relatively small contribution of the 12-15 years age cohort to infection transmission have not been reinterrogated. Current model outputs do not incorporate direct protective effects of immunising this age group, or anticipated related indirect protection of children <12 years;
o Given the recent shift in the national immunisation strategy regarding this cohort our next work phase will include attention to immunisation coverage in school settings. We are consulting with Operation COVID-Shield to identify vaccine implementation approaches that will influence likely future coverage in schools, within their population context.
3
Figure ES1: Epidemic growth to 180 days for Baseline PHSMs and Partial TTIQ
Medium seeding High seeding
70% threshold
80% threshold
Figure ES2: Epidemic growth to 180 days for Baseline PHSMs and Optimal TTIQ
Medium seeding High seeding
70% threshold
80% threshold
Figure ES3: Epidemic growth to 240 days for High seeding epidemics at the 70% threshold with Partial TTIQ. Grey curves assume continuously overlaid low PHSMs. Blue curves show enhanced suppression by medium PHSMs during the transition between 70 and 80%, reverting to low PHSMs from 80%*
*Note y axes smaller than for Figures ES1 and ES2, to enable comparison of infections at 80% threshold
Between 300 and 1,000 infections Between 1,000 and 4,500 infections
4
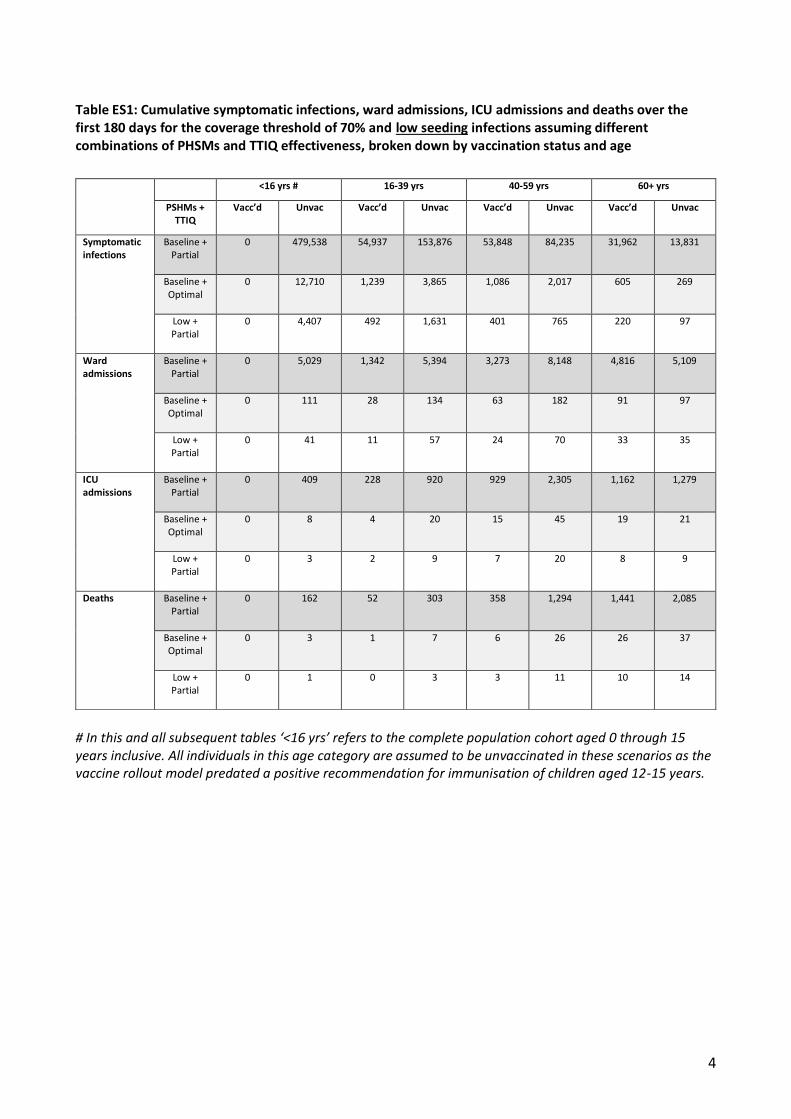
Table ES1: Cumulative symptomatic infections, ward admissions, ICU admissions and deaths over the first 180 days for the coverage threshold of 70% and low seeding infections assuming different combinations of PHSMs and TTIQ effectiveness, broken down by vaccination status and age
# In this and all subsequent tables ‘<16 yrs’ refers to the complete population cohort aged 0 through 15 years inclusive. All individuals in this age category are assumed to be unvaccinated in these scenarios as the vaccine rollout model predated a positive recommendation for immunisation of children aged 12-15 years.
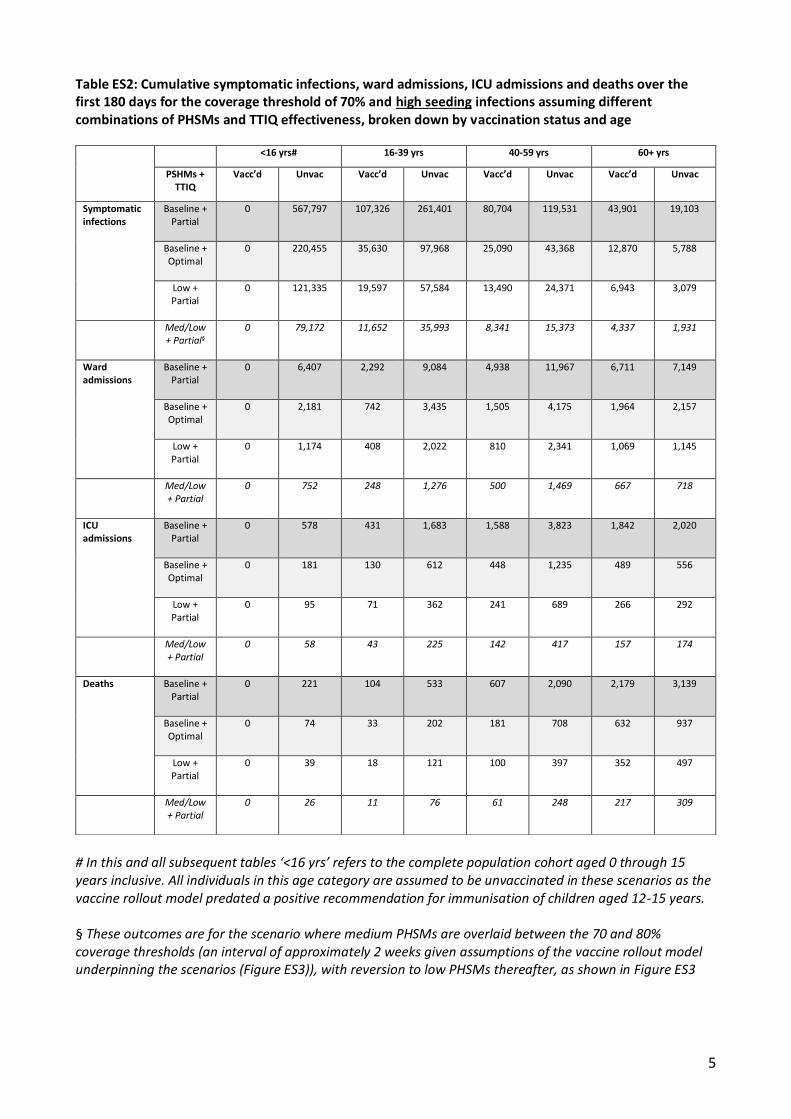
Table ES2: Cumulative symptomatic infections, ward admissions, ICU admissions and deaths over the first 180 days for the coverage threshold of 70% and high seeding infections assuming different combinations of PHSMs and TTIQ effectiveness, broken down by vaccination status and age
# In this and all subsequent tables ‘<16 yrs’ refers to the complete population cohort aged 0 through 15 years inclusive. All individuals in this age category are assumed to be unvaccinated in these scenarios as the vaccine rollout model predated a positive recommendation for immunisation of children aged 12-15 years. § These outcomes are for the scenario where medium PHSMs are overlaid between the 70 and 80% coverage thresholds (an interval of approximately 2 weeks given assumptions of the vaccine rollout model underpinning the scenarios (Figure ES3)), with reversion to low PHSMs thereafter, as shown in Figure ES3
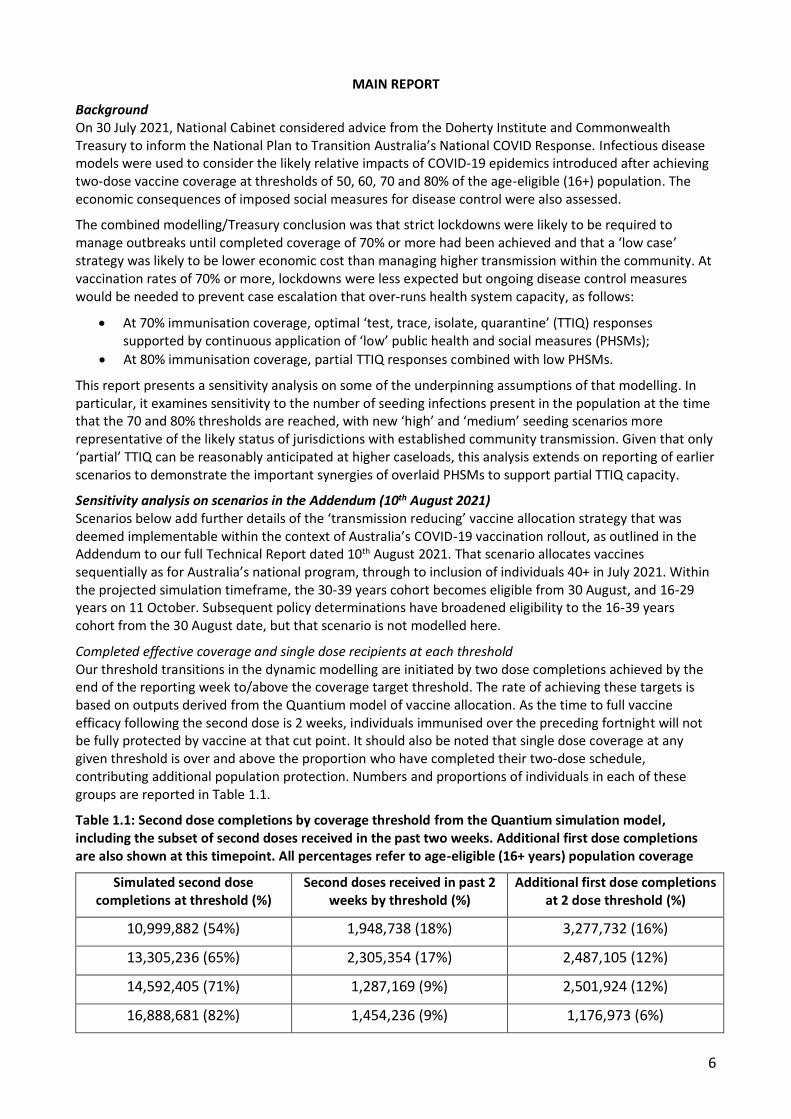
Background On 30 July 2021, National Cabinet considered advice from the Doherty Institute and Commonwealth Treasury to inform the National Plan to Transition Australia’s National COVID Response. Infectious disease models were used to consider the likely relative impacts of COVID-19 epidemics introduced after achieving two-dose vaccine coverage at thresholds of 50, 60, 70 and 80% of the age-eligible (16+) population. The economic consequences of imposed social measures for disease control were also assessed.
The combined modelling/Treasury conclusion was that strict lockdowns were likely to be required to manage outbreaks until completed coverage of 70% or more had been achieved and that a ‘low case’ strategy was likely to be lower economic cost than managing higher transmission within the community. At vaccination rates of 70% or more, lockdowns were less expected but ongoing disease control measures would be needed to prevent case escalation that over-runs health system capacity, as follows:
• At 70% immunisation coverage, optimal ‘test, trace, isolate, quarantine’ (TTIQ) responses supported by continuous application of ‘low’ public health and social measures (PHSMs);
• At 80% immunisation coverage, partial TTIQ responses combined with low PHSMs.
This report presents a sensitivity analysis on some of the underpinning assumptions of that modelling. In particular, it examines sensitivity to the number of seeding infections present in the population at the time that the 70 and 80% thresholds are reached, with new ‘high’ and ‘medium’ seeding scenarios more representative of the likely status of jurisdictions with established community transmission. Given that only ‘partial’ TTIQ can be reasonably anticipated at higher caseloads, this analysis extends on reporting of earlier scenarios to demonstrate the important synergies of overlaid PHSMs to support partial TTIQ capacity.
Sensitivity analysis on scenarios in the Addendum (10th August 2021) Scenarios below add further details of the ‘transmission reducing’ vaccine allocation strategy that was deemed implementable within the context of Australia’s COVID-19 vaccination rollout, as outlined in the Addendum to our full Technical Report dated 10th August 2021. That scenario allocates vaccines sequentially as for Australia’s national program, through to inclusion of individuals 40+ in July 2021. Within the projected simulation timeframe, the 30-39 years cohort becomes eligible from 30 August, and 16-29 years on 11 October. Subsequent policy determinations have broadened eligibility to the 16-39 years cohort from the 30 August date, but that scenario is not modelled here.
Completed effective coverage and single dose recipients at each threshold Our threshold transitions in the dynamic modelling are initiated by two dose completions achieved by the end of the reporting week to/above the coverage target threshold. The rate of achieving these targets is based on outputs derived from the Quantium model of vaccine allocation. As the time to full vaccine efficacy following the second dose is 2 weeks, individuals immunised over the preceding fortnight will not be fully protected by vaccine at that cut point. It should also be noted that single dose coverage at any given threshold is over and above the proportion who have completed their two-dose schedule, contributing additional population protection. Numbers and proportions of individuals in each of these groups are reported in Table 1.1.
Table 1.1: Second dose completions by coverage threshold from the Quantium simulation model, including the subset of second doses received in the past two weeks. Additional first dose completions are also shown at this timepoint. All percentages refer to age-eligible (16+ years) population coverage
Simulated second dose completions at threshold (%)
Second doses received in past 2 weeks by threshold (%)
Additional first dose completions at 2 dose threshold (%)
10,999,882 (54%) 1,948,738 (18%) 3,277,732 (16%)
13,305,236 (65%) 2,305,354 (17%) 2,487,105 (12%)
14,592,405 (71%) 1,287,169 (9%) 2,501,924 (12%)
16,888,681 (82%) 1,454,236 (9%) 1,176,973 (6%)
7
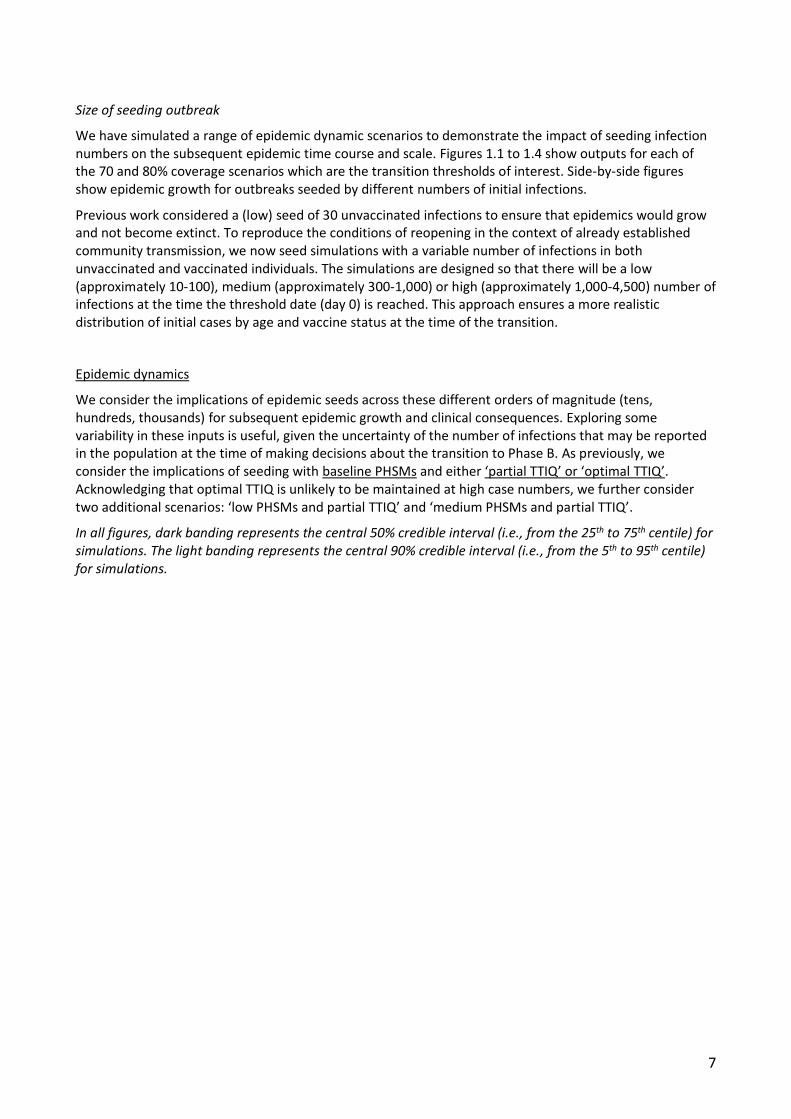
Size of seeding outbreak
We have simulated a range of epidemic dynamic scenarios to demonstrate the impact of seeding infection numbers on the subsequent epidemic time course and scale. Figures 1.1 to 1.4 show outputs for each of the 70 and 80% coverage scenarios which are the transition thresholds of interest. Side-by-side figures show epidemic growth for outbreaks seeded by different numbers of initial infections.
Previous work considered a (low) seed of 30 unvaccinated infections to ensure that epidemics would grow and not become extinct. To reproduce the conditions of reopening in the context of already established community transmission, we now seed simulations with a variable number of infections in both unvaccinated and vaccinated individuals. The simulations are designed so that there will be a low (approximately 10-100), medium (approximately 300-1,000) or high (approximately 1,000-4,500) number of infections at the time the threshold date (day 0) is reached. This approach ensures a more realistic distribution of initial cases by age and vaccine status at the time of the transition.
Epidemic dynamics
We consider the implications of epidemic seeds across these different orders of magnitude (tens, hundreds, thousands) for subsequent epidemic growth and clinical consequences. Exploring some variability in these inputs is useful, given the uncertainty of the number of infections that may be reported in the population at the time of making decisions about the transition to Phase B. As previously, we consider the implications of seeding with baseline PHSMs and either ‘partial TTIQ’ or ‘optimal TTIQ’. Acknowledging that optimal TTIQ is unlikely to be maintained at high case numbers, we further consider two additional scenarios: ‘low PHSMs and partial TTIQ’ and ‘medium PHSMs and partial TTIQ’.
In all figures, dark banding represents the central 50% credible interval (i.e., from the 25th to 75th centile) for simulations. The light banding represents the central 90% credible interval (i.e., from the 5th to 95th centile) for simulations.
8
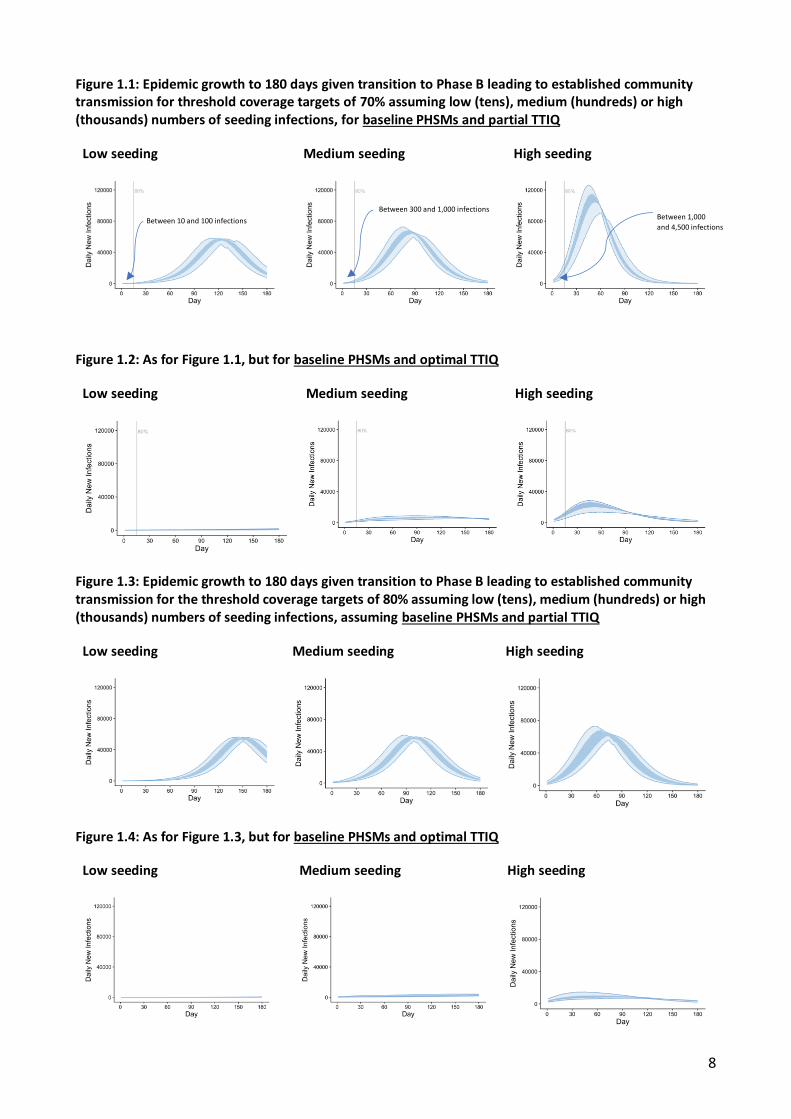
Figure 1.1: Epidemic growth to 180 days given transition to Phase B leading to established community transmission for threshold coverage targets of 70% assuming low (tens), medium (hundreds) or high (thousands) numbers of seeding infections, for baseline PHSMs and partial TTIQ
Low seeding Medium seeding High seeding
Figure 1.2: As for Figure 1.1, but for baseline PHSMs and optimal TTIQ
Low seeding Medium seeding High seeding
Figure 1.3: Epidemic growth to 180 days given transition to Phase B leading to established community transmission for the threshold coverage targets of 80% assuming low (tens), medium (hundreds) or high (thousands) numbers of seeding infections, assuming baseline PHSMs and partial TTIQ
Low seeding Medium seeding High seeding
Figure 1.4: As for Figure 1.3, but for baseline PHSMs and optimal TTIQ
Low seeding Medium seeding High seeding
Between 1,000
and 4,500 infections
Between 300 and 1,000 infections
Between 10 and 100 infections
9
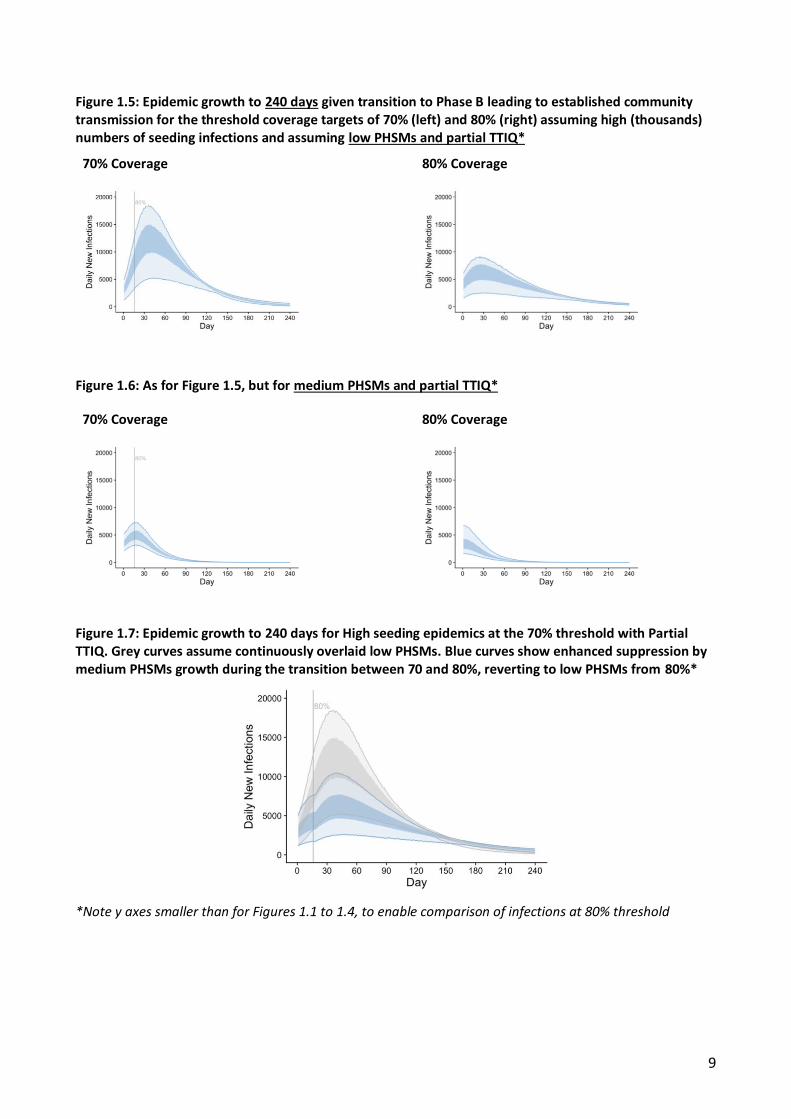
Figure 1.5: Epidemic growth to 240 days given transition to Phase B leading to established community transmission for the threshold coverage targets of 70% (left) and 80% (right) assuming high (thousands) numbers of seeding infections and assuming low PHSMs and partial TTIQ*
70% Coverage 80% Coverage
Figure 1.6: As for Figure 1.5, but for medium PHSMs and partial TTIQ*
70% Coverage 80% Coverage
Figure 1.7: Epidemic growth to 240 days for High seeding epidemics at the 70% threshold with Partial TTIQ. Grey curves assume continuously overlaid low PHSMs. Blue curves show enhanced suppression by medium PHSMs growth during the transition between 70 and 80%, reverting to low PHSMs from 80%*
*Note y axes smaller than for Figures 1.1 to 1.4, to enable comparison of infections at 80% threshold
10
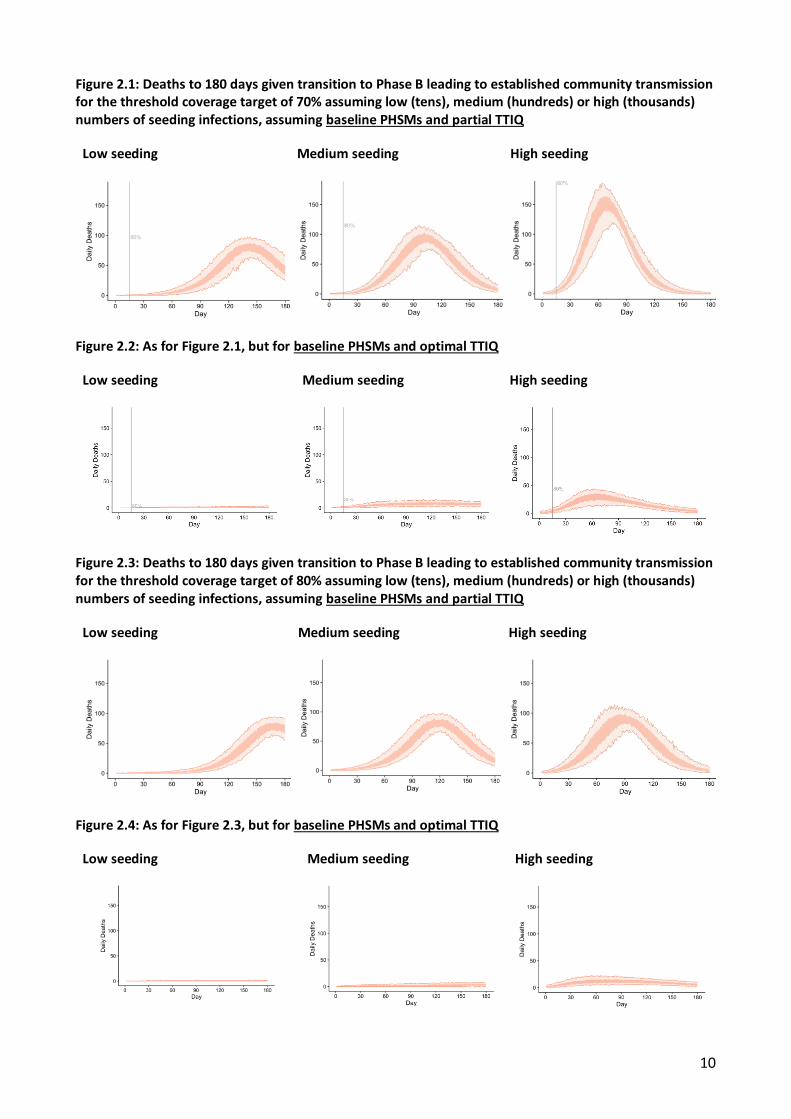
Figure 2.1: Deaths to 180 days given transition to Phase B leading to established community transmission for the threshold coverage target of 70% assuming low (tens), medium (hundreds) or high (thousands) numbers of seeding infections, assuming baseline PHSMs and partial TTIQ
Low seeding Medium seeding High seeding
Figure 2.2: As for Figure 2.1, but for baseline PHSMs and optimal TTIQ
Low seeding Medium seeding High seeding
Figure 2.3: Deaths to 180 days given transition to Phase B leading to established community transmission for the threshold coverage target of 80% assuming low (tens), medium (hundreds) or high (thousands) numbers of seeding infections, assuming baseline PHSMs and partial TTIQ
Low seeding Medium seeding High seeding
Figure 2.4: As for Figure 2.3, but for baseline PHSMs and optimal TTIQ
Low seeding Medium seeding High seeding
11
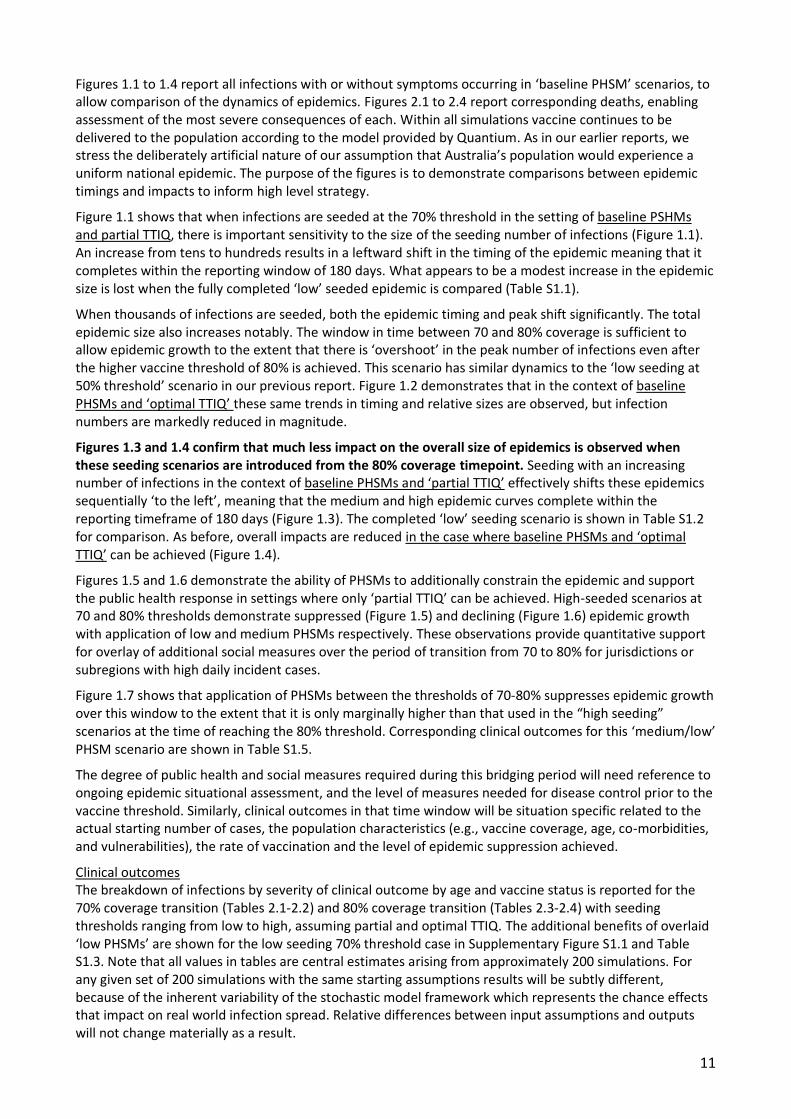
Figures 1.1 to 1.4 report all infections with or without symptoms occurring in ‘baseline PHSM’ scenarios, to allow comparison of the dynamics of epidemics. Figures 2.1 to 2.4 report corresponding deaths, enabling assessment of the most severe consequences of each. Within all simulations vaccine continues to be delivered to the population according to the model provided by Quantium. As in our earlier reports, we stress the deliberately artificial nature of our assumption that Australia’s population would experience a uniform national epidemic. The purpose of the figures is to demonstrate comparisons between epidemic timings and impacts to inform high level strategy.
Figure 1.1 shows that when infections are seeded at the 70% threshold in the setting of baseline PSHMs and partial TTIQ, there is important sensitivity to the size of the seeding number of infections (Figure 1.1). An increase from tens to hundreds results in a leftward shift in the timing of the epidemic meaning that it completes within the reporting window of 180 days. What appears to be a modest increase in the epidemic size is lost when the fully completed ‘low’ seeded epidemic is compared (Table S1.1).
When thousands of infections are seeded, both the epidemic timing and peak shift significantly. The total epidemic size also increases notably. The window in time between 70 and 80% coverage is sufficient to allow epidemic growth to the extent that there is ‘overshoot’ in the peak number of infections even after the higher vaccine threshold of 80% is achieved. This scenario has similar dynamics to the ‘low seeding at 50% threshold’ scenario in our previous report. Figure 1.2 demonstrates that in the context of baseline PHSMs and ‘optimal TTIQ’ these same trends in timing and relative sizes are observed, but infection numbers are markedly reduced in magnitude.
Figures 1.3 and 1.4 confirm that much less impact on the overall size of epidemics is observed when these seeding scenarios are introduced from the 80% coverage timepoint. Seeding with an increasing number of infections in the context of baseline PHSMs and ‘partial TTIQ’ effectively shifts these epidemics sequentially ‘to the left’, meaning that the medium and high epidemic curves complete within the reporting timeframe of 180 days (Figure 1.3). The completed ‘low’ seeding scenario is shown in Table S1.2 for comparison. As before, overall impacts are reduced in the case where baseline PHSMs and ‘optimal TTIQ’ can be achieved (Figure 1.4).
Figures 1.5 and 1.6 demonstrate the ability of PHSMs to additionally constrain the epidemic and support the public health response in settings where only ‘partial TTIQ’ can be achieved. High-seeded scenarios at 70 and 80% thresholds demonstrate suppressed (Figure 1.5) and declining (Figure 1.6) epidemic growth with application of low and medium PHSMs respectively. These observations provide quantitative support for overlay of additional social measures over the period of transition from 70 to 80% for jurisdictions or subregions with high daily incident cases.
Figure 1.7 shows that application of PHSMs between the thresholds of 70-80% suppresses epidemic growth over this window to the extent that it is only marginally higher than that used in the “high seeding” scenarios at the time of reaching the 80% threshold. Corresponding clinical outcomes for this ‘medium/low’ PHSM scenario are shown in Table S1.5.
The degree of public health and social measures required during this bridging period will need reference to ongoing epidemic situational assessment, and the level of measures needed for disease control prior to the vaccine threshold. Similarly, clinical outcomes in that time window will be situation specific related to the actual starting number of cases, the population characteristics (e.g., vaccine coverage, age, co-morbidities, and vulnerabilities), the rate of vaccination and the level of epidemic suppression achieved.
Clinical outcomes The breakdown of infections by severity of clinical outcome by age and vaccine status is reported for the 70% coverage transition (Tables 2.1-2.2) and 80% coverage transition (Tables 2.3-2.4) with seeding thresholds ranging from low to high, assuming partial and optimal TTIQ. The additional benefits of overlaid ‘low PHSMs’ are shown for the low seeding 70% threshold case in Supplementary Figure S1.1 and Table S1.3. Note that all values in tables are central estimates arising from approximately 200 simulations. For any given set of 200 simulations with the same starting assumptions results will be subtly different, because of the inherent variability of the stochastic model framework which represents the chance effects that impact on real world infection spread. Relative differences between input assumptions and outputs will not change materially as a result.
12
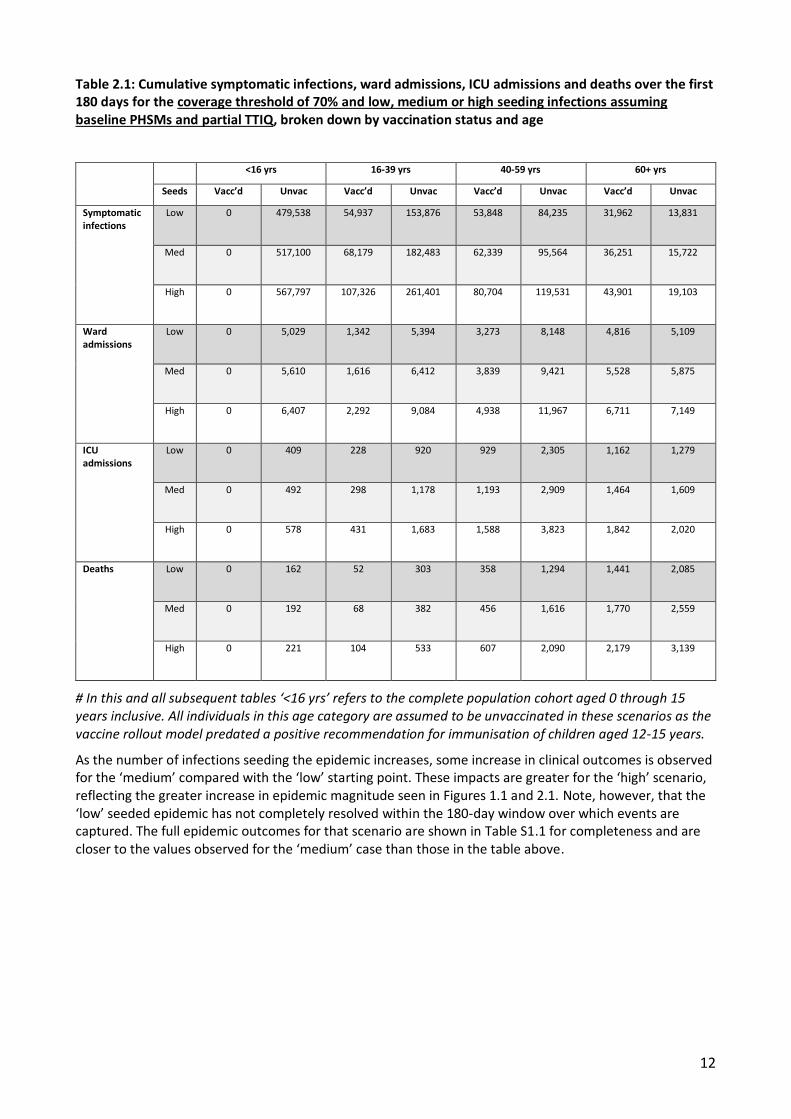
Table 2.1: Cumulative symptomatic infections, ward admissions, ICU admissions and deaths over the first 180 days for the coverage threshold of 70% and low, medium or high seeding infections assuming baseline PHSMs and partial TTIQ, broken down by vaccination status and age
Med 0 517,100 68,179 182,483 62,339 95,564 36,251 15,722
High 0 567,797 107,326 261,401 80,704 119,531 43,901 19,103
Ward admissions
Low 0 5,029 1,342 5,394 3,273 8,148 4,816 5,109
Med 0 5,610 1,616 6,412 3,839 9,421 5,528 5,875
High 0 6,407 2,292 9,084 4,938 11,967 6,711 7,149
ICU admissions
Low 0 409 228 920 929 2,305 1,162 1,279
Med 0 492 298 1,178 1,193 2,909 1,464 1,609
High 0 578 431 1,683 1,588 3,823 1,842 2,020
Deaths Low 0 162 52 303 358 1,294 1,441 2,085
Med 0 192 68 382 456 1,616 1,770 2,559
High 0 221 104 533 607 2,090 2,179 3,139
# In this and all subsequent tables ‘<16 yrs’ refers to the complete population cohort aged 0 through 15 years inclusive. All individuals in this age category are assumed to be unvaccinated in these scenarios as the vaccine rollout model predated a positive recommendation for immunisation of children aged 12-15 years.
As the number of infections seeding the epidemic increases, some increase in clinical outcomes is observed for the ‘medium’ compared with the ‘low’ starting point. These impacts are greater for the ‘high’ scenario, reflecting the greater increase in epidemic magnitude seen in Figures 1.1 and 2.1. Note, however, that the ‘low’ seeded epidemic has not completely resolved within the 180-day window over which events are captured. The full epidemic outcomes for that scenario are shown in Table S1.1 for completeness and are closer to the values observed for the ‘medium’ case than those in the table above.
13
Table 2.2: As for table 2.1, assuming baseline PHSMs and optimal TTIQ
Med 0 110,543 12,773 38,058 10,456 18,815 5,704 2,537
High 0 220,455 35,630 97,968 25,090 43,368 12,870 5,788
Ward admissions
Low 0 111 28 134 63 182 91 97
Med 0 1,014 285
1,333 620 1,753 861 928
High 0 2,181 742 3,435 1,505 4,175 1,964 2,157
ICU admissions
Low 0 8 4 20 15 45 19 21
Med 0 71 44 204 155 432 180 201
High 0 181 130 612 448 1,235 489 556
Deaths Low 0 3 1 7 6 26 26 37
Med 0 32 12 75 69 274 261 378
High 0 74 33 202 181 708 632 937
These findings confirm our earlier strategic advice, that maintenance of optimal TTIQ capacity enables substantial reduction of the clinical consequences of the transition to Phase B. In the case that optimal TTIQ capacity is not able to be maintained, additional ‘low-level’ public health and social measures in combination with partial TTIQ can achieve similar epidemiological and clinical outcomes (Table S1.3).
14
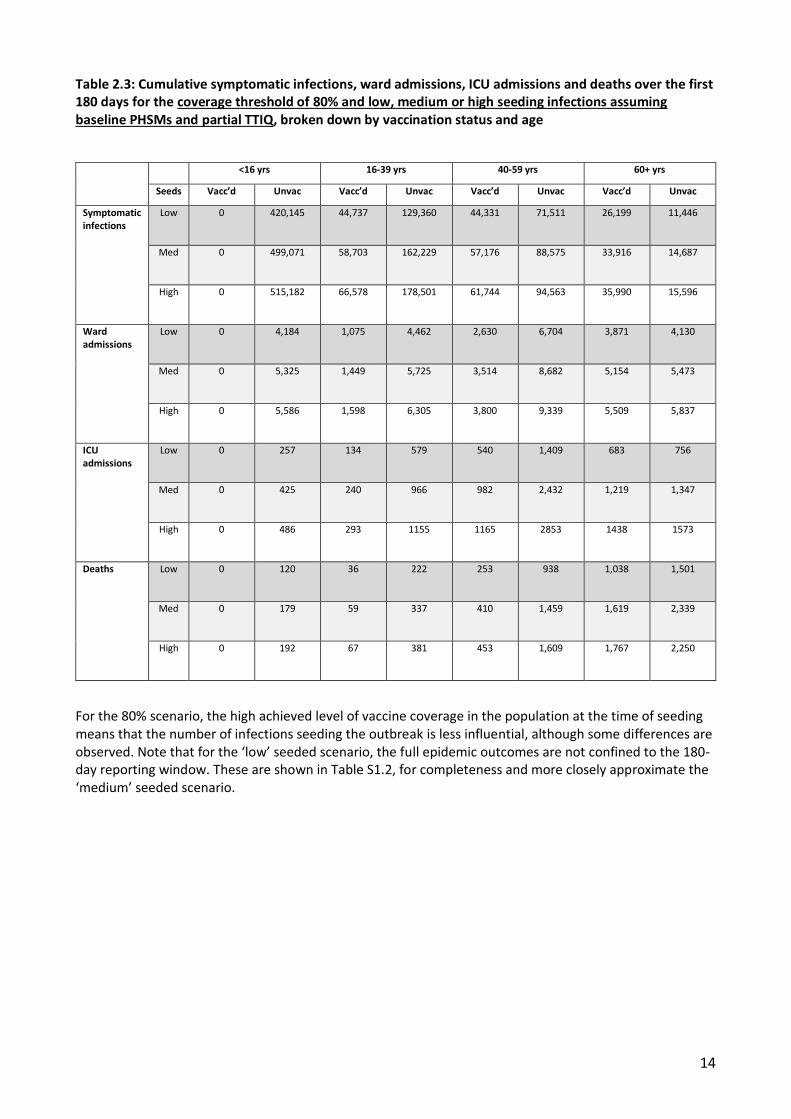
Table 2.3: Cumulative symptomatic infections, ward admissions, ICU admissions and deaths over the first 180 days for the coverage threshold of 80% and low, medium or high seeding infections assuming baseline PHSMs and partial TTIQ, broken down by vaccination status and age
Med 0 499,071 58,703 162,229 57,176 88,575 33,916 14,687
High 0 515,182 66,578 178,501 61,744 94,563 35,990 15,596
Ward admissions
Low 0 4,184 1,075 4,462 2,630 6,704 3,871 4,130
Med 0 5,325 1,449 5,725 3,514 8,682 5,154 5,473
High 0 5,586 1,598 6,305 3,800 9,339 5,509 5,837
ICU admissions
Low 0 257 134 579 540 1,409 683 756
Med 0 425 240 966 982 2,432 1,219 1,347
High 0 486 293 1155 1165 2853 1438 1573
Deaths Low 0 120 36 222 253 938 1,038 1,501
Med 0 179 59 337 410 1,459 1,619 2,339
High 0 192 67 381 453 1,609 1,767 2,250
For the 80% scenario, the high achieved level of vaccine coverage in the population at the time of seeding means that the number of infections seeding the outbreak is less influential, although some differences are observed. Note that for the ‘low’ seeded scenario, the full epidemic outcomes are not confined to the 180-day reporting window. These are shown in Table S1.2, for completeness and more closely approximate the ‘medium’ seeded scenario.
15
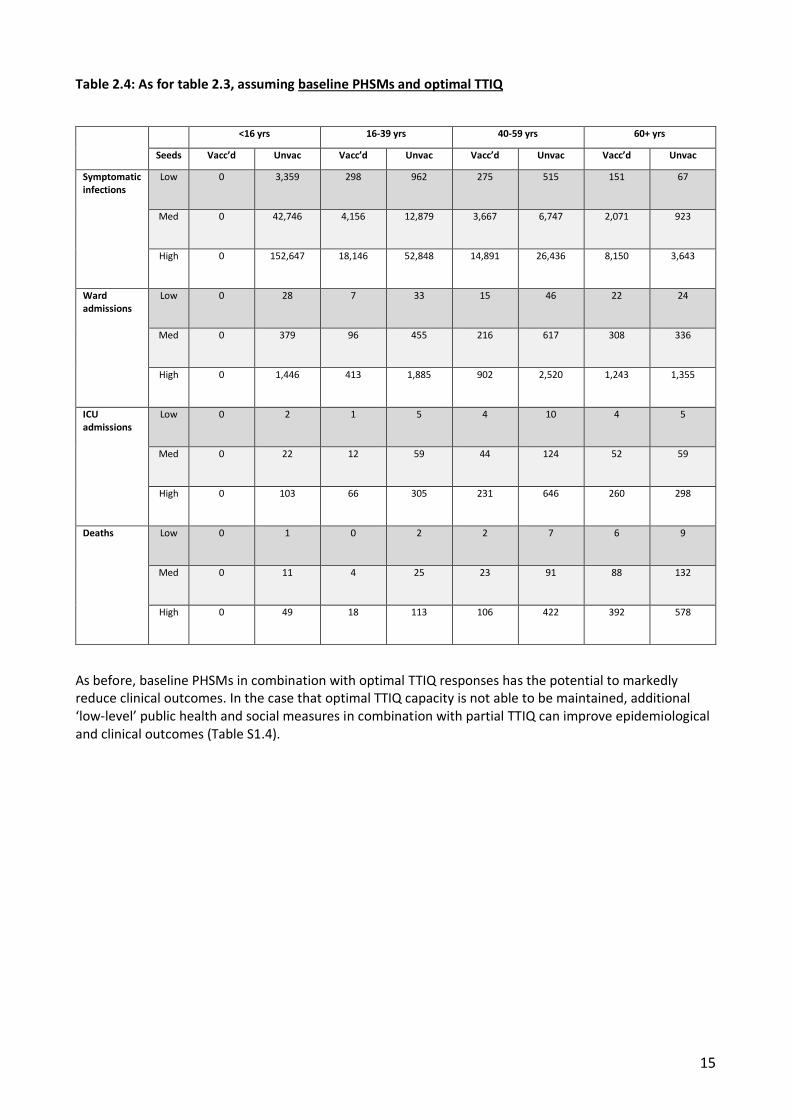
Table 2.4: As for table 2.3, assuming baseline PHSMs and optimal TTIQ
High 0 152,647 18,146 52,848 14,891 26,436 8,150 3,643
Ward admissions
Low 0 28 7 33 15 46 22 24
Med 0 379 96 455 216 617 308 336
High 0 1,446 413 1,885 902 2,520 1,243 1,355
ICU admissions
Low 0 2 1 5 4 10 4 5
Med 0 22 12 59 44 124 52 59
High 0 103 66 305 231 646 260 298
Deaths Low 0 1 0 2 2 7 6 9
Med 0 11 4 25 23 91 88 132
High 0 49 18 113 106 422 392 578
As before, baseline PHSMs in combination with optimal TTIQ responses has the potential to markedly reduce clinical outcomes. In the case that optimal TTIQ capacity is not able to be maintained, additional ‘low-level’ public health and social measures in combination with partial TTIQ can improve epidemiological and clinical outcomes (Table S1.4).
16
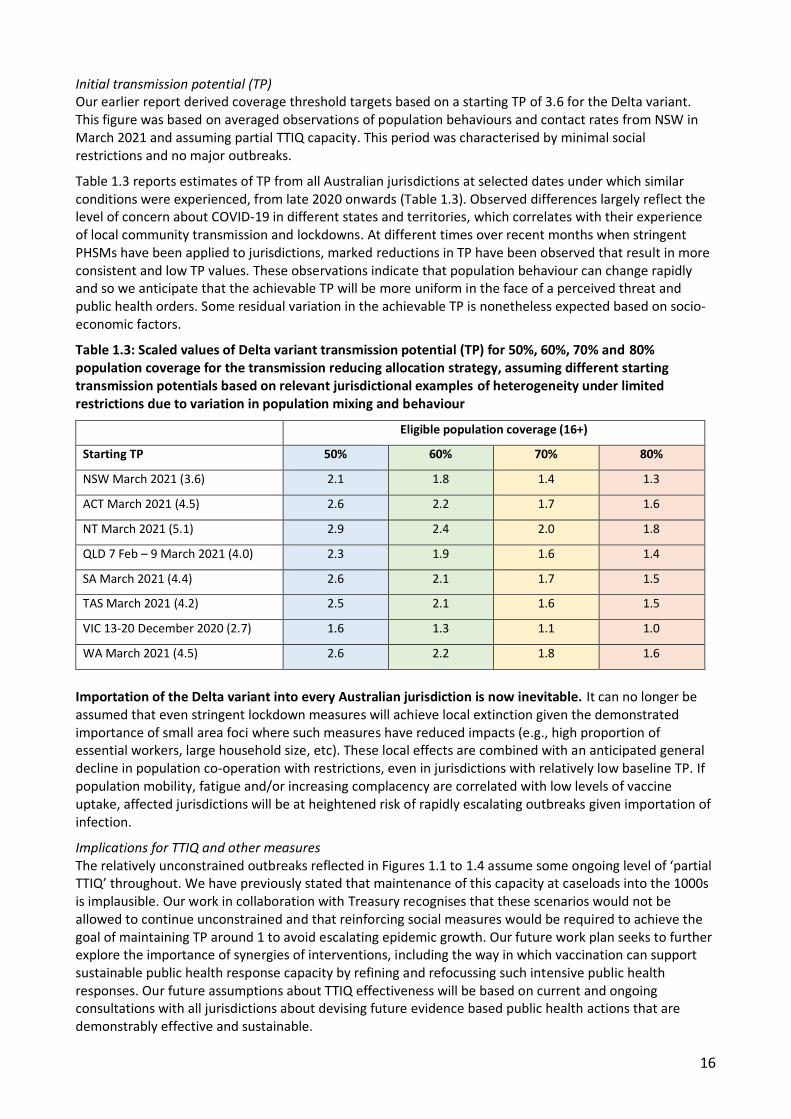
Initial transmission potential (TP) Our earlier report derived coverage threshold targets based on a starting TP of 3.6 for the Delta variant. This figure was based on averaged observations of population behaviours and contact rates from NSW in March 2021 and assuming partial TTIQ capacity. This period was characterised by minimal social restrictions and no major outbreaks.
Table 1.3 reports estimates of TP from all Australian jurisdictions at selected dates under which similar conditions were experienced, from late 2020 onwards (Table 1.3). Observed differences largely reflect the level of concern about COVID-19 in different states and territories, which correlates with their experience of local community transmission and lockdowns. At different times over recent months when stringent PHSMs have been applied to jurisdictions, marked reductions in TP have been observed that result in more consistent and low TP values. These observations indicate that population behaviour can change rapidly and so we anticipate that the achievable TP will be more uniform in the face of a perceived threat and public health orders. Some residual variation in the achievable TP is nonetheless expected based on socio-economic factors.
Table 1.3: Scaled values of Delta variant transmission potential (TP) for 50%, 60%, 70% and 80% population coverage for the transmission reducing allocation strategy, assuming different starting transmission potentials based on relevant jurisdictional examples of heterogeneity under limited restrictions due to variation in population mixing and behaviour
Eligible population coverage (16+)
Starting TP 50% 60% 70% 80%
NSW March 2021 (3.6) 2.1 1.8 1.4 1.3
ACT March 2021 (4.5) 2.6 2.2 1.7 1.6
NT March 2021 (5.1) 2.9 2.4 2.0 1.8
QLD 7 Feb – 9 March 2021 (4.0) 2.3 1.9 1.6 1.4
SA March 2021 (4.4) 2.6 2.1 1.7 1.5
TAS March 2021 (4.2) 2.5 2.1 1.6 1.5
VIC 13-20 December 2020 (2.7) 1.6 1.3 1.1 1.0
WA March 2021 (4.5) 2.6 2.2 1.8 1.6
Importation of the Delta variant into every Australian jurisdiction is now inevitable. It can no longer be assumed that even stringent lockdown measures will achieve local extinction given the demonstrated importance of small area foci where such measures have reduced impacts (e.g., high proportion of essential workers, large household size, etc). These local effects are combined with an anticipated general decline in population co-operation with restrictions, even in jurisdictions with relatively low baseline TP. If population mobility, fatigue and/or increasing complacency are correlated with low levels of vaccine uptake, affected jurisdictions will be at heightened risk of rapidly escalating outbreaks given importation of infection.
Implications for TTIQ and other measures The relatively unconstrained outbreaks reflected in Figures 1.1 to 1.4 assume some ongoing level of ‘partial TTIQ’ throughout. We have previously stated that maintenance of this capacity at caseloads into the 1000s is implausible. Our work in collaboration with Treasury recognises that these scenarios would not be allowed to continue unconstrained and that reinforcing social measures would be required to achieve the goal of maintaining TP around 1 to avoid escalating epidemic growth. Our future work plan seeks to further explore the importance of synergies of interventions, including the way in which vaccination can support sustainable public health response capacity by refining and refocussing such intensive public health responses. Our future assumptions about TTIQ effectiveness will be based on current and ongoing consultations with all jurisdictions about devising future evidence based public health actions that are demonstrably effective and sustainable.
17
Currency of proposed next phase work plan
Critical importance of data-informed optimisation and targeting of TTIQ response (Work Package 1) TTIQ capacity is an important constraint on forward transmission of infection to minimise harms. Multi-jurisdictional consultations co-ordinated by Health are ongoing with CDNA and AHPPC to determine the most efficient and effective public health responses in Phase A and through transition to Phase B and C. These discussions are informed by the current experience of evolving epidemics in NSW and VIC where rationalisation of response actions has been needed to deal with high caseloads in the setting of low vaccine coverage. In the transition to Phase B, the constraining effects of vaccine on transmission will greatly assist the public health response. Importantly, in that phase there will be a shift in the objectives of TTIQ from ‘zero tolerance’ containment to transmission reduction allowing a lesser focus on casual and place-based contact tracing outside high-risk settings.
Real world evaluation of impact of social measures at small area level (Work Package 2) The scenarios in this report representing a single national COVID-19 epidemic are clearly (and deliberately) artificial and serve to inform high level policy strategy. In reality, the national COVID-19 epidemic has been and will continue to be a ‘fire’ fought on multiple fronts. Public health units are aware that small areas and subpopulations with different age and household structures and levels of advantage have different risks of infection transmission and adverse health outcomes. Throughout the pandemic, we have also observed that such individuals may also be disproportionately engaged in essential service occupations that cannot be safely performed at home meaning that broadly applied social measures and lockdowns provide less effective protection. The national situational assessment team has been working in collaboration with A/Prof James Wood (UNSW) to support the current NSW response, including through reporting of TP at small area level. Within work package 2, we will examine case studies based on data from NSW and VIC to demonstrate how population determinants influence risk both in outbreak and immunised settings. It is anticipated that in the future, TP reporting will be available at small area level to inform ongoing risk assessment, including the need for focused intensified TTIQ responses in areas where social measures have reduced impacts, aligning with WP1. WP2 includes consultations with key populations groups including through the Aboriginal and Torres Strait Islander Advisory Group and the CALD Advisory Group.
Small area requirements for augmented vaccine coverage and delivery Areas at increased risk of transmission and with reduced impacts of social measures should be prioritised for vaccine delivery and higher target thresholds may be recommended. We are liaising closely with the Quantium team in Health to determine how findings from our work may map to their characterisation of small areas to support strategic vaccine allocation moving forward.
Timeliness and prioritisation of 12-15 years program extension Recent announcements regarding intentions to immunise the 12-15 years age group pending a positive ATAGI recommendation have elevated the priority of work to inform vaccine strategy in the school years. We are consulting with Operation COVID-shield to identify vaccine implementation approaches that will influence assumptions about likely future coverage within schools, in their population context. Such understandings will inform models of infection transmission in school settings in a largely immunised population, informing recommendations for ongoing COVID-safe measures, proportionate public health responses to school-based outbreaks and any requirements for school closure in the setting of broad social restrictions. Addition of this age group to the National Program will enhance the within-household ‘indirect’ effects anticipated from immunising parents, further reducing the risk of infecting siblings less than 12 years within the home environment.
Additional implications of jurisdictional TP for border risk tolerance (Work Package 3) Consultations co-ordinated by PMC have commenced with a broad range of government departments, to define aspirational arrivals targets over the six months following transition to Phase B. Findings will inform input risk assumptions and distribution of arrivals pathways to allow evaluation of outbreak risks associated with any breaches of the quarantine system. Outbreaks risks and consequences will be assessed in the context of TP achieved through vaccination and social measures in exemplar jurisdictions. This phase of work will bring together relevant insights from the preceding work packages.
18
APPENDIX
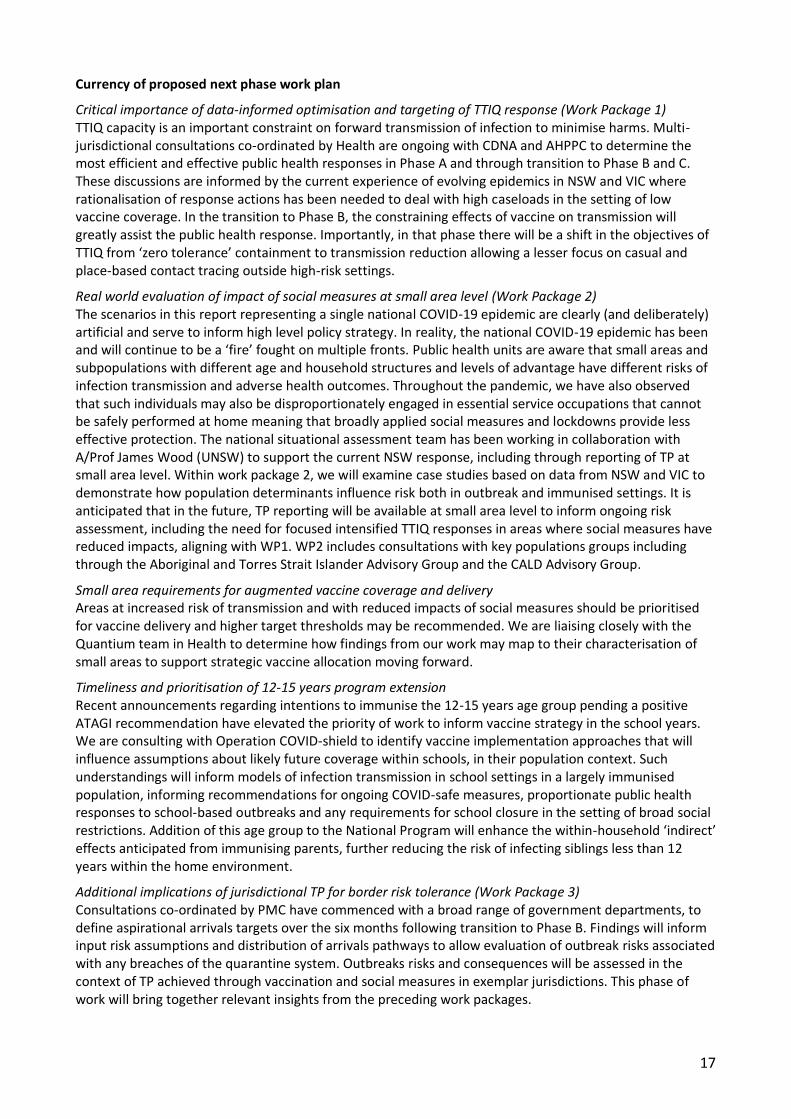
Extension of ‘full’ epidemic course for low seeding epidemics at 70/80% coverage, assuming baseline PHSMs and partial TTIQ
Table S1.1: Cumulative symptomatic infections, ward admissions, ICU admissions and deaths over the full epidemic course for the coverage threshold of 70% and low seeding infections assuming baseline PHSMs and partial TTIQ, broken down by vaccination status and age
*Note that some figures for these ‘low’ scenarios are now higher than those reported in related tables for the ‘medium’ seeding scenarios, which have almost but not quite completed in the 180 days.
Overlay of PHSMs on partial TTIQ scenarios reduces clinical outcomes The additional constraint of continuous ‘low’ PHSMs augments the ability of ‘partial TTIQ’ capacity to suppress epidemic growth to a level similar to that observed for the ‘baseline PHSM and optimal TTIQ’ scenario in our earlier report.
Figure S1.1: Epidemic growth to 180 days given transition to Phase B leading to established community transmission for the coverage threshold of 70% and low seeding infections, assuming continuous low PHSMs and partial TTIQ*
All infections Deaths
*Note the y axis in the ‘all infections’ plots is substantively lower than that in the comparison Figure 1.1 (leftmost plot – low seeding) where the y axis extends to 120,000
19
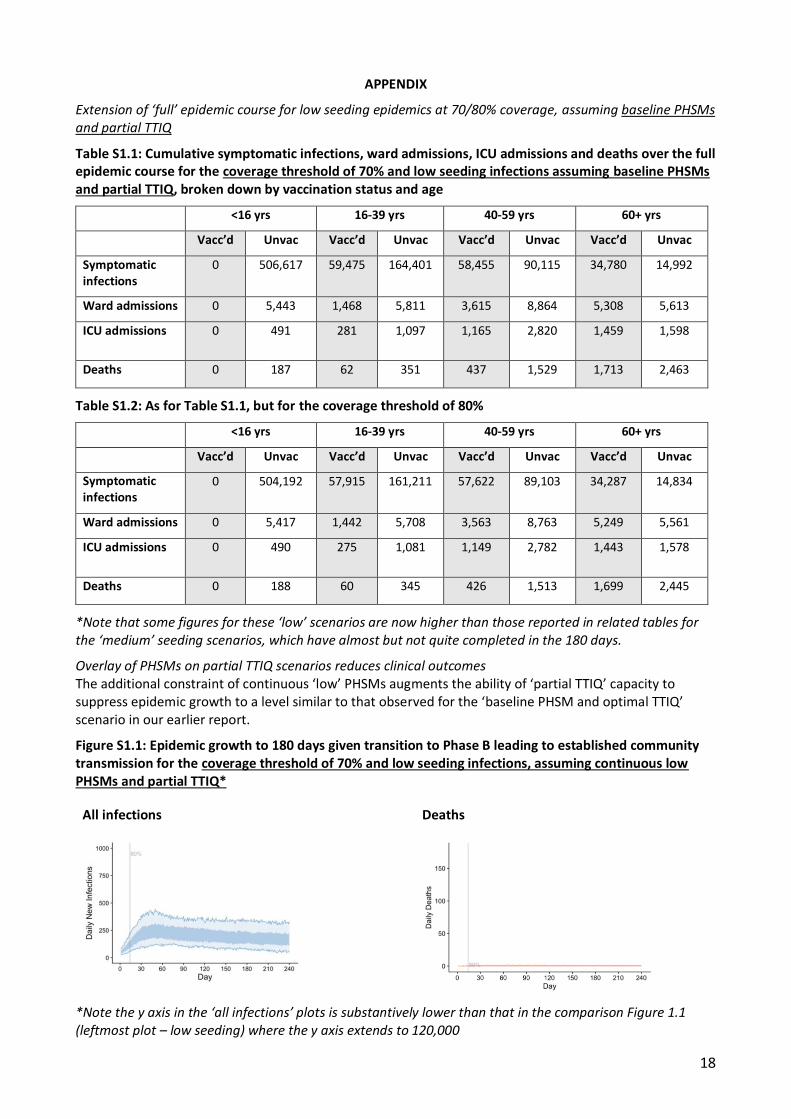
Table S1.3: Cumulative symptomatic infections, ward admissions, ICU admissions and deaths over the first 180 days for the coverage threshold of 70% and low seeding infections assuming continuous low PHSMs and partial TTIQ, broken down by vaccination status and age
Table S1.5: As for Table S1.4 but assuming continuously overlaid medium PHSMs during the transition between 70 and 80% coverage thresholds, reverting to low PHSMs from 80%*
Identification of code error related to AZ dosing interval in simulations contained in dynamic model outputs up to and including the Technical Report and Addendum (10th August 2021)
When reviewing the code for the purpose of running these simulations, an input error was identified relating to the assumed dose spacing of Astra Zeneca vaccines. Second doses were assigned to individuals at 49 days (7 weeks) instead of 84 days (12 weeks). Full efficacy following second dose completion was assumed. As a result, individuals who had received Astra Zeneca were deemed fully protected sooner.
Careful code checking has always ensured that seeding occurred only when the target vaccine coverage threshold of 50% or more was reached in the simulated population. The bulk of Astra Zeneca delivered in the Australian program was in the early phases of vaccine rollout. The consequence of this error was to increase the relative proportion of individuals deemed fully immunised in the earlier phases of the simulations with minimal influence on the later phases of simulated epidemics.
We have rerun our (original) model simulations with the corrected dose spacing of 84 days. The numerical impact of the change is minor, with no change to interpretation.
Figure S2.1: Epidemic growth to 240 days given transition to Phase B leading to established community transmission for the threshold coverage targets of 70% and 80% (rows) with 30 seeded infections in unimmunised individuals, assuming baseline PHSMs and partial TTIQ. The original and updated dose spacings for the AZ vaccine are shown in columns.
49-day interval 84-day interval
70% Coverage
80% Coverage
21
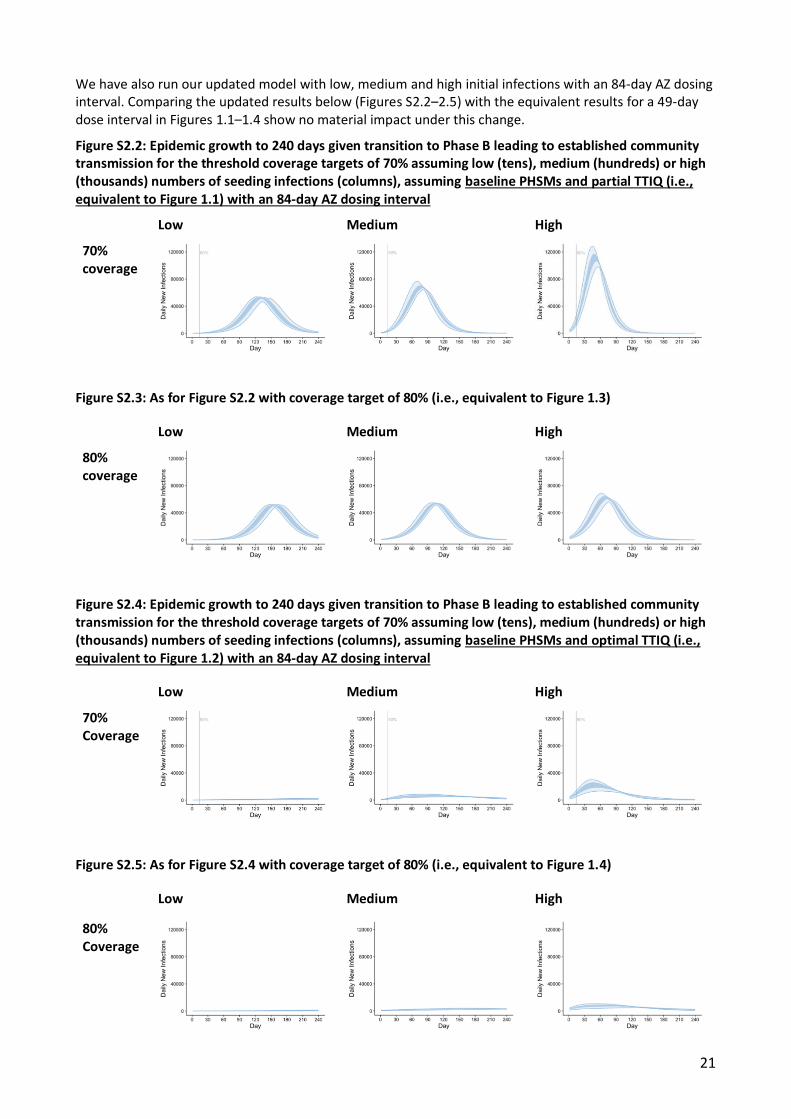
We have also run our updated model with low, medium and high initial infections with an 84-day AZ dosing interval. Comparing the updated results below (Figures S2.2–2.5) with the equivalent results for a 49-day dose interval in Figures 1.1–1.4 show no material impact under this change.
Figure S2.2: Epidemic growth to 240 days given transition to Phase B leading to established community transmission for the threshold coverage targets of 70% assuming low (tens), medium (hundreds) or high (thousands) numbers of seeding infections (columns), assuming baseline PHSMs and partial TTIQ (i.e., equivalent to Figure 1.1) with an 84-day AZ dosing interval
Low Medium High
70% coverage
Figure S2.3: As for Figure S2.2 with coverage target of 80% (i.e., equivalent to Figure 1.3)
Low Medium High
80% coverage
Figure S2.4: Epidemic growth to 240 days given transition to Phase B leading to established community transmission for the threshold coverage targets of 70% assuming low (tens), medium (hundreds) or high (thousands) numbers of seeding infections (columns), assuming baseline PHSMs and optimal TTIQ (i.e., equivalent to Figure 1.2) with an 84-day AZ dosing interval
Low Medium High
70% Coverage
Figure S2.5: As for Figure S2.4 with coverage target of 80% (i.e., equivalent to Figure 1.4)
Low Medium High
80% Coverage
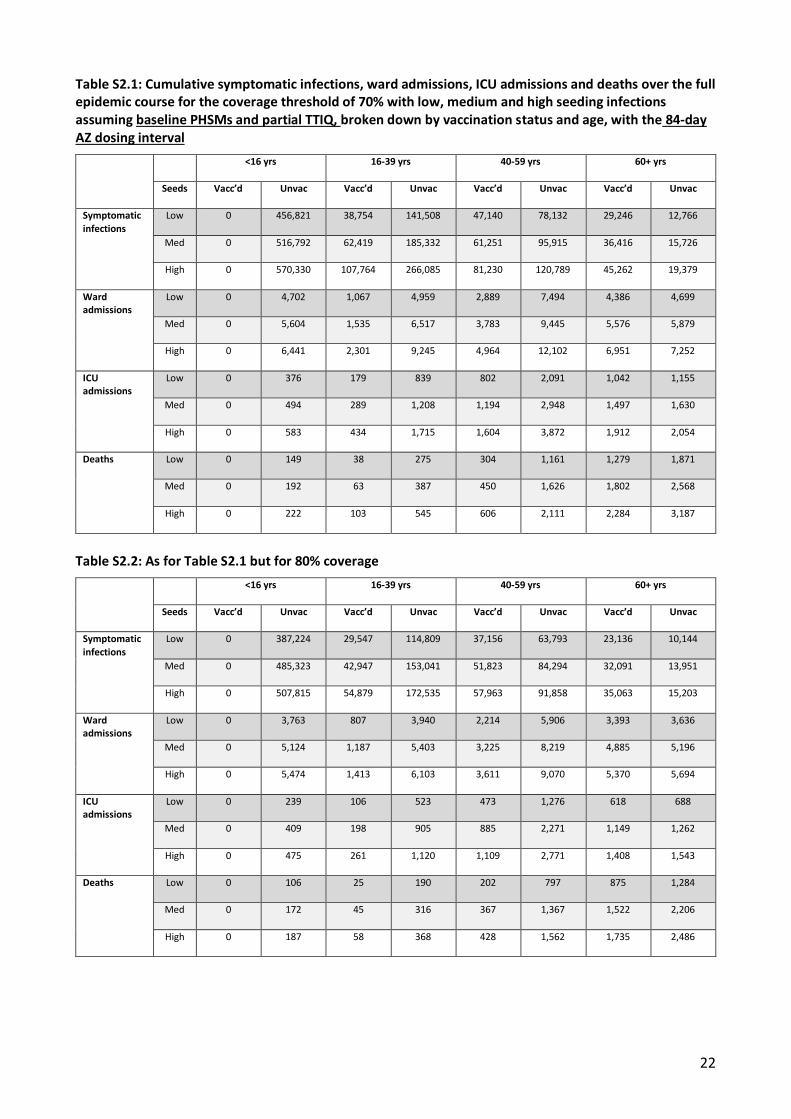
22
Table S2.1: Cumulative symptomatic infections, ward admissions, ICU admissions and deaths over the full epidemic course for the coverage threshold of 70% with low, medium and high seeding infections assuming baseline PHSMs and partial TTIQ, broken down by vaccination status and age, with the 84-day AZ dosing interval