Page 1
~ 0 ~
Dipartimento di Ecologia e Biologia
Dottorato di Ricerca in Genetica e Biologia Cellulare
Ciclo XXVII
Settore scientifico-disciplinare BIO/11
MUTANT P53 INHIBITS microRNA BIOGENESIS BY
INTERFERING WITH THE MICROPROCESSOR
COMPLEX
Candidata: Dott.ssa Aymone Gurtner
Coordinatore Dottorato: Relatore:
Prof. Giorgio Prantera Dott.ssa Giulia Piaggio
Page 2
~ 1 ~
TABLE OF CONTENTS
1 ABSTRACT p4
2 INTRODUCTION p5
2.1 MicroRNAs. p5
2.2 MicroRNA biogenesis. p5
2.3 MicroRNAs are cancer genes. p8
2.4 Defects of microRNA biogenesis in cancer. p10
2.4.1 Genetic alterations. p10
2.4.2 Transcriptional regulation. p11
2.4.3 Post-transcriptional regulation. p12
2.5 The tumor suppressor p53 is a master regulator of microRNAs. p16
2.6 MicroRNAs and mutant p53: more questions than answers. p17
3 RESULTS p19
3.1 Mutp53 inhibits mature miRNAs expression. p19
3.2 Mutp53 negatively regulates miRNA biogenesis at
transcriptional and post-transcriptional level. p23
3.3 Mutp53 binds and sequesters p72/82 from
Microprocessor causing an attenuation of miRNA maturation. p25
3.4 Mutp53-regulated miRNAs inhibit cell growth and migration. p28
4 CONCLUSIONS AND DISCUSSION p32
5 MATERIALS AND METHODS p35
5.1 Cell culture and transfection. p35
Page 3
~ 2 ~
5.2 lentiviral vectors. p35
5.3 RNA extraction, cDNA synthesis and RT-qPCR. p35
5.4 Western blotting. p38
5.5 Co-immunoprecipitation. p39
5.6 RNA-ChIP. p39
5.7 Transfection of miRNA mimics. p40
5.8 Cell growth assay and flow cytometry. p40
5.9 Wound-healing assay. p40
5.10 Double Immunofluorescence labeling. p41
5.11 Confocal Scanning Laser Microscopy. p41
5.12 miRNA PCR array analysis. p41
5.13 Hierarchical clustering of breast cancer samples
based on miRNA expression data. p42
5.14 Statistical analysis. p42
6 REFERENCES p43
Figure 1 p7
Figure 2 p15
Figure 3 p18
Figure 4 p20
Figure 5 p22
Figure 6 p24
Figure 7 p26
Figure 8 p27
Page 4
~ 3 ~
Figure 9 p29
Figure 10 p30
Figure 11 p31
Figure 12 p33
Page 5
~ 4 ~
1 ABSTRACT
A decrease of mature microRNAs is often observed in human malignancies giving them
potential to act as tumor suppressors. Thus, microRNAs may be potential targets for cancer
therapy. In agreement, inhibition of microRNA biogenesis tends to enhance tumorigenesis,
and alterations in the microRNA biogenesis machinery impact on the establishment and
development of cancer programs. Moreover, accumulation of pri-microRNAs and
corresponding depletion of mature microRNAs occurs in human cancers compared to normal
tissues, strongly indicating an impairment of crucial steps in microRNA biogenesis. Still, the
mechanisms through which microRNAs are regulated in cancer remain poorly understood.
Therefore, the understanding of mechanisms that drive the alterations in the microRNA
biogenesis is a cardinal question in cancer biology. The TP53 tumor suppressor gene is
mutated in half of human tumors resulting in an oncogene with Gain-Of-Function activities.
Numerous microRNAs can be regulated by wtp53 at transcriptional and post-transcriptional
level but very few data about mutant p53-dependent microRNA expression are available yet.
Here we demonstrate that mutant p53 oncoproteins modulate the biogenesis of a subset of
microRNAs in cancer cells inhibiting their post-transcriptional maturation. Interestingly,
among these microRNAs several are also downregulated in human tumors. By confocal,
coimmunoprecipitation and RNA-ChIP experiments, we show that endogenous mutant p53
binds and sequesters RNA helicases p72/82 from the Microprocessor complex, interfering
with the Drosha-pri-microRNAs association. In agreement with this, the overexpression of
p72 leads to an increase of mature microRNAs levels. Finally, we demonstrate that 4 of post-
transcriptionally regulated microRNAs display tumor suppressive properties related to
apoptosis, cell cycle arrest, epithelial-mesenchymal transition repression and migration
inhibition, strongly indicating that these microRNAs are downregulated by mutp53 in order to
de-activate tumor suppressive pathways. Our study highlights for the first time a novel GOF
activity of mutant p53 proteins responsible, at least in part, for the microRNA deregulation
observed in cancer.
Page 6
~ 5 ~
2 INTRODUCTION
2.1 MicroRNAs.
With the advent of next generation sequencing techniques a previously unknown world of
non-coding RNA molecules have been discovered. The best characterized non-coding RNA
family consists in microRNAs. MicroRNAs (miRNAs) are small non coding single-stranded
RNAs of about 20–25 nucleotides in length that regulate gene expression by binding to
complementary target mRNAs and promoting their decay or inhibiting their translation (1-3).
More than 2000 miRNA genes and an even greater number of predicted miRNA targets have
been identified in the human genome. Thus, miRNAs are potent regulators of gene expression
involved in diverse physiological processes, such as normal development, differentiation,
growth control, apoptosis, and in human diseases, particularly in cancer where they act as
regulators of key cancer-related pathways (4-6).
Moreover, an aberrant miRNA levels reflect the physiological state of cancer cells and can be
detected by miRNA expression profiling and harnessed for the purpose of diagnosis and
prognosis (7, 8). In agreement, miRNA processing defects enhance tumorigenesis (9).
Although insights into the regulatory function of miRNAs are beginning to emerge, much less
is known about the deregulation of miRNA in cancer.
2.2 MicroRNA biogenesis.
The expression level of biologically active mature miRNAs is the result of a fine mechanism
of biogenesis, carried out by different enzymatic complexes that exert their function at
transcriptional and post-transcriptional levels.
MiRNAs sequences are distributed all throughout the genome, being localized in exonic or
intronic regions, as well as intergenic locations (10). The biogenesis of miRNAs starts with
their transcription by RNA polymerase II (11) although some other miRNAs are transcribed
by RNA polymerase III (12) resulting in a primary transcript known as pri-miRNA which
contains a 33 nucleotides hairpin stem, a terminal loop and a flanking single stranded
sequence of hundreds of bases or even several kilobases. In general, pri-miRNAs are capped
at the 5´end and polyadenylated at the 3´ end. The canonical miRNA biogenesis pathway is
characterized by two subsequent central steps utilizing ribonuclease reactions (Figure 1B). In
the nucleus, pri-miRNAs are recognized and cropped into hairpin-structured precursor
miRNAs (pre-miRNAs) by the Drosha complex (also known as Microprocessor complex).
Page 7
~ 6 ~
Drosha, an RNase III enzyme, and DGCR8 (DiGeorge critical region 8), a double-stranded
RNA-binding domain (dsRBD) protein, are two essential components of the Microprocessor
complex. Drosha liberates the stem_loop pre-miRNAs from pri-miRNAs in cooperation with
DGCR8-mediated recognition of the junctional region between the single-stranded and
double-stranded portions of pri-miRNAs (13, 14). The Drosha complex also contains several
auxiliary factors including the DEAD-box RNA helicases p68 (DDX5) and p72/p82 (DDX17)
witch promote the fidelity and activity of Drosha processing (15). miRNA biogenesis is
homeostatically controlled by an auto-feedback loop between Drosha and DGCR8 (16), in
which DGCR8 stabilizes Drosha protein level, while Drosha destabilizes DGCR8 mRNA
through cleavage of the hairpin structures in the DGCR8 mRNA. p68 and p72/p82 are
prototypic members of the DEAD box protein family of RNA helicases (see section 2.4.3).
Alternatively, some non-canonical biogenesis pathways may occur during mRNA splicing,
giving rise to “miRtrons”. MiRtrons are in fact, the spliced-out introns of mRNAs, which
constitute functional pre-miRNAs. Therefore, production of miRtrons is independent of
Drosha digestion (17). The pre-miRNAs of approximately 70 nucleotides in length are
transported from the nucleus to the cytoplasm by Exportin-5 (XPO5) together with Ran-GTP
(Figure 1B)(18). Exportin-5 can also protect pre-miRNAs against nuclear degradation (19). In
the cytoplasm, Dicer, another RNase III, digests the pre-miRNA into a 20-25 nucleotides
mature duplex miRNA. During this process, Dicer is associated with other proteins like TAR
RNA binding protein (TRBP) and kinase R–activating protein (PACT) to increase its stability
and its processing activity (20, 21). The miRNA duplex is comprised of two miRNA strands,
with one strand loaded onto the RNA-induced silencing complex (RISC), which contains the
Argonaute (Ago) family protein as a core component (Figure 1B). In these processes, another
strand (miRNA* strand) is usually degraded, while miRNA* strands are retained and function
in some cases (22). Mature miRNAs serve as guides directing RISC to target mRNAs, which
are degraded, destabilized or translationally inhibited by the Ago proteins (23).
Page 8
~ 7 ~
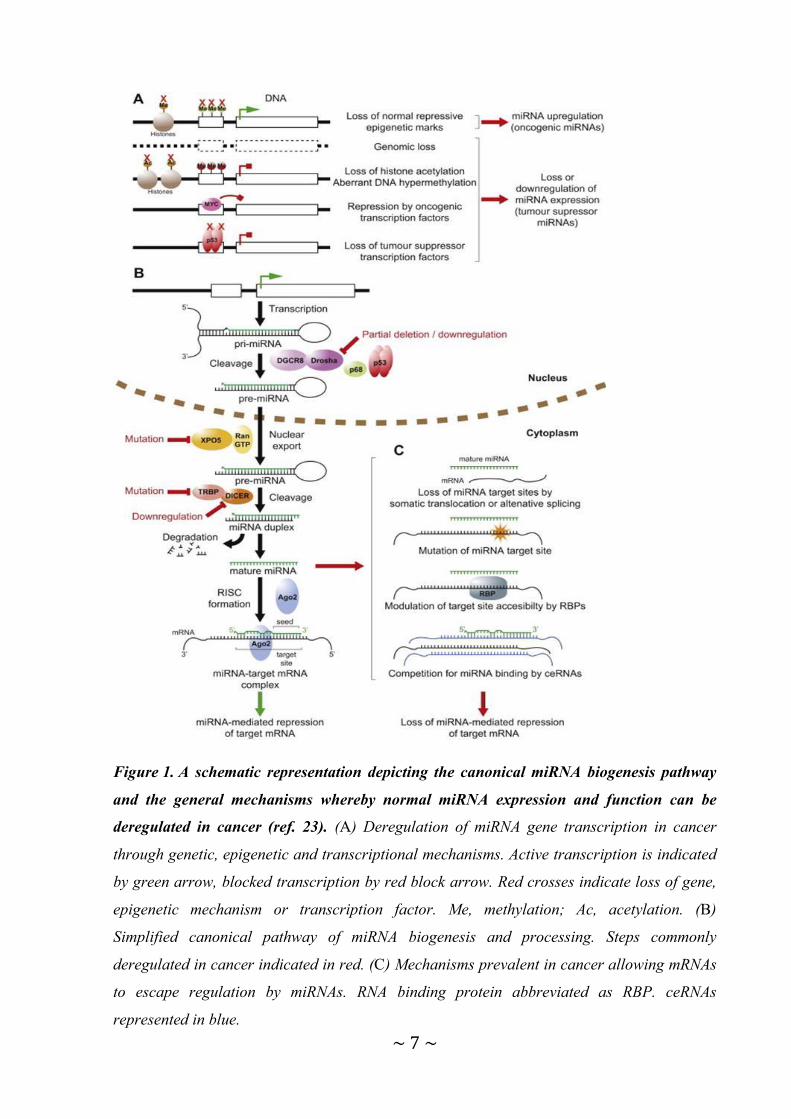
Figure 1. A schematic representation depicting the canonical miRNA biogenesis pathway
and the general mechanisms whereby normal miRNA expression and function can be
deregulated in cancer (ref. 23). (A) Deregulation of miRNA gene transcription in cancer
through genetic, epigenetic and transcriptional mechanisms. Active transcription is indicated
by green arrow, blocked transcription by red block arrow. Red crosses indicate loss of gene,
epigenetic mechanism or transcription factor. Me, methylation; Ac, acetylation. (B)
Simplified canonical pathway of miRNA biogenesis and processing. Steps commonly
deregulated in cancer indicated in red. (C) Mechanisms prevalent in cancer allowing mRNAs
to escape regulation by miRNAs. RNA binding protein abbreviated as RBP. ceRNAs
represented in blue.
Page 9
~ 8 ~
2.3 MicroRNAs are cancer genes.
Downregulation of miRNAs is commonly observed in human cancers (23), suggesting that
miRNAs are primarily tumor suppressor genes. Microarray expression data from a wide
spectrum of cancer diseases have since evidenced that aberrant miRNA expression is the rule
rather than the exception in cancer (24-26). Importantly, mouse models featuring miRNA
overexpression or ablation have demonstrated causal links between miRNAs and cancer
development and miRNAs are rapidly entering the clinic as biomarkers and putative
therapeutic targets (27). Indeed, aberrant miRNA levels reflect the physiological state of
cancer cells and can be detected by miRNA expression profiling and harnessed for the
purpose of diagnosis and prognosis (28, 29). In fact, miRNA profiling can be more accurate at
classifying tumors than mRNA profiling because miRNA expression correlates closely with
tumor origin and stage, and can be used to classify poorly differentiated tumors that are
difficult to identify using a standard histological approach. The special features of miRNAs
make them potentially useful for detection in clinical specimens. For example, miRNAs are
relatively resistant to ribonuclease degradation, and they can be easily extracted from small
biopsies, frozen samples and even formalin-fixed, paraffinembedded tissues. Furthermore,
relatively simple and reproducible assays have been developed to detect the abundance of
individual miRNAs, and methods that combine small RNA isolation, PCR and next-
generation sequencing, allow accurate and quantitative assessment of all the miRNAs that are
expressed in a patient specimen, including material that has been isolated by laser capture
microdissection. Perhaps the most appealing application of miRNAs as a cancer diagnostic
tool comes from the discovery of circulating miRNAs in serum. For example, miR-141
expression levels in serum were significantly higher in patients with prostate cancer than in
healthy control individuals (30). Although the analysis of circulating miRNAs is only just
beginning, the successful advancement of this technology could provide a relatively non-
invasive diagnostic tool for single-point or longitudinal studies. With such diagnostic tools in
place, miRNA profiling could be used to guide cancer classification, facilitate treatment
decisions, monitor treatment efficacy and predict clinical outcome.
As a single miRNA may target up to several hundred mRNAs, aberrant miRNA expression
may affect a multitude of transcripts and profoundly influence cancer-related signaling
pathways. Functional studies show that miRNAs that are affected by somatic alterations in
tumors can affect cancer phenotypes directly, therefore confirming their driver function in
malignancy. As drivers of malignancy, mechanistic studies show that these miRNAs interact
Page 10
~ 9 ~
with known cancer networks; hence, tumor-suppressor miRNAs can negatively regulate
protein-coding oncogenes, whereas oncogenic miRNAs often repress known tumor
suppressors. Importantly, mouse models featuring miRNA overexpression or ablation have
demonstrated causal links between miRNAs and cancer development and miRNAs are rapidly
entering the clinic as putative therapeutic targets (27).
Expression of miRNAs is mainly downregulated in tumor tissues, as compared to
corresponding healthy tissues, which supported the role of miRNAs as primarily tumor
suppressors such as miR-10b, -34a, -let-7c, 145 well described on review 31. Along with the
dominance of tumor suppressor miRNAs, several well-characterized oncogenic miRNAs have
been reported in tumors. Perhaps the best example of this is the oncogenic miR-17-92 cluster,
which is amplified in some human B cell lymphomas, cooperates with Myc to promote B-cell
lymphoma in mice. Transgenic mice overexpressing miR-17-92 developed
lymphoproliferative disorders (32) and retroviral overexpression of the cluster accelerated
lymphoma formation in collaboration with MYC (33). Two groups have independently
dissected the cluster using knockout mice and demonstrated that loss of miR-17-92 leads to
reduced tumourgenicity and increased cell death (34, 35). Another example is miR-155
overexpression in the lymphoid compartment, which triggers B-cell leukaemia or a
myeloproliferative disorder depending on the system used to drive expression of the
transgene; this was the first example of a miRNA that initiates cancer in a transgenic setting
(36, 37). In addition to promoting cancer initiation, miRNAs can modulate processes that
support cancer progression, including metastasis (38-41). For example, in breast cancer, miR-
10b and miR-9 can induce metastasis, whereas miR-126, miR-335 and miR-31 act as
suppressors. The miR-200 family inhibits epithelial-to-mesenchymal transition, which
influences one aspect of the metastatic process (42). However, miR-200 could also promote
the colonization of metastatic cells in breast cancer, which provides an example of the
opposing activities of some miRNAs (43).
Because many downregulated miRNAs function as tumor suppressors, better understanding
of the biological mechanisms underlying their modulation will likely enable new strategies for
prevention, early detection and therapy of cancer.
Since the discovery of miRNAs in model organisms, miRNAs have emerged as key regulators
of normal development and a diversity of normal cellular processes. Given what we know
now, it is not surprising that perturbations in miRNA biogenesis or expression can contribute
to disease. In cancer, the effects of miRNA alteration can be widespread and profound, and
they touch on virtually all aspects of the malignant phenotype. The mechanisms of
Page 11
~ 10 ~
modification, turnover, stabilization and reduction of miRNAs are largely unknown. Further
characterization of the regulatory elements of miRNA biosynthesis and function will provide
new insights yielding comprehensive understanding of the complex gene-regulatory networks
governed by miRNAs and the involvement of miRNAs in cancer. These findings will also
offer a molecular basis for diagnostic and therapeutic strategies based on miRNA biology.
2.4 Defects of microRNA biogenesis in cancer.
As described above, although the expression of some miRNAs is increased in malignant cells,
the widespread under expression of miRNAs is a more common phenomenon. Different main
mechanisms have been proposed as the underlying cause of the global downregulation of
miRNAs in cancer cells: genetic alterations, transcriptional regulation (epigenetic
mechanisms, miRNA suppression by oncogenic transcription factors, miRNA downregulation
by loss of tumour suppressor transcription factors), post-transcriptional regulation.
Collectively, the global changes in miRNA expression that are seen in cancer cells probably
arise through multiple mechanisms; the combined small changes in the expression of many
miRNAs seem to have a large impact on the malignant state.
2.4.1 Genetic alterations.
In 2004 it was reported that around 50% of miRNAs are located at fragile sites and cancer
susceptibility loci (44). However since then, many more miRNAs have been identified and the
relationship between site fragility and miRNA density seems far more complex than
previously thought. More complete mapping of the human miRNA genes on fragile sites,
cancer-specific translocation breakpoints, repetitive sequences and CpG islands has since
been conducted and reveals that miRNA genes are indeed associated with fragile sites (45).
Aside from structural genetic changes, somatic translocations of miRNA target sites have also
been documented resulting in escape from regulation of an mRNA target by a specific
miRNA (46). Potentially, mutations that alter a miRNA seed sequence could ablate target
repression by tumor-suppressive miRNAs or allow for altered target selection, which could
contribute to oncogenesis. Whereas naturally occurring sequence variations, such as SNPs
(Single Nucleotide Polymorphism), have been shown to influence miRNA targeting in
cancer-related pathways (47), tumor-specific mutations seem to be infrequent.
Page 12
~ 11 ~
2.4.2 Transcriptional regulation.
Epigenetic mechanisms are also important for miRNA transcriptional regulation. Different
approaches have shown that DNA methylation and histone deacetylase inhibitors can modify
the expression of several miRNAs. The identification of miRNAs undergoing DNA
methylation in a broad set of tumors, pointed out the importance of this process in miRNA
downregulation and in the establishment of cancer programs. miR-124 and miR-34, well
defined tumor suppressors, are subject to epigenetic silencing by aberrant DNA
hypermethylation affecting cell cycle pathways in tumors (48). Furthermore, DNA
methylation profiles in miRNA promoter regions can be useful as a diagnostic and prognostic
marker. For example, miR-23b, a miRNA with tumor suppressor activity in prostate cancer, is
downregulated through DNA hypermethylation of its promoter region and its expression level
is correlated with overall survival and recurrence-free survival (49). Deregulated expression
of miRNAs in cancer is also a consequence of alteration in histone marks (Figure 1A), which
occur primarily due to the aberrant action of histone deacetylases and the Polycomb repressor
complex (PRC2). For example, over expression of PRC2 in prostate cancer contributes to the
repression of miR-101 and miR-205 by increasing the levels of H3K27me3 at their promoters.
These alterations result in an increased rate of cell proliferation. In colorectal cancer,
chromatin at promoter regions of tumor suppressor miRNAs show a closed configuration,
producing a repressed transcriptional state (50). CTCF, another epigenetic factor, acts as a
border that delimits the propagation of DNA methylation and histone repressive marks over
different regulatory regions controlling gene expression. In different cancers, CTCF is lost,
promoting repressive epigenetic mechanisms. Recent studies have shown that CTCF regulates
miRNAs such as the tumor suppressor miR-125b1 and the oncogenic miR-375 in breast
cancer cells (51). Finally, the same transcription factors that control mRNA expression can
also regulate miRNA transcription (Figure 1A). For instance, the proto-
oncogene MYC activates the miR-17–92 cluster and causes widespread downregulation of
miRNA genes including tumor suppressor miRNAs such as miR-15a/16–1, miR-34a, and let-
7 family members (52). It appears that the MYC-regulated miRNAs affect virtually all aspects
of the MYC oncogenic program, including proliferation, survival, metabolism, angiogenesis,
and metastasis (53). Besides MYC, other key proteins involved in transcriptional regulation,
including E2F1 (54), ZEB1 (55) and p53 (56, 57) can also regulate the transcription of several
miRNAs.
Page 13
~ 12 ~
2.4.3 Post-transcriptional regulation.
The expression level of miRNA can also be modified as a result of defects in the miRNA
biogenesis pathway. Deregulation of enzymes and cofactors involved in these pathways can
affect the levels of mature miRNAs and have important biological ramifications.
In vivo studies have provided the most direct evidence of an active role for miRNA
downregulation in at least some types of cancer. For example, analysis of mouse models in
which the core enzymes of miRNA biogenesis have been constitutively or conditionally
disrupted by different mechanisms suggests that these molecules function as haploinsufficient
tumour suppressors. Thus, the repression of miRNA processing by the partial depletion of
Dicer1 and Drosha accelerates cellular transformation and tumorigenesis in vivo (64).
Furthermore, deletion of a single Dicer1 allele in lung epithelia promotes Kras-driven lung
adenocarcinomas, whereas complete ablation of Dicer1 causes lethality because of the need
for miRNAs in essential processes (58). Consistent with the potential relevance of these
mechanisms, reduced Dicer1 and Drosha levels have been associated with poor prognosis in
the clinic (59). In addition to the core machinery, modulators of miRNA processing can also
function as haploinsufficient tumour suppressors. Hence, point mutations that affect TARBP2
or exportin-5 are correlated with sporadic and hereditary carcinomas that have microsatellite
instability (60, 61). Moreover, accumulation of pri-miRNAs and corresponding depletion of
mature miRNAs occurs in human cancers compared to normal tissues (62), strongly
indicating an impairment of crucial steps in miRNA biogenesis.
Other miRNA modulators that influence the processing of only a subset of miRNAs could
also be important. p68 (DDX5) and p72/p82 (DDX17) are prototypic members of the DEAD
box protein family of RNA helicases. The isoforms p72 and p82 are transcribed from the
ddx17 gene and share identical RNA helicases functional properties (63). P68 and p72/82
have been shown to interact with each other and form heterodimers and although they share
some functional overlaps, it is clear that they have also distinct roles (64). Both p68 and p72
are responsible for the processing of a subset of pri-miRNAs acting as a bridge between
Drosha and other proteins. Indeed, several molecules, involved in different signalling
pathways, (wtp53, SMAD, BRCA1, and YAP) have been described to bind p68 and/or p72/82
regulating Drosha/DGCR8 mediated miRNAs processing (Figure 2)(65-68). Interestingly,
there are indications that miRNA processing can also be regulated by other miRNAs. The
miR-103/107 family has been shown to target Dicer thereby reducing global miRNA levels
(69). Elevated levels of miR-103/107 are seen in aggressive breast cancers and correlates with
Page 14
~ 13 ~
increased metastatic potential. Mechanistically this is thought to occur by induction of
epithelial-to-mesenchymal transition (EMT) through downregulation of miR-200 levels (69).
During carcinogenesis, point mutations can alter the function of protein coding genes
resulting, for example, in activated oncogenes or deactivated tumour suppressors. This type of
mechanism, being mutation of the seed sequence in the case of mature miRNAs, appears rare.
However, sequence variation in the miRNA target sites present in the mRNA seemingly does
occur allowing mRNAs to avoid binding and consequent negative regulation by miRNAs
(Figure 1C). Indeed, there is evidence that this mechanism plays a role in tumorigenesis.
Bioinformatic analysis of expressed sequence tag and single nucleotide polymorphism (SNP)
databases has demonstrated differing allele frequencies of miRNA-binding sites in cancers
compared to normal tissues (23). Specific incidences of this have been demonstrated
experimentally, such as the case of let-7 and its oncogenic target HMGA2. In several tumours,
the open reading frame and the 3′UTR that contains let-7 target sites have been found
separated by chromosomal rearrangements at the HMGA2 locus resulting in escape of
HMGA2 from let-7 regulation, overexpression of the protein and promotion of tumor
formation (reviewed in ref. 23). Alternative splicing or polyadenylation site usage represent
other mechanisms that can generate alternative 3′UTRs in mRNAs, altering the occurrence of
miRNA target sites (Figure 1C). Functionally, the truncated isoform of the proto-oncogene
IGF2BP1 was shown to increase the frequency of oncogenic transformation more than
expression of the full-length isoform (reviewed in ref. 23).
Accessibility of miRNA binding sites can also be regulated by the secondary structure of the
mRNA molecule, which can be modulated through association of RNA binding proteins
(Figure 1C). Interestingly, sometimes sequences in the vicinity of a miRNA target site are
highly evolutionarily conserved. This led to the hypothesis that these sequences represent
docking platforms for RNA binding proteins to act as modulators of miRNA activity. Finally,
the emergence of other functional non-coding RNAs (ncRNA) has hinted at the possible
complexity of the RNA-ome as a network of inter-communicating regulatory molecules.
An early study reporting the existence of a connection between other ncRNAs and miRNAs
involved in cancer observed that a significant proportion of ultraconserved genomic regions
code for specific set of ncRNAs whose expression is perturbed in human cancers and also
regulated by aberrantly expressed miRNAs (70). Subsequently, the Competing Endogenous
RNA (ceRNA) hypothesis was introduced, proposing that endogenous RNAs, for example
protein coding and non-coding transcripts containing common miRNA recognition elements
(MREs), can compete for the binding of a limited pool of miRNAs thereby co-regulating one
Page 15
~ 14 ~
another (Figure 1C)(71). This hypothesis is exemplified experimentally by work on the
tumour suppressor PTEN mRNA, where MREs are conserved in its related pseudogene
PTENP1 (72). Overexpression of the PTENP1 3′UTR increased levels of PTEN and resulted
in growth inhibition in a DICER-dependent manner. Interestingly,PTENP1 may be a tumour
suppressor gene since copy number losses at the PTENP1 locus were found to occur in
sporadic colon cancer (72). Similar regulation by pseudogenes was observed for other
important cancer genes like KRAS and its pseudogene KRAS1P (72).
As a consequence of these and other studies, more in-depth analysis of the role of
pseudogenes and lncRNAs in cancer is being carried out since they can potentially act as
potent tumour suppressors and oncogenes.
Page 16
~ 15 ~
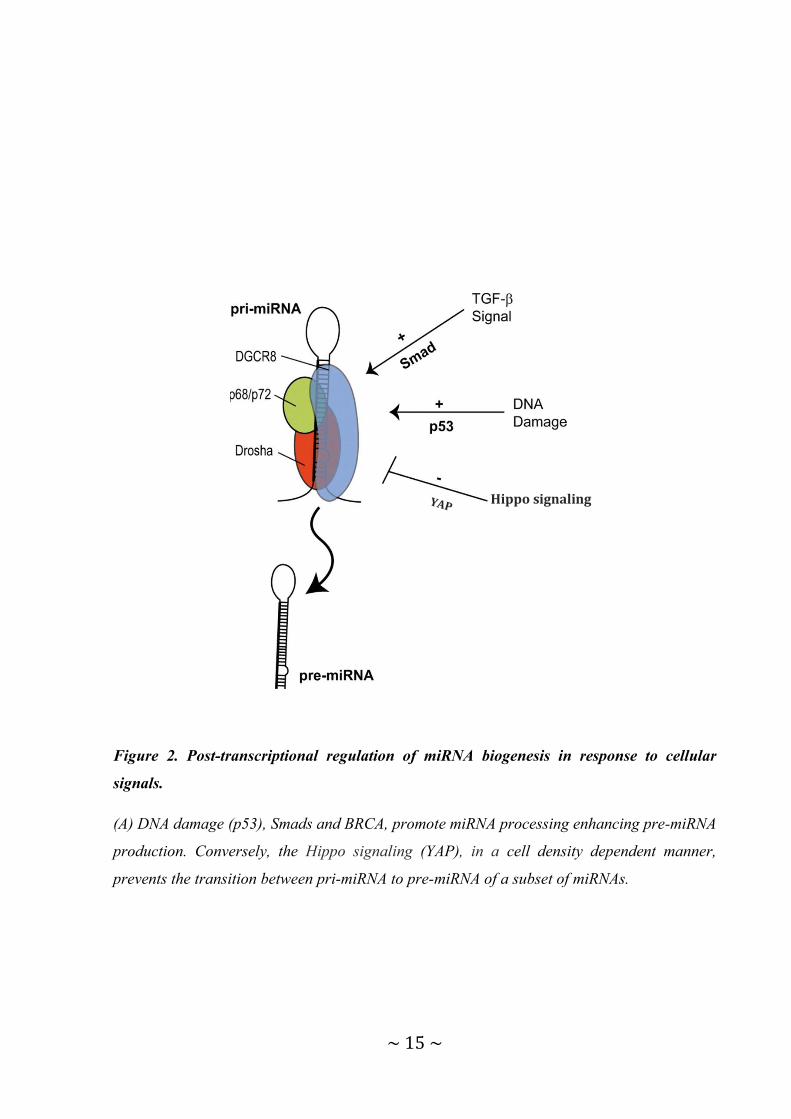
Figure 2. Post-transcriptional regulation of miRNA biogenesis in response to cellular
signals.
(A) DNA damage (p53), Smads and BRCA, promote miRNA processing enhancing pre-miRNA
production. Conversely, the Hippo signaling (YAP), in a cell density dependent manner,
prevents the transition between pri-miRNA to pre-miRNA of a subset of miRNAs.
Hippo signaling
Page 17
~ 16 ~
2.5 The tumor suppressor p53 is a master regulator of microRNAs.
The TP53 tumour suppressor is perhaps the most important and well-studied cancer gene, and
it is not surprising that several studies have suggested that miRNA biology can have a role in
its regulation and activity. The p53 protein acts as a sequence-specific DNA binding factor
that can activate and repress transcription. Although there is no doubt that most of the actions
of p53 can be explained by its ability to control canonical protein-coding targets such as
CDKN1A and PUMA, it can also transactivates several miRNAs. Indeed, in the p53 tumor
suppressor network, many of the functions normally associated with p53 may also be
executed by miRNAs. As a transcription factor, p53 directly regulates the transcription of a
growing number of miRNAs, acting both as a transactivator of tumor-suppressive miRNAs
and a repressor of some oncogenic miRNAs. MiRNAs up-regulated by p53 often target anti-
apoptotic and pro-proliferative genes, thus reinforcing the function of p53, or they may even
feedback to regulate p53 itself (Figure 3). One of the best studied classes is the miR-34
family, which represses genes that can promote proliferation and apoptosis, plausible targets
in a p53-mediated tumour-suppressor response (73). The discovery of additional p53-
regulated miRNAs, and the targeting of p53 or its pathway by other miRNAs, has provided
general insights into the miRNA-mediated control of gene expression and the potential
therapeutic opportunities for targeting the p53 network. Several p53-activated miRNAs, such
as miR-192, miR-194, miR-215 and miR-605, can target MDM2, which is a negative
regulator of p53 and a therapeutic target. These potentially relevant miRNAs can be
epigenetically silenced in some types of cancer; however, their reactivation or reintroduction
offers an intriguing therapeutic opportunity for inhibiting MDM2 in tumours that harbour
wild-type p53 (74, 75). Similarly, p53 can also activate miR-107, miR-200 or miR-192, which
are miRNAs that inhibit angiogenesis and epithelial-to-mesenchymal transition (76-78).
Conversely, p53 can be repressed by certain oncogenic miRNAs including miR-380-5p,
which is upregulated in neuroblastomas with MYCN amplification, or miR-504, which
decreases p53-mediated apoptosis and cell-cycle arrest and can promote tumorigenesis (79,
80).
Most research on p53 and miRNA focuses on the transcriptional effects of p53 on miRNA
expression. However, p53 also has transcription-independent functions (Figure 2 and 3).
Indeed, a recent study (68) suggests that p53’s influence on miRNA might extend beyond
transcriptional regulation. In HCT116 cells and human fibroblasts, p53 immunoprecipitated
with the miRNA-processing protein Drosha through the DEAD-box RNA helicase p68. The
Page 18
~ 17 ~
observed association of p53 with p68 correlated with an increase in the levels of several
different mature and precursor miRNAs after DNA damage, including miR-16–1, miR-143,
miR-145 and miR-206; primary transcript levels were unchanged. These miRNAs modulate
the expression of cell proliferation and stemness associated genes, and their regulation by p53
suggests a role for p53 controlling global gene expression and cell fate. A similar post-
transcriptional regulation of miRNA biogenesis involving p68/p72 has also been shown to be
mediated by other nuclear proteins such as SMAD, BRCA1, and YAP (as described in section
2.4.3). In sum, these findings suggest a novel function of p53 in miRNA maturation and
suggest that several transcription factors interact with the Drosha processing machinery to
regulate miRNA expression.
2.6 MicroRNAs and mutant p53: more questions than answers.
More than 50% of human cancers carry mutations within the p53 locus (81). Mutant p53
(mutp53) proteins can acquire novel oncogenic functions known as gain of function activities
(GOF) favouring in vivo tumor induction, maintenance and spreading in mouse models (82-
84). GOF mutp53 proteins can exert their activities through both transcriptional regulation of
target genes and by binding, sequestration and inactivation of tumor suppressor proteins (81,
85, 86). Numerous miRNAs are transcriptionally modulated by wtp53 (see section 2.6). In
addition, wtp53 is able to interact with the Microprocessor complex and facilitates the post-
transcriptional maturation of miRNAs with growth suppressive function (68). Recently, some
miRNAs were described as transcriptional targets of mutp53 (87) whereas it is not yet clear if
mutp53 plays a role in the regulation of miRNA processing.
Since tumors are characterized by downregulation of miRNA expressions and high
incidence of mutp53 proteins, we asked whether a new GOF of mutp53 resides in its
ability to inhibit expression of miRNAs at transcriptional and/or biogenesis level.
Page 19
~ 18 ~
Figure 3. Contribution of miRNAs to cancer pathways (ref. 5).
Tumour suppressor p53 can regulate several tumour suppressor miRNAs (blue), activating
different antitumoral pathways. The regulation of MDM2 by some of these miRNAs leads to
interesting feedforward loops. At the same time, p53 can be negatively regulated by oncogenic
miRNAs (in red). In addition, p53 is involved in the biogenesis of several tumour
suppressormi RNAs.
Page 20
~ 19 ~
3 RESULTS
3.1 Mutp53 inhibits mature miRNAs expression.
To identify miRNAs regulated by mutp53 we performed a genome wide expression analysis
of 376 mature miRNA in SW480 cells before and after constitutive depletion of the
endogenous mutp53 R273H. The cells were transduced with lentiviral vectors carrying either
shRNAs specific for p53 (sh-p53) or shRNA scrambled control (sh-scr), and the modulation
of mature miRNAs expression was investigated. The viral infection efficiently depleted the
expression of mutp53 protein as measured by western blot (Figure 4A). The results revealed
that 33 out of 376 miRNAs were upregulated (≥ 2 fold) after mutp53 depletion and only 4
downregulated (≥ 1,5 fold) (Figure 4B, 4C, 4D), strongly indicating, for the first time, that
mutp53 may be responsible at least in part for the miRNAs downregulation observed in
cancer. By qRT-PCR we validated the downregulation of 16 of these miRNAs (Figure 4E) in
SW480 cells (miR-648 was non responsive). Some of the most strongly downregulated
miRNAs in SW480 cells were also downregulated in another colon cancer cell line, HT29,
harboring the same mutp53-R273H protein (Figure 5A, 5B). To investigate the role of
different mutp53 proteins on miRNA expression, we also examined the effects of endogenous
mutp53-R175H through its depletion on breast cancer cells SKBR3 (Figure 5A). Among the
16 miRNAs downregulated by mutp53-R273H in colon cancer cells, 9 were also
downregulated in breast cancer cells in a mutp53-R175H dependent manner (Figure 5C).
Interestingly, our analysis of miRNA expression (next-generation sequencing data from The
Cancer Genome Atlas (TCGA))(88), in a large dataset of breast cancer samples (BRCA)
expressing mutp53 with missense mutation, revealed that several miRNAs are downregulated
in human breast cancer (Figure 5D), including 4 mutp53-dependent miRNA found on SKBR3
(miR-517a, -1, -143, -133b). To test the specificity of the observed effects, we restored
mutp53 (R273H) expression on SW480-sh-p53 cells (Figure 5E) and observed a partial rescue
of the downregulation of 10 miRNAs (Figure 5F). Consistent with the oncogenic role of
mutp53, it has been demonstrated that several of the 33 miRNAs are downregulated in
different types of human solid cancer and have tumor suppressor activity (miR-143, -218, -1, -
517a, -519c, -515, 518b, 142-3p) (89-103). Of note few data are available on their role in
colon cancer and their expression has not yet been associated with mutp53.
Taken together, our data demonstrate that different mutp53 proteins inhibit expression of a
subset of miRNAs in several cancer cell lines. Since some of these miRNAs are already
Page 21
~ 20 ~
described as oncosuppressors, these data also indicate that mutp53 GOF activity impacts on
downregulation of their oncosuppressive function.
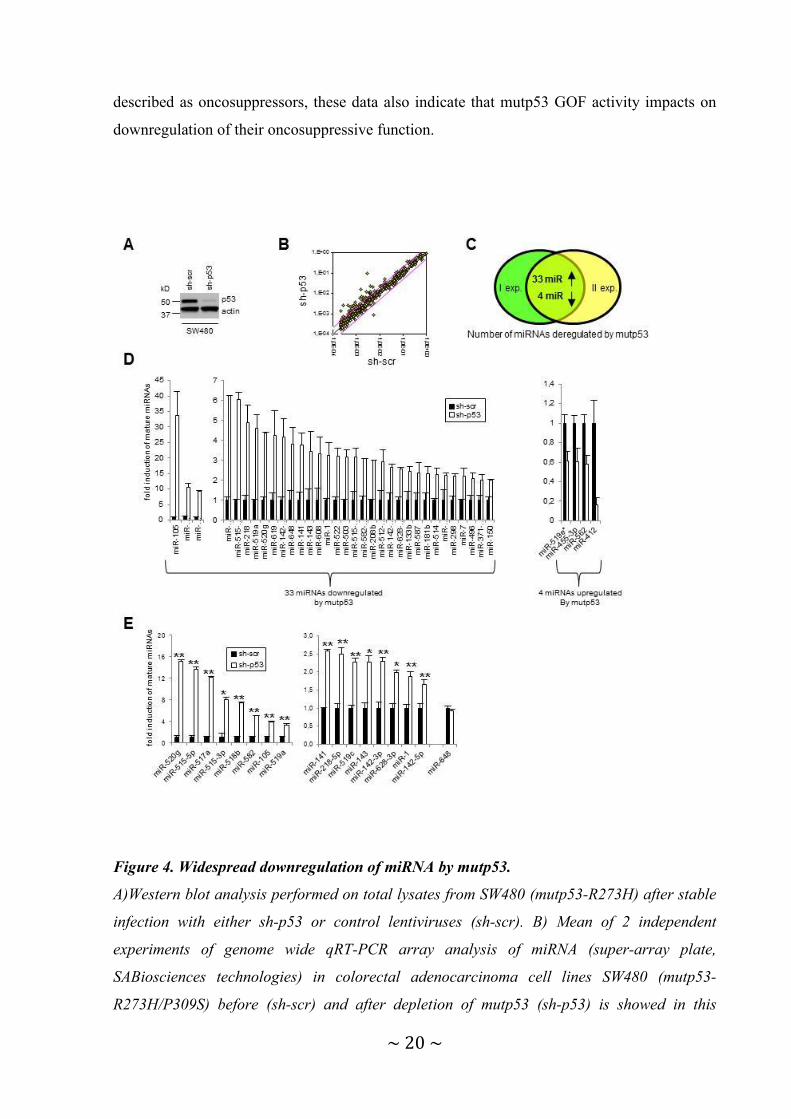
Figure 4. Widespread downregulation of miRNA by mutp53.
A)Western blot analysis performed on total lysates from SW480 (mutp53-R273H) after stable
infection with either sh-p53 or control lentiviruses (sh-scr). B) Mean of 2 independent
experiments of genome wide qRT-PCR array analysis of miRNA (super-array plate,
SABiosciences technologies) in colorectal adenocarcinoma cell lines SW480 (mutp53-
R273H/P309S) before (sh-scr) and after depletion of mutp53 (sh-p53) is showed in this
Page 22
~ 21 ~
scatter plot. The endogenous mutp53 expression was silenced through constitutive RNA
interference (lentiviral infections). The results of 2 independent experiments are represented.
Pink lines indicate threshold of 2. C) Number of miRNAs upregulated ( ≥ 2 fold) and
downregulated (≥ 1,5 fold) by mutp53 in both array analysis are depicted in Venn diagram. I
exp. = first experiment, II exp. = second experiment. D) qRT-PCR analysis of 33 miRNAs
downregulated and 4 miRNAs upregulated by mutp53 on SW480 cells. Mean of 2 independent
experiments of genome wide analysis of miRNA expression (super-array plate, SABiosciences
technologies) is shown. The 37 miRNAs were divided into three graphs based on the levels of
expression. E) Validation by qRT-PCR analysis of 17 mature miRNAs expression in SW480.
Means of 6 independent experiments (infections) performed in triplicate are represented as
fold induction where mature-miRNAs in sh-scr cells are = 1. miR-648 was non responsive.
The 17 miRNAs were divided into two graphs based on the levels of expression. On figure
4D, E data were normalized to U6. *p≤0.05, **p≤0.005 student’s t test.
Page 23
~ 22 ~
Figure 5. Widespread downregulation of miRNA by mutp53.
A)Western blot analysis performed on total lysates from HT29 (mutp53-R273H) and SKBR3
cells (mutp53-R175H) before (sh-scr) and after depletion of mutp53 (sh-p53). qRT-PCR
analysis of 5 mature miRNAs expression in HT29 (B) and 8 mature miRNAs expression in
SKBR3(C) cells before (sh-scr) and after depletion of mutp53 (sh-p53). n=2. qRT-PCR
performed in triplicate. D) Hierarchical clustering of miRNA differentially expressed in
breast carcinoma samples with missense mutation in the p53 gene (N=91) versus normal
breast samples (N=80) obtained from TCGA. Relative miRNA expression values across
samples are graphically rendered using a green-to-red scale for lowest-to-highest. E)
Western blot analysis performed on total lysates from control cells (sh-scr+ctrl), cells stably
depleted of mutp53 and transfected with control (sh-p53+ctrl) or mutp53-R273H (sh-
p53+R273H) vectors. F) qRT-PCR analysis of 10 mature miRNAs in SW480 cells described
on figure 5E. Means of 2 experiments performed in triplicates are presented as fold induction
where mature miRNAs in SW480 cells transfected with control vector (sh-scr+ctrl) are = 1.
On figure 5B, C, F data were normalized to U6.
Page 24
~ 23 ~
3.2 Mutp53 negatively regulates miRNA biogenesis at transcriptional and post-
transcriptional level.
To investigate the molecular mechanism by which mutp53 orchestrates miRNA expression,
we measured the expression levels of pri-miRNAs and pre-miRNAs of the 16 most
downregulated mutp53-dependent miRNAs identified above.
As shown in figure 6A and 6B some miRNAs were upregulated both at pri- and pre-miRNA
levels after mutp53 depletion (left panels)(corresponding to mature miR-520g, -518b, -582, -
141, -519c, -143, -142-5p, -142-3p) demonstrating a transcriptional level of regulation.
However, several miRNAs showed no significant change in primary transcripts (Figure 6A,
right panel)(corresponding to mature miR-517a, -519a, -105, -628, -1, -218, -515-5p, -515-
3p), thus demonstrating that mutp53 regulates miRNA expression not only at transcriptional
but also at post-transcriptional level. Moreover, the increase of pre-miR-517a, -519a-1, -105-
1/2, -628, -1-2, -218-1 expression suggest that the mutp53 impacts on miRNA biogenesis at
Drosha level (Figure 6B, righ panel). Interestingly the two pre-miR-218-2 and pre-miR-515-
1/2 were not upregulated after mutp53 knockdown. Since their mature forms increase after
mutp53 depletion this result suggests that these 2 miRNAs are mainly regulated at the level of
Dicer processing. The analysis of pri- and pre-miRNA levels of miRNAs differentially
expressed on SKBR3 and HT29 after mutp53 depletion identify, also in these systems, a post-
transcriptional mechanism of regulation (Figure 6C, 6D).
Taken together, our results support a new key role of mutp53 in post-transcriptional
regulation of diverse miRNAs.
Page 25
~ 24 ~
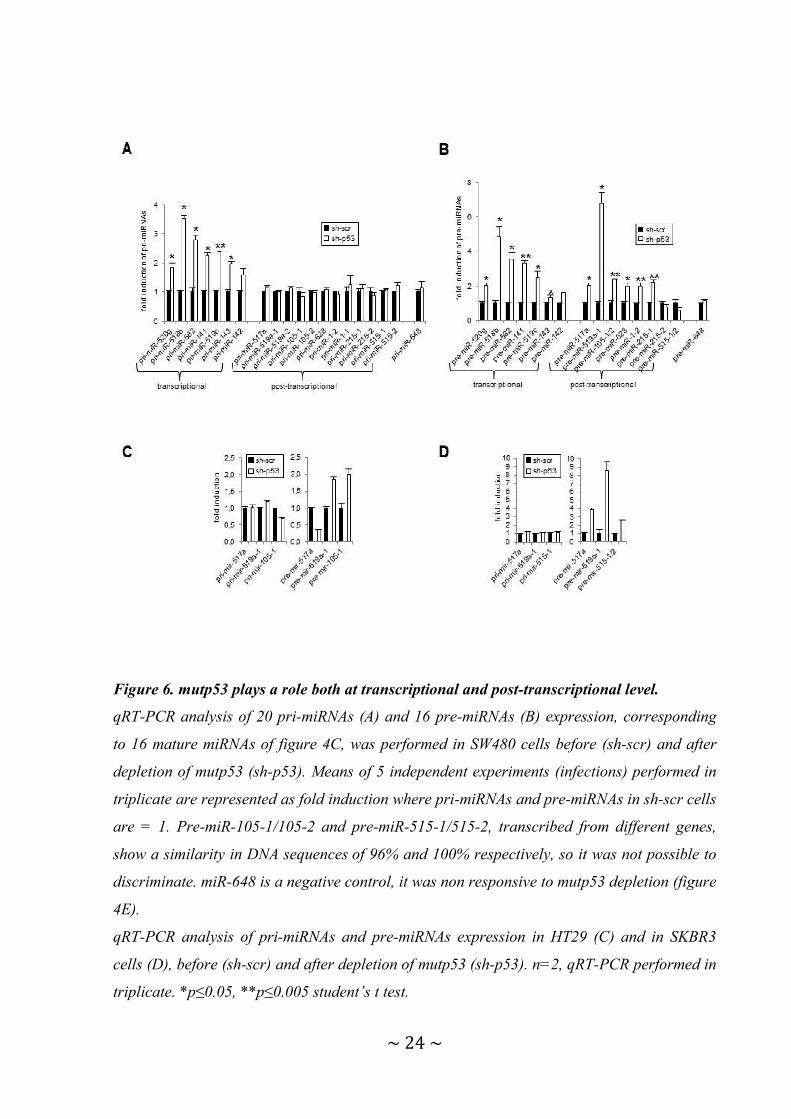
Figure 6. mutp53 plays a role both at transcriptional and post-transcriptional level.
qRT-PCR analysis of 20 pri-miRNAs (A) and 16 pre-miRNAs (B) expression, corresponding
to 16 mature miRNAs of figure 4C, was performed in SW480 cells before (sh-scr) and after
depletion of mutp53 (sh-p53). Means of 5 independent experiments (infections) performed in
triplicate are represented as fold induction where pri-miRNAs and pre-miRNAs in sh-scr cells
are = 1. Pre-miR-105-1/105-2 and pre-miR-515-1/515-2, transcribed from different genes,
show a similarity in DNA sequences of 96% and 100% respectively, so it was not possible to
discriminate. miR-648 is a negative control, it was non responsive to mutp53 depletion (figure
4E).
qRT-PCR analysis of pri-miRNAs and pre-miRNAs expression in HT29 (C) and in SKBR3
cells (D), before (sh-scr) and after depletion of mutp53 (sh-p53). n=2, qRT-PCR performed in
triplicate. *p≤0.05, **p≤0.005 student’s t test.
Page 26
~ 25 ~
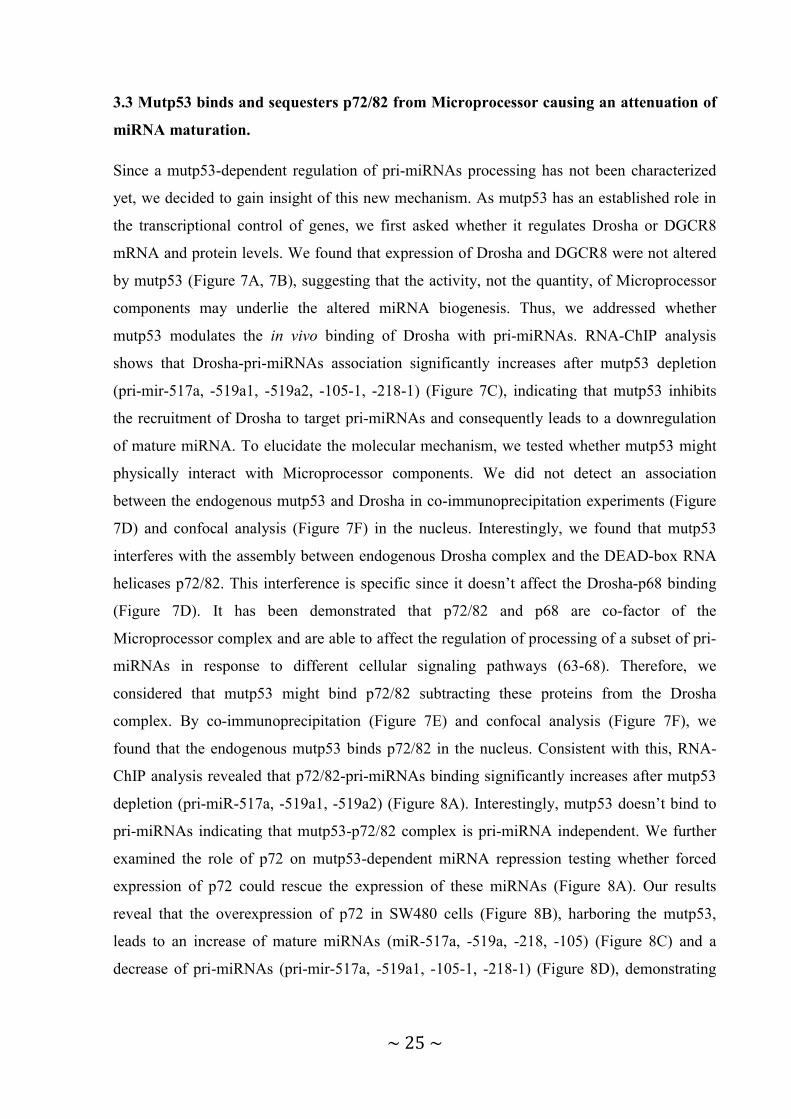
3.3 Mutp53 binds and sequesters p72/82 from Microprocessor causing an attenuation of
miRNA maturation.
Since a mutp53-dependent regulation of pri-miRNAs processing has not been characterized
yet, we decided to gain insight of this new mechanism. As mutp53 has an established role in
the transcriptional control of genes, we first asked whether it regulates Drosha or DGCR8
mRNA and protein levels. We found that expression of Drosha and DGCR8 were not altered
by mutp53 (Figure 7A, 7B), suggesting that the activity, not the quantity, of Microprocessor
components may underlie the altered miRNA biogenesis. Thus, we addressed whether
mutp53 modulates the in vivo binding of Drosha with pri-miRNAs. RNA-ChIP analysis
shows that Drosha-pri-miRNAs association significantly increases after mutp53 depletion
(pri-mir-517a, -519a1, -519a2, -105-1, -218-1) (Figure 7C), indicating that mutp53 inhibits
the recruitment of Drosha to target pri-miRNAs and consequently leads to a downregulation
of mature miRNA. To elucidate the molecular mechanism, we tested whether mutp53 might
physically interact with Microprocessor components. We did not detect an association
between the endogenous mutp53 and Drosha in co-immunoprecipitation experiments (Figure
7D) and confocal analysis (Figure 7F) in the nucleus. Interestingly, we found that mutp53
interferes with the assembly between endogenous Drosha complex and the DEAD-box RNA
helicases p72/82. This interference is specific since it doesn’t affect the Drosha-p68 binding
(Figure 7D). It has been demonstrated that p72/82 and p68 are co-factor of the
Microprocessor complex and are able to affect the regulation of processing of a subset of pri-
miRNAs in response to different cellular signaling pathways (63-68). Therefore, we
considered that mutp53 might bind p72/82 subtracting these proteins from the Drosha
complex. By co-immunoprecipitation (Figure 7E) and confocal analysis (Figure 7F), we
found that the endogenous mutp53 binds p72/82 in the nucleus. Consistent with this, RNA-
ChIP analysis revealed that p72/82-pri-miRNAs binding significantly increases after mutp53
depletion (pri-miR-517a, -519a1, -519a2) (Figure 8A). Interestingly, mutp53 doesn’t bind to
pri-miRNAs indicating that mutp53-p72/82 complex is pri-miRNA independent. We further
examined the role of p72 on mutp53-dependent miRNA repression testing whether forced
expression of p72 could rescue the expression of these miRNAs (Figure 8A). Our results
reveal that the overexpression of p72 in SW480 cells (Figure 8B), harboring the mutp53,
leads to an increase of mature miRNAs (miR-517a, -519a, -218, -105) (Figure 8C) and a
decrease of pri-miRNAs (pri-mir-517a, -519a1, -105-1, -218-1) (Figure 8D), demonstrating
Page 27
~ 26 ~
that p72/82 positively regulates the processing of miRNAs downregulated at post-
transcriptional level by mutp53.
Altogether, these results reveal a previously unrecognized function of mutp53 in miRNA
processing in which mutp53, sequestering p72/82, interferes with a functional assembly
between Drosha complex and these RNA helicases, causing a widespread downregulation of
miRNAs.
Figure 7. Drosha-pri-miRNAs association increases after mutp53 depletion.
Relative expression of Drosha and DGCR8 mRNAs (A) and protein levels (B) in SW480 cells
(sh-scr) and (sh-mutp53). qRT-PCR and WB data were normalized to actin; C) RNA-ChIP
analysis for the association between pri-miRNAs and Drosha in SW480 cells (sh-scr) and (sh-
mutp53). Endogenous Drosha was immunoprecipitated followed by qPCR amplification with
pri-miRNAs primers. One of 3 independent experiments performed in triplicate is represented
as fold induction to control IgG. Mutp53 binds and sequesters p72 from Microprocessor
complex. Immunoprecipitation (IP) assays were performed with nuclear extracts of SW480
cells before (sh-scr) and after depletion of mutp53 (sh-p53) using an antibody against
Page 28
~ 27 ~
endogenous Drosha (D) and p72/p82 (E) proteins. IB, immunoblot. F) Colocalization
(yellow) of endogenous mutp53 (red) with p72/p82 (green) and with Drosha (green) was
analyzed by indirect immunofluorescence combined with Confocal Scanning Laser
Microscopy. Confocal analysis of single optical section is shown. Bars 5 µm. The images
have been collected with a 60x oil objective. One experiment of several is represented.
Figure 8. Overexpression of p72 induces mutp53-dependent miRNAs levels.
A) RNA-ChIP analysis for the association between pri-miRNAs, p72/p82 and mutp53 in
SW480 cells before (sh-scr) and after depletion of mutp53 (sh-p53). Endogenous p72/p82 and
mutp53 were immunoprecipitated followed by qPCR amplification with pri-miRNAs primers.
One of 3 independent experiments performed in triplicate is represented as fold induction to
control IgG. B) Western blot analysis performed on total lysates from SW480 cells after
overexpression with either p72 expression vector (+p72) or control vector (ctrl). qRT-PCR
analysis of mature miRNAs (C) and pri-miRNAs (D) expression in SW480 cells after
transfection with control or p72 vectors. Means of 3 experiments performed in triplicates are
presented as fold induction where mature miRNAs and pri-miRNAs in SW480 cells
transfected with control vector are = 1. Data were normalized to U6.
Page 29
~ 28 ~
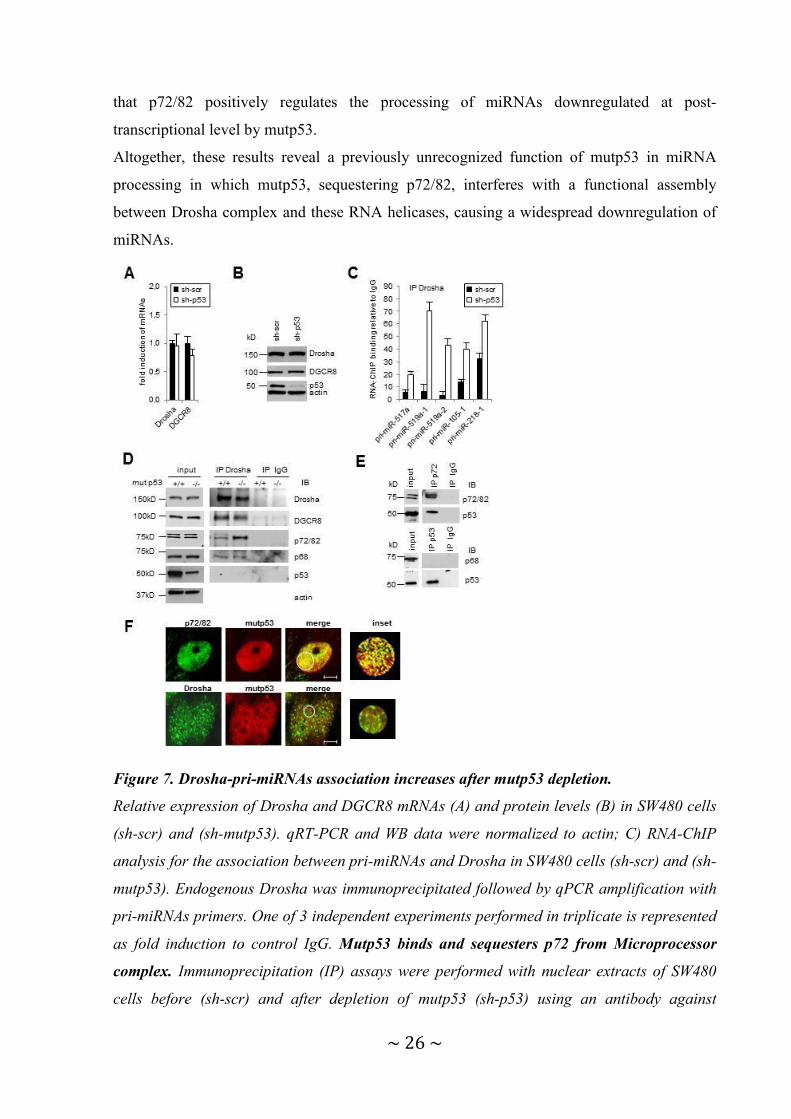
3.4 Mutp53-regulated miRNAs inhibit cell growth and migration.
Our results show that, in mutp53-expressing cells a subset of miRNAs is downregulated,
suggesting their tumor suppressor activity/ies. To investigate whether the above identified
miRNAs have a negative effect on typical tumorigenic features such as cell cycle progression
and migration, we transiently transfected SW480 cells with synthetic miRNAs (miRNA-
517a,-519a, -218, -105) and with a negative control miRNA (miR-NC). Subsequently, we
analyzed samples daily for cell number, cell viability and cell cycle profiles. Expression of
miR-517a, -519a, -105, but not of miR-218 (data not shown), impaired, although to different
extents, SW480 cell survival as indicated by the reduction of viable cell number and by the
increase of trypan blue positive cells (Figure 9A, 9B, 9C). Moreover, the consistent reduction
of the total cell number induced by the overexpression of miR-517a (Figure 9A, 9B) suggests
that this miRNA impairs also the cell cycle progression. Cytoflurimetric analysis of cell cycle
profiles (Facs) reveals a significant cell accumulation in S and G2/M phases induced by miR-
517a (Figure 9D). In particular we observed a 3 fold-increase of cells in G2/M phase at 48
hours, and an accumulation of cells in S phase of 1,46 fold at 72 hours and 1,9 fold at 96h
respect to control samples (Figure 9D, Figure 10A). On the contrary miR-519a and miR-105
had no appreciable effect on cell cycle (Figure 10B). Of note, the reduction of cell viability
and cell cycle perturbation upon miR-517a overexpression is accompanied by a time
dependent increase of cells in SubG1 peak, indicative of apoptosis (Figure 10A). We
identified as an apoptotic event the cell death induced by miR-517a and miR-519a, as
demonstrated by the induction of cleaved PARP, an hallmark of apoptosis and caspase
activation (Figure 9E). These results are particularly significant for miR-517a, since they
confer to this miRNA important potential tumor suppressive properties in terms of induction
of apoptosis, yet unknown in colon cancer cells.
We also investigated the effect of these miRNAs on the migratory capability of SW480 cells,
that are characterized by a marked mesenchymal phenotype important for tumor progression
and metastasis. Interestingly, the transient overexpression of miR-519a and miR-218,
individually, resulted in a decreased cell migration in a wound-healing assay (Figure 11A).
Consistent with this, miR-519a and, to a lesser extent, miR-218 caused a reduction of Zeb1
and a concomitant induction of E-cadherin protein level (Figure 11B), thus suggesting a
critical role of both miRNAs in colon cancer mesenchymal-epithelial transition (MET). miR-
218 is a well known inhibitor of migration and invasion of metastatic cells in diverse kinds of
solid tumors (101), though no evidence has emerged until now regarding colon cancer. Still,
Page 30
~ 29 ~
any kind of oncosuppressor activity has been described for miR-519a until now. In our
experimental condition transient overexpression of miR-517a and miR-105 doesn’t affect cell
migration (data not shown). Taken together, our data strongly indicate that these miRNAs are
downregulated by mutp53 in order to de-activate tumor suppressive pathways.
Figure 9. miR-517a impairs cell proliferation and survival.
SW480 cells transfected with the indicated synthetic miRNAs or a negative control miRNA
(miR-NC) were plated in triplicate; viable cell number (A), total cell number (B) and % of
trypan blue positive cells (C) were counted daily. Mean of 2 independent experiments are
reported. D) FACS analysis of miR-517a or negative control miRNA (miR-NC) transfected
SW480 cells. Mean of 3 independent experiments are reported. E) Protein extracts derived
from SW480 cells at 96h after transfection with the indicated syntethic miRNA, were
subjected to western blot analysis with the indicated antibodies. Two different exposure times
are represented.
Page 31
~ 30 ~
Figure 10. miR-517a impairs cell proliferation and survival.
A) FACS analysis of SW480 cells transfected with of miR-517a or negative control miRNA
(miR-NC) in 3 indipendent experiments. B) FACS analysis of SW480 cells transfected with
miR-519a, miR-105 or negative control miRNA (miR-NC). Mean of 3 independent
experiments are reported.
Page 32
~ 31 ~
Figure 11. miR-519a and miR-218 inhibit cell migration.
A) Wound healing assay showing the reduced migratory capability of SW480 cells transfected
with synthetic miR-519a and miR-218. 1 of 3 independent experiments is shown. B) Protein
extracts derived from SW480 cells at 96h after transfection with the indicated syntethic
miRNAs, were subjected to western blot analysis with the indicated antibodies.
Page 33
~ 32 ~
4 CONCLUSIONS AND DISCUSSION
Here we reveal a previously unrecognized function of mutp53 in the regulation of miRNA
processing, and provide, in part, a mechanistic explanation of the widespread downregulation
of miRNAs observed in cancers. Our data of a genome wide analysis of miRNA expression
revealed that mutp53 isoform R273H, which is frequently present in human tumors,
downregulates 33 of 376 miRNAs analyzed in colon cancer cells. Moreover, we found that
another missense mutp53, R175H, inhibits the expression of several of these miRNAs in
breast cancer. These observations strongly point to a general mechanism that involves
different p53 proteins with missense mutations and also indicate that the signature of miRNAs
downregulated by mutp53 proteins in different solid tumors has, at least in part, common
members. Further studies on a larger scale are required to identify miRNAs negatively
downregulated by different mutp53 proteins in different tumor models. Interestingly, 4 of the
miRNAs identified by us on SKBR3 cells are among those downregulated in the TCGA
dataset of human breast cancers carrying missense mutations of p53, as compared to the
normal samples. This last result strongly highlights the clinical relevance of our studies.
Unfortunately, it was not possible to perform a statistically significant analysis with TCGA
miRNA dataset of human colon cancers because only 8 normal tissues are profiled for
miRNA and none of them is matched with the 107 tumor samples expressing p53 protein with
missense mutations.
From a mechanistic point of view, we found that mutp53 downregulates miRNAs not only at
transcriptional but also at post-transcriptional level. Indeed, endogenous mutp53 directly
binds p72/82 hindering the association of this DEAD-box with the Microprocessor complex
and pri-miRNAs, resulting in an inhibition of miRNA biogenesis (Figure 12). Moreover our
analysis of pre-miRNA levels strongly suggests that mutp53 regulates miRNA biogenesis also
downstream of the pri-miRNA maturation step, at least for pre-miR-515 and pre-miR-218-2.
In this regard, it has been shown that mutp53 R273H can downregulate Dicer expression at
protein level (102). Finally, we found that 4 mutp53-dependent miRNAs exhibit tumor
suppressor functions such as cell death, cell cycle arrest and inhibition of cell migration,
suggesting that mutp53 regulates proliferation and migration also through miRNAs inhibition.
These data are in agreement with the literature and our previous results demonstrating that
depletion of mutp53 reduces cell proliferation and in vivo tumorigenicity (103, 104). A miR-
517a-dependent induction of apoptosis has been identified in bladder cancer cell line (105),
whereas Rui-Fang Liu and colleagues described a G2/M cell cycle arrest induced by miR-
Page 34
~ 33 ~
Figure 12. Proposed model.
Mutp53 binds and sequesters p72/82 from the Microprocessor complex, and inhibits the
processing of tumor suppressor miRNAs.
Page 35
~ 34 ~
517a in several hepatocellular carcinoma cell lines (94). Here we provide strong evidence that
miR-517a suppresses cell growth, promotes apoptosis and induces a significant cell
accumulation in S and G2/M phase in colon cancer cell line. Moreover we found important
potential tumor suppressive properties of miR-519a yet unknown. Lastly, we found that both
miR-519a and miR-218 inhibit EMT downregulating Zeb1 and subsequently upregulating E-
cadherin protein levels. Interestingly, we identified 2 putative binding sites for mir-519a and 1
for miR-218 on the 3’UTR of Zeb1 gene, suggesting that this mutp53-dependent miRNA
could regulate directly Zeb protein level. Our data strongly suggests that mutation of p53 can
promote EMT and aggressive potential of tumor cells by inhibiting miR-519a and miR-218.
Mutp53 promotes various processes such as cell proliferation, chemoresistance, cholesterol
metabolism, invasion, metastasis and various other tumour promoting events (81-83). Several
effects of mutp53 proteins are mediated through their interaction and subsequent regulation of
other factors such as TAp63, NF-Y, SP1 (18-25). Here we have found a new interaction
between mutp53 and p72 that leads to an inhibition of miRNAs biogenesis and in turn the
deregulation of gene expression. Interestingly, Mori and colleagues have recently
demonstrated in an elegant paper, that the protein YAP, with oncogenic potential, regulates
miRNAs biogenesis through sequestering p72 in a cell-density-dependent manner in cancer
cells (67).
In conclusion, collectively our data demonstrate a global impact of mutp53 on miRNA
biogenesis and suggest that miRNAs are downregulated by mutp53 in order to inactivate
tumor suppressive pathways. Since mutations in TP53 occur at high frequency in human
cancers, developing strategies to block the oncogenic effects of mutp53 will be an important
step for their treatment. Moreover, miRNAs are powerful regulators of gene expression, thus
the effects of miRNA downregulation by mutp53 are profound. A deeper understanding of the
complex effects of mutp53-regulated miRNA overexpression in mouse models of cancers will
be essential for deciphering the physiological function of miRNAs in mutp53 signaling and to
allow new advances for therapeutic manipulation of miRNA regulated by mutp53.
Page 36
~ 35 ~
5 MATERIALS AND METHODS
5.1 Cell culture and transfection.
Colon adenocarcinoma SW480 (mutp53R273H), colon adenocarcinoma HT29
(mutp53R273H) and breast carcinoma SKBR3 (mutp53R175H) human cell lines were grown
in Dulbecco’s modified Eagle’s medium (GIBCO-BRL), supplemented with 10% FBS
(GIBCO-BRL), L-glutamine (2mM), Penicillin (100 U/ml)/Streptomycin (100 ug/ml) (Life
Technologies Inc.). PGS5-DDX17 vector, expressing p72 protein, was kindly provided by V.
Sartorelli. SW480 were transiently transfected with Lipofectamine LTX following the
manufacturer’s instructions (Invitrogen).
5.2 Lentiviral vectors.
pLV-THM (sh-scr), pLV-THsi/p53 (sh-p53), were produced by transient trasfection in 293T
cells according to standard protocols. Briefly, subconfluent 293T cells were cotransfected
with 20 μg of a plasmid vector, 15 μg of pAX2 and 6 μg of pMD2G-VSVG by calcium
phosphate precipitation (GIBCO-BRL). After 6–8 hours medium was replaced with fresh
medium (6.0 ml/plate) supplemented with 1.0 mM Sodium Pyruvate (GIBCO-BRL).
Lentiviruses were harvested 48 h later, centrifuged 5 min at 3,000 RPM, aliquoted and stored
at -80°C. Lentiviral stocks were titered following standard protocols and routinely a viral titer
of 100 transducing units per ml (TU/ml) was achieved.
5.3 RNA extraction, cDNA synthesis and RT-qPCR.
qRT-PCR assays were performed to measure the expression levels of pri-miRNAs, pre-
miRNAs, mature miRNAs and mRNAs. Total RNA was extracted using TRIzol Reagent
(Invitrogen) following the manufacturer’s instructions. Reverse Transcription of mature
miRNAs expression was performed by TaqMan MicroRNA RT assay. For pri-miRNAs, pre-
miRNAs, and mRNA expression, RNA was retro-transcribed with Moloney-Murine-
Leukemia virus reverse-transcriptase (M-MLV-RT, Invitrogen) following the manufacturer’s
instruction. Quantitative PCR, determined on an ABI Prism 7900 apparatus (Applied
Biosystems), was performed using SYBR FAST UNIVERSAL READYMIX (Kapa) for pri-
miRNAs, pre-miRNAs, and mRNA; KAPA PROBE FAST QPCR UNIVERSAL MASTER
Page 37
~ 36 ~
MIX (Kapa) was used for mature miRNAs reactions. Experiments were done on triplicate and
the results were estimated based on the comparative threshold (2-ΔCt). RNU6 was used as
endogenous control to standardize mature miRNA, pri-miRNAs and pre-miRNAs expression,
beta-actin was used for mRNA normalization.
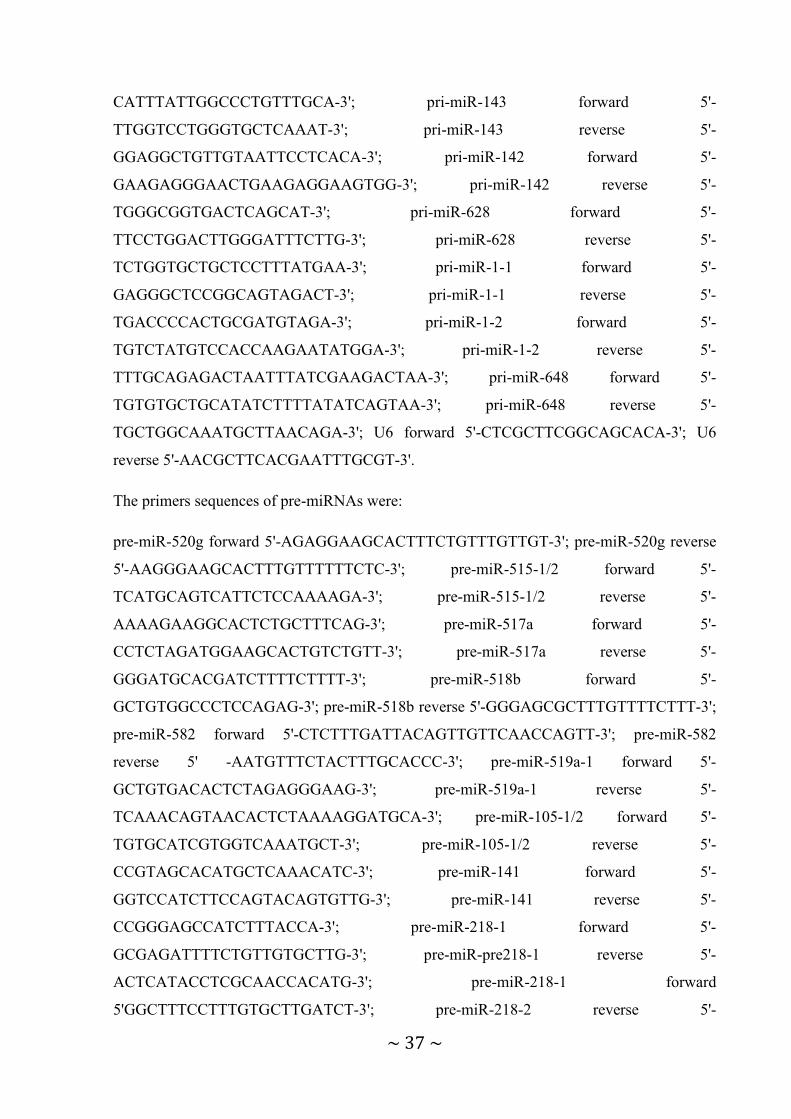
The primers sequences of pri-miRNAs, designed within 200bp upstream the pre-miRNA
sequence, were:
pri-miR-520g forward 5'-CCCTTGATGAACAAGGCTAACC-3'; pri-miR-520g reverse 5'-
CCCTGAAAGGACCATCTCCAATT-3'; pri-miR-515-1 forward 5'-
AGGATGGTCGTGGTCTCTTGAC-3'; pri-miR-515-1 reverse 5'-
TGGCTCACGCCTGGAATC-3'; pri-miR-515-2 forward 5'-
GTCTCTTGATGAACAAGGCTAACCT-3'; pri-miR-515-2 reverse 5'-
CCCTAAAAGGACCATCTCCAGTT-3'; pri-miR-517a forward 5'-
TGGTGGTGGGTGCCTCTAAT-3'; pri-miR-517a reverse 5'-
TGGGTTCAAGCGATTCTTCTG-3'; pri-miR-518b forward 5'-
GCCTTGATGAACAAGGCTAACC-3'; pri-miR-518b reverse 5'-
CCCTAAAAGGACCATCTCCAGTT-3'; pri-miR-582 forward 5'-
GTCATTCATGCACACATTGAAGAG-3'; pri-miR-582 reverse 5'-
TCTACTAGAGAGAGATTTGCTAGTGGTGTT-3'; pri-miR-519a-1 forward 5'-
ACAGTCATGGTTTCACCATGTTG-3'; pri-miR-519a-1 reverse 5'-
GGCGGGAGGATCACTTGAG-3'; pri-miR-519a-2 forward 5'-
TGGAAATGGTCCTTTTAGGGATT-3'; pri-miR-519a-2 reverse 5'-
GGCCCTGTTTGCGTGTTT-3'; pri-miR-105-1 forward 5'-CATGATTTTTTGTCATA
CAGTGTGTTTG-3'; pri-miR-105-1 reverse
GAAGCTGACATCCAATATATAGGAGTAGATA-3'; pri-miR-105-2 forward 5'-
TTTCTACACCATGTCTTTCACTATTGTG-3'; pri-miR-105-2 reverse 5'-
GATACCAGGTTATAGGGAGTAGACAGATG-3'; pri-miR-141 forward 5'-
CCACCCAGTGCGATTTGT-3'; pri-miR-141 reverse 5'- CCAACCCCAAGCTCAAGGT-3';
pri-miR-218-1 forward 5'-CGGGAAGAATGCATGTCATG -3'; pri-miR-218-1 reverse 5'-
GGAGGGAAGGAGGAGAAAAGC-3'; pri-miR-218-2 forward 5'-
GCAATCTTCGGAAGTGTTCCA-3'; pri-miR-218-2 reverse 5'-
CCCCCACTGAGCGTGATTAG-3'; pri-miR-519c forward 5'-
CTGGAGATGGCCCTGATAGG-3'; pri-miR-519c reverse 5'-
Page 38
~ 37 ~
CATTTATTGGCCCTGTTTGCA-3'; pri-miR-143 forward 5'-
TTGGTCCTGGGTGCTCAAAT-3'; pri-miR-143 reverse 5'-
GGAGGCTGTTGTAATTCCTCACA-3'; pri-miR-142 forward 5'-
GAAGAGGGAACTGAAGAGGAAGTGG-3'; pri-miR-142 reverse 5'-
TGGGCGGTGACTCAGCAT-3'; pri-miR-628 forward 5'-
TTCCTGGACTTGGGATTTCTTG-3'; pri-miR-628 reverse 5'-
TCTGGTGCTGCTCCTTTATGAA-3'; pri-miR-1-1 forward 5'-
GAGGGCTCCGGCAGTAGACT-3'; pri-miR-1-1 reverse 5'-
TGACCCCACTGCGATGTAGA-3'; pri-miR-1-2 forward 5'-
TGTCTATGTCCACCAAGAATATGGA-3'; pri-miR-1-2 reverse 5'-
TTTGCAGAGACTAATTTATCGAAGACTAA-3'; pri-miR-648 forward 5'-
TGTGTGCTGCATATCTTTTATATCAGTAA-3'; pri-miR-648 reverse 5'-
TGCTGGCAAATGCTTAACAGA-3'; U6 forward 5'-CTCGCTTCGGCAGCACA-3'; U6
reverse 5'-AACGCTTCACGAATTTGCGT-3'.
The primers sequences of pre-miRNAs were:
pre-miR-520g forward 5'-AGAGGAAGCACTTTCTGTTTGTTGT-3'; pre-miR-520g reverse
5'-AAGGGAAGCACTTTGTTTTTTCTC-3'; pre-miR-515-1/2 forward 5'-
TCATGCAGTCATTCTCCAAAAGA-3'; pre-miR-515-1/2 reverse 5'-
AAAAGAAGGCACTCTGCTTTCAG-3'; pre-miR-517a forward 5'-
CCTCTAGATGGAAGCACTGTCTGTT-3'; pre-miR-517a reverse 5'-
GGGATGCACGATCTTTTCTTTT-3'; pre-miR-518b forward 5'-
GCTGTGGCCCTCCAGAG-3'; pre-miR-518b reverse 5'-GGGAGCGCTTTGTTTTCTTT-3';
pre-miR-582 forward 5'-CTCTTTGATTACAGTTGTTCAACCAGTT-3'; pre-miR-582
reverse 5' -AATGTTTCTACTTTGCACCC-3'; pre-miR-519a-1 forward 5'-
GCTGTGACACTCTAGAGGGAAG-3'; pre-miR-519a-1 reverse 5'-
TCAAACAGTAACACTCTAAAAGGATGCA-3'; pre-miR-105-1/2 forward 5'-
TGTGCATCGTGGTCAAATGCT-3'; pre-miR-105-1/2 reverse 5'-
CCGTAGCACATGCTCAAACATC-3'; pre-miR-141 forward 5'-
GGTCCATCTTCCAGTACAGTGTTG-3'; pre-miR-141 reverse 5'-
CCGGGAGCCATCTTTACCA-3'; pre-miR-218-1 forward 5'-
GCGAGATTTTCTGTTGTGCTTG-3'; pre-miR-pre218-1 reverse 5'-
ACTCATACCTCGCAACCACATG-3'; pre-miR-218-1 forward
5'GGCTTTCCTTTGTGCTTGATCT-3'; pre-miR-218-2 reverse 5'-
Page 39
~ 38 ~
TTCCGTTTCCATCGTTCCAC-3'; pre-miR-519c forward 5'-
TCTCAGCCTGTGACCCTCTA-3'; pre-miR-519c reverse 5'-
TTCAGACAACAGAAAGCGCT-3'; pre-miR-143 forward 5'-
CTGTCTCCCAGCCTGAGGTG-3'; pre-miR-143 reverse 5'-
AGACTCCCAACTGACCAGAGATG-3'; pre-miR-142 forward 5'-
CAGTGCAGTCACCCATAAAGTAGAA-3'; pre-miR-142 reverse 5'-
CACCCTCCAGTGCTGTTAGTAGTG-3'; pre-miR-628 forward 5'-
CACTTCCTCATGCTGACATATTTACTAGA-3'; pre-miR-628 reverse 5'-
CACTCTTACTAGAAGGTTATTAATTTTACCCTCT-3'; pre-miR-1-2 forward 5'-
ACCTACTCAGAGTACATACTTC-3'; pre-miR-1-2 reverse 5'-
GCATTCTATGTTCATATGGGTAC-3'; pre-miR-648 forward 5'-
ATCACAGACACCTCCAAGTG-3'; pre-miR-648 reverse 5'-
TCACTTCCGACTAAGTGCCA-3'
The primers sequences of mRNAs were:
hDrosha forward 5'-TGGATGCGCTTGAAAAATATA-3'; hDrosha reverse 5'-
TCGATGAACCGCTTCTGATG-3'; h-beta-actin forward 5'-
TCACCCACACTGTGCCCATCTACGA-3'; h-beta-actin reverse 5'-
CAGCGGAACCGCTCATTGCCAATGG-3'; hDGCR8 forward 5'-
GGAAAGGGAGGAGACTCGAAA -3'; hDGCR8 reverse 5'- GCGGACGCCACAATGG -3'.
5.4 Western blotting.
Cells were washed twice in ice-cold PBS, harvested by scraping with 1X RIPA buffer (150
mMNaCl, 1 % TritonX100, 0.25 % Sodium deoxycholate, 0.1 % SDS, 50 mM Tris/HCl pH
8.0, 20 mM EDTA) supplemented with 1X protease and phosphatase inhibitor cocktail
(Sigma-Aldrich). Lysates were incubated 30 min in ice, clarified by centrifugation 20 min at
14000 RPM, and resolved onto SDS-PAGE. Blotting was performed according to standard
protocols and PVDF filter was immuno-reacted with following antibodies: mouse monoclonal
anti-p53 (DOI, Blandino et al., 1999), rabbit anti-Drosha (Cell Signaling, D28B1), rabbit anti-
DGCR8 (Abcam, ab90579), mouse anti-p68 (Millipore, clone PAb204), rabbit anti-DDX17
(Abcam, ab 24601), mouse anti-HSP70 (StressGen, N27F34), mouse anti-actin (Ab-1,
Calbiochem), rabbit anti-TCF8/ZEB1 (Cell Signaling, D80D3), mouse anti-E-Cadherin
Page 40
~ 39 ~
(Trasduction Laboratories, 610182). Signals were detected by ECL detection reagents
(Pierce).
5.5 Co-immunoprecipitation.
Cells were lysed on ice with Yoshi A buffer (10mM Tris HCl pH8; 1,5 mM MgCl2; 10mM
KCl, 0,5 mM DTT), supplemented with protease inhibitors (Roche) by passing cell
suspension through a 26-G needle several times. After 30 min on ice and centrifugation (3000
rpm, 5 min at 4 °C), the nuclei fraction was re-suspended in nuclei lysis buffer (50mM Tris
HCl pH8, 15mM MgCl2, 5mM KCl, 5mM EGTA, 150mM NaCl, 2mM EDTA, 0,1% NP40).
Lysates (1 mg/sample) were clarified (13000 rpm, 10 min at 4 °C), precleared with Pierce
Protein-G Agarose (Pierce) and incubated overnight at +4 °C with antibody-protein-G
complexes previously crosslinked by DMP Dimethyl Pimelimidate Dihydrochloride (Sigma).
4ug of the following antibodies were used: rabbit anti-Drosha (ab12286, Abcam), mouse anti-
DDX17 (C-9) (Santa Cruz, sc-271112), sheep polyclonal serum anti-p53 Ab7 (PC35,
Calbiochem), polyclonal anti rabbit (Millipore, # 12370) and polyclonal anti mouse igG
(Millipore, # 12371). After washes (5x) in cold lysis buffer, samples were analyzed by
Western Blot, with the antibodies described in western blotting section.
5.6 RNA-ChIP.
SW480 cells were crosslinked for 15 min with 1% formaldehyde, the cell pellet was
resuspended in lysis buffer (5mM PIPES, pH 8.0, 85 mM KCl, 0.5% Nonidet P-40),
incubated in ice for 10 min, homogenized, and pelleted by centrifugation. The nuclei fraction
was then resuspended in sonication buffer (50 mM Tris at pH 8.0, 10 mM EDTA, 1% SDS,
protease inhibitors). After, nuclei were disrupted by sonication, the lysates were diluted 10
times, precleared by adding protein G for 1 h at 4°C, and then incubated with 5ug rabbit
polyclonal anti-Drosha (ab12286, Abcam) and mouse monoclonal anti-DDX17 (C-9) (Santa
Cruz, sc-271112) antibodies overnight at 4°C with mild shaking. Immunoprecipitation was
performed with protein G-agarose (Pierce), previously blocked with 1 μg/μl sheared herring
sperm DNA and 1 μg/μl bovin serum albumin (BSA), for 3h at 4°C. After stringent washing
and elution, the samples were heated at 65°C for only 2h to reverse formaldehyde cross-links,
and then ethanol precipitated. The precipitated DNA/RNA was treated with 10mM, 40mM
Page 41
~ 40 ~
Tris-HCl pH6.5, 20μg of proteinase K (Roche Diagnostics), and then extracted with Trizol
reagent and ethanol precipitated. The RNA pellets were resuspended in 20 μl of RNase free
water and digested with DNAse (Sigma) for 45 min at 37°C. 20μl of RNA was used for a 30
μl cDNA synthesis reaction. Quantitative PCR reactions were then performed by real-time
PCR machine (Applied Biosystem). The primers sequences of pri-miRNAs are shown above,
in RNA extraction, cDNA synthesis and RT-qPCR section.
5.7 Transfection of miRNA mimics.
For miRNA overexpression, SW480 cells were transiently transfected with synthetic miRNA
mimics -517a, -519a, -218, -105 or miRNA mimic negative control (miR-NC), that contains a
scrambled sequence and does not specifically target any human gene products (Dharmacon),
at a final concentration of 20 nM using Lipofectamine RNAimax Transfection Reagent (Life
Technologies).
5.8 Cell growth assay and flow cytometry.
SW480 cells were transfected with the indicated miRNA mimics (Dharmacon) and after 24h
were plated in 24 well plates at low density (15000 cells per well). Cells were harvested at the
indicated time points and cell number in triplicate was determined in duplicate, with a
Thomas hemocytometer. Lethality was determined by counting the number of cells stained
with trypan blue. Cell-cycle was monitored at the same time points by FACS analysis: cells
were harvested, washed in PBS, and fixed in MetOH:acetic acid solution (4:1) for 60 minutes
at +4°C. Cells were then incubated in 500 μL of staining solution (50 μg/mL of propidium
iodide, 50 μg/mL of RNAase, 0.1% Triton X-100 in PBS 1×) for 1 hour at 4°C and analyzed
by flow cytometry. 4 indipendent experiments were performed in triplicates.
5.9 Wound-healing assay.
For the wound healing assays, SW480 cells were plated in 35 mm plates and transfected with
the indicated miRNA mimics. After 48h cell monolayers were wounded with a sterile tip and
maintained in 10% serum medium. Images were taken after 0, 10 and 24 hours after
wounding. 3 independent experiments were performed.
Page 42
~ 41 ~
5.10 Double Immunofluorescence labeling.
Cells were fixed for 10 minutes with 2% (w/v) formaldehyde in PBS, then permeated with
0,05% Triton X-100 and blocked 1h with 5% bovin serum albumin (BSA). The following
primary antibodies (diluted in 1% BSA) were used: rabbit anti-DDX17 (Abcam, ab 24601)
and rabbit anti-Drosha (ab12286, Abcam) overnight, sheep polyclonal serum anti-p53 Ab7
(PC35, Calbiochem) 1h at room temperature. The following secondary antibodies (diluted in
1% BSA) were used: Cy3-conjugated donkey anti-mouse and Cy2-conjugated donkey anti-
rabbit (Jackson ImmunoResearch Laboratories). Each secondary antibody was incubated for
1h at room temperature. The DNA was counterstained with 0.4 mg/ml 49, 69-diamidino-2-
phenylindole (DAPI) (Sigma) (data not shown). Slides were mounted in 50% glycerol and
analyzed within 24 h. As control, single immunofluorescence labeling for each antibody, and
immunofluorescence labeling where the primary antibody was omitted were performed (data
not shown).
5.11 Confocal Scanning Laser Microscopy.
All experiments were performed at least 4 times in duplicate. For each experiment, 100 nuclei
were visualized. Images were recorded by using a Zeiss LSM 510 Meta confocal laser
scanning microscope equipped with a 60X/1.23 NA oil immersion objective. Ar laser (488
and 514 nm), and HeNe laser (543 nm) were used to excite the fluorophores. Emitted
fluorescence was detected with a 505- to 530-nm bandpass filter for the green signal and a
560-nm long-pass filter for the red signal. The LSM 510 R. 3.2 META (Zeiss) image analysis
software was used.
5.12 miRNA PCR array analysis.
Human RT2 miRNA PCR Arrays (MAH-3100)
(http://www.sabiosciences.com/mirna_pcr_product/HTML/MAH-3100A.html) were obtained
from SA Biosciences. Two hundred ng of isolated RNA, from SW480 (sh-scr) and SW480
(sh-p53), were used for reverse transcription and the entire first strand cDNA was diluted and
distributed amongst the 384 wells of the super-array plate. The reactions were performed with
RT² SYBR Green / ROX PCR Master Mix (SABiosciences). Results were analyzed by the
vendor .
Page 43
~ 42 ~
5.13 Hierarchical clustering of breast cancer samples based on miRNA expression data.
We first downloaded miRNA sequencing data as well as clinical data of breast carcinoma
(BRCA) and normal breast samples from TCGA data portal (https://tcga-
data.nci.nih.gov/tcga/). Next, we selected 91 BRCA samples, carrying missense mutation in
the p53 gene, and 80 normal breast samples and we analyzed the expression profile of 1047
miRNAs across these samples. We found 475 miRNAs as differentially expressed between
the two groups (474 miRNAs, Student's t-test pvalue < 0.05; miR-517a, Student's t-test pvalue
= 0.075, after correction for multiple testing performed with False Discovery Rate method). In
order to facilitate interpretation of the data structure, we used the hierarchical clustering
expression profiles of 475 miRNAs. We used the Euclidean distance as a measure of
dissimilarity between the expression profiles of miRNAs. Then, we used a dendogram (or
clustering tree) as a graphical representation of the resulting matrix of distances and a
heatmap where different colors represent different values of the pair distances. The final
dendrogram is displayed in supplementary figure 1D and represents a compact visualization
of the dissimilarity matrix between miRNA expression profiles. We can see that there are two
main clusters: in one cluster the miRNAs appear generally downregulated in normal tissues
and upregulated in breast cancer tissues, while the other cluster encompasses miRNAs that
show an opposite trend.
5.14 Statistical analysis.
Numerical data were reported as means of results of separate experiments. Significance
was assessed by Student’s t test analysis. Values at p≤0,05 were considered to indicate
significant differences.
Page 44
~ 43 ~
6 REFERENCES
1. Ha M, Kim VN (2014) Regulation of microRNA biogenesis. Nat Rev Mol Cell Bio
15: 509-24.
2. Krol J, Loedige I, Filipowicz W (2010) The widespread regulation of microRNA
biogenesis, function and decay. Nat Rev Genet 11:597-610.
3. Winter J, Jung S, Keller S, Gregory RI, Diederichs S (2009) Many roads to maturity:
microRNA biogenesis pathways and their regulation. Nat Cell Biol 11:228-34. doi:
10.1038/ncb0309-228.
4. Bushati N, Cohen SM (2007) microRNA functions. Annu Rev Cell Dev Biol 23:175-
205.
5. Lujambio A, Lowe SW (2012) The microcosmos of cancer. Nature 482:347-55.
6. Lynam-Lennon N, Maher SG, Reynolds JV (2009) The roles of microRNA in cancer
and apoptosis. Biol Rev Camb Philos Soc 84: 55-71.
7. Yanaihara N, et al., (2006) Unique microRNA molecular profiles in lung cancer
diagnosis and prognosis. Cancer Cell. 9:189–198.
8. Calin GA, et al., (2005) A microRNA signature associated with prognosis and
progression in chronic lymphocytic leukemia. N. Engl. J. Med. 353:1793–1801.
9. Kumar MS, Lu J, Mercer KL, Golub TR, Jacks T (2007) Impaired microRNA
processing enhances cellular transformation and tumorigenesis. Nat Genet 39: 673-7.
doi:10.1038/ng2003.
10. Altuvia Y, et al., (2005) Clustering and conservation patterns of human microRNAs.
Nucleic Acids Res 33:2697-706.
11. Lee Y, et al., (2004) MicroRNA genes are transcribed by RNA polymerase II. Embo J
23:4051-60.
12. Borchert GM, Lanier W, Davidson BL. (2006) RNA polymerase III transcribes human
microRNAs. Nat Struct Mol Biol 13:1097-101.
13. Lee Y., et al., (2003) The nuclear RNase III Drosha initiates microRNA processing.
Nature 425: 415-419.
14. Han J, et al., (2006) Molecular basis for the recognition of primary microRNAs by the
Drosha-DGCR8 complex. Cell 125:887-901.
15. Gregory RI, et al., (2004) The Microprocessor complex mediates the genesis of
microRNAs. Nature. 432: 235-40.
Page 45
~ 44 ~
16. Han J et al., (2009) Posttranscriptional crossregulation between Drosha and DGCR8.
Cell 136:75-84.Berezikov E, Chung WJ, Willis J, Cuppen E, Lai EC. (2007) Mammalian
mirtron genes. Mol Cell 28:328-36.
17. Lund E., Guttinger S, Calado A, Dahlberg JE and Kutay U. (2004) Nuclear export of
microRNA precursors. Science 303:95-98.
18. Zeng Y, Cullen BR. (2004) Structural requirements for premicroRNA binding and
nuclear export by Exportin 5. Nucleic Acids Res 32:4776-4785.
19. Chendrimada TP, (2005) TRBP recruits the Dicer complex to Ago2 for micro-RNA
processing and gene silencing. Nature 436:740-744.
20. Lee Y, et al., (2006) The role of PACT in the RNA silencing pathway. Embo J
25:522-32.
21. Chiang, HR, et al., (2010) Mammalian microRNAs: experimental evaluation of novel
and previously annotated genes. Genes Dev. 24:992-1009.
22. Bartel DP, (2009) MicroRNAs: target recognition and regulatory functions. Cell
136:215-233.
23. Jansson MD, Lund AH. (2012) MicroRNA and cancer. Mol Oncol 6:590-610.
24. Croce CM, (2009) Causes and consequences of microRNA dysregulation in cancer.
Nat. Rev. Genet., 10:704–714
25. Lu J, Getz G, (2005) MicroRNA expression profiles classify human cancers. Nature,
435:834–838.
26. Munker R, Calin GA. (2011) MicroRNA profiling in cancer. Clin. Sci. (Lond.),
121:141–158
27. Iorio MV, Croce CM. (2012) MicroRNA dysregulation in cancer: diagnostics,
monitoring and therapeutics. A comprehensive review. EMBO Mol. Med., 4:143–159.
28. Yanaihara, N. et al., (2006) Unique microRNA molecular profiles in lung cancer
diagnosis and prognosis. Cancer Cell 9:189–198.
29. Calin GA, et al., (2005) A microRNA signature associated with prognosis and
progression in chronic lymphocytic leukemia. N. Engl. J. Med. 353:1793–1801.
30. Weiland MI, Gao XH, Zhou L, Mi QS. (2012) Small RNAs have a large impact:
circulating microRNAs as biomarkers for human diseases. RNA Biol. 9:850-9
31. Blandino G, et al., (2014) Tumor suppressor microRNAs: a novel non-coding alliance
against cancer. FEBS Lett. 588:2639-52.
32. Xiao C, et al., (2008) Lymphoproliferative disease and autoimmunity in mice with
increased miR-17-92 expression in lymphocytes Nat. Immunol., 9:405–414.
Page 46
~ 45 ~
33. He L, et al., (2005) A microRNA polycistron as a potential human oncogene. Nature,
435:828–833.
34. Mu P, et al., (2009) Genetic dissection of the miR-17∼92 cluster of microRNAs in
Myc-induced B-cell lymphomas. Genes Dev., 23:2806–2811.
35. Olive V, et al., (2009) miR-19 is a key oncogenic component of mir-17-92. Genes
Dev., 23:2839–2849.
36. Costinean S, et al., (2006) Pre-B cell proliferation and lymphoblastic
leukemia/highgrade lymphoma in E(mu)-miR155 transgenic mice. Proc. Natl Acad. Sci. USA
103:7024–7029.
37. O’Connell R M, et al., (2008) Sustained expression of microRNA-155 in
hematopoietic stem cells causes a myeloproliferative disorder. J. Exp. Med. 205:585–594.
38. Ma L, Teruya-Feldstein J & Weinberg R A, (2007) Tumour invasion and metastasis
initiated by microRNA-10b in breast cancer. Nature 449:682–688.
39. Tavazoie SF, et al., (2008) Endogenous human microRNAs that suppress breast
cancer metastasis. Nature 451:147–152.
40. Ma L. et al., (2010) miR-9, a MYC/MYCN-activated microRNA, regulates E-cadherin
and cancer metastasis. Nature Cell Biol. 12:247–256.
41. Valastyan S, et al., (2009) A pleiotropically acting microRNA, miR-31, inhibits breast
cancer metastasis. Cell 137:1032–1046.
42. Cano A, & Nieto MA (2008) Non-coding RNAs take center stage in epithelial-
tomesenchymal transition. Trends Cell Biol. 18:357–359.
43. Korpal M et al., (2011) Direct targeting of Sec23a by miR-200s influences cancer cell
secretome and promotes metastatic colonization. Nature Med. 17:1101–1108.
44. Calinet GA, et al., (2004) Human microRNA genes are frequently located at fragile
sites and genomic regions involved in cancers. Proc. Natl. Acad. Sci. USA, 101:2999-3004.
45. Lagana A, et al., (2010) Variability in the incidence of miRNAs and genes in fragile
sites and the role of repeats and CpG islands in the distribution of genetic material. PLoS One,
5:e11166.
46. Mayr C, Hemann MT, Bartel DP, (2007) Disrupting the pairing between let-7 and
Hmga2 enhances oncogenic transformation. Science, 315:1576-1579.
47. Wynendaele J, et al., (2010) An illegitimate microRNA target site within the 3' UTR
of MDM4 affects ovarian cancer progression and chemosensitivity. Cancer Res. 70:9641-
9649
Page 47
~ 46 ~
48. Agirre X, et al., (2009) Epigenetic silencing of the tumor suppressor microRNA Hsa-
miR-124a regulates CDK6 expression and confers a poor prognosis in acute lymphoblastic
leukemia. Cancer Res 69:4443-4453.
49. Majid S, et al., (2012) MicroRNA-23b represses proto-oncogene Src kinase, functions
as a methylation-silenced tumor suppressor with diagnostic and prognostic significance in
prostate cancer. Cancer Res 72:6435-6446.
50. Goel A, Boland CR, (2012) Epigenetics of Colorectal Cancer. Gastroenterology
143:1442-1460.
51. Zhang Y, et al., (2011) miR-125b is methylated and functions as a tumor suppressor
by regulating the ETS1 proto-oncogene in human invasive breast cancer. Cancer Res
71:3552-62.
52. Bui TV, Mendell JT, (2010) Myc: Maestro of MicroRNAs. Genes & cancer 1:568-
575.
53. Emmrich S, Pützer BM (2010) Checks and balances: E2F-microRNA crosstalk in
cancer control. Cell Cycle 9:2555–2567.
54. Brabletz S, Brabletz T, (2010) The ZEB/miR-200 feedback loop--a motor of cellular
plasticity in development and cancer? EMBO Rep. 11:670–677.
55. Hermeking H, (2012) MicroRNAs in the p53 network: micromanagement of tumour
suppression. Nat Rev Cancer 12(9): 613-626.
56. Shi M, Liu D, Shen B, Guo N, (2010) Helpers of the cellular gatekeeper-miRNAs
dance in P53 network. Biochim Biophys Acta 1805: 218-225.
57. Kumar MS, Lu J, Mercer KL, Golub TR, Jacks T (2007) Impaired microRNA
processing enhances cellular transformation and tumorigenesis. Nat Genet 39: 673-677
58. Kumar M S, et al., (2009) Dicer1 functions as a haploinsufficient tumor suppressor.
Genes Dev. 23:2700–2704.
59. Merritt WM, et al., (2008) Dicer, Drosha, and outcomes in patients with ovarian
cancer. N. Engl. J. Med. 359:2641–2650.
60. Melo SA, et al., (2009) A TARBP2 mutation in human cancer impairs microRNA
processing and DICER1 function. Nature Genet. 41:365–370.
61. Melo SA, et al., (2010) A genetic defect in exportin-5 traps precursor microRNAs in
the nucleus of cancer cells. Cancer Cell 18, 303–315.
62. Thomson JM et al., (2006) Extensive post-transcriptional regulation of microRNAs
and its implications for cancer. Genes Dev 20: 2202-2207.
Page 48
~ 47 ~
63. Uhlmann-Schiffler H, Rössler OG, Stahl H (2002) The mRNA of DEAD box protein
p72 is alternatively translated into an 82-kDa RNA helicase. J Biol Chem 277: 1066-1075.
64. Fuller-Pace FV, (2013) The DEAD box proteins DDX5 (p68) and DDX17 (p72):
multi-tasking transcriptional regulators. Biochim Biophys Acta 1829:756-63.
65. Davis BN, Hilyard AC, Lagna G, Hata A (2008) SMAD proteins control DROSHA-
mediated microRNA maturation. Nature 454: 56-61.
66. Kawai S, Amano A (2012) BRCA1 regulates microRNA biogenesis via the DROSHA
microprocessor complex. J Cell Biol. 197: 201-208.
67. Mori M, et al., (2014) Hippo signaling regulates microprocessor and links cell-
density-dependent miRNA biogenesis to cancer. Cell 156: 893-906.
68. Suzuki HI, et al., (2009) Modulation of microRNA processing by p53. Nature
460:529-33.
69. Martello G, et al., (2010) A microRNA targeting dicer for metastasis control. Cell
141:1195-120.
70. Calin GA, et al., (2007) Ultraconserved regions encoding ncRNAs are altered in
human leukemias and carcinomas. Cancer Cell, 12:215-229.
71. Salmena L, Poliseno L, Tay Y, Kats L, Pandolfi PP (2011) A ceRNA hypothesis: the
Rosetta Stone of a hidden RNA language?. Cell 146 : pp. 353–358.
72. Poliseno L, et al., (2010) A coding-independent function of gene and pseudogene
mRNAs regulates tumour biology. Nature, 465:1033–1038.
73. He L, He X, Lowe SW & Hannon GJ, (2007) microRNAs join the p53 network–
another piece in the tumour-suppression puzzle. Nature Rev. Cancer 7:819–822.
74. Pichiorri F, et al., (2010) Downregulation of p53-inducible microRNAs 192, 194, and
215 impairs the p53/MDM2 autoregulatory loop in multiple myeloma development. Cancer
Cell 18:367–381.
75. Xiao J, Lin H, Luo X, & Wang Z, (2011) miR-605 joins p53 network to form a
p53:miR-605:Mdm2 positive feedback loop in response to stress. EMBO J. 30:524–532.
76. Yamakuchi M, et al., (2010) P53-induced microRNA-107 inhibits HIF-1 and tumor
angiogenesis. Proc. Natl Acad. Sci. USA 107:6334–6339.
77. Chang CJ, et al., (2011) p53 regulates epithelial-mesenchymal transition and stem cell
properties through modulating miRNAs. Nature Cell Biol. 13:317–323.
78. Kim T, et al., (2011) p53 regulates epithelial-mesenchymal transition through
microRNAs targeting ZEB1 and ZEB2. J. Exp. Med. 208:875–883.
Page 49
~ 48 ~
79. Swarbrick A, et al., (2010) miR-380-5p represses p53 to control cellular survival and
is associated with poor outcome in MYCN-amplified neuroblastoma. Nature Med. 16:1134–
1140.
80. Hu W, et al., (2010) Negative regulation of tumor suppressor p53 by microRNA miR-
504. Mol. Cell 38:689–699.
81. Muller PA, Vousden KH, (2014) Mutant p53 in Cancer: New Functions and
Therapeutic Opportunities. Cancer Cell 25:304-17.
82. Brosh R, Rotter V, (2009) When mutants gain new powers: news from the mutant p53
field. Nat Rev Cancer 9:701-713.
83. Donehower LA, Lozano G, (2009) 20 years studying p53 functions in genetically
engineered mice. Nat Rev Cancer 9: 831-841.
84. Donehower LA, (2014) Insights into wild-type and mutant p53 functions provided by
genetically engineered mice. Hum Mutat 35:715-727.
85. Gurtner A, et al., (2010) Mutant p53-induced up-regulation of mitogen-activated
protein kinase kinase 3 contributes to gain of function. J Biol Chem 285:14160-14169.
86. Santoro R, Strano S, Blandino G (2014) Transcriptional regulation by mutant p53 and
oncogenesis. Subcell Biochem 85:91-103.
87. Li XL, Jones MF, Subramanian M, Lal A (2014) Mutant p53 exerts oncogenic effects
through microRNAs and their target gene networks. FEBS Lett 588:2610-2615.
88. Weinstein JN, et al., (2013) Cancer Genome Atlas Research Network, The Cancer
Genome Atlas Pan-Cancer analysis project. Nat Genet 45:1113-1120.
89. Alajez NM, et al., (2011) MiR-218 suppresses nasopharyngeal cancer progression
through downregulation of survivin and the SLIT2-ROBO1 pathway. Cancer Res 71:2381-
2391.
90. Borralho PM, et al., (2011) miR-143 overexpression impairs growth of human colon
carcinoma xenografts in mice with induction of apoptosis and inhibition of proliferation.
PLoS One 6:e23787.
91. ST, et al., (2010) MicroRNA-519c suppresses hypoxia-inducible factor-1alpha
expression and tumor angiogenesis. Cancer Res 70:2675-2685.
92. Feng X, Wang Z, Fillmore R, Xi Y, (2014) MiR-200, a new star miRNA in human
cancer. Cancer Lett 344:166-173.
93. Gao X, Jin W (2014) The emerging role of tumor-suppressive microRNA-218 in
targeting glioblastoma stemness. Cancer Lett 353:25-31.
Page 50
~ 49 ~
94. Liu RF, et al., (2013) Down-regulation of miR-517a and miR-517c promotes
proliferation of hepatocellular carcinoma cells via targeting Pyk2. Cancer Lett 329:164-173.
95. Migliore C, et al., (2012) MiR-1 downregulation cooperates with MACC1 in
promoting MET overexpression in human colon cancer. Clin. Cancer Res 18:737-747.
96. Nohata N, Hanazawa T, Enokida H, Seki N (2012) microRNA-1/133a and microRNA-
206/133b clusters: dysregulation and functional roles in human cancers. Oncotarget. 3:9-21.
97. Pinho FG, et al., (2013) Downregulation of microRNA-515-5p by the estrogen
receptor modulates sphingosine kinase 1 and breast cancer cell proliferation. Cancer Res
73:5936-5948.
98. Sayed D, Abdellatif M, (2011) MicroRNAs in development and disease. Physiol Rev
91:827-887.
99. Takaoka Y, et al., (2012) Forced expression of miR-143 represses ERK5/c-Myc and
p68/p72 signaling in concert with miR-145 in gut tumors of Apc(Min) mice. PLoS One
7:e42137.
100. Tu Y, et al., (2013) MicroRNA-218 inhibits glioma invasion, migration, proliferation,
and cancer stem-like cell self-renewal by targeting the polycomb group gene Bmi1. Cancer
Res 73:6046-6055.
101. Uesugi A, et al., (2011) The tumor suppressive microRNA miR-218 targets the mTOR
component Rictor and inhibits AKT phosphorylation in oral cancer. Cancer Res 71: 5765-
5778. 109. Wu L, et al., (2011) MicroRNA-142-3p, a new regulator of RAC1, suppresses
the migration and invasion of hepatocellular carcinoma cells. FEBS Lett 585:1322-1330.
102. Muller PA, Trinidad AG, Caswell PT, Norman JC, Vousden KH (2014) Mutant p53
regulates Dicer through p63-dependent and -independent mechanisms to promote an invasive
phenotype. J Biol. Chem. 289:122-132.
103. Bossi G, et al., (2006) Mutant p53 gain of function: reduction of tumor malignancy of
human cancer cell lines through abrogation of mutant p53 expression. Oncogene 25:304-309.
104. Braicu C, Pileczki V, Irimie A, Berindan-Neagoe I (2013) p53siRNA therapy reduces
cell proliferation, migration and induces apoptosis in triple negative breast cancer cells. Mol
Cell Biochem 381:61–68.
105. Yoshitomi T, et al., (2011) Restoration of miR-517a expression induces cell apoptosis
in bladder cancer cell lines. Oncol Rep. 25:1661-1668.