1 Alma Mater Studiorum – Università di Bologna DOTTORATO DI RICERCA IN ONCOLOGIA E PATOLOGIA SPERIMENTALE Ciclo XXIX Settore Concorsuale di afferenza: 06/A4 Settore Scientifico disciplinare: MED08 MicroRNA in Oral Squamous Cell Carcinoma and Oral Potentially Malignant Lesions: from biological discovery to clinical utility. Presentata da: Dott. Giacomo Del Corso Coordinatore Dottorato Relatore Prof. Pier Luigi Lollini Chiar.ma Prof.ssa Maria Pia Foschini Esame finale anno 2017
Transcript
1
Alma Mater Studiorum – Università di Bologna
DOTTORATO DI RICERCA IN ONCOLOGIA E PATOLOGIA SPERIMENTALE
Ciclo XXIX
Settore Concorsuale di afferenza: 06/A4
Settore Scientifico disciplinare: MED08
MicroRNA in Oral Squamous Cell Carcinoma
and Oral Potentially Malignant Lesions:
from biological discovery to clinical utility.
Presentata da: Dott. Giacomo Del Corso Coordinatore Dottorato Relatore
Prof. Pier Luigi Lollini Chiar.ma Prof.ssa Maria Pia Foschini
Oral Squamous Cell Carcinoma (OSCC) is the most common malignant tumor of the oral
cavity. It represents the majority of head and neck cancers with more than half million
patients being affected each year worldwide [1]. More than 90% are squamous cell
carcinomas which are mostly attributed to exogenous factors such as tobacco smoking and
heavy alcohol consumption. Advances in cancer research have provided new information
on the cellular and molecular processes in carcinogenesis. This also has lead to the
identification of biological markers and effective treatment options. The long-term
survival rates, however, remain low and many individuals are affected.
1.1.1 OSCC epidemiology
OSCC is the eighth most common cancer in the world, with the highest prevalence among
men (5-year prevalence in men: 401,075) [2]. According to Ferlay et al. the worldwide cases
of oral cancer in 2008 in both sexes were about 263,000 (2.1% of the total cancers), the
incidence rate was 3.9 per 100,000 persons and approximately 127,000 cases were fatal.
According to the American Cancer society the incidence of OSCC is higher in developed
countries when compared to developing countries, but the mortality rates remain higher
in developing countries. In developing countries the incidence of OSCC is 107,700 in males
and the estimated deaths are 61,200 [3].
In south-central Asia, OSCC is one of the third most frequent types of cancer. In India the
incidence rate is 12.6 per 100 000 population, and in other countries of Asia OSCC remains
one of the most common cancers [4, 5]. Of interest, the incidence rate remains high in
6
several developed countries such as Denmark, Poland, Germany, Scotland, and also in
Australia, Japan, New Zealand and the USA [6, 7].
1.1.2 Survival Rates
The 5-year survival rate has been relatively low for OSCC despite advancement in
diagnosis and treatment. According to the Surveillance, Epidemiology and End Results
Program the overall 5-year relative survival is 62.2%. The 5-year survival rate of late-stage
OSCC (distant, cancer has metastasized) is only 20% and it is approximately 82% for early
stage OSCC (localized tumor, confined to primary site) [8]. In USA from 1983 to 2006, the
five-year survival rate has increased from 52.5% to 60.8% within the time period [9].
Data from the World Health Organization showed a similar negative trend in the survival
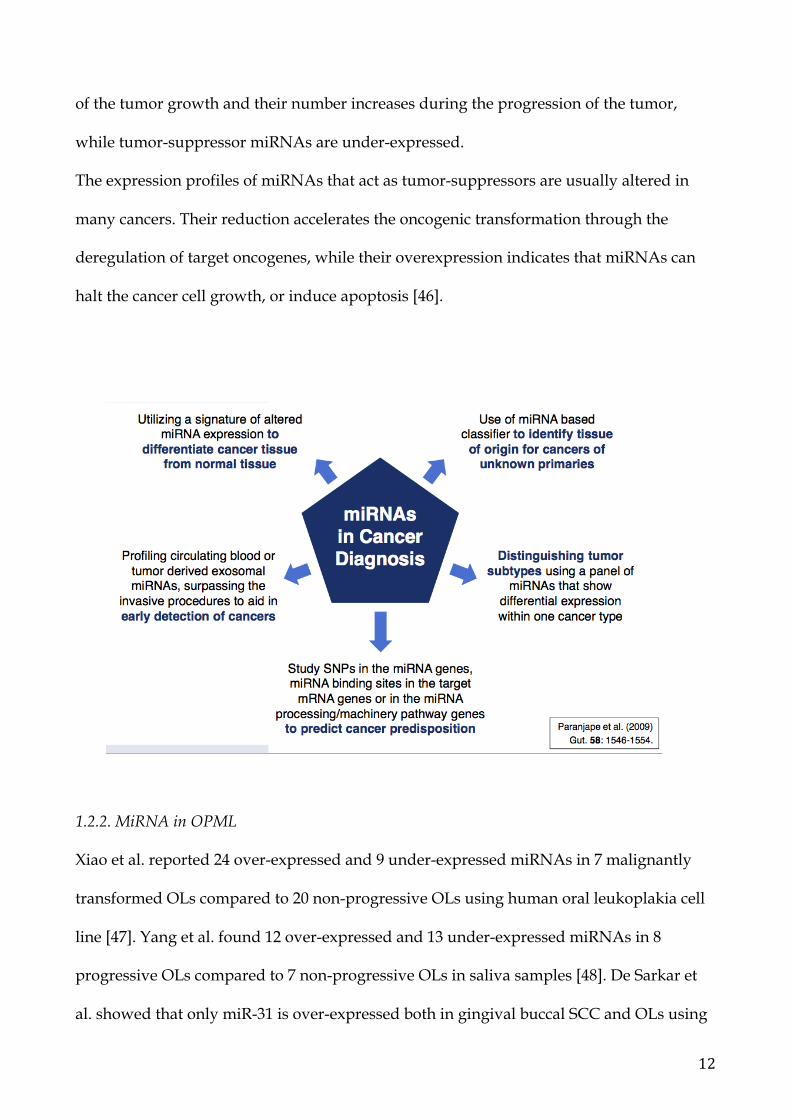
rates between 2005-2010 in some countries (e.g., Brazil, Egypt, Germany, Japan,
Netherlands, Poland, United Kingdom) [10] where the number of deaths has increased.
1.1.3 Demographic and Anatomical sites
OSCC arises from mucosa lining of the oral cavity or from the lips. The most common type
is squamous cell carcinoma, and the histological grade can vary from well-differentiated
keratinizing to undifferentiated non-keratinizing with a high tendency to metastasize.
In the United States the median age at diagnosis for cancer of the oral cavity is 64.5 years
of age [11]. The tongue remains the main site of OSCC [12-16], affecting particularly the
lateral posterior border, in older males individuals [17]. Interestingly, a new trend
emerged during the last 20 years; the rate of OSCC (especially tongue cancer) increased in
younger patients without any apparent and common risk factor such as tobacco or alcohol
consumption [18, 19]. The increased trend of OSCC in younger patients merits further
investigation. Data from 2006-2010 show that the total percentage of cancer of the tongue
7
who occurred in people younger than 45 years old is 7.5% whereas the median age at
diagnosis for tongue cancer is 61 years of age [20]. The other most involved sites are the
lips (17%) and the floor of the mouth (14%). Lip cancer, especially the lower lip, is
typically observed in people who are exposed to sunlight (e.g., fishermen, farmers, skiers
and windsurfers) [21].
1.1.4 Diagnosis
The clinical appearance of OSCC is variable and requires an expert eye to recognize its
features. Early lesions may appear as red oral mucosa failing to heal within two weeks, or
as a persistent lump with spontaneous bleeding or ulceration [22]. Lesions may appear
flat, raised, exophytic or ulcerated without any initial symptoms. Over time patients may
complain of difficulties chewing, limited tongue movement or an abnormal sensation
secondary to swelling. After the cancer growth, more symptoms occur and include
bleeding, paresthesia, mobile teeth (when the tumor invades the bone), and induration
and fixation of soft tissues; only one third are diagnosed with localized tumors [23]. Any
suspicious and persistent lesion should be followed up by the clinician and biopsied [24].
1.1.5 The malignant progression
Normal cells transform into preneoplastic cells and then to cancer after a series of clinical
and histopathological stages involving genetic and molecular changes. These stages are
clinically represented by manifestations on oral mucosa, such as leukoplakia,
erythroplakia or leukoerythroplakia, and they all represent a predictive factor of
malignant transformation [25].
The multi-step progression of cancer involves a combination of acquired and inherited
alterations in the DNA sequence. Genetic changes in keratinocytes cause a progressive
8
acquisition of a malignant phenotype from premalignant to cancer, characterized by
invasion across the epithelial basement membrane and eventual metastasis. The
overexpression of oncogenes causes a disruption in the cell cycle driving to abnormal cell
proliferation [2], while the expression of the tumor suppressor genes, especially the
proteins p53 and p16 in the dysplastic epithelium are significant markers to detect
potentially malignant lesions in the oral cavity [26].
Risk factors can lead to genetic and epigenetic alterations; the most observed cases of
mutation of these genes are present in people from Asia due to the tobacco chewing and
betel quid [27, 28]. Furthermore, epigenetic may cause an alteration of gene expression
through aberrant DNA methylation, histone modifications and expression of microRNAs
[29].
Dionne KR, Warnakulasuriya S, Zain RB, Cheong SC. Potentially malignant disorders of the oral cavity: current practice and future directions in the clinic and laboratory. Int J Cancer. 2015 Feb 1;136(3):503-15.
1.1.6 Oral potentially malignant lesions (OPML)
9
OPML comprise leukoplakia, erythroplakia, oral lichen planus and oral submucous
fibrosis. These lesions are characterized by sequential accumulation of molecular changes
that can lead to dysplasia (mild, moderate or severe) and then to frank invasive carcinoma
[30].
Oral Lichen Planus (OLP) is an immuno-mediated inflammatory condition of the oral
mucosa [31]. It occurs in 1 to 2 % of adults and may be idiopathic or associated with a
variety of systemic and local conditions. OLP usually affects the buccal mucosa and
tongue bilaterally, and can present with three distinct forms: reticular/keratotic (classic),
erosive/erythematous, and ulcerative forms. Less than 1% of OLP evolve in OSCC [32, 33].
Oral Leukoplakia (OL) is a white lesion that can affect any site of the oral cavity, and its
diagnosis it is made by the exclusion of the other known diseases. The malignant
transformation rate of all leukoplakias is 9-37%. There are three clinical different type of
leukoplakia (the homogeneous, the non homogeneous and the verrucous type); the most
aggressive is the proliferative verrucous type (60-100% of proliferative leukoplakias
develop carcinoma) [34]. The risk of malignant transformation is meanly correlated to the
degree of histological dysplasia (mild, moderate or severe) that represents the histological
step of the epithelial malignant transformation. However, dysplasia has limited prognostic
value. Nowadays, there are not specific markers that can predict the probability of
malignant progression from dysplatic lesions to cancer. Some OL can transform into
cancer after a series of progressing genetic alterations. OL that transformed into OSCC are
called progressive OL. The multi-step progression involves a combination of acquired and
inherited alterations in the DNA sequence that can lead to OSCC.
According to the WHO definition oral erythroplakia is defined as “any lesion of the oral
mucosa that presents as bright red velvety plaques which cannot be characterized
clinically or pathologically as any other recognizable condition”. The risk of malignant
10
transformation of erythroplakia is the highest between the others premalignant forms
(90%). This lesion presents as red plaques that can be depressed or flat, and they occur
mainly on the floor of the mouth, the soft palate and the ventral tongue [35].
Oral submucous fibrosis is a condition characterized by a fibrous aspect, a significant
morbidity with pain and reduced oral opening which may affect any site of the oral cavity
[36]. It is associated with areca nut chewing especially in Southeast Asia and the reported
risk of malignant transformation varies from 2.3-7.6% [37].
1.2 MicroRNAs
Mature microRNAs (miRNAs) are short, single-stranded noncoding RNAs of 21–24
nucleotides in length that regulate gene expression post-transcriptionally by degrading or
repressing mRNA. Specifically, miRNAs associate to their target mRNAs by base-pairing
to partially complementary sites, usually located in the 3’untranslated region (3’UTR) [38,
39]. A single miRNA can regulate the translation of multiple genes, thus it can modulate
the expression of multiple proteins.
MiRNAs can influence numerous signaling cascades and biological networks, including
during the progression to OSCC. The authors showed that some of the genetic alterations
in OSCC are earlier expressed in the same-site leukoplakia.
Interestingly regarding miR-181b, Cervigne et al. reported an overexpression of this
miRNA in progressive leukoplakias. However Yang et al. [48] revealed that miR-181b was
found under-expressed in progressing leukoplakias compared to non-progressing. Our
32
data show a significant overexpression of miR-181b in non-progressive OPML in
accordance with the article of Yang et al. These controversial data describe an uncertain
role for miR-181b in OPML that need further studies.
In our results this miRNA showed a marked difference in terms of fold change between
lesions that transformed into cancer and lesions that remained stable in a long-term
follow-up period. Our study corroborates previous data reported by other authors [47, 50,
73] and seeks to underline the importance of introducing miRNAs in the all-day clinical
practice of oral surgeons and pathologist in order to avoid the development of OSCC.
MiRNAs represent important regulators of epigenetic expression and can be used for the
early detection of OPML at high-risk of malignant transformation.
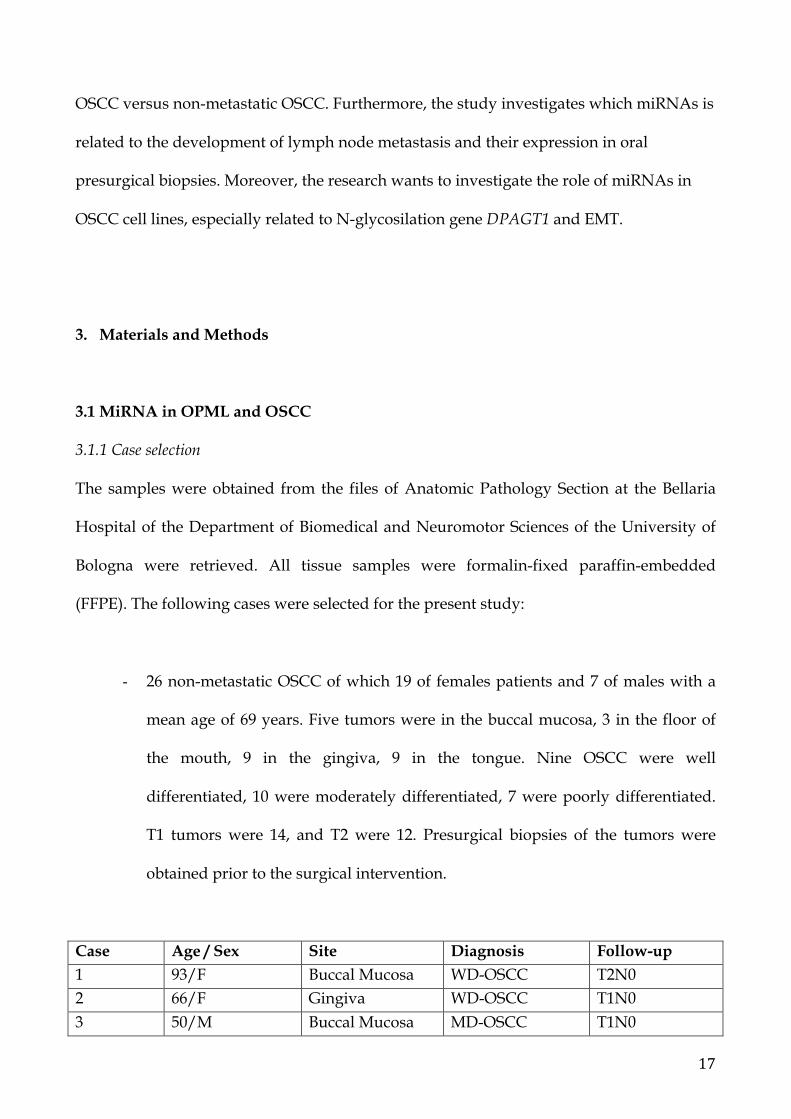
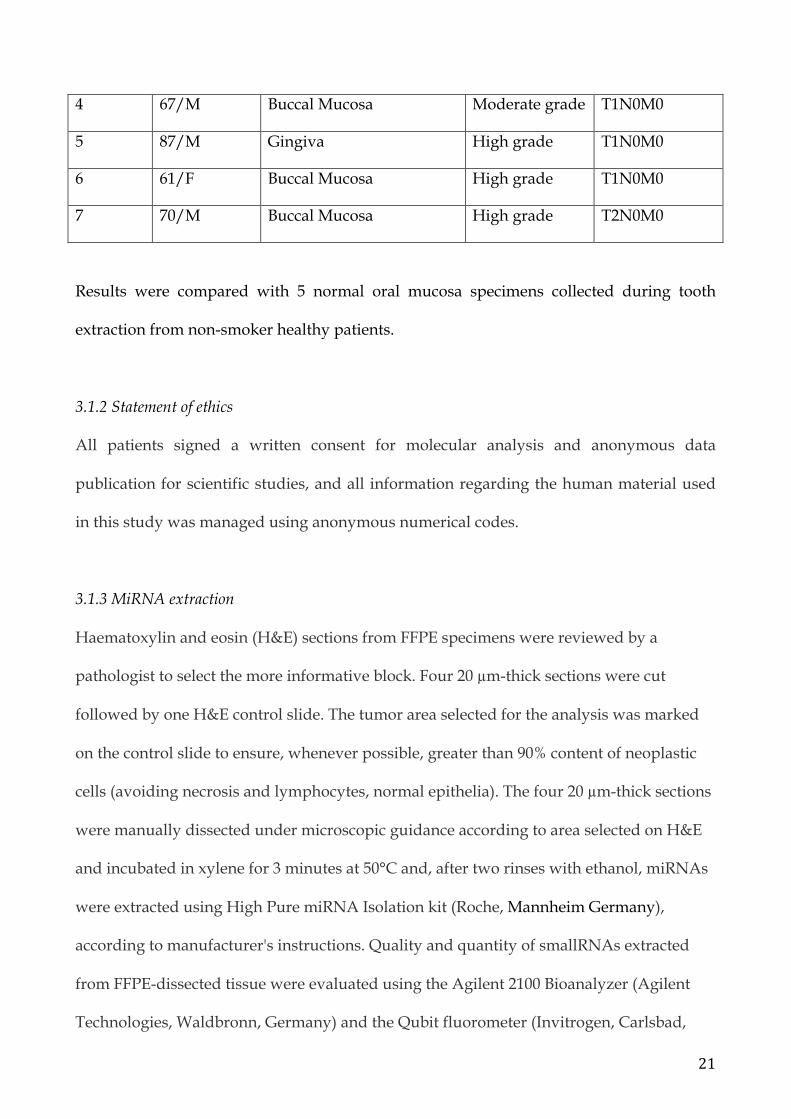
Regarding OSCC samples, we focused on T1 and T2 tumors because they present a better
prognosis and nodal spread is usually confined to lymph nodes. Therefore the reason was
to minimize the biological variations and to find biomarkers correlated to the early
metastatic tumors. Thus, a diagnosis made by a miRNA biomarker at early stage or N1
stage can increase the survival expectation of the patient.
Our results showed a significant difference between miRNAs in T1 and T2 metastatic
tumors and T1 and T2 tumors free of metastasis in more than 5 years. In particular, miR-21
was found overexpressed in aggressive OSCC that had metastasis in one or more cervical
lymph nodes. MiR-21 is an established oncogenic miRNA that targets tumor-suppressing
genes TPM1 and PTEN [55, 75]. Mir-21 was found over-expressed in squamous cell
carcinoma of the tongue, and in progressive OPMLs [47, 48, 50]. This oncogenic miRNA
promotes the tumor invasion of SCC of the tongue via the Wnt/β-catenin pathway by
targeting tumor suppressor DKK2 [56]. MiR-21 was also involved in EMT in human
bronchial epithelial cells and hepatocytes [58, 76].
33
Of interest, the miR-21 over-expression in presurgical biopsies revealed an important role
of miRNA analysis directly prior to the surgery in order to make a correct diagnosis and
orientate the prognosis. Mir-10a was found under-expressed in presurgical biopsies but
not in OSCC samples. Very few studies are present in literature describing the role of miR-
10a in oral cancer, thus further research is necessary.
On the other hand, we showed a down regulation of miR-137 in tumor samples,
suggesting a tumor suppressor role in the events that lead to the metastasis as previously
reported in literature [77]. Mir-137 seems to inhibit the mesenchymal biomarkers N-
cadherin, vimentin and Snail expression indicating a suppressing role in EMT.
Regarding the miRNAs found in OSCC differently from normal oral tissues, we are not
stupefied to see more overexpressed miRNAs because of their oncological role to promote
OSCC. Mir-101 is described as a tumor suppressor miRNA, it is underexpressed in OSCC
tissues and cell lines and inversely related to ZEB1 expression [78]. MiR-200a belongs to a
different cluster of the miR-200 family (differently from miR-200c) but very few articles are
described in literature about oral tissues, as well as about miR-345.
MiR-221 is known to be involved in tumorigenesis in several neoplasms, in particular in
OSCC it is correlated to the growth of the tumor and p27 and p57 might be the targets of it
[79].
Several studies reveal a miRNA expression in patients with metastasis of OSCC. Mir-29b,
miR-155-5p miR-372, miR-373 are higher expressed in OSCC patients with lymph-node
metastasis and thus they act as oncomirs in the malignant progression of OSCC [80-82].
Only two studies, similar to ours, reported a comparison between miRNA expression in
patients with and without lymph node metastasis. In one article, the authors compared 20
metastatic OSCC with 17 non-metastatic OSCC and found 31 miRNAs differently
34
expressed, in particular miR-29a, miR-29c and miR-140-3p are involved in the
downregulation of their specific target genes [83]. The other article reported an over-
expression of miR-31 and miR-130b in non-metastatic samples, while miR-181 and miR-
296 are over-expressed in metastatic tumors [84]. Regarding the discovery of miRNA in
presurgical biopsies very rare oncological articles are reported in the literature. To best of
our knowledge, only one article reported a miRNA expression in FFPE lymph nodes and
fine-needle aspiration biopsies of OSCC patients. Mir-203 and miR-205 were found highly
expressed in metastatic lymph nodes and showed high accuracy in fine-needle aspiration
biopsies [85].
Our data suggest an important role of miR-21 both in oral presurgical biopsies and oral
tissues as a prognostic factor in discriminating metastatic from non-metastatic OSCC. This
result represents an important finding because no other studies describe a miRNA
expression starting from biopsies and confirmed in tissues.
In OSCC cell lines, our results show that miR-200c is inversely related to DPAGT1
expression and suggest that EMT and increased proliferation of complex N-glycans in
OSCC are driven by changes by this miRNA. We identified ZEB1 as a predominant
marker of EMT, in particular a significant correlation was observed between high ZEB1
expression and tumor cell proliferation associated with DPGAT1 overexpression. We
demonstrated that the inhibition of ZEB1 and DPAGT1 in OSCC cell lines lead to
significant inhibition of cell invasion in vitro guided by the overexpression f miR-200c.
The miR-200 family consists of five members, which form two clusters. MiR-200b, miR-
200a and miR-429 are clustered on human chromosome 1, whereas miR-200c and miR-141
are grouped on chromosome 12, with each cluster expressed as a polycistronic transcript.
35
Binding specificities differ within the miR-200 family, with seed sequences differing
between miR-200a-141 (subgroup I) and miR-200b-200c-429 (subgroup II) [86].
We have found that repression of ZEB1 by miR-200c resulted in reduced expression of the
key mesenchymal markers, vimentin and fibronectin, and acquisition of an epithelial
phenotype.
MiR-200 family members have subsequently been studied in a number of
EMT-related in vitro model systems. During induction of EMT in MDCK cells with either
TGF-b or ectopic expression of the protein tyrosine phosphatase Pez, the miR-200 family
and E-cadherin were repressed in parallel with an increase in ZEB1 and ZEB2 expression
[87]. The ability to induce an EMT was dependent upon repression of the miR-200 family
and induction of ZEB1 and ZEB2 expression. Conversely, a MET could be induced by
expression of the miR-200 family in cells that were originally mesenchymal in nature.
These results confirm that the miR-200 family represses ZEB1 expression and
consequently inhibits the progression of an EMT by establishing and maintaining an
epithelial phenotype. The repression of ZEB expression by miRNA-200 family is direct,
and occurs as a result of the miRNA binding to eight and nine sites in the 3 UTRs of ZEB1
and ZEB2 mRNA [69].
Data suggest that the majority, if not all, epithelial cells express high levels of the miR-200
family, which directly repress ZEB1 and ZEB2 and so enable the expression of E-cadherin.
However, if an extracellular signal stimulates the expression of ZEB1, the miR-200 family
is suppressed allowing EMT to proceed.
Together with ZEB1 expression we have found Twist1 expression. Twist1 is a highly
conserved, basic helix-loop-helix transcription factor mapped at 7q21.2, has a bifunctional
role, acting as an activator or a repressor, depending on post-translational modifications
36
and physiologic contexts [88, 89]. Twist1 induces gene transactivation through cisbinding
to E-box regulatory regions, which are present in several target genes, and this involves
complex homodimerization and heterodimerization mechanisms regulated by protein
phosphorylation [89]. In the case of gene repression, Twist1 can repress genes by
regulating chromatin remodeling through histone acetyltransferase-dependent=histone
deacetylase-dependent mechanisms and through the inhibition of DNA binding activity of
transcription factors [88]. The implication of Twist1 in cell migration is attributed
primarily to its ability to contribute to EMT, through the down-regulation of E-cadherin
and the upregulation of mesenchymal markers like vimentin, fibronectin, and N-cadherin
[90, 91]. Previous studies have indicated that Twist1 promotes cell proliferation, migration,
and expression of a primitive ECM, thus promoting an undifferentiated state [90]. In
addition, Twist1 contributes to the EMT phenotype, which has been associated with
resistance to chemotherapy and relapses [91].
6. Conclusions The progressive accumulation of genetic and epigenetic modifications leads the cell to
undergo the neoplastic transformation. Thus, the use of molecules that regulate these
processes are becoming important to prevent the genesis and growth of OSCC.
The overespression of miR-21 and downregulation of miR-137 may be used as prognostic
biomarkers to differentiate metastatic OSCC between non-metastatic OSCC, while miR-
649 can be used as a biomarker to prevent the malignant transformation of OPML. The
miR-21 overexpression in presurgical biopsies of metastatic OSCC seems a useful
biomarker to differentiate metastatic OSCC from non-metastatic OSCC.
37
In vitro data about tumor suppressor miR-200c must be tested in surgical samples and if
good data will be obtained it may be used as a therapeutic option.
Our findings suggest that some miRNAs are correlated to an invasive behavior in OSCC
and in OPML. The detection of these novel biomarkers can guide the surgeon to prevent
the development of the tumor and lymph-node metastasis and to a better management of
the patients.
38
7. Bibliography
1. Haddad, R.I. and D.M. Shin, Recent advances in head and neck cancer. N Engl J Med, 2008. 359(11): p. 1143-54.
2. Scully, C. and J. Bagan, Oral squamous cell carcinoma: overview of current understanding of aetiopathogenesis and clinical implications. Oral Dis, 2009. 15(6): p. 388-99.
3. Global cancer Facts-Figures. American Cancer Society. 4. Moore, S.R., et al., The epidemiology of tongue cancer: a review of global incidence.
Oral Dis, 2000. 6(2): p. 75-84. 5. Moore, S.R., et al., The epidemiology of mouth cancer: a review of global incidence.
Oral Dis, 2000. 6(2): p. 65-74. 6. Petersen, P.E., The World Oral Health Report 2003: continuous improvement of oral
health in the 21st century--the approach of the WHO Global Oral Health Programme. Community Dent Oral Epidemiol, 2003. 31 Suppl 1: p. 3-23.
7. Stewart BW, K.P., World Cancer Report. Lyon: WHO International Agency for Research on Cancer; 2003.
8. Ries LAG MD, K.M., Mariotto A, Miller BA, Feuer EJ, Clegg L, Horner MJ, Howlader N, Eisner MP, Reichman M, Edwards BK. SEER Cancer Statistics Review, 1975-2005, National Cancer Institute. Bethesda, MD. 2008.
9. Ferlay, J., et al., Estimates of worldwide burden of cancer in 2008: GLOBOCAN 2008. Int J Cancer, 2010. 127(12): p. 2893-917.
10. WHO Mortality, Available from: apps.who.int/healthinfo/statistics/mortality/whodpms. Data and Statistics. .
11. Based on November 2012 SEER data submission. SEER Cancer Statistics Review, 1975-2010. National Cancer Institute. Bethesda, MD., 2013.
12. Garavello, W., R. Spreafico, and R.M. Gaini, Oral tongue cancer in young patients: a matched analysis. Oral Oncol, 2007. 43(9): p. 894-7.
13. Hernandez-Guerrero, J.C., et al., Prevalence trends of oral squamous cell carcinoma. Mexico City's General Hospital experience. Med Oral Patol Oral Cir Bucal, 2013. 18(2): p. e306-11.
14. Pitman, K.T., et al., Cancer of the tongue in patients less than forty. Head Neck, 2000. 22(3): p. 297-302.
15. Popovtzer, A., et al., Squamous cell carcinoma of the oral tongue in young patients. Laryngoscope, 2004. 114(5): p. 915-7.
16. Veness, M.J., et al., Anterior tongue cancer: age is not a predictor of outcome and should not alter treatment. ANZ J Surg, 2003. 73(11): p. 899-904.
17. Scully C, M.D., Oral cancer. HeggenhougenKH, QuahS, eds Encyclopedia of public health. Vol 4. San Diego, CA: Academic Press, : p. pp. 668–677.
18. Shiboski, C.H., S.C. Shiboski, and S. Silverman, Jr., Trends in oral cancer rates in the United States, 1973-1996. Community Dent Oral Epidemiol, 2000. 28(4): p. 249-56.
19. Myers, J.N., et al., Squamous cell carcinoma of the tongue in young adults: increasing incidence and factors that predict treatment outcomes. Otolaryngol Head Neck Surg, 2000. 122(1): p. 44-51.
20. Surveillance, Epidemiology and End Results Program. Available from: seer.cancer.gov. A premier source for cancer statistics in the United States.
21. S., S., Demographics and occurrence of oral and pharyngeal cancers. The outcomes, the trends, the challenge. J Am Dent Assoc, 2001. 132 Suppl: p. 7S-11S.
39
22. Villa, A., C. Villa, and S. Abati, Oral cancer and oral erythroplakia: an update and implication for clinicians. Aust Dent J, 2011. 56(3): p. 253-6.
23. Neville, B.W. and T.A. Day, Oral cancer and precancerous lesions. CA Cancer J Clin, 2002. 52(4): p. 195-215.
24. Rethman, M.P., et al., Evidence-based clinical recommendations regarding screening for oral squamous cell carcinomas. Tex Dent J, 2012. 129(5): p. 491-507.
25. Lumerman, H., P. Freedman, and S. Kerpel, Oral epithelial dysplasia and the development of invasive squamous cell carcinoma. Oral Surg Oral Med Oral Pathol Oral Radiol Endod, 1995. 79(3): p. 321-9.
26. Angiero, F., et al., Expression of p16, p53 and Ki-67 proteins in the progression of epithelial dysplasia of the oral cavity. Anticancer Res, 2008. 28(5A): p. 2535-9.
27. Das, N., J. Majumder, and U.B. DasGupta, ras gene mutations in oral cancer in eastern India. Oral Oncol, 2000. 36(1): p. 76-80.
28. Kuo, M.Y., et al., Mutations of Ki-ras oncogene codon 12 in betel quid chewing-related human oral squamous cell carcinoma in Taiwan. J Oral Pathol Med, 1994. 23(2): p. 70-4.
29. Gasche, J.A. and A. Goel, Epigenetic mechanisms in oral carcinogenesis. Future Oncol, 2012. 8(11): p. 1407-25.
30. van der Waal, I., Potentially malignant disorders of the oral and oropharyngeal mucosa; present concepts of management. Oral Oncol, 2010. 46(6): p. 423-5.
31. Warnakulasuriya, S., N.W. Johnson, and I. van der Waal, Nomenclature and classification of potentially malignant disorders of the oral mucosa. J Oral Pathol Med, 2007. 36(10): p. 575-80.
32. Sharma, A., et al., Lichen planus: an update and review. Cutis, 2012. 90(1): p. 17-23. 33. Fitzpatrick, S.G., S.A. Hirsch, and S.C. Gordon, The malignant transformation of
oral lichen planus and oral lichenoid lesions: A systematic review. J Am Dent Assoc, 2014. 145(1): p. 45-56.
34. Lee, J.J., et al., Carcinoma and dysplasia in oral leukoplakias in Taiwan: prevalence and risk factors. Oral Surg Oral Med Oral Pathol Oral Radiol Endod, 2006. 101(4): p. 472-80.
35. Reichart, P.A. and H.P. Philipsen, Oral erythroplakia--a review. Oral Oncol, 2005. 41(6): p. 551-61.
36. Kerr, A.R., et al., A systematic review of medical interventions for oral submucous fibrosis and future research opportunities. Oral Dis, 2011. 17 Suppl 1: p. 42-57.
37. Angadi, P.V. and S. Rao, Management of oral submucous fibrosis: an overview. Oral Maxillofac Surg, 2010. 14(3): p. 133-42.
38. Flynt, A.S. and E.C. Lai, Biological principles of microRNA-mediated regulation: shared themes amid diversity. Nat Rev Genet, 2008. 9(11): p. 831-42.
39. Miranda, K.C., et al., A pattern-based method for the identification of MicroRNA binding sites and their corresponding heteroduplexes. Cell, 2006. 126(6): p. 1203-17.
40. Lee, Y., et al., MicroRNA genes are transcribed by RNA polymerase II. EMBO J, 2004. 23(20): p. 4051-60.
41. Basyuk, E., et al., Human let-7 stem-loop precursors harbor features of RNase III cleavage products. Nucleic Acids Res, 2003. 31(22): p. 6593-7.
42. Grishok, A., et al., Genes and mechanisms related to RNA interference regulate expression of the small temporal RNAs that control C. elegans developmental timing. Cell, 2001. 106(1): p. 23-34.
43. Schwarz, D.S., et al., Asymmetry in the assembly of the RNAi enzyme complex. Cell, 2003. 115(2): p. 199-208.
40
44. Lu, J., et al., MicroRNA expression profiles classify human cancers. Nature, 2005. 435(7043): p. 834-8.
45. Chen, C.Z., MicroRNAs as oncogenes and tumor suppressors. N Engl J Med, 2005. 353(17): p. 1768-71.
46. Kumar, M.S., et al., Impaired microRNA processing enhances cellular transformation and tumorigenesis. Nat Genet, 2007. 39(5): p. 673-7.
47. Xiao, W., et al., Upregulation of miR-31* is negatively associated with recurrent/newly formed oral leukoplakia. PLoS One, 2012. 7(6): p. e38648.
48. Yang, Y., et al., Progress risk assessment of oral premalignant lesions with saliva miRNA analysis. BMC Cancer, 2013. 13: p. 129.
49. De Sarkar, N., et al., A Quest for miRNA Bio-Marker: A Track Back Approach from Gingivo Buccal Cancer to Two Different Types of Precancers. PLoS One, 2014. 9(8): p. e104839.
50. Cervigne, N.K., et al., Identification of a microRNA signature associated with progression of leukoplakia to oral carcinoma. Hum Mol Genet, 2009. 18(24): p. 4818-29.
51. Liu, X., et al., MicroRNA-138 suppresses invasion and promotes apoptosis in head and neck squamous cell carcinoma cell lines. Cancer Lett, 2009. 286(2): p. 217-22.
52. Chang, K.W., et al., Association between high miR-211 microRNA expression and the poor prognosis of oral carcinoma. J Dent Res, 2008. 87(11): p. 1063-8.
53. Yang, C.C., et al., miR-181 as a putative biomarker for lymph-node metastasis of oral squamous cell carcinoma. J Oral Pathol Med, 2011. 40(5): p. 397-404.
54. Sasahira, T., et al., Downregulation of miR-126 induces angiogenesis and lymphangiogenesis by activation of VEGF-A in oral cancer. Br J Cancer, 2012. 107(4): p. 700-6.
55. Zhu, S., et al., MicroRNA-21 targets the tumor suppressor gene tropomyosin 1 (TPM1). J Biol Chem, 2007. 282(19): p. 14328-36.
56. Kawakita, A., et al., MicroRNA-21 Promotes Oral Cancer Invasion via the Wnt/beta-Catenin Pathway by Targeting DKK2. Pathol Oncol Res, 2013.
57. Ward, A., et al., Re-expression of microRNA-375 reverses both tamoxifen resistance and accompanying EMT-like properties in breast cancer. Oncogene, 2013. 32(9): p. 1173-82.
58. Zhao, J., et al., MiR-21 simultaneously regulates ERK1 signaling in HSC activation and hepatocyte EMT in hepatic fibrosis. PLoS One, 2014. 9(10): p. e108005.
59. Varelas, X., M.P. Bouchie, and M.A. Kukuruzinska, Protein N-glycosylation in oral cancer: dysregulated cellular networks among DPAGT1, E-cadherin adhesion and canonical Wnt signaling. Glycobiology, 2014. 24(7): p. 579-91.
60. Beavon, I.R., The E-cadherin-catenin complex in tumour metastasis: structure, function and regulation. Eur J Cancer, 2000. 36(13 Spec No): p. 1607-20.
61. Bretthauer, R.K., Structure, expression, and regulation of UDP-GlcNAc: dolichol phosphate GlcNAc-1-phosphate transferase (DPAGT1). Curr Drug Targets, 2009. 10(6): p. 477-82.
62. Langer, M.D., et al., N-glycosylation alters cadherin-mediated intercellular binding kinetics. J Cell Sci, 2012. 125(Pt 10): p. 2478-85.
63. Wu, Z.Q., et al., Canonical Wnt signaling regulates Slug activity and links epithelial-mesenchymal transition with epigenetic Breast Cancer 1, Early Onset (BRCA1) repression. Proc Natl Acad Sci U S A, 2012. 109(41): p. 16654-9.
41
64. Nita-Lazar, M., et al., Hypoglycosylated E-cadherin promotes the assembly of tight junctions through the recruitment of PP2A to adherens junctions. Exp Cell Res, 2010. 316(11): p. 1871-84.
65. Zhao, X., et al., MicroRNAs as critical regulators involved in regulating epithelial- mesenchymal transition. Curr Cancer Drug Targets, 2013. 13(9): p. 935-44.
66. Moreno-Bueno, G., F. Portillo, and A. Cano, Transcriptional regulation of cell polarity in EMT and cancer. Oncogene, 2008. 27(55): p. 6958-69.
67. Iwatsuki, M., et al., Epithelial-mesenchymal transition in cancer development and its clinical significance. Cancer Sci, 2010. 101(2): p. 293-9.
68. Brabletz, S. and T. Brabletz, The ZEB/miR-200 feedback loop--a motor of cellular plasticity in development and cancer? EMBO Rep, 2010. 11(9): p. 670-7.
69. Gregory, P.A., et al., The miR-200 family and miR-205 regulate epithelial to mesenchymal transition by targeting ZEB1 and SIP1. Nat Cell Biol, 2008. 10(5): p. 593-601.
70. Lo, W.L., et al., MicroRNA-200c attenuates tumour growth and metastasis of presumptive head and neck squamous cell carcinoma stem cells. J Pathol, 2011. 223(4): p. 482-95.
71. Jamali, Z., et al., MicroRNAs as prognostic molecular signatures in human head and neck squamous cell carcinoma: a systematic review and meta-analysis. Oral Oncol, 2015. 51(4): p. 321-31.
72. Curtis, R.E., et al., Impact of chronic GVHD therapy on the development of squamous-cell cancers after hematopoietic stem-cell transplantation: an international case-control study. Blood, 2005. 105(10): p. 3802-11.
73. Brito, J.A., et al., Relationship between microRNA expression levels and histopathological features of dysplasia in oral leukoplakia. J Oral Pathol Med, 2014. 43(3): p. 211-6.
74. Zhu, G., et al., Identification of Gene and MicroRNA Signatures for Oral Cancer Developed from Oral Leukoplakia. Biomed Res Int, 2015. 2015: p. 841956.
75. Meng, F., et al., MicroRNA-21 regulates expression of the PTEN tumor suppressor gene in human hepatocellular cancer. Gastroenterology, 2007. 133(2): p. 647-58.
76. Luo, F., et al., MicroRNA-21, up-regulated by arsenite, directs the epithelial-mesenchymal transition and enhances the invasive potential of transformed human bronchial epithelial cells by targeting PDCD4. Toxicol Lett, 2014. 232(1): p. 301-309.
77. Sun, L., et al., MicroRNA-137 suppresses tongue squamous carcinoma cell proliferation, migration and invasion. Cell Prolif, 2016. 49(5): p. 628-35.
78. Wu, B., et al., MiRNA-101 inhibits oral squamous-cell carcinoma growth and metastasis by targeting zinc finger E-box binding homeobox 1. Am J Cancer Res, 2016. 6(6): p. 1396-407.
79. Yang, C.J., et al., miR-221 and miR-222 expression increased the growth and tumorigenesis of oral carcinoma cells. J Oral Pathol Med, 2011. 40(7): p. 560-6.
80. Yang, C.N., et al., MicroRNA-29b regulates migration in oral squamous cell carcinoma and its clinical significance. Oral Oncol, 2015. 51(2): p. 170-7.
81. Tu, H.F., et al., Upregulation of miR-372 and -373 associates with lymph node metastasis and poor prognosis of oral carcinomas. Laryngoscope, 2015. 125(11): p. E365-70.
82. Baba, O., et al., MicroRNA-155-5p is associated with oral squamous cell carcinoma metastasis and poor prognosis. J Oral Pathol Med, 2016. 45(4): p. 248-55.
42
83. Serrano, N.A., et al., Integrative analysis in oral squamous cell carcinoma reveals DNA copy number-associated miRNAs dysregulating target genes. Otolaryngol Head Neck Surg, 2012. 147(3): p. 501-8.
84. Severino, P., et al., Small RNAs in metastatic and non-metastatic oral squamous cell carcinoma. BMC Med Genomics, 2015. 8: p. 31.
85. de Carvalho, A.C., et al., Accuracy of microRNAs as markers for the detection of neck lymph node metastases in patients with head and neck squamous cell carcinoma. BMC Med, 2015. 13: p. 108.
86. Park, S.M., et al., The miR-200 family determines the epithelial phenotype of cancer cells by targeting the E-cadherin repressors ZEB1 and ZEB2. Genes Dev, 2008. 22(7): p. 894-907.
87. Hill, L., G. Browne, and E. Tulchinsky, ZEB/miR-200 feedback loop: at the crossroads of signal transduction in cancer. Int J Cancer, 2013. 132(4): p. 745-54.
88. Franco, H.L., et al., Redundant or separate entities?--roles of Twist1 and Twist2 as molecular switches during gene transcription. Nucleic Acids Res, 2011. 39(4): p. 1177-86.
89. Qin, Q., et al., Normal and disease-related biological functions of Twist1 and underlying molecular mechanisms. Cell Res, 2012. 22(1): p. 90-106.
90. Alami, J., B.R. Williams, and H. Yeger, Differential expression of E-cadherin and beta catenin in primary and metastatic Wilms's tumours. Mol Pathol, 2003. 56(4): p. 218-25.
91. Ansieau, S., et al., TWISTing an embryonic transcription factor into an oncoprotein. Oncogene, 2010. 29(22): p. 3173-84.
43
8. Acknowledgement
I would like to acknowledge Professor Maria Pia Foschini for her support and help in
doing my PhD at the University of Bologna.
Luca Morandi for the precious work at the laboratory of the Bellaria Hospital.
Professor Maria Kukuruzinska, Trevor Paker and Alessandro Villa for the high-level
experience at Boston University during my first and second year of PhD, and for what
they have taught me.
Prof Marchetti, Montebugnoli and Dr Tarsitano for their support during the clinical
activity and for the research carried out with them.