Page 1
Design and analysis of a composite beam for infrastructure applications
Part III: Experimental results and nonlinear FE analysis
By
Mario Springolo1, Amar Khennane2* , Gerard van Erp3
1,2 Faculty of Engineering and Surveying, The University of Southern Queensland, Toowoomba, Qld 4350, Australia
3 Professor, Executive Director, Fibre Composite Design and Development Centre. The University of Southern Queensland, Toowoomba, Qld 4350, Australia
Abstract:
Using the analytical approaches developed, the cross section of the new fibre composite beam
described in the prequels to this paper is designed in order to avert secondary failure modes. A
series of specimens have been built and put through a thorough testing regime to establish the
performance of the beam. To gain confidence in the analytical models and achieve further
understanding of the beam behaviour, a rigorous nonlinear finite element analysis is also
presented. It was found that the analytical model agreed relatively well with the experiment
and the FE analysis, thus validating the underlying assumptions.
Keywords: composite beam, nonlinear finite element, Abaqus, Python, bending, shear,
moment shear interaction
*Lecturer, Faculty of Engineering and Surveying, The University of Southern Queensland, Toowoomba, Qld 4350, Australia Tel: (+61) (7) 4631 1383, Fax: (+61) (7) 4631 2526, email: [email protected]
1
Page 2
Biographical notes: Mr Mario Springolo has submitted his PhD to the Faculty of Engineering and Surveying at USQ. He is currently working as a structural engineer with Larken Teys consulting Pty Ltd. http://www.larkinteys.com.au Biographical notes: Dr Amar Khennane holds a BE from Tizi-Ouzou, Algeria, an M.Sc. from Heriot Watt, UK, and a PhD, from UQ, Australia. Before joining the Faculty of Engineering and Surveying at the University of Southern Queensland, he was a researcher with the Cooperative Research Centre for Advanced Composite Structures, Ltd, Australia. His research interests are in composite materials: micro-mechanics, durability and through life estimation of composite structures, and computational mechanics. Biographical notes: Professor Van Erp was born and educated in the Netherlands and moved to Asutralia in 1989. In 1990 he joined the Faculty of Engineering and Surveying at USQ. Currently, he is the Executive Director of Fibre Composites Design & Development, University of Southern Queensland (USQ) responsible of Australia's first fibre composites bridge.
2
Page 3
INTRODUCTION
The new fibre composite beam described in the prequels is put through a testing program that
includes tests designed for primary and secondary failure modes. In particular, the behaviours
in bending, shear, combined bending and shear, buckling, and lateral torsional buckling were
investigated. A detailed description of the experimental set up and the complete results are
given in [1], and only the most important results are reported herein.
In particular, it was found that the core material cracks prior to the ultimate failure of the
beam. This was caused by the low failure strain of 0.6% of the core when compared to the
main unidirectional laminates, which have a failure strain around 2%. Associated with the
cracking of the core is localised de-bonding at the interface between the laminates and core.
In addition, it was found that the different constituents of the beam exhibited different
behaviours in tension and compression. The FRP laminates were found to undergo
progressive damage due to matrix cracking, fibre-matrix de-bonding and fibre breakage
before failure. The best approach to model these phenomena appears to be at micro-
mechanical level. However, such an analysis is impossible for large components such as
structural elements. Previously some research efforts have assumed equivalent homogeneity
to make limited progress. In the present paper, instead of ignoring the lack of homogeneity,
attention will be focussed on the internal structure of the material, since it is the latter that
governs the behaviour of the composite system and consequently its failure. The approach
favoured herein considers the damage progression in the constituents.
Using both the scripting ability of the ABAQUS finite element software [9], and user defined
subroutines, the damage phenomena are incorporated in the form of damage variables to
3
Page 4
model the nonlinear behaviour of an FRP beam. The obtained results will be compared to
both the analytical and experimental results.
FINITE ELEMENT ANALYSIS
Modelling the FRP beam using ABAQUS
ABAQUS is a general finite element package with non-linear capabilities. In particular,
whenever a material definition is not supported, the user is provided with the ability to use
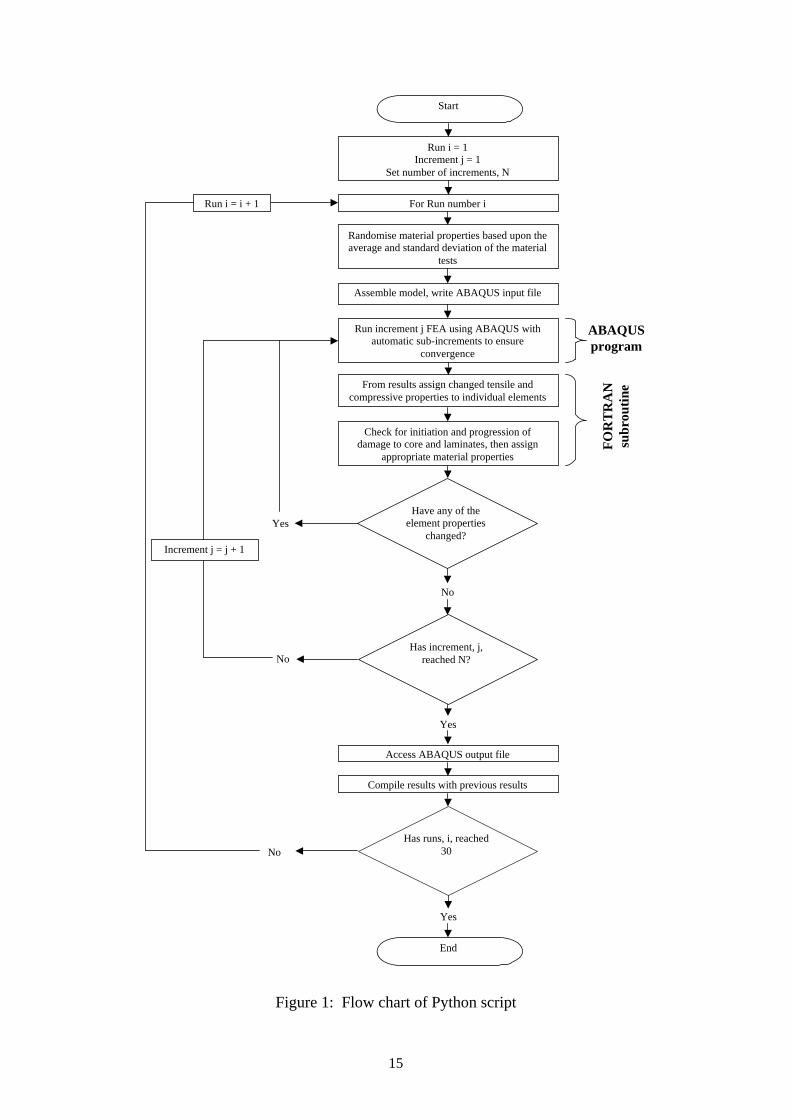
external subroutines. Taking advantage of the ability to script within ABAQUS, using the
Python language [10], an algorithm taking into account the progressive damage within the
constituents is proposed. To account for the different material properties in tension and
compression, a linear elastic analysis with homogeneous properties is first run to identify
stress states within the beam. Material properties are then assigned correspondingly. Because
of changes in the model, caused by modelling the damage at different parts of the beam
throughout the analysis, this process is updated at each iteration, depending on the stress
states obtained at the previous iteration. The cracking in the core material is modelled using a
smeared crack approach. When the strain in the core material exceeds a limiting value, the
elastic modulus is put to zero at the offending Gauss point. The peel-off of the laminate from
the core material is not modelled as the interaction behaviour between core material and
laminates is yet to be quantified, and is the subject of continuing investigation. Damage in the
laminates is modelled by means of an external Fortran subroutine implementing the damage
model of Chang et al. [8]. Furthermore, initial material properties throughout the beam model
are varied to imitate the heterogeneous nature of the materials so that stress concentrations
may form, providing the sites for crack initiation and laminate failure. A flow chart of the
process is shown on Figure 1.
4
Page 5
To model the progressive matrix, shear, and compressive failure of the laminates, the existing
formulations by Chang et al. [8] were also incorporated within a user defined Fortran
subroutine.
PURE BENDING
Finite element model
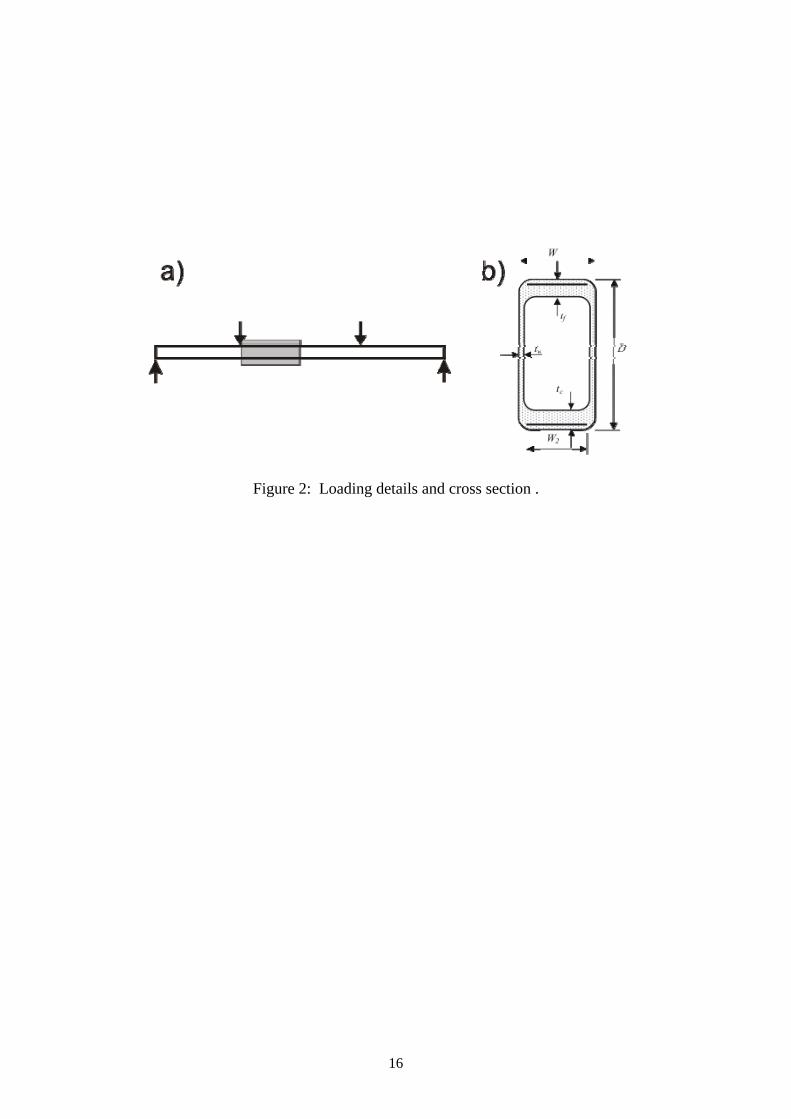
Figure 2 shows the loading details and the geometrical details of the cross section used to
simulate the beam under pure bending. Only the shaded area, pure bending part, shown on
Figure 2-a is analysed.
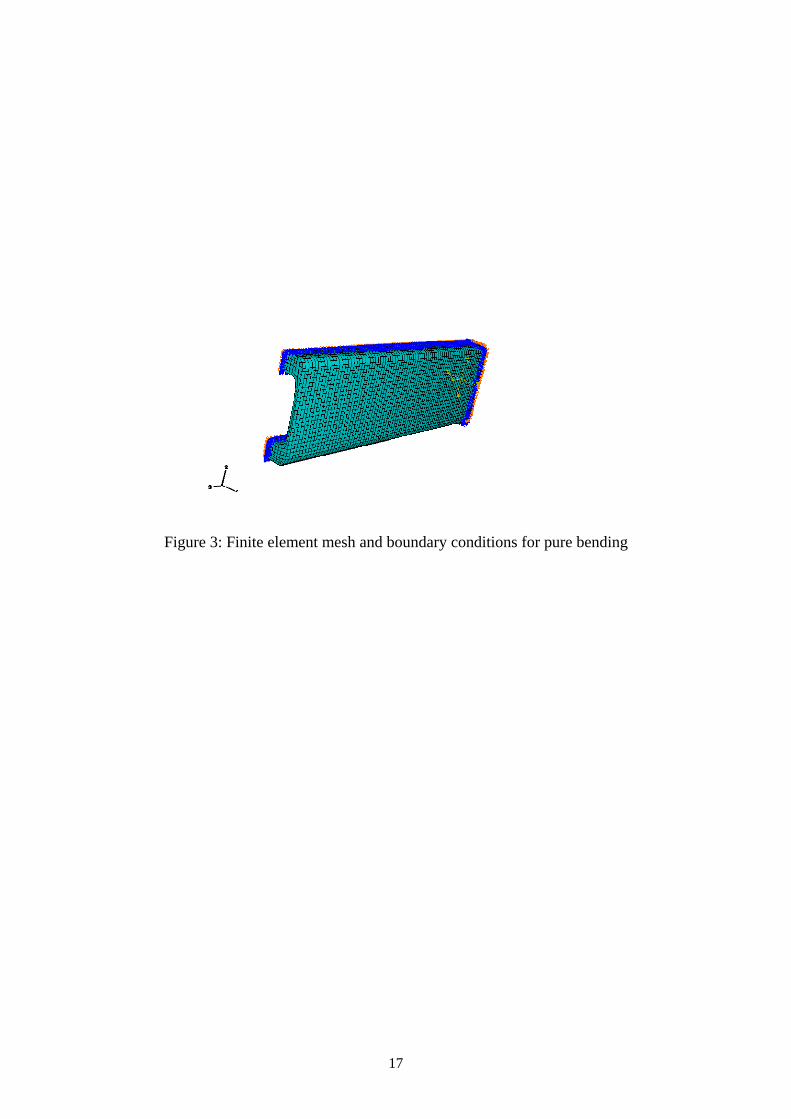
Due to symmetry, only half of the section is analysed as shown on Figure 3 representing the
finite element mesh and boundary conditions. The nodes on the left face were constrained to
remain on a plane to comply with the Bernoulli hypothesis that plane sections remain plane.
The nodes on the right hand cross section are fixed in both the first and third direction but free
to move in the third (vertical) direction except for three nodes in the middle of the section that
are totally restrained. This is necessary to avoid any rigid body movement of the model. The
nodes on the longitudinal face of symmetry are only constrained in the first (transversal)
direction.
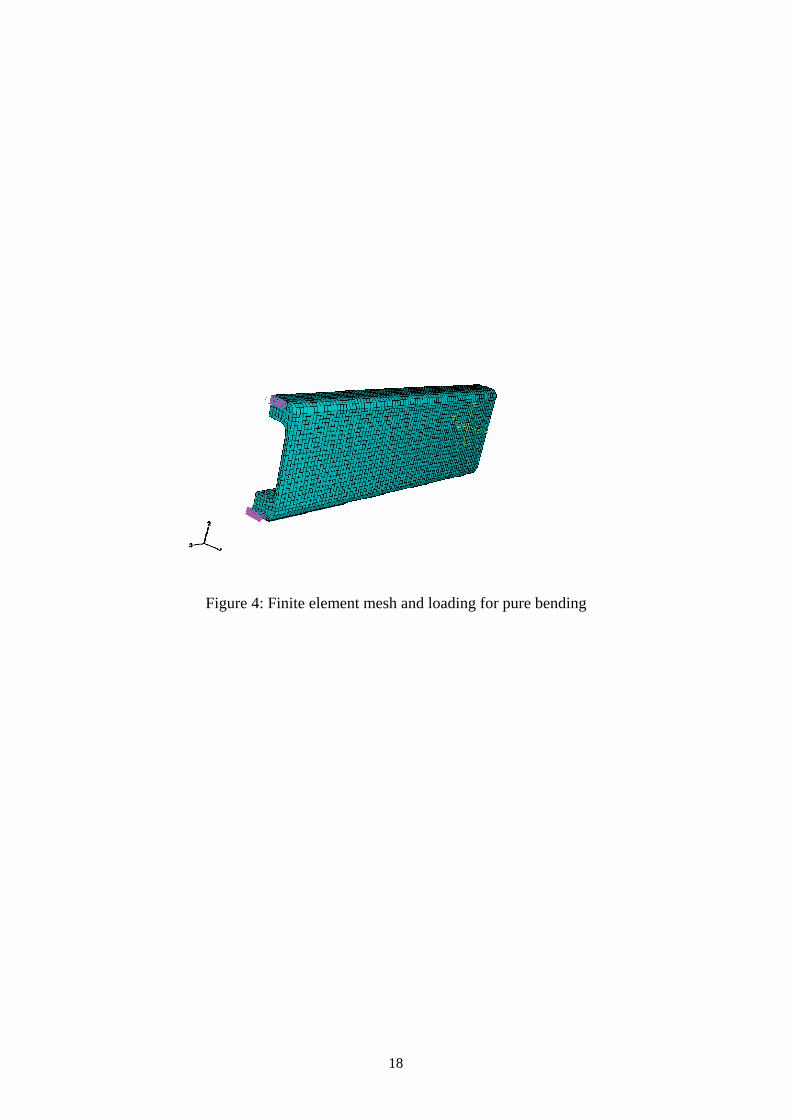
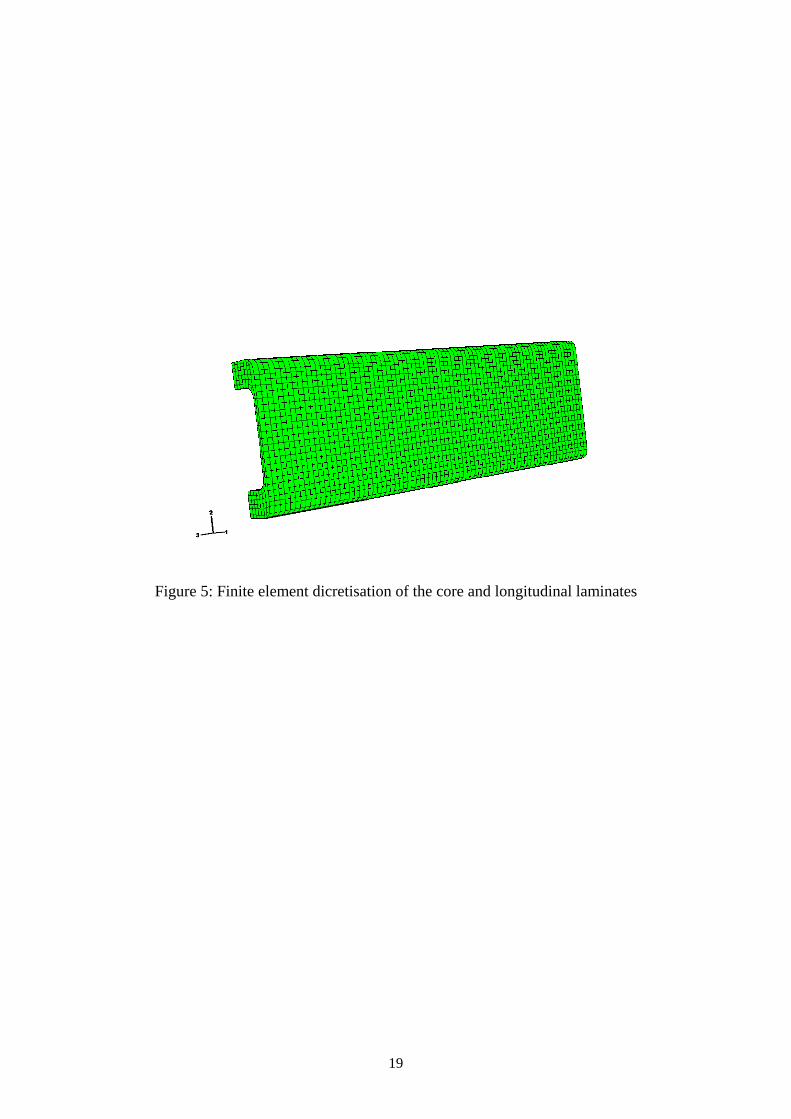
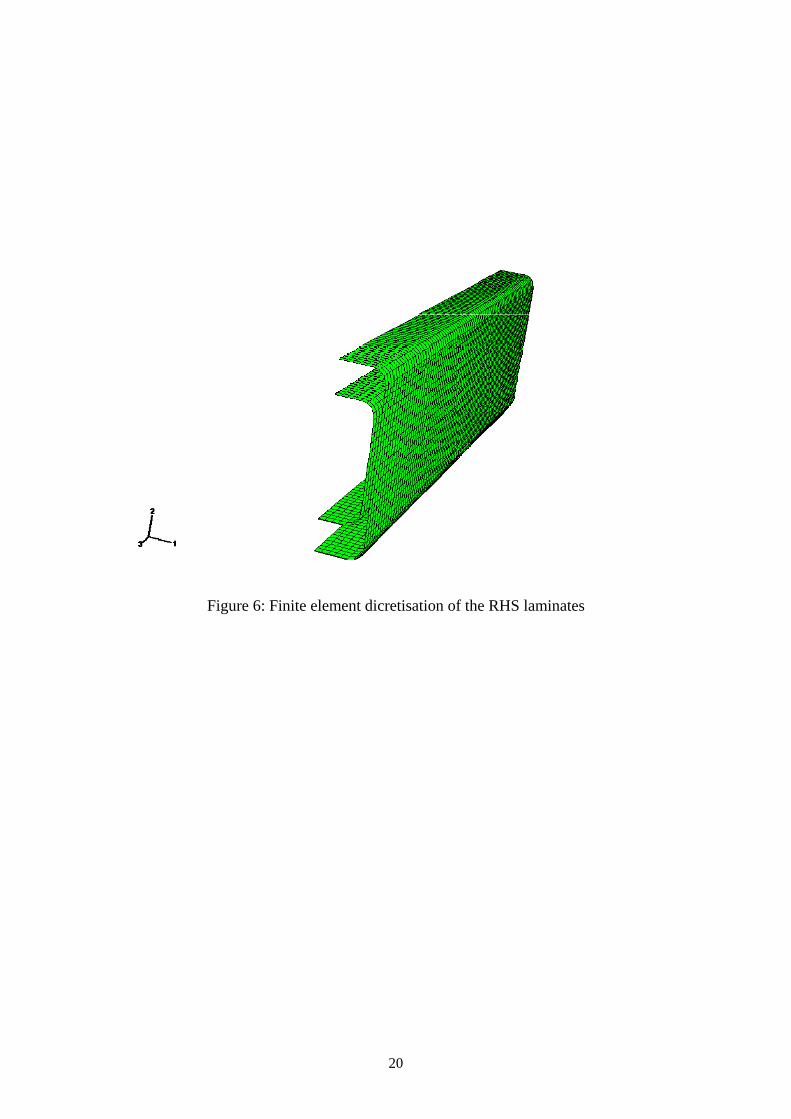
The loading is applied through a couple as shown on Figure 4 to induce pure bending. The
core and longitudinal laminates were discretised using 8 noded brick elements as shown on
Figure 5. The RHS laminates were discretised using 4 noded shell elements as shown on
Figure 6.
5
Page 6
Material properties
Material properties were randomly assigned to the brick and shell elements in the models. The
distribution was based upon the average and standard deviation recorded in testing the
laminates and the Particulate Filled Resin (PFR) shown in Table 1 of Part I of the prequel. To
ensure that results were statistically valid, 30 models, each with a different randomisation
sequence, were analysed for each loading configuration. Both the assigning of tensile and
compressive properties, and the modelling of progressive failure was achieved within
ABAQUS via a user defined Fortran subroutine. The core material cracking and FRP tensile
capacities were based on a maximum strain criterion. To simulate the cracked behaviour of an
element, the tensile and shear moduli, respectively parallel and perpendicular to the direction
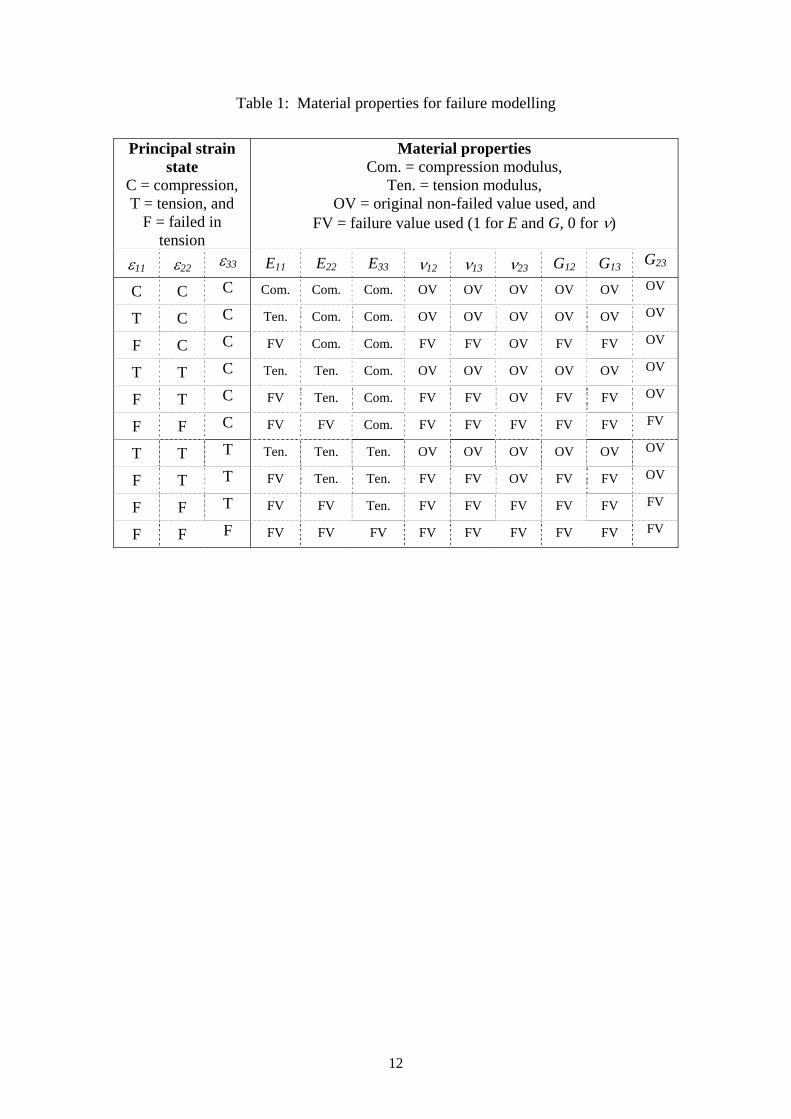
of failure, were re-set to one. The 10 different principal strain states possible as represented on
Table 1. For example, if a brick element representing a laminate is under a state of tension (T)
in the direction of ε11, and compression (C) in the directions of ε22 and ε33, then the tensile
modulus E11 will be used in the direction of ε11, while the compressive moduli E22 and E33
will be used in the directions corresponding to ε22 and ε33. Original non-failed value (OV) for
Poisson’s ratios and shear moduli will also be used. However, if it has already failed in any
direction (represented by the letter F), then failed values (FV) for the elastic properties in that
direction will be used. Table 1 is used to model the progressive matrix, shear, and
compressive failure of the laminates using the damage formulation developed by Chang et al.
[8]
Results and discussion
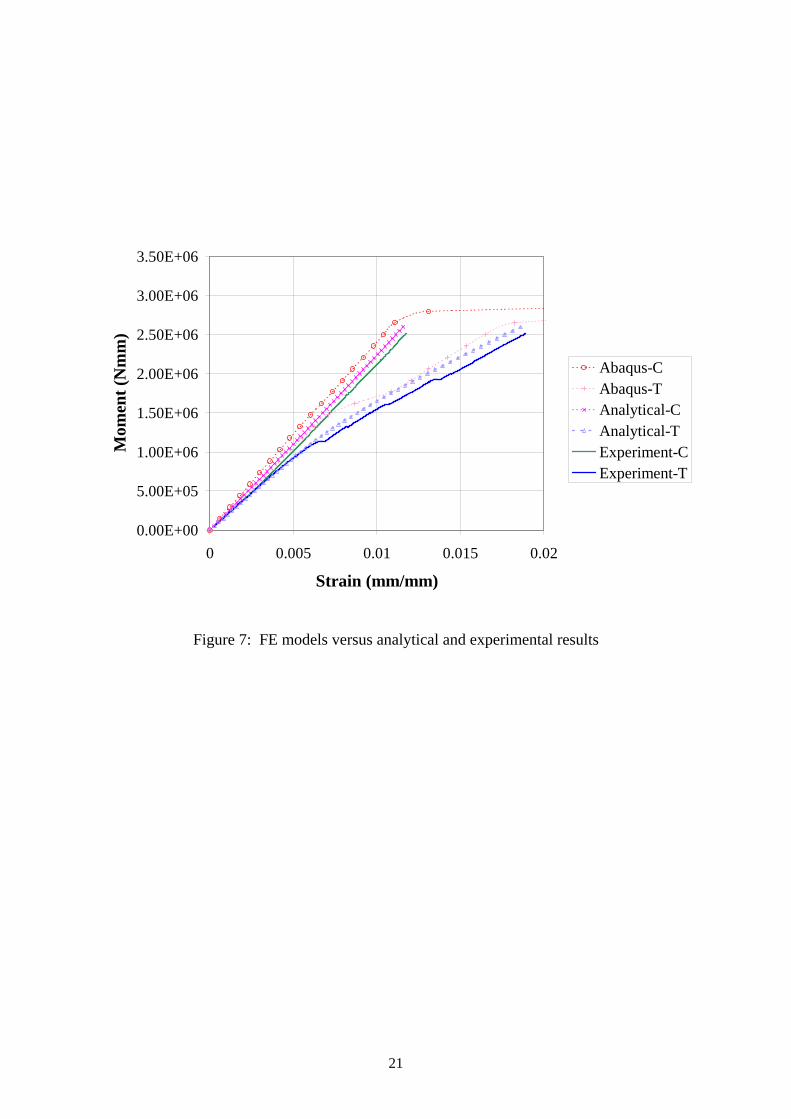
Figure 7 shows the obtained results for the beams tensile and compressive strains at mid-span
(denoted T and C respectively in the figure). It can be seen that there exist an excellent
6
Page 7
correlation with both the experimental and analytical results. Furthermore, the FEA and
analytical ultimate capacity predictions agree very well with the experimental results.
The difference in the analytical and FEA predictions of tensile strains, between moments of
1E6 to 1.75E6 Nmm on Figure 7, could be attributed to the fact that the FEA model does not
provide for core-laminate de-bonding. Given the current state of knowledge, this de-bonding
behaviour cannot be modelled reliably, regardless of the FEA package chosen. As mentioned
previously, the characterisation of this phenomenon is still under investigation. However, the
FEA results converge to the analytical predictions above a moment of 1.75E6 Nmm, which is
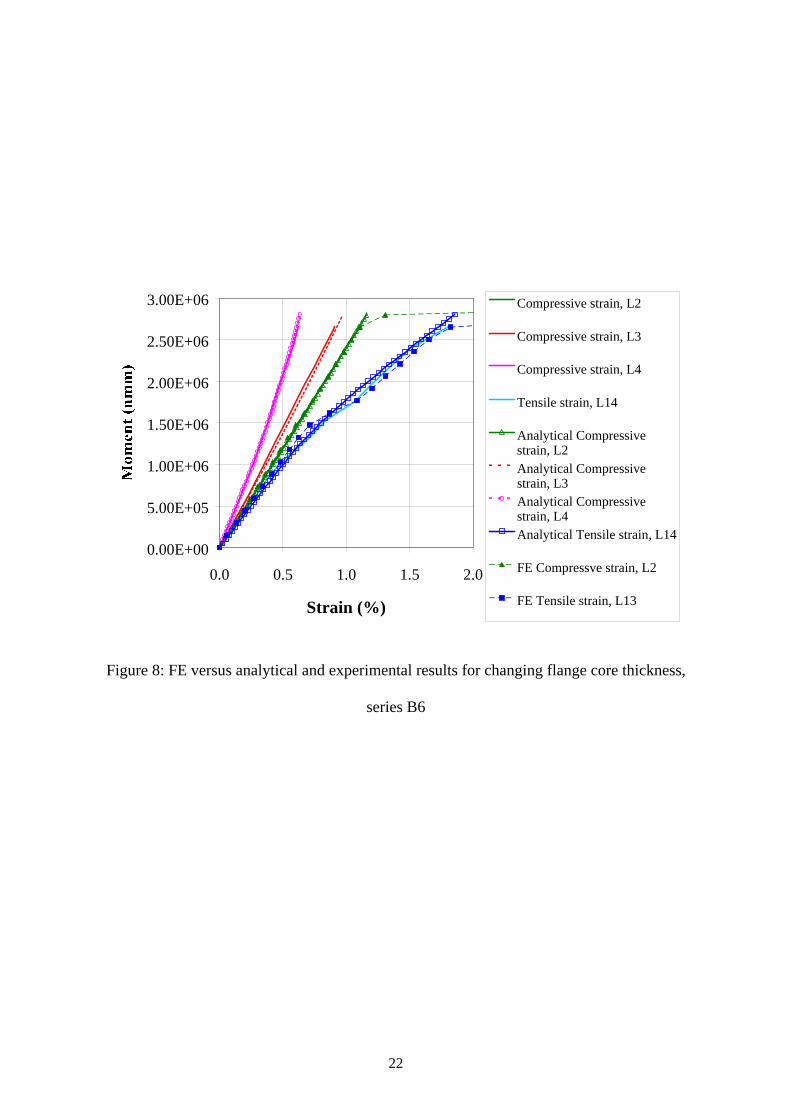
of prime importance as far as prediction of loading capacity is concerned. To further test the
validity of the developed FEA approach a number of models with altered beam geometry are
compared against experimental data. As can be seen on Figure 8 to Figure 11, the FEA
predictions are consistent for all the beam geometries tested.
MODELS UNDER SPECIFIC LOADING REGIMES
The developed approach provides excellent correlation with analytical and experimental
results under a state of pure bending. To establish the overall applicability of the approach, it
is used to model the beam behaviour, and predict the occurrence of following range of failure
modes:
• moment buckling of the webs,
• combined shear and bending,
• shear buckling of the webs, and
• lateral torsional buckling
7
Page 8
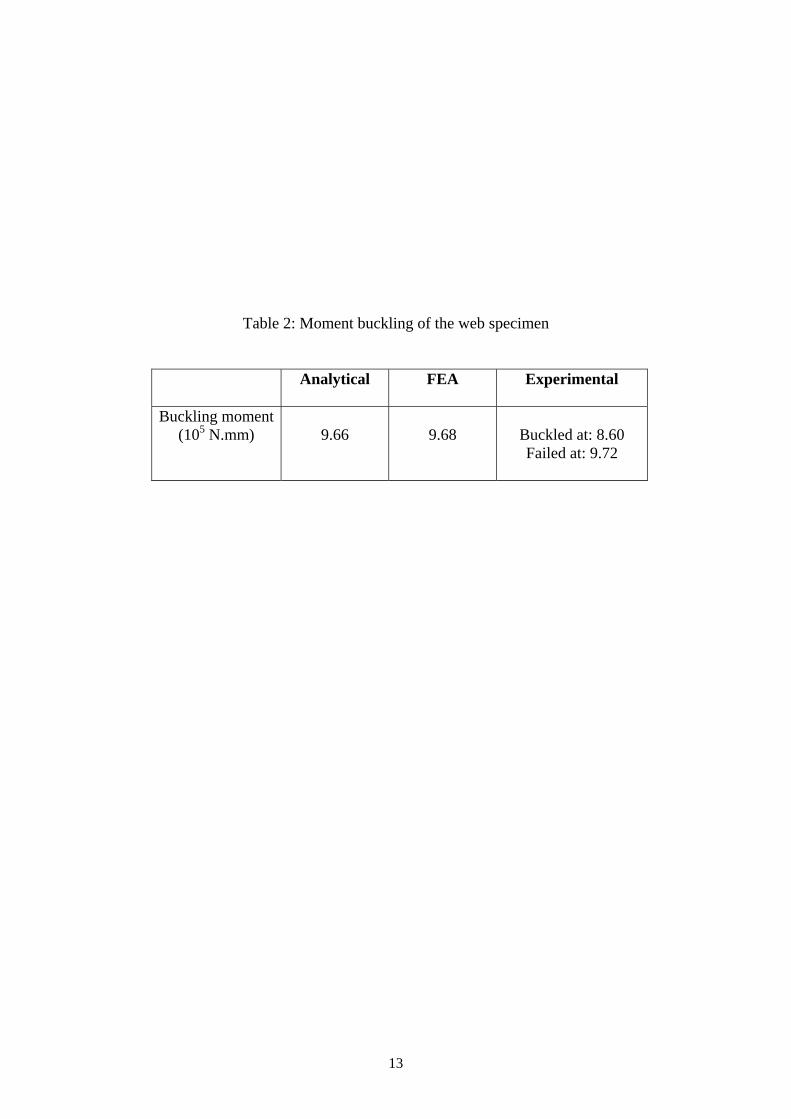
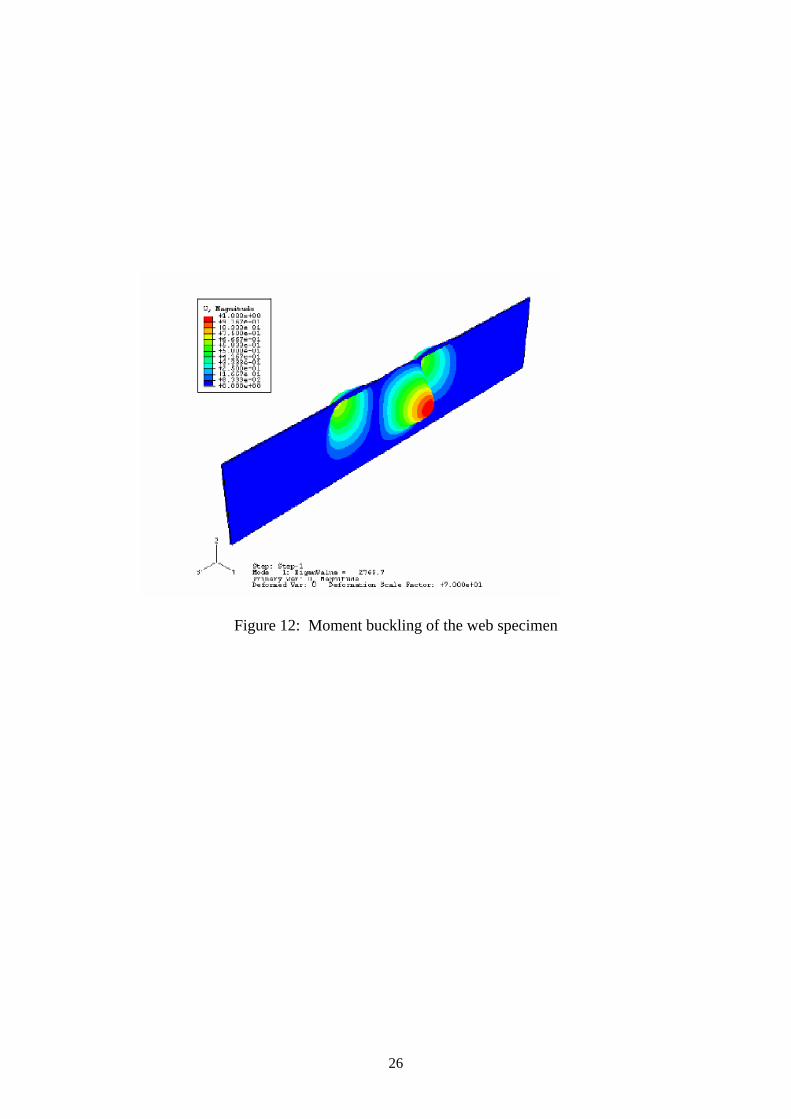
Moment buckling of the webs Testing for web buckling required the manufacture and testing of separate web specimens.
These specimens are modelled as per the four-point bending test arrangement. The first
buckling mode, as predicted by the model, is shown on Figure 12. Comparison of results, as
shown on Table 2, shows that the analytical and finite element solutions are similar and agree
well with the experimental results.
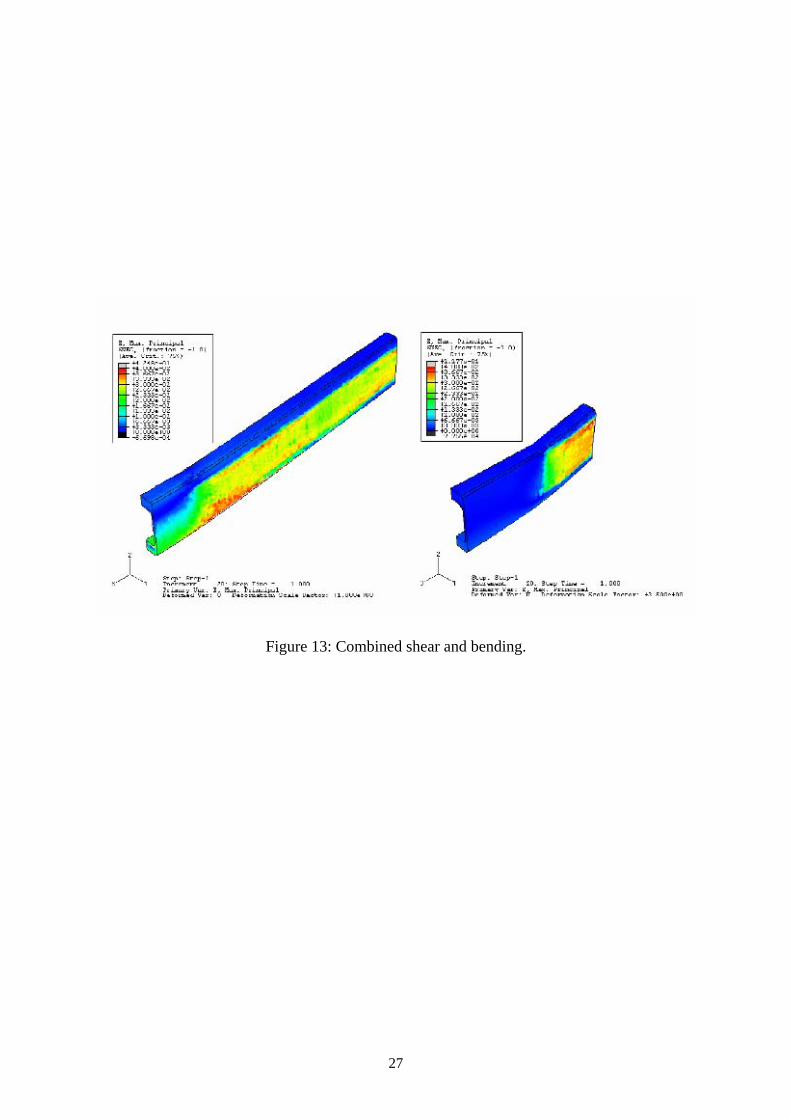
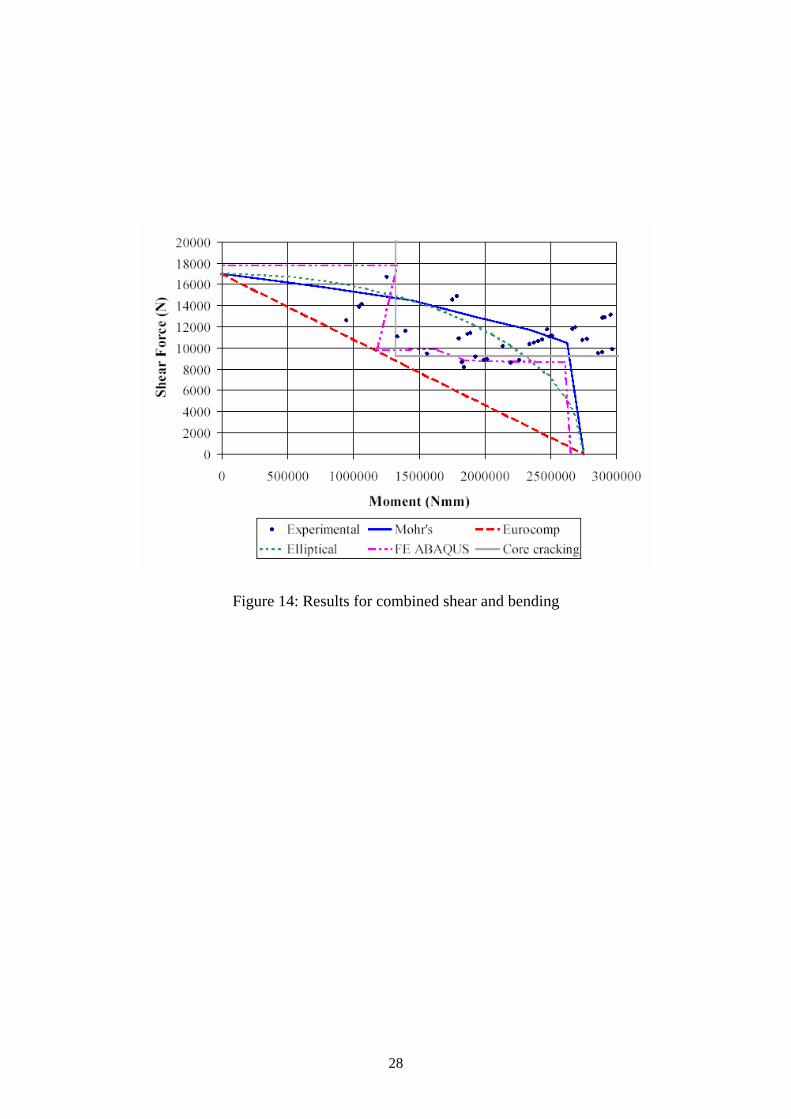
Combined shear and bending
Six beams loaded in four-point bending were analysed. Due to symmetry, only half spans
were modelled. The lengths of the spans were successively reduced to obtain the interaction
diagrams between moment and shear. Figure 13 shows the two extremes of the model
geometry’s. The obtained failure predictions, together with the analytical and experimental
results, are plotted on Figure 14. It can be seen that the FEA results reproduce the trend of the
experimental results shown as dots on the plot. However, the FE results correlate with the
analytical results only at either high-shear and low moment or low-shear and high-moments.
Furthermore, the general trend shown by the FE results seems to follow occurrences of
cracking in the core material as experimentally observed.
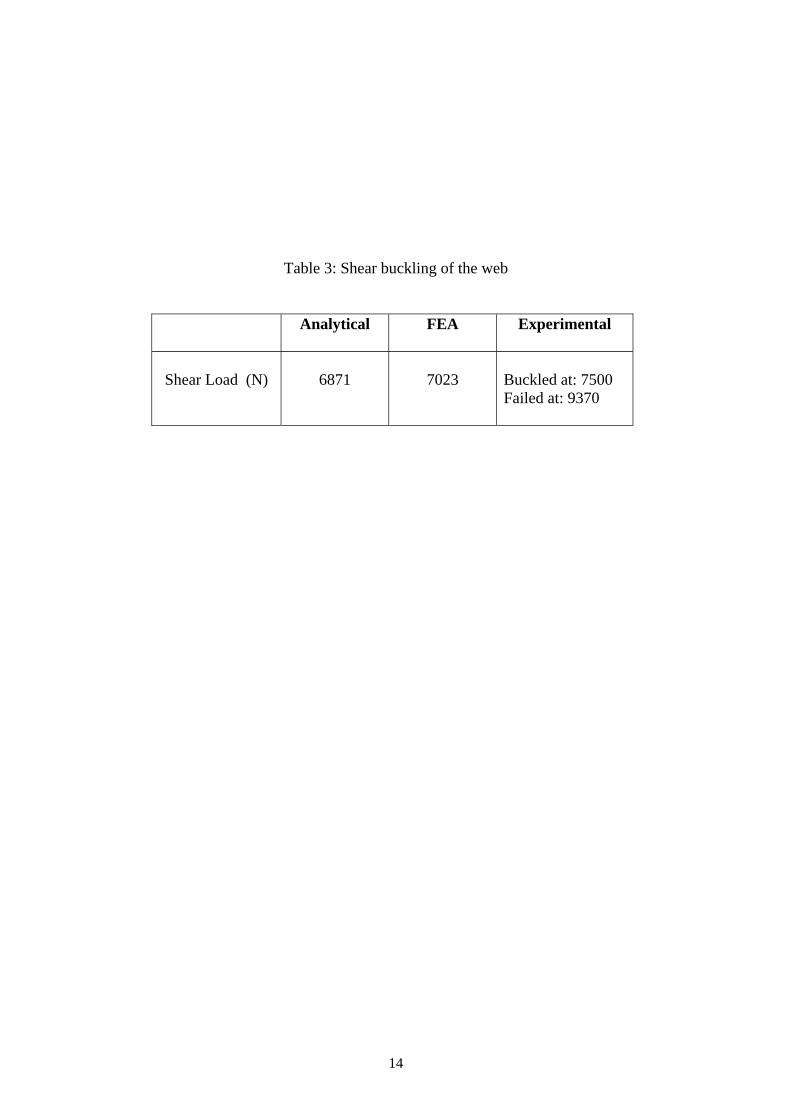
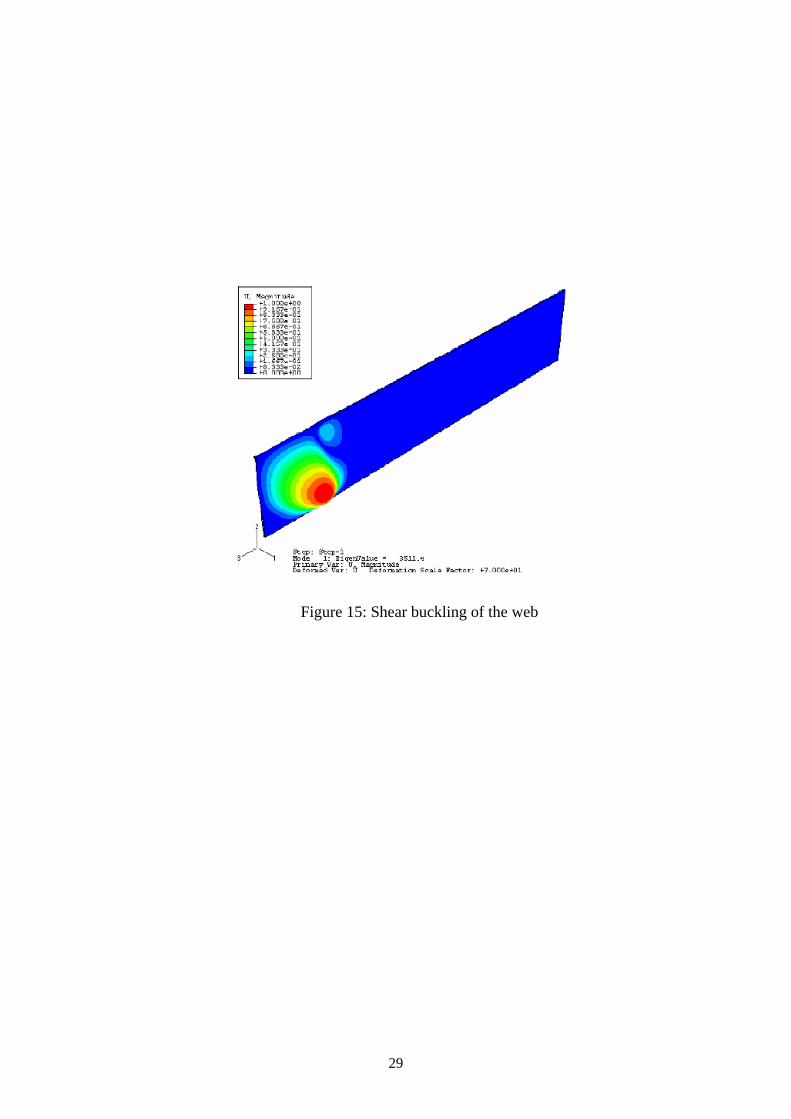
Shear buckling of the webs
To model shear buckling, a web specimen similar to that used to test for moment buckling,
was modelled. The first predicted buckling mode is shown on Figure 15. As with moment
buckling, comparison of the results, as reported on Table 3, shows good agreement between
the analytical, FE and experimental results.
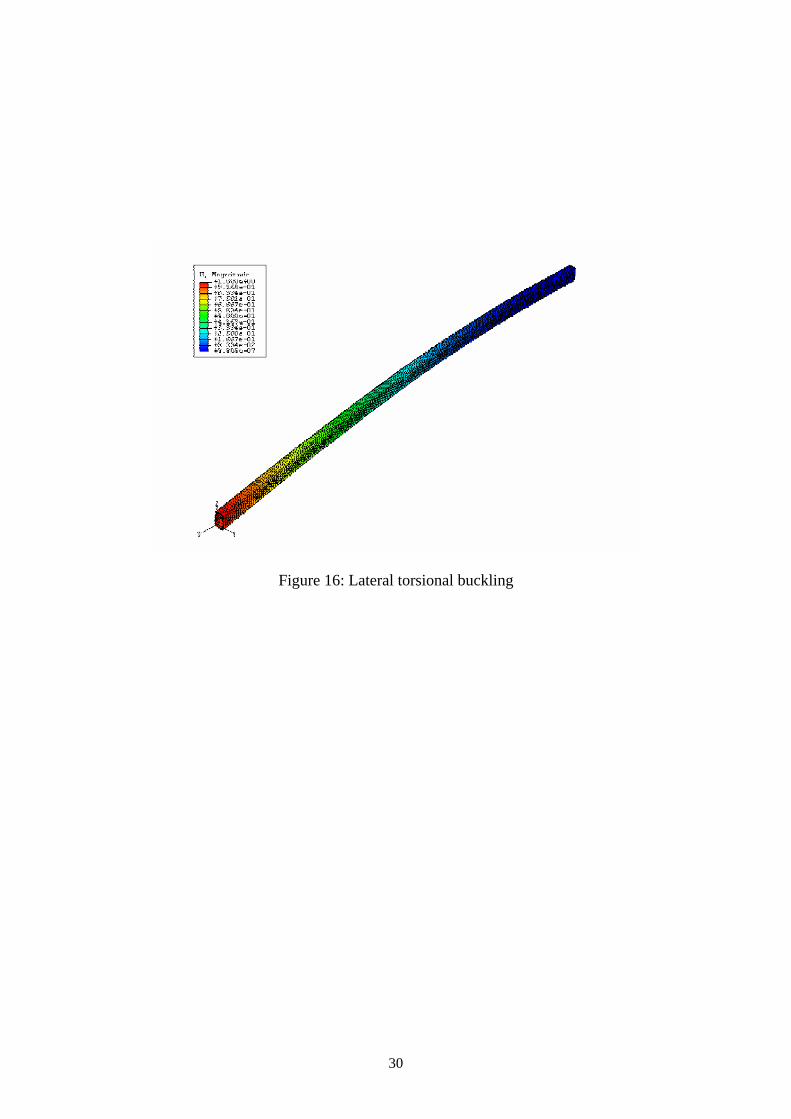
Lateral torsional buckling
8
Page 9
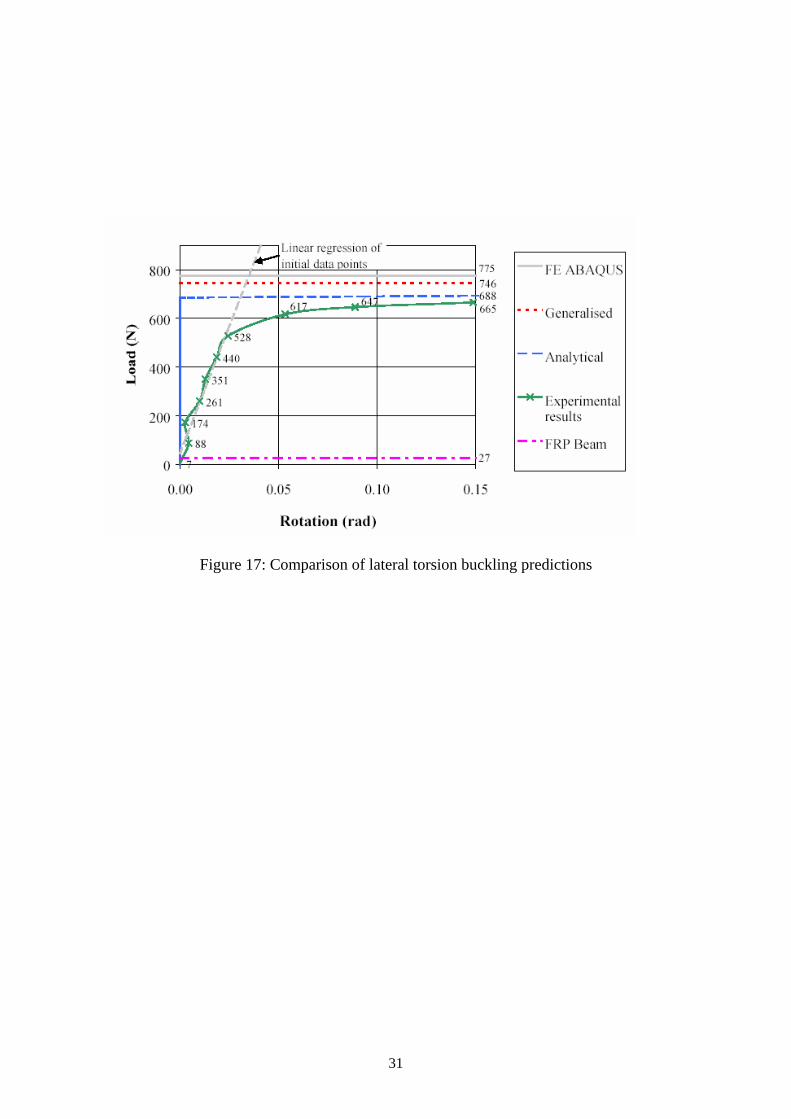
In line with the experimental set up, a two-meter long cantilevered beam was modelled. The
model was solved to obtain the eigenvalues. Figure 16 shows the first predicted buckling
mode. As shown on Figure 17, there is some variability between the experimental, theoretical
and FEA results. The Eurocomp formulation for FRP beams is substantially lower than the
other methods. The remainder of the predictions lie within 27% of each other. The FEA is
within 11% of the critical moment as observed in the experimentation.
CONCLUSIONS
The behaviour of the developed beam has been well described using advanced nonlinear finite
element analysis that incorporates heterogeneous material property description and damage
progression in the individual constituents of the beam. In particular, the developed FE
approach captured the interaction between shear and bending better than any other method
Both the experimental results and the non linear finite element analysis corroborated that the
addition of the core material to the flanges and webs of the newly developed beam suppresses
most of the premature failures modes known to occur in existing designs. This constitutes an
improvement in overall beam performance. However, it was also revealed that failures from
point loads, and combined moment–shear interaction, are dominated by buckling failure due
to the cracking of the core material. Contrary to existing belief, it was found that the pure
shear capacity of the web laminates is governed by fibre fracture rather than fibre pull-out as
is described in codes and the literature.
9
Page 10
The simplified analytical formulas described in the sequels show very good agreement with
both the experimental results and FE analysis. These formulas were initially formulated for
designing the experimental program. However, in the light of the observed accuracy, these
formulas could constitute the basis for designing these FRP beams.
References
1. Springolo, M. New fibre-reinforced polymer box beam: investigation of static
behaviour. PhD thesis. Faculty of Engineering, The University of Southern Queensland,
Australia. 2005. http://adt.usq.edu.au/adt-QUSQ/public/adt-QUSQ20050421.122411/
2. Ascione L, Feo G, Mancusi G. On the statical behaviour of fibre-reinforced polymer
thin-walled beams. Composites Part B: Engineering. 2000; 31B(8): 643-653.
3. Barbero EJ, Lopez-Anido R, Davalos JF. On the mechanics of thin-walled laminated
composite beams. Journal of Composite Materials. 1993; 27(8): 806-829.
4. Davalos JF, Qiao P. Analytical and experimental study of lateral distortional buckling
of FRP wide-flange beams. Journal of Composites for Construction. 1997; 1(4): 150-
159.
5. Davalos JF, Salim P, Qiao R., Lopez-Anido R, Barbero E J. Analysis and design of
pultruded FRP shapes under bending. Composites Part B: Engineering. 1996; 27(3/4):
295-306.
6. Haj-Ali R, Kilic H. Nonlinear behavior of pultruded FPR composites. Composites Part
B: Engineering. 2002; 33(3):173-191
7. Taufik A, Barrau JJ, Lorin F. Composite Beam Analysis with Arbitrary Cross Section.
Composite Structures. 1999; 44(2/3): 189-194.
8. Chang F, Lessard L, Chang K, Liu S. Damage tolerance of laminated composites
containing a hole and subjected to tension or compression. 34th International SAMPE
10
Page 11
Symposium and Exhibition - Tomorrow's Materials: Today. SAMPE, Covina, CA,
USA, 1989 p:559-568.
9. Hibbitt, Karlsson & Sorensen Inc., 'ABAQUS', ver 6.4, Hibbitt, Karlsson & Sorensen,
Inc., Pawtucket. RI 02860-4847, USA, 2003
10. Van Rossum G. Python Software Foundation. http://www.python.org/
11
Page 12
Table 1: Material properties for failure modelling
Principal strain state
C = compression, T = tension, and
F = failed in tension
Material properties Com. = compression modulus,
Ten. = tension modulus, OV = original non-failed value used, and
FV = failure value used (1 for E and G, 0 for ν)
ε11 ε22 ε33 E11 E22 E33 ν12 ν13 ν23 G12 G13 G23
C C C Com. Com. Com. OV OV OV OV OV OV
T C C Ten. Com. Com. OV OV OV OV OV OV
F C C FV Com. Com. FV FV OV FV FV OV
T T C Ten. Ten. Com. OV OV OV OV OV OV
F T C FV Ten. Com. FV FV OV FV FV OV
F F C FV FV Com. FV FV FV FV FV FV
T T T Ten. Ten. Ten. OV OV OV OV OV OV
F T T FV Ten. Ten. FV FV OV FV FV OV
F F T FV FV Ten. FV FV FV FV FV FV
F F F FV FV FV FV FV FV FV FV FV
12
Page 13
Table 2: Moment buckling of the web specimen
Analytical
FEA
Experimental
Buckling moment (105 N.mm)
9.66
9.68
Buckled at: 8.60 Failed at: 9.72
13
Page 14
Table 3: Shear buckling of the web
Analytical
FEA
Experimental
Shear Load (N)
6871
7023
Buckled at: 7500 Failed at: 9370
14
Page 15
ABAQUS program
No
Yes
Has runs, i, reached 30
End
Compile results with previous results
Yes
Start
For Run number i
Randomise material properties based upon the average and standard deviation of the material
tests
Assemble model, write ABAQUS input file
From results assign changed tensile and compressive properties to individual elements
Run increment j FEA using ABAQUS with automatic sub-increments to ensure
convergence
Yes Have any of the
element properties changed?
No
Check for initiation and progression of damage to core and laminates, then assign
appropriate material properties
Run i = 1 Increment j = 1
Set number of increments, N
No
Run i = i + 1
Has increment, j, reached N?
FOR
TR
AN
su
brou
tine
Increment j = j + 1
Access ABAQUS output file
Figure 1: Flow chart of Python script
15
Page 16
Figure 2: Loading details and cross section .
16
Page 17
Figure 3: Finite element mesh and boundary conditions for pure bending
17
Page 18
Figure 4: Finite element mesh and loading for pure bending
18
Page 19
Figure 5: Finite element dicretisation of the core and longitudinal laminates
19
Page 20
Figure 6: Finite element dicretisation of the RHS laminates
20
Page 21
0.00E+00
5.00E+05
1.00E+06
1.50E+06
2.00E+06
2.50E+06
3.00E+06
3.50E+06
0 0.005 0.01 0.015 0.02
Strain (mm/mm)
Mom
ent (
Nm
m)
Abaqus-CAbaqus-TAnalytical-CAnalytical-TExperiment-CExperiment-T
Figure 7: FE models versus analytical and experimental results
21
Page 22
0.00E+00
5.00E+05
1.00E+06
1.50E+06
2.00E+06
2.50E+06
3.00E+06
0.0 0.5 1.0 1.5 2.0
Strain (%)
Compressive strain, L2
Compressive strain, L3
Compressive strain, L4
Tensile strain, L14
Analytical Compressivestrain, L2Analytical Compressivestrain, L3Analytical Compressivestrain, L4Analytical Tensile strain, L14
FE Compressve strain, L2
FE Tensile strain, L13
Figure 8: FE versus analytical and experimental results for changing flange core thickness,
series B6
22
Page 23
0.00E+00
5.00E+05
1.00E+06
1.50E+06
2.00E+06
2.50E+06
3.00E+06
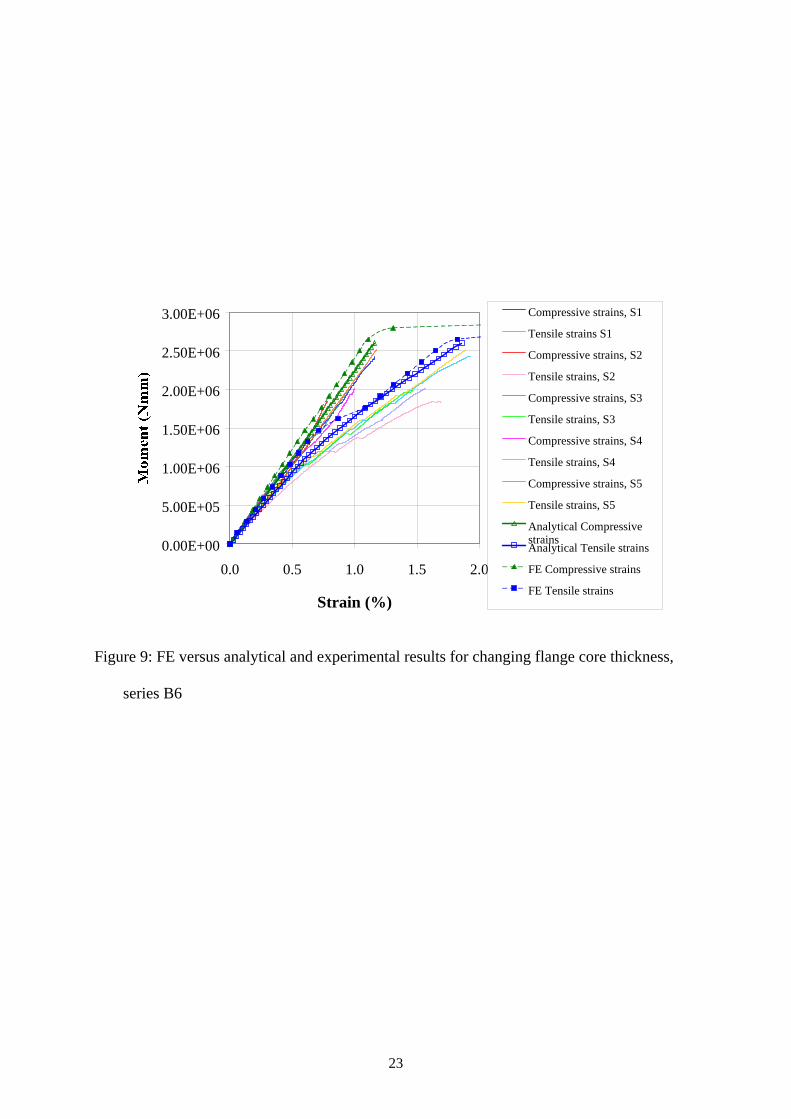
0.0 0.5 1.0 1.5 2.0
Strain (%)
Compressive strains, S1
Tensile strains S1
Compressive strains, S2
Tensile strains, S2
Compressive strains, S3
Tensile strains, S3
Compressive strains, S4
Tensile strains, S4
Compressive strains, S5
Tensile strains, S5
Analytical CompressivestrainsAnalytical Tensile strains
FE Compressive strains
FE Tensile strains
Figure 9: FE versus analytical and experimental results for changing flange core thickness,
series B6
23
Page 24
0.00E+00
5.00E+05
1.00E+06
1.50E+06
2.00E+06
2.50E+06
3.00E+06
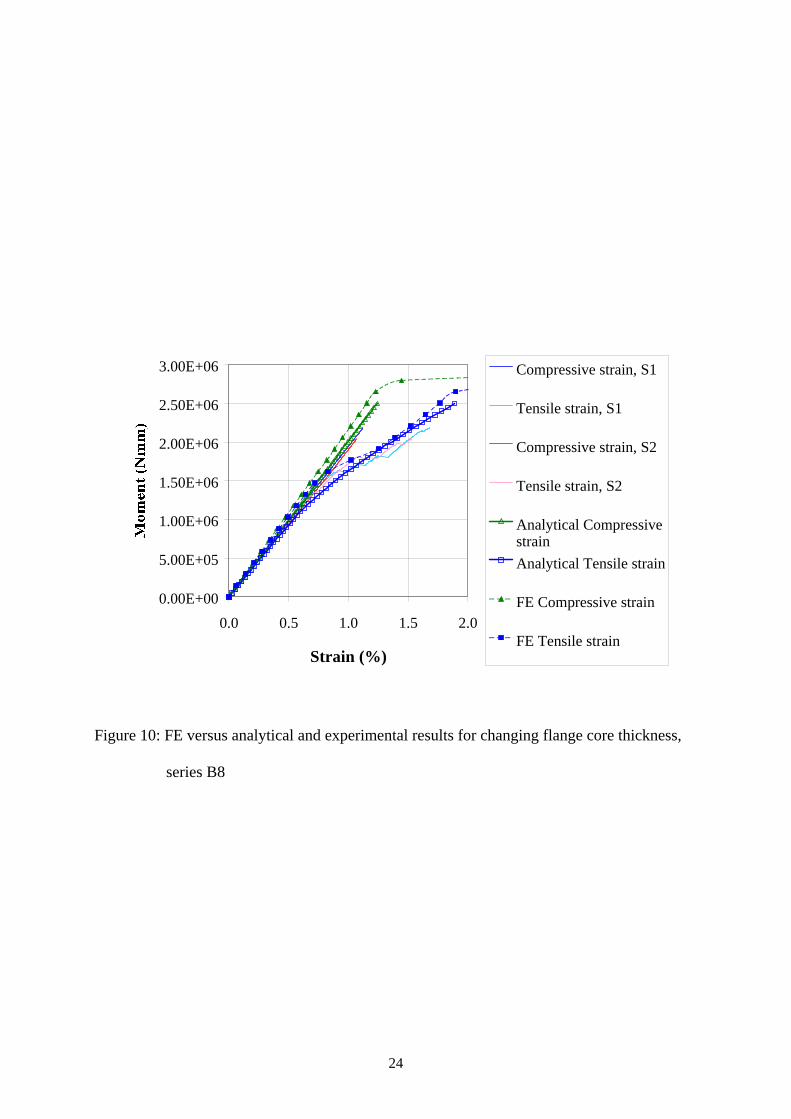
0.0 0.5 1.0 1.5 2.0
Strain (%)
Compressive strain, S1
Tensile strain, S1
Compressive strain, S2
Tensile strain, S2
Analytical CompressivestrainAnalytical Tensile strain
FE Compressive strain
FE Tensile strain
Figure 10: FE versus analytical and experimental results for changing flange core thickness,
series B8
24
Page 25
0.00E+00
5.00E+05
1.00E+06
1.50E+06
2.00E+06
2.50E+06
3.00E+06
3.50E+06
4.00E+06
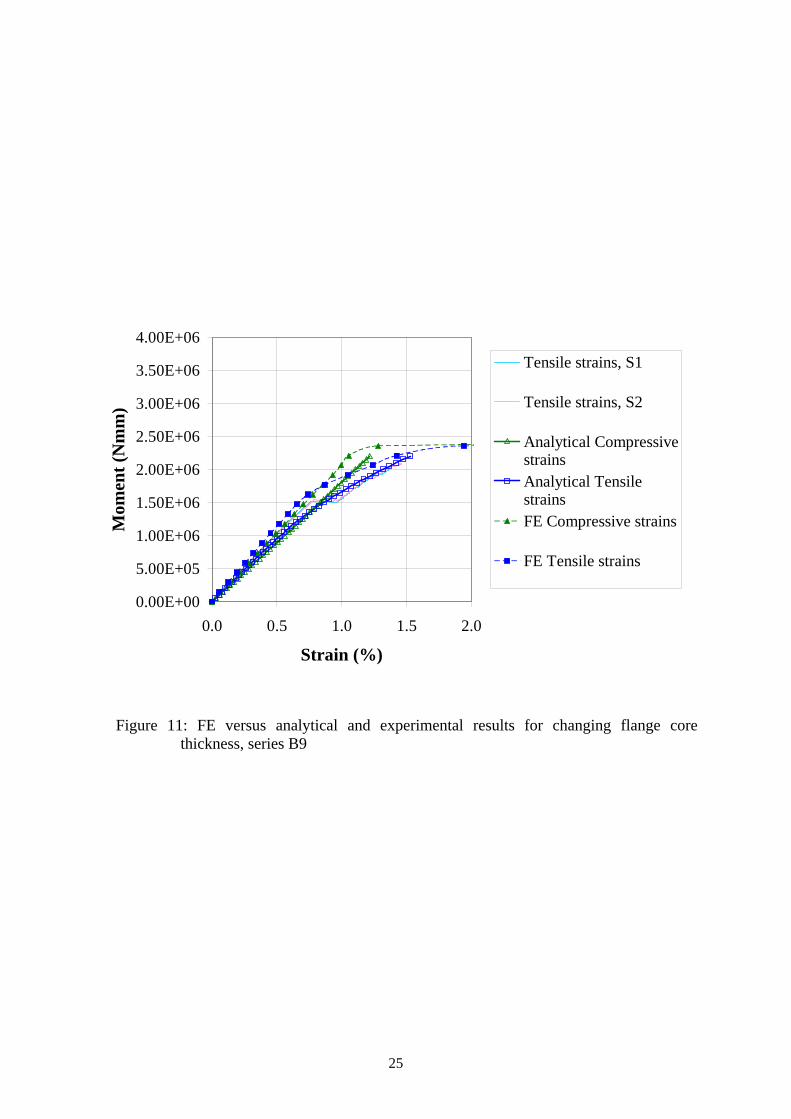
0.0 0.5 1.0 1.5 2.0
Strain (%)
Mom
ent (
Nm
m)
Tensile strains, S1
Tensile strains, S2
Analytical CompressivestrainsAnalytical TensilestrainsFE Compressive strains
FE Tensile strains
Figure 11: FE versus analytical and experimental results for changing flange core thickness, series B9
25
Page 26
Figure 12: Moment buckling of the web specimen
26
Page 27
Figure 13: Combined shear and bending.
27
Page 28
Figure 14: Results for combined shear and bending
28
Page 29
Figure 15: Shear buckling of the web
29
Page 30
Figure 16: Lateral torsional buckling
30
Page 31
Figure 17: Comparison of lateral torsion buckling predictions
31